Navistar International Corporation
Navistar International — Q2 2014 Earnings Presentation
40 slides from Navistar International's earnings presentation, Jun 5, 2014

Slide 1: Q2 Earnings Presentation
Q2 EARNINGS PRESENTATION June 5, 2014 Exhibit 99.2

Slide 2: Safe Harbor Statement
Safe Harbor Statement Information provided and statements contained in this report that are not purely historical are forward- looking statements within the meaning of Section 27A of the Securities Act of 1933, as amended, Section 21E of the Securities Exchange Act of 1934, as amended, and the Priva

Slide 3: Other Cautionary Notes
Other Cautionary Notes The financial information herein contains audited and unaudited information and has been prepared by management in good faith and based on data currently available to the Company. Certain non-GAAP measures are used in this presentation to assist the reader in understanding our

Slide 4: Q2 2014 Results
ND QUARTER 2014 RESULTS Troy Clarke, President & CEO

Slide 5: Agenda
Agenda Q2 Overview Troy Clarke Financial Results Walter Borst Drive to Deliver Update Jack Allen Summary Troy Clarke
Slide 6: Transformation: Guiding Principles & Priorities
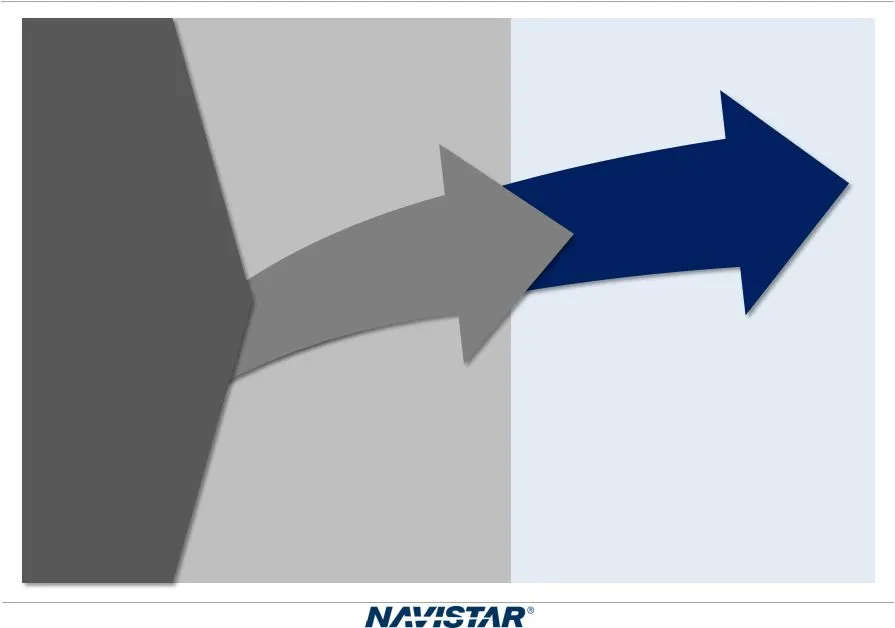
2013 2014 • Quality • Cost • Sense of Urgency • Great Products • Customer Satisfaction • People Transformation: Guiding Principles & Priorities • Leading Vehicle Uptime • Driving a Lean Enterprise • EBITDA Margin Expansion • Profitable Market Share Turnaround: • Improve Quality • Hit our Launches •

Slide 7: 2nd Quarter Summary
• Exceeded Q2 adjusted EBITDA guidance • Hit our cash guidance • Revised Class 6-8 and Bus industry forecast up to 317,000-335,000 • Improving retail market share • Focus on quality and product performance • Building momentum with ISB-powered Class 6/7 and Bus products • Target mid-July deliveries f

Slide 8: Financial Results
FINANCIAL RESULTS Walter Borst, Executive Vice President & CFO

Slide 9: Income Statement Summary
Income Statement Summary Note: This slide contains non-GAAP information; please see the REG G in appendix for a detailed reconciliation. (A) Amounts attributable to Navistar International Corporation. $ in millions, except per share Quarters Ended April 30, Traditional Chargeouts 16,900 13,500 Sales

Slide 10: Q2 2014 Segment Results
Q2 2014 Segment Results Segment Results: North America Truck $ (134) $ (303) North America Parts Global Operations (150) Financial Services Quarters Ended April 30, $ in millions
Slide 11: Q2 2014 EBITDA
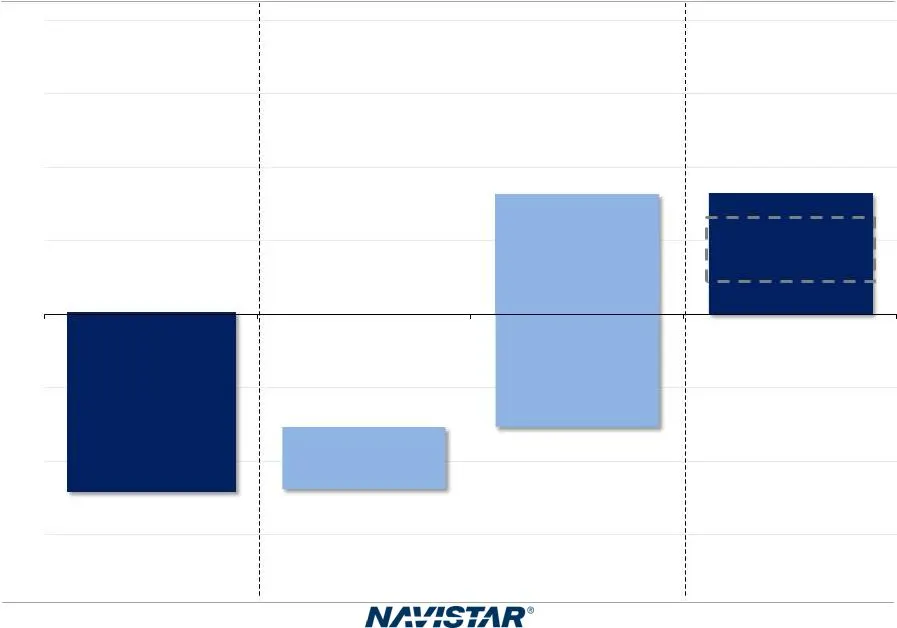
Q2 Guidance* $25-$75M Q2 2014 EBITDA $ in millions Note: This slide contains non-GAAP information; please see the REG G in appendix for a detailed reconciliation. * Excluding pre-existing warranty and one-time items. ($119) $82 ($42) ($159) ($150) ($100) ($50) $0 $50 $100 $150 $200 Q2 2014 Actual EB

Slide 12: Q2 2014 Manufacturing Cash Update
Q2 2014 Manufacturing Cash Update $ in millions * Cash balance includes marketable securities. **Guidance as provided on 3/5/2014. Note: This slide contains non-GAAP information; please see the REG G in appendix for a detailed reconciliation. Guidance** Actual 1Q 2014 Manufacturing Cash Balance* $1,
Slide 13: Manufacturing Cash Balances
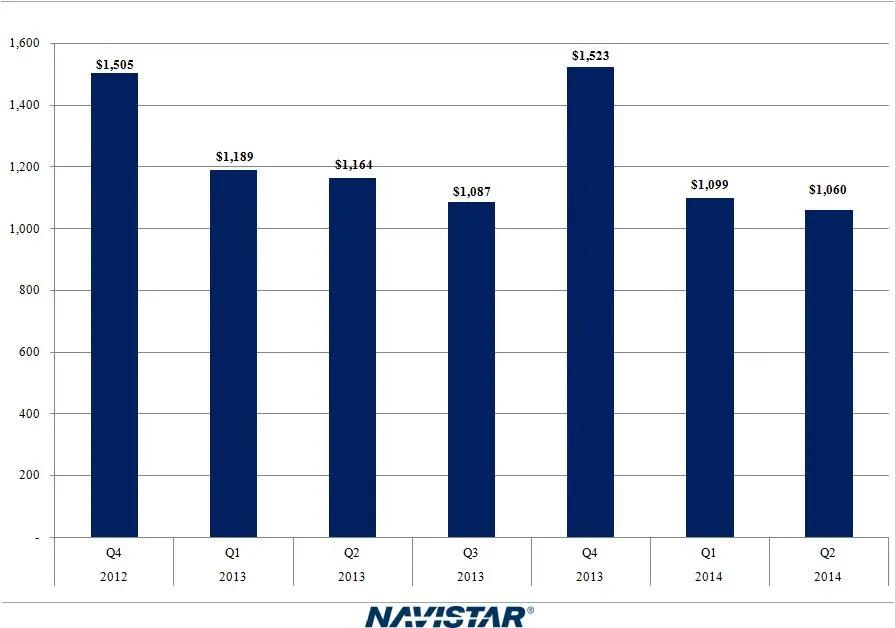
Manufacturing Cash Balances* * Cash balance includes marketable securities. Note: This slide contains non-GAAP information; please see the REG G in appendix for a detailed reconciliation. $ in millions
Slide 14: Convertible Note Refinancing Transaction
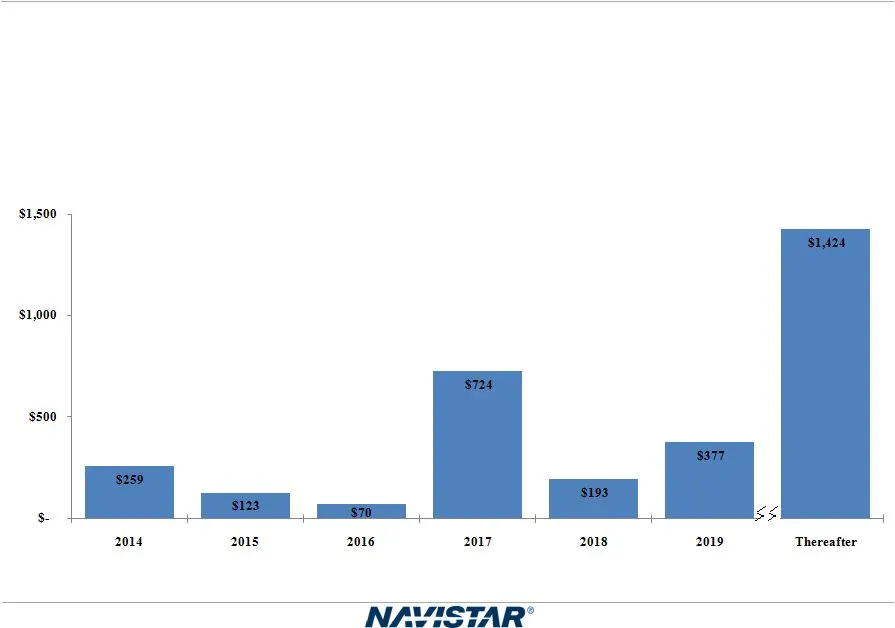
Convertible Note Refinancing Transaction • Issued $411M new Convertible Notes due 2019, reported debt of $367M net of unamortized discount of $44M • Repurchased $404M notional of the 3% Convertible Notes • Significantly extended our debt maturity profile $ in millions Note: Debt balances on chart, n
Slide 15: Guidance: Q3 2014 Manufacturing Cash
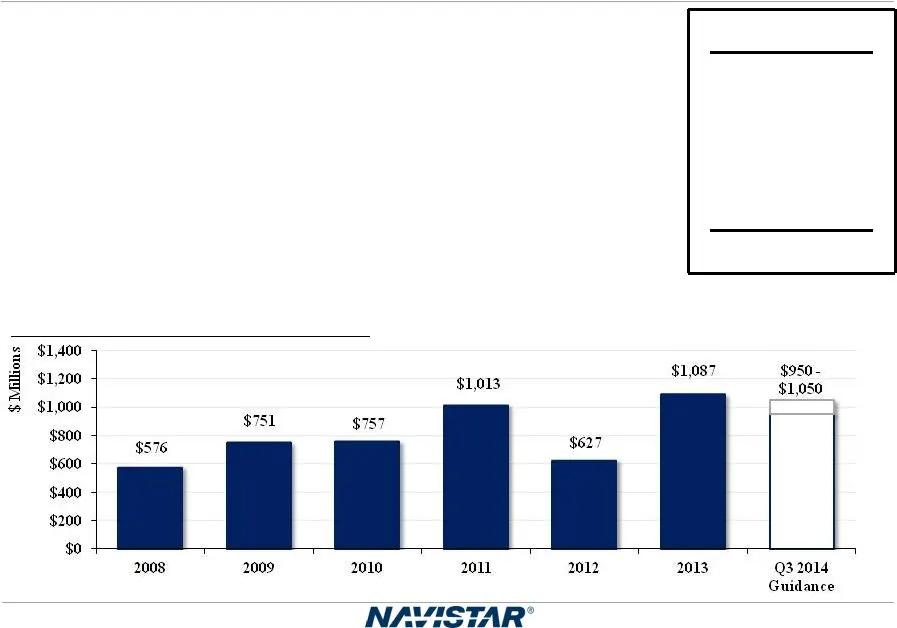
Guidance: Q3 2014 Manufacturing Cash $ in millions Note: This slide contains non-GAAP information; please see the REG G in appendix for a detailed reconciliation. Q3 Manufacturing Cash Balances* Guidance Q2 2014 Manufacturing Cash Balance* $1,060 Consolidated EBITDA** $75-$125 Capex/Cash Interest/Pe
Slide 16: Drive to Deliver Metrics
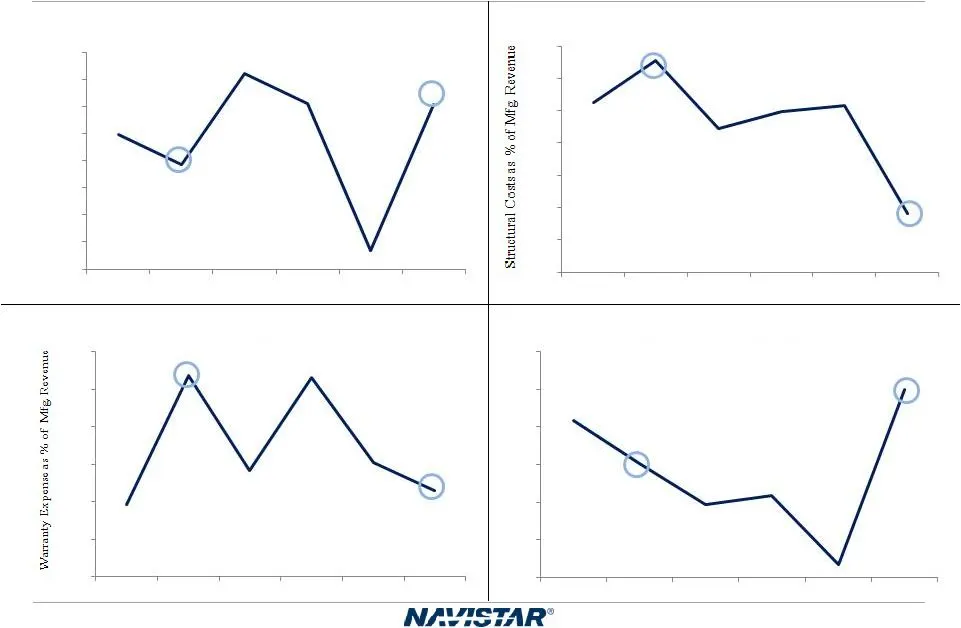
Drive to Deliver Metrics (millions) 0.0% 1.0% 2.0% 3.0% 4.0% 1Q13 2Q13 3Q13 4Q13 1Q14 2Q14 Adjusted EBITDA Margin 11% 12% 13% 14% 15% 16% 17% 1Q13 2Q13 3Q13 4Q13 1Q14 2Q14 Structural Costs % Manufacturing Revenue 2% 4% 6% 8% 10% 12% Warranty Expense % Manufacturing Revenue $2,100 $2,200 $2,300 $2,40
Slide 17: Long-term EBITDA Goals
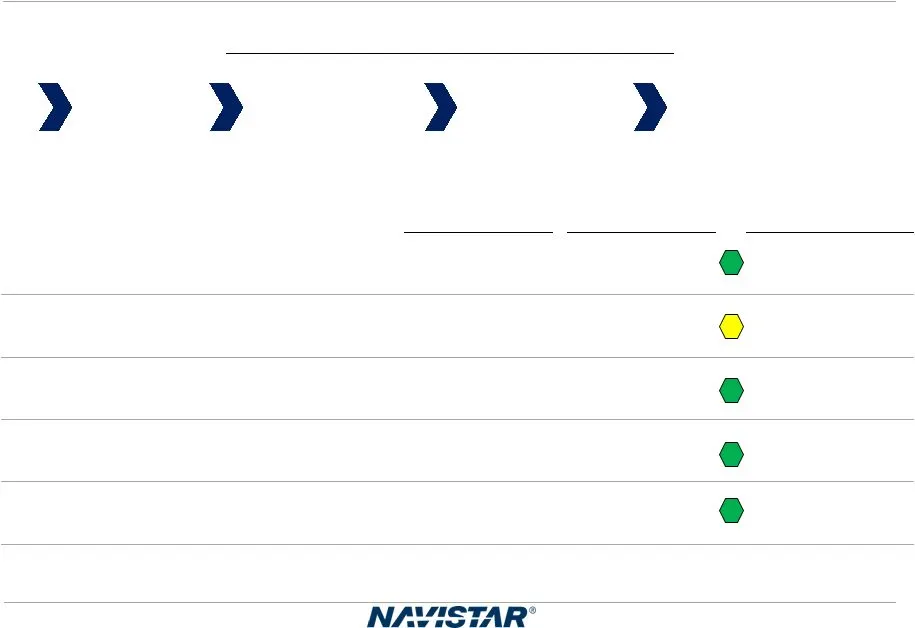
Long-term EBITDA Goals 4 Pronged Action Plan to Improve EBITDA Volume Material Structural Warranty increase cost savings cost savings cost reductions 2013 Actual 2014* 2015 Exiting & Long-term Class 6 - 8 & Bus industry 301,300 300 - 335,000 G 325 - 350,000 Class 6 - 8 & Bus combined market share 18

Slide 18: Summing It Up
• Positive Q2 adjusted EBITDA beat our guidance • Projecting – Q3: Positive EBITDA – Q4: Quarter-over-quarter improvement • Long-term EBITDA goals on track with increased sales momentum and cost reduction efforts in progress Summing It Up

Slide 19: Drive to Deliver
DRIVE TO DELIVER Jack Allen, Executive Vice President & COO

Slide 20: Q2 Summary: Operational Progress
• Operational Progress – Warranty spend improving – New product quality • 2014 Industry Outlook-U.S. and Canada Retail Sales – Class 6-8 and Bus forecast 317,000-335,000 – Combined Class 8 forecast 225,000-235,000 Q2 Summary
Slide 21: U.S. and Canada Class 6-8 Retail Market Share
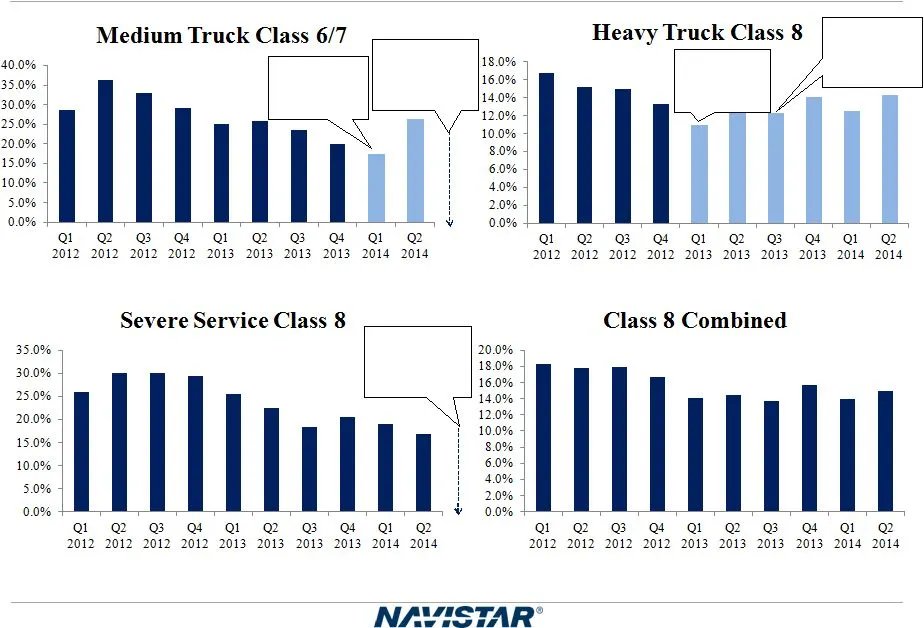
U.S. and Canada Class 6-8 Retail Market Share Launched DuraStar with Cummins ISB Launched ProStar with Cummins ISX Launched ProStar with MaxxForce 13L with SCR Launch WorkStar with MaxxForce 9/10 SCR Q3 Q3 Launch DuraStar with MaxxForce 9/10 SCR

Slide 22: Drive to Deliver Progress in Q2 2014
• OnCommand Connection • Used truck • Parts • Engineering • Manufacturing • ROIC actions • SG&A • Brazil Drive to Deliver Progress in Q2 2014

Slide 23: Summary
SUMMARY Troy Clarke, President & CEO

Slide 24: 2014 Milestones and Expectations
• Revised Class 8 industry to 225,000 - 235,000 • Exit 2014 Class 6-8 truck and bus share at 21% run rate • Increase structural cost reductions to $250 million • Deliver manufacturing cost savings of $50-$60 million • Drive material cost reductions to offset cost of SCR • On track for additional $1,

Slide 25: Navistar
NAVISTAR:
Slide 26: Navistar Financial Corporation Highlights
Retail Notes Bank Facility Navistar Financial Corporation Highlights • Financial Services Segment profit of $24 million for Q2, $47 million YTD • Total U.S. financing availability of $460 million as of April 30, 2014 • Debt/Equity Leverage of 2.7:1 as of April 30, 2014 • Retail accounts funding faci
Slide 27: Retail Market Share - U.S. and Canada Class 6-8
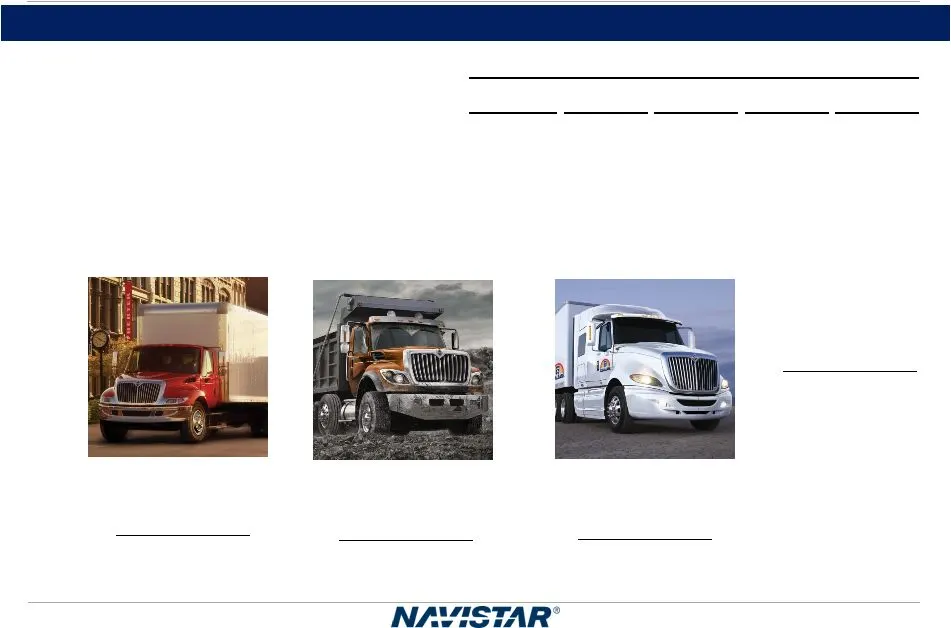
Retail Market Share - U.S. and Canada Class 6-8: A Leader in Several Commercial Vehicle Segments Class 6/7 Medium-Duty Retail Market Share: Q2 2014: 26% Q1 2014: 17% Class 8 Severe Service Retail Market Share: Q2 2014: 17% Q1 2014: 19% Class 8 Heavy Retail Market Share: Q2 2014: 14% Q1 2014: 12% Com
Slide 28: Worldwide Truck Chargeouts
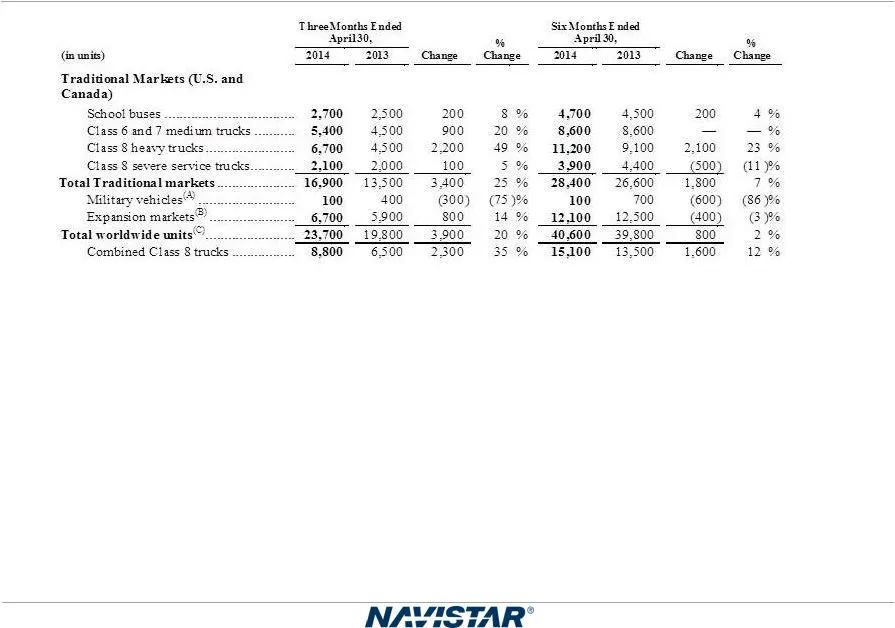
Worldwide Truck Chargeouts We define chargeouts as trucks that have been invoiced to customers. The units held in dealer inventory represent the principal difference between retail deliveries and chargeouts. This table summarizes our approximate worldwide chargeouts from our continuing operations. W
Slide 29: Worldwide Engine Shipments
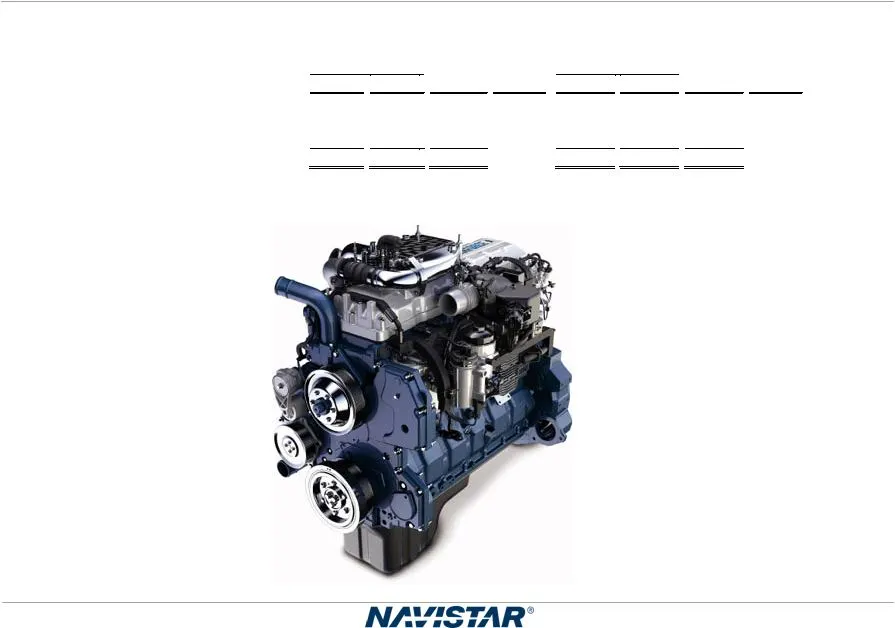
Worldwide Engine Shipments Engine Shipments Three Months Ended April 30, % Change Six Months Ended April 30, % Change (in units) Change Change OEM sales-South America ........................... ........................... 24,300 30,800 (6,500 ) (21 )% 44,300 56,400 (12,100 ) (21 )% Intercompany sal
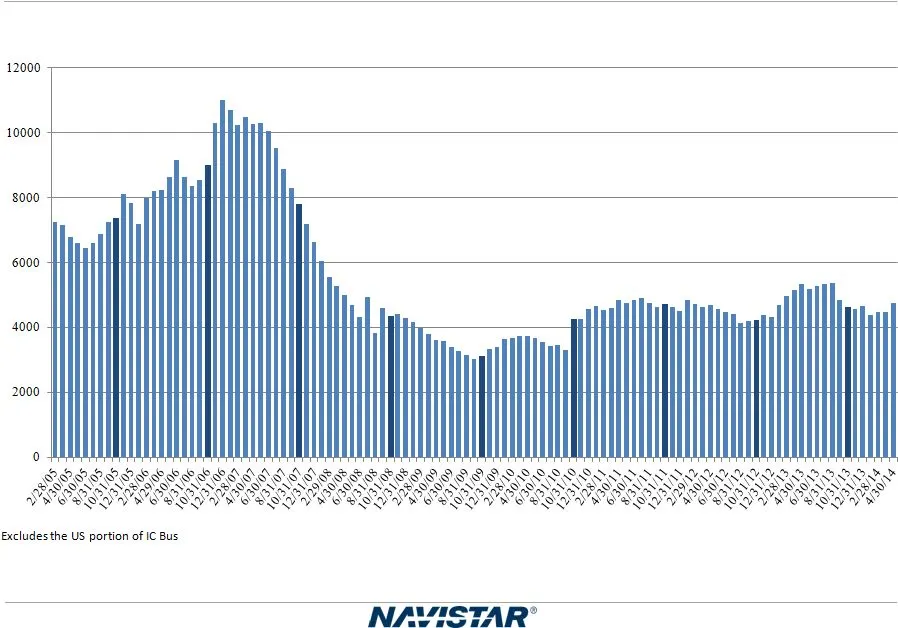
Slide 30: U.S. and Canada Dealer Stock Inventory
U.S. and Canada Dealer Stock Inventory* * Includes U.S. and Canada Class 4-8 and school bus inventory, but does not include U.S. IC Bus.

Slide 31: Frequently Asked Questions
Frequently Asked Questions Q1: What is included in Corporate and Eliminations? A: The primary drivers of Corporate and Eliminations are Corporate SG&A, pension and OPEB expense (excluding amounts allocated to the segments), annual incentive, manufacturing interest expense, and the elimination of int
Slide 32: Frequently Asked Questions; Reconciliation to ACT - Retail Sales
Reconciliation to ACT - Retail Sales Reconciliation to ACT - Retail Sales 2014 2015 Frequently Asked Questions Q5: What is your expectation for future cash tax payments? A: Our cash tax payments will remain low in 2014 and will gradually increase as we utilize available net operating losses (NOLs) a

Slide 33: Frequently Asked Questions
Frequently Asked Questions Q8: What is your manufacturing interest expense for Fiscal Year 2014? A: Manufacturing interest for 2014 is forecasted at approximately $257 million. Q9: What should we assume for capital expenditures in Fiscal Year 2014? A: We expect capital expenditures to be less than $
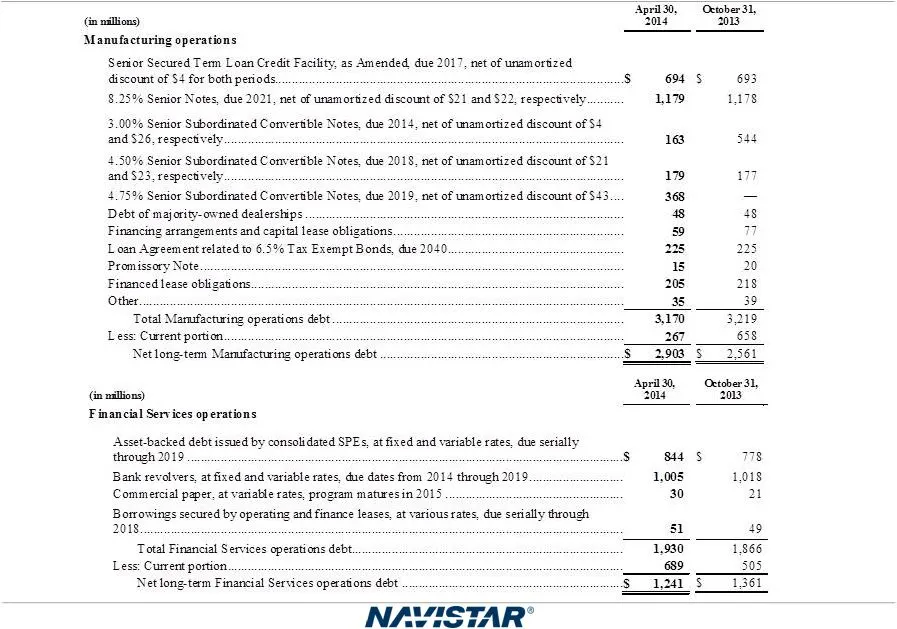
Slide 34: Manufacturing Operations Debt
April30, Ortober 31, (Go millions) 2014 203 ‘Manufacturing operations Senior Secured Term Loan Credit Facility, as Amended, due 2017, net of unamortized iscount of $4 for both periods S64 S$ 693 8.25% Senior Notes, due 2021, net of unamortized discount of $21 and $22, respectively 4179 1178 3.00% Se

Slide 35: SEC Regulation G Non-GAAP Reconciliation
SEC Regulation G Non-GAAP Reconciliation SEC Regulation G Non-GAAP Reconciliation The financial measures presented below are unaudited and not in accordance with, or an alternative for, financial measures presented in accordance with U.S. generally accepted accounting principles ("GAAP"). The non-GA
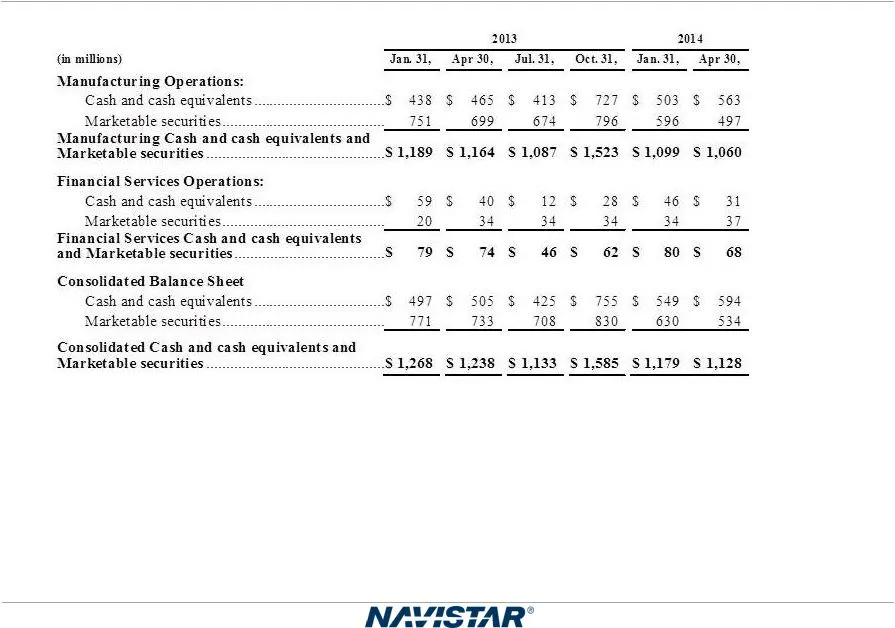
Slide 36: SEC Regulation G Non-GAAP Reconciliations
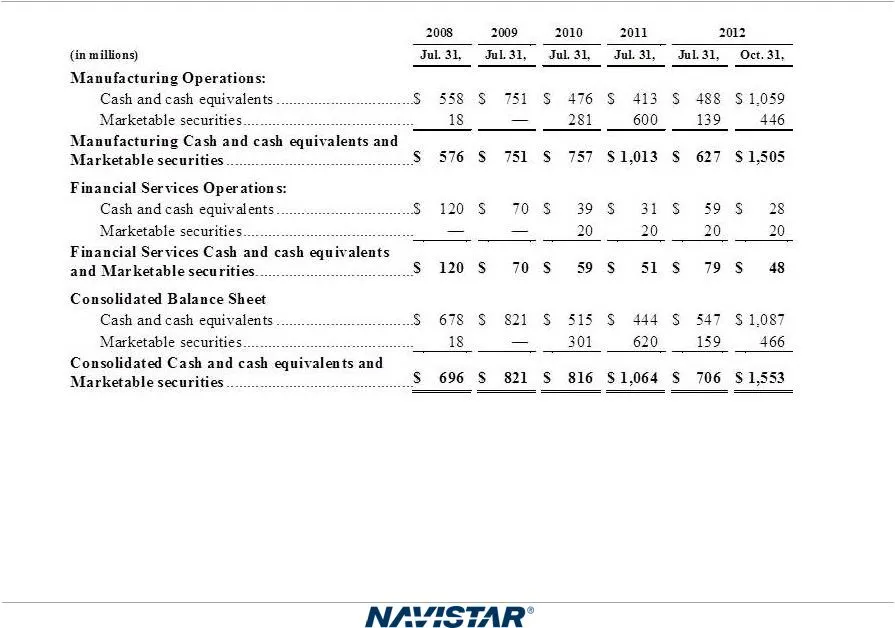
SEC Regulation G Non-GAAP Reconciliations Manufacturing segment cash and cash equivalents and marketable securities reconciliation:
Slide 37: SEC Regulation G Non-GAAP Reconciliations
SEC Regulation G Non-GAAP Reconciliations Manufacturing segment cash and cash equivalents and marketable securities reconciliation:

Slide 38: SEC Regulation G Non-GAAP Reconciliations
SEC Regulation G Non-GAAP Reconciliations Earnings (loss) before interest, taxes, depreciation, and amortization ("EBITDA") reconciliation Adjusted EBITDA reconciliation : (A) Manufacturing interest expense is the net interest expense primarily generated for borrowings that support the manufacturing

Slide 39: Significant Items Included Within Our Results
Significant Items Included Within Our Results ______________________ (A) In the second quarter of 2014, we recognized a non-cash charge of $149 million for the impairment of certain intangible assets of our Brazilian engine reporting unit. As a result of the economic downturn in Brazil causing decli

Slide 40: Significant Items: Brazilian Deferred Tax Valuation Allowance
(C) During the second quarter of 2014, our evaluation of the realizability of our Brazilian deferred tax assets resulted in a determination that a valuation allowance was required, due to a deterioration of operating performance in Brazil, an increase in net operating loss carryforwards, and the imp
Source: SEC EDGAR · 8-K filed Jun 5, 2014
More decks from Navistar International Corporation
 Q2 2021 Earnings Presentation20 slides · Jun 8, 2021
 Q1 2021 Earnings Presentation20 slides · Mar 9, 2021
 Q4 2020 Earnings Presentation22 slides · Dec 17, 2020
 Q3 2020 Earnings Presentation21 slides · Sep 9, 2020
 Q2 2020 Earnings Presentation21 slides · Jun 4, 2020
 Q1 2020 Earnings Presentation21 slides · Mar 4, 2020