Emclaire Financial — Shareholder Meeting (April 2013)
41 slides from Emclaire Financial's shareholder meeting presentation, Apr 24, 2013
Slide 1: 2013 Annual Meeting of Shareholders
Emclaire Financial Corp 2013 ANNUAL MEETING OF SHAREHOLDERS EMCCLAIRE FINANCIAL CORP PARENT COMPANY OF: THE FARMERS NATIONAL BANK OF EMLENTON William C. Marsh Emlenton, Pennsylvania Chairman, President and April 24, 2013 Chief Executive Officer
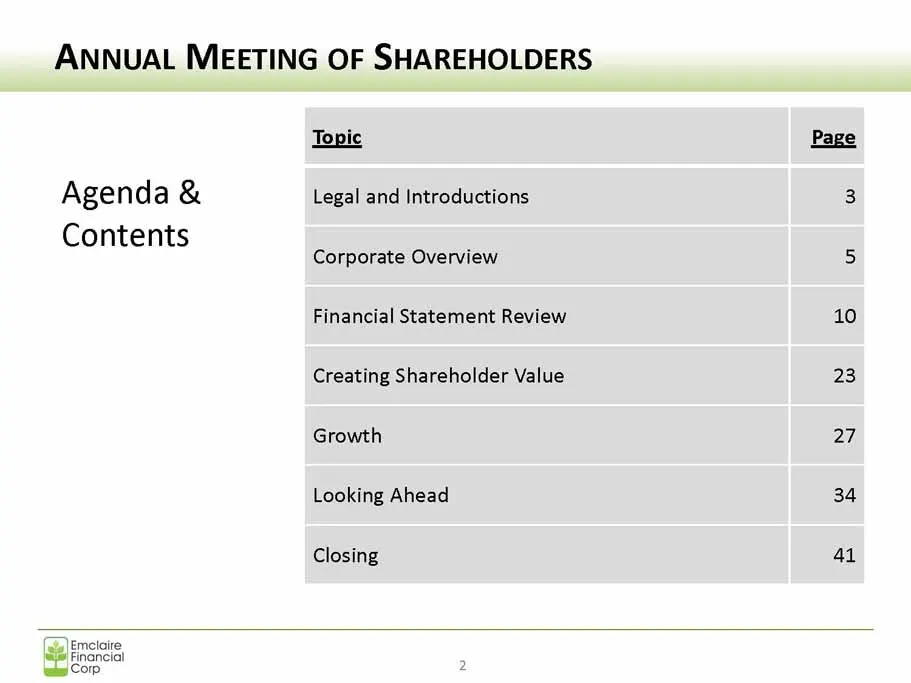
Slide 2: Annual Meeting of Shareholders Agenda & Contents
ANNUAL MEETING OF SHAREHOLDERS Topic Page Agend a& Legal and Introductions 3 Contents , Corporate Overview 5 Financial Statement Review 10 Creating Shareholder Value 23 Growth 27 Looking Ahead 34 Closing 41 ap) Emclaire Financial Comp
Slide 3: Legal
LEGAL This presentation contains certain forward-looking statements and information relating to the Company that are based on the beliefs of management as well as assumptions made by and information currently available to management. These forward-looking statements relate to, among other things, ex
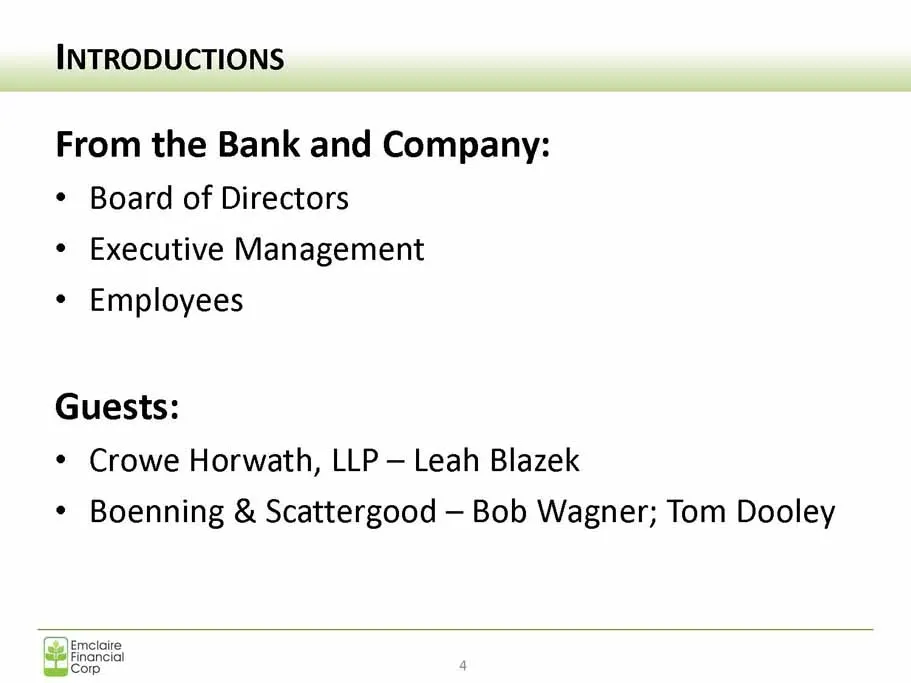
Slide 4: Introductions
INTRODUCTIONS From the Bank and Company: ¢ Board of Directors ¢ Executive Management ¢ Employees Guests: * Crowe Horwath, LLP — Leah Blazek ¢ Boenning & Scattergood — Bob Wagner; Tom Dooley Jp)Emclaire Financial Comp 01
Slide 5: Corporate Overview
CORPORATE OVERVIEW Company Industry Economy |
Slide 6: Overview — Company
OVERVIEW — COMPANY * Two new branch offices * Investment in commercial banking * Investment in financial services * Stable earnings ¢ Strong balance sheet growth ¢ Stable asset quality * Capital growth * Positioned for continued expansion * Continue to look at acquisition and other growth opportunit
Slide 7: Overview — Industry
OVERVIEW — INDUSTRY — Industry consolidation — Continued dramatic increase in new regulations post financial crisis — Historically low interest rate environment — Nationally weak loan demand — Technology demands and risks — Competitive threat from credit unions and non-bank financial companies (Wal-
Slide 8: Overview — Industry
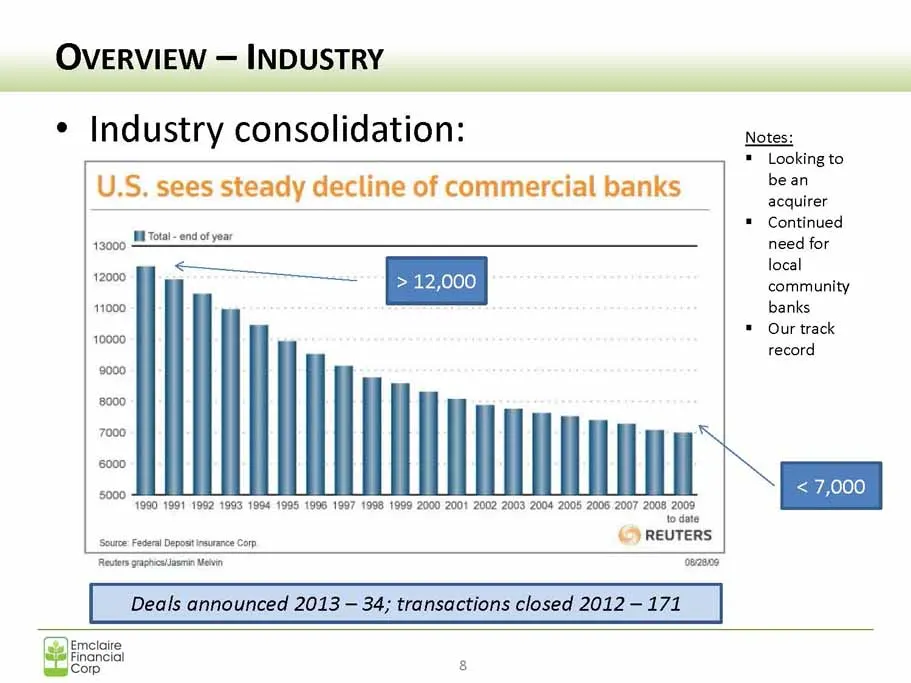
OVERVIEW — INDUSTRY SSS * Industry consolidation: Notes: * Looking to U.S. sees steady decline of commercial banks eae Continued 42000 Mi Toalend of year need for $e cs local > 12,000 community banks Our track record NX < 10 5000 1990 1991 1992 1993 1964 1995 1906 1997 1998 1999 2000 2001 zoc2 2003
Slide 9: Overview — Economy
OVERVIEW — ECONOMY ¢ Unemployment has stabilized and trending favorably — better in PA, western PA than nationally * Real estate market continued modest improvement — no significant decline in our markets ¢ Stock market has rebounded strongly to pre- financial crisis levels
Slide 10: Financial Statement Review
FINANCIAL STATEMENT REVIEW Consolidated Financial Highlights Consolidated Balance Sheet Earnings Asset Quality Emciaire Financial Comp
Slide 11: Consolidated Financial Highlights
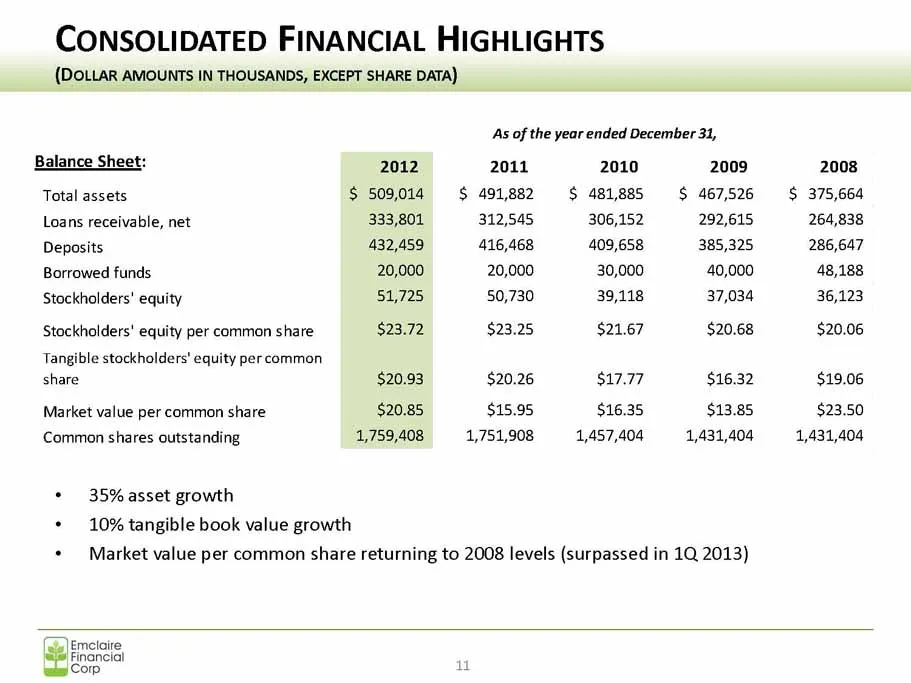
CONSOLIDATED FINANCIAL HIGHLIGHTS (DOLLAR AMOUNTS IN THOUSANDS, EXCEPT SHARE DATA) As of the year ended December 31, Balance Sheet: 2012 2011 2010 2009 2008 Total assets $ 509,014 $ 491,882 $ 481,885 $ 467,526 $ 375,664 Loans receivable, net 333,801 312,545 306,152 292,615 264,838 Deposits 432,459 4
Slide 12: Consolidated Financial Highlights
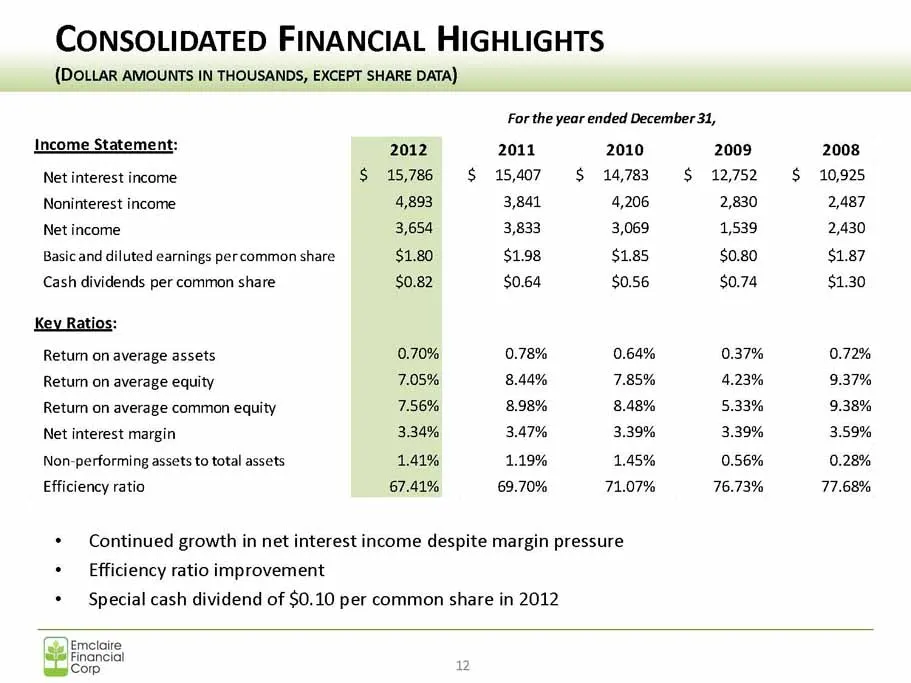
CONSOLIDATED FINANCIAL HIGHLIGHTS (DOLLAR AMOUNTS IN THOUSANDS, EXCEPT SHARE DATA) Income Statement: Net interest income Noninterest income Net income Basic and diluted earnings per common share Cash dividends per common share Key Ratios: Return on average assets Return on average equity Return on a
Slide 13: Consolidated Balance Sheets
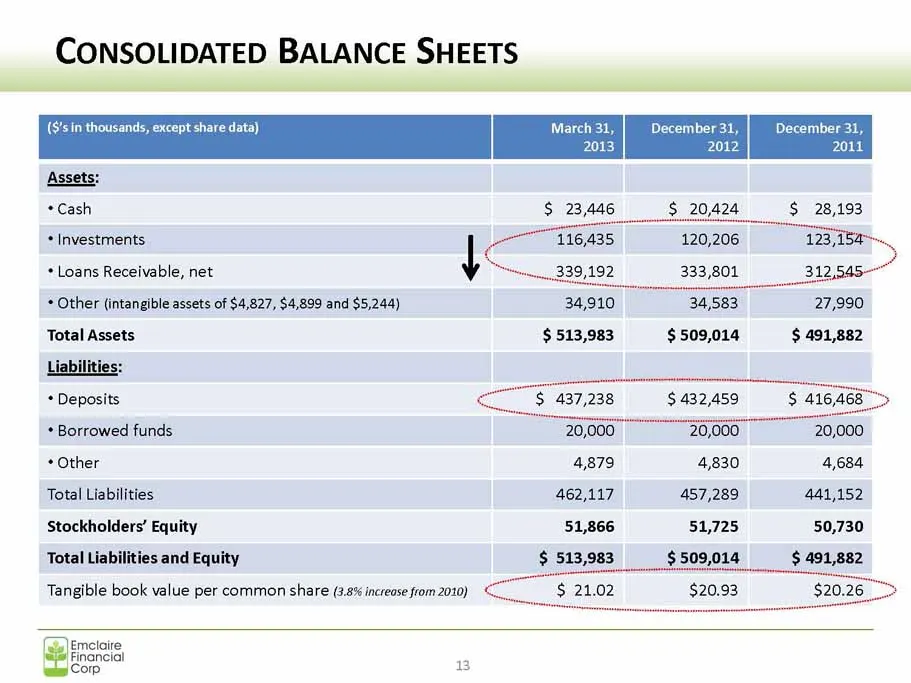
CONSOLIDATED BALANCE SHEETS March 31, 2013 (S’sin thousands, except Assets: *Cash $ 23,446 $ 20,424 * Investments T1635 120,206 + Loans Receivable, net y nu 339,192 333,801 * Other (intangible assets of $4,827, $4,899 and $5,244) 34,910 34,583 Total Assets: $513,983 $509,014 Liabilities: * Deposits
Slide 14: Consolidated Balance Sheets
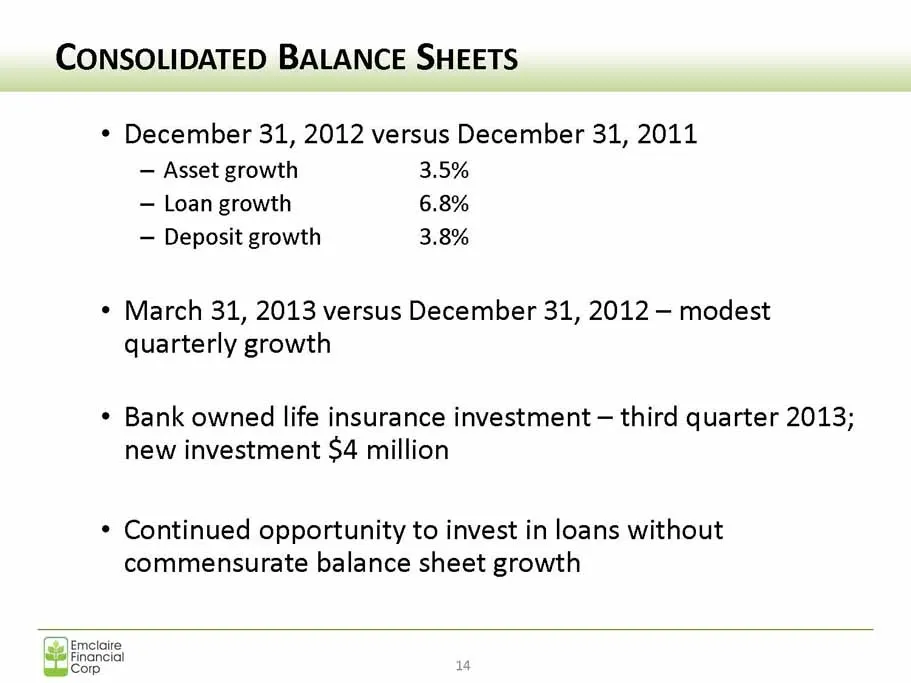
CONSOLIDATED BALANCE SHEETS * December 31, 2012 versus December 31, 2011 — Asset growth 3.5% — Loan growth 6.8% — Deposit growth 3.8% * March 31, 2013 versus December 31, 2012 — modest quarterly growth * Bank owned life insurance investment — third quarter 2013; new investment $4 million * Continued
Slide 15: Earnings — 2012 Compared to 2011
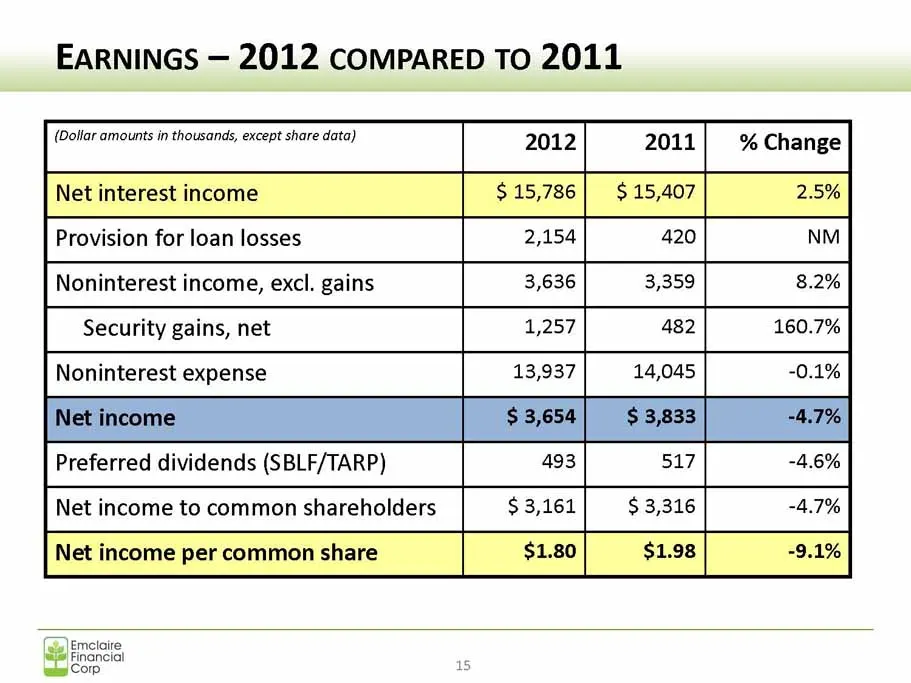
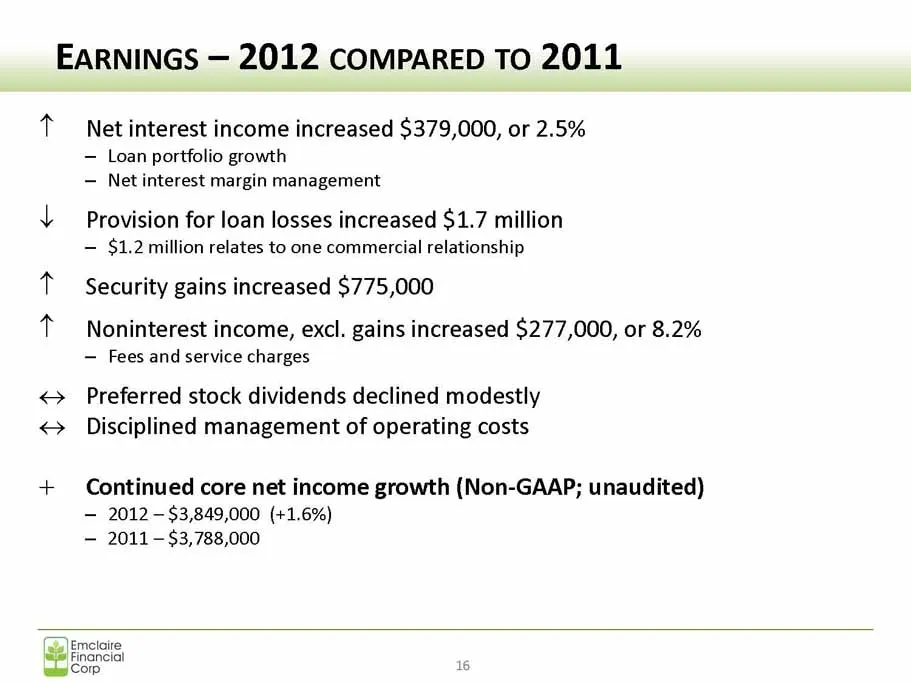
EARNINGS — 2012 COMPARED TO 2011 (Dollar amounts in thousands, except share data) 2012 2011 % Change Net interest income $15,786 | $15,407 2.5% Provision for loan losses 2,154 420 NM Noninterest income, excl. gains 3,636 3,359 2% Security gains, net 1,257 482 160.7% Noninterest expense 13,937 14,045
Slide 16: Earnings — 2012 Compared to 2011
EARNINGS — 2012 ComPARED TO 2011 + Net interest income increased $379,000, or 2.5% — Loan portfolio growth — Net interest margin management \ Provision for loan losses increased $1.7 million — $1.2 million relates to one commercial relationship t Security gains increased $775,000 * — Noninterest inc
Slide 17: Earnings Considerations
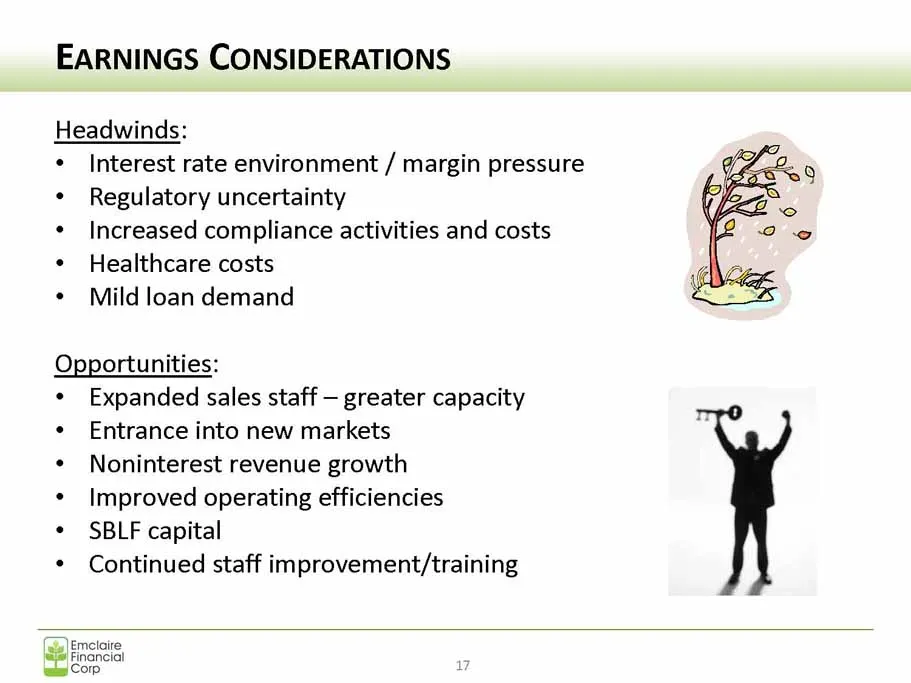
EARNINGS CONSIDERATIONS Headwinds: * Interest rate environment / margin pressure « Regulatory uncertainty « Increased compliance activities and costs * Healthcare costs * Mild loan demand Opportunities: « Expanded sales staff — greater capacity ¢ Entrance into new markets ¢ Noninterest revenue growt
Slide 18: Earnings — 1Q 2013 Compared to 1Q 2012
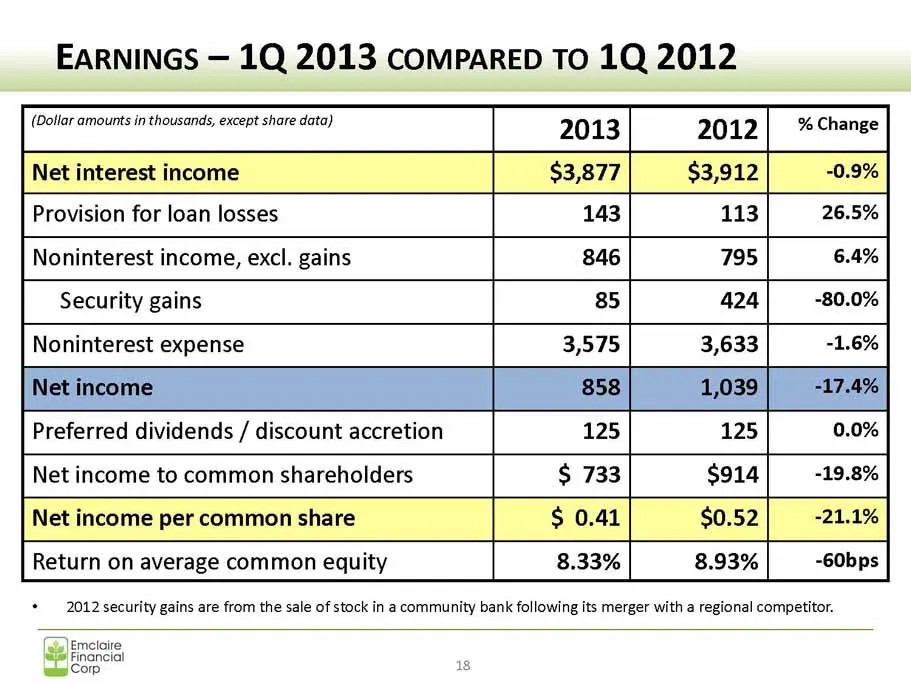
EARNINGS — 1Q 2013 comPaARED TO 1Q 2012 (Dollar amounts in thousands, except share data) 2013 2012 % Change Net interest income $3,877 $3,912 -0.9% Provision for loan losses 143 113 26.5% Noninterest income, excl. gains 846 795 6.4% Security gains 85 424 -80.0% Noninterest expense 3,575 3,633 -1.6%
Slide 19: Earnings — 1Q 2013 Compared to 1Q 2012
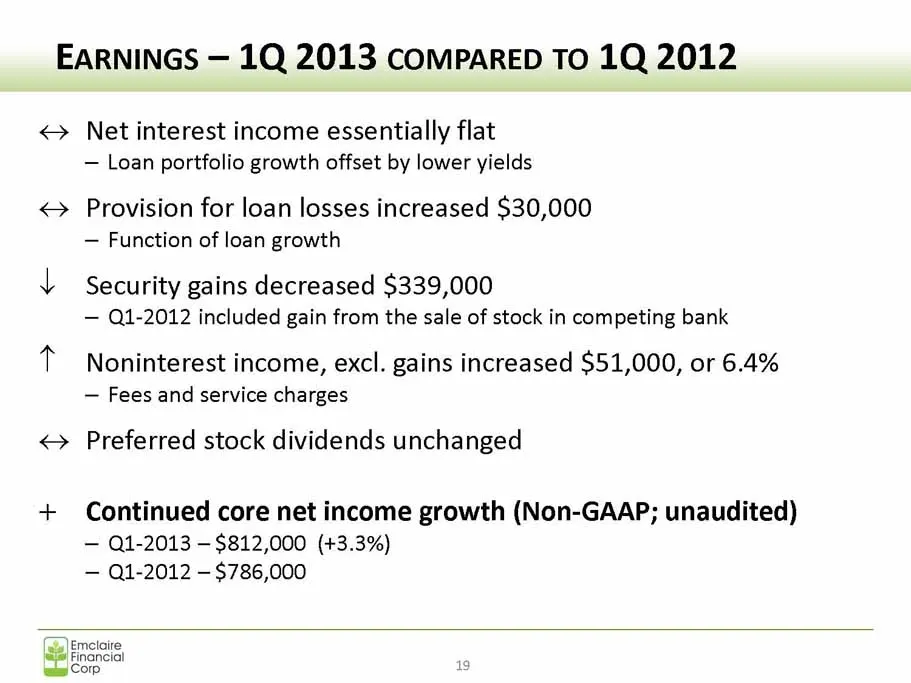
EARNINGS — 1Q 2013 comPaARED TO 1Q 2012 <> Net interest income essentially flat — Loan portfolio growth offset by lower yields Provision for loan losses increased $30,000 — Function of loan growth \ Security gains decreased $339,000 — Q1-2012 included gain from the sale of stock in competing bank +
Slide 20: Asset Quality — Overview
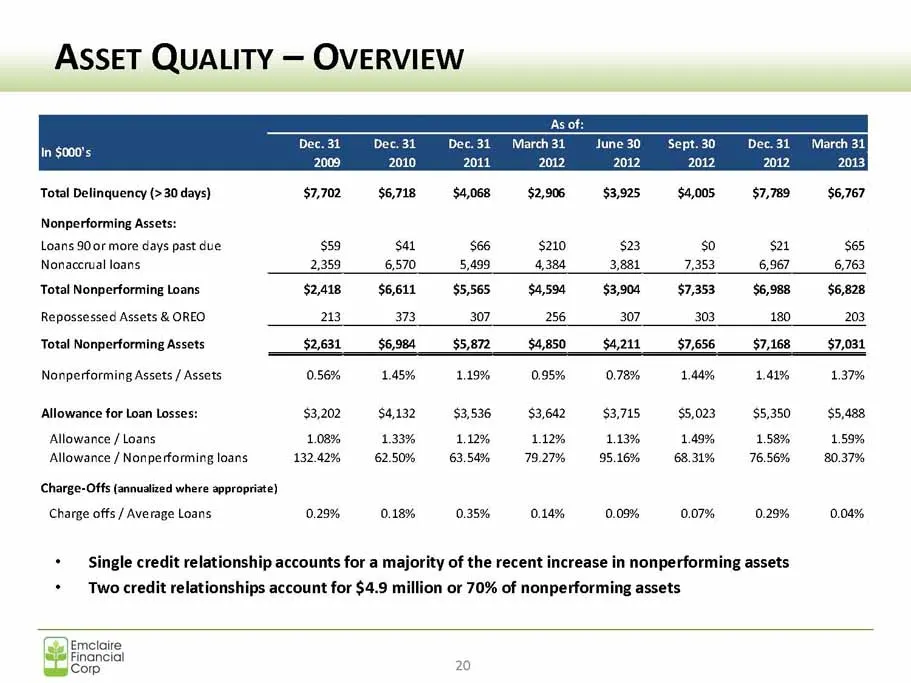
ASSET QUALITY — OVERVIEW Total Delinquency (>30 days) Nonperforming Assets: Loans 900r more days past due Nonacerual loans Total Nonperforming Loans Repossessed Assets & OREO Total Nonperforming Assets Nonperforming Assets / Assets Allowance for Loan Losses: Allowance / Loans Allowance / Nonperformi
Slide 21: Asset Quality — Nonperforming Asset Peer Review
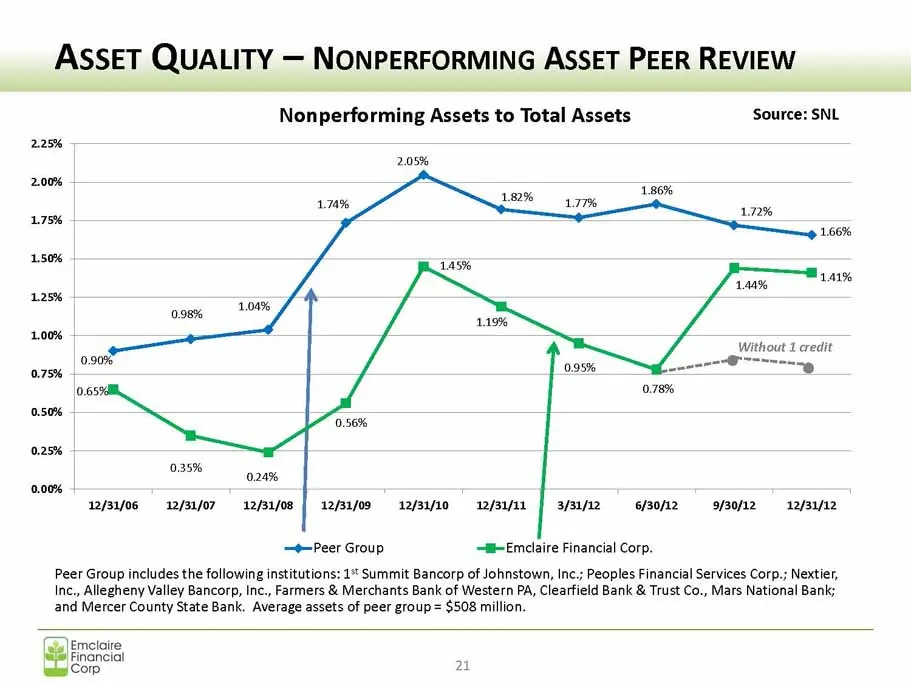
ASSET QUALITY — NONPERFORMING ASSET PEER REVIEW Nonperforming Assets to Total Assets Soure 2.05% 0.35% 024% aafsyjos 12/31/07 12/sifos | i2/sifoo—2/st/10.—2fsifaa | 3/3i/iz 6/30/12 9/30/12—12/31/12 Peer Group a+ Emclaire Financial Corp, Peer Group includes the following institutions: 1** Summit Banc
Slide 22: Asset Quality — Delinquency Trends
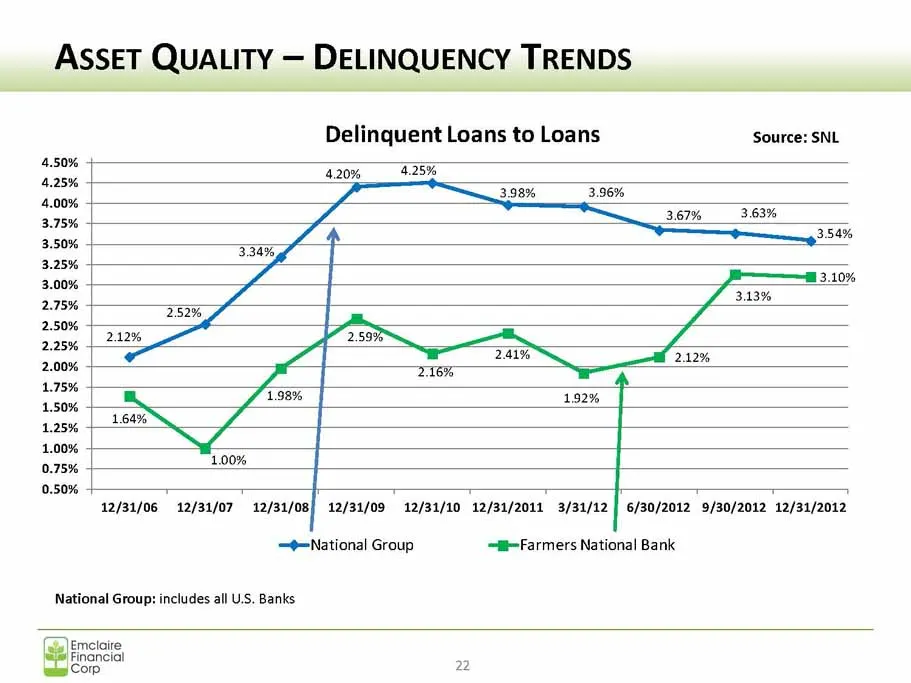
ASSET QUALITY — DELINQUENCY TRENDS Delinquent Loans to Loans Source: SNL 420% 4.25% 3.98% 3.96% 2.25% + f 138% | 192% LS 150% a 1.00% 12/31/06 12/31/07 12/31/08| 12/31/09 12/31/10 12/31/2011 3/31/12 | 6/30/2012 9/30/2012 12/31/2012 =@=National Group =™=Farmers National Bank National Group: includes
Slide 23: Creating Shareholder Value
CREATING SHAREHOLDER VALUE Stock Performance — Long Term Stock Performance — Short Term Dividend Review Emcloire Financial 5 Corp B
Slide 24: Stock Performance — Long Term
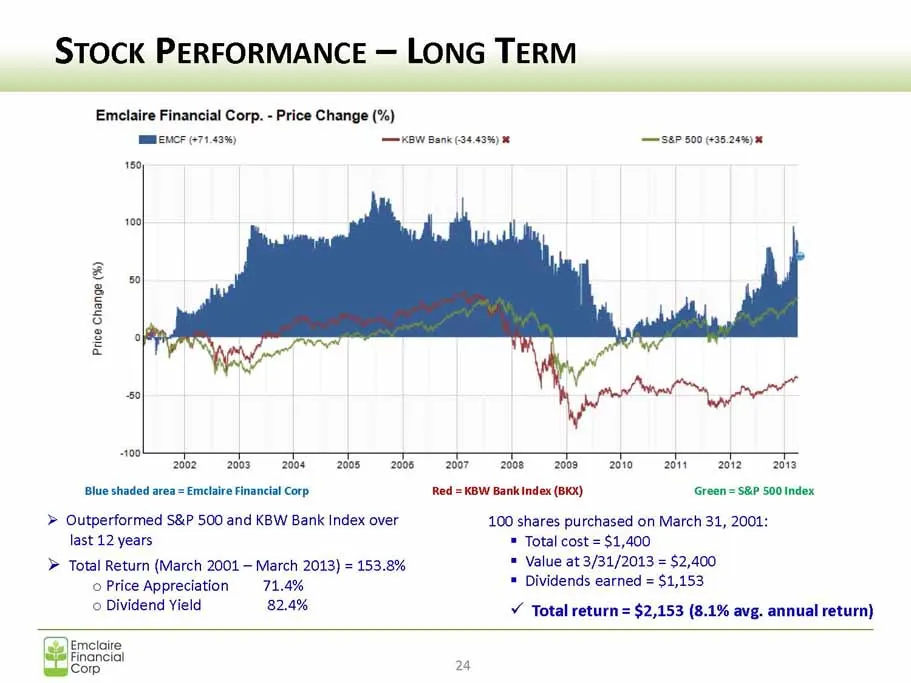
STOCK PERFORMANCE — LONG TERM Emclaire Financial Corp. - Price Change (%) IBEMICE (671.43) 180 Price Change (%) ‘2002 2003«=« 2008 +=—«2005 2008 Blue shaded area = Emelaire Financial Corp > Outperformed S&P 500 and KBW Bank Index over last 12 years > Total Return (March 2001 — March 2013) = 153.8% ©
Slide 25: Stock Performance — Short Term
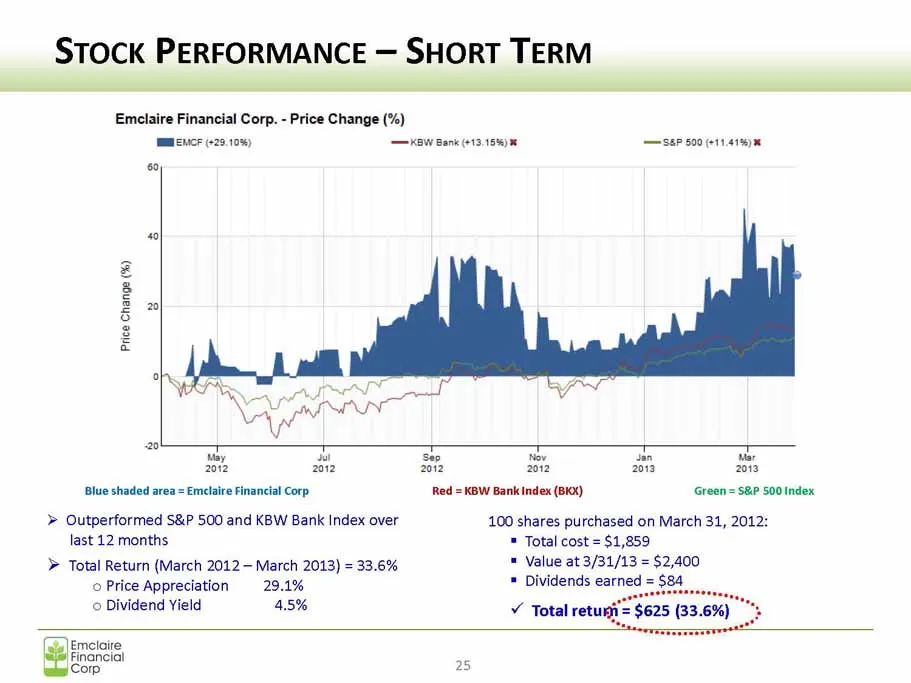
STOCK PERFORMANCE — SHORT TERM Emclaire Financial Corp. - Price Change (%) MENGE (29.10%) SW Bank 013 158) ser 500 (1141) 69) Price Change Naan wy a Ste 1 ian uae 2a 22 208 202 203 2013 ‘Blue shaded area = Emelaire Financial Corp Red = KBW Bank index (BKX) Green = S&P 500 Index > Outperformed S&P 50
Slide 26: Dividend Review
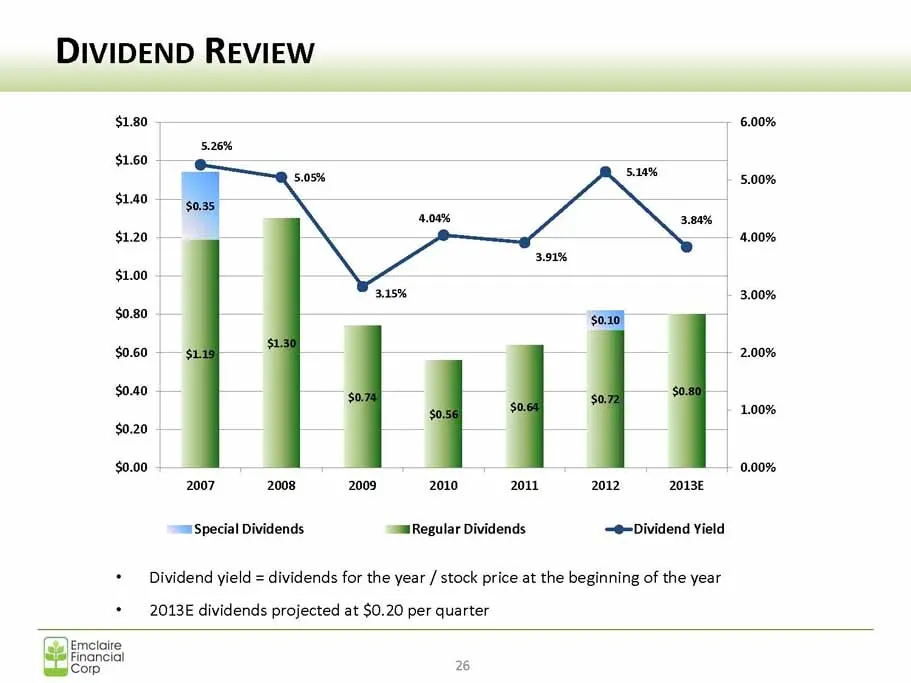
DIVIDEND REVIEW $1.80 $1.60 $1.40 $1.20 $1.00 5.26% 5.05% x 3.94% 2007 2008 2009 2010 2011 2012 2013 smSpecial Dividends smmRegular Dividends -@-Dividend Yield Dividend yield = dividends for the year / stock price at the beginning of the year 2013E dividends projected at $0.20 per quarter 5.00% 4.00
Slide 27: Growth
GROWTH Franchise and Branch Expansion Business Line Investment B)Emetote, nancial Comp 2
Slide 28: Balance Sheet Growth
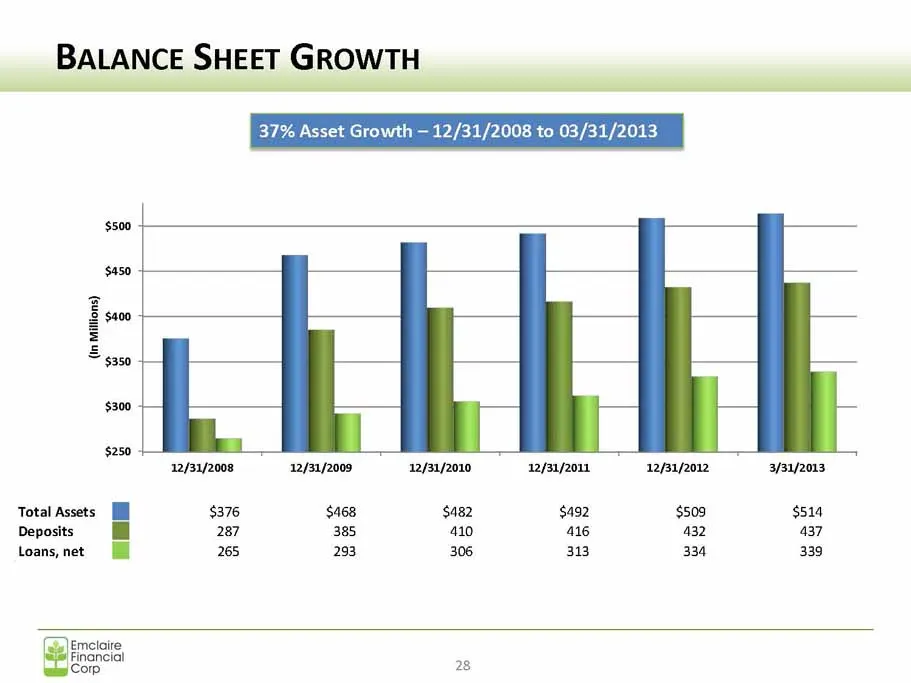
BALANCE SHEET GROWTH 37% Asset Growth — 12/31/2008 to 03/31/2013 (in mittions) ¥ ¢£ 8 8 Gq $250 + 12/31/2008 12/31/2009 12/31/2010 wps1j201 12/31/2012 Total Assets [ill $376 $468 $482 $492 $509 Deposits [i 287 385 410 416 432 loans, net [i 265 293 306 313 334 Emetatre nancial Comp 28
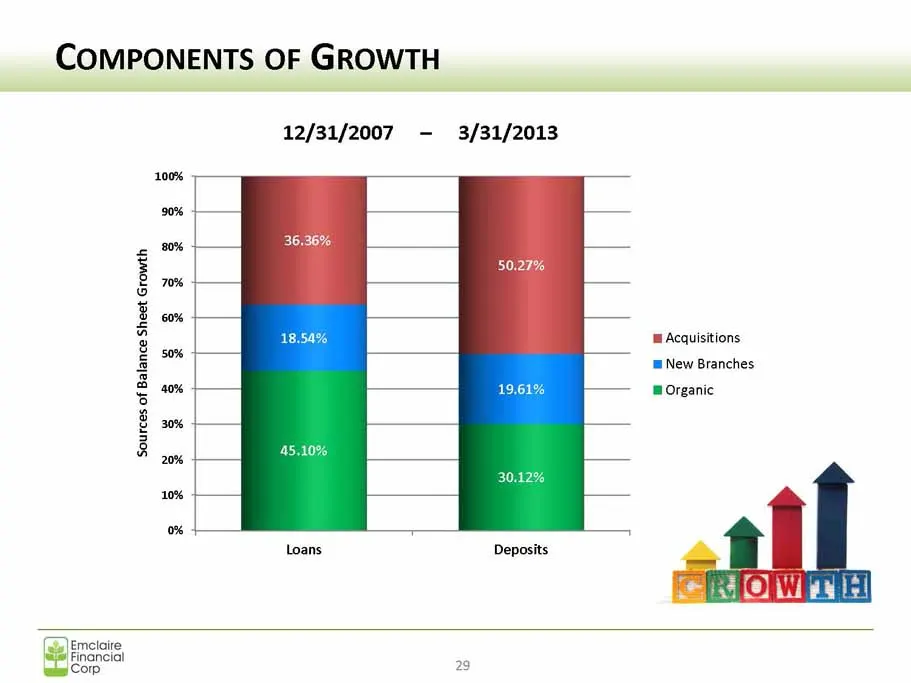
Slide 29: Components of Growth
COMPONENTS OF GROWTH 12/31/2007. - 3/31/2013 100% 90% 0% Em 6 tm 2 mAcquisitions 2 sox 5 mi New Branches $ 40% ‘Organic 8 nes 5 8 20% 10% Loans Deposits Emcloire Financial = Corp 2
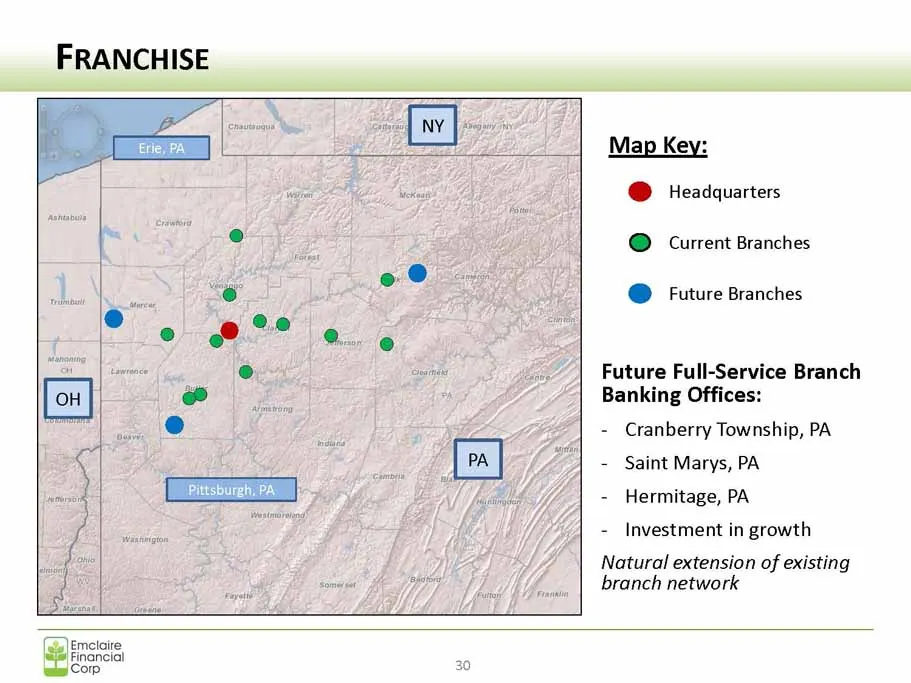
Slide 30: Map Key: Branch Locations
Map Key: seer @ Headquarters @ Current Branches a oe @ Future Branches Gy @ carne 3 Future Full-Service Branch Banking Offices: Cranberry Township, PA Saint Marys, PA Kiiditgpes Hermitage, PA Investment in growth oi Natural extension of existing oma Py, Wi & branch network Emelaire Financial Comp
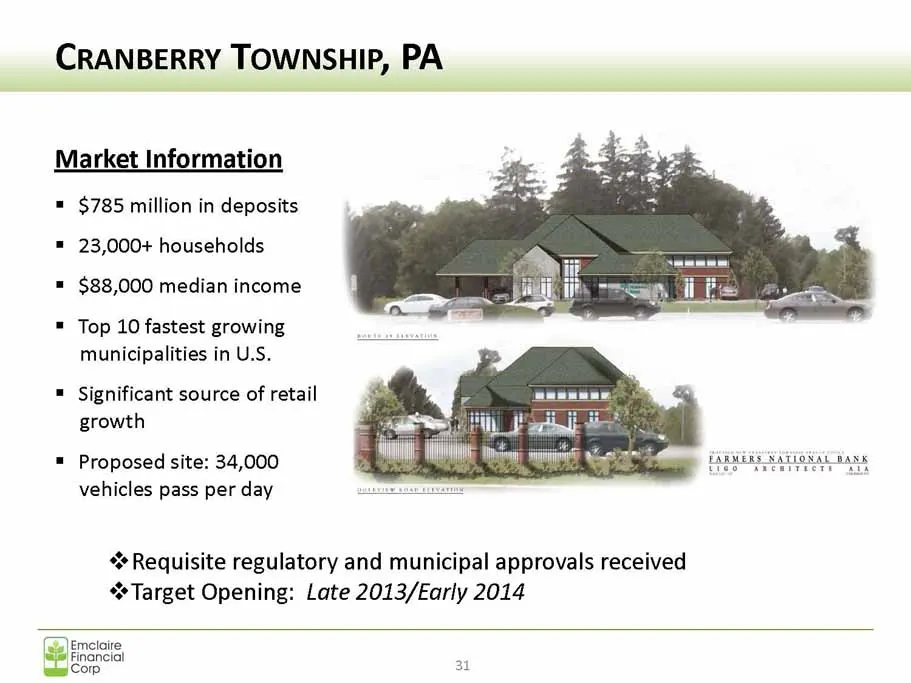
Slide 31: Cranberry Township, PA
CRANBERRY TOWNSHIP, PA Market Information = $785 million in deposits 23,000+ households $88,000 median income Top 10 fastest growing municipalities in U.S. Significant source of retail growth : ae =m COAL NE nam ine = Proposed site: 34,000 vehicles pass per day Hho Mtrearntery ats “Requisite regulat
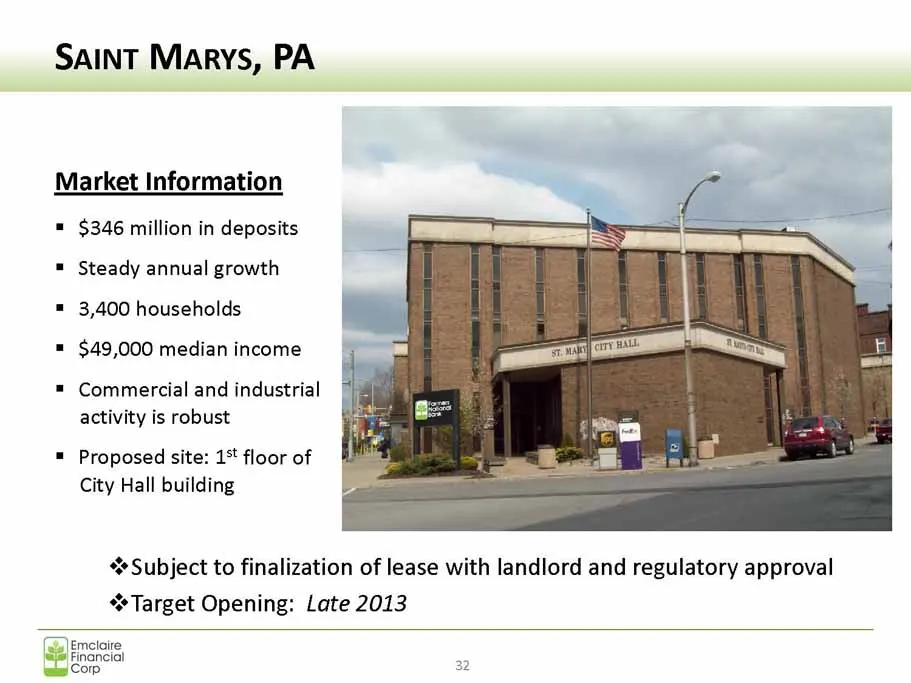
Slide 32: Saint Marys, PA
SAINT Marys, PA Market Information = $346 million in d Steady annual growth 3,400 households $49,000 median income Commercial and industrial activity is robust Proposed site: 1* floor of City Hall building “Subject to finalization of lease with landlord and regulatory approval “Target Opening: Late
Slide 33: Hermitage, PA
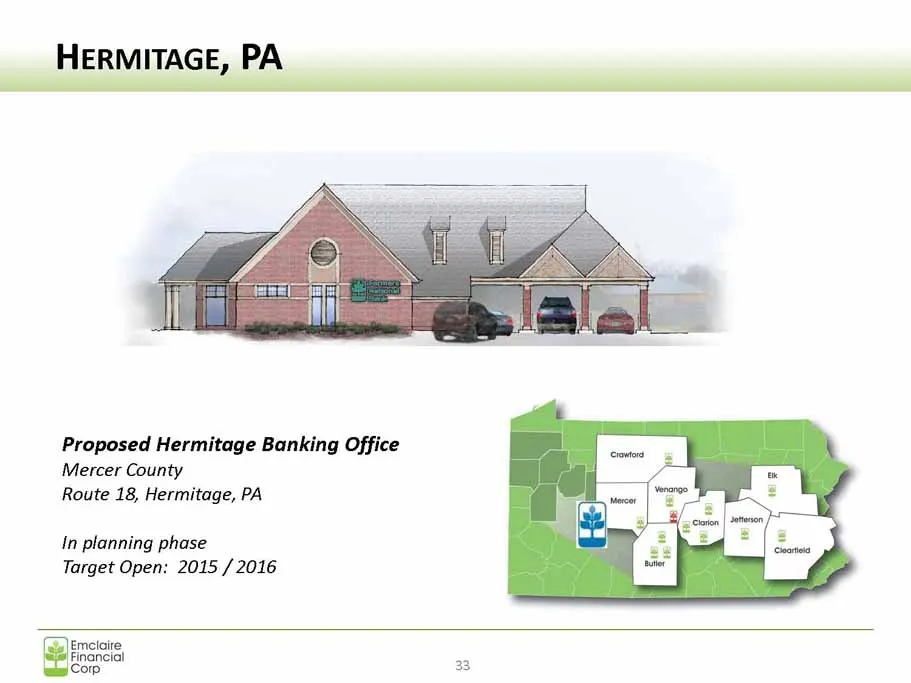
HERMITAGE, PA Proposed Hermitage Banking Office Mercer County Route 18, Hermitage, PA In planning phase Target Open: 2015 /2016 Emcloire Financial 5 Corp 3
Slide 34: Looking Ahead
LOOKING AHEAD Investing in Business Lines Investing in People and Systems Market Assessment Strategy Recap Emelaire Financial Comp
Slide 35: Business Line Investment
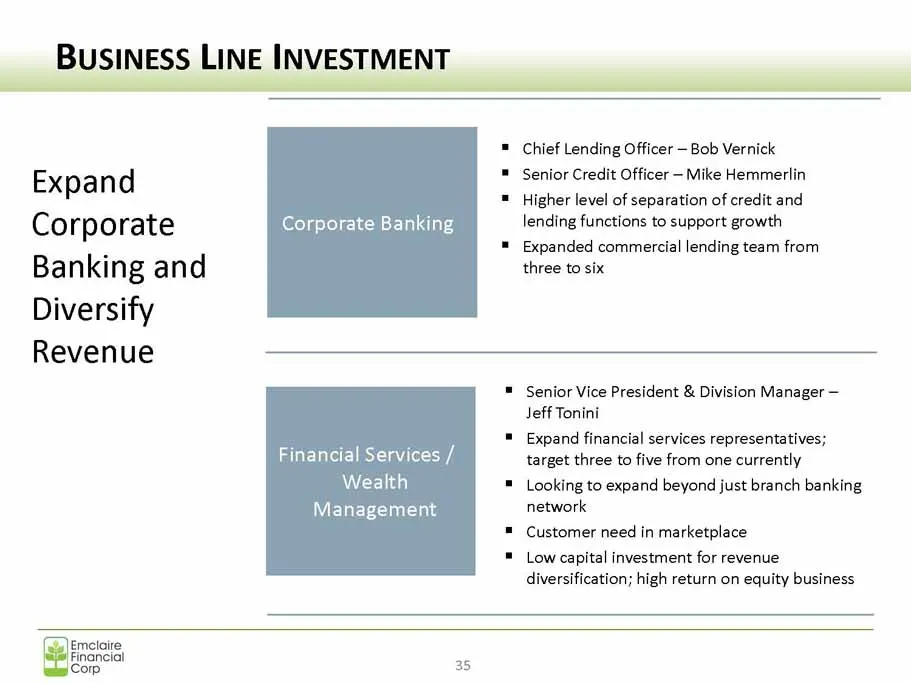
ESS ESTMENT Chief Lending Officer — Bob Vernick Senior Credit Officer - Mike Hemmerlin Higher level of separation of credit and Expand Corporate Corporate Banking lending functions to support growth . ™ Expanded commercial lending team from Banking and three to six Diversify Revenue Senior Vice Pres
Slide 36: People and Systems Investment
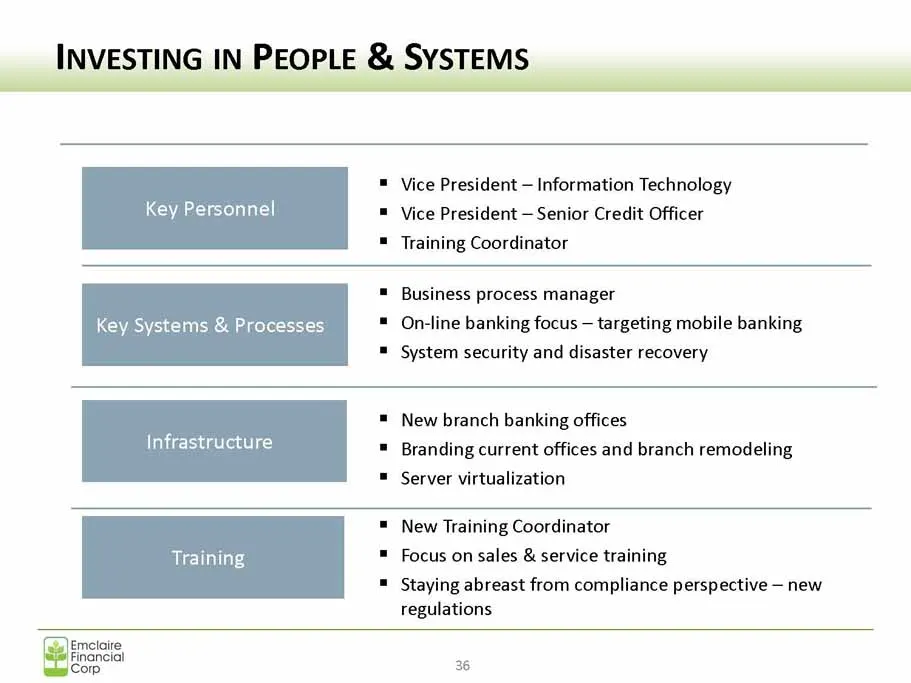
TI PE YS Vice President — Information Technology Key Personnel ™ Vice President — Senior Credit Officer = Training Coordinator ™ Business process manager Key Systems & Processes * On-line banking focus — targeting mobile banking ™ System security and disaster recovery New branch banking offices Infr
Slide 37: Market Assessment
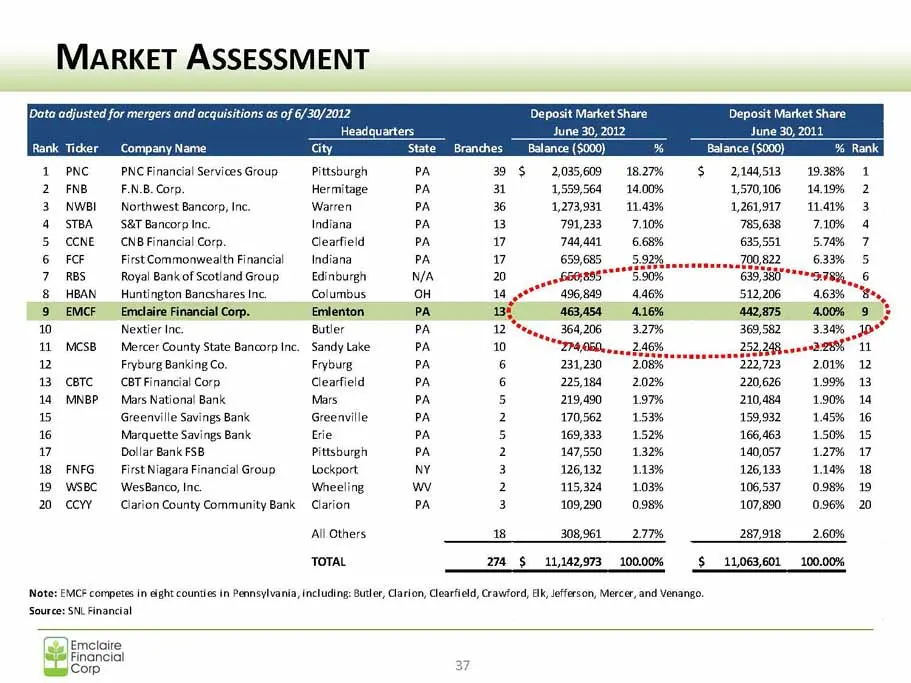
MARKET ASSESSMENT Data adjusted for mergers and acquisitions as of 6/30/2012 Deposit Market Share Deposit Market Share Headquarters June 30, 2012 June 30, 2011 Rank Ticker Company Name City State Branches Balance ($000) Balance ($000) 1 PNC —-PNCFinancial Services Group _—Pittsburgh PA 39 $ 2,085,60
Slide 38: Market Assessment
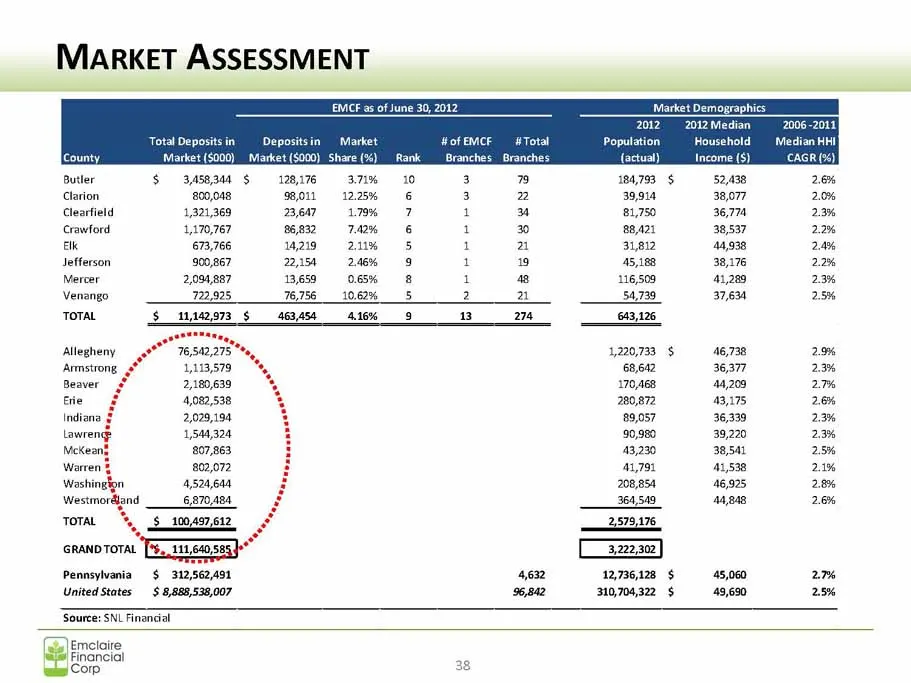
MARKET ASSESSMENT EMCF as of June 30, 2012 2012 Median Market WofEMCF Total Household Branches Branches Total Deposits in ‘Market ($000) Depositsin Market ($000) Income (S) Butler a 3,458,344 $ 128,176 3.71% 10 3 79 184,793 $ 52,438 1,220,733 $ 46,738 Washington sana oe 16,005 6,870,484 364,549 AABA
Slide 39: Strategy Recap
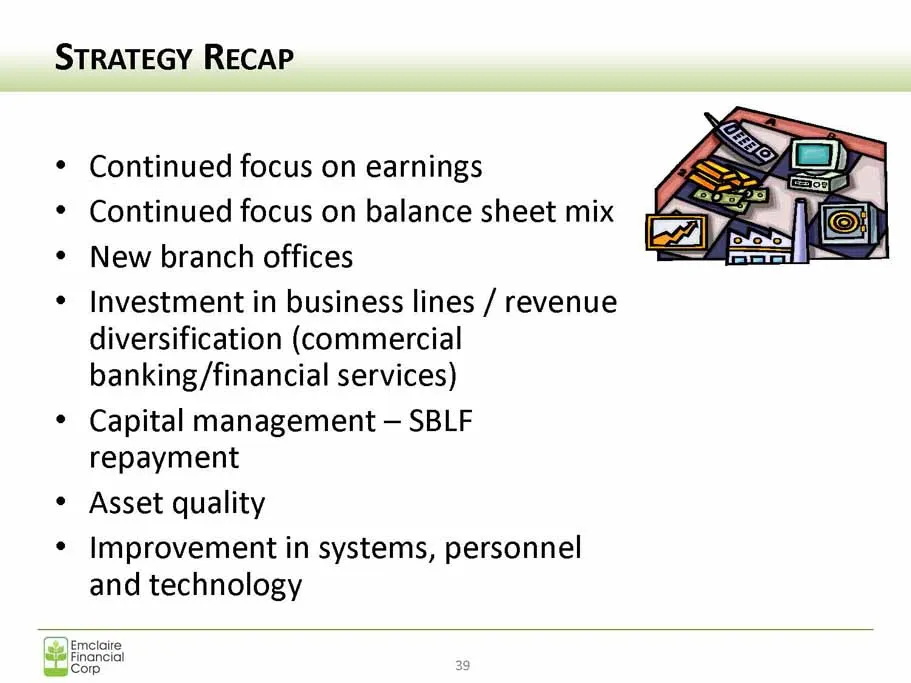
STRATEGY RECAP ¢ Continued focus on earnings ¢ Continued focus on balance sheet mix ¢ New branch offices ¢ Investment in business lines / revenue diversification (commercial banking/financial services) * Capital management — SBLF repayment ¢ Asset quality ¢ Improvement in systems, personnel and tech
Slide 40: Well Positioned
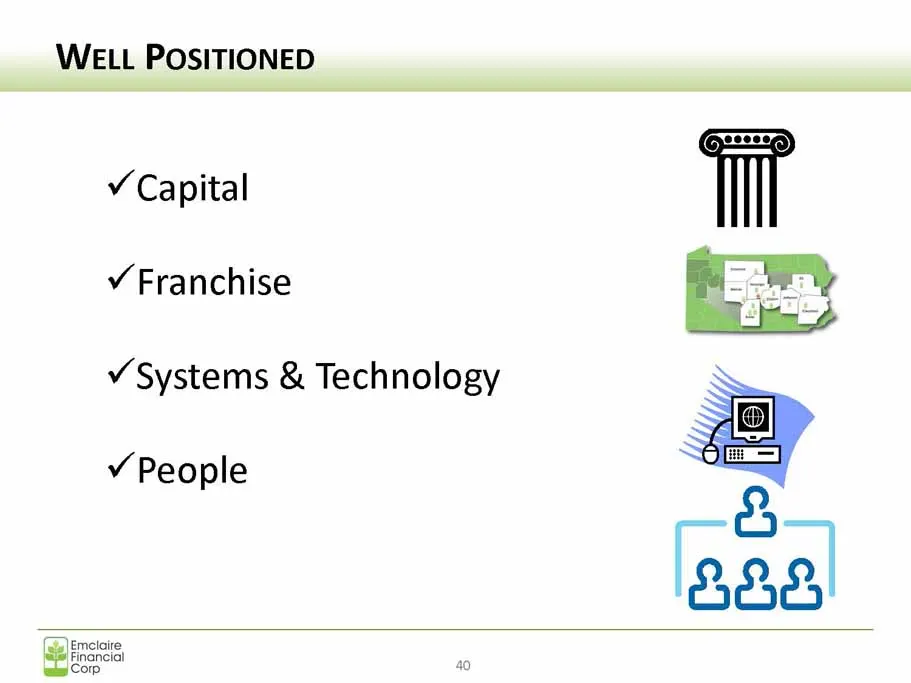
WELL POSITIONED ¥ Capital v Franchise v Systems & Technology ¥ People

Slide 41: Open Discussion
OPEN DISCUSSION ne Questions and Answers Emelaire Financial Comp at
Source: SEC EDGAR · 8-K filed Apr 24, 2013
More decks from Emclaire Financial Corp
 Merger or Acquisition (March 2022)13 slides · Mar 24, 2022
 Shareholder Meeting (April 2021)36 slides · Apr 21, 2021
 Shareholder Meeting (April 2020)32 slides · Apr 22, 2020
 Raymond James Emerging Bank Symposium (September 2019)23 slides · Sep 4, 2019
 Shareholder Meeting (April 2019)32 slides · Apr 24, 2019
 Shareholder Meeting (April 2018)28 slides · Apr 25, 2018