Emclaire Financial — Shareholder Meeting (April 2021)
36 slides from Emclaire Financial's shareholder meeting presentation, Apr 21, 2021
Slide 1: 2021 Annual Meeting of Shareholders
2021 ANNUAL MEETING OF SHAREHOLDERS EMCLAIRE FINANCIAL CORP PARENT COMPANY OF: THE FARMERS NATIONAL BANK OF EMLENTON Presented by: William C. Marsh - Chairman, President and Chief Executive Officer Emlenton, Pennsylvania * April 21,2021 Emclaire Financial Corp
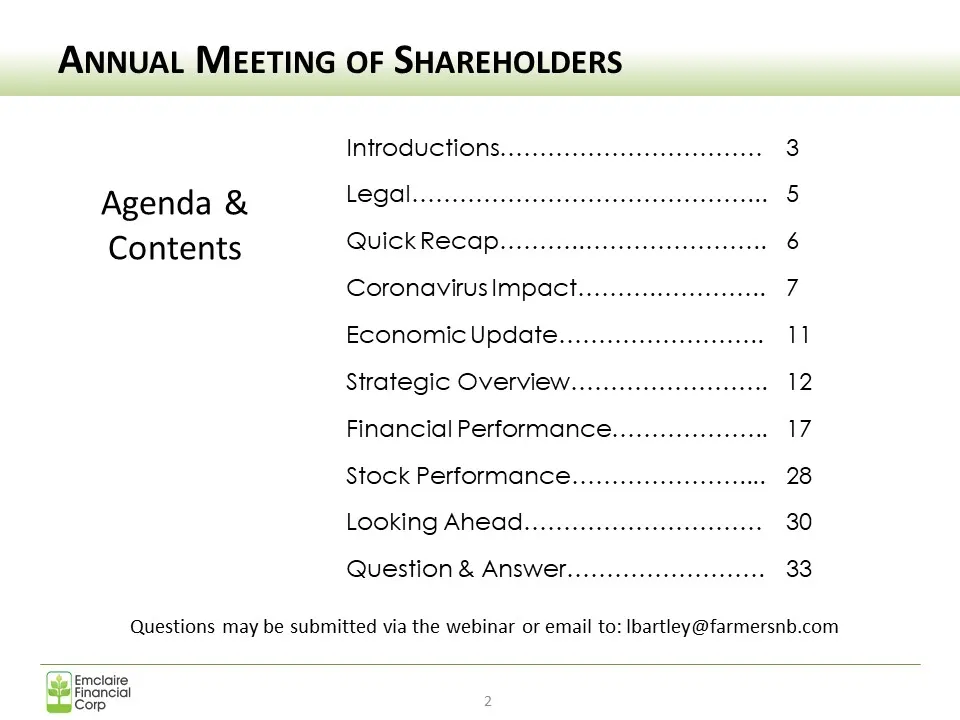
Slide 2: Annual Meeting of Shareholders Contents
ANNUAL MEETING OF SHAREHOLDERS INtOGUCTIONS. 0... :cceeeeeeeeseeeeeeee eee eee 3 Agenda & [KF (| ee CCE 5 Contents QUICK RECO seernsrsssenmasecccommnssescces 6 COPONAVINUS IMPAChrvcicssesssssessseessees 7 ECONOMICU DAOC ...s00ssca0sssasses0000¥0 1 Strategic OVErVieW.........ccceecceeee eens 12 Finan

Slide 3: Our Board of Directors
Our BOARD OF DIRECTORS James M. Crooks William C. Marsh Millssa S. Bauer FB Bo So be.

Slide 4: Our Executive Management Team
Our EXECUTIVE MANAGEMENT TEAM Emelaire Financial Corp. 4
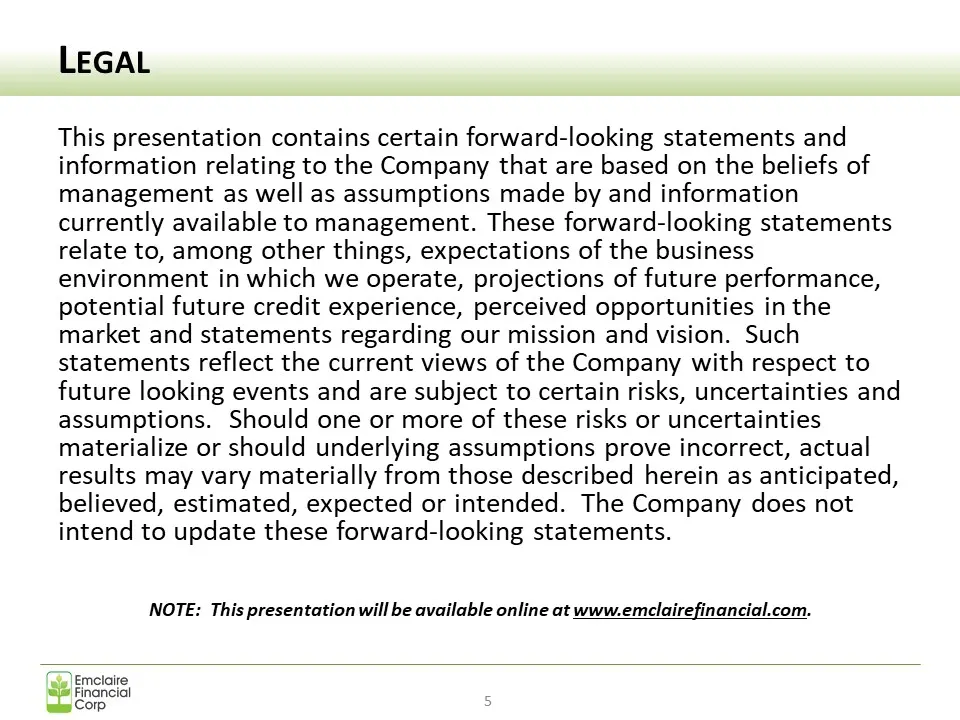
Slide 5: Legal
LEGAL This presentation contains certain forward-looking statements and information relating to the Company that are based on the beliefs of management as well as assumptions made by and information currently available to management. These forward-looking statements relate to, among other things, ex
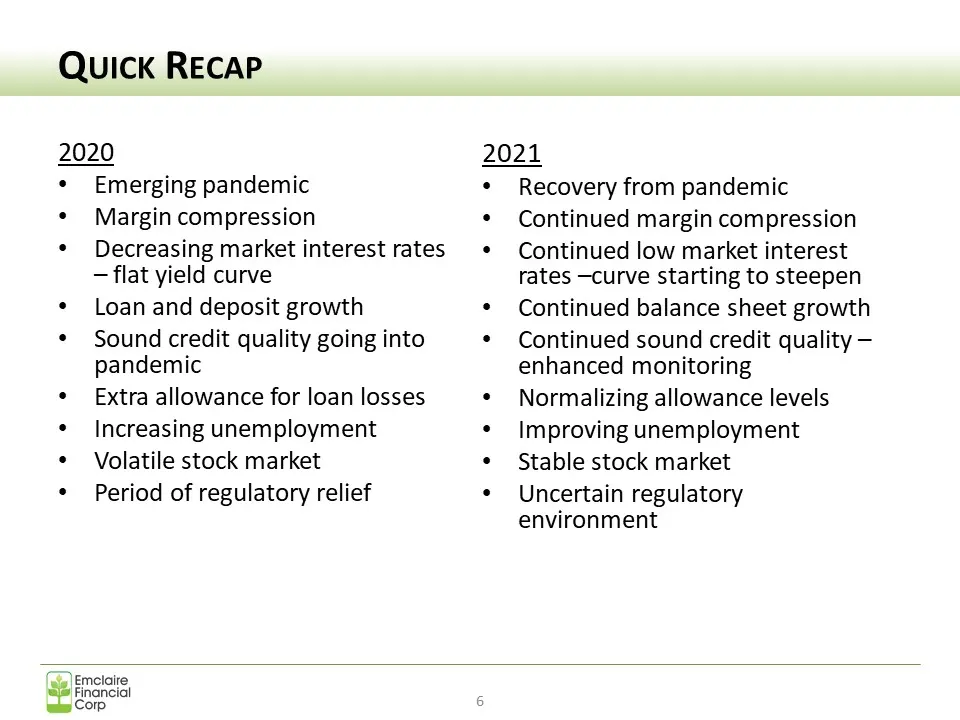
Slide 6: Quick Recap
Quick RECAP 2020 Emerging pandemic Margin compression Decreasing market interest rates — flat yield curve Loan and deposit growth Sound credit quality going into pandemic Extra allowance for loan losses Increasing unemployment Volatile stock market Period of regulatory relief 2 021 Recovery from pan
Slide 7: Coronavirus (COVID-19) Impact
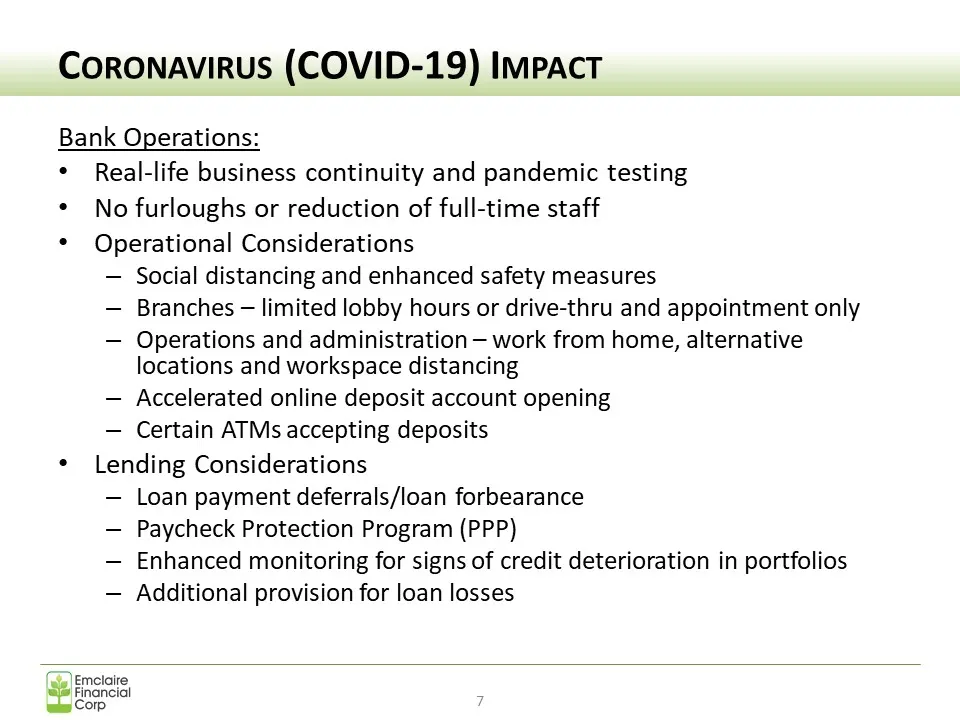
Coronavirus (COVID-19) Impact Bank Operations: * Real-life business continuity and pandemic testing * No furloughs or reduction of full-time staff * Operational Considerations Social distancing and enhanced safety measures Branches — limited lobby hours or drive-thru and appointment only Operations
Slide 8: Coronavirus (COVID-19) Impact: Paycheck Protection Program
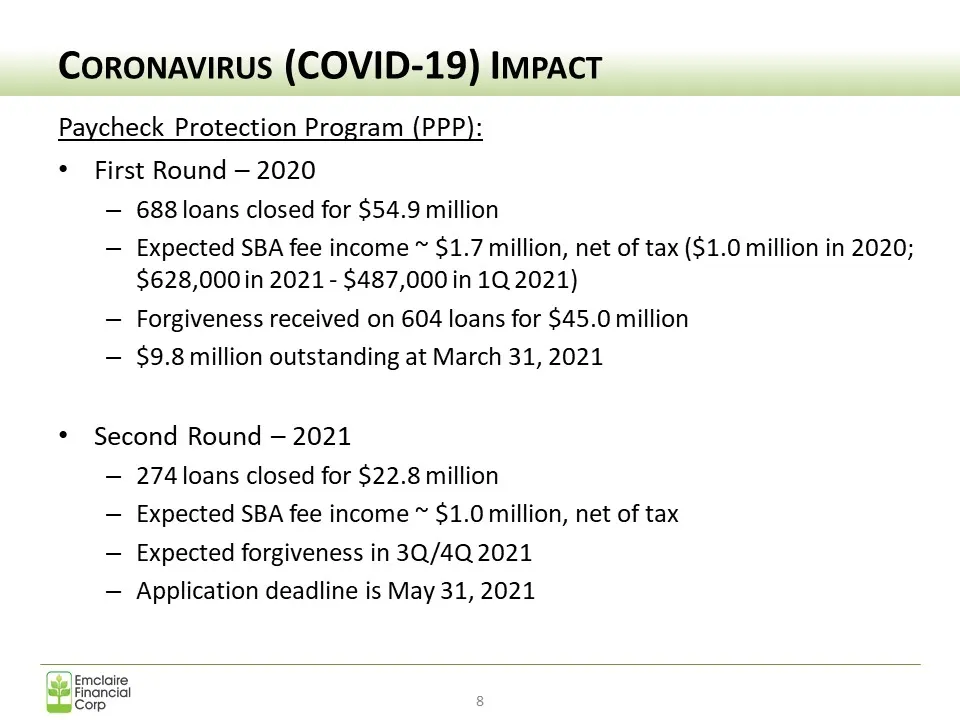
Coronavirus (COVID-19) Impact Paycheck Protection Program (PPP): * First Round — 2020 — 688 loans closed for $54.9 million — Expected SBA fee income ~ $1.7 million, net of tax ($1.0 million in 2020; $628,000 in 2021 - $487,000 in 1Q 2021) — Forgiveness received on 604 loans for $45.0 million — $9.8
Slide 9: Coronavirus (COVID-19) Impact: Loan Deferment/Forbearance
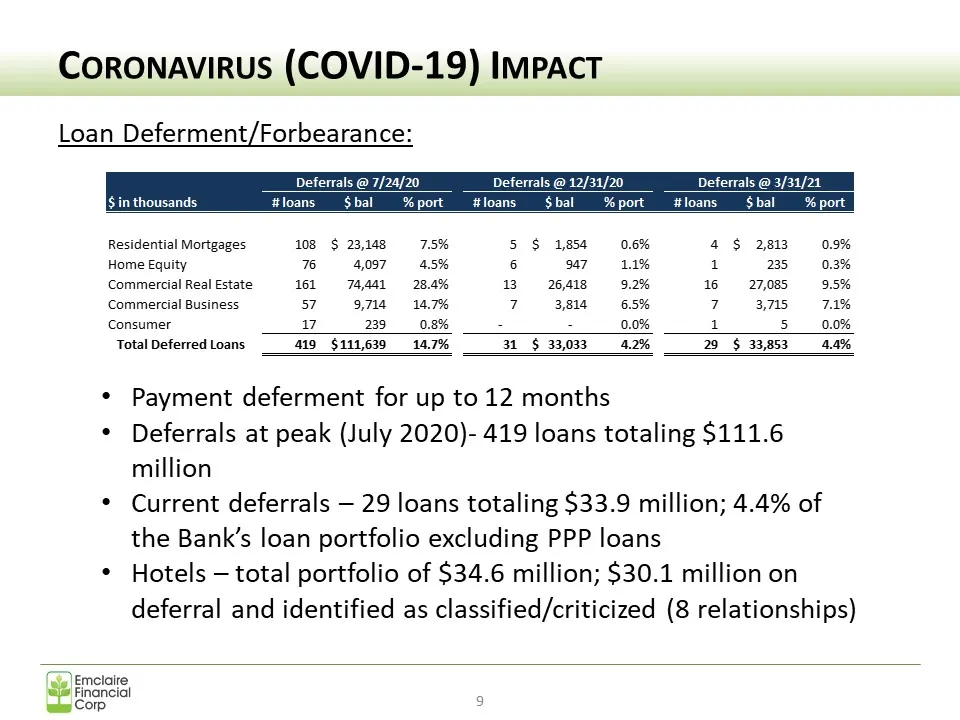
Coronavirus (COVID-19) Impact Loan Deferment/Forbearance: Deferrals @ 3/31/21 $ in thousands loans $bal__%port loans $bal__‘%port __#loans bal port Residential Mortgages 108 $ 23,148 7.5% 5 $ 1,854 0.6% 4 $ 2813 0.9% Home Equity 76 4,097 4.5% 6 947 -1.1% 1 235 (0.3% Commercial Real Estate 161 74,441
Slide 10: Coronavirus (COVID-19) Impact: Long-term Impact
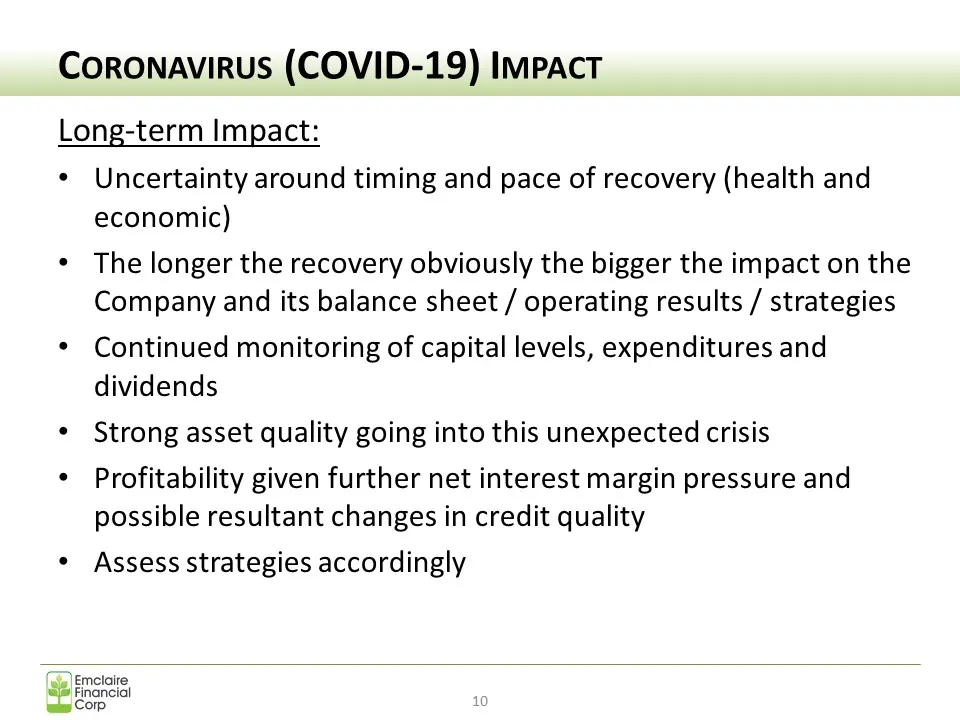
Coronavirus (COVID-19) Impact Long-term Impact: ¢ Uncertainty around timing and pace of recovery (health and economic) ¢ The longer the recovery obviously the bigger the impact on the Company and its balance sheet / operating results / strategies * Continued monitoring of capital levels, expenditure
Slide 11: Economic Update
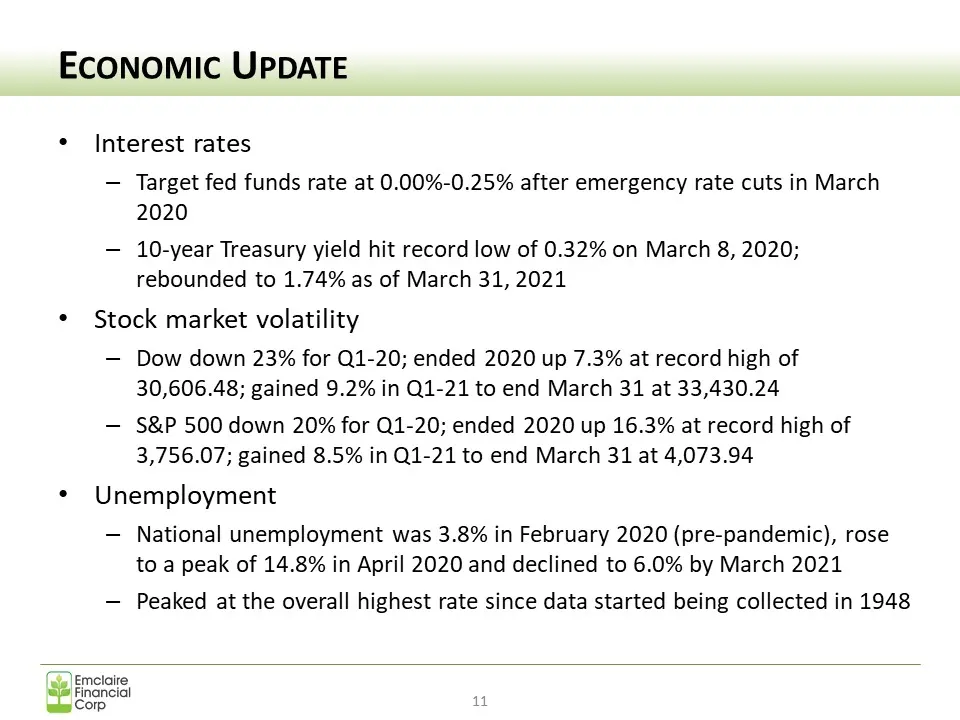
ECONOMIC UPDATE * Interest rates — Target fed funds rate at 0.00%-0.25% after emergency rate cuts in March 2020 — 10-year Treasury yield hit record low of 0.32% on March 8, 2020; rebounded to 1.74% as of March 31, 2021 * Stock market volatility — Dow down 23% for Q1-20; ended 2020 up 7.3% at record
Slide 12: Strategic Overview
-++ Strategic Overview --- Emelaire Financial Corp, 2
Slide 13: Strategic Overview
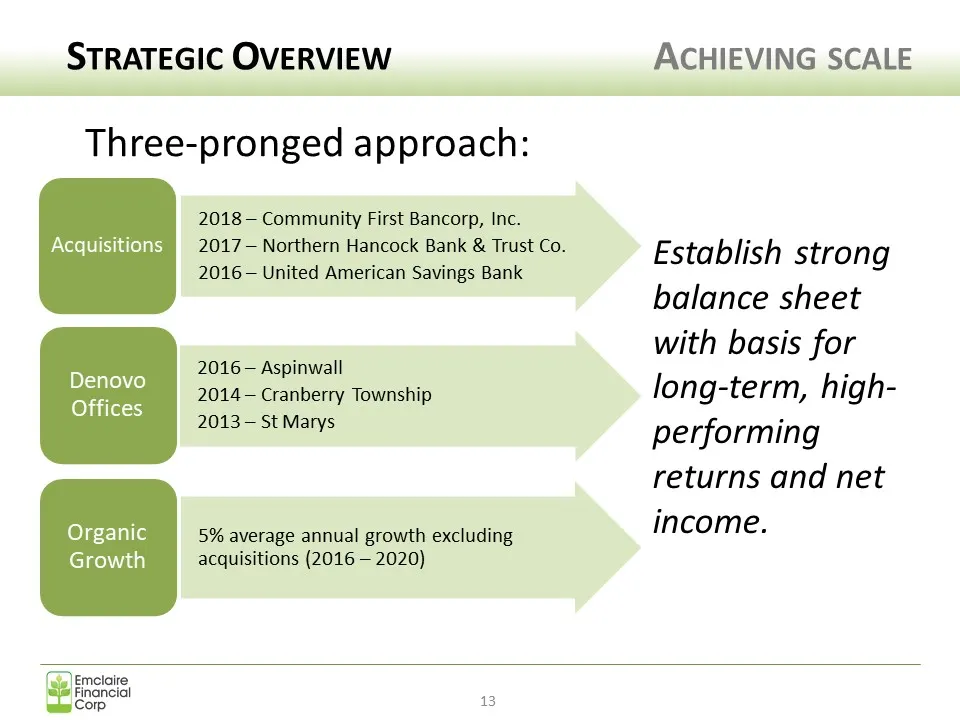
STRATEGIC OVERVIEW Three-pronged approach: 2018 — Community First Bancorp, Inc. UX Sisfeyps =.2017 — Northern Hancock Bank & Trust Co. 2016 -— United American Savings Bank 2016 — Aspinwall 2014 — Cranberry Township 2013 — St Marys Denovo Offices Organic 5% average annual growth excluding Growth acqu
Slide 14: Strategic Overview: Banking Industry Trends
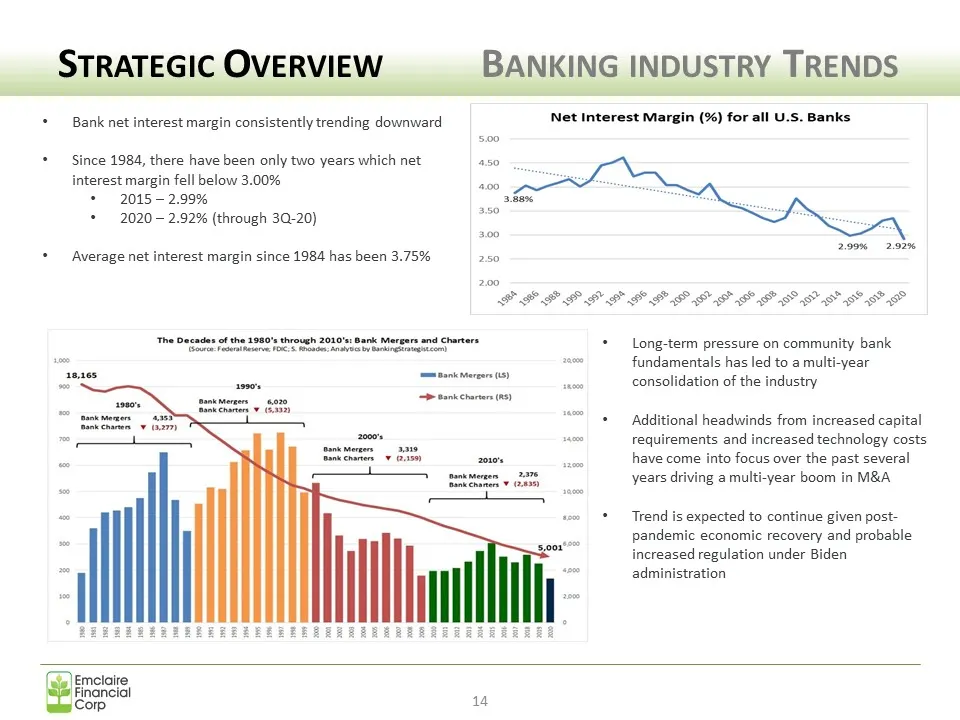
STRATEGIC OVERVIEW BANKING INDUSTRY TRENDS + Bank net interest margin consistently trending downward Net Interest Margin (%) for all U.S. Banks + Since 1984, there have been only two years which net 450 interest margin fell below 3.00% bs. * 2015 - 2.99% 3.Ba% * 2020 - 2.92% (through 3Q-20) + Averag
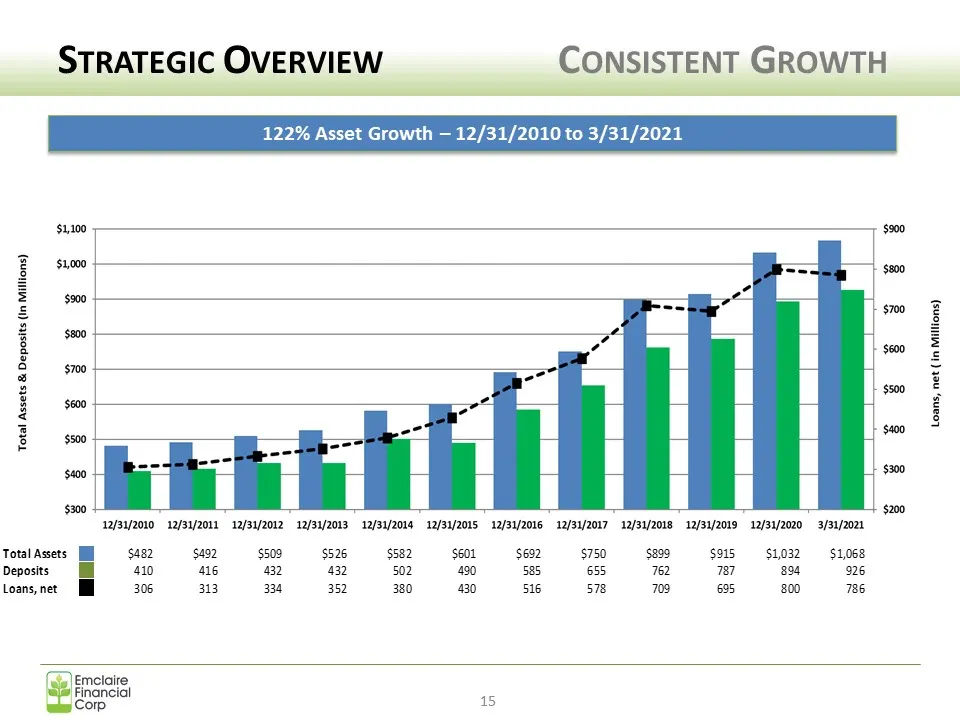
Slide 15: Strategic Overview: Consistent Growth
STR ATEGIC OVERVIEW CONSISTENT GROWTH $4300 $900 g $800 5 ~ = smo 3 2 i soo é = 5 i H so E xf ‘$400 3 é $300 $200 12/31/2010 12/31/2011 12/31/2012 12/31/2013 12/31/2014 12/31/2015 12/31/2016 12/31/2017 12/31/2018 12/31/2019 12/31/2020 3/31/2021 Total Assets [i $482, $492, $509 $526 $582 $601 $692 $7
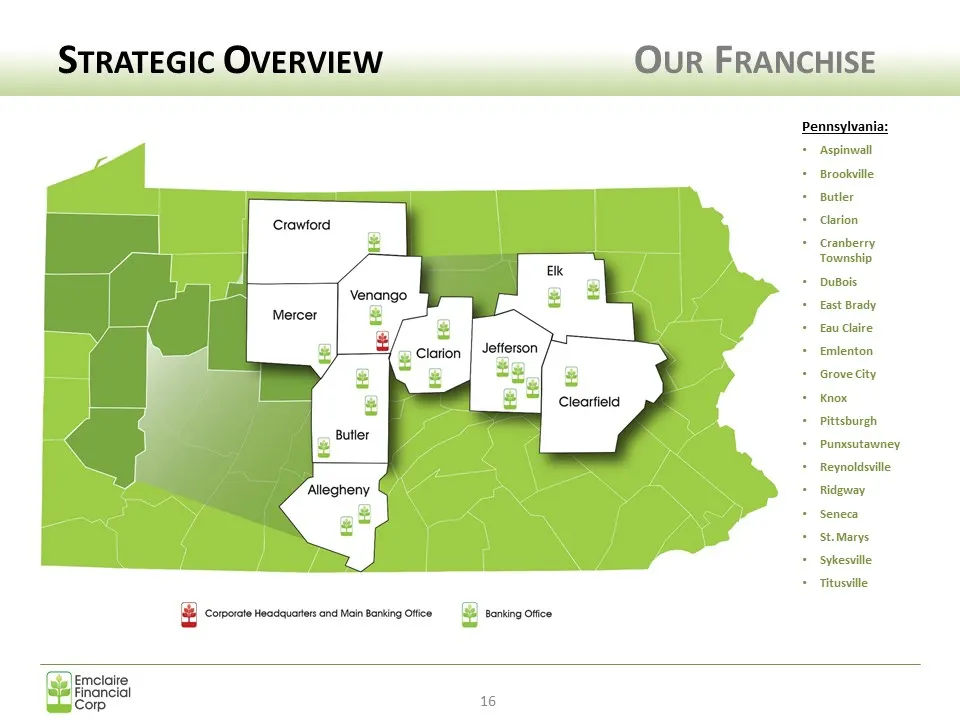
Slide 16: Strategic Overview: Our Franchise
STRATEGIC OVERVIEW OUR FRANCHISE Pennsylvania: + Aspinwall + Brookwille + Butler + Clarion + Cranberry Township + DuBois Venango a + East Brady Mercer + Eau Chaire Jefferson + Emlenton + Grovecity g| = Clearfield — + Pittsburgh + Punxsutawney + Reynoldsville ‘Allegheny + Ridgway 2 + Seneca = + stars
Slide 17: Financial Performance
--- Financial Performance ..-- Se Emclaire Financial “orp 17
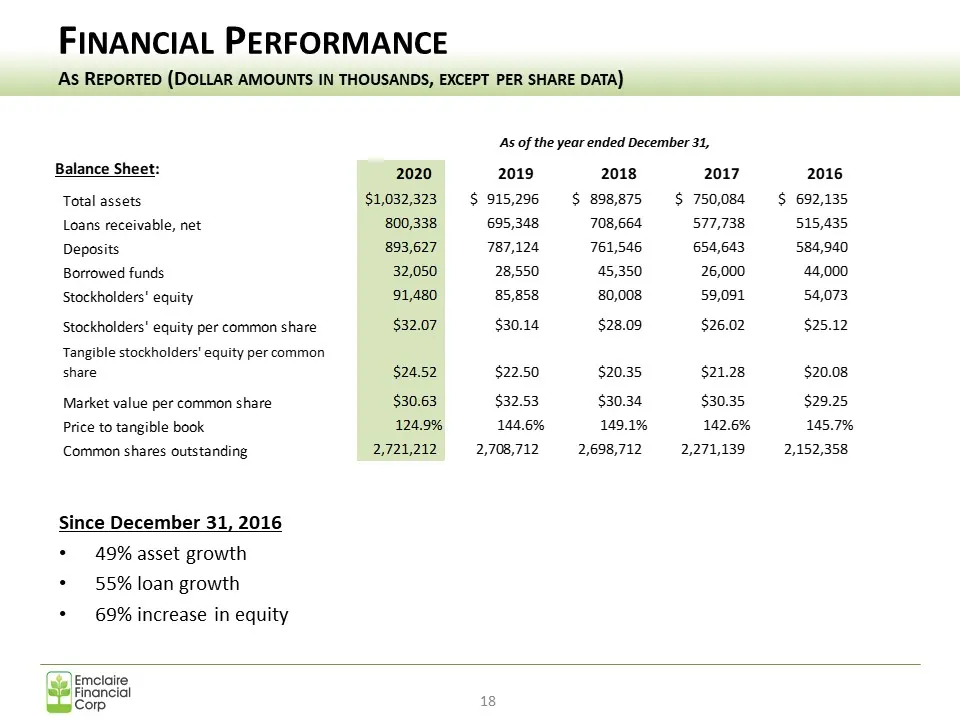
Slide 18: Financial Performance
FINANCIAL PERFORMANCE As REPORTED (DOLLAR AMOUNTS IN THOUSANDS, EXCEPT PER SHARE DATA) Balance Sheet: As of the year ended December 31, 2020 2019 2018 2017 2016 Total assets $1,032,323 $ 915,296 $ 898,875 $ 750,084 $$ 692,135 Loans receivable, net 800,338 695,348 708,664 577,738 515,435 Deposits 893
Slide 19: Financial Performance
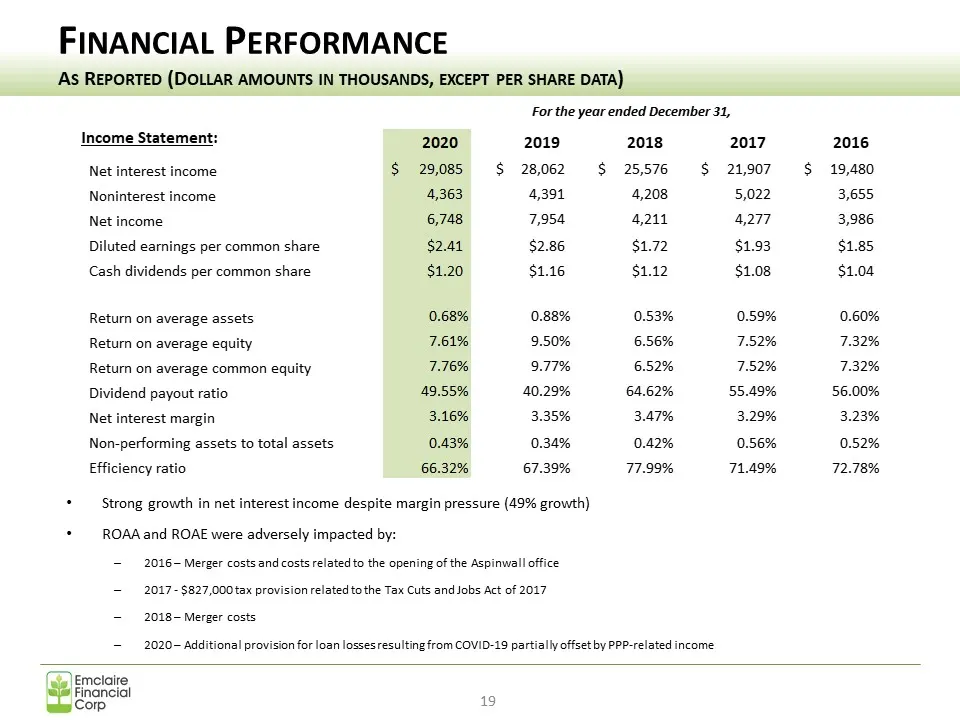
FINANCIAL PERFORMANCE As REPORTED (DOLLAR AMOUNTS IN THOUSANDS, EXCEPT PER SHARE DATA) Income Statement: Net interest income No: ferest income Net income Diluted earnings per common share Cash dividends per common share Return on average assets Return on average equity Return on average common equit
Slide 20: Financial Performance 2020 vs. 2019
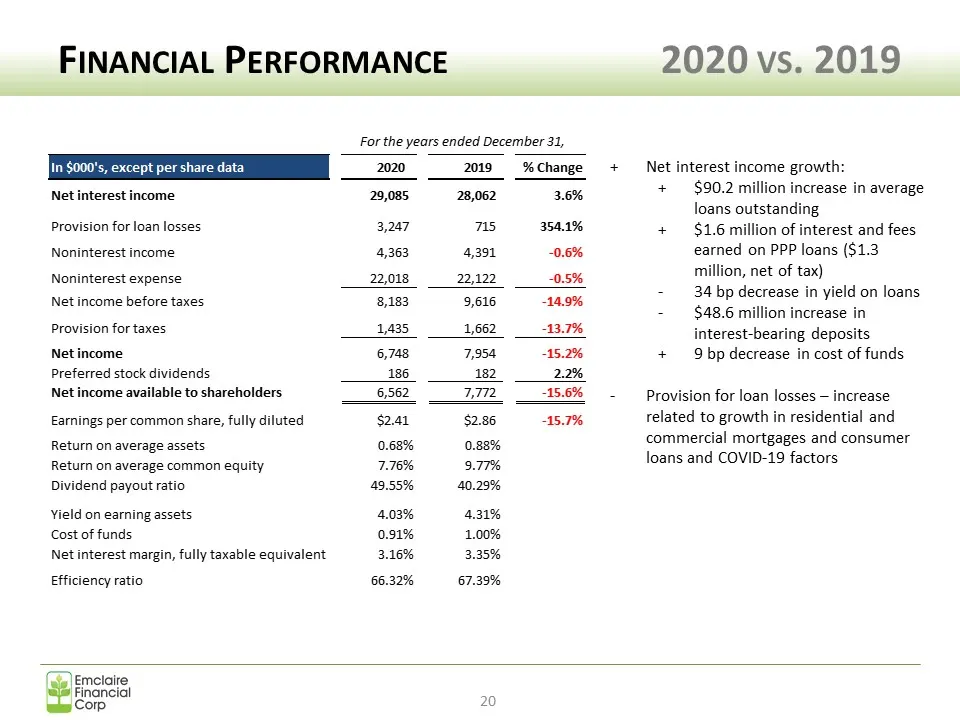
FINANCIAL PERFORMANCE 2020 vs. 2019 For the years ended December 31, In $000's, except per share data 2020 2019 _%Change + Net interest income growth: + $90.2 million increase in average Net interest income (29,085 (28,062 3.6% loans outstanding Provision for loan losses 3,287 715 354.1% + $1.6 mill
Slide 21: Financial Performance: Net Interest Income
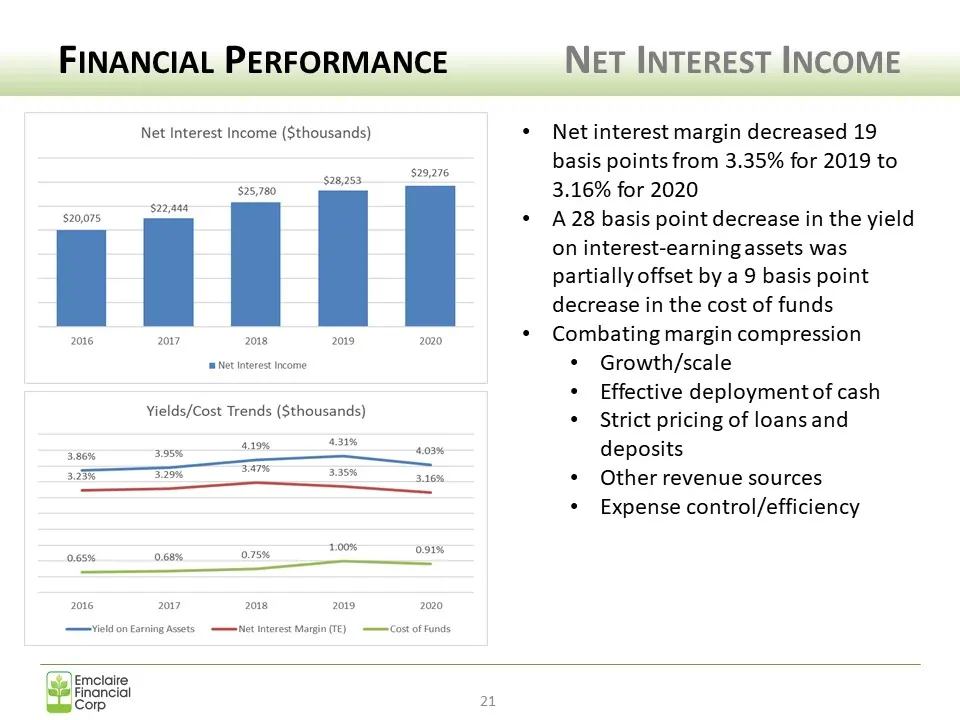
FINANCIAL PERFORMANCE Net Interest Income ($thousands) $28,253 $25,780 $22,448 J 2016 2017 2018 2019 sm Net Interest Income Yields/Cost Trends (Sthousands) $29,276 2020 4.03% 3.16% 091% 2020 aa. 431% sax 3.95% 325% erry 547% 335% 1.00% 0.655 0.68% 0.75% 2016 2017 2018 2019 Yield on Earing Assets Net
Slide 22: Financial Performance Q1-2021 Balance Sheet
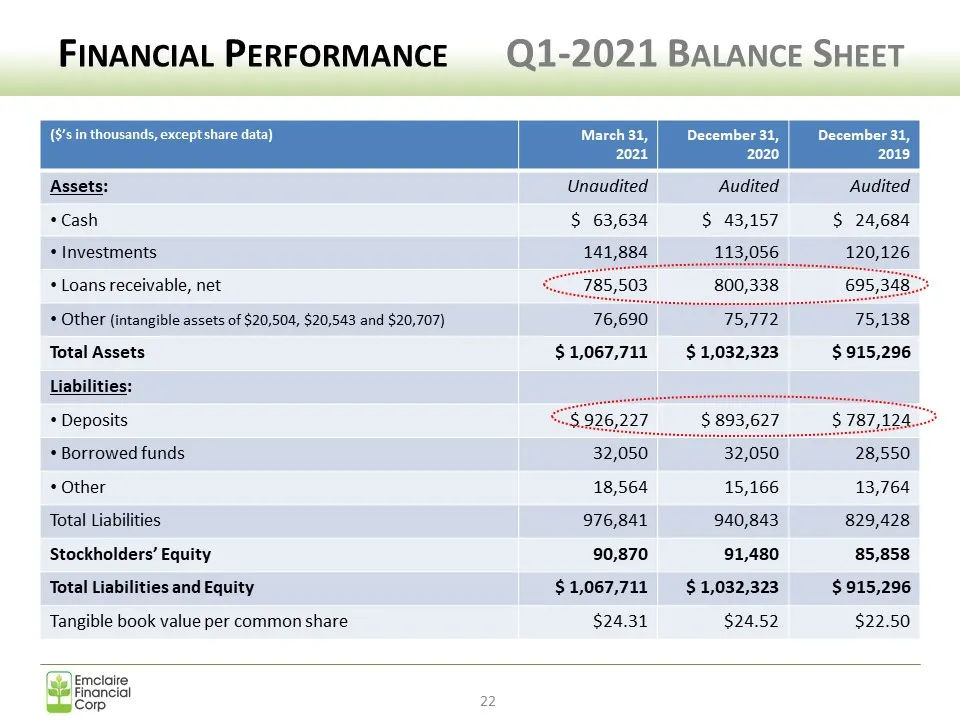
FINANCIAL PERFORMANCE Q1-2021 BALANCE SHEET (§’sin thousands, except share data) December 31, | December 31, 2020 2019 Assets: Unaudited Audited Audited * Cash $ 63,634 $ 43,157 $ 24,684 113,056 120,126 * Investments * Loans receivable, net * Other (intangible assets of $20,504, $20,543 and $20,707)
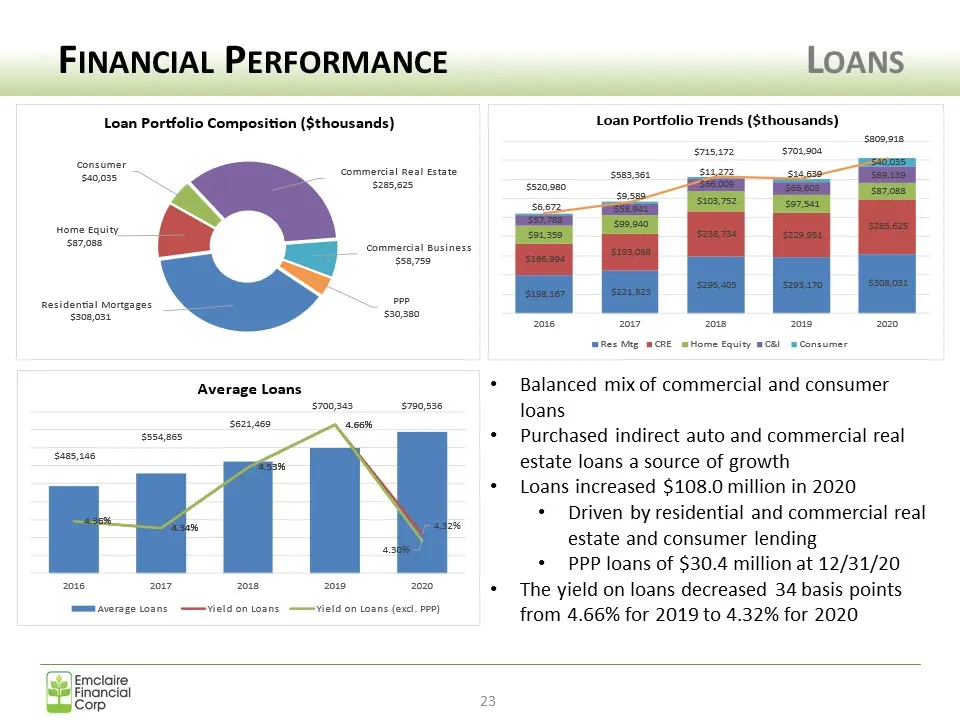
Slide 23: Financial Performance: Loans
FINANCIAL PERFORMANCE LOANS Loan Portfolio Composition ($thousands) Loan Portfolio Trends ($thousands) 00 918 sms 701908 ‘ossumer commercial Real Estate S085 $205,025, ome eal > $27,088 commercai Business $38,739 lies Mag MCRE Home Equity CSI = Consumer Average Loans * Balanced mix of commercial and
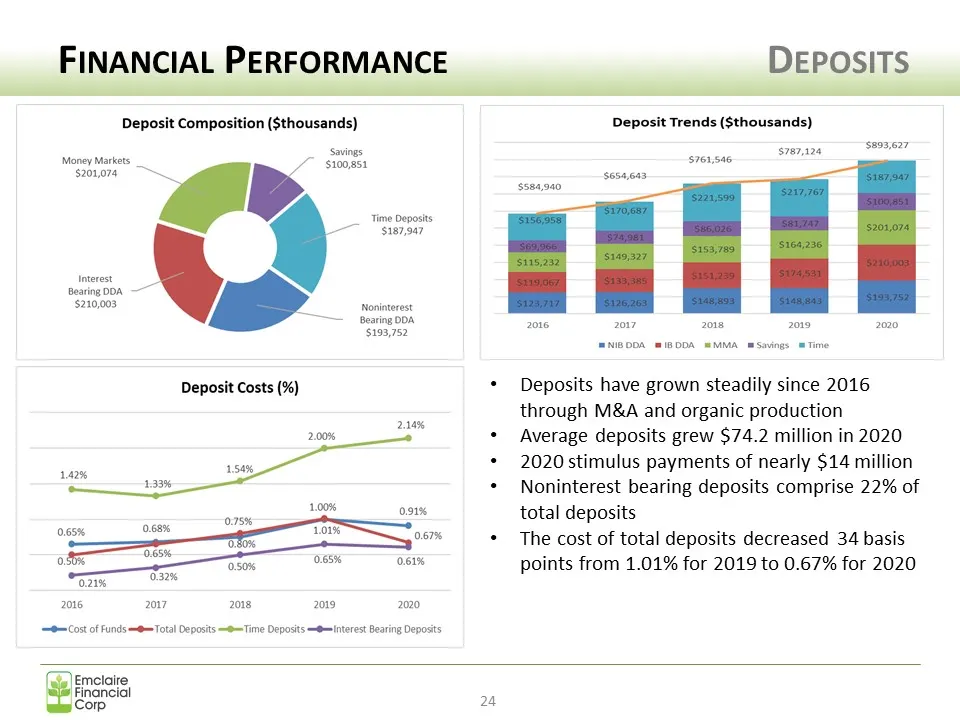
Slide 24: Financial Performance: Deposits
FINANCIAL PERFORMANCE DEPOSITS Deposit Composition (Sthousands) Deposit Trends ($thousands) $893,607 savings $787,124 . 5761,546, Money Markets = $100,851 $201,074 4 $654,643 sse4.940 Time Deposits $187,947 Bearing DOA — $210,003, Noninterest — Bearing ODA 2016 2017 2o1e 2019 2020 $193,752 Deposit C
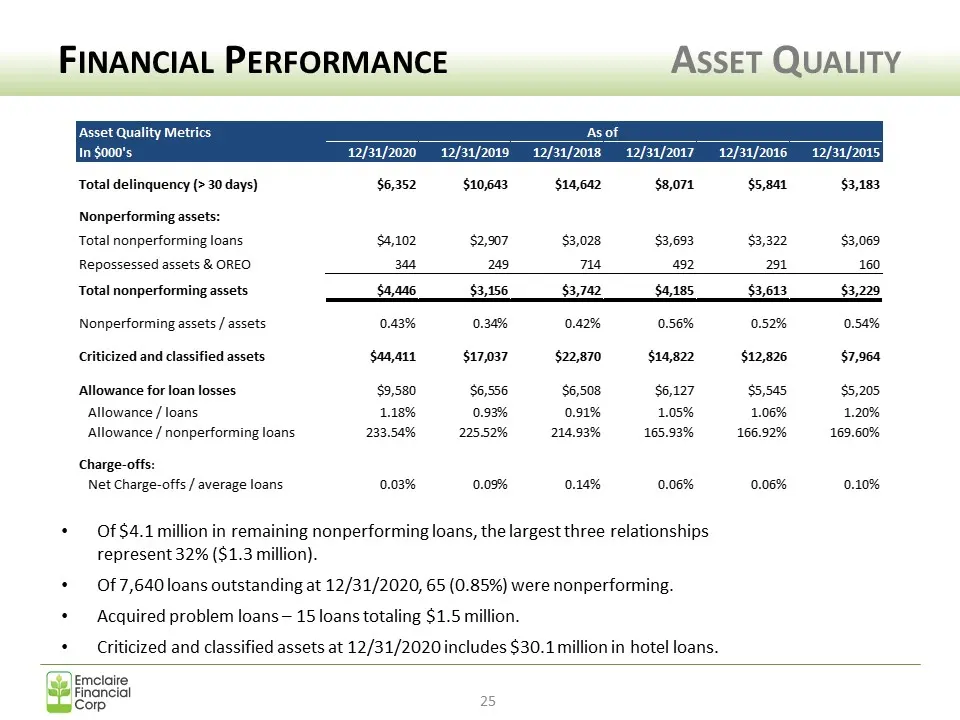
Slide 25: Financial Performance: Asset Quality
FINANCIAL PERFORMANCE ASSET QUALITY [Asset Quality Metrics As of In $000's 12/31/2020 12/31/2019 12/31/2018 12/31/2017 _ 12/31/2016 __ 12/31/2015 Total delinquency (> 30 days) $6,352 $10,643 $14,642 $8,071 $5,841 $3,183 Nonperforming assets: Total nonperforming loans $4,102 $2,907 $3,028 $3,693 $3,3
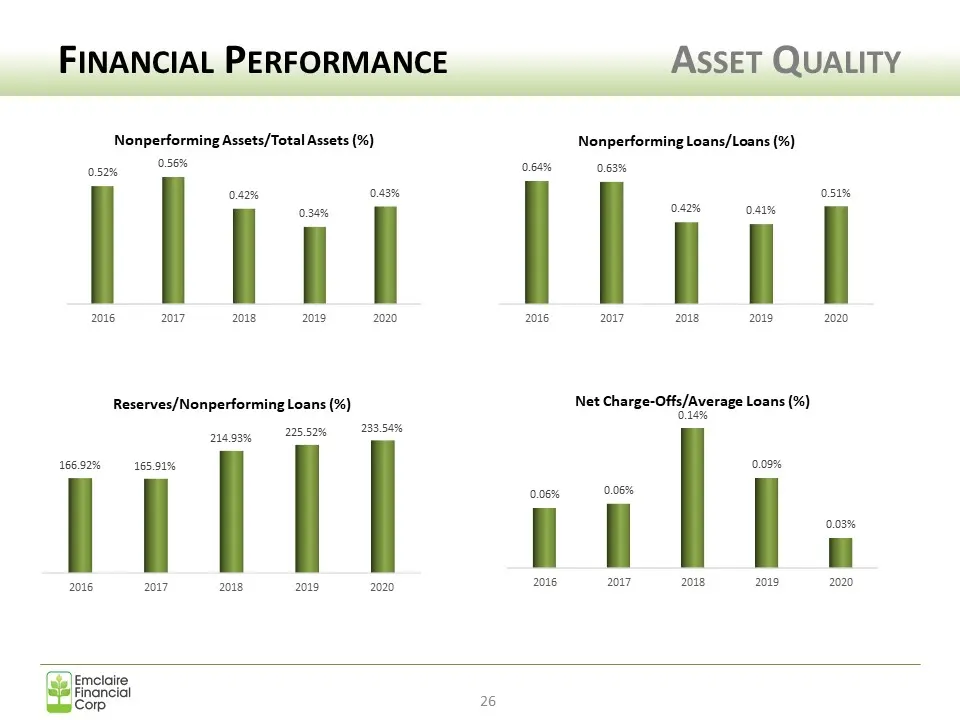
Slide 26: Financial Performance: Asset Quality
FINANCIAL PERFORMANCE ASSET QUALITY Nonperforming Assets/Total Assets (%) Nonperforming Loans/Loans (%) 052% 0.58% 064% 0.63% 042% 0.83% 051% | 030% | 0.42% 01% | 2016 2017 2018 2019 2020 2016 2017 2018 2019 2020 Reserves/Nonperforming Loans (%) Net Charge-Offs/Average Loans (%) 23354% 214.93% psa 1
Slide 27: Financial Performance Q1-2021 vs. Q1-2020
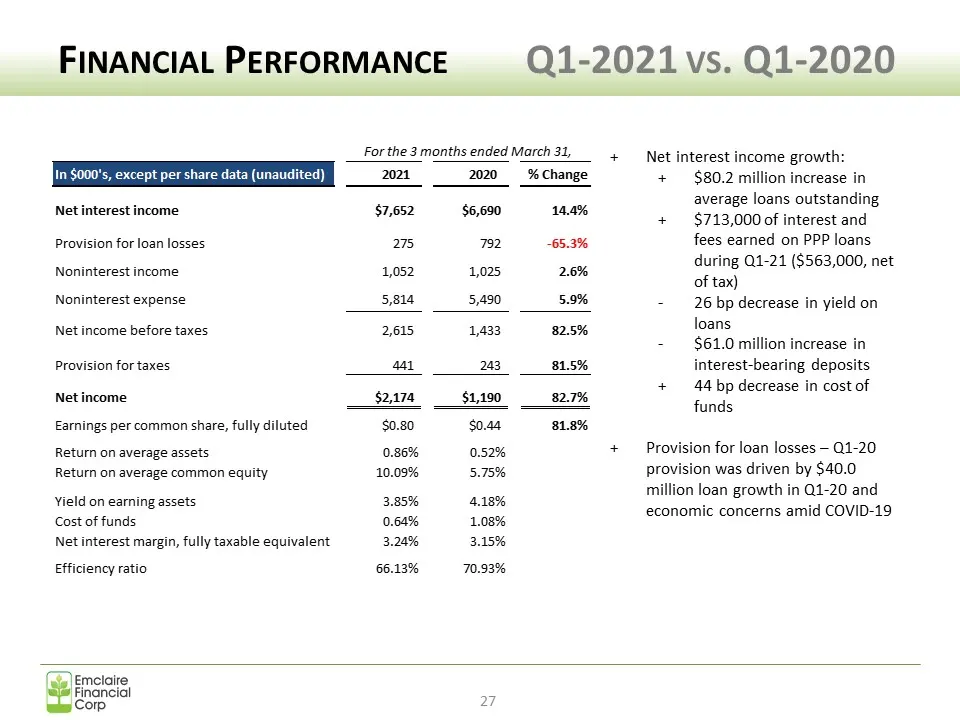
FINANCIAL PERFORMANCE Q1-2021 vs. Q1-2020 Forthe3 months ended March 31, ‘Net interest income growth: in $000's, except per share data (unaudited) 2021 2020 _% Change + $80.2 million increase in average loans outstanding Net inte t i 7,652 5,690 14.4% a et interest income - 2 + $713,000 of interest
Slide 28: Stock Performance
Stock Performance Se Emclaire Financial “orp 28
Slide 29: Corporate Overview: Stock Performance
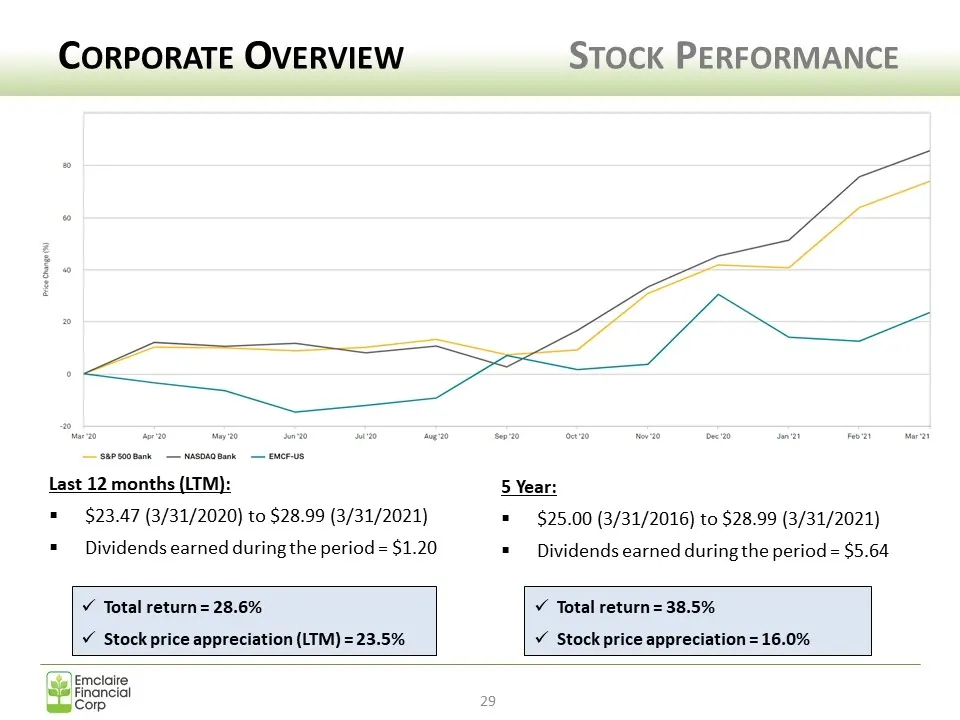
CORPORATE OVERVIEW STOCK PERFORMANCE Last 12 months (LTM): 5 Year: = $23.47 (3/31/2020) to $28.99 (3/31/2021) = $25.00 (3/31/2016) to $28.99 (3/31/2021) * Dividends earned during the period = $1.20 = Dividends earned during the period = $5.64 v Total return = 28.6% v Total return = 38.5% Y Stock pri
Slide 30: Looking Ahead
- Looking Ahead
Slide 31: Looking Ahead
LOOKING AHEAD ¢ Managing Through the Pandemic ¢ Net Interest Margin Management ¢ Industry Consolidation * Operational Initiatives * Management Succession * Continued Need for Scale Emclaire Financial Corp
Slide 32: Strategic Elements for Success
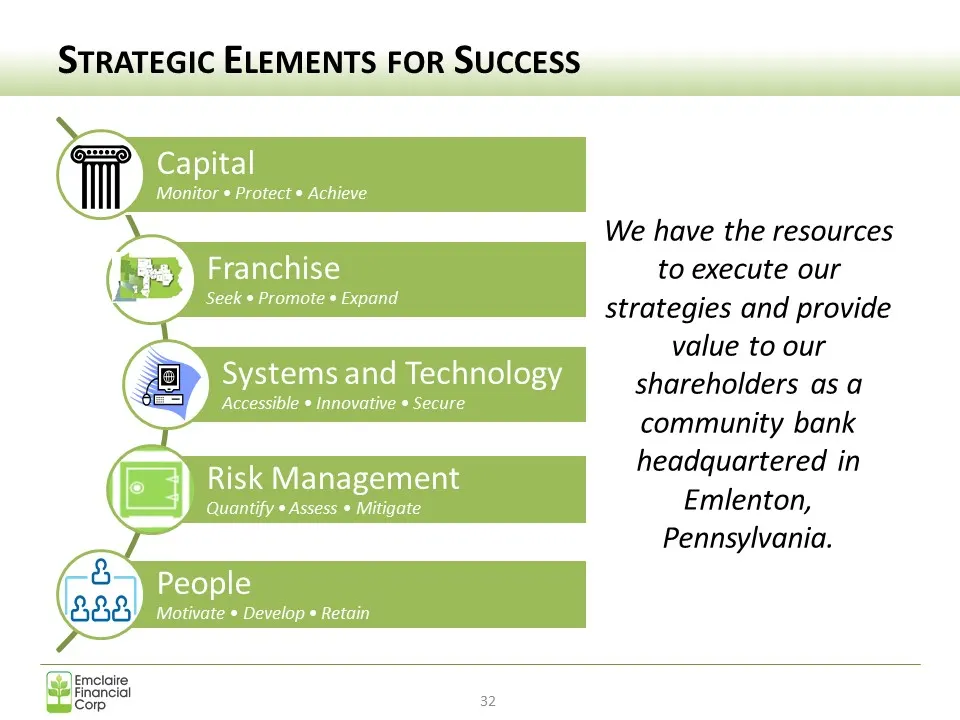
STRATEGIC ELEMENTS FOR SUCCESS Capital Monitor ¢ Protect ¢ Achieve We have the resources Franchise to execute our Seek ® Promote ¢ Expand strategies and provide value to our Systems and Technology shareholders as a Accessible * Innovative * Secure | community bank headquartered in Risk Management (Q
Slide 33: Q&A Session
Q&A SESSION Questions and Answers Emclaire Financial Corp 33

Slide 34: Special Thank You
SPECIAL THANK YOU We wish to express our sincere gratitude and appreciation to Robert L. Hunter who retired from our Board of Directors on December 31, 2020. Bob was a constant source of guidance, integrity and counsel during his 46 years of service. Emelaire Financial 7 Corp
Slide 35: 2021 Annual Meeting of Shareholders
2021 ANNUAL MEETING OF SHAREHOLDERS EMCLAIRE FINANCIAL CORP PARENT COMPANY OF: THE FARMERS NATIONAL BANK OF EMLENTON Presented by: William C. Marsh Chairman, President and Chief Executive Officer Emlenton, Pennsylvania * April 21,2021 Emclaire Financial Corp 35
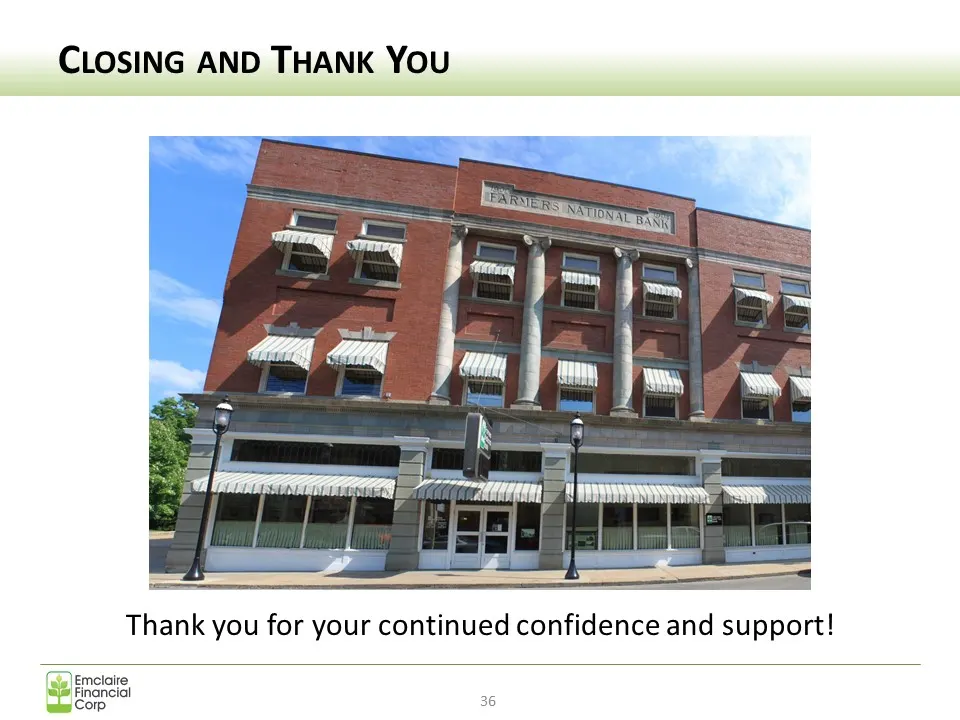
Slide 36: Closing and Thank You
CLOSING AND THANK YOU Thank you for your continued confidence and support! ,|Emelaire Financial a6 Corp 36
Source: SEC EDGAR · 8-K filed Apr 21, 2021
More decks from Emclaire Financial Corp
 Merger or Acquisition (March 2022)13 slides · Mar 24, 2022
 Shareholder Meeting (April 2020)32 slides · Apr 22, 2020
 Raymond James Emerging Bank Symposium (September 2019)23 slides · Sep 4, 2019
 Shareholder Meeting (April 2019)32 slides · Apr 24, 2019
 Shareholder Meeting (April 2018)28 slides · Apr 25, 2018
 Investor Presentation (December 2017)21 slides · Dec 6, 2017