Chittenden — Investor Presentation (January 2003)
28 slides from Chittenden's investor presentation, Jan 3, 2003
Slide 1: Chittenden Corporation
Chittnln CORPORATION As of September 30, 2002 (i Clilnun Qiusccem | BEFLASHPRIK Aunt ROLE TEST Qeoan, — Cihittenudbre
Slide 2: A Compelling Story
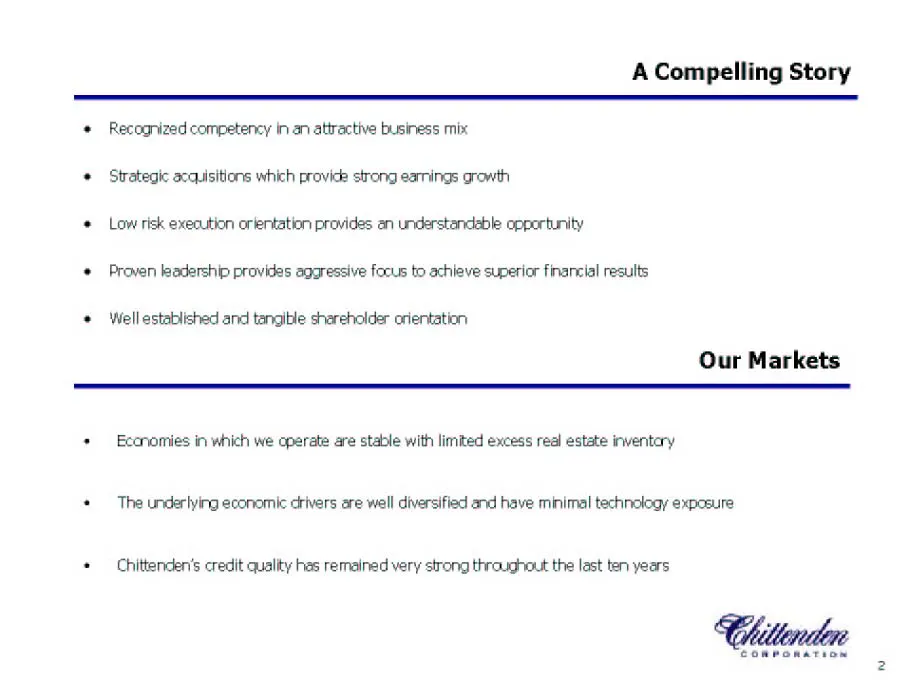
A Compelling Story * Recognized competency in an attractive business mix * Strategic acquisitions which provide strong earnings growth * Low risk execution orientation provides an understandable opportunity Proven leadership provides aggressive focus to achieve superior financial results * Well esta
Slide 3: Deposits by State
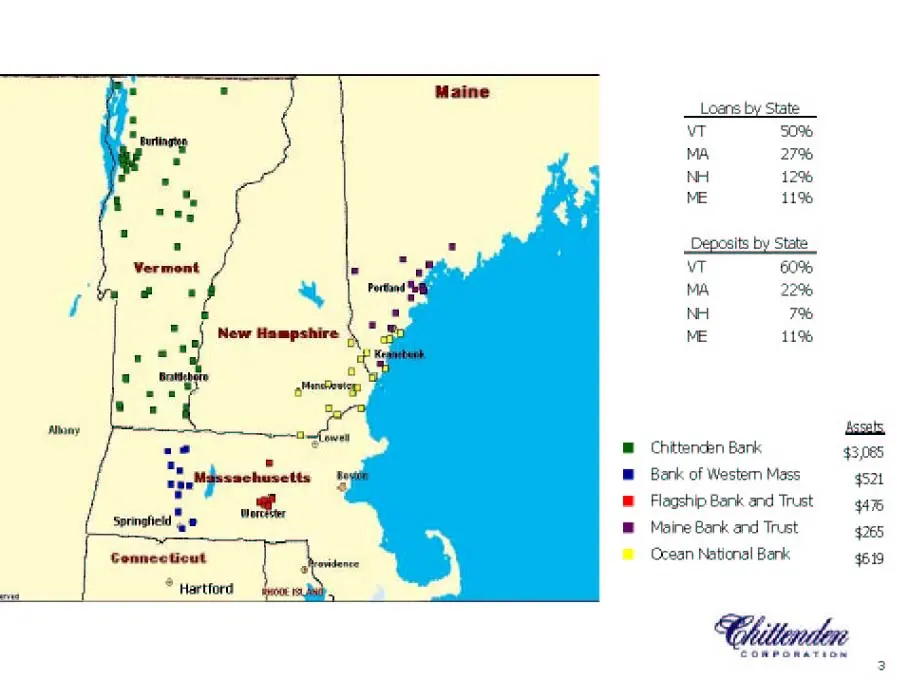
VT 50% MA 27% NH 12% ME 11% Deposits by State \T 60% MA 22% NH 7% ME 11% Chittenden Bank Bank of Western Mass Flagship Bank and Trust Maine Bank and Trust (Ccean National Bank com
Slide 4: Strategic Direction
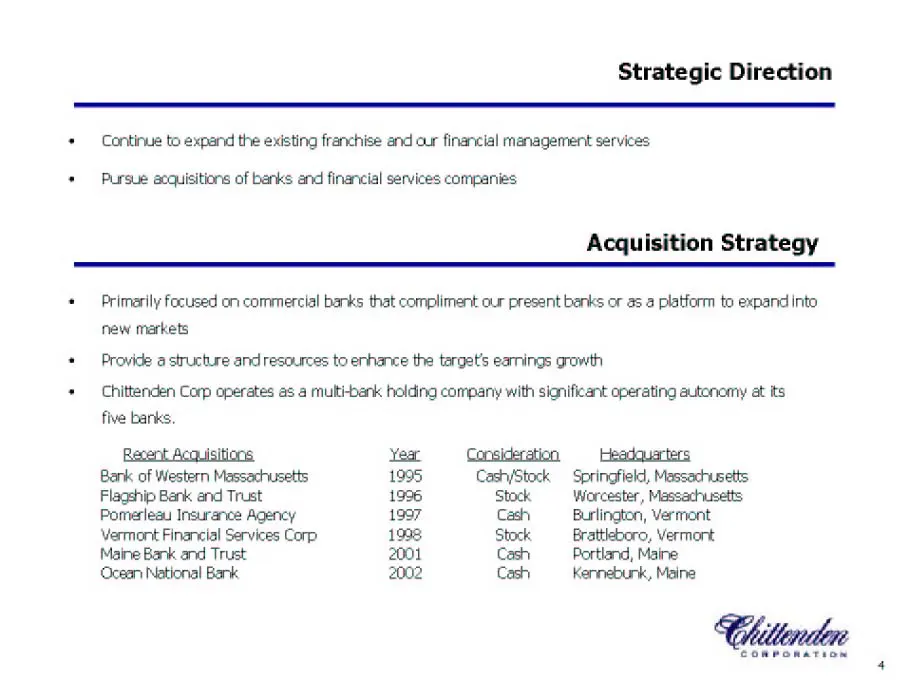
Strategic Direction * Continue to expand the existing franchise and our financial management services + Pursue acquisitions of banks and financial services companies Acquisition Strategy + Primerily Focused on commercial barks that compliment our present banks or a5 a platform to expand into new mar
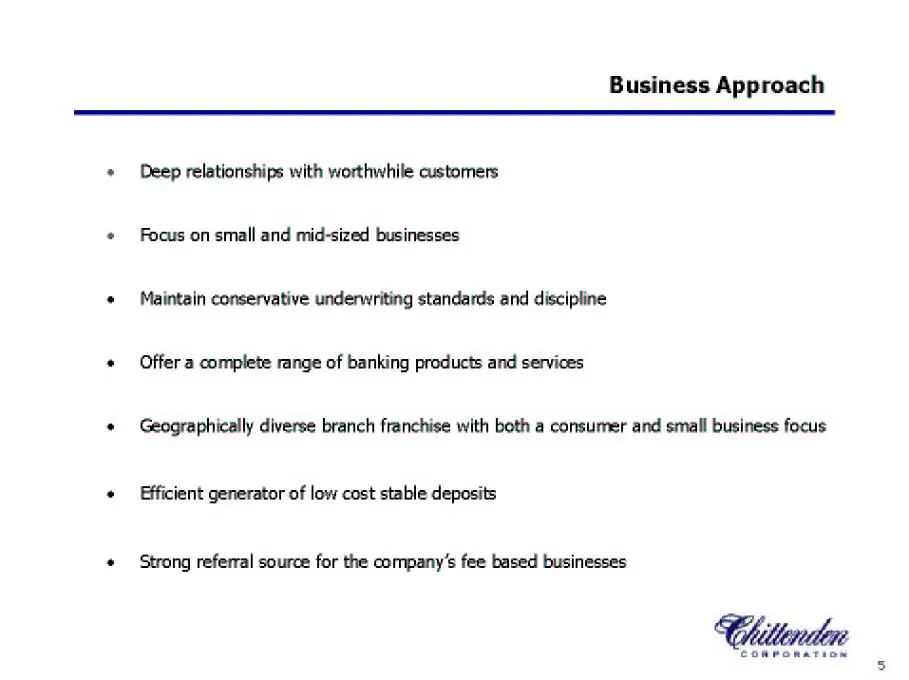
Slide 5: Business Approach
Business Approach Deep relationships with worthwhile customers Focus on small and mid-sized businesses Maintain conservative underwriting standards and discipline Offer a complete range of banking products and services Geographically diverse branch franchise with both a consumer and small business f
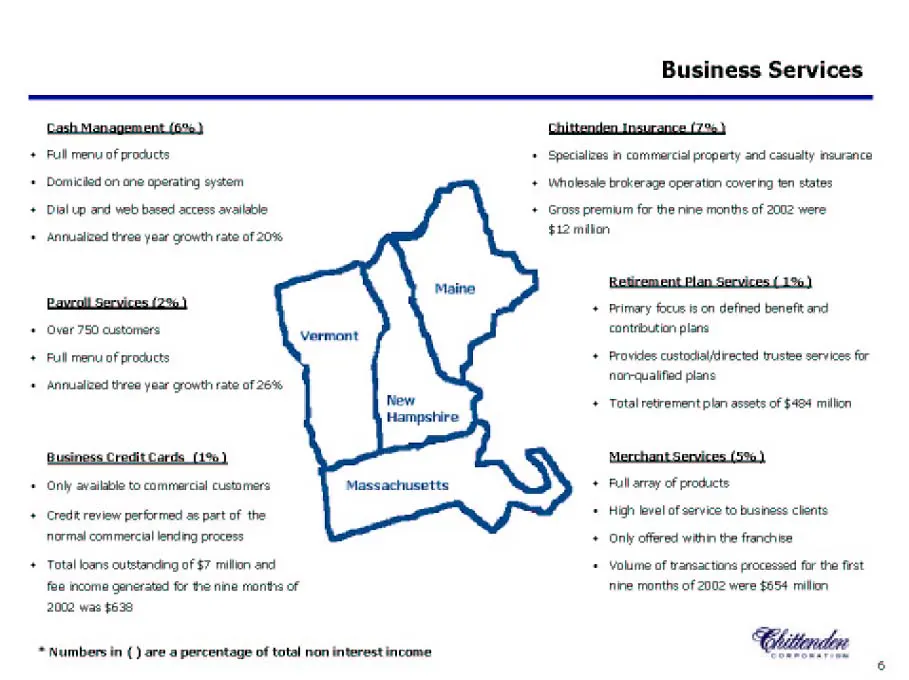
Slide 6: Business Services
Business Services Cash Menagement (6%) + Full menu of products © Domiciled on ane operating system + Dial up and web based access available + Annualized three year growth rate af 20% Pawcoll Services (2e0) + Over 750 customers + Full menu of products + Annualized three year growth rate of 26% Busine
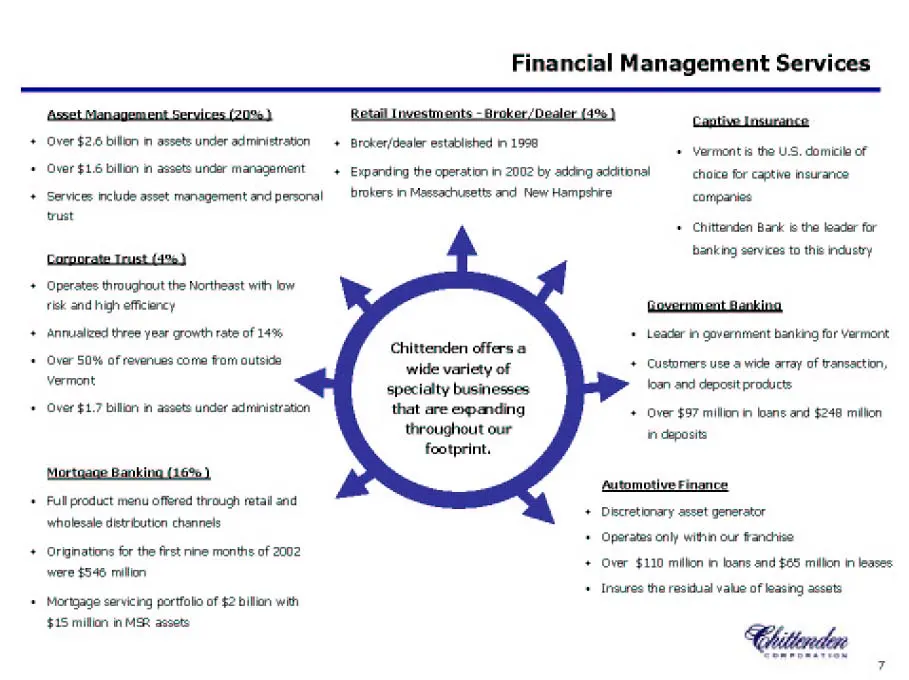
Slide 7: Financial Management Services
Financial Management Services éssetManagement Services(20%} == Retail Investments —A@roker/Dealer (498) tive tncurance Over $216 billon in assets under administration Over $1.6 billon in assets under management Services include asset management and personal trust (Comorate Trust (4%) ‘Operates throu
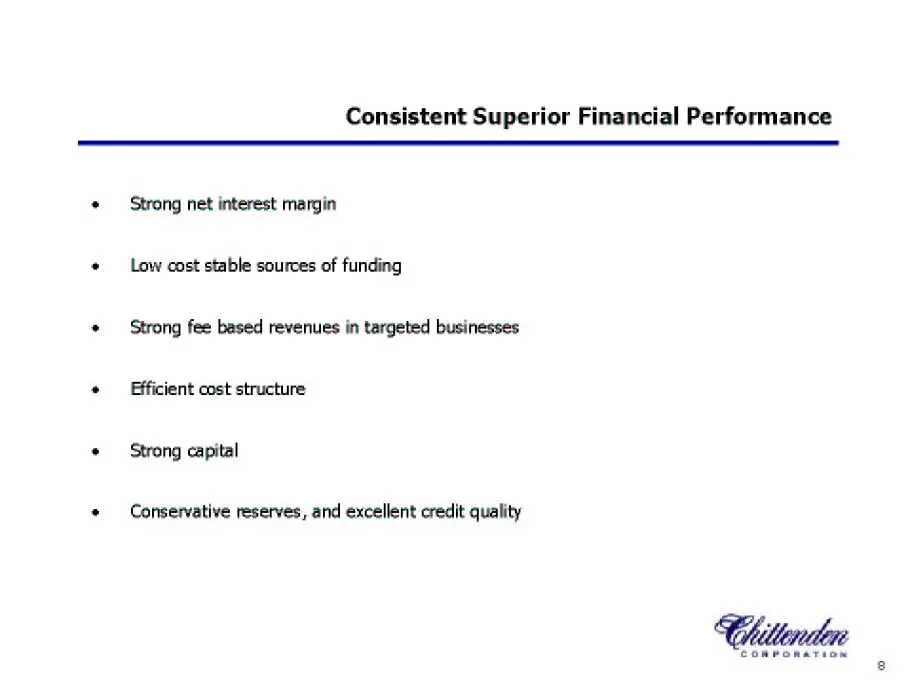
Slide 8: Consistent Superior Financial Performance
Consistent Superior Financial Performance Strong net interest margin Low cost stable sources of funding Strong fee based revenues in targeted businesses Efficient cost structure Strong capital Conservative reserves, and excellent credit quality
Slide 9: Strong Consistent Net Interest Margin
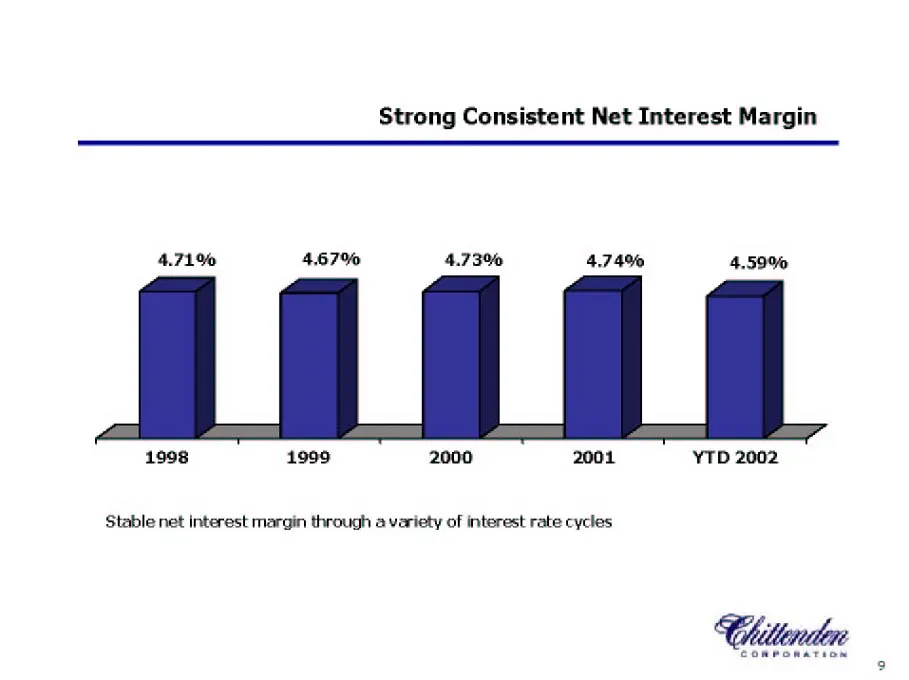
Strong Consistent Net Interest Margin 4.71% 467% 4.73% 4.74% 4.59% 1998 1999 2000 2001 YTD 2002 Stable net interest margin through a variety of interest rate cycles
Slide 10: A Diversified Loan Portfolio
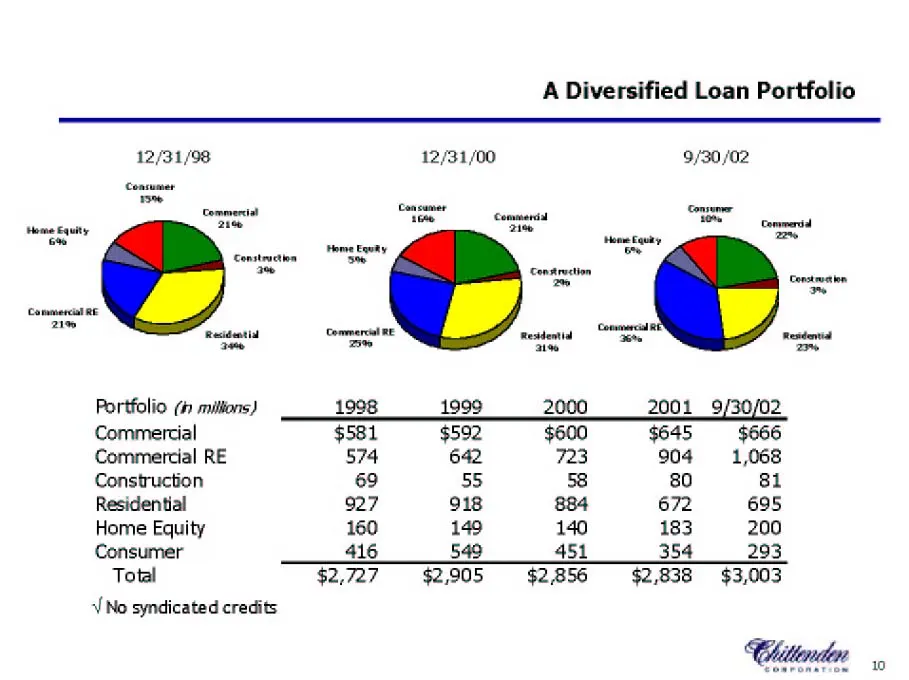
A Diversified Loan Portfolio 12/31/98 12/31/00 9/30/02 Cena . Commertst Commend rd 7 pis = — ae _ Semmes i eer ~—_ - conaraton on = a Residential bead Residential Renda oo eed oe Portfolio (i millions) 1998 1999 2000 2001 9/30/02 Commercial $581 $592 $600 $645 $666 Commercial RE 574 642 723 904 1,06
Slide 11: Strong Core Funding
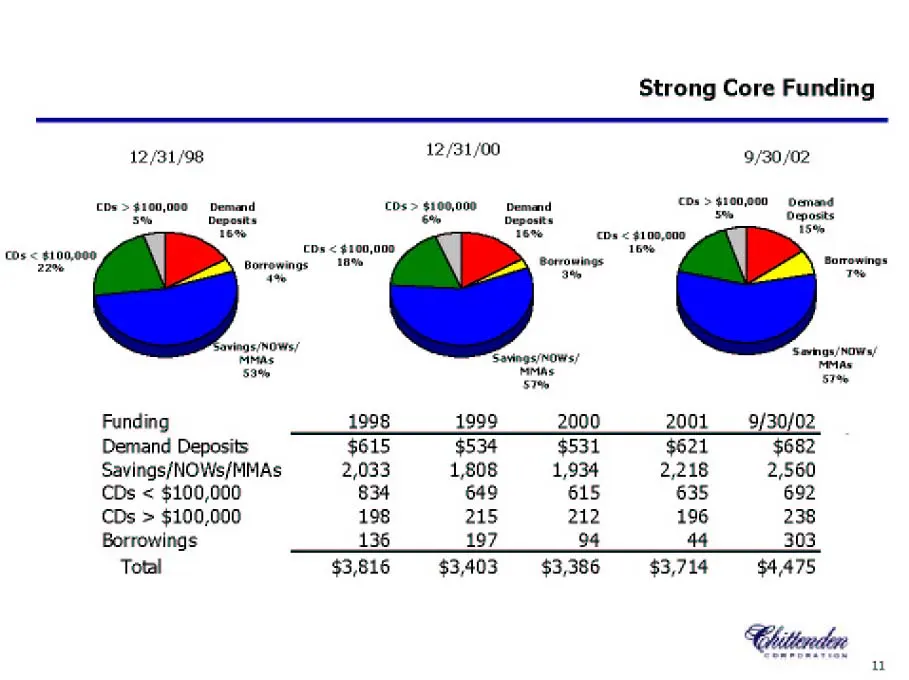
Strong Core Funding 12/31/98 12/31/00 9/30/02 CDs zeta 000 = PEs Shen nce = o> — Saues 16% 16% CDs < $100,000 ad coe anoee ar ee sono vngeyNOWs/ ——_ semgy naw Soe8 tars vr Funding 1998 1999 2000 2001 9/30/02 Demand Deposits $615 $534 $531 $621 $682 Savings/NOWs/MMAs 2,033 1,808 1,934 2,218 2,560 CDs
Slide 12: A Strong Diversified Stream of Noninterest Income
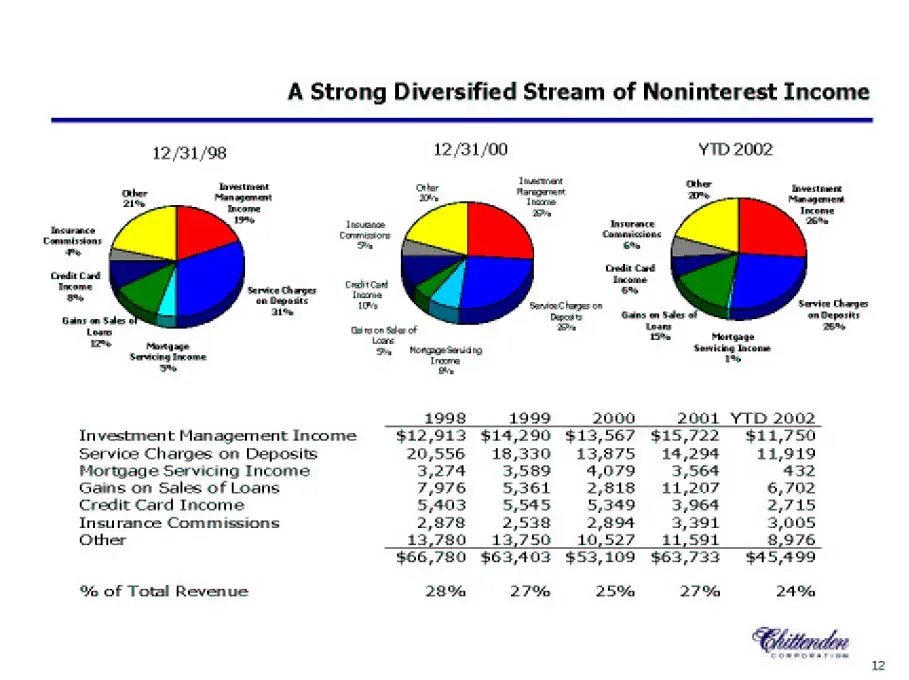
A Strong Diversified Stream of Noninterest Income 12/31/98 12/31/00 YTD 2002 a Investment Other ober Inwestomeet Ober = a ca om = os Acne 1986 Tecucnae = tnrvrance 2 wut Corenizctone Comncsoes. coats re = Cs non =— Tome Creo “~ ian 1% ‘Service hagas on ‘Service Charges Gin m $d Bee” Gans er nepenn i
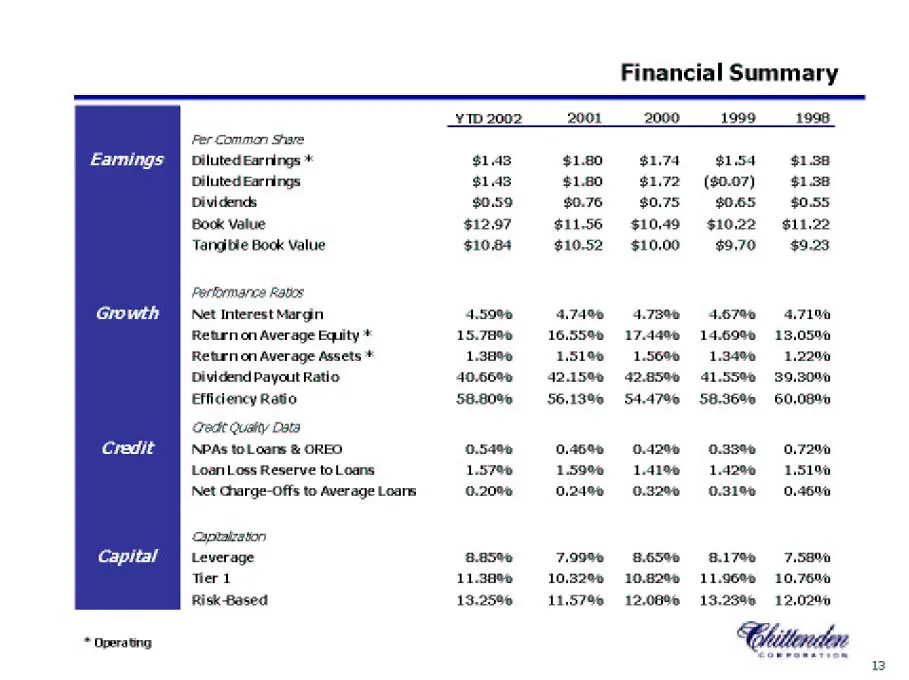
Slide 13: Financial Summary: Per Common Share
Per Common Share Diluted Earrings * Diluted Earrings Dividends Book Value Tangible Book Value Perloomance Raties Net Interest Margin Return on Average Equity * Return on Average Assets * Dividend Payout Ratio Efficiency Ratio edt Qualty Data NPAs toLoans & OREO Loan Loss Reserve to Loans Net Gharge-
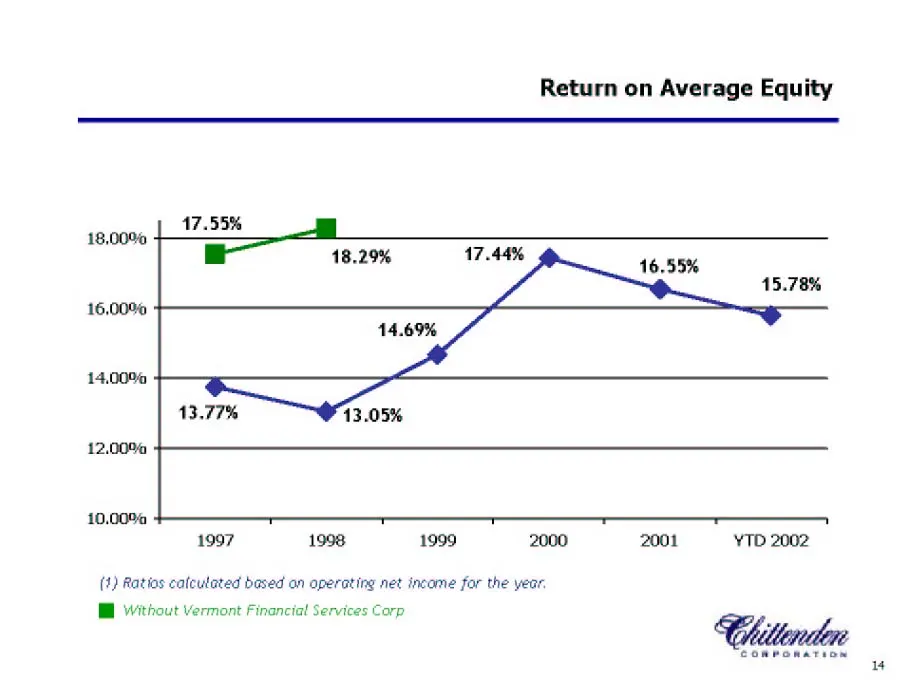
Slide 14: Return on Average Equity
Return on Average Equity 18,00% 16,00% 14.00% 12.00% 10.00% 1997 1998 1999 2000 2001 YTD 2002 (3) Ratios catcuteted based an aperating net income for the year, WB Without vermont Financial Services Corp CONPORATION
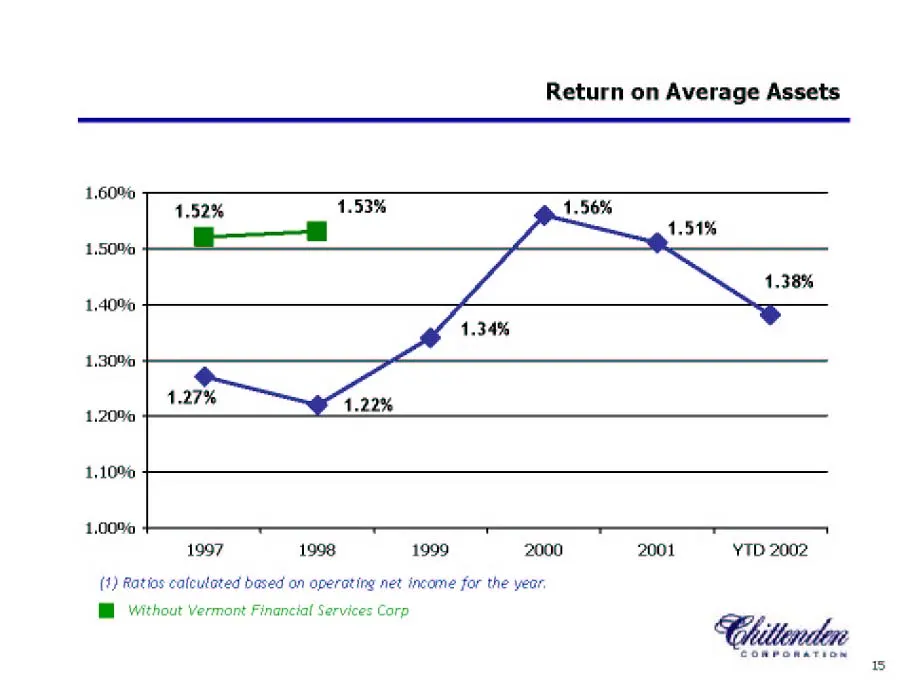
Slide 15: Return on Average Assets
1,60% 1.50% 1.40% 1.30% 1.20% 1,10% 1.00% Return on Average Assets 1997 1998 1999 2000 2001 YTD 2002 (1) Ratios calculated based an operating net income for the year. WH Without Vermont Financial Services Corp 5
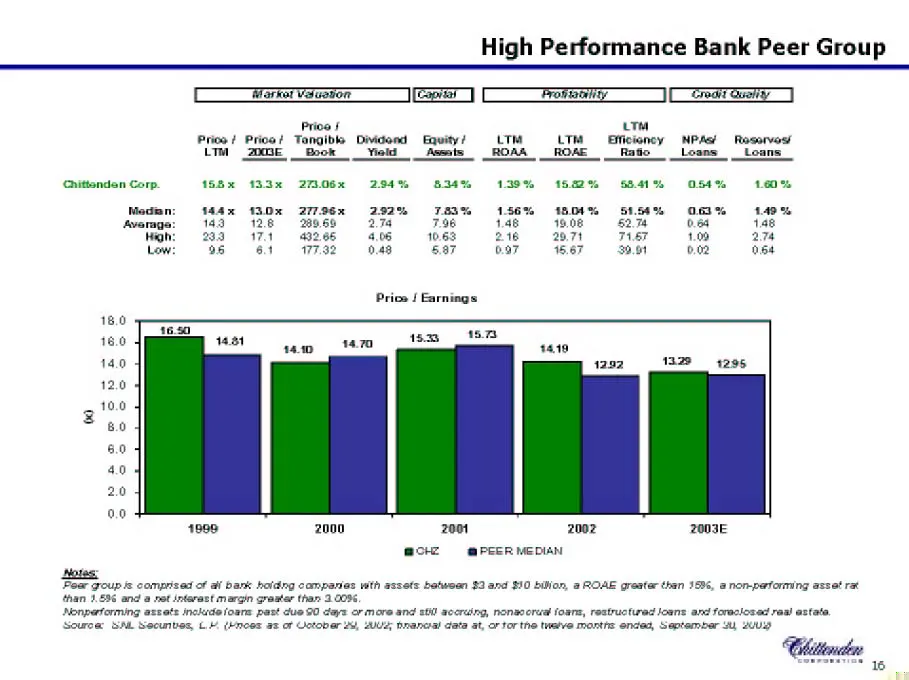
Slide 16: High Performance Bank Peer Group
High Performance Bank Peer Group if War Ket VIGSIOn ler [ Fromnany | area cary Prive f um Prioa / Prico/ Tangible Dividosd Equity LT LT Efficioney NPAsy Rosorvass LIM ODE Book Yioks__Awsnis_ ROAR ROAE Ratio _Loans___ Loans 15x 133" 2706x 294% 834% 159% 18—% SEH OSt% Loot 44x 13Dx 27796x (292% 7A3% 1
Slide 17: A Compelling Story
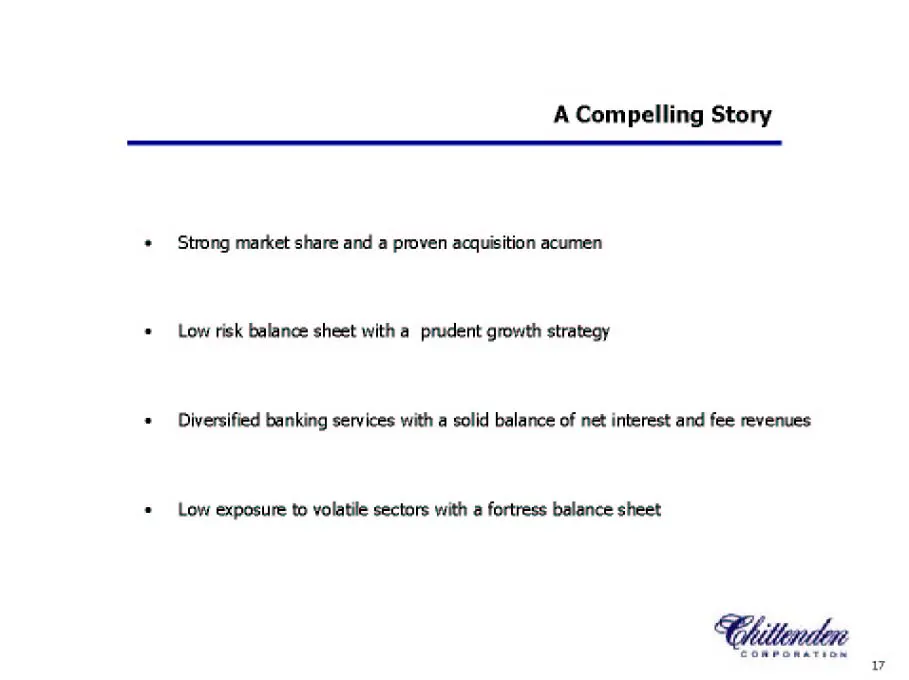
A Compelling Story Strong market share and a proven acquisition acumen Low risk balance sheet with a prudent growth strategy Diversified banking services with a solid balance of net interest and fee revenues Low exposure to volatile sectors with a fortress balance sheet CONPORATION v
Slide 18: Acquisition of Granite State Bankshares
CORPORATION Acquisition of GRANITE STATE BANKSHARES (MP The Power of Local Banking November 8, 2002 TERN isTRNUARORSTS EEFLAGHIP BANK MANE TAL
Slide 19: Summary of Significant Terms
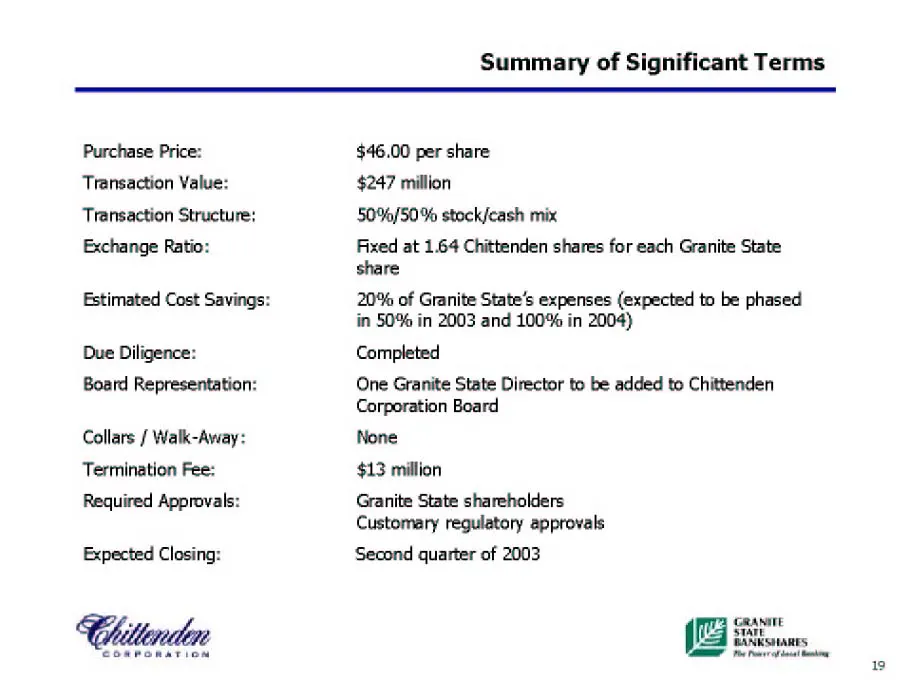
Purchase Price: Transaction Value: Transaction Structure; Exchange Ratio: Estimated Cost Savings: Due Diligence: Board Representation: Collars / Walk-Away: Termination Fee: Required Approvals: Expected Closing: Summary of Significant Terms $46.00 per share $247 million 50%/50% stock/cash mix Fixed a
Slide 20: Snapshot of Granite State
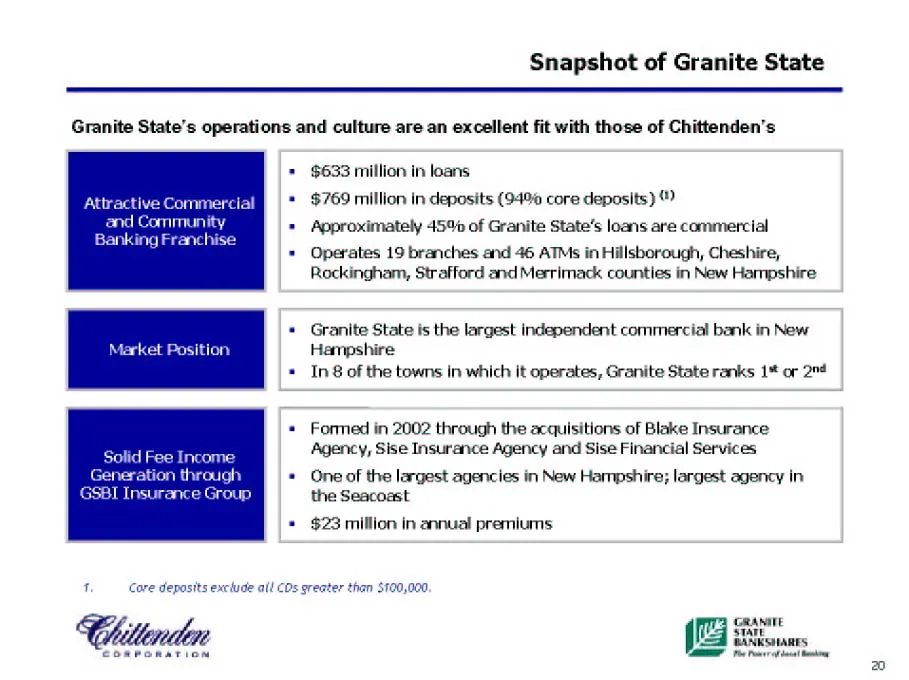
Snapshot of Granite State Granite State’s operations and culture are an excellent fit with those of Chittenden’s 1, Commercial mimunity Franchise $633 million in loans $769 million in deposits (94% core deposits) Approximately 45% of Granite State's loans are commercial Operates 19 branches and 46 A
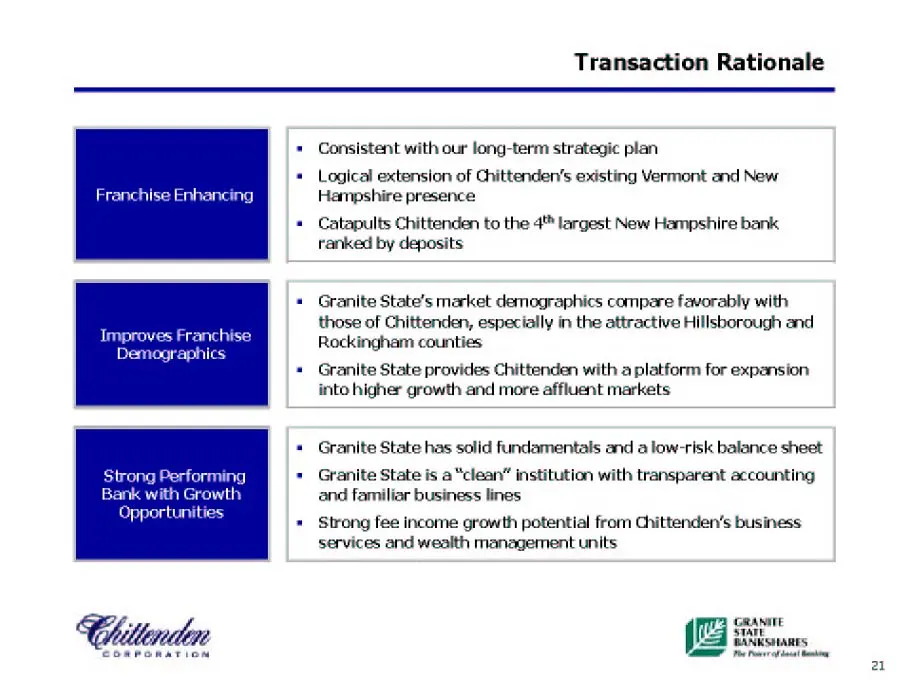
Slide 21: Franchise Enhancing
Franchise Enhancing Bank wit OF COmPORATION Transaction Rationale Consistent with our long-term strategic plan Logical extension of Chittenden’s existing Vermont and New Hampshire presence Catapults Chittenden to the 4" largest New Hampshire bank ranked by deposits Granite State's market demographic
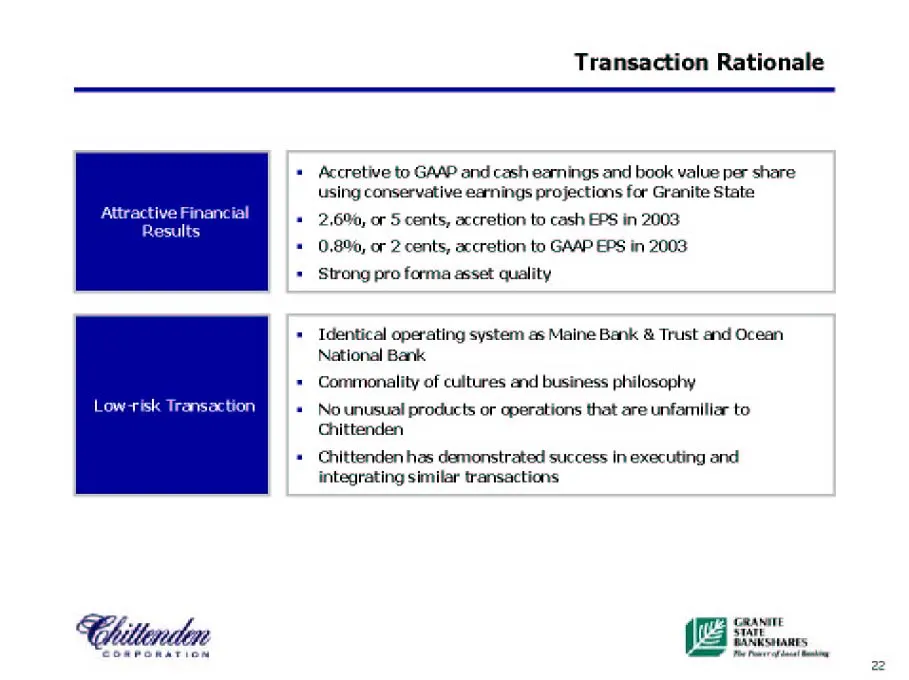
Slide 22: Attractive Financial Results, Low-risk Transaction
Attractive Financial Results Low-risk Transaction Chittenden COmPORATION Transaction Rationale Accretive to GAAP and cash earings and book value per share: using conservative earnings projections for Granite State 2.6%, or 5 cents, accretion to cash EPS in 2003 0.8%, or 2 cents, accretion to GAAP EP
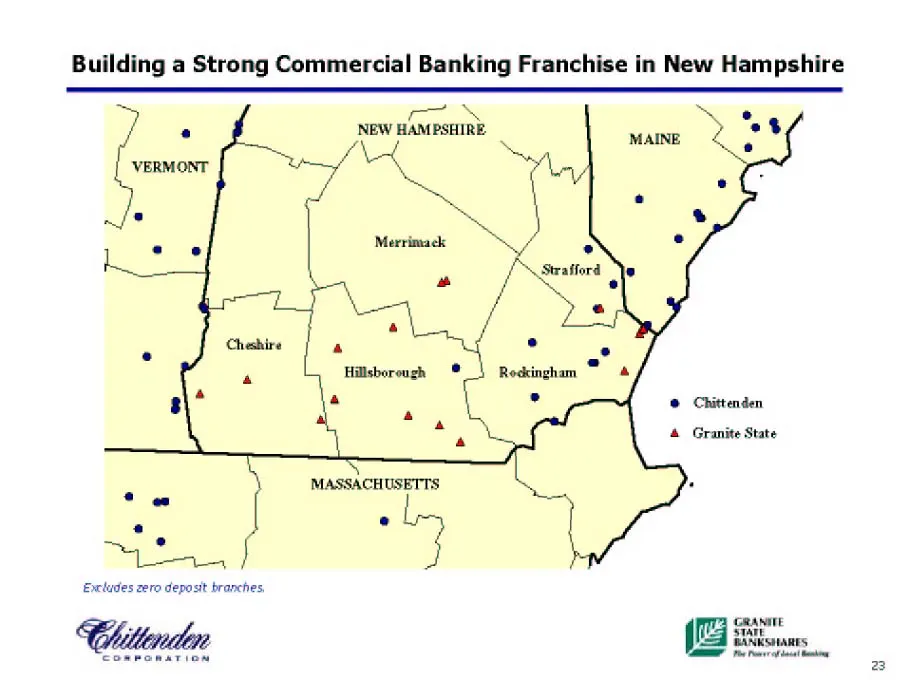
Slide 23: Building a Strong Commercial Banking Franchise in New Hampshire
Building a Strong Commercial Banking Franchise in New Hampshire or (ESS NEW HAMPSHIRE © Chittenden 4 Granite State Chiterndn (fT Poe Peo i eng 23
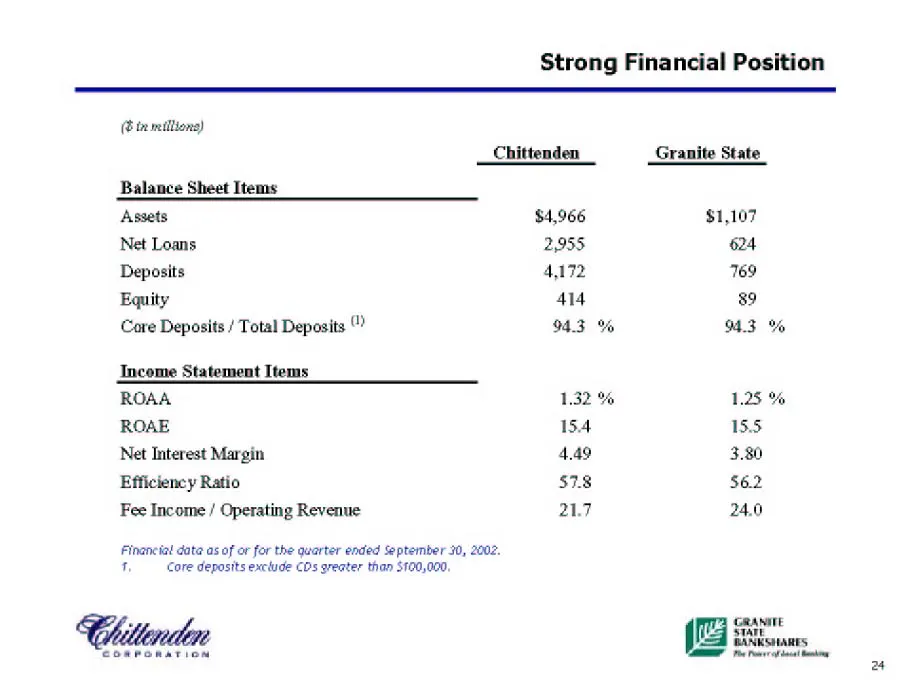
Slide 24: Strong Financial Position
(Bin millions) Balance Sheet Items Assets Net Loans Deposits Equity Core Deposits / Total Deposits Income Statement Items ROAA ROAE Net Interest Margin Efficiency Ratio Fee Income / Operating Revenue Financ iat date as of or for the quarter ended September 30, 2002, 1, Core deposits exctude COs grea
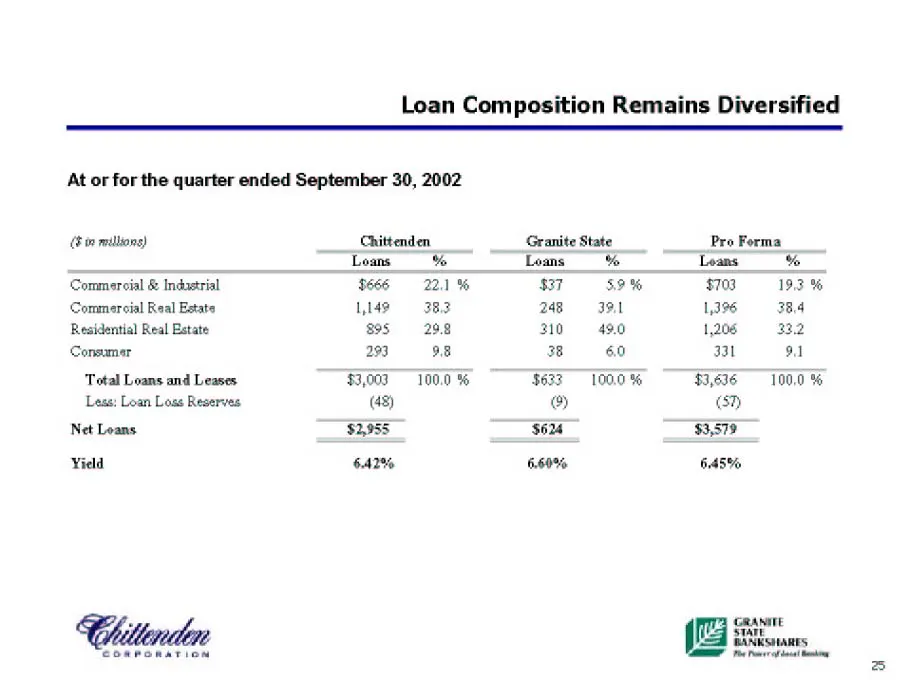
Slide 25: Loan Composition Remains Diversified
Loan Composition Remains Diversified At or for the quarter ended September 30, 2002 (8m millions) Chittenden ___ Granite State — Leans Loans % ‘Commercial & Industrial $666 221% 87 59% $103 «19.3 % Commercial Real Estate 1,149 383 248 31 1,396 384 Residential Real Estate 89S 29.8 310 49.0 1,206 332
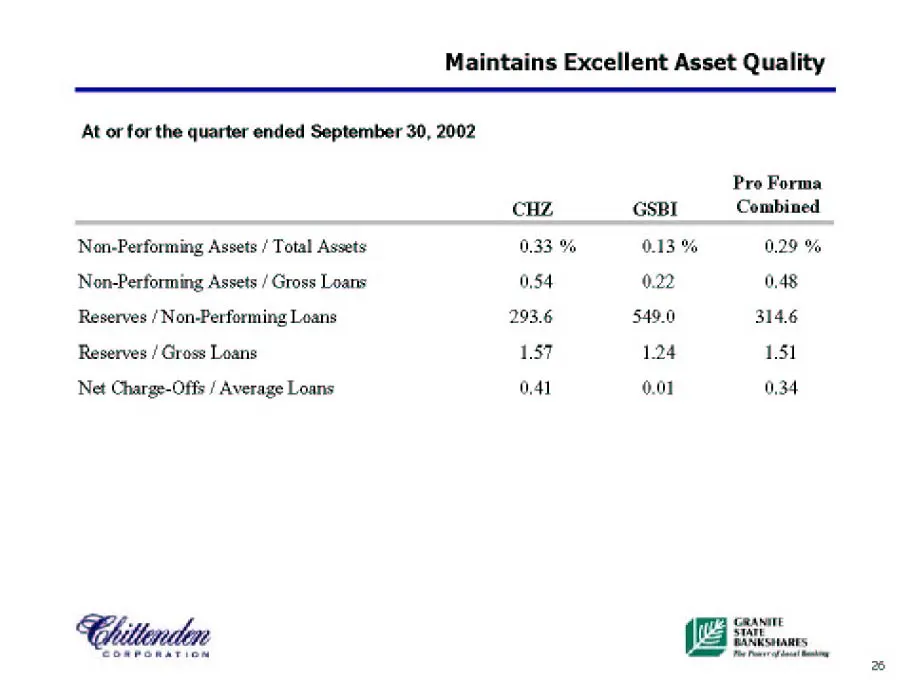
Slide 26: Maintains Excellent Asset Quality
Maintains Excellent Asset Quality At or for the quarter ended September 30, 2002 Pro Forma CHZ GSBI Combined Non-Performing Assets / Total Assets 0.33 % 0.13 % 0.29 % Non-Performing Assets / Gross Loans 0,54 0.22 0.48 Reserves / Non-Performing Loans 293.6 549.0 314.6 Reserves / Gross Loans 1.57 1.24
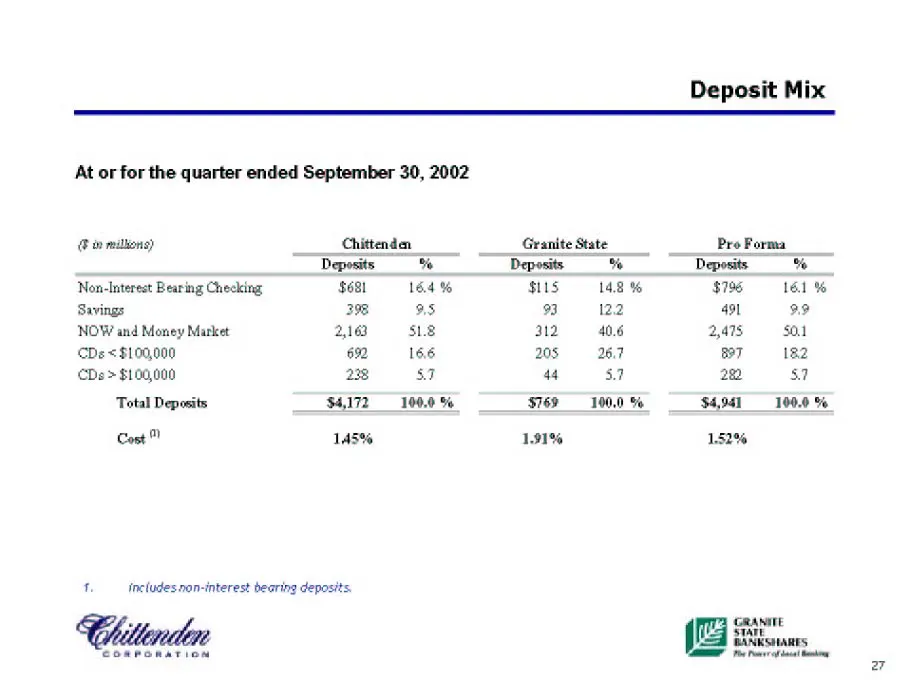
Slide 27: Deposit Mix
At or for the quarter ended September 30, 2002 Deposit Mix @ im medlions) Chittenden Granite State Pro Forma Deposits % Deposits % Deposits % Non-Interest Bearing Checking $61 16.4 % SUIS 14.8 % $796 16.1 % Savings 398 BS 93 122 491 99 NOW and Money Market 218 © S18 312 40.6 2,475 SOA CDs < $100,000
Slide 28: Visit our website
CORPORATION Visit our website fora wide range of products, latest financial reports and many other interactive services: www.chittendencorp.com This presentation contains “forward-looking statements" which may describe future plans and strategic initiatives. These forward ooking statements are based
Source: SEC EDGAR · 8-K filed Jan 3, 2003
More decks from Chittenden Corp
 Investor Presentation (September 2007)38 slides · Sep 7, 2007
 Merger or Acquisition (June 2007)27 slides · Jun 27, 2007
 Chittenden — Merger or Acquisition (June 2007)25 slides · Jun 27, 2007
 Merger or Acquisition (June 2007)9 slides · Jun 5, 2007
 Investor Presentation (May 2007)36 slides · May 14, 2007
 Investor Presentation (February 2007)37 slides · Feb 16, 2007