Novelis — Q1 FY2008 Earnings Presentation
28 slides from Novelis's earnings presentation, Aug 10, 2007
Slide 1: Novelis Q1 2008 Results
Novelis Q1 2008 Results Mumbai, India August 10, 2007
Slide 2: Cautionary Statement
Cautionary Statement Statements made in this presentation which describe Novelis’ intentions, expectations, beliefs or predictions may be forward-looking statements within the meaning of securities laws. Examples of forward-looking statements in this news release include those related to the integra
Slide 3: Strategic Rationale & Synergy
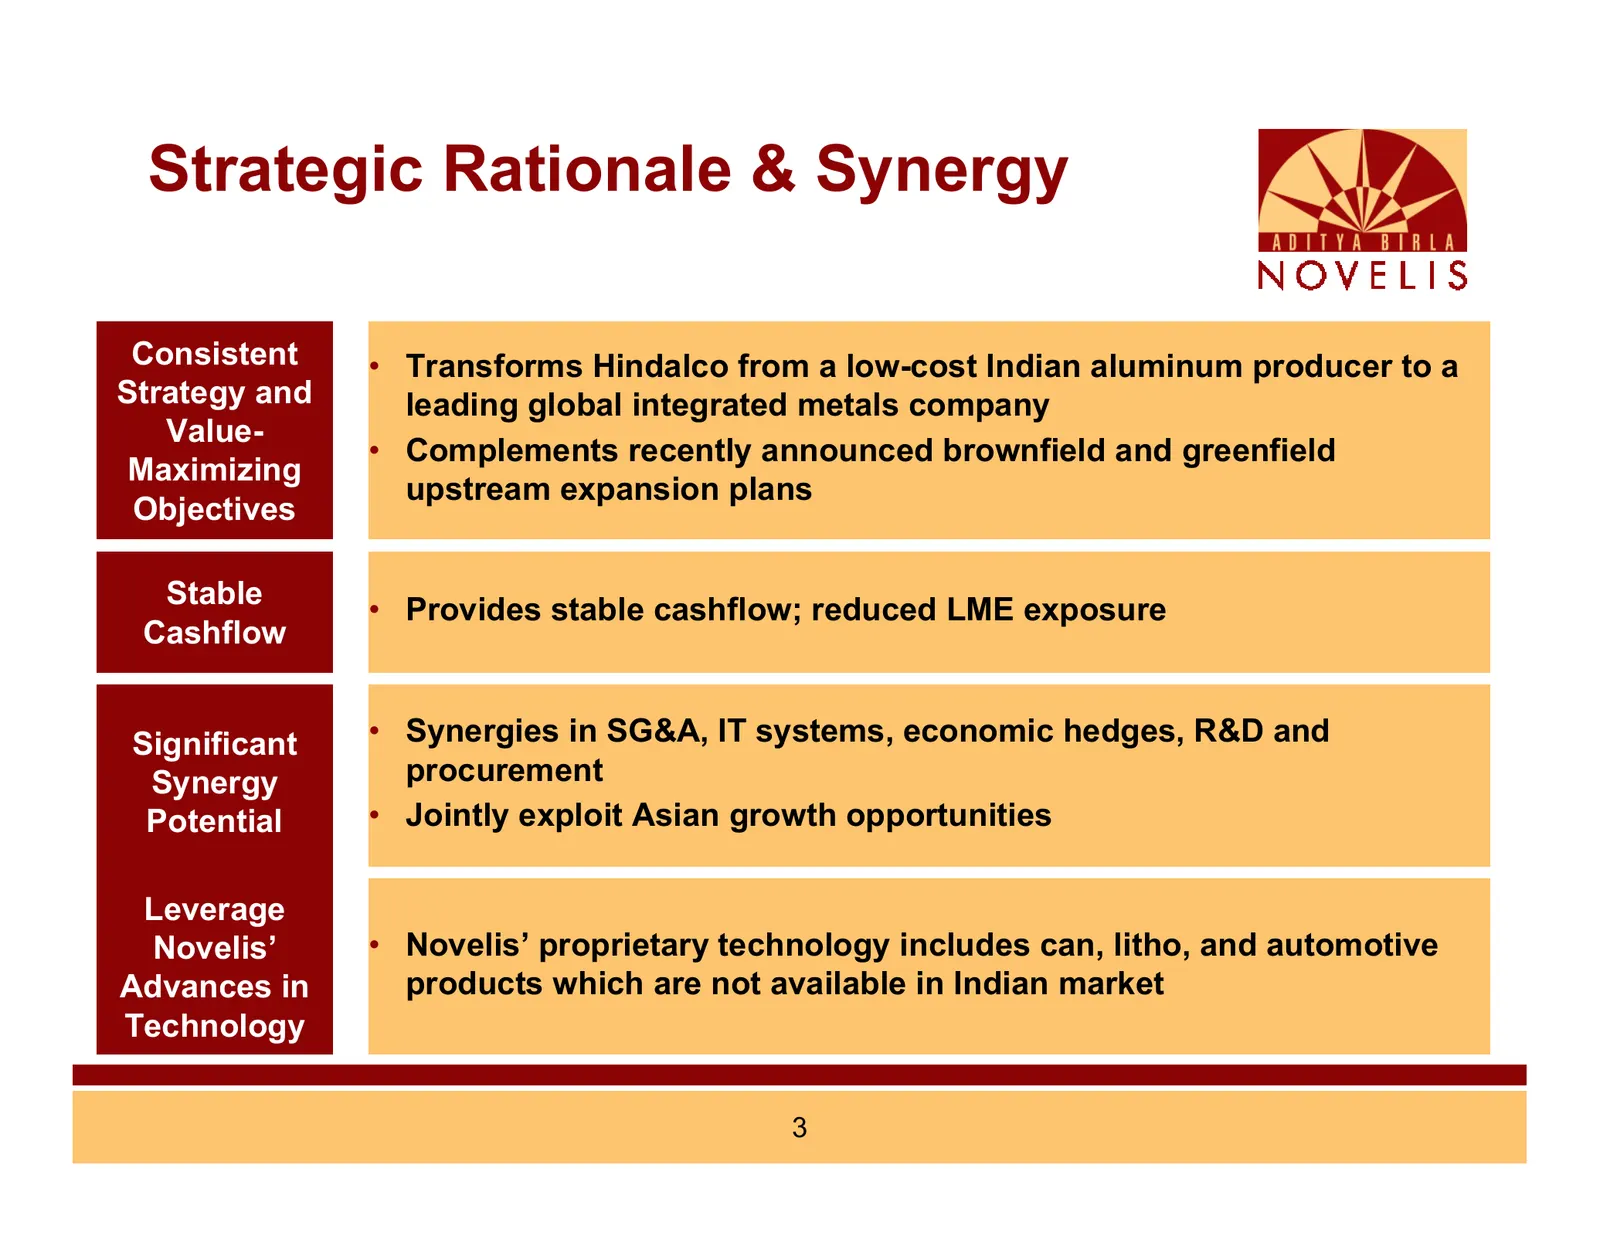
Strategic Rationale & Synergy Consistent • Transforms Hindalco from a low-cost Indian aluminum producer to a Strategy and leading global integrated metals company Value- • Complements recently announced brownfield and greenfield Maximizing upstream expansion plans Objectives Stable • Provides stable
Slide 4: Global Leader in Rolled Aluminum
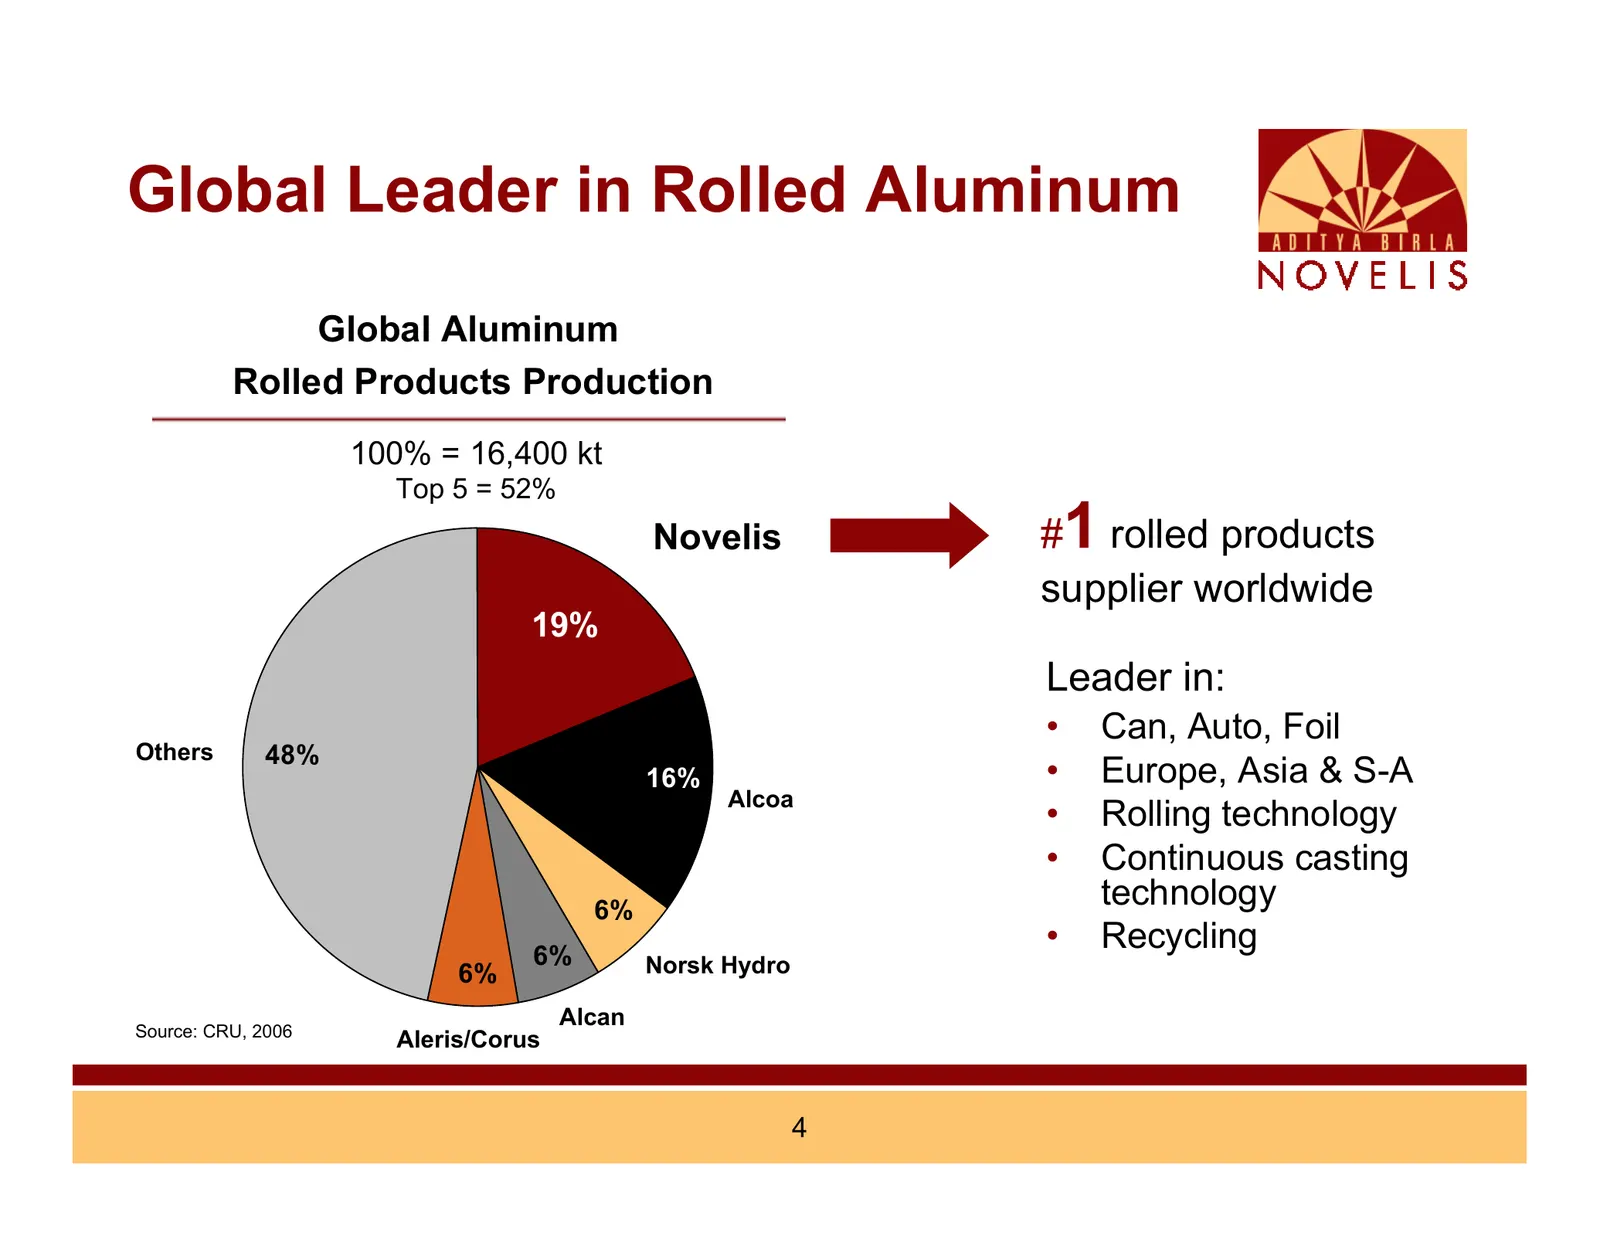
Global Leader in Rolled Aluminum Global Aluminum Rolled Products Production 100% = 16,400 kt Top 5 = 52% Novelis 1 # rolled products supplier worldwide 19% Leader in: • Can, Auto, Foil Others 48% 16% • Europe, Asia & S-A Alcoa • Rolling technology • Continuous casting 6% technology 6% • Recycling 6%
Slide 5: Novelis' Global Presence
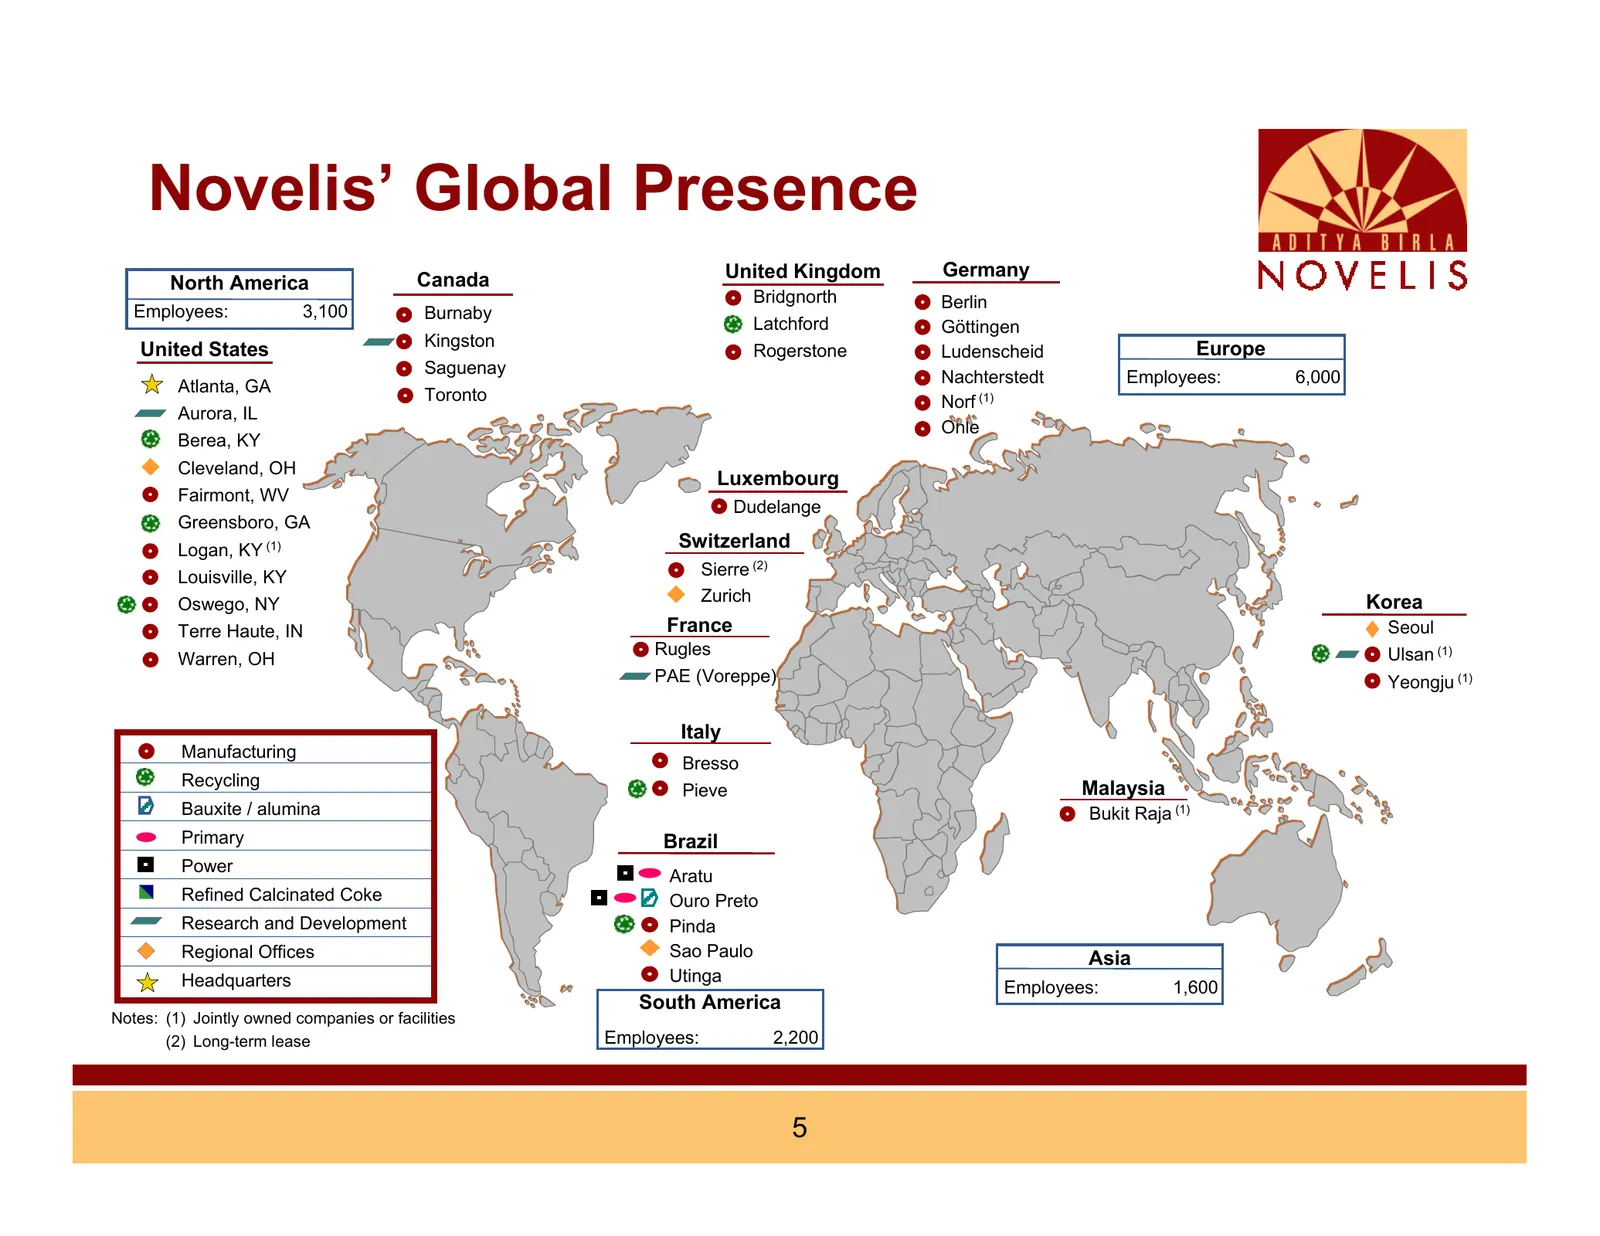
Novelis’ Global Presence United Kingdom Germany North America Canada Bridgnorth Berlin Employees: 3,100 Burnaby Latchford Göttingen Kingston Europe United States Rogerstone Ludenscheid Saguenay Nachterstedt Employees: 6,000 Atlanta, GA Toronto Norf (1) Aurora, IL Ohle Berea, KY Cleveland, OH Luxembo
Slide 6: Novelis Management Team
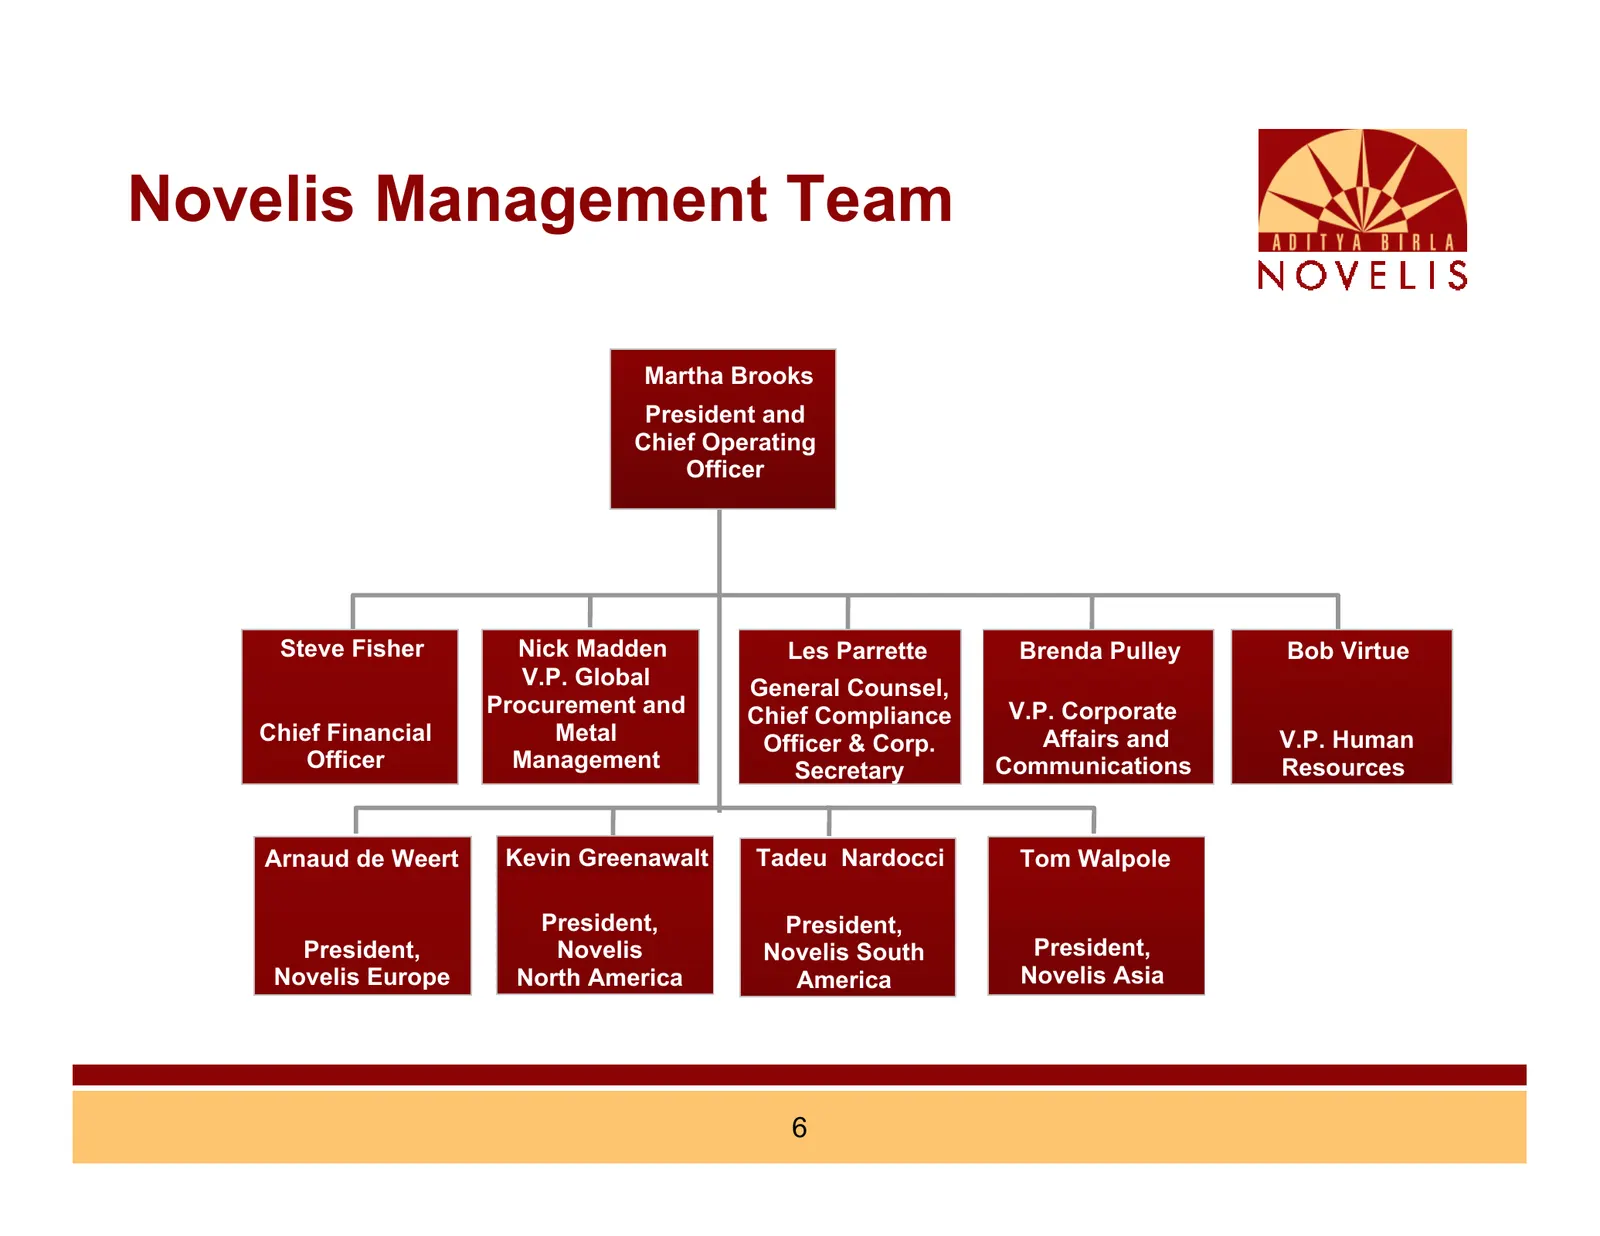
Novelis Management Team D. Bhattachary Martha Brooks President and Chief Operating Officer Steve Fisher Nick Madden Les Parrette Brenda Pulley Bob Virtue V.P. Global General Counsel, Procurement and Chief Compliance V.P. Corporate Chief Financial Metal Officer & Corp. Affairs and V.P. Human Officer
Slide 7: High-end Product Portfolio
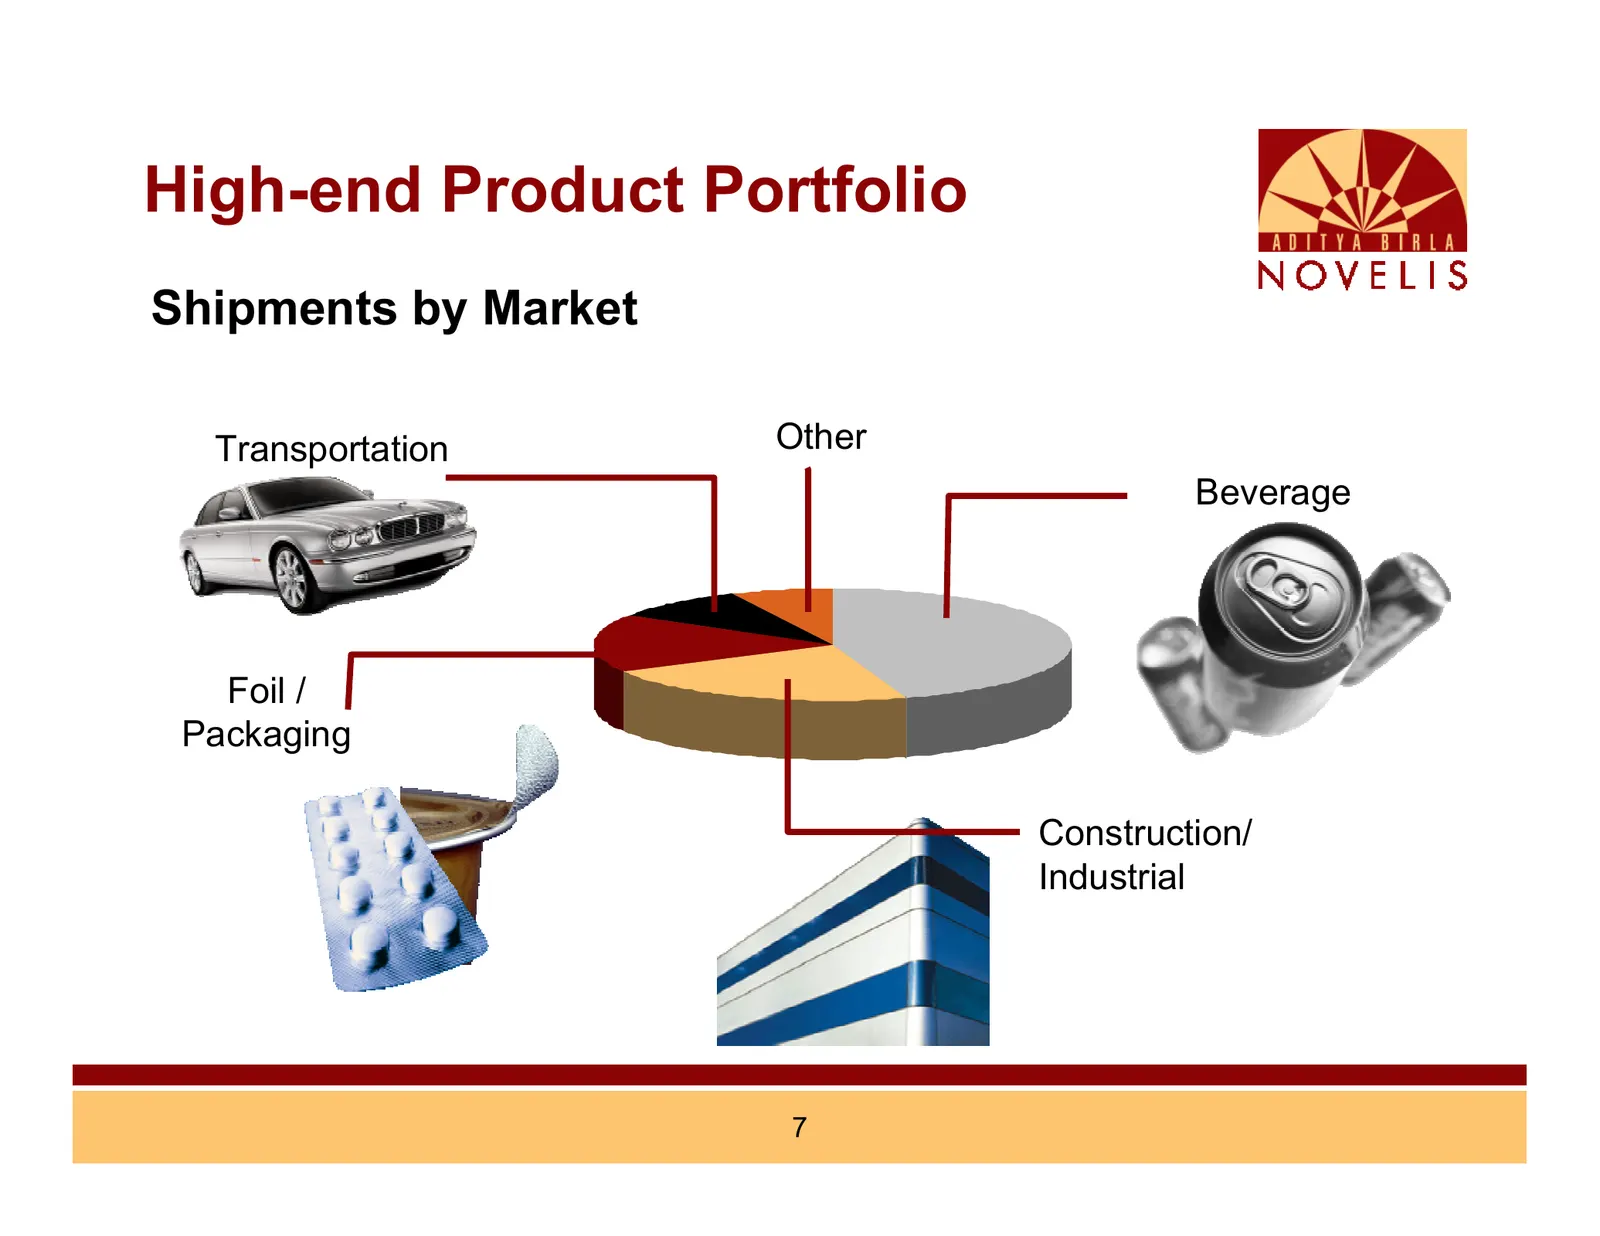
High-end Product Portfolio Shipments by Market Transportation Other Beverage Foil / Packaging Construction/ Industrial 7
Slide 8: Novelis Supplies World Leaders
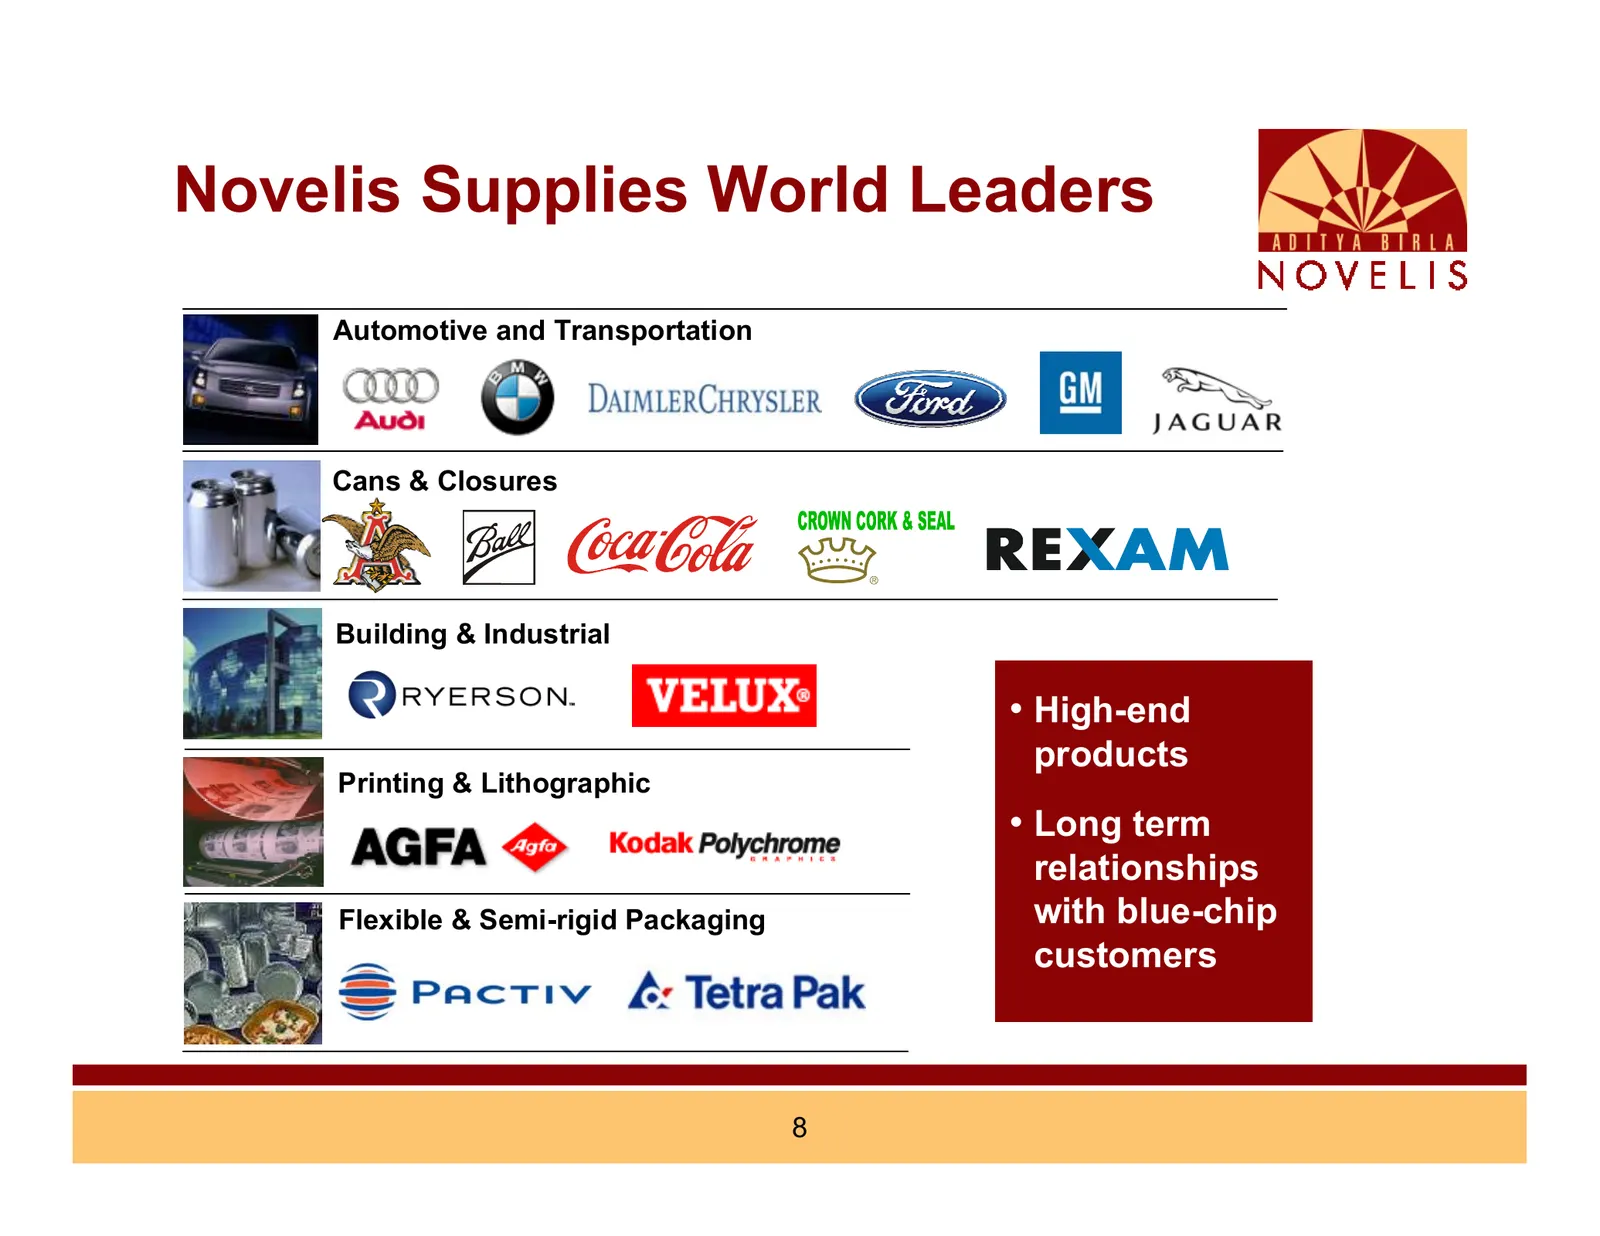
Novelis Supplies World Leaders Automotive and Transportation Cans & Closures Building & Industrial • High-end products Printing & Lithographic • Long term relationships Flexible & Semi-rigid Packaging with blue-chip customers 8
Slide 9: Attractive Industry Fundamentals
Attractive Industry Fundamentals • Significant barriers to entry exist in the aluminum rolled products industry – large capital cost – long lead times to install cost competitive plants – technological requirements; premium on “know how” – customer qualifications demand • Rising service, quality and
Slide 10: Novelis Regional Overview
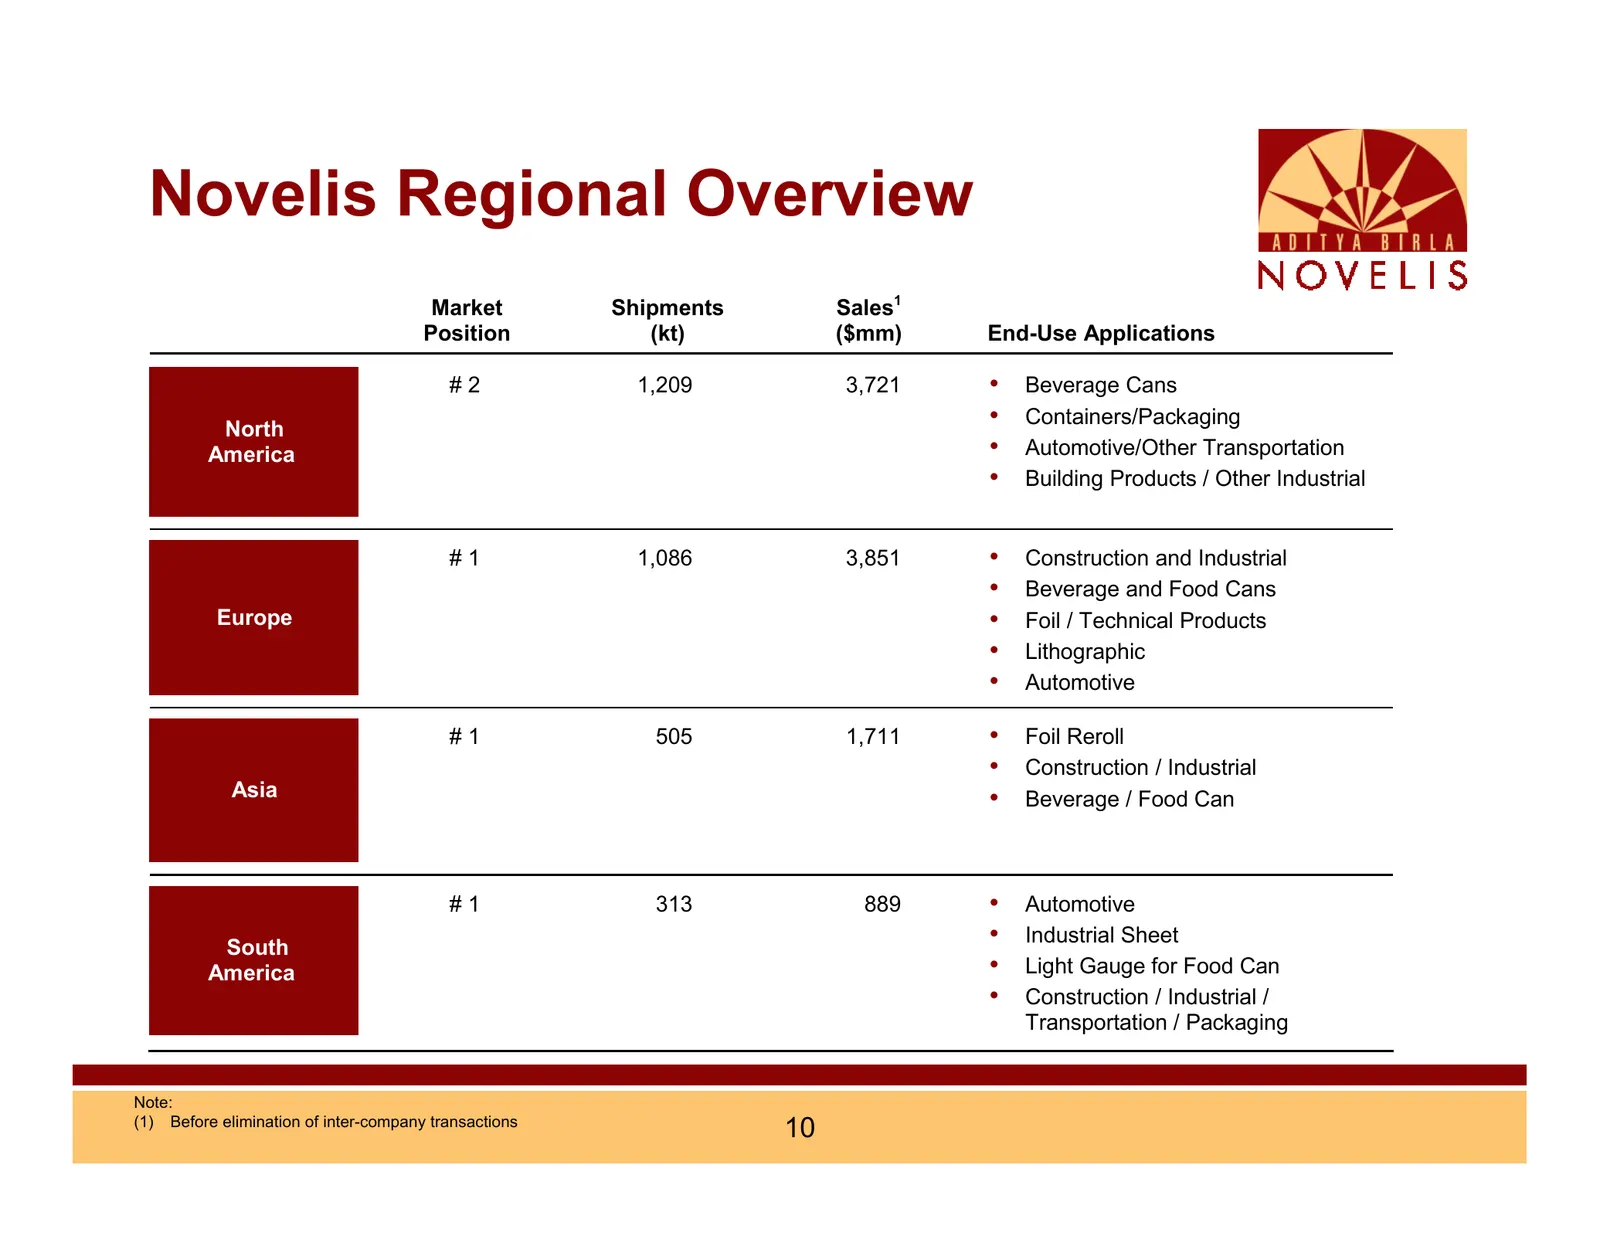
Novelis Regional Overview Market Shipments Sales1 Position (kt) ($mm) End-Use Applications #2 1,209 3,721 • Beverage Cans North • Containers/Packaging America • Automotive/Other Transportation • Building Products / Other Industrial #1 1,086 3,851 • Construction and Industrial • Beverage and Food Can
Slide 11: A Balanced Portfolio and Market Position
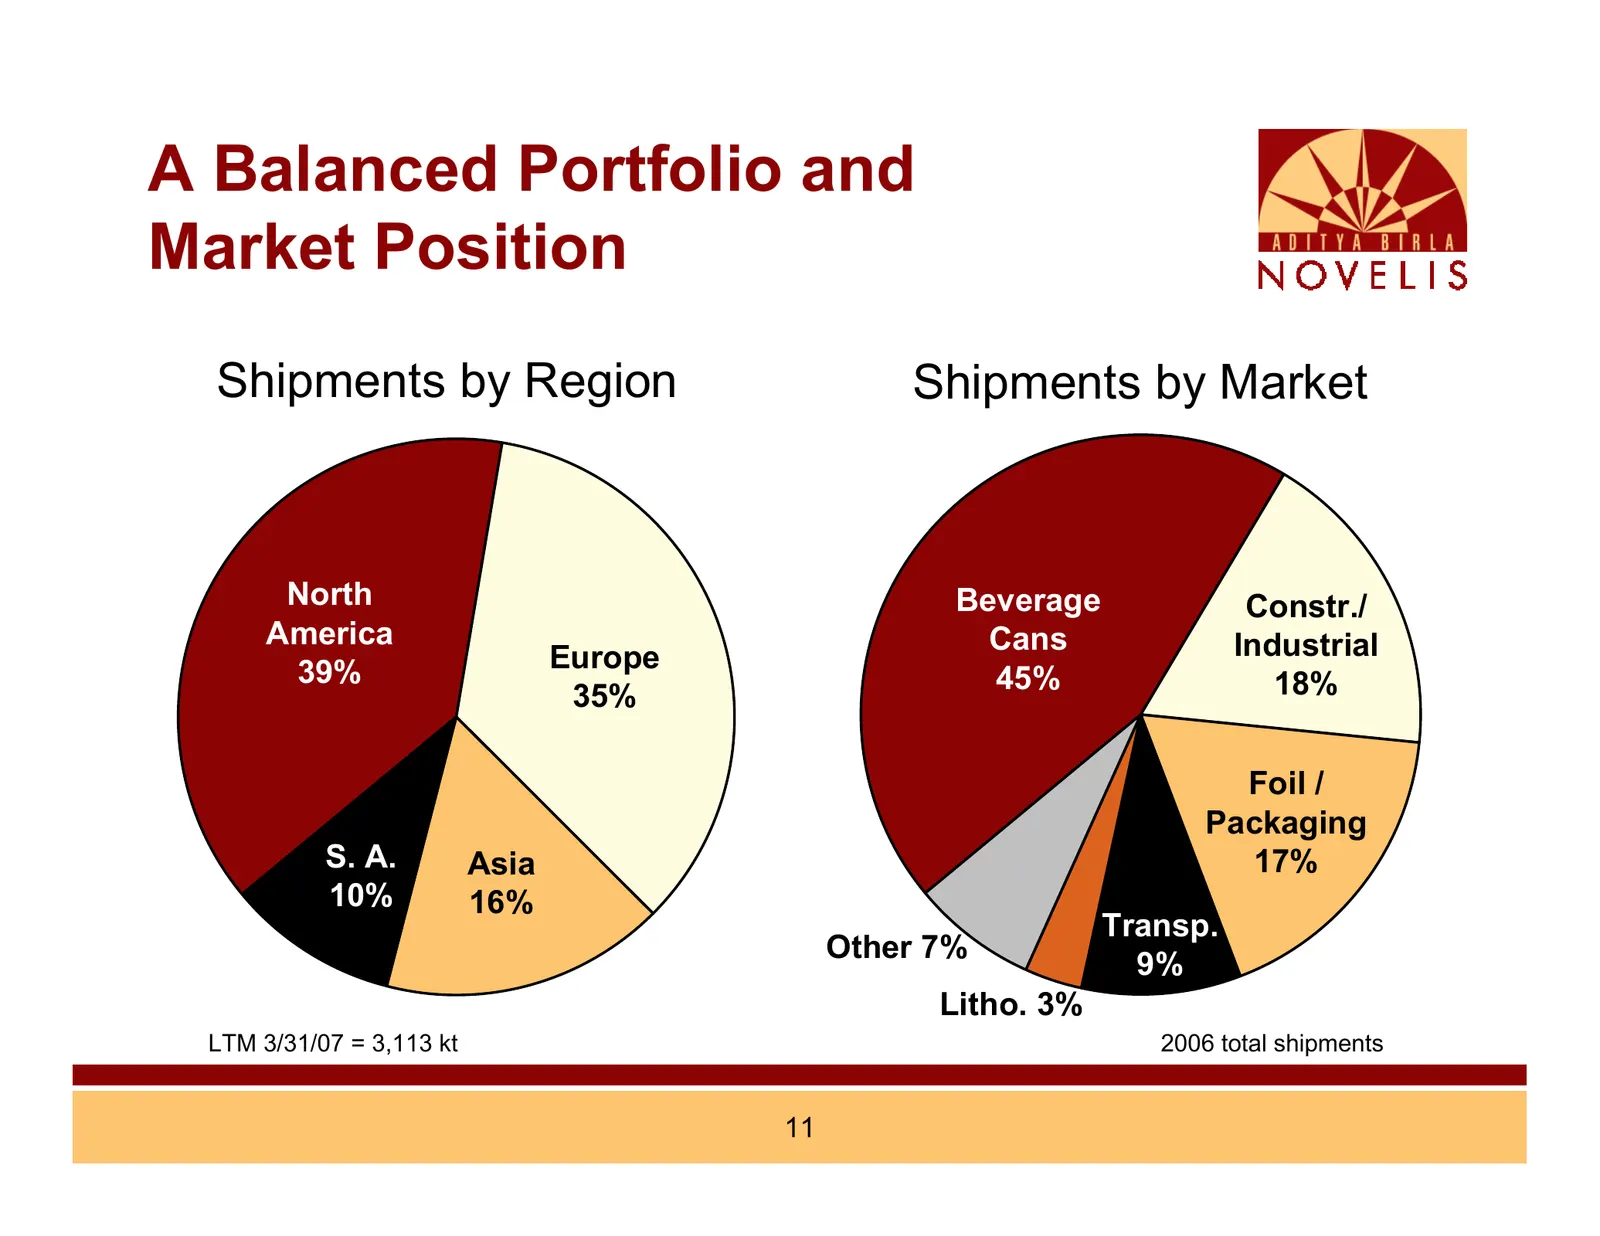
A Balanced Portfolio and Market Position Shipments by Region Shipments by Market North Beverage Constr./ America Cans Industrial 39% Europe 45% 18% 35% Foil / Packaging S. A. Asia 17% 10% 16% Transp. Other 7% 9% Litho. 3% LTM 3/31/07 = 3,113 kt 2006 total shipments 11
Slide 12: Operational Excellence
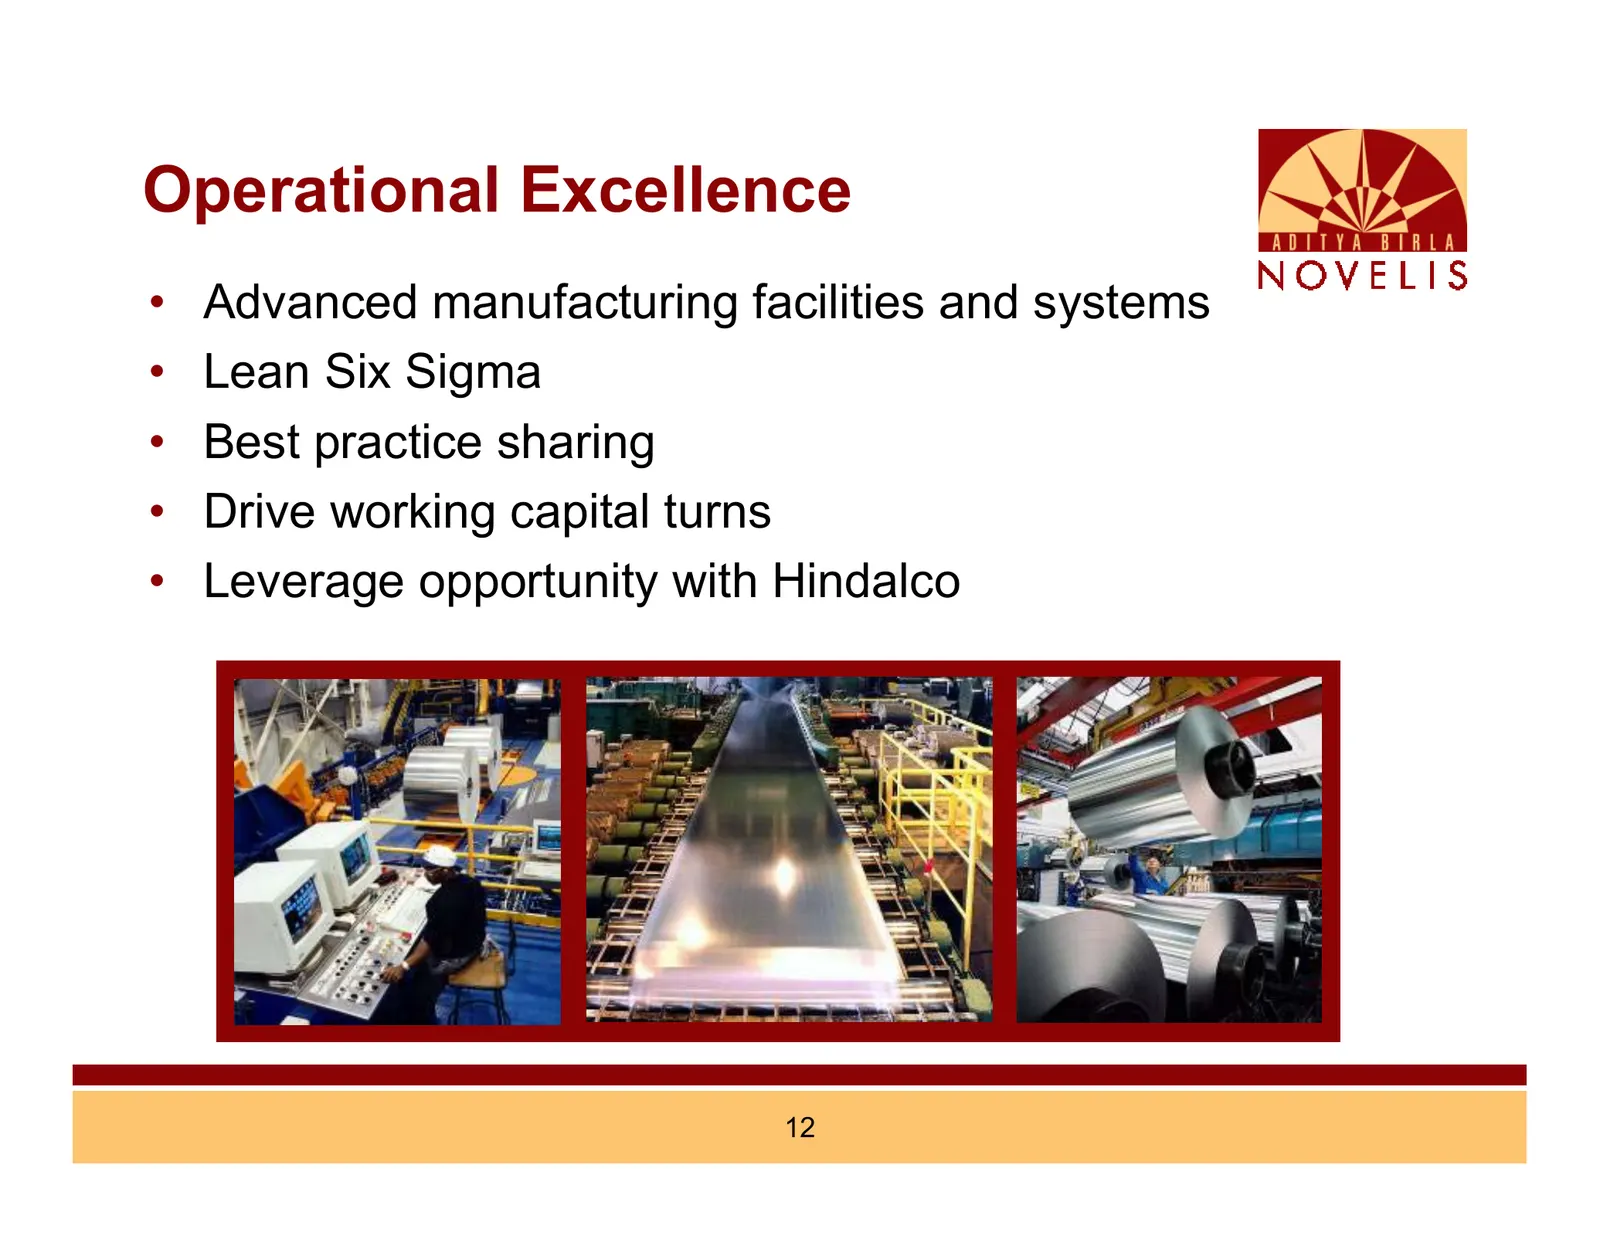
Operational Excellence • Advanced manufacturing facilities and systems • Lean Six Sigma • Best practice sharing • Drive working capital turns • Leverage opportunity with Hindalco 12
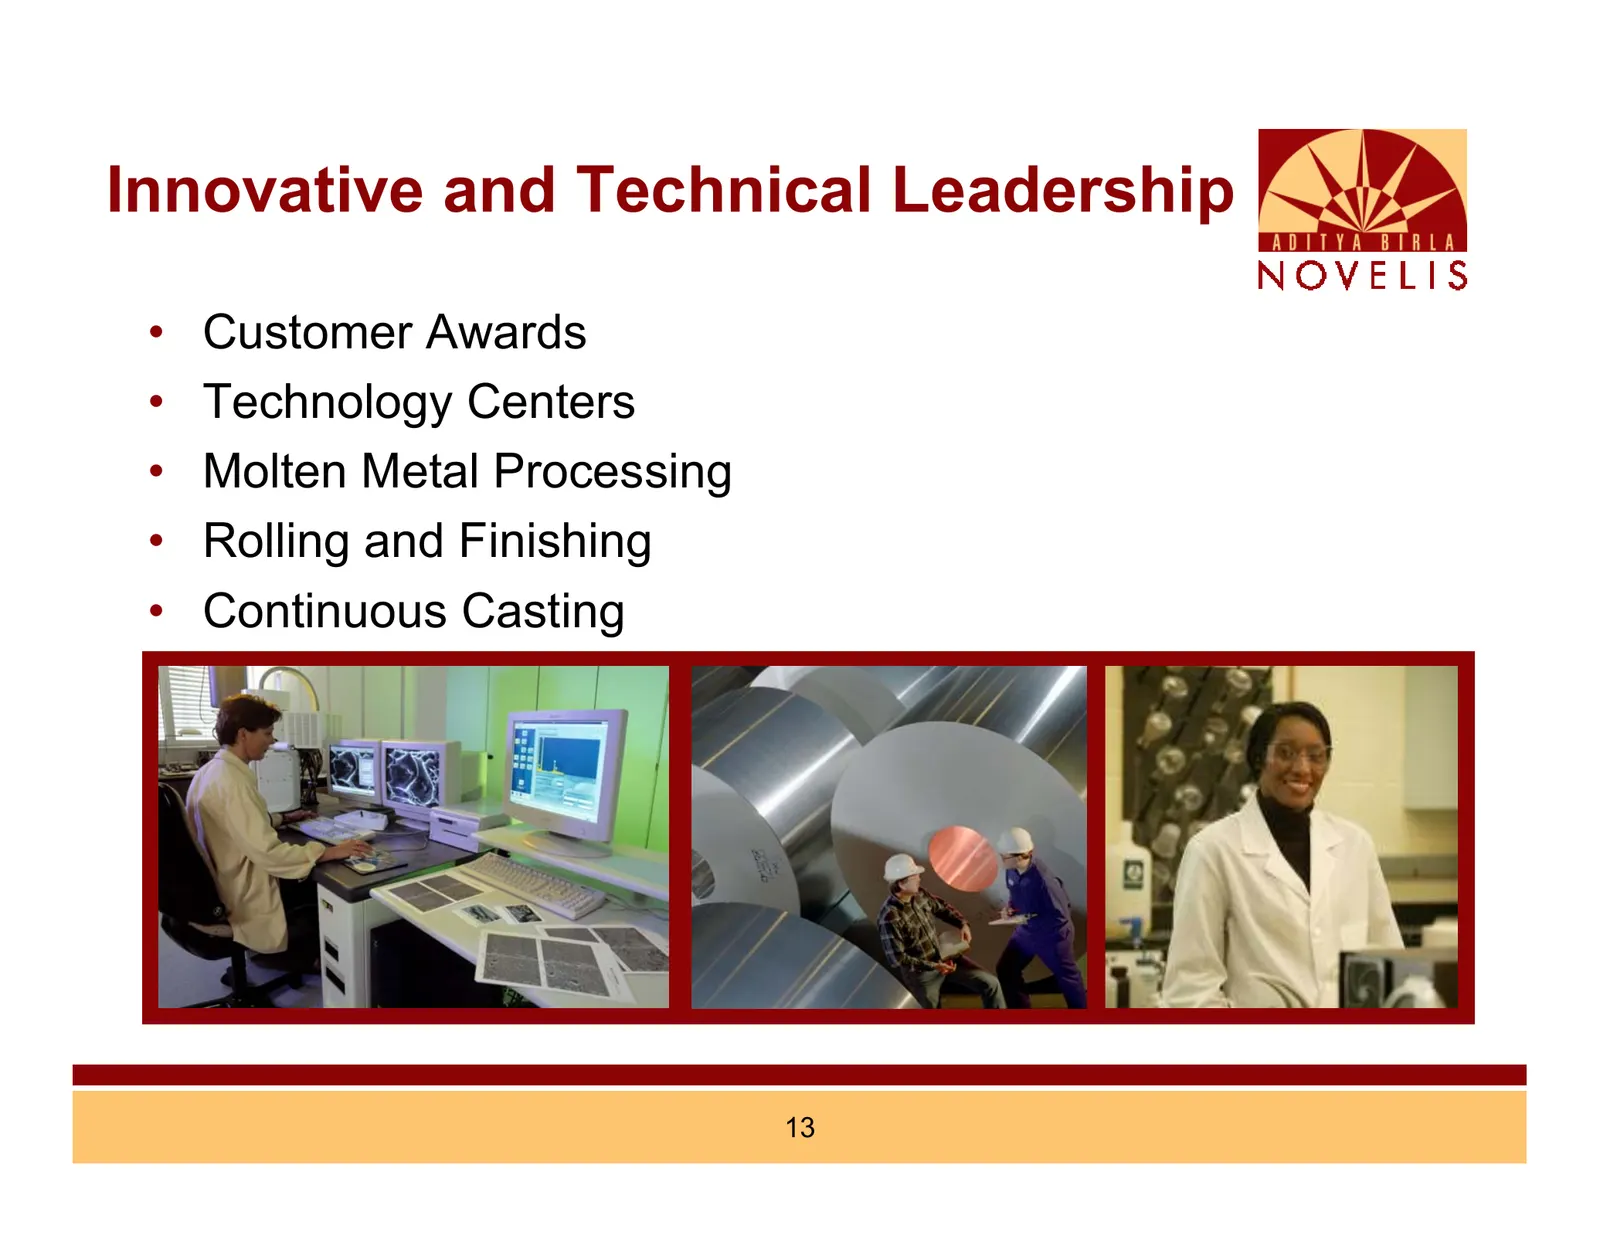
Slide 13: Innovative and Technical Leadership
Innovative and Technical Leadership • Customer Awards • Technology Centers • Molten Metal Processing • Rolling and Finishing • Continuous Casting 13
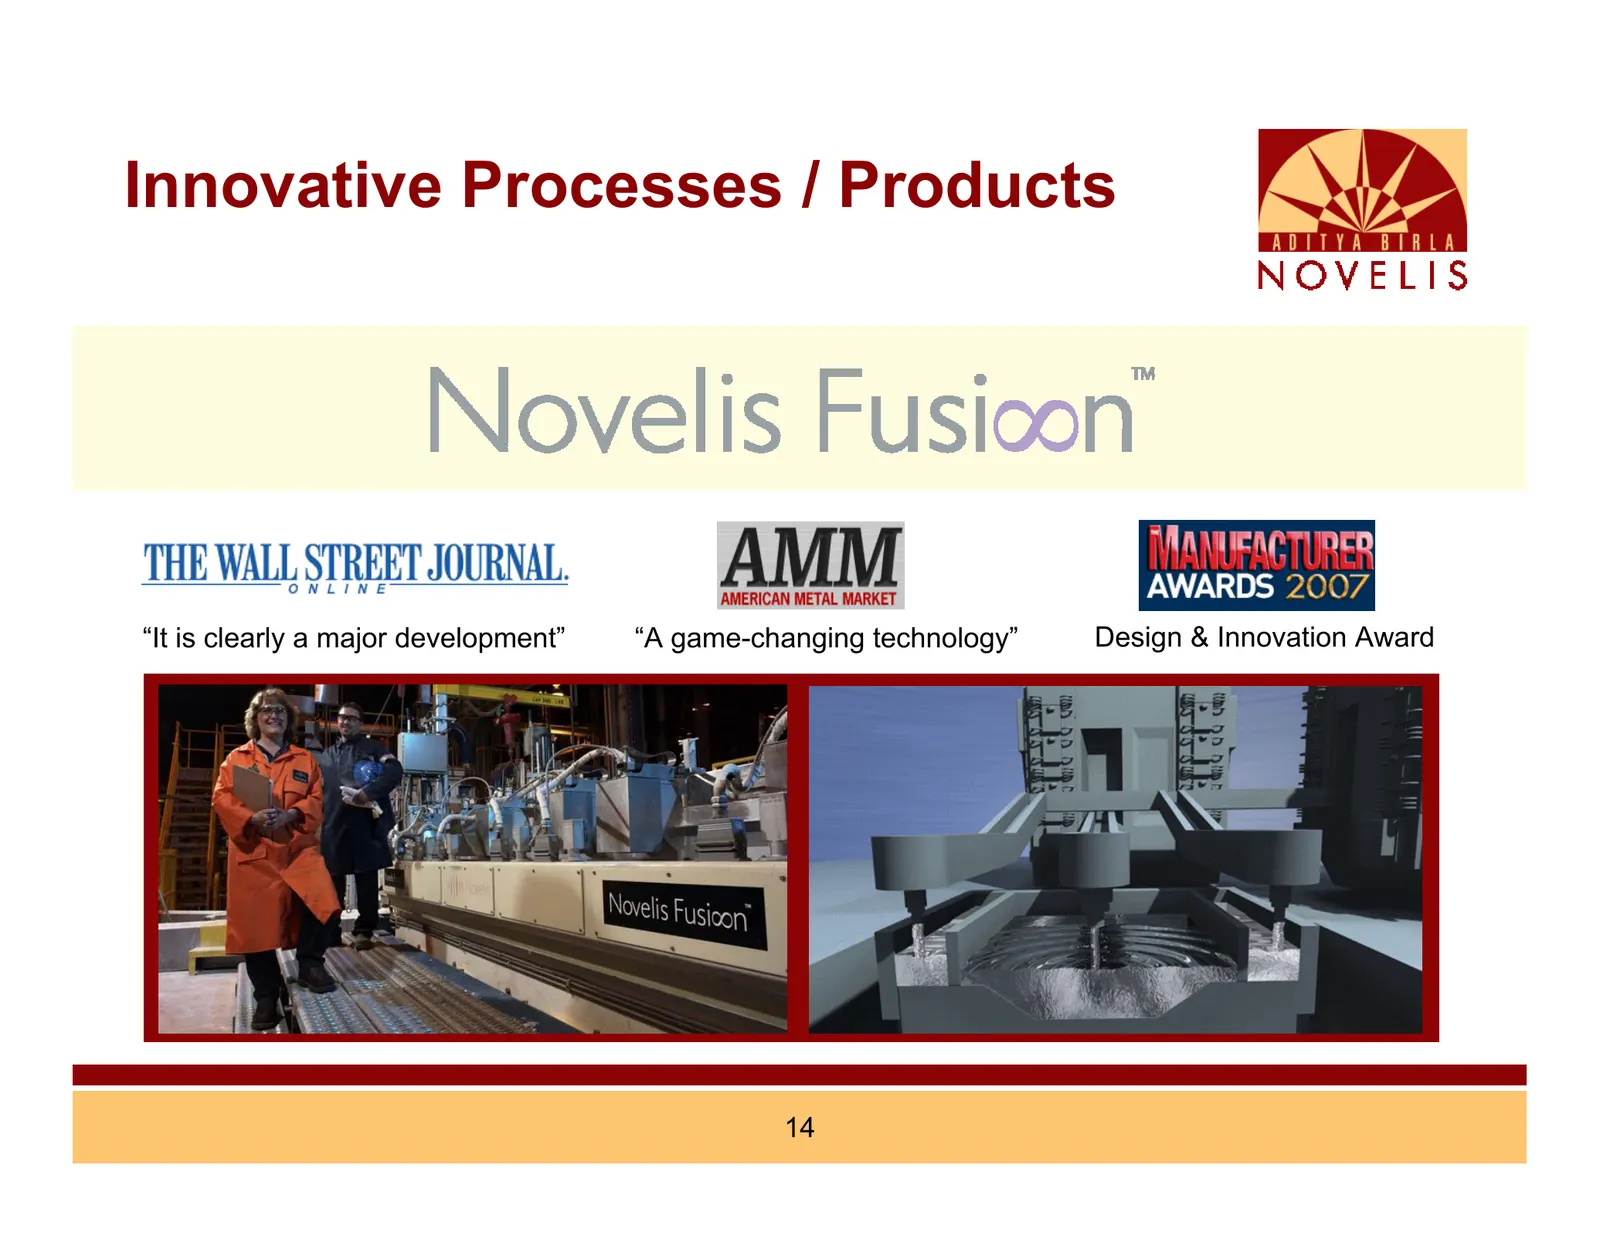
Slide 14: Innovative Processes / Products
Innovative Processes / Products “It is clearly a major development” “A game-changing technology” Design & Innovation Award 14
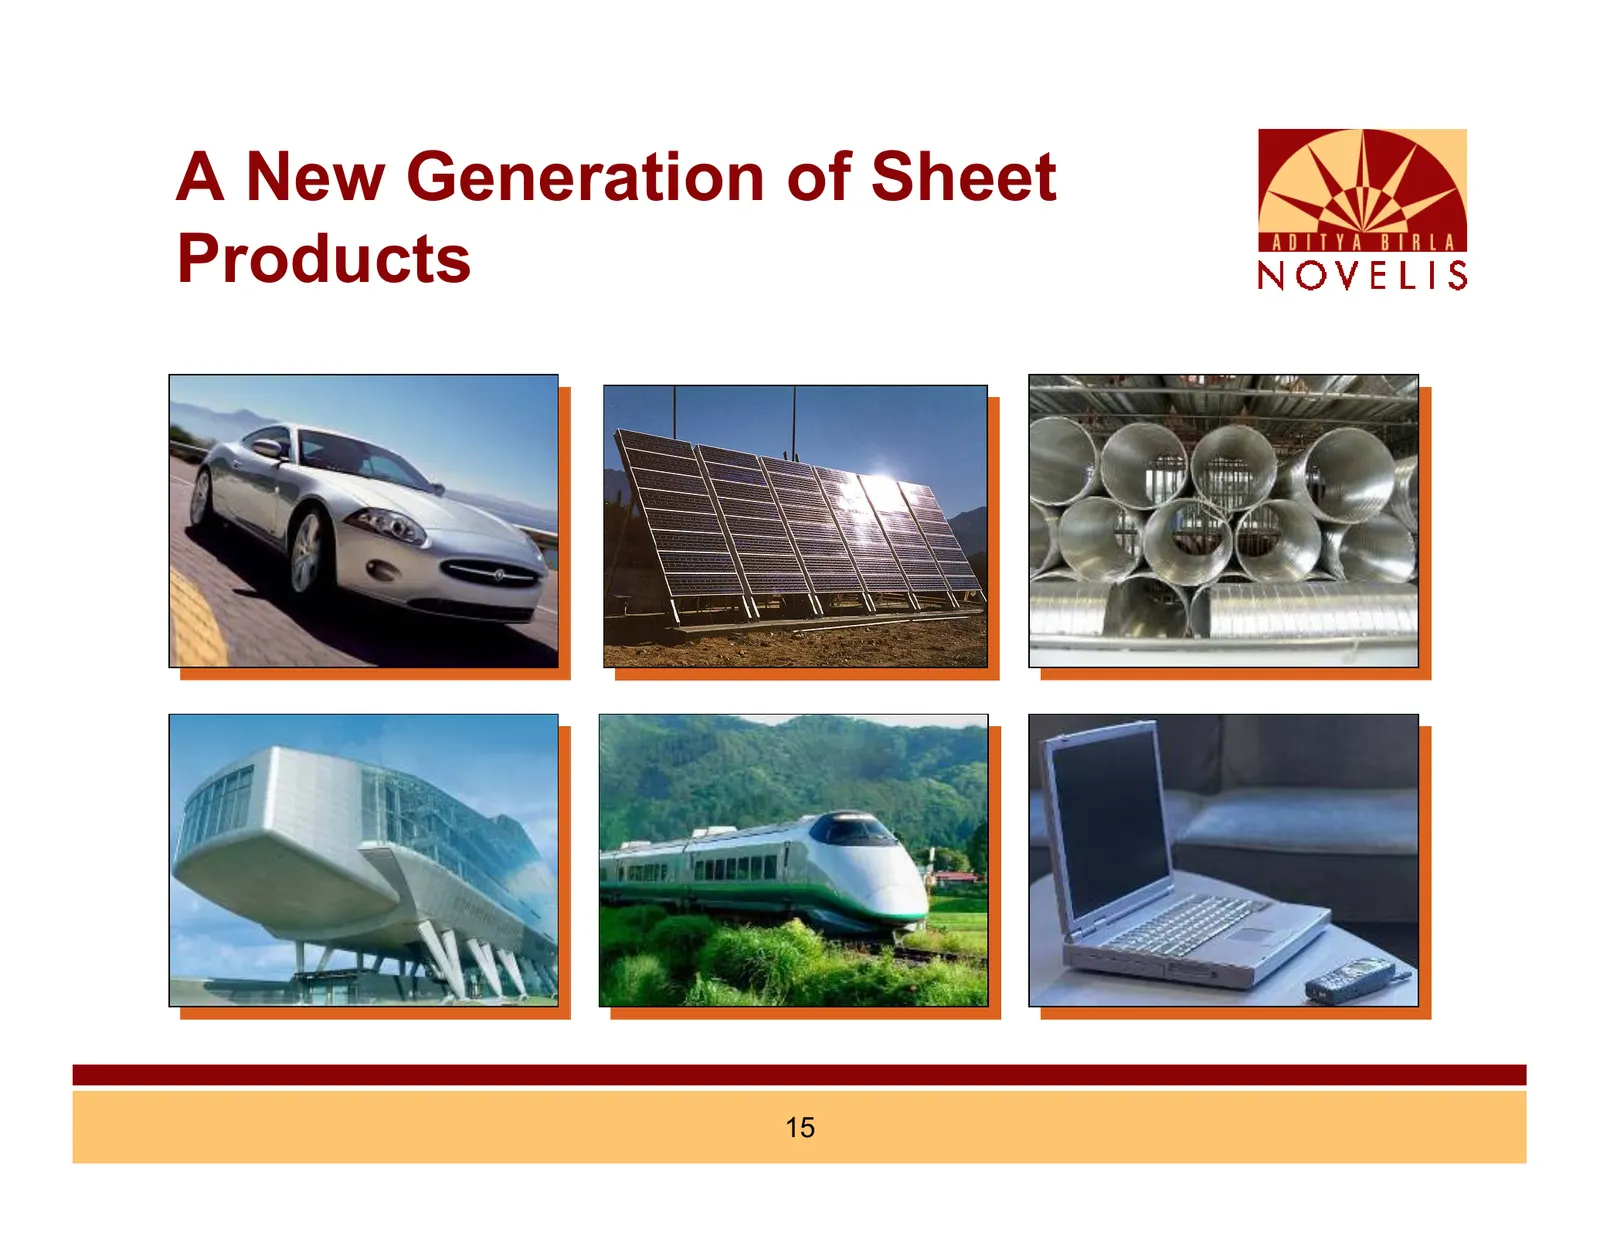
Slide 15: A New Generation of Sheet Products
A New Generation of Sheet Products Automotive Appliances Industrial Architectural Transportation Electronics 15
Slide 16: Q1 Financial Review
NOVELIS Q1 Financial Review
Slide 17: Highlights
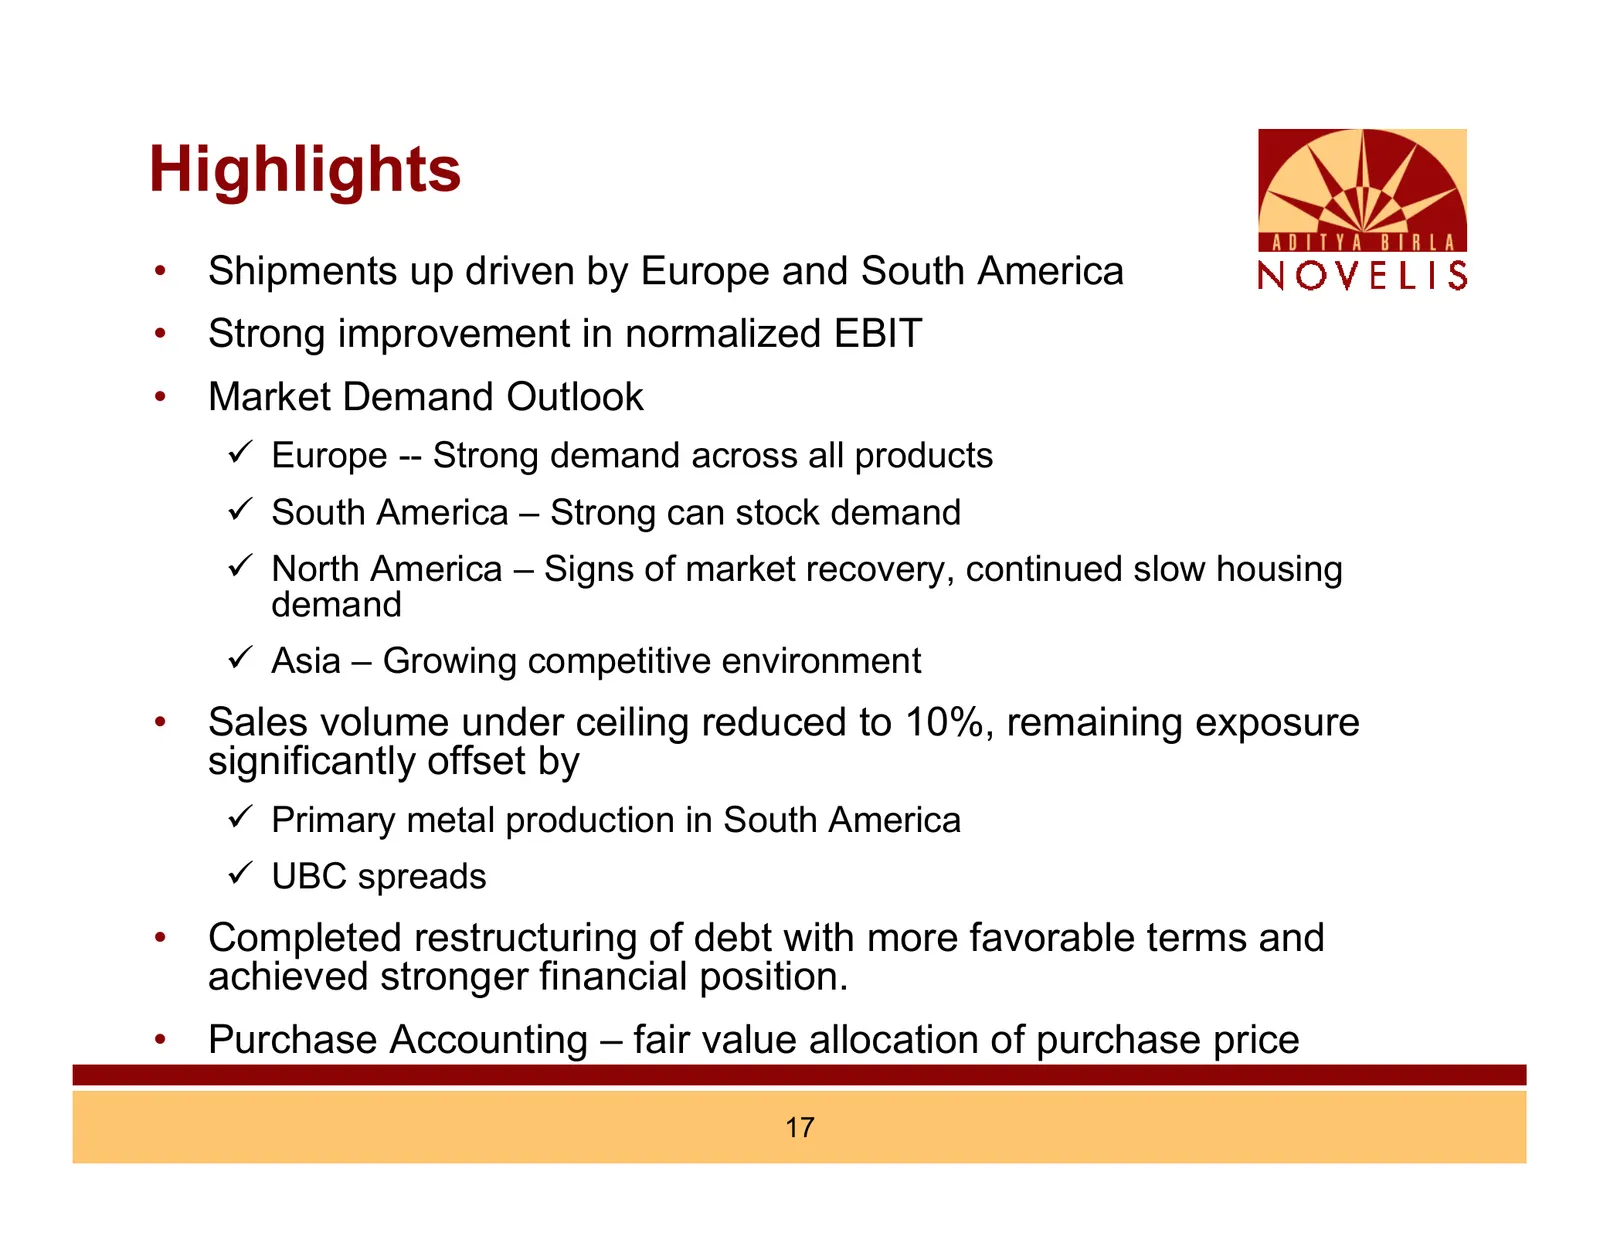
Highlights • Shipments up driven by Europe and South America • Strong improvement in normalized EBIT • Market Demand Outlook 9 Europe -- Strong demand across all products 9 South America – Strong can stock demand 9 North America – Signs of market recovery, continued slow housing demand 9 Asia – Grow
Slide 18: Drivers of Performance
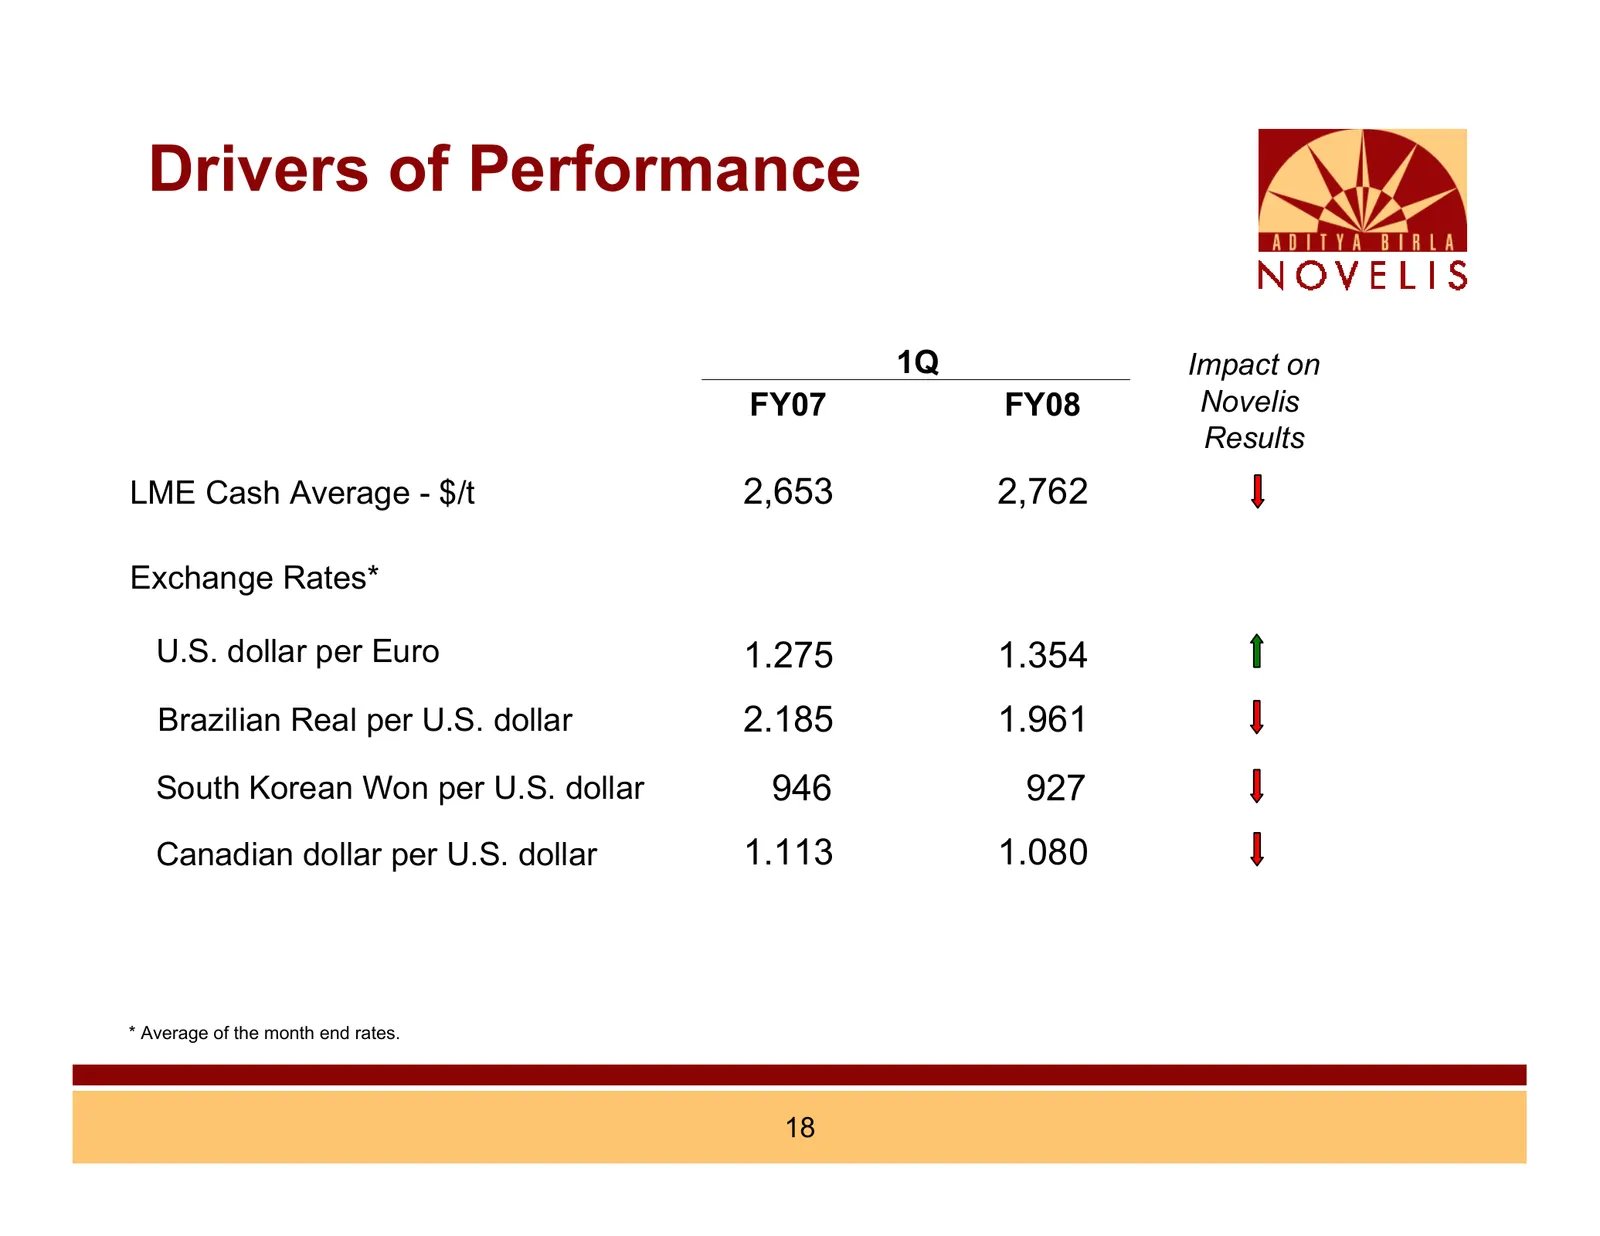
Drivers of Performance 1Q Impact on FY07 FY08 Novelis Results LME Cash Average - $/t 2,653 2,762 Exchange Rates* U.S. dollar per Euro 1.275 1.354 Brazilian Real per U.S. dollar 2.185 1.961 South Korean Won per U.S. dollar 946 927 Canadian dollar per U.S. dollar 1.113 1.080 * Average of the month end
Slide 19: Results at a glance
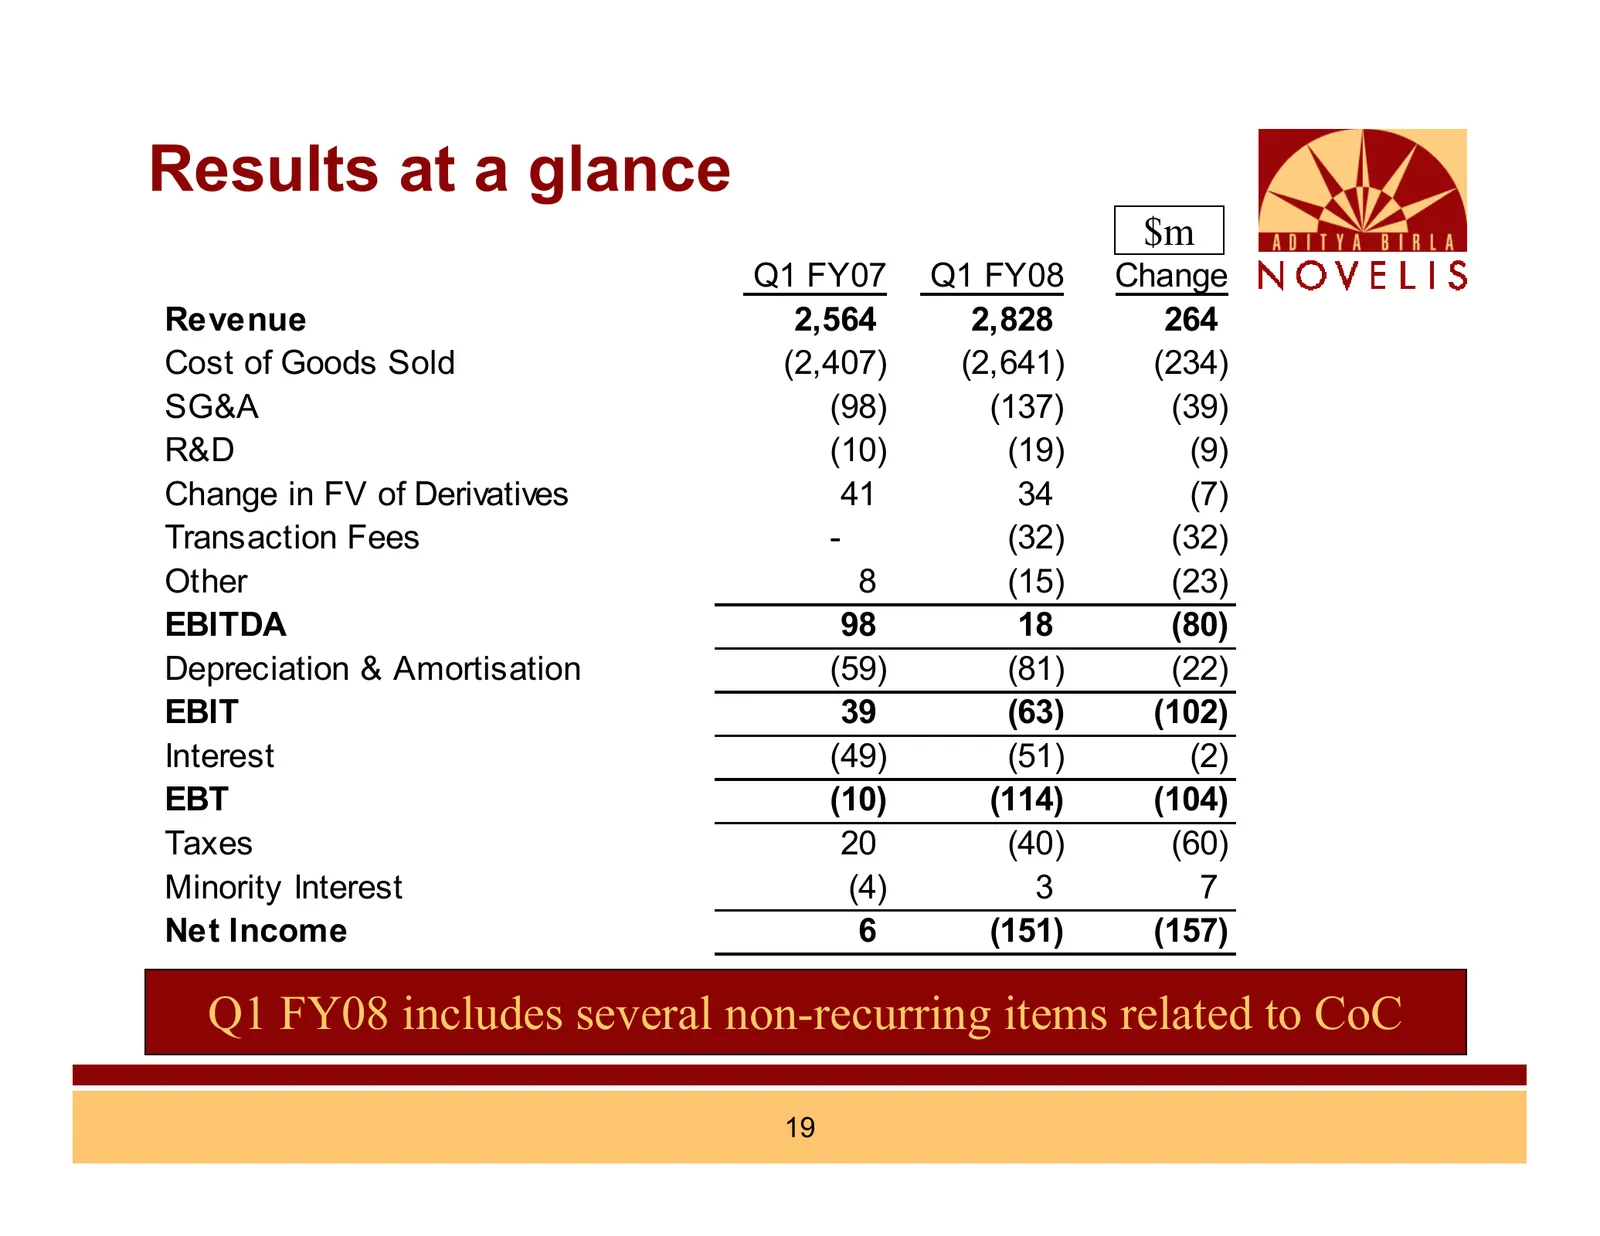
Results at a glance $m Q1 FY07 Q1 FY08 Change Revenue 2,564 2,828 264 Cost of Goods Sold (2,407) (2,641) (234) SG&A (98) (137) (39) R&D (10) (19) (9) Change in FV of Derivatives 41 34 (7) Transaction Fees - (32) (32) Other 8 (15) (23) EBITDA 98 18 (80) Depreciation & Amortisation (59) (81) (22) EBIT
Slide 20: Normalised EBIT
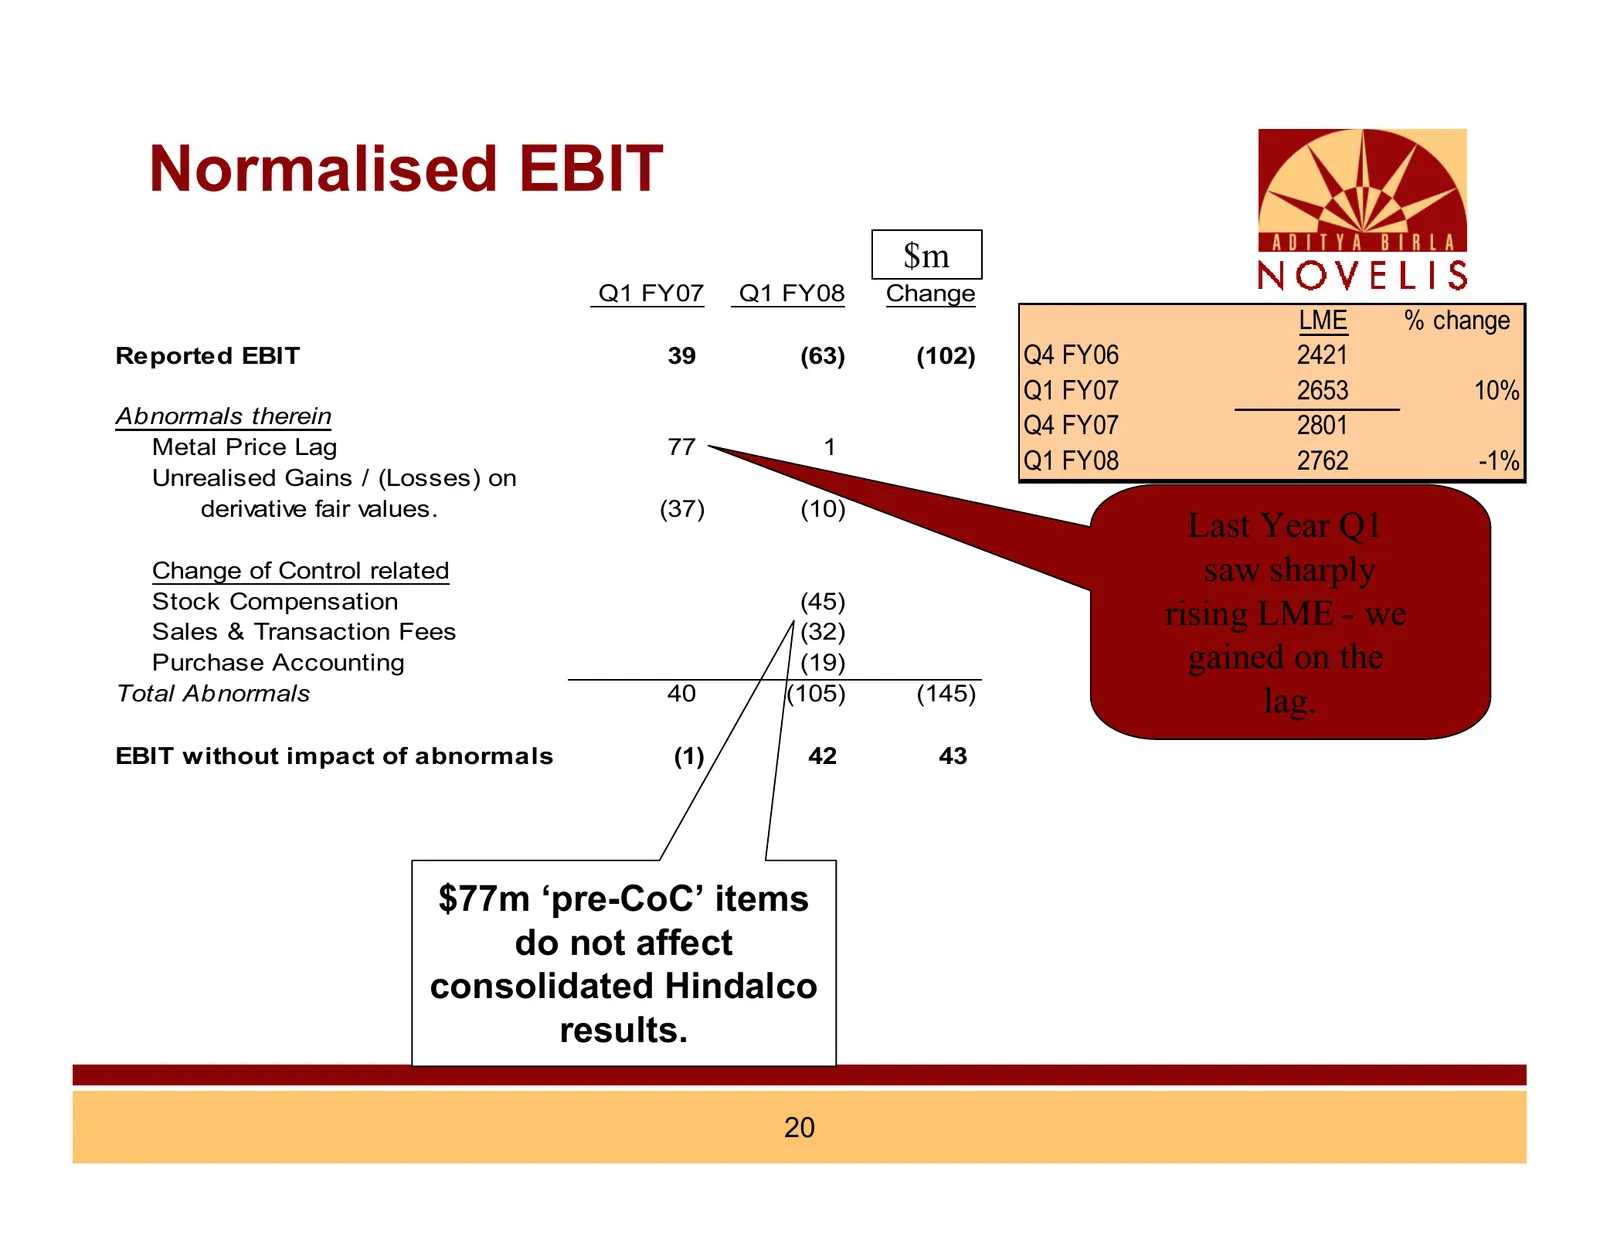
Normalised EBIT $m Q1 FY07 Q1 FY08 Change LME % change Reported EBIT 39 (63) (102) Q4 FY06 2421 Q1 FY07 2653 10% Abnormals therein Q4 FY07 2801 Metal Price Lag 77 1 Q1 FY08 2762 -1% Unrealised Gains / (Losses) on derivative fair values. (37) (10) Last Year Q1 Change of Control related saw sharply St
Slide 21: Normalised EBIT Variance
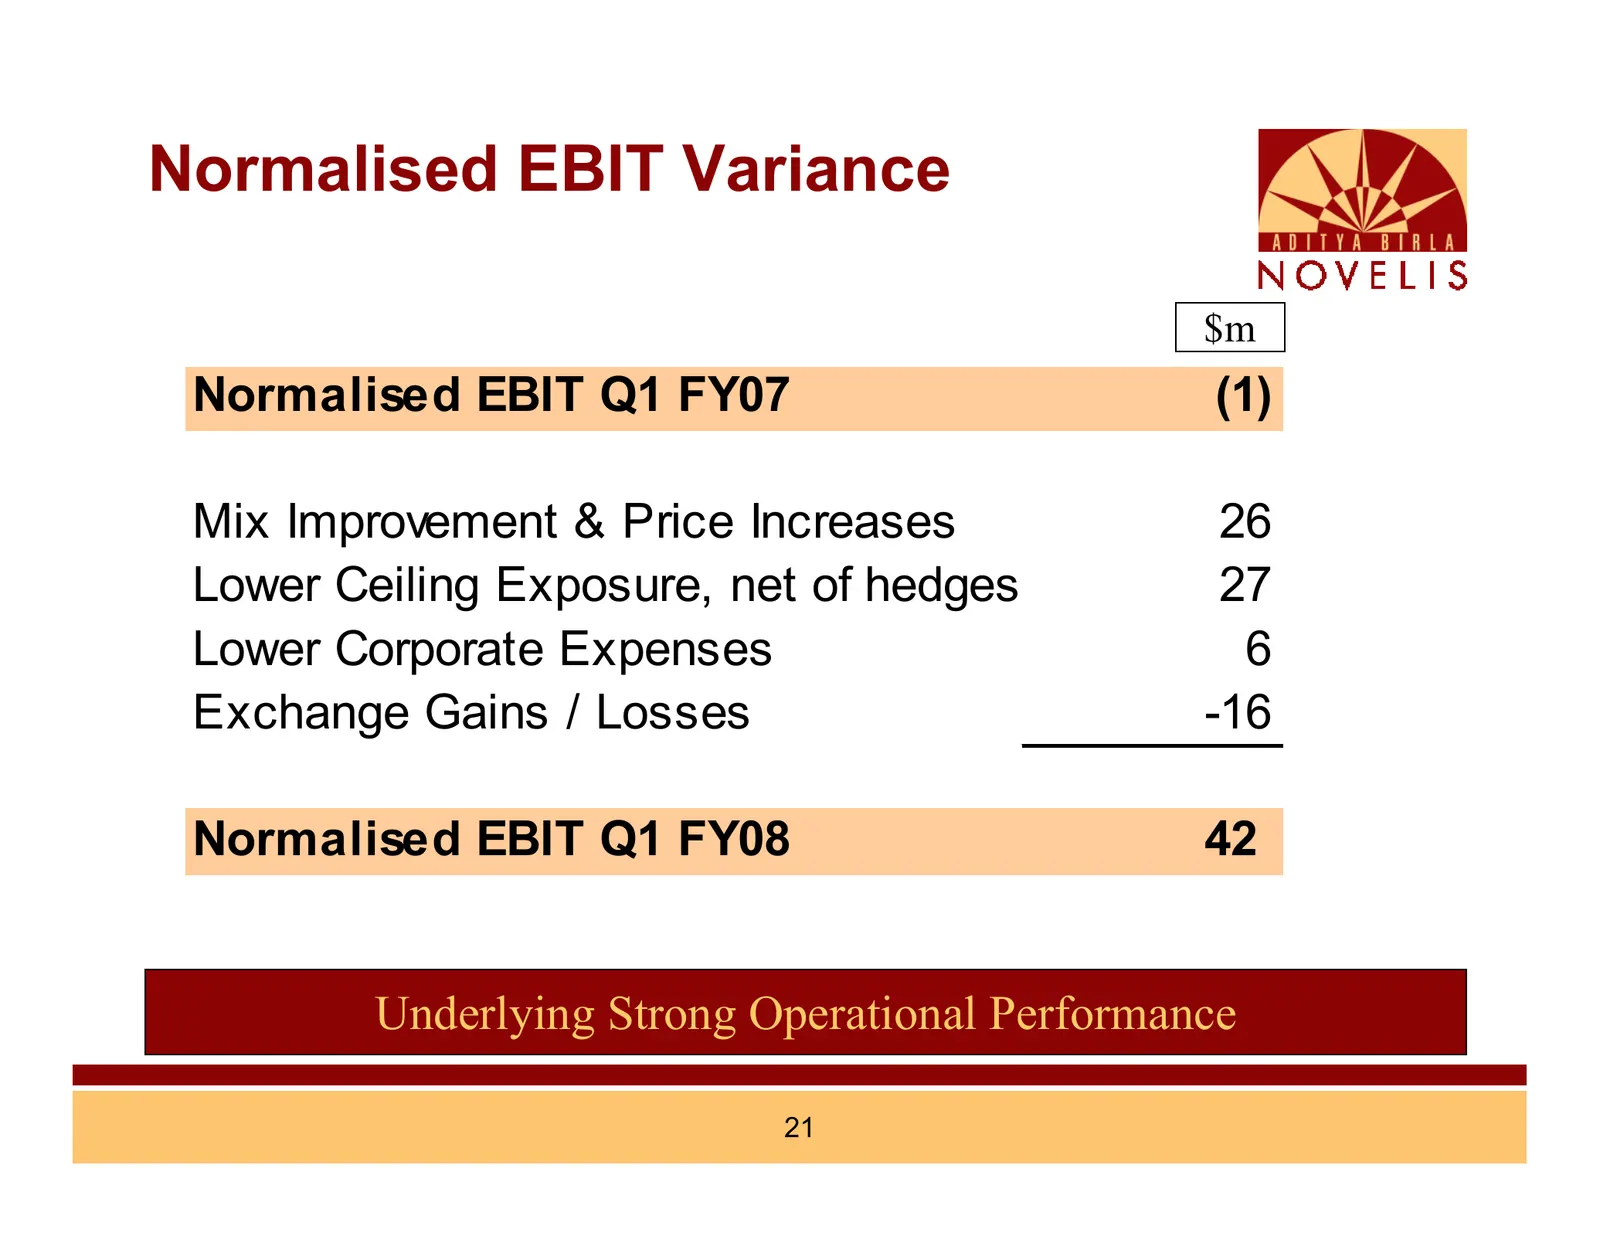
Normalised EBIT Variance $m Normalised EBIT Q1 FY07 (1) Mix Improvement & Price Increases 26 Lower Ceiling Exposure, net of hedges 27 Lower Corporate Expenses 6 Exchange Gains / Losses -16 Normalised EBIT Q1 FY08 42 Underlying Strong Operational Performance 21
Slide 22: Price Ceiling Exposures and Risk Mitigation
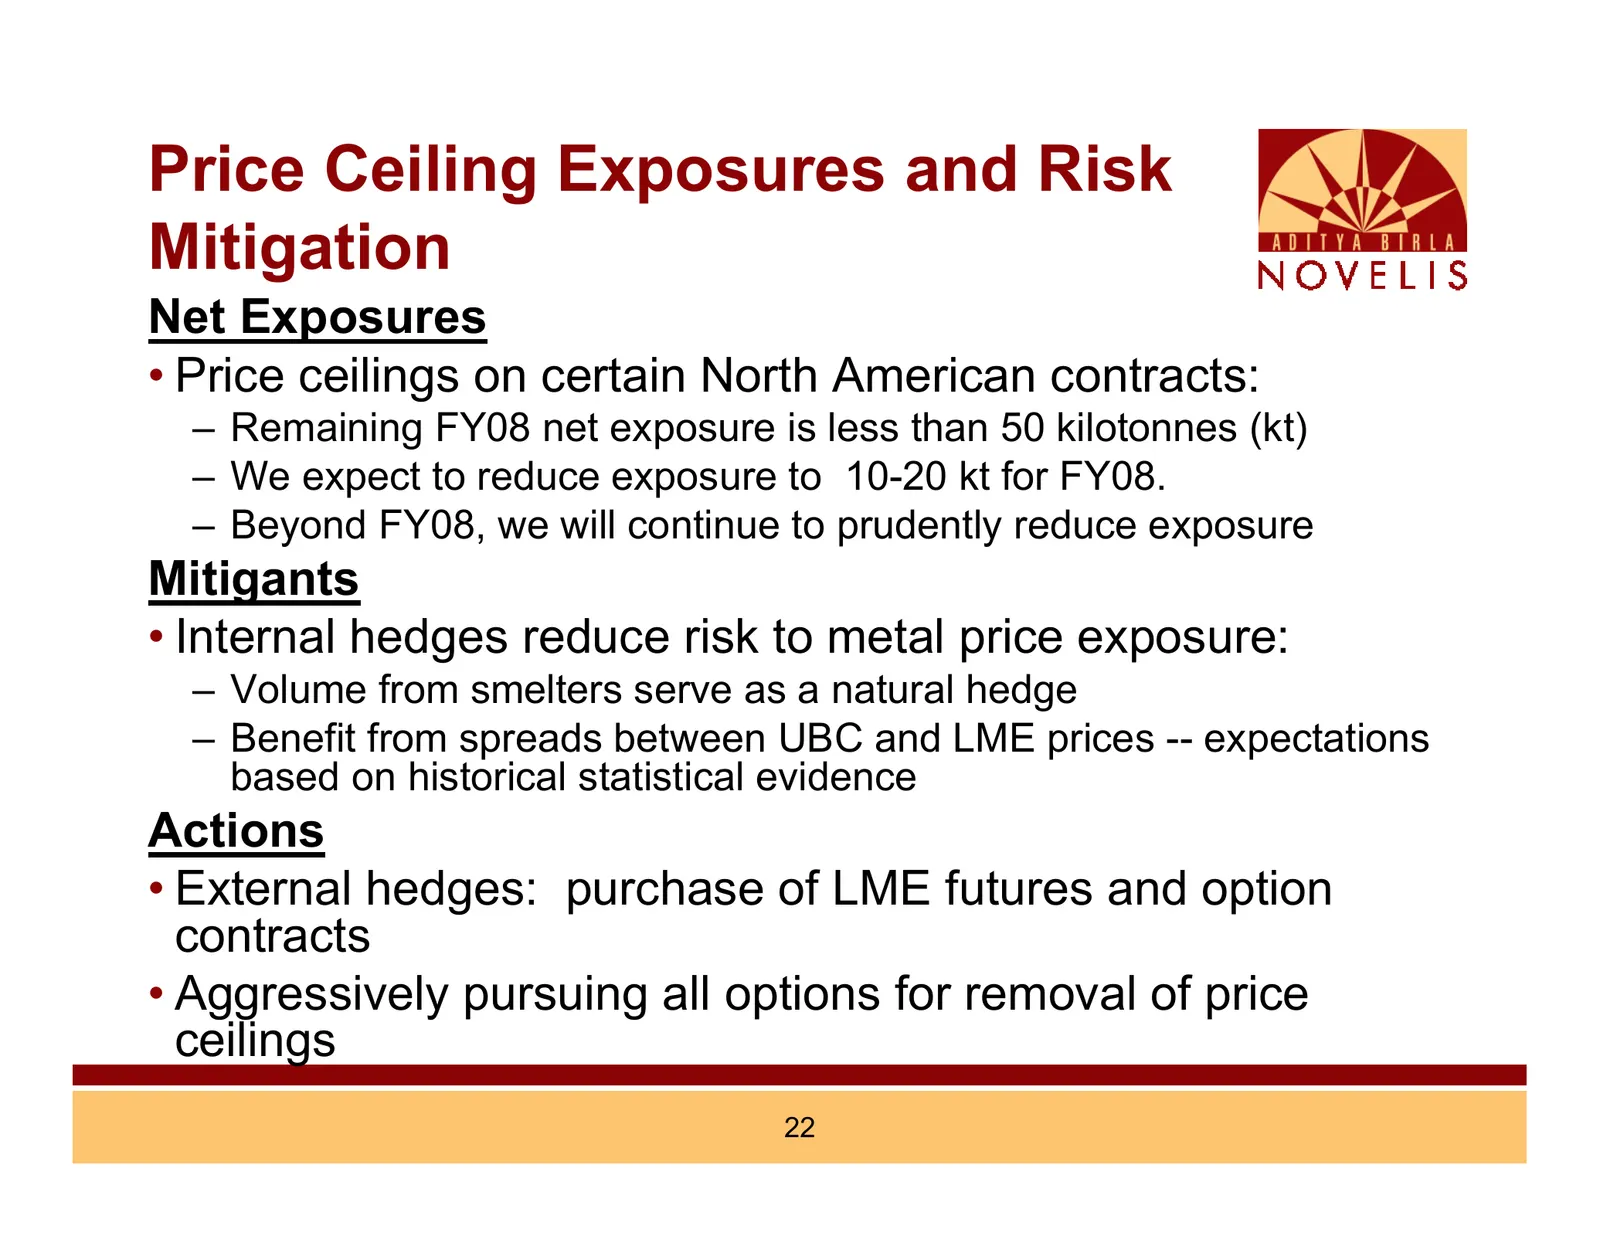
Price Ceiling Exposures and Risk Mitigation Net Exposures • Price ceilings on certain North American contracts: – Remaining FY08 net exposure is less than 50 kilotonnes (kt) – We expect to reduce exposure to 10-20 kt for FY08. – Beyond FY08, we will continue to prudently reduce exposure Mitigants •
Slide 23: Income Taxes
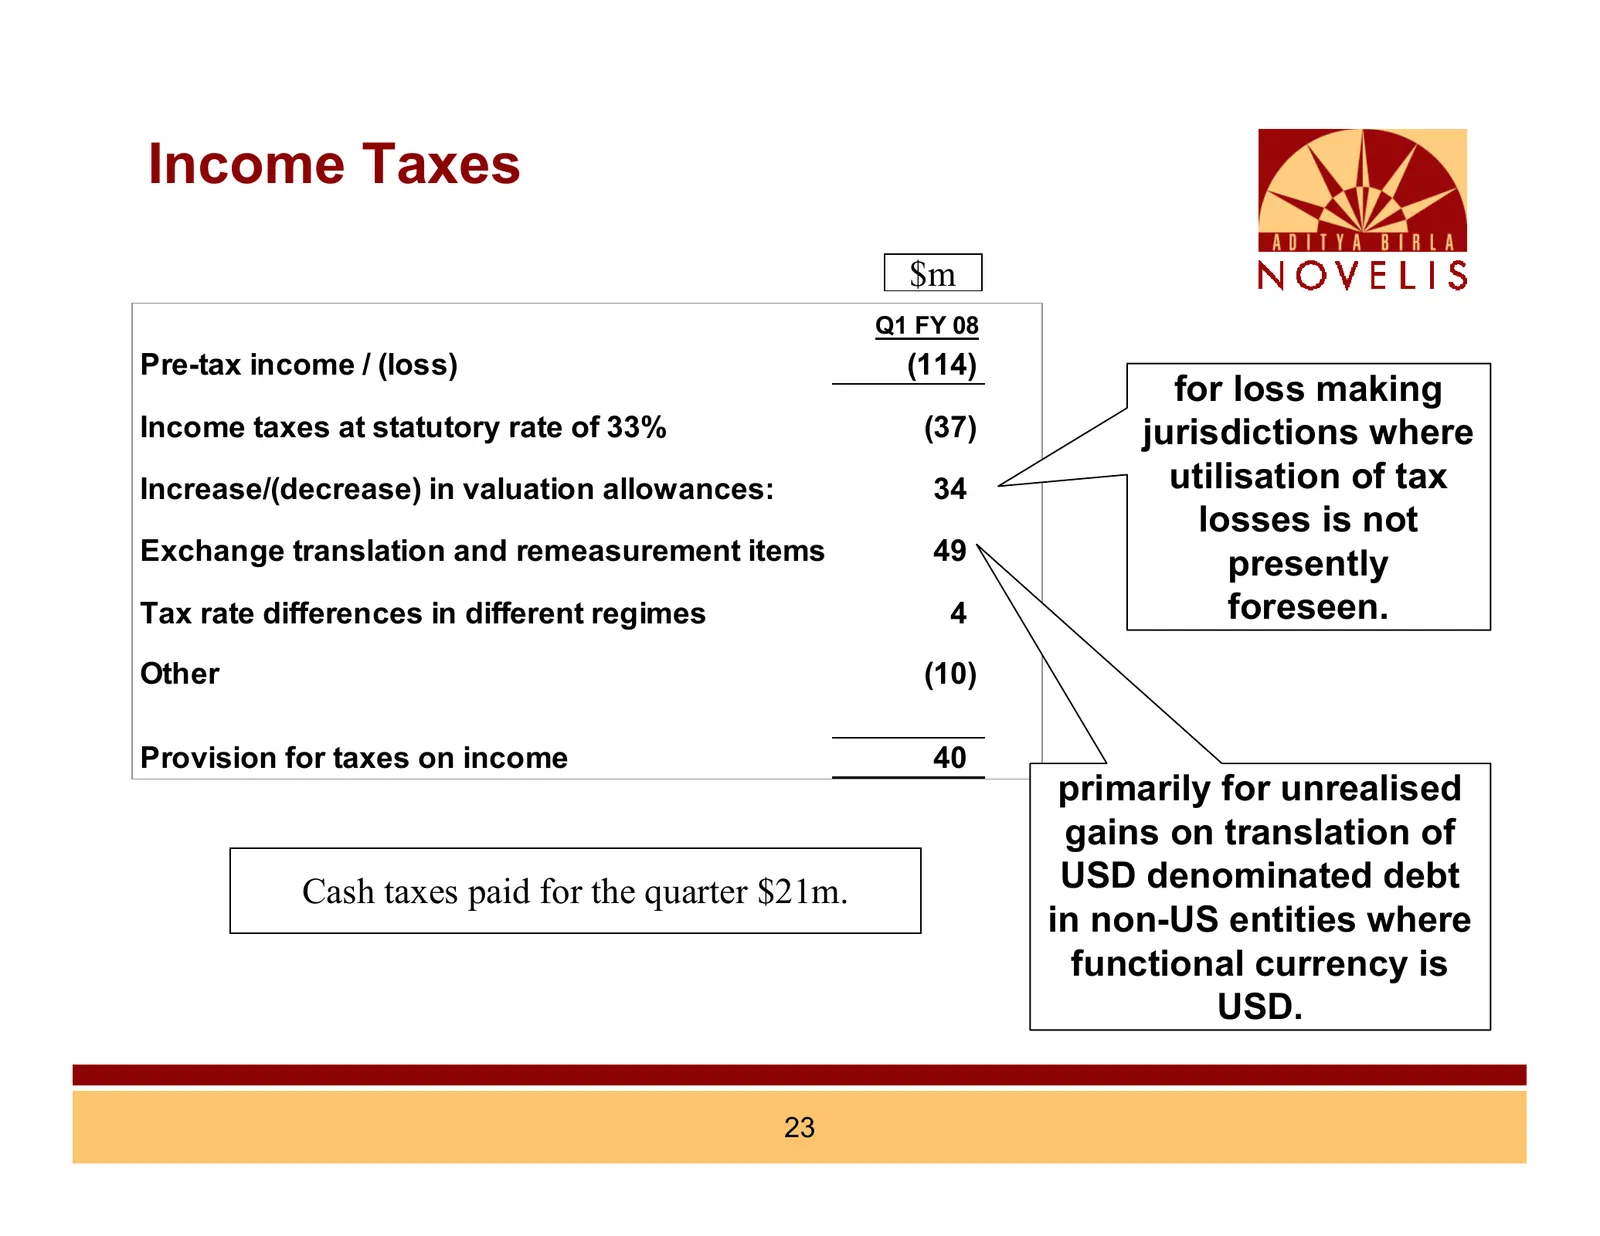
Income Taxes $m Q1 FY 08 Pre-tax income / (loss) (114) for loss making Income taxes at statutory rate of 33% (37) jurisdictions where Increase/(decrease) in valuation allowances: 34 utilisation of tax losses is not Exchange translation and remeasurement items 49 presently Tax rate differences in dif
Slide 24: Cash Profits
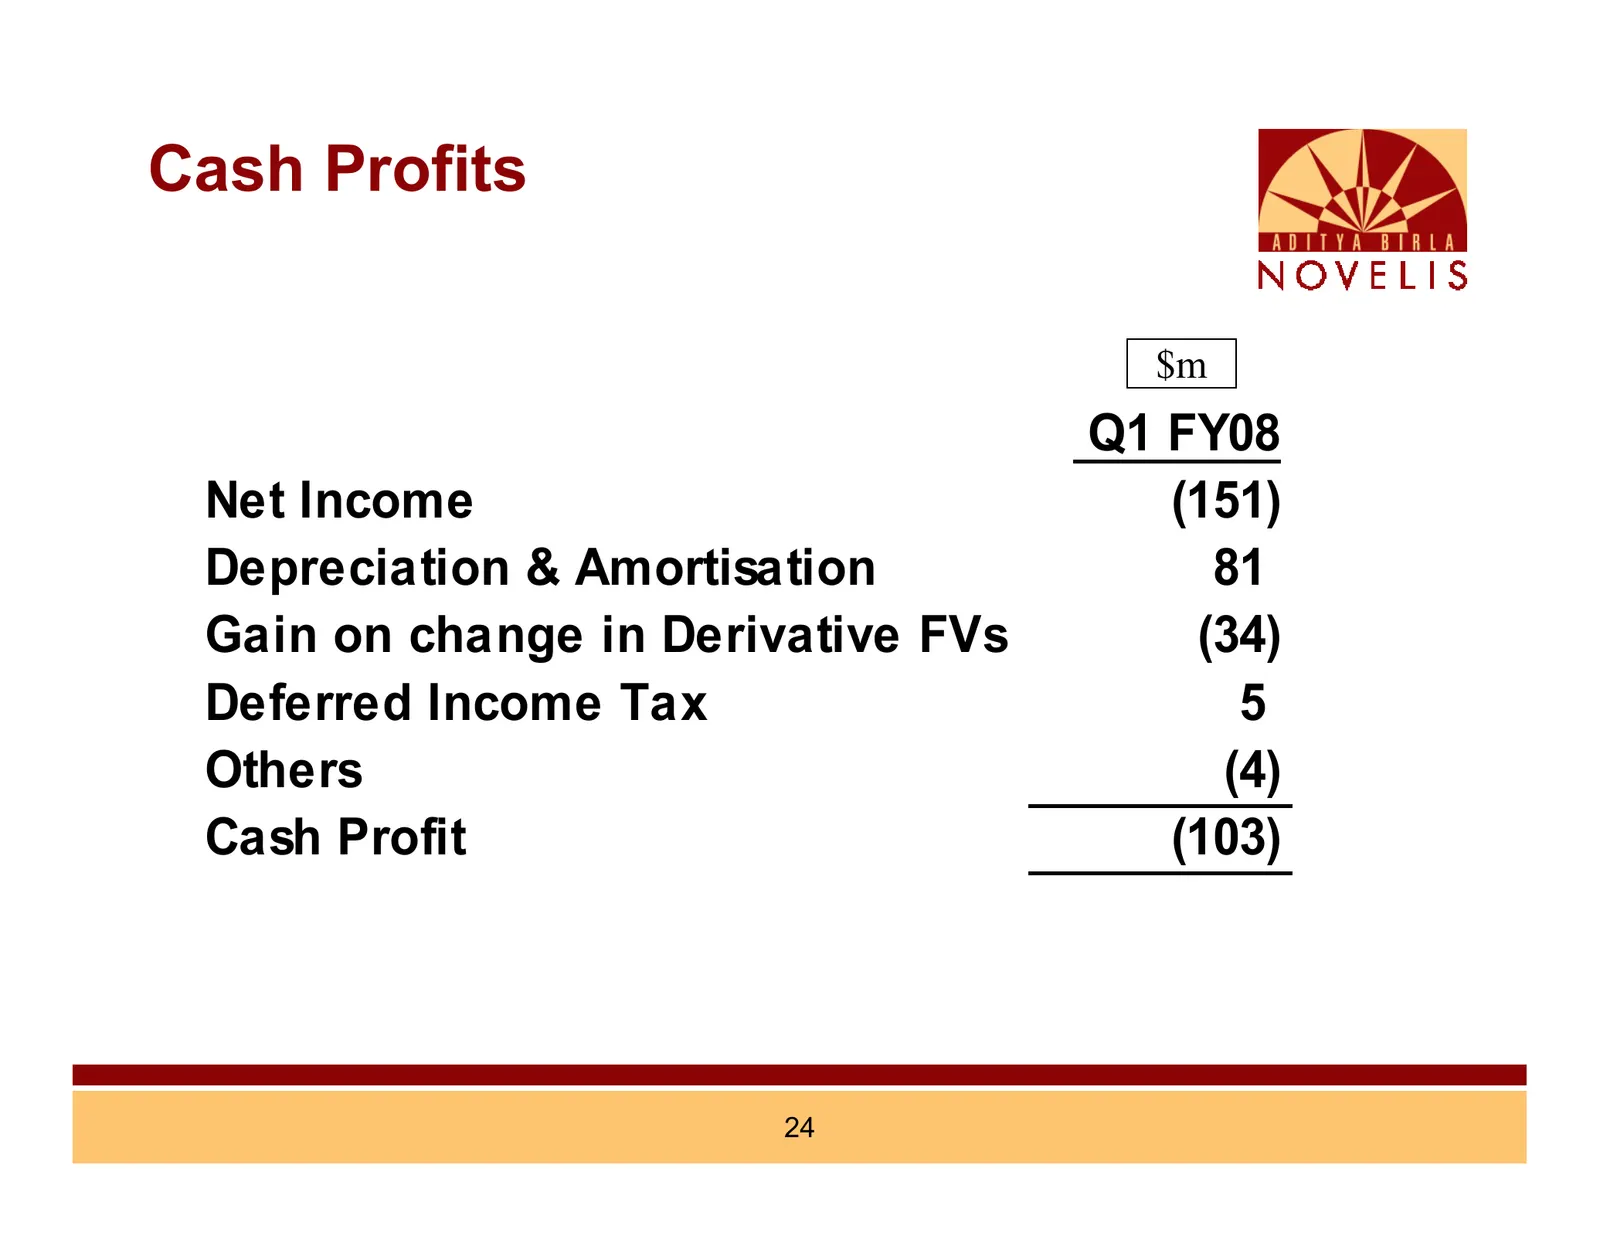
Cash Profits $m Q1 FY08 Net Income (151) Depreciation & Amortisation 81 Gain on change in Derivative FVs (34) Deferred Income Tax 5 Others (4) Cash Profit (103) 24
Slide 25: Cash Flow
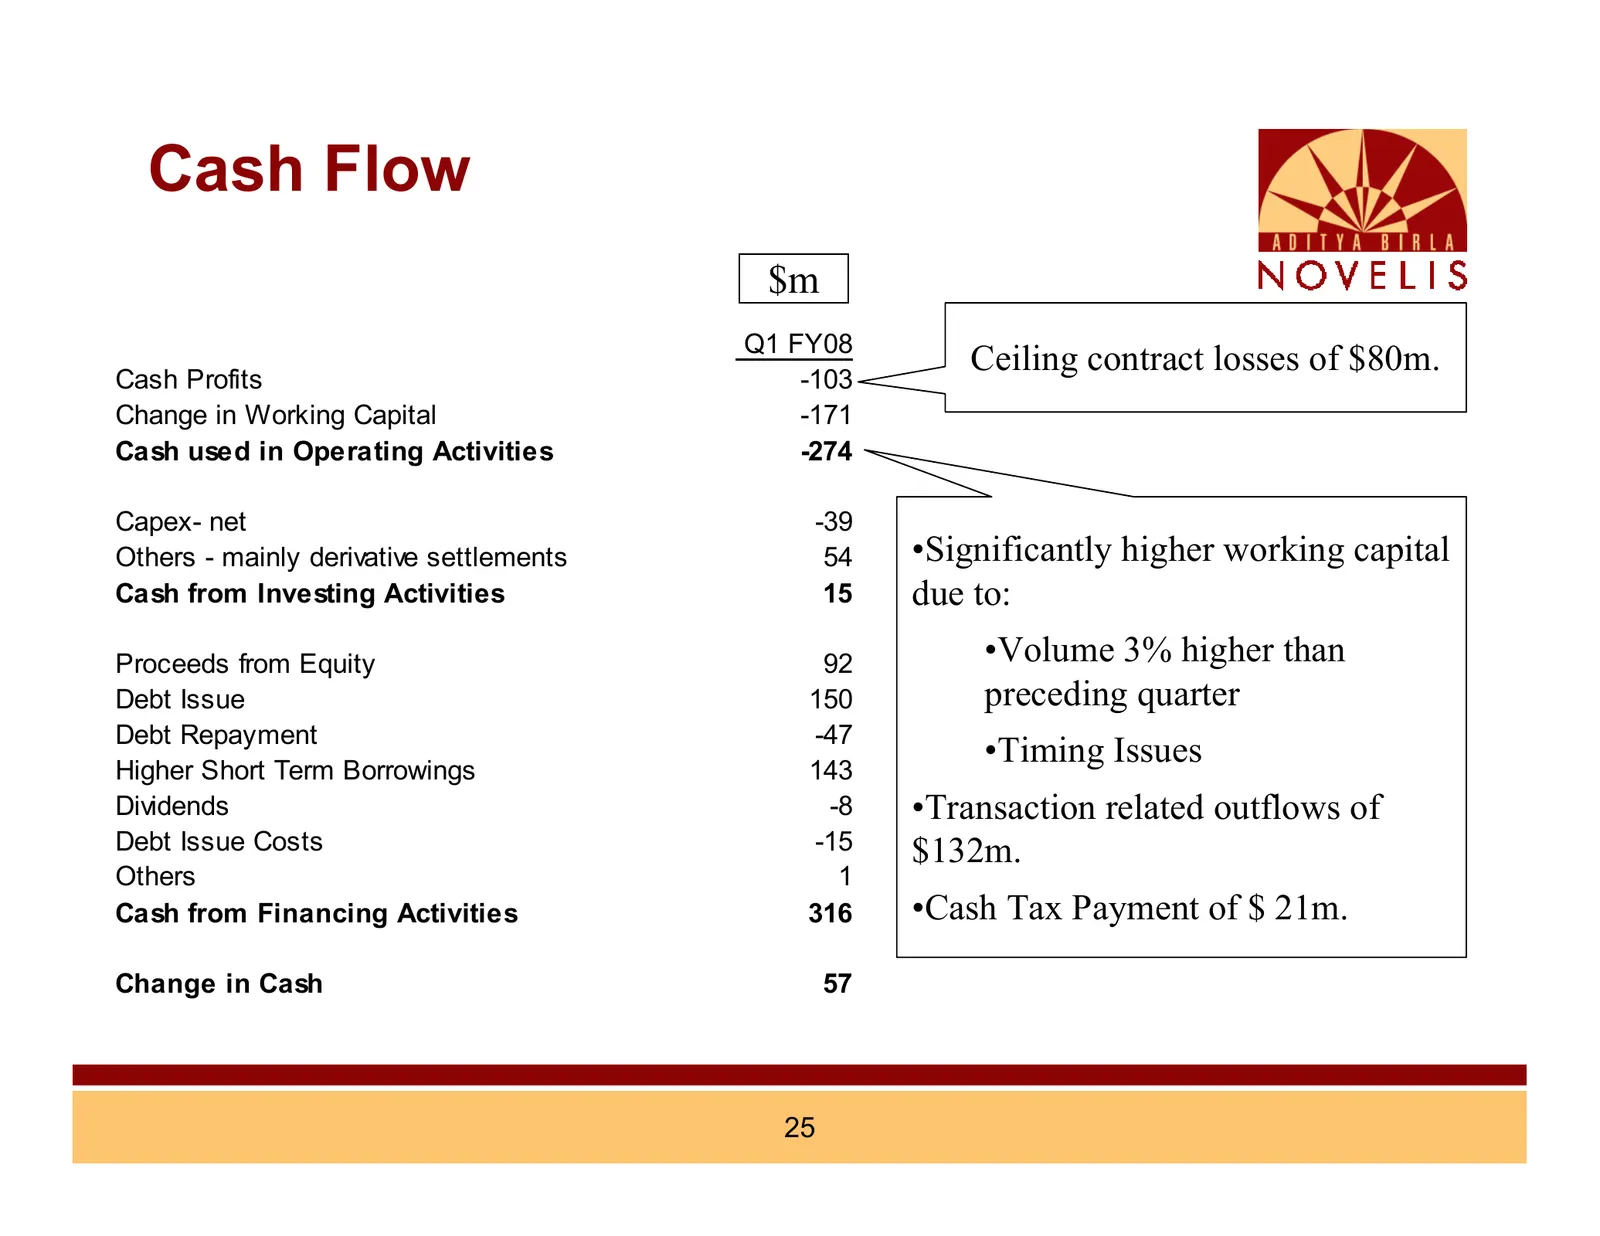
Cash Flow $m Q1 FY08 Ceiling contract losses of $80m. Cash Profits -103 Change in Working Capital -171 Cash used in Operating Activities -274 Capex- net -39 Others - mainly derivative settlements 54 •Significantly higher working capital Cash from Investing Activities 15 due to: Proceeds from Equity
Slide 26: Re-financing
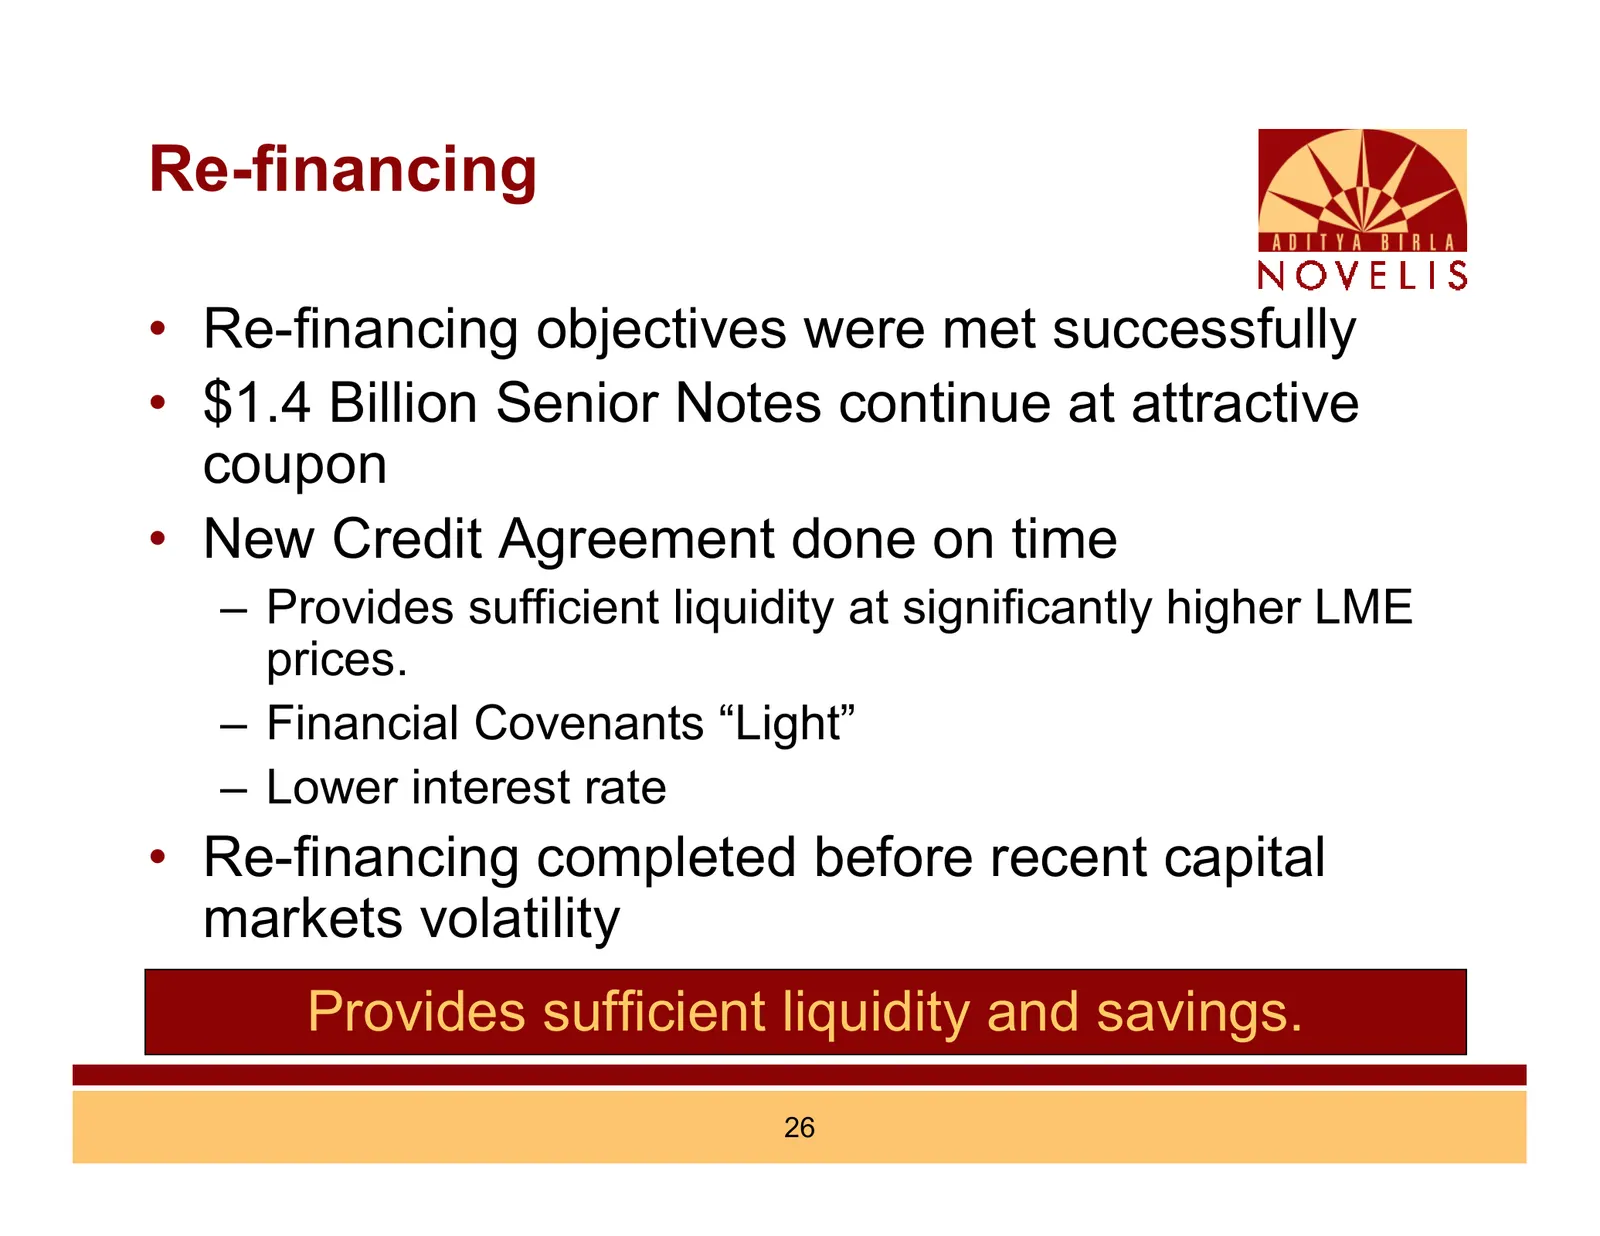
Re-financing • Re-financing objectives were met successfully • $1.4 Billion Senior Notes continue at attractive coupon • New Credit Agreement done on time – Provides sufficient liquidity at significantly higher LME prices. – Financial Covenants “Light” – Lower interest rate • Re-financing completed
Slide 27: Summing Up
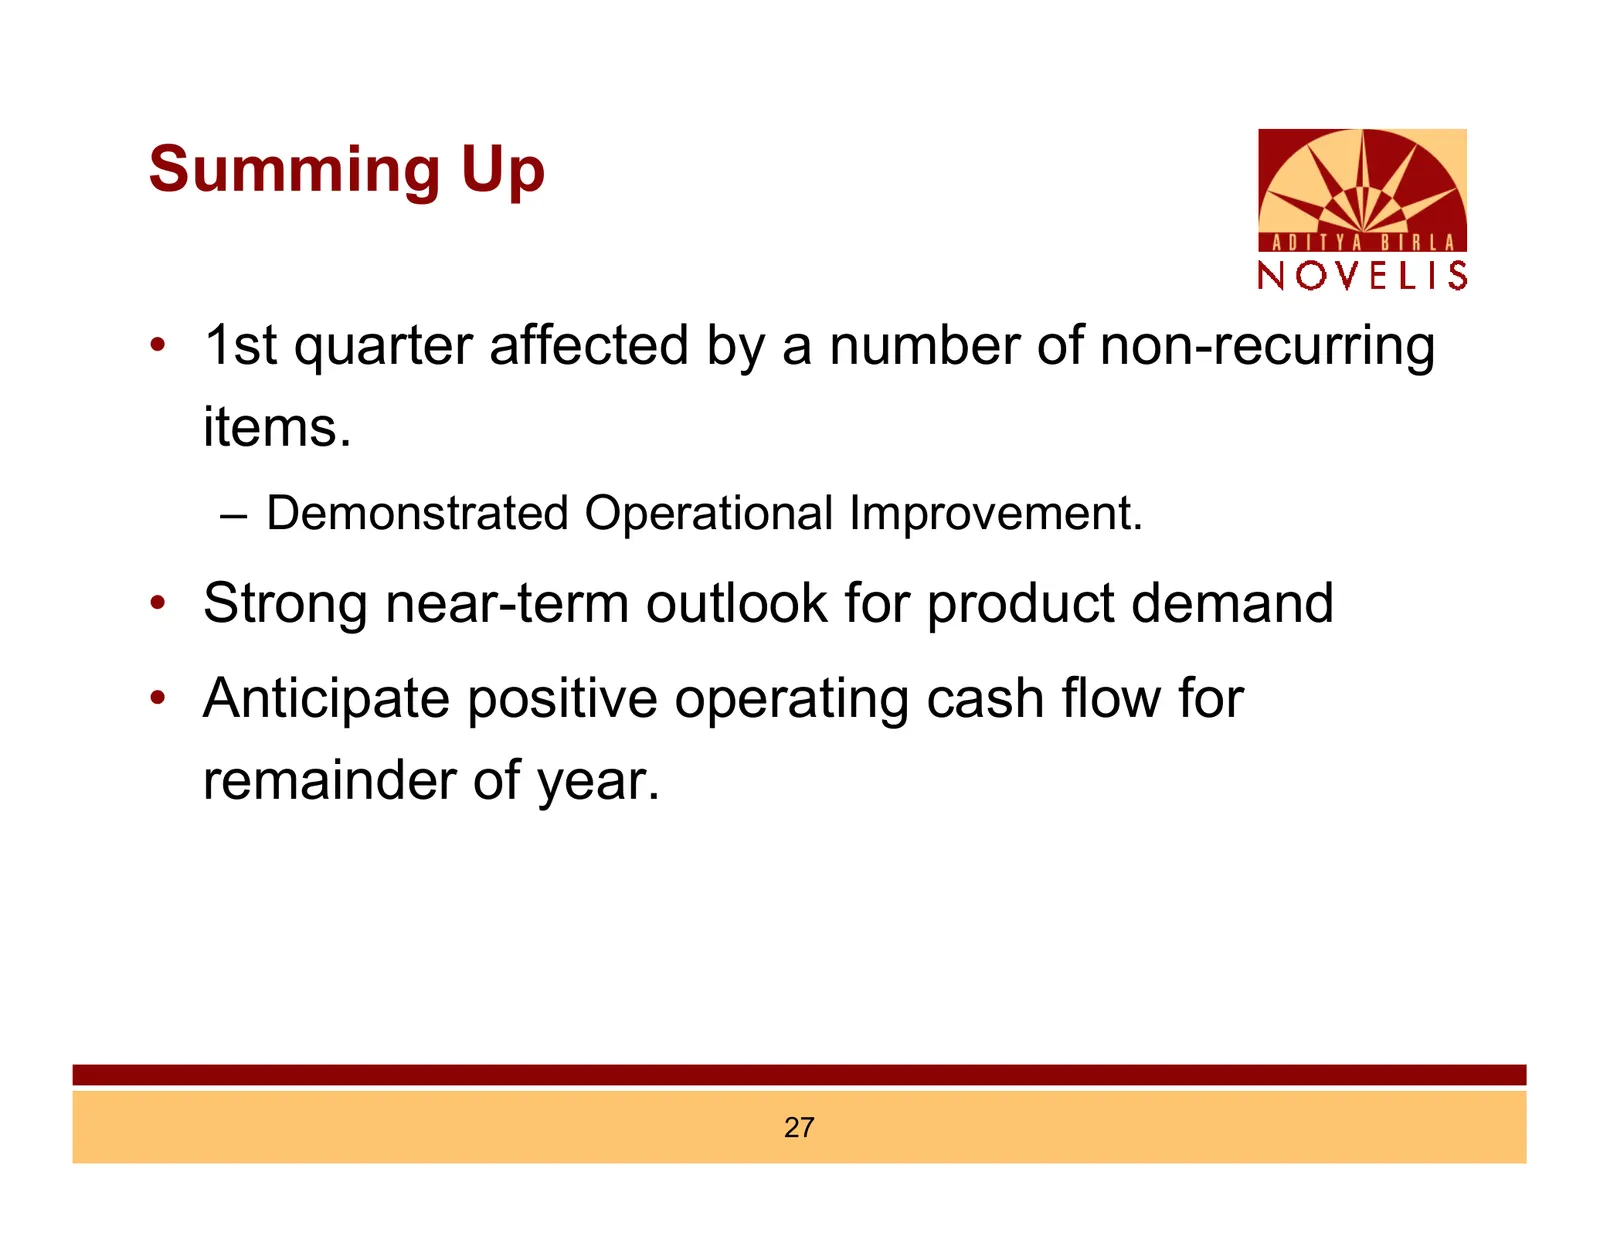
Summing Up • 1st quarter affected by a number of non-recurring items. – Demonstrated Operational Improvement. • Strong near-term outlook for product demand • Anticipate positive operating cash flow for remainder of year. 27

Slide 28: NOVELIS
NOVELIS
Source: Internet Archive copy of hindalco.com
More decks from Novelis Inc.
 Q2 FY2027 Earnings Presentation20 slides · Nov 5, 2026
 Q2 FY2027 Earnings Presentation31 slides · Nov 5, 2026
 Q1 FY2027 Earnings Presentation21 slides · Aug 5, 2026
 Q1 FY2027 Earnings Presentation31 slides · Aug 5, 2026
 Q4 FY2026 Earnings Presentation33 slides · May 19, 2026
 Q3 FY2026 Earnings Presentation33 slides · Feb 11, 2026