Perion Network Ltd · NASDAQ:PERI
Perion Network — Q2 2012 Earnings Presentation
21 slides from Perion Network's earnings presentation, August 2012
Slide 1: Investor Presentation
Investor Presentation August 2012
Slide 2: Safe Harbor Statement
Safe Harbor Statement This presentation contains historical information and forward-looking statements within the meaning of The Private Securities Litigation Reform Act of 1995 with respect to the business, financial condition and results of operations of the Company. The words “believe,” “expect,”
Slide 3: Investment Overview
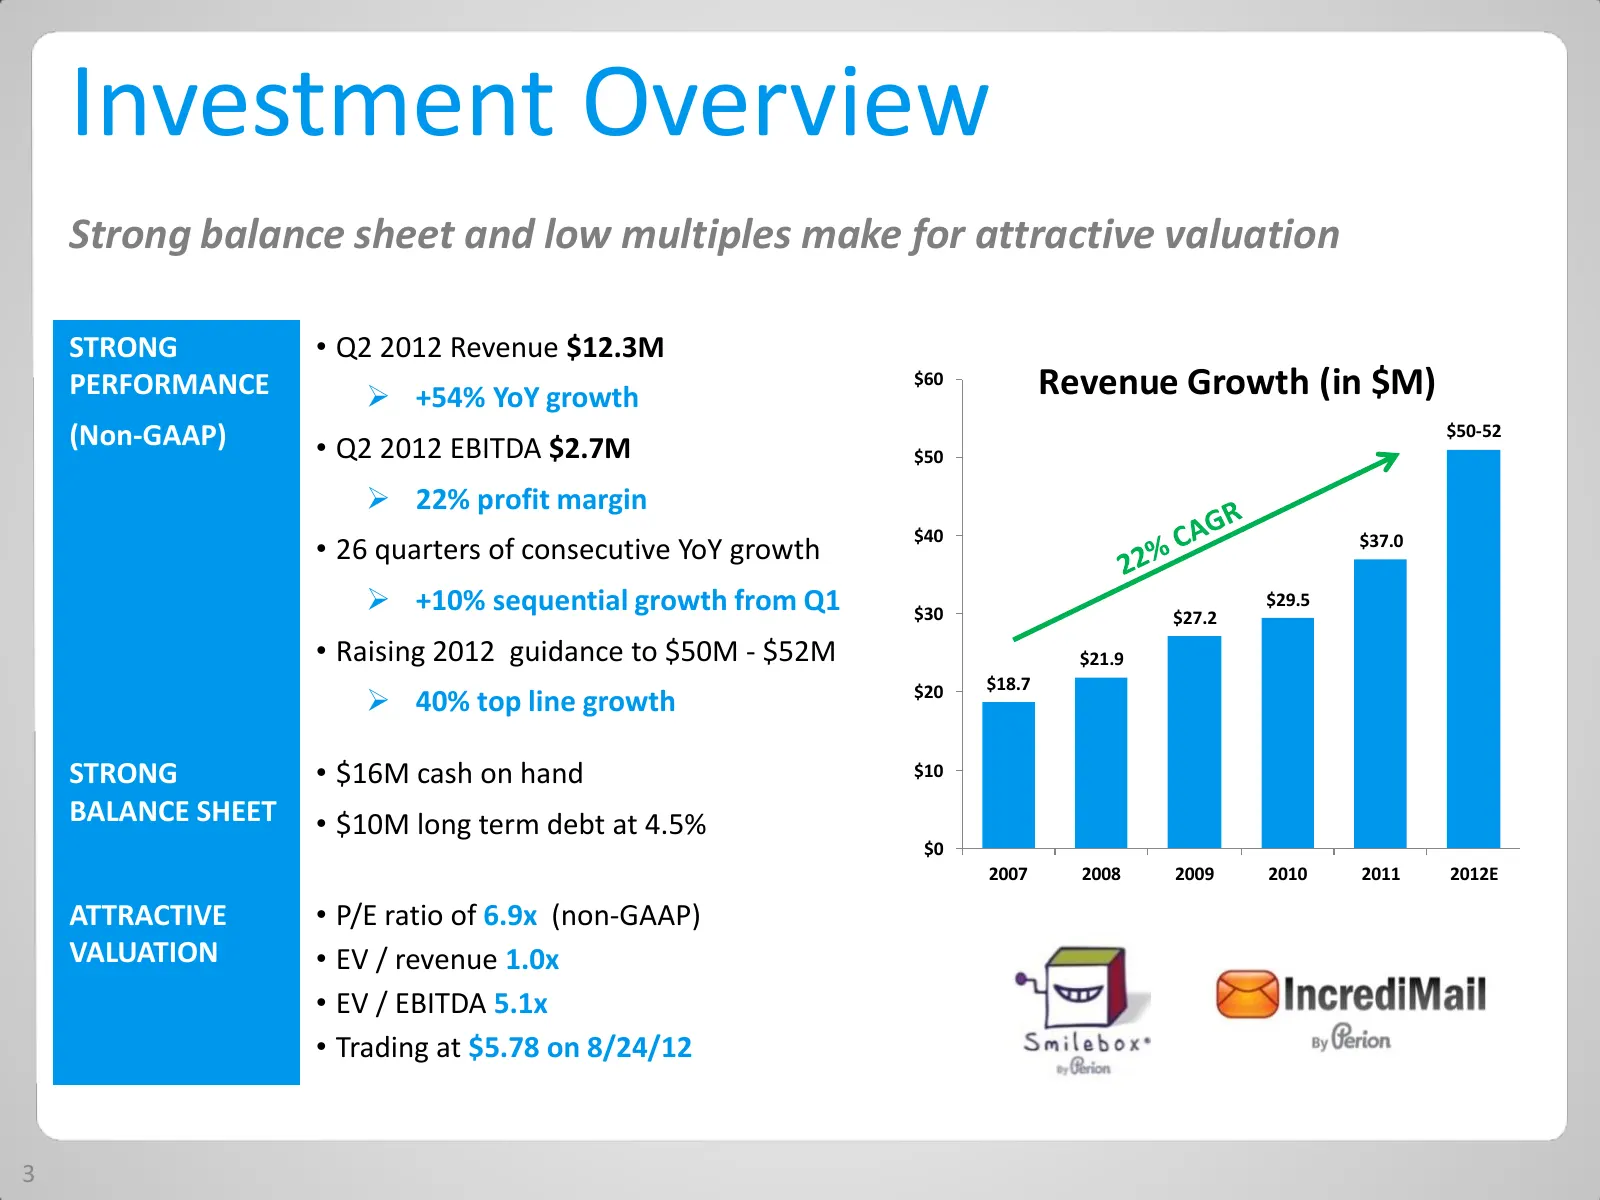
Investment Overview Strong balance sheet and low multiples make for attractive valuation STRONG • Q2 2012 Revenue $12.3M PERFORMANCE +54% YoY growth $60 Revenue Growth (in $M) (Non-GAAP) • Q2 2012 EBITDA $2.7M $50-52 $50 22% profit margin $40 • 26 quarters of consecutive YoY growth $37.0 +10%
Slide 4: What We Do
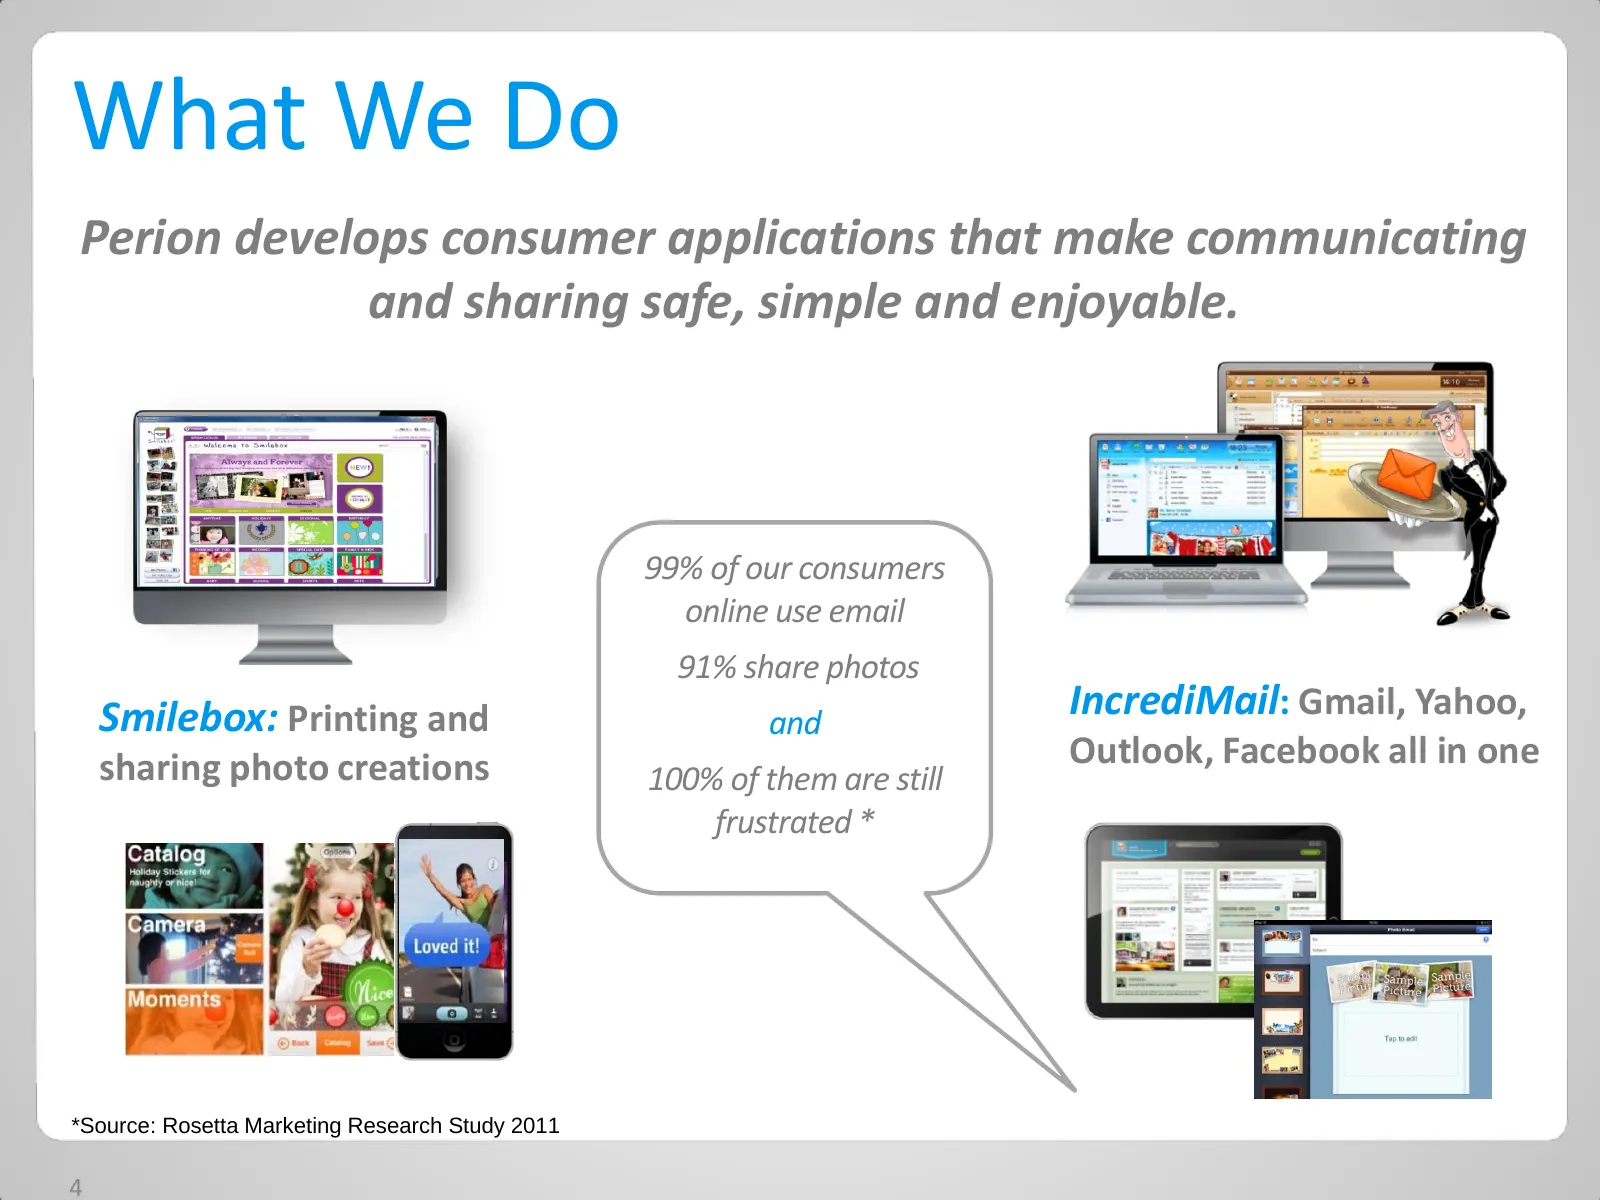
What We Do Perion develops consumer applications that make communicating and sharing safe, simple and enjoyable. 99% of our consumers online use email 91% share photos Smilebox: Printing and and IncrediMail: Gmail, Yahoo, sharing photo creations Outlook, Facebook all in one 100% of them are still fr
Slide 5: Our IncrediMail Product
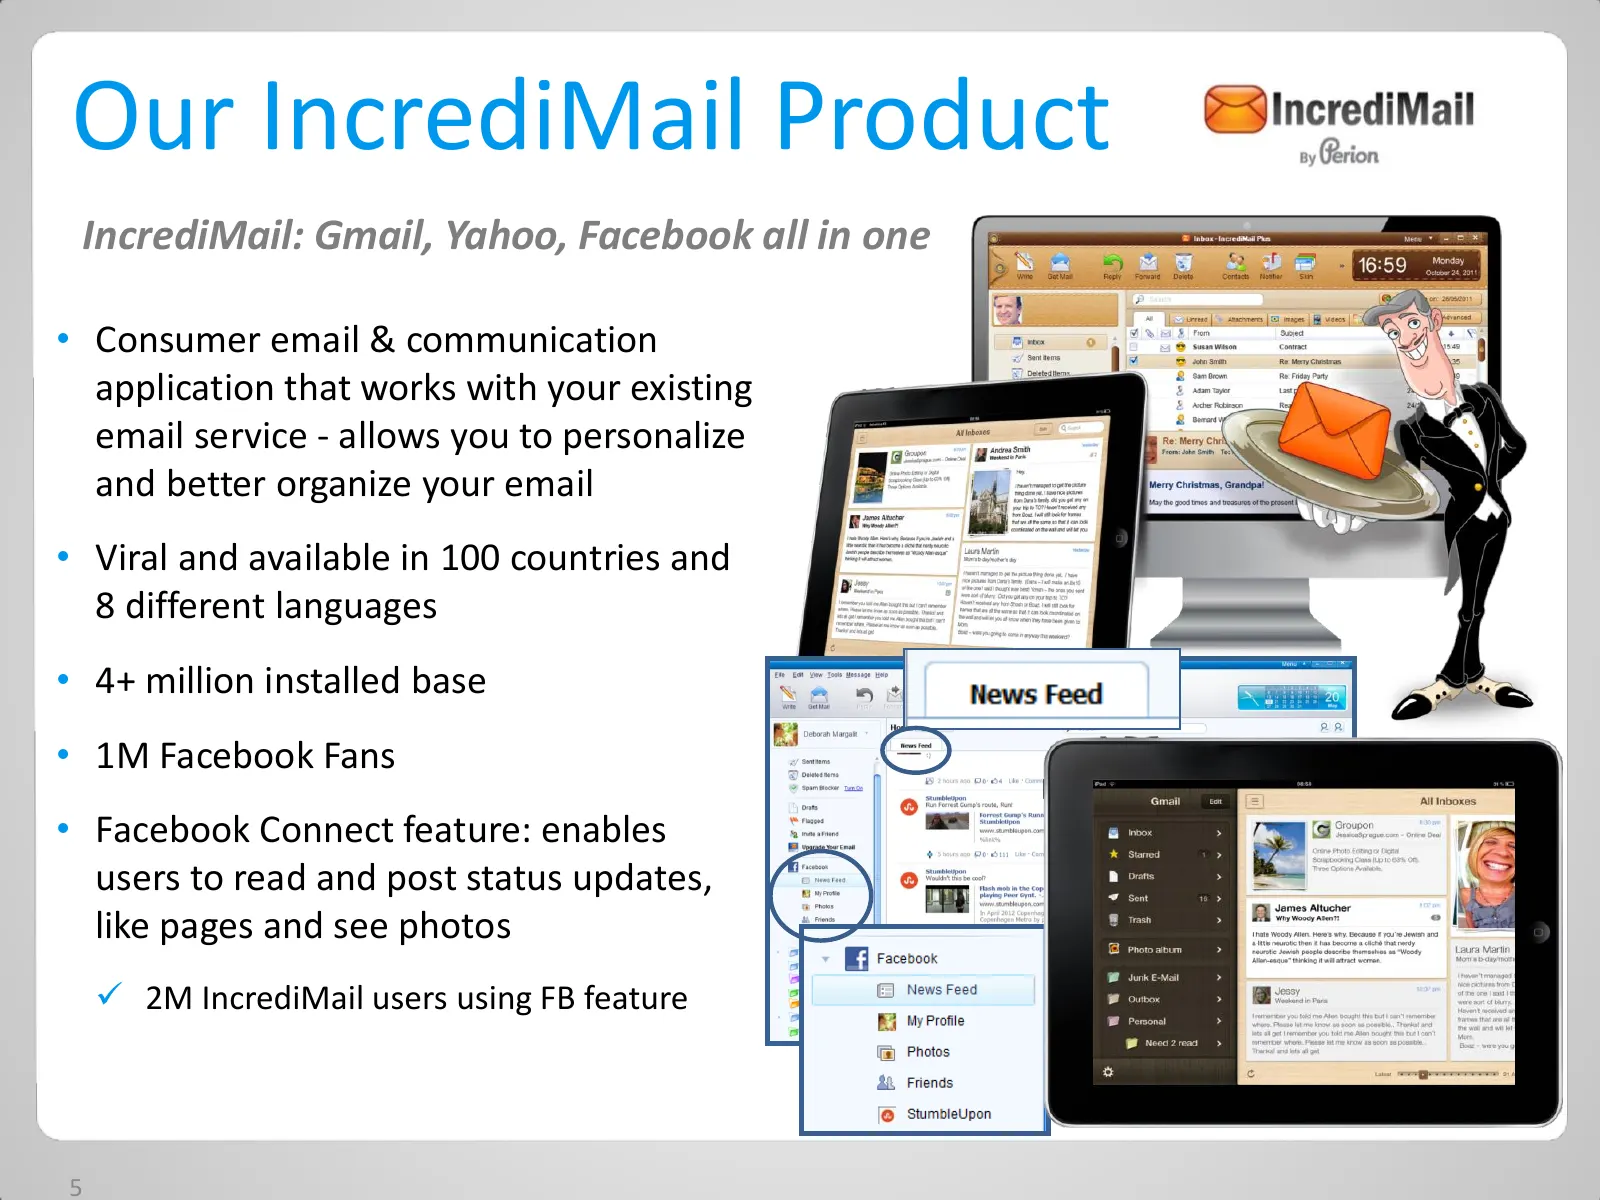
Our IncrediMail Product IncrediMail: Gmail, Yahoo, Facebook all in one • Consumer email & communication application that works with your existing email service - allows you to personalize and better organize your email • Viral and available in 100 countries and 8 different languages • 4+ million ins
Slide 6: Our Smilebox Product
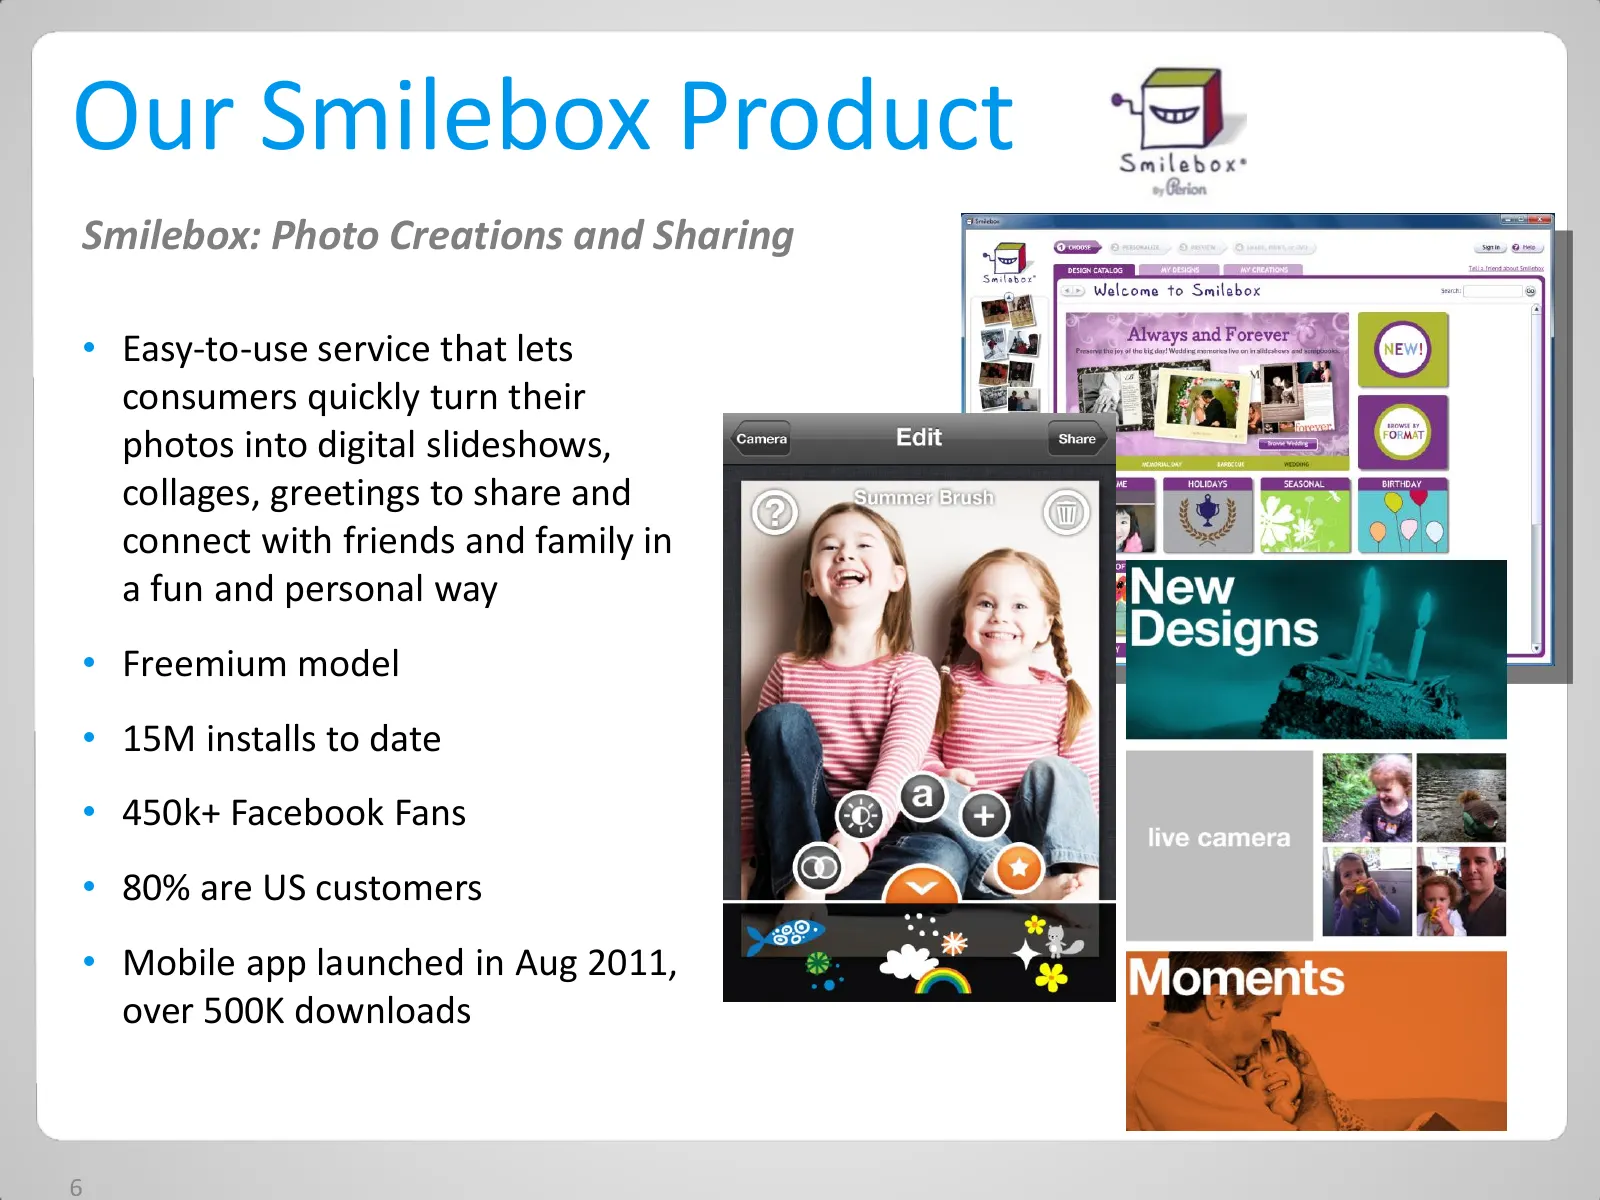
Our Smilebox Product Smilebox: Photo Creations and Sharing • Easy-to-use service that lets consumers quickly turn their photos into digital slideshows, collages, greetings to share and connect with friends and family in a fun and personal way • Freemium model • 15M installs to date • 450k+ Facebook
Slide 7: Our Primary Consumer: Second Wave Adopters
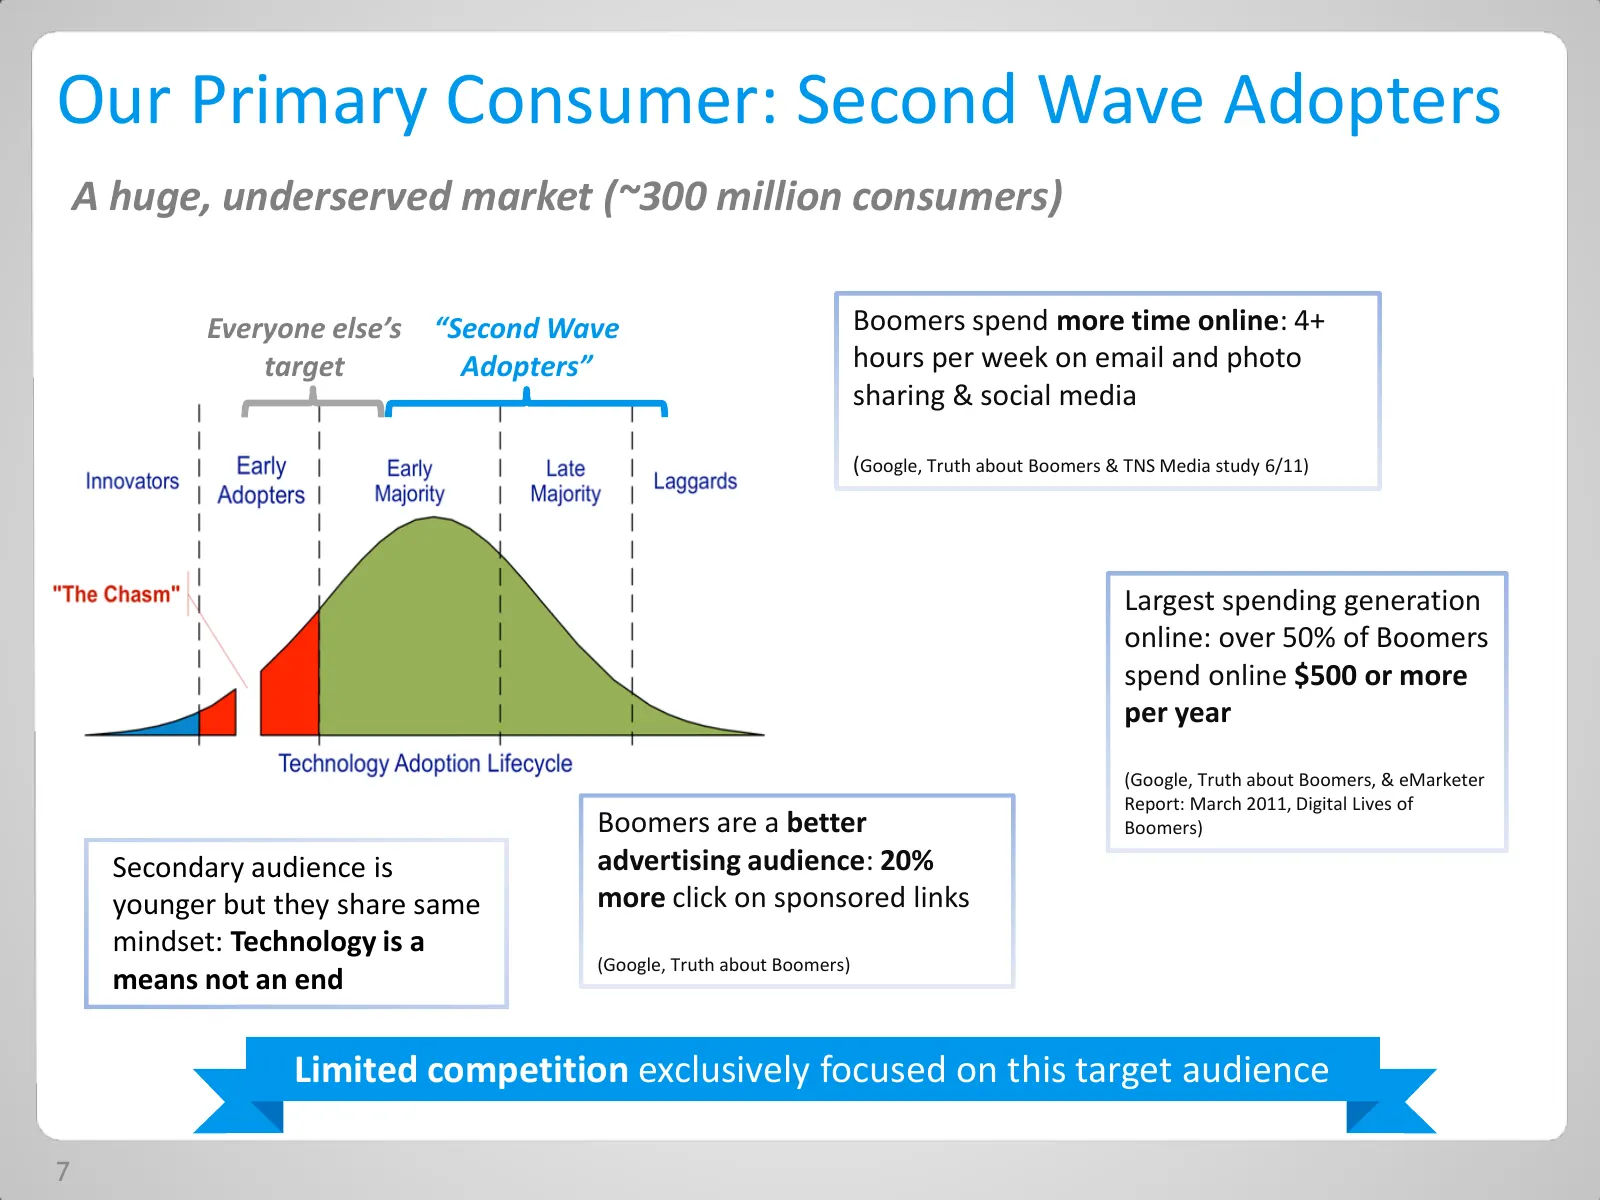
Our Primary Consumer: Second Wave Adopters A huge, underserved market (~300 million consumers) Everyone else’s “Second Wave Boomers spend more time online: 4+ target Adopters” hours per week on email and photo sharing & social media (Google, Truth about Boomers & TNS Media study 6/11) Largest spendi
Slide 8: Our Business Model: Freemium
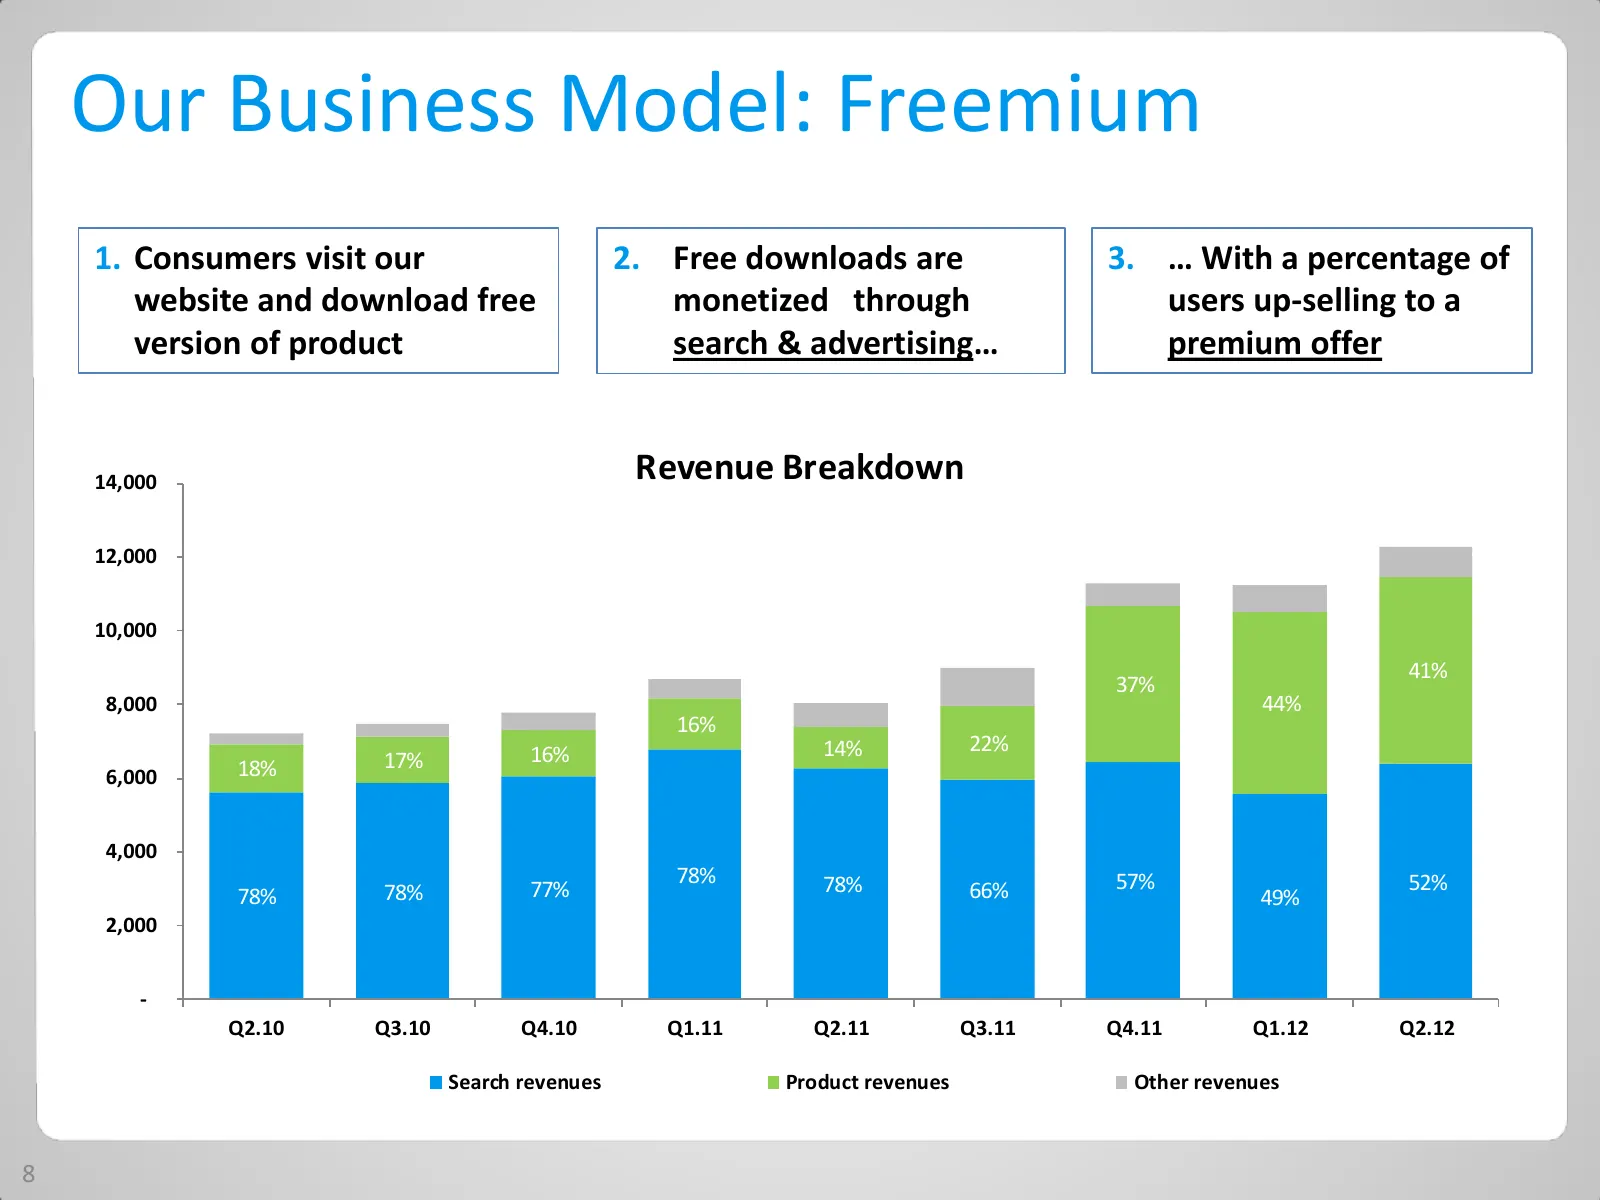
Our Business Model: Freemium 1. Consumers visit our 2. Free downloads are 3. … With a percentage of website and download free monetized through users up-selling to a version of product search & advertising… premium offer 14,000 Revenue Breakdown 12,000 10,000 41% 37% 8,000 44% 16% 16% 14% 22% 18% 17
Slide 9: Advertising & Search: How Does It Work?
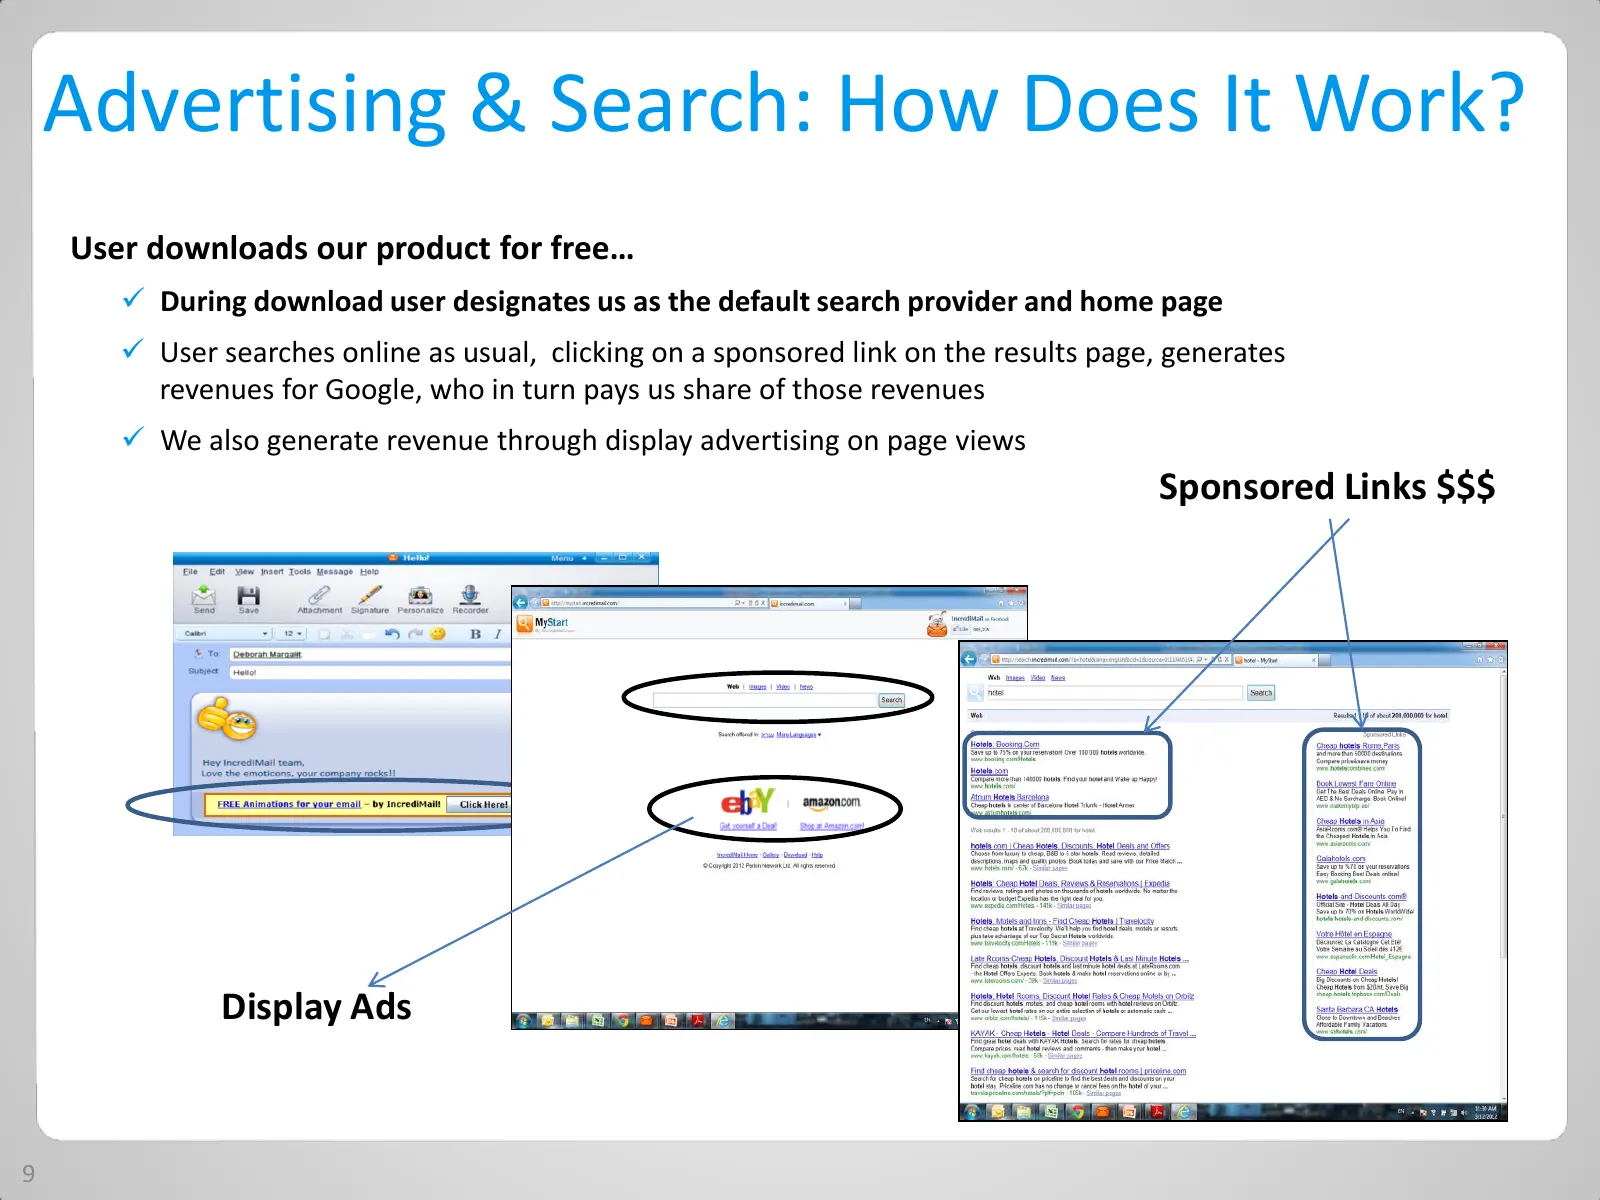
Advertising & Search: How Does It Work? User downloads our product for free… During download user designates us as the default search provider and home page User searches online as usual, clicking on a sponsored link on the results page, generates revenues for Google, who in turn pays us share o
Slide 10: Premium: What Is It?
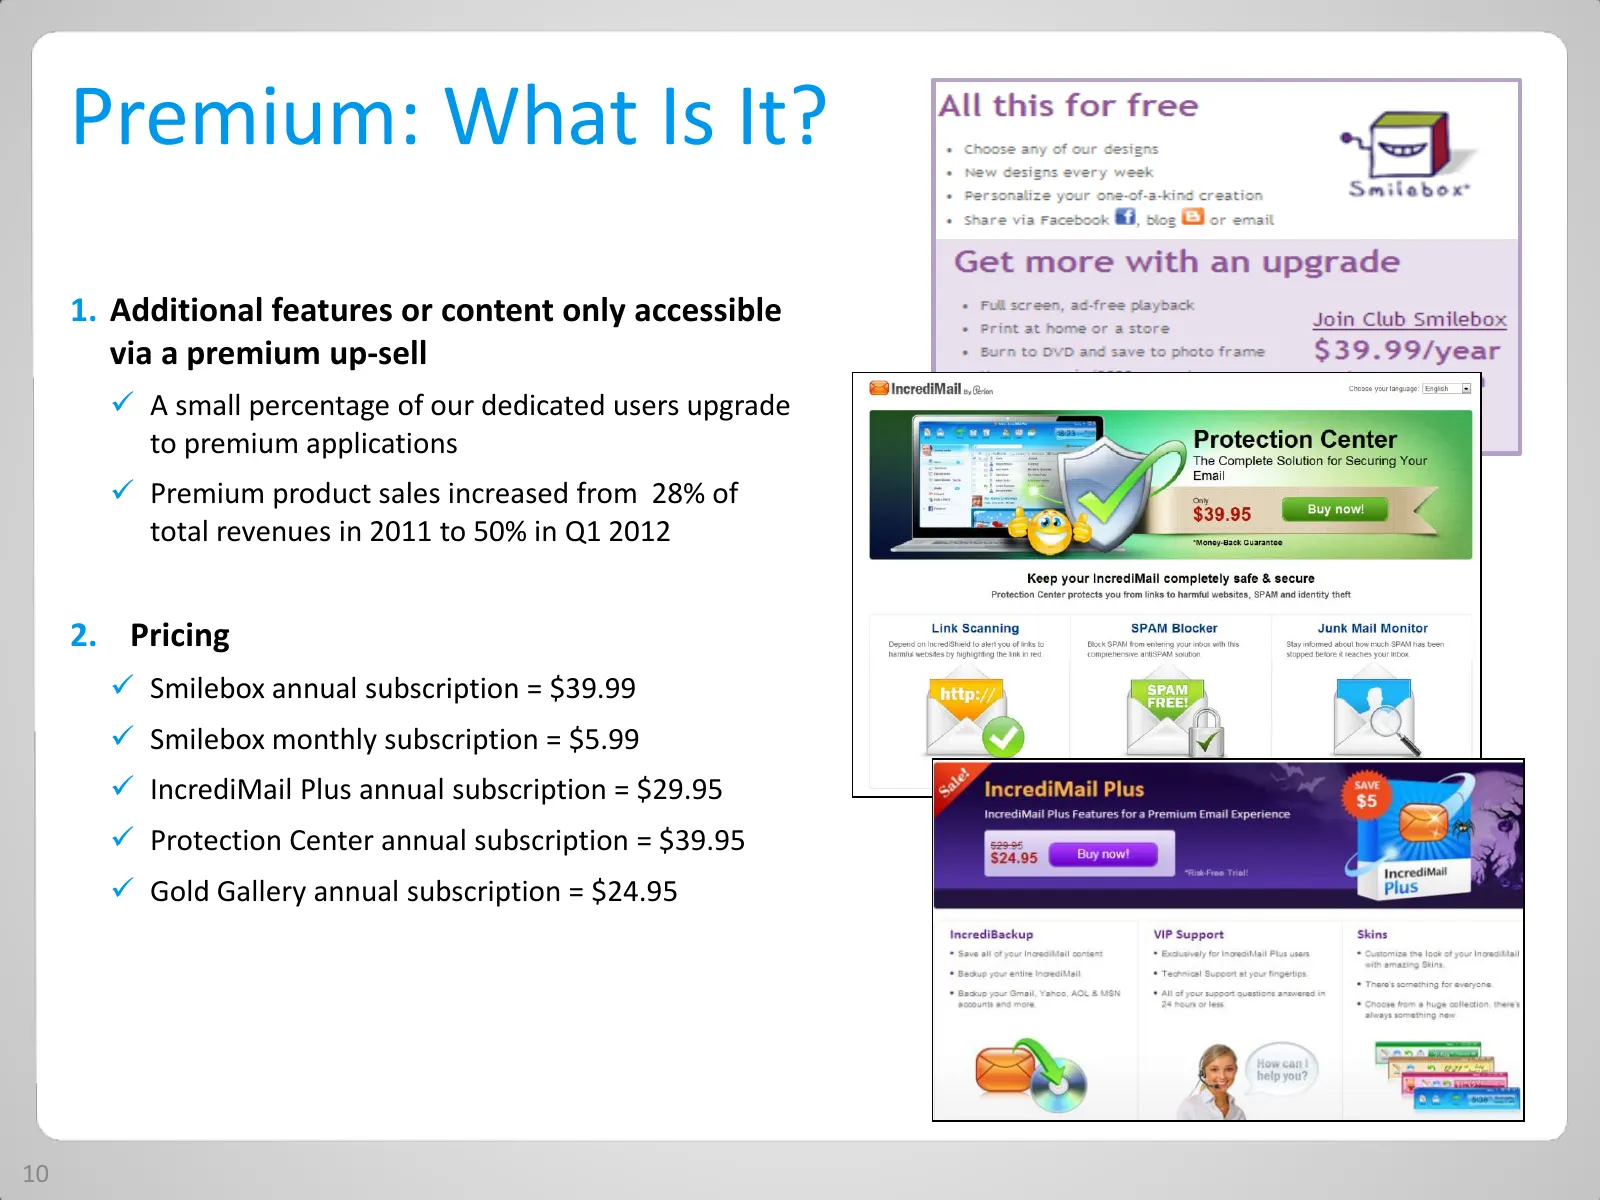
Premium: What Is It? 1. Additional features or content only accessible via a premium up-sell A small percentage of our dedicated users upgrade to premium applications Premium product sales increased from 28% of total revenues in 2011 to 50% in Q1 2012 2. Pricing Smilebox annual subscription =
Slide 11: Growth Catalysts
Growth Catalysts We see several growth engines that will drive growth in the near future: • Continuing growth of our search revenue • Extensions of our products on new platforms – especially tablets • Additional successful and accretive acquisitions 11
Slide 12: Search Query & Revenue Trend
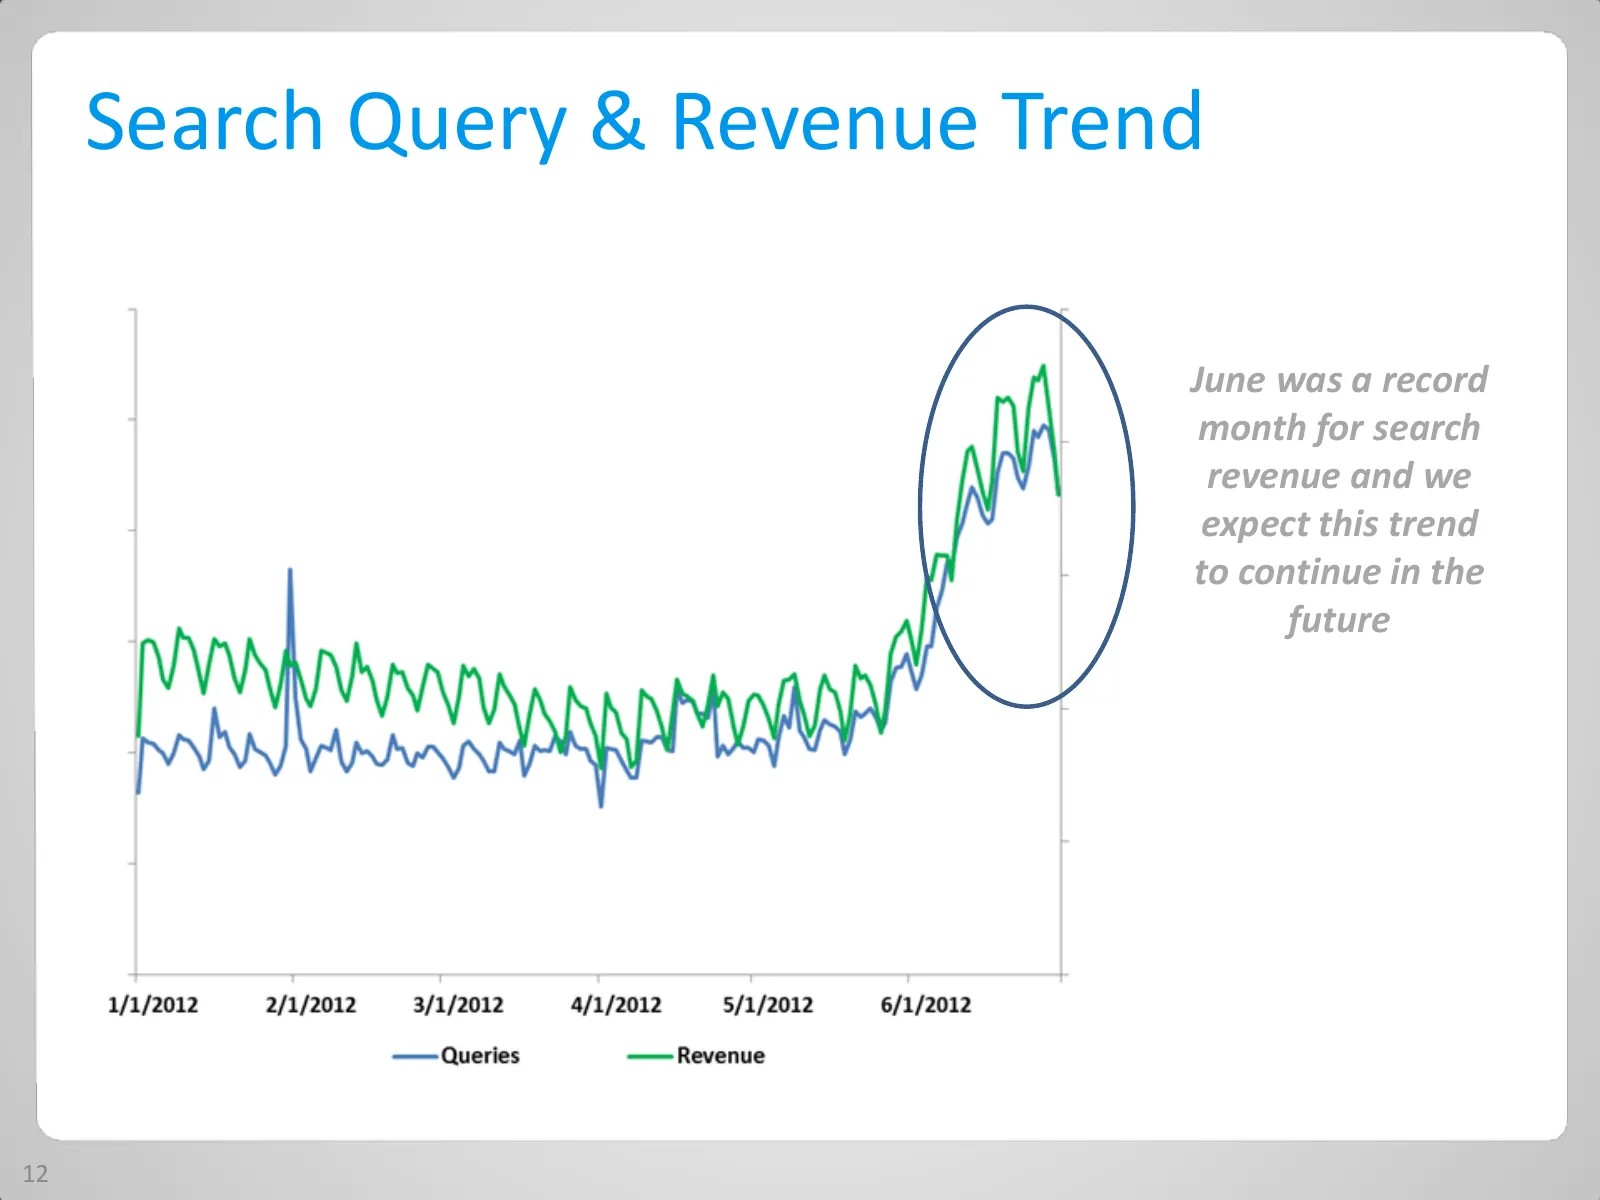
Search Query & Revenue Trend June was a record month for search revenue and we expect this trend to continue in the future 12
Slide 13: Impact of Improved Systems
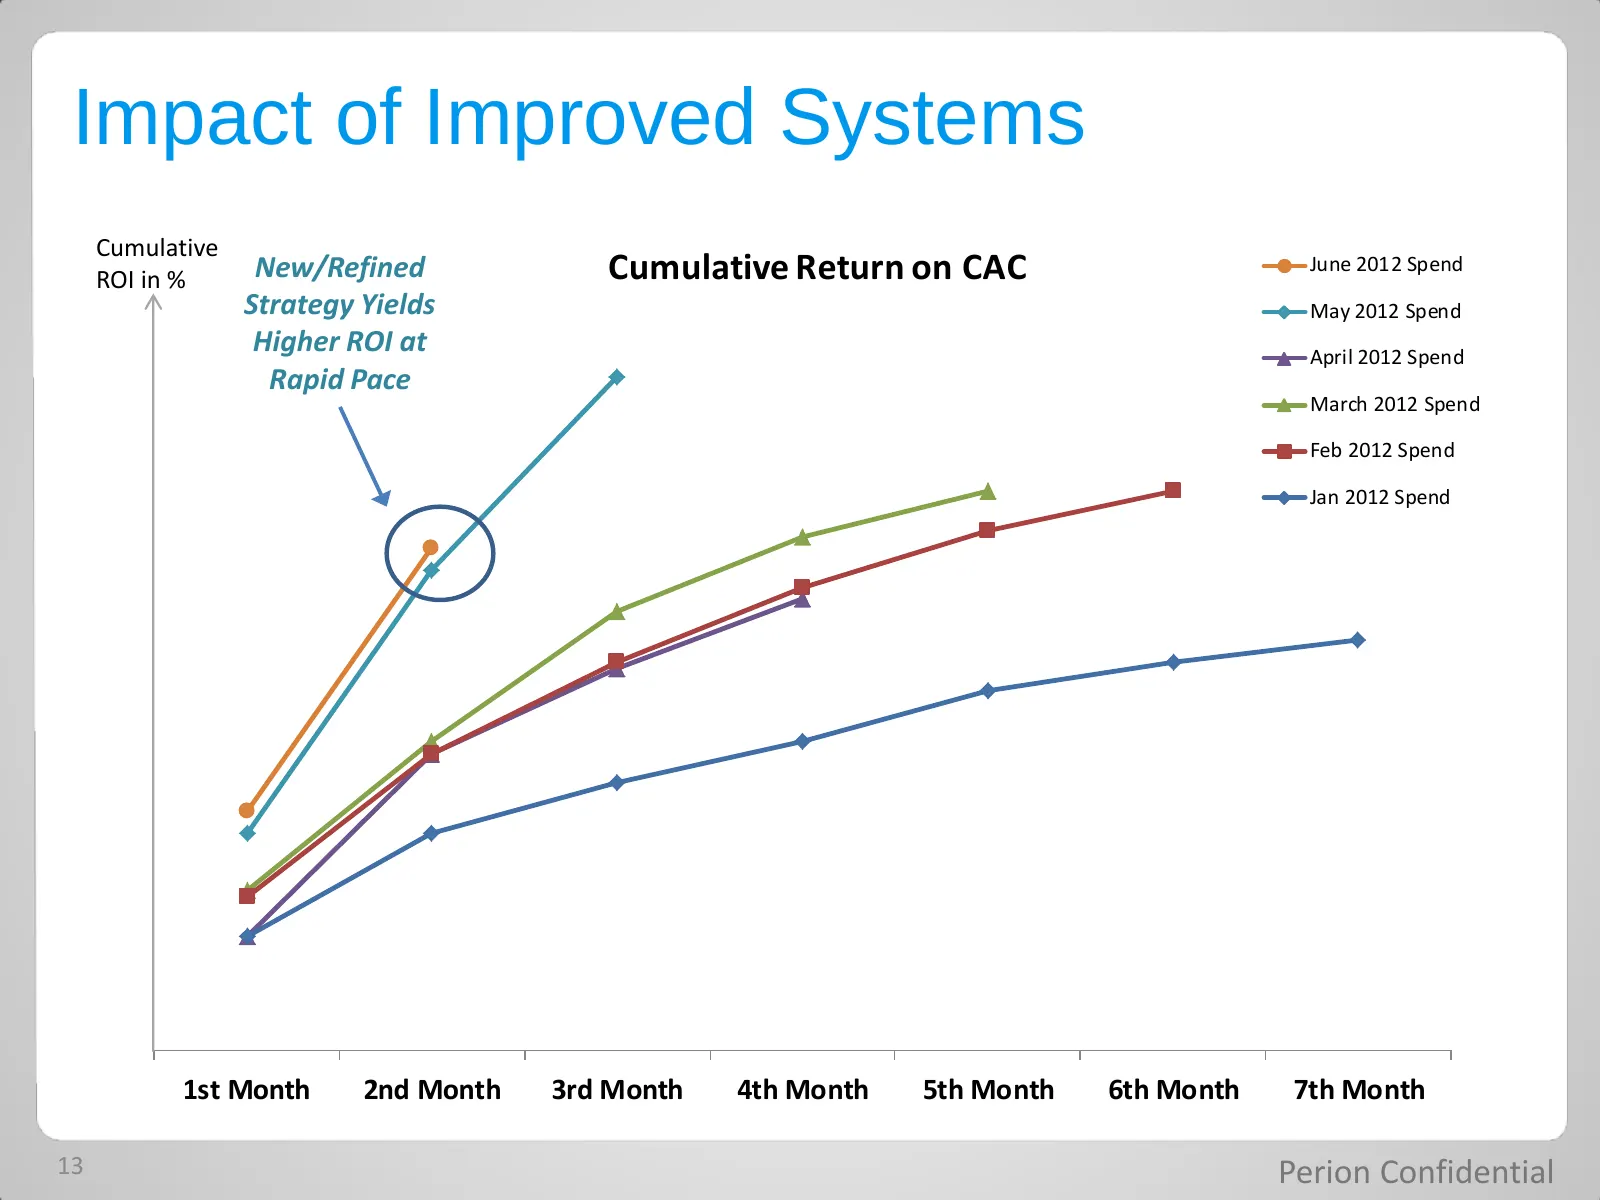
Impact of Improved Systems Cumulative ROI in % New/Refined Cumulative Return on CAC June 2012 Spend Strategy Yields May 2012 Spend Higher ROI at April 2012 Spend Rapid Pace March 2012 Spend Feb 2012 Spend Jan 2012 Spend 1st Month 2nd Month 3rd Month 4th Month 5th Month 6th Month 7th Month 13 Perion
Slide 14: Growing Opportunities: Mobile
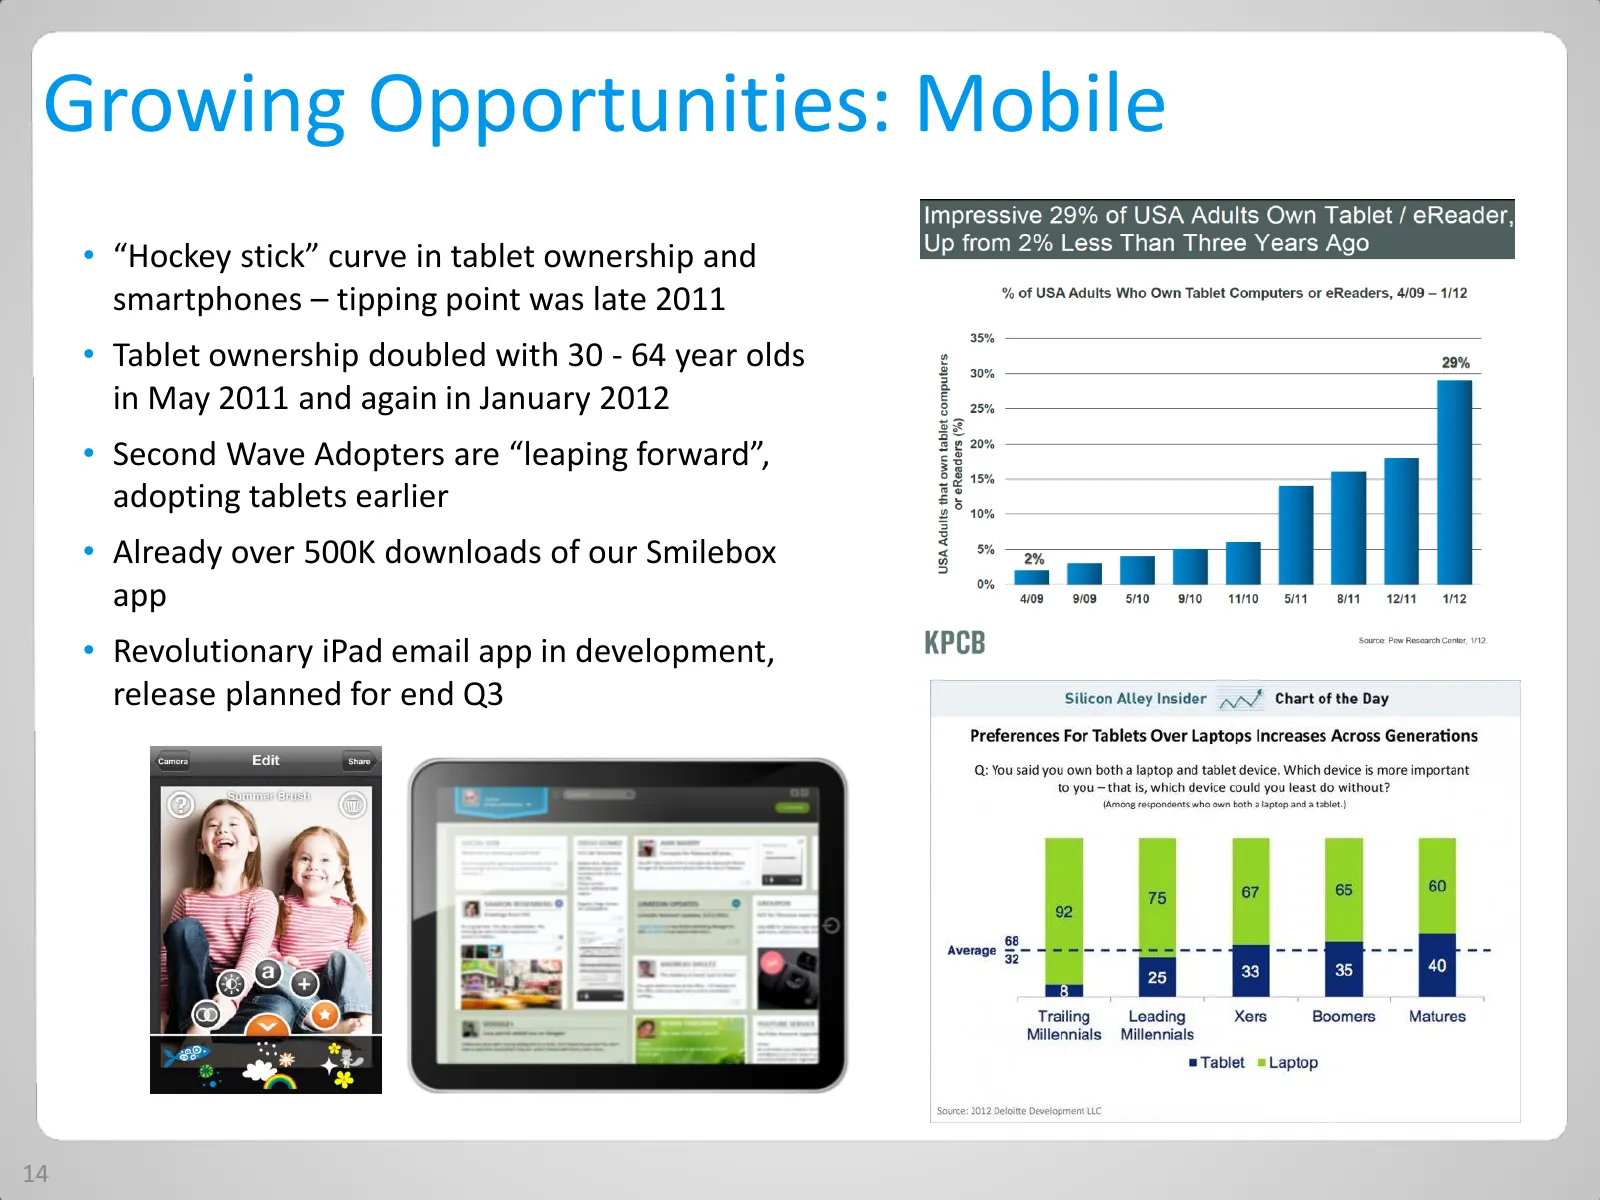
Growing Opportunities: Mobile • “Hockey stick” curve in tablet ownership and smartphones – tipping point was late 2011 • Tablet ownership doubled with 30 - 64 year olds in May 2011 and again in January 2012 • Second Wave Adopters are “leaping forward”, adopting tablets earlier • Already over 500K do
Slide 15: Growth through Acquisitions
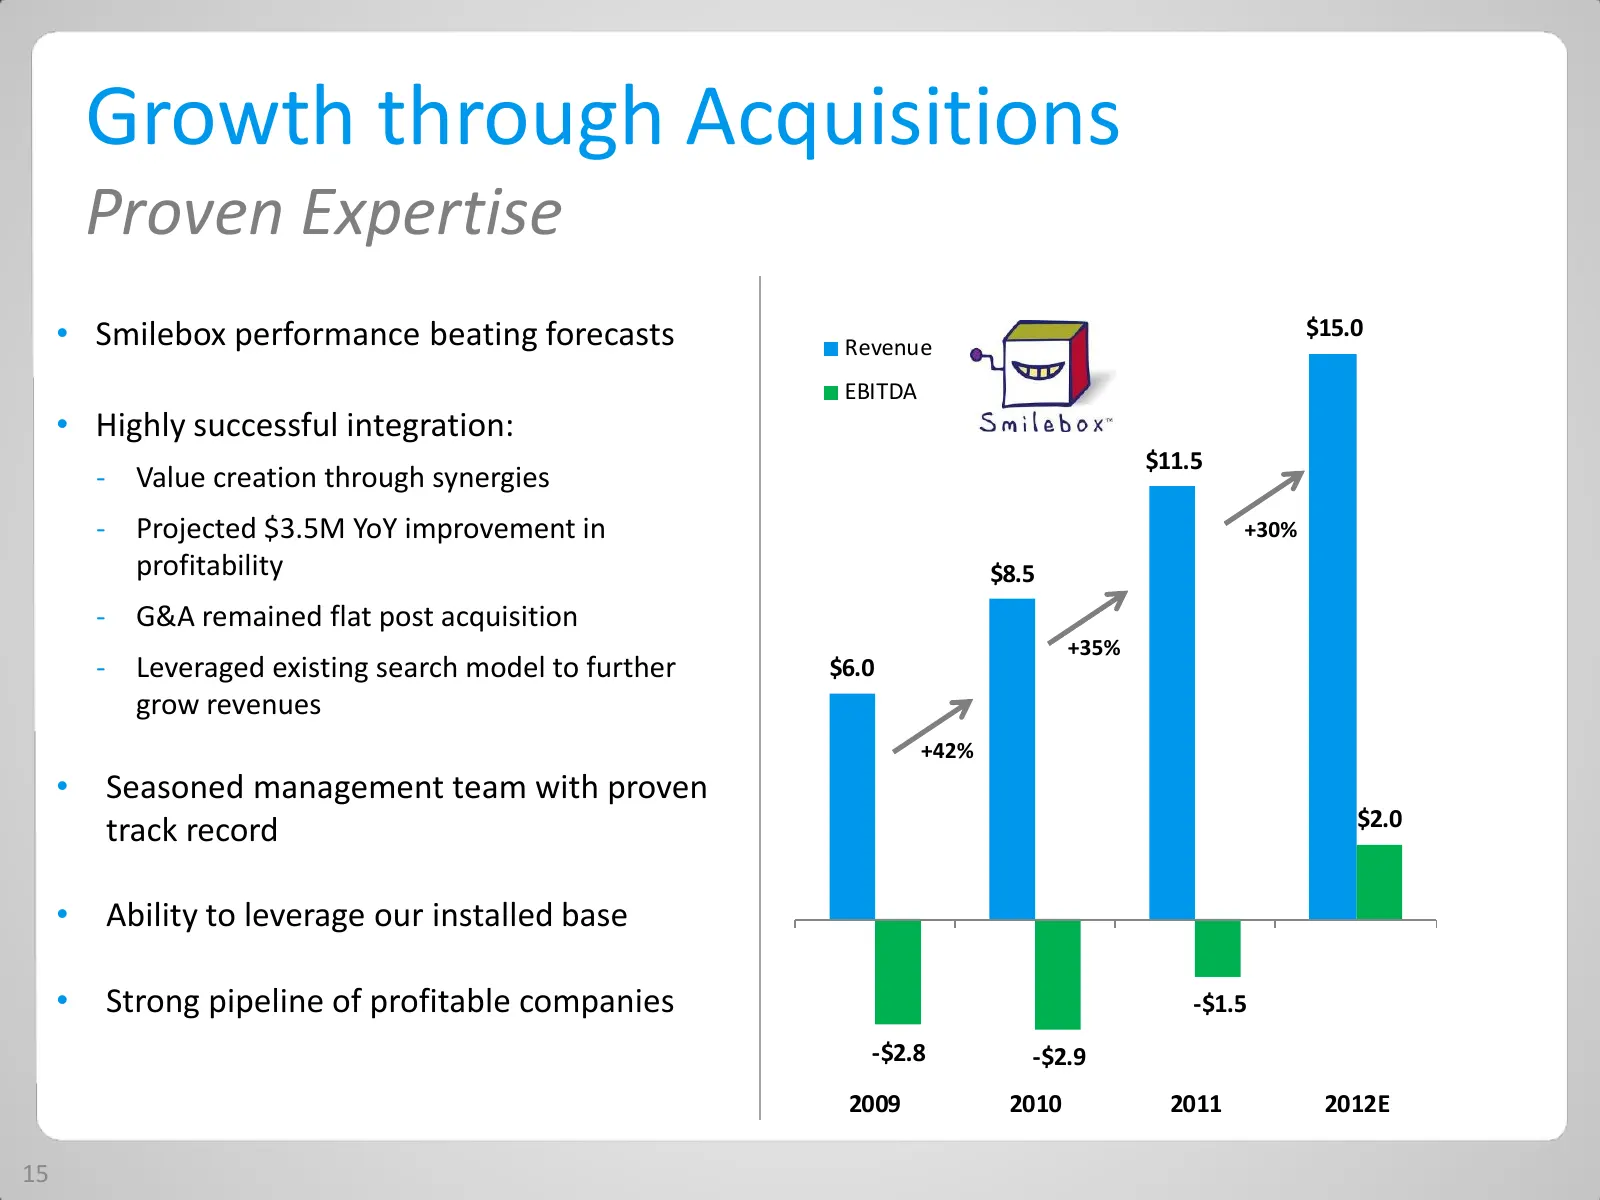
Growth through Acquisitions Proven Expertise • Smilebox performance beating forecasts Revenue $15.0 EBITDA • Highly successful integration: $11.5 ‐ Value creation through synergies ‐ Projected $3.5M YoY improvement in +30% profitability $8.5 ‐ G&A remained flat post acquisition +35% ‐ Leveraged exis
Slide 16: Financial Highlights Non-GAAP
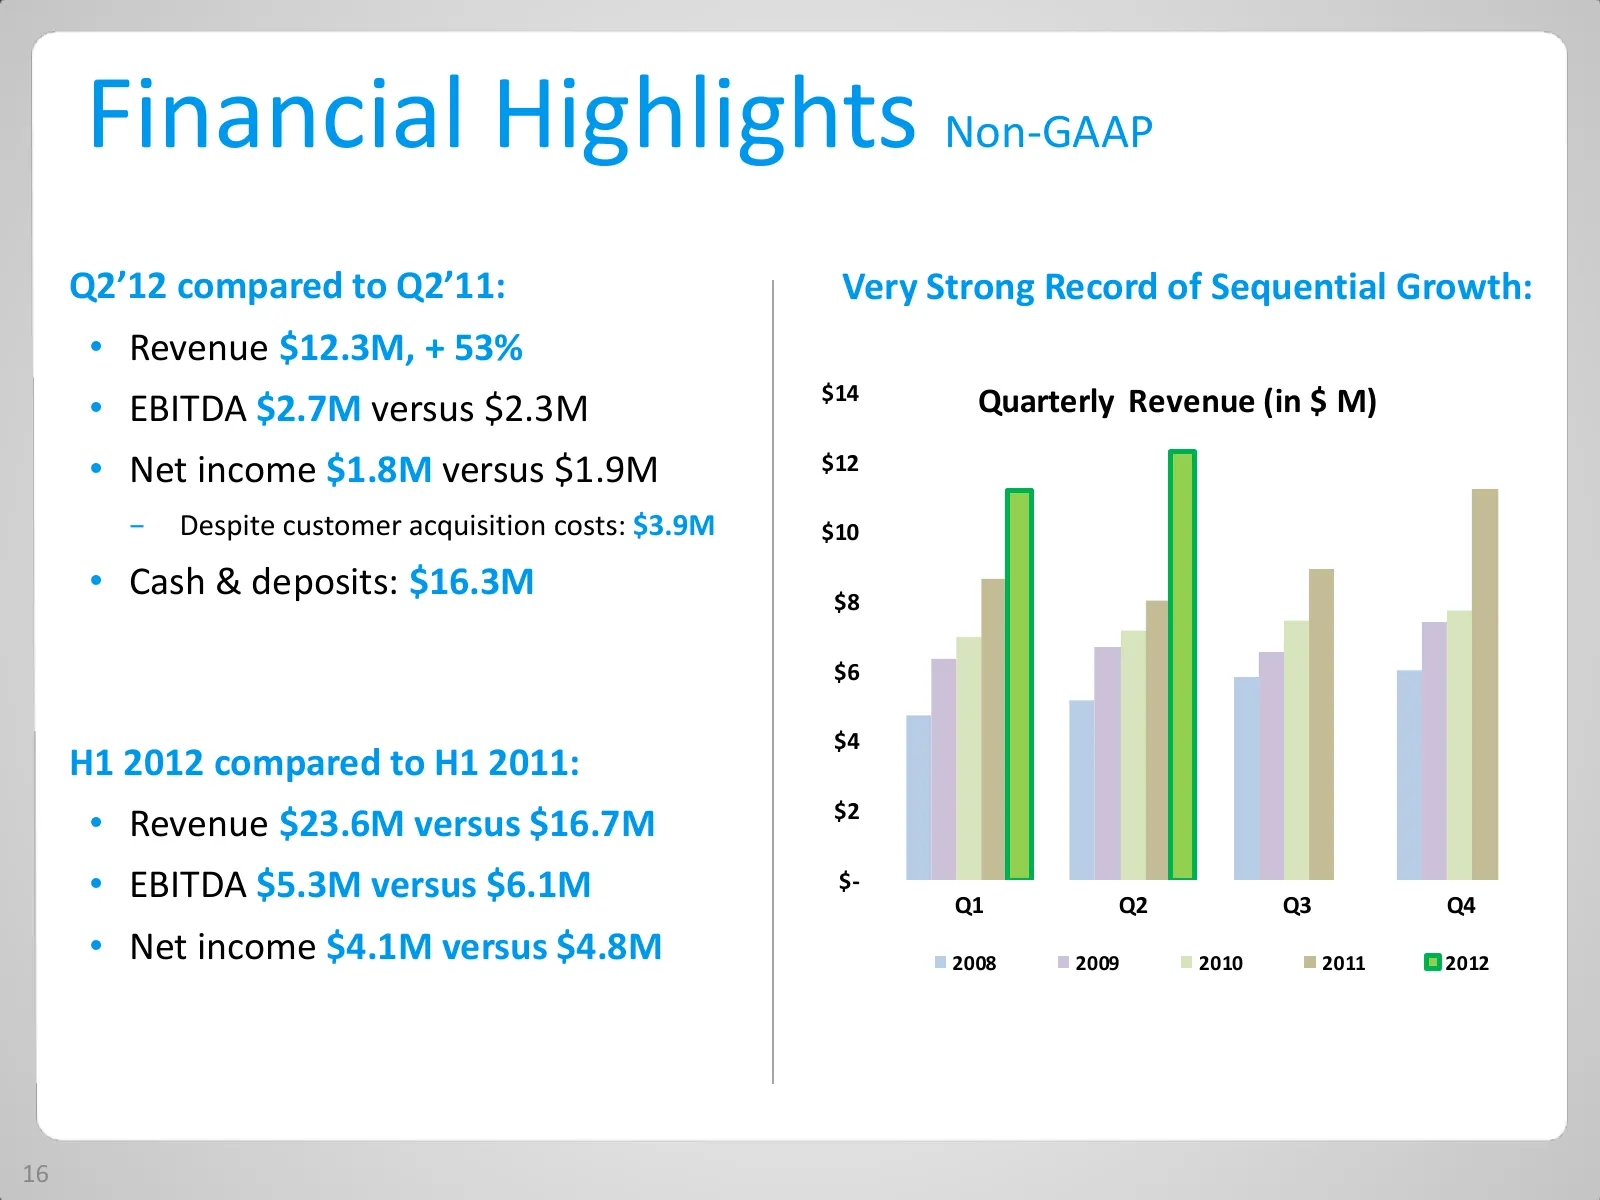
Financial Highlights Non-GAAP Q2’12 compared to Q2’11: Very Strong Record of Sequential Growth: • Revenue $12.3M, + 53% $14 • EBITDA $2.7M versus $2.3M Quarterly Revenue (in $ M) • Net income $1.8M versus $1.9M $12 − Despite customer acquisition costs: $3.9M $10 • Cash & deposits: $16.3M $8 $6 $4 H1
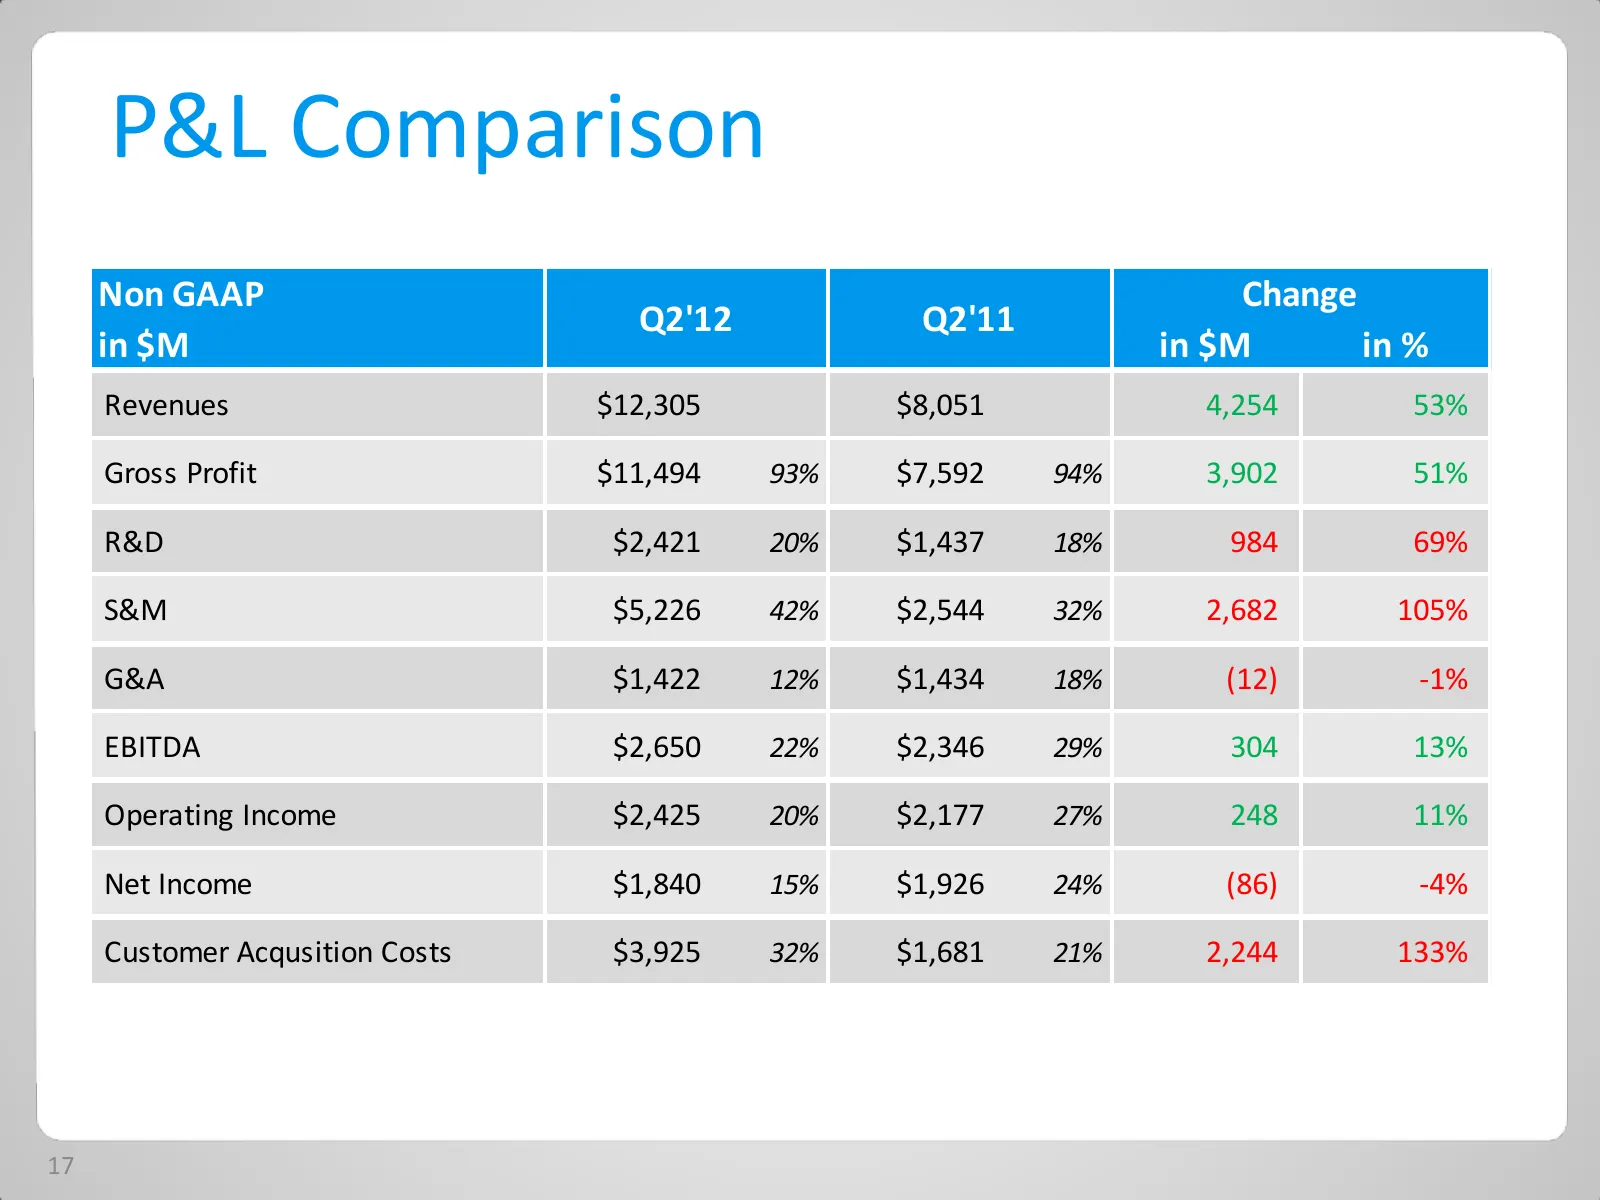
Slide 17: P&L Comparison
P&L Comparison Non GAAP Change Q2'12 Q2'11 in $M in $M in % Revenues $12,305 $8,051 4,254 53% Gross Profit $11,494 93% $7,592 94% 3,902 51% R&D $2,421 20% $1,437 18% 984 69% S&M $5,226 42% $2,544 32% 2,682 105% G&A $1,422 12% $1,434 18% (12) -1% EBITDA $2,650 22% $2,346 29% 304 13% Operating Income
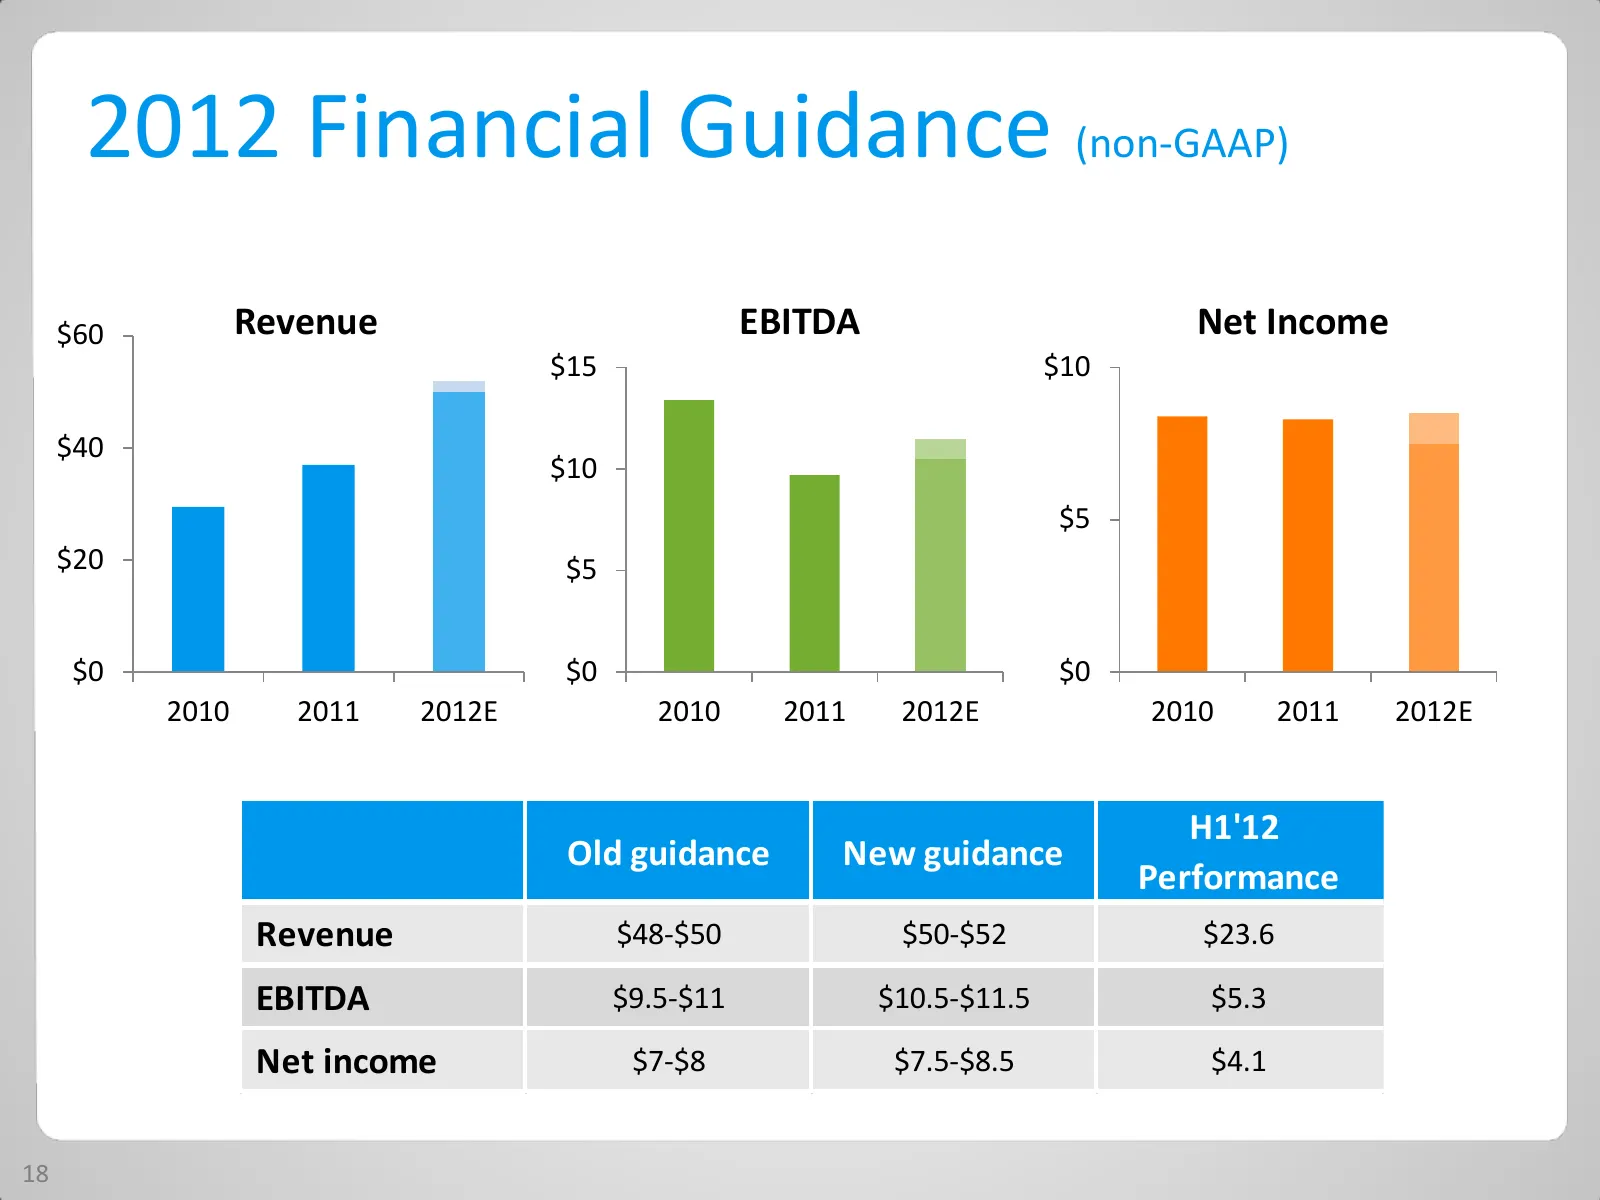
Slide 18: 2012 Financial Guidance (non-GAAP)
2012 Financial Guidance (non-GAAP) $60 Revenue EBITDA Net Income $15 $10 $40 $10 $5 $20 $5 $0 $0 $0 2010 2011 2012E 2010 2011 2012E 2010 2011 2012E H1'12 Old guidance New guidance Performance Revenue $48-$50 $50-$52 $23.6 EBITDA $9.5-$11 $10.5-$11.5 $5.3 Net income $7-$8 $7.5-$8.5 $4.1 18
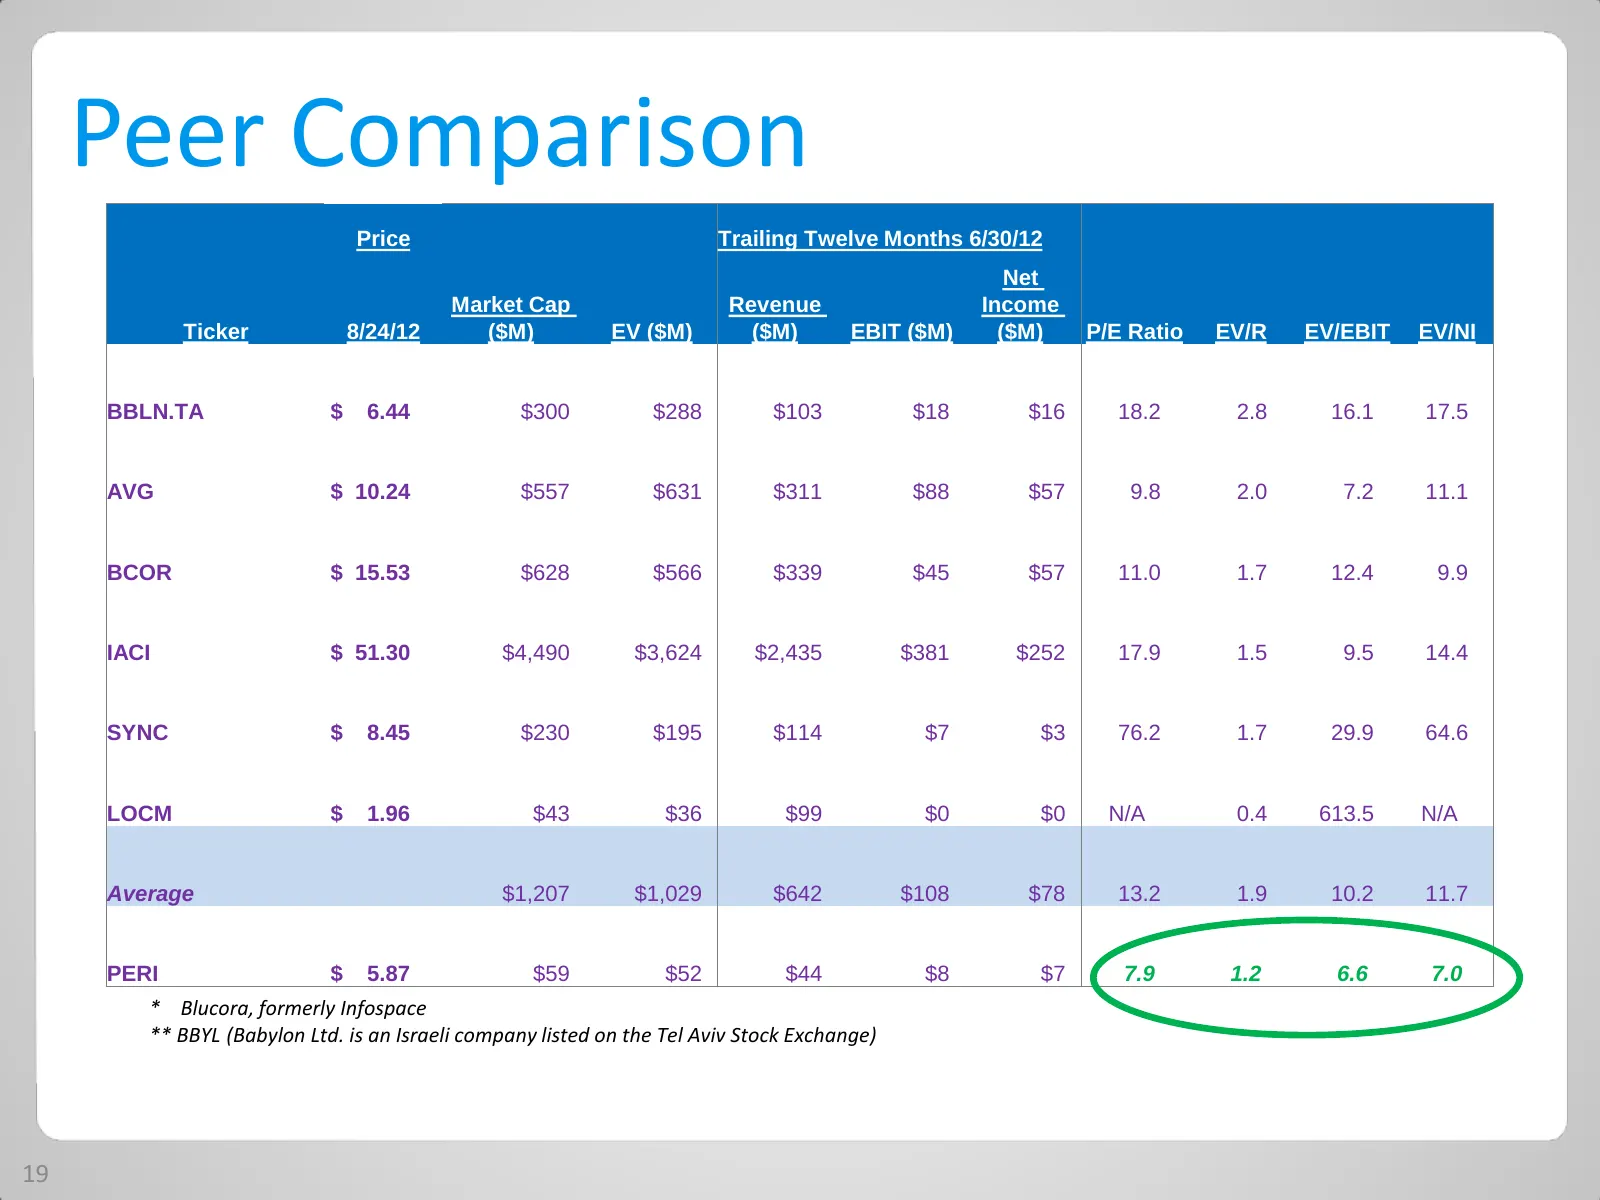
Slide 19: Peer Comparison
Peer Comparison Price Trailing Twelve Months 6/30/12 Net Market Cap Revenue Income Ticker 8/24/12 ($M) EV ($M) ($M) EBIT ($M) ($M) P/E Ratio EV/R EV/EBIT EV/NI BBLN.TA $ 6.44 $300 $288 $103 $18 $16 18.2 2.8 16.1 17.5 AVG $ 10.24 $557 $631 $311 $88 $57 9.8 2.0 7.2 11.1 BCOR $ 15.53 $628 $566 $339 $45
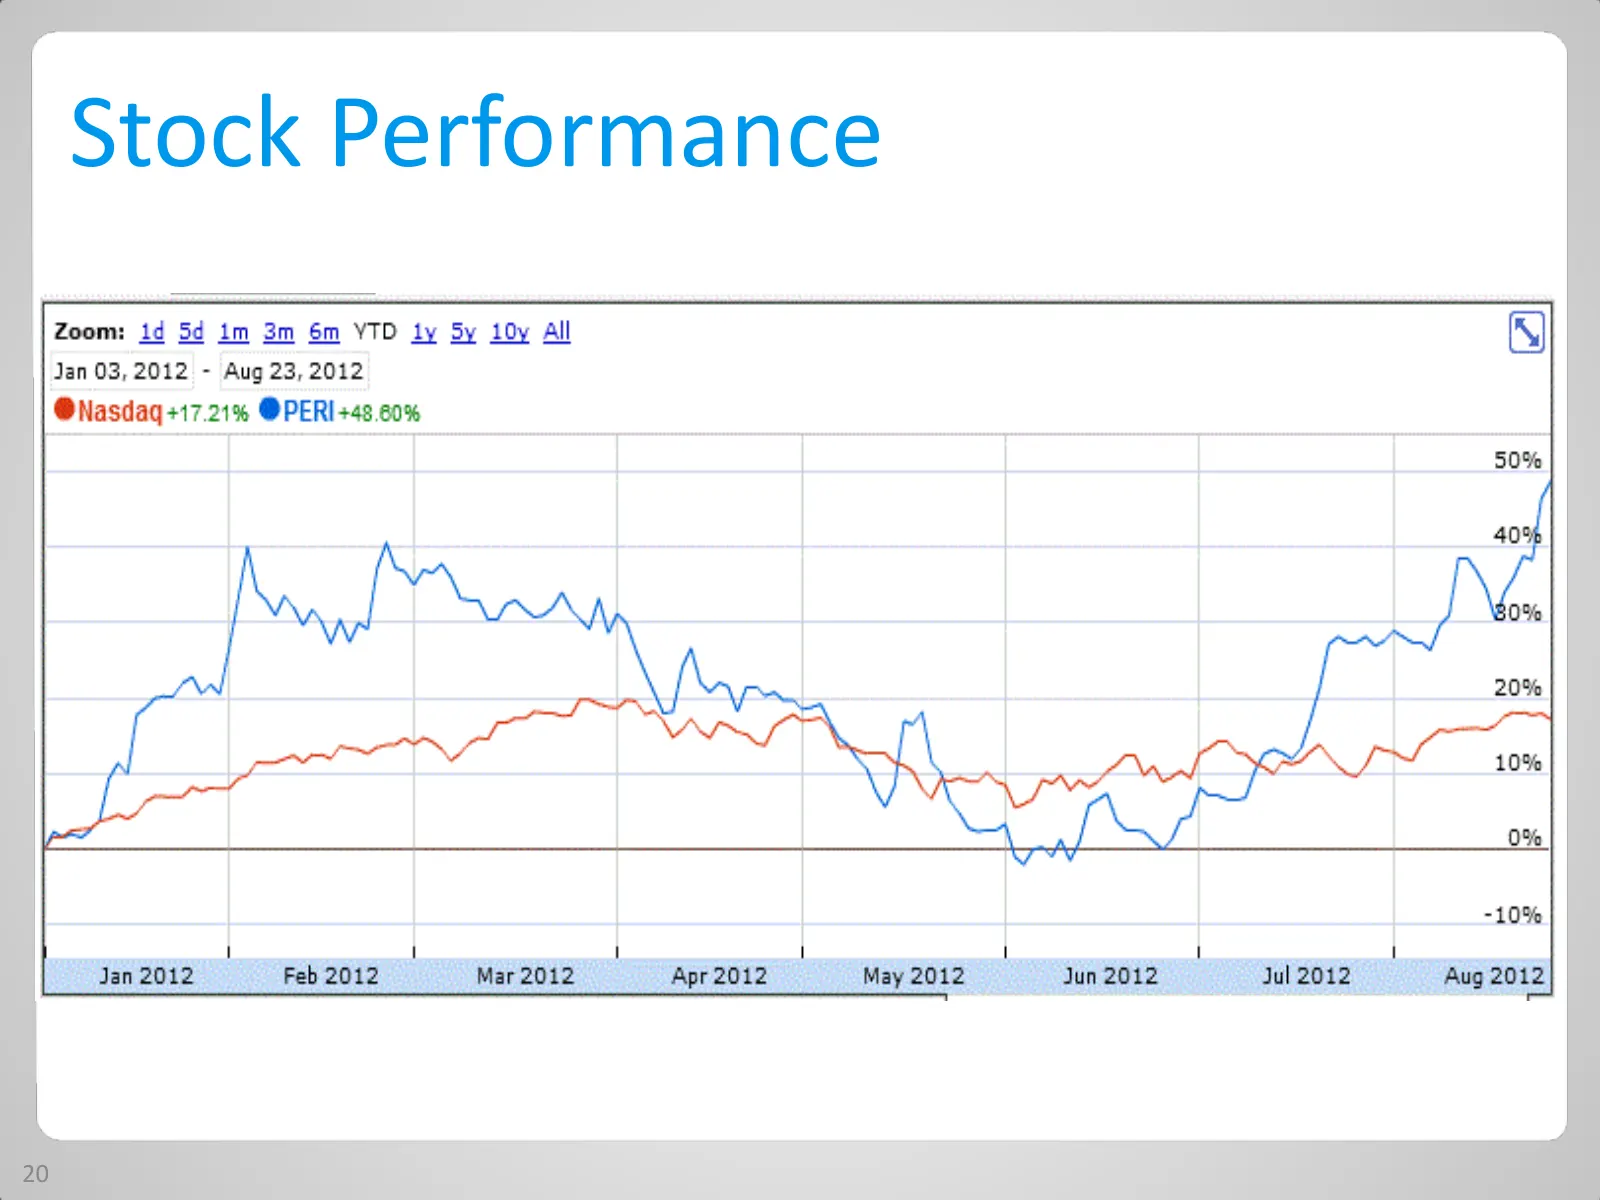
Slide 20: Stock Performance
Stock Performance @Nasdaq+17.21% @PERI+48.60% Mf RAL oe ~ ae val

Slide 21: Thank you!
Thank you!
Source: Internet Archive copy of perion.com
More decks from Perion Network Ltd
 Q2 2026 Earnings Presentation43 slides · Aug 10, 2026
 Investor Presentation (August 2026)83 slides · August 2026
 Investor Presentation (June 2026)80 slides · Jun 29, 2026
 Q1 2026 Earnings Presentation39 slides · May 20, 2026
 Q4 2025 Earnings Presentation54 slides · Feb 18, 2026
 Q3 2025 Earnings Presentation40 slides · Nov 12, 2025