Consti Oyj · OMXHEX:CONSTI
Consti Oyj — FY2017 Earnings Presentation
28 slides from Consti Oyj's earnings presentation, Feb 15, 2018
Slide 1: Consti Group Plc Financial Statements 1 January – 31 December 2017
CONSTI GROUP PLC FINANCIAL STATEMENTS 1 JANUARY – 31 DECEMBER 2017 CEO Esa Korkeela Building renovation specialist | www.consti.fi
Slide 2: Contents
Contents Highlights and Group performance Cash flow and financial position Market outlook, guidance and summary Appendix Building renovation specialist | www.consti.fi
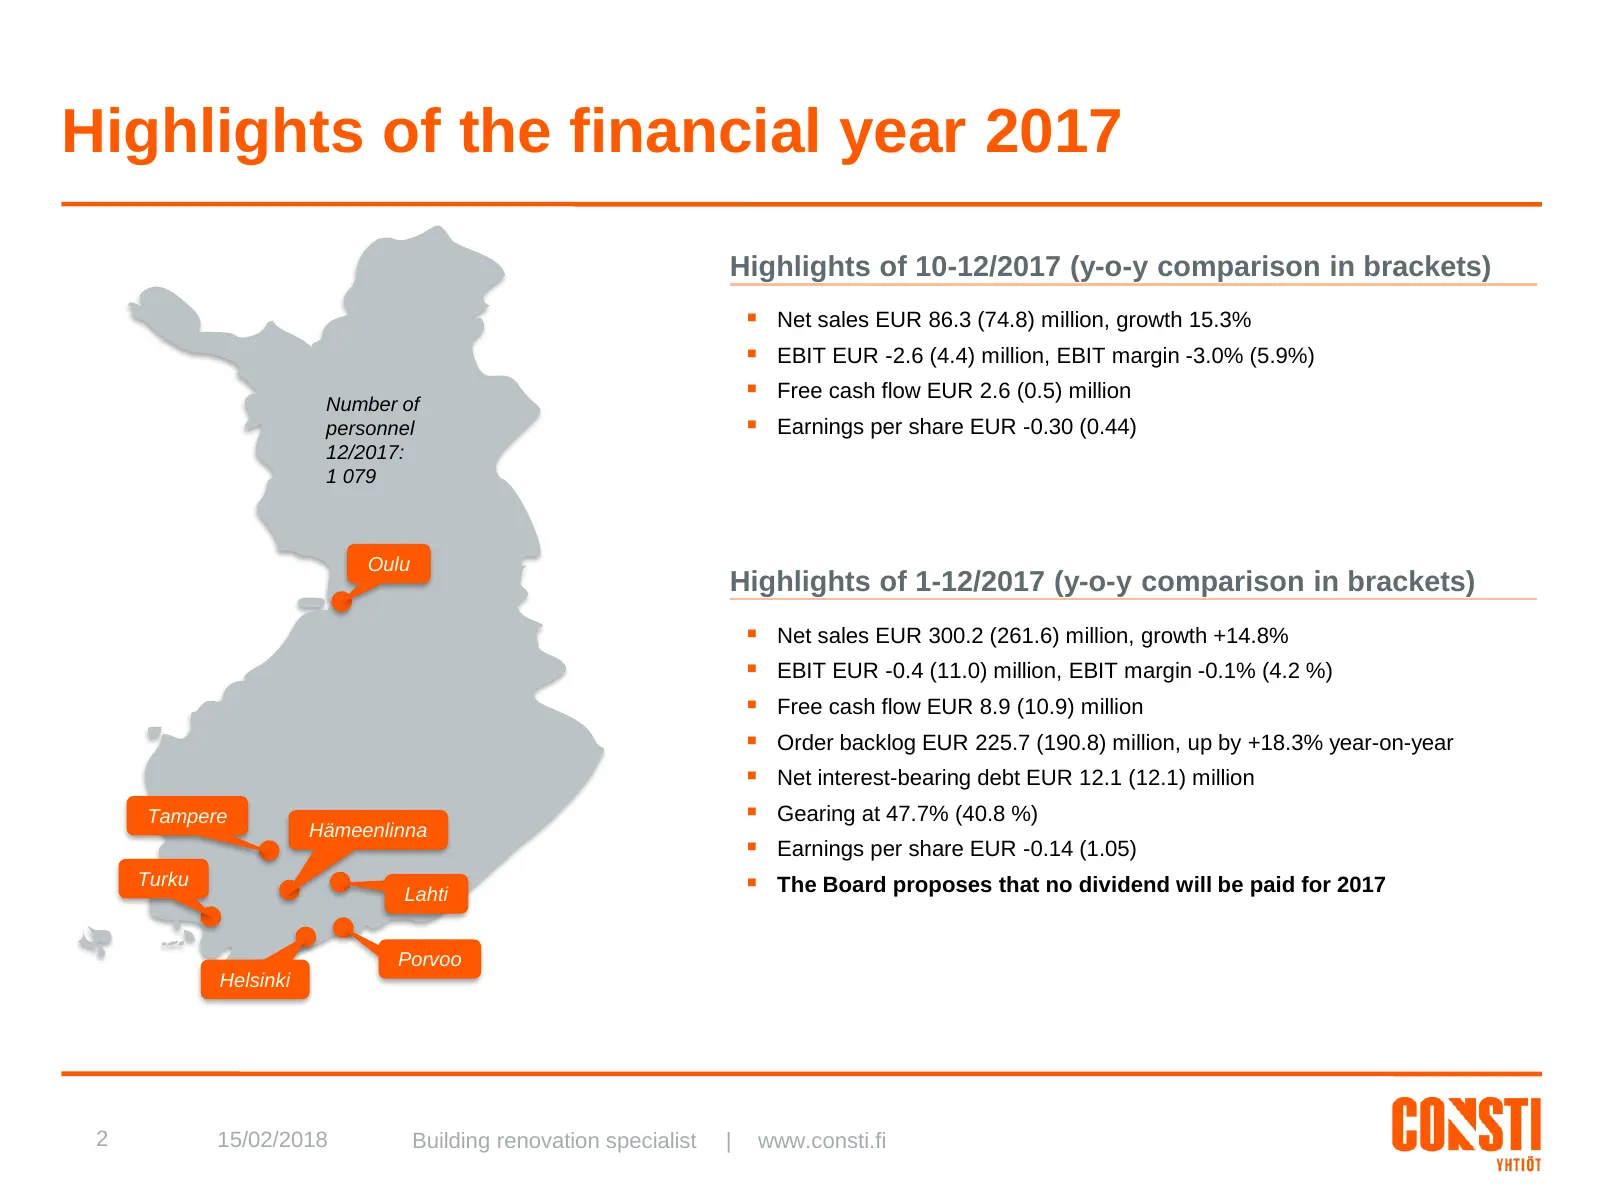
Slide 3: Highlights of the financial year 2017
Highlights of the financial year 2017 Highlights of 10-12/2017 (y-o-y comparison in brackets) Net sales EUR 86.3 (74.8) million, growth 15.3% EBIT EUR -2.6 (4.4) million, EBIT margin -3.0% (5.9%) Number of Free cash flow EUR 2.6 (0.5) million personnel Earnings per share EUR -0.30 (0.44) 12/
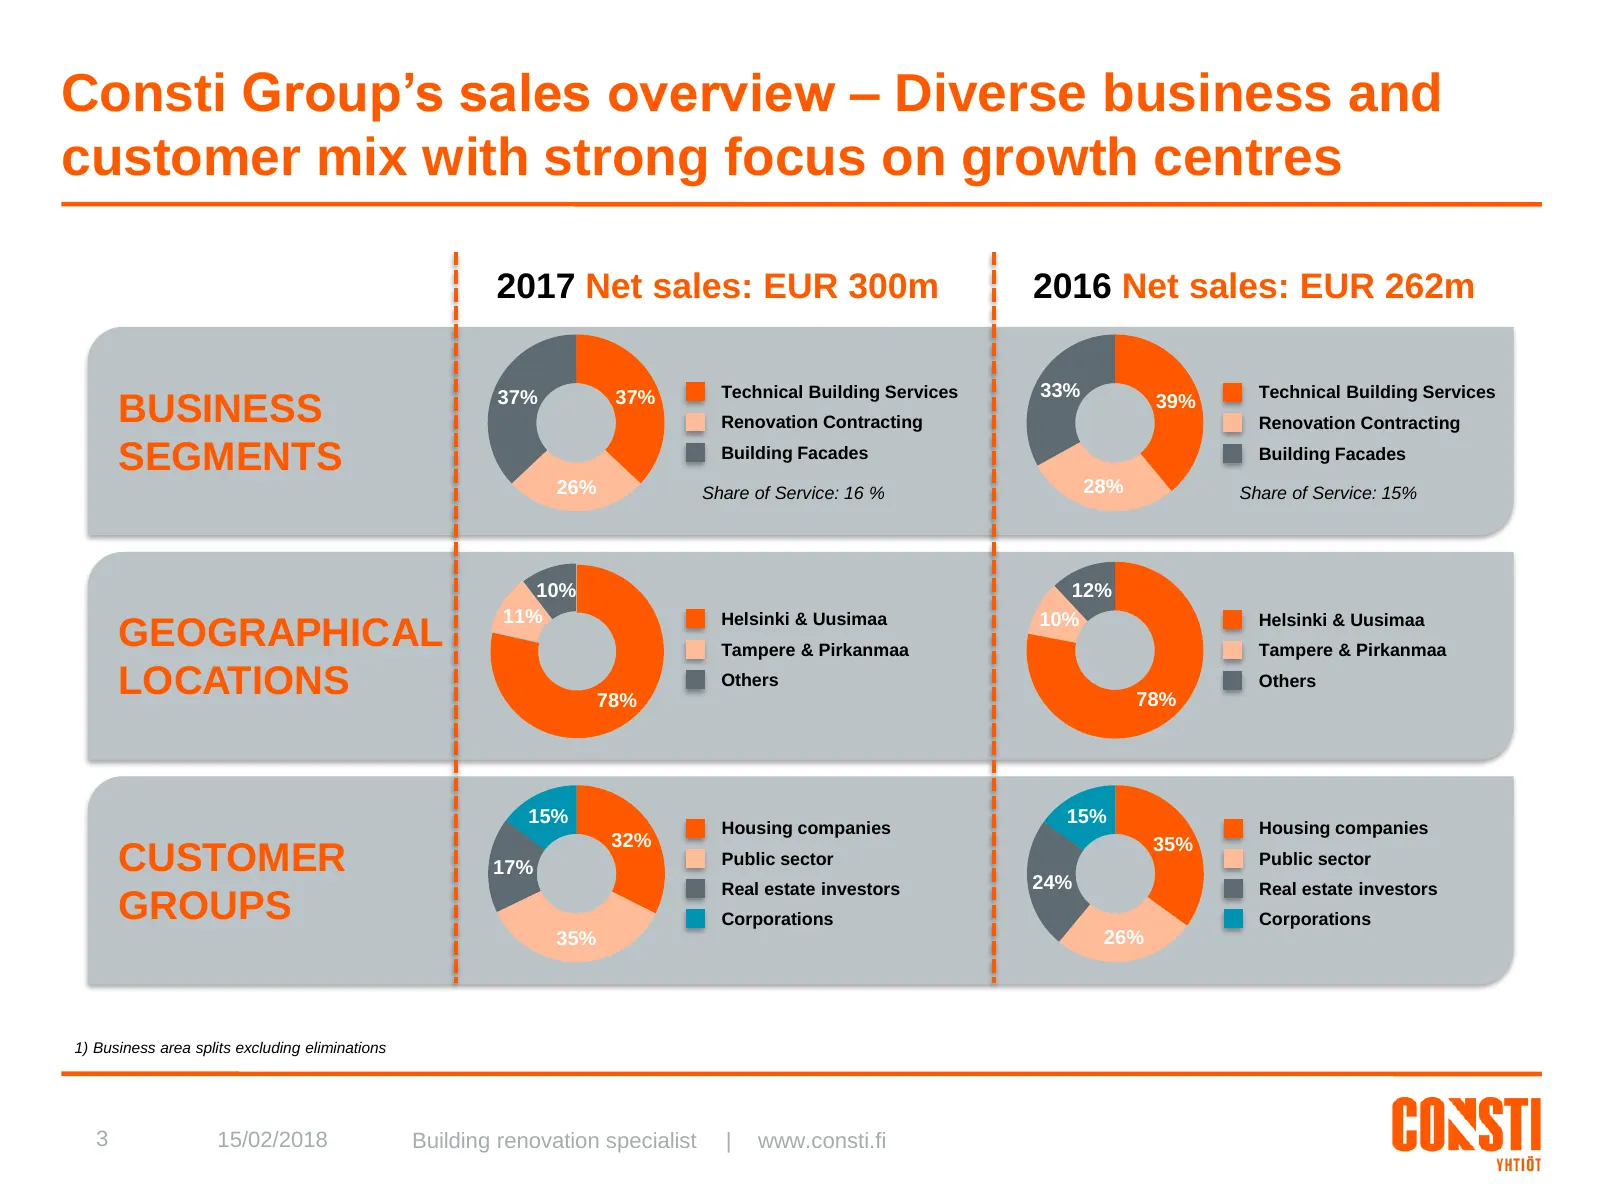
Slide 4: Consti Group's sales overview – Diverse business and customer mix
Consti Group’s sales overview – Diverse business and customer mix with strong focus on growth centres 2017 Net sales: EUR 300m 2016 Net sales: EUR 262m 37% 37% Technical Building Services 33% Technical Building Services BUSINESS Renovation Contracting 39% Renovation Contracting SEGMENTS Building Fac
Slide 5: Net sales grew in all business areas
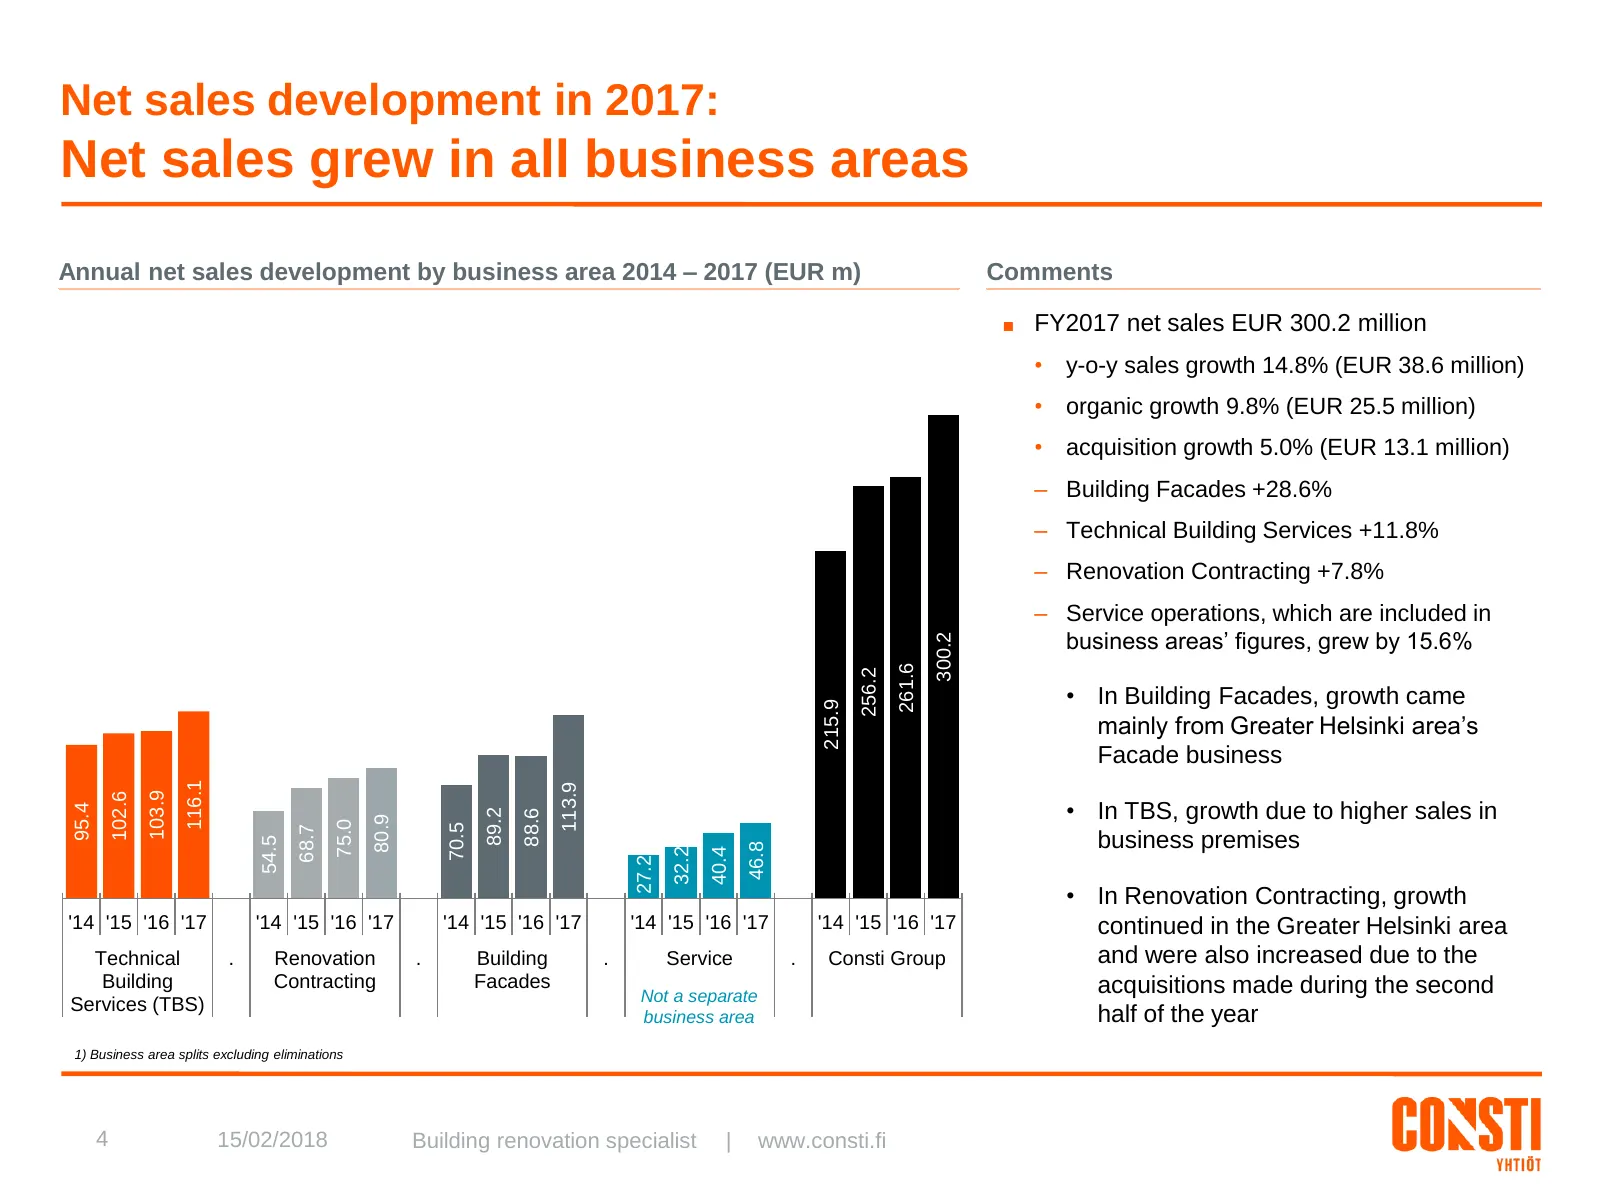
Net sales development in 2017: Net sales grew in all business areas Annual net sales development by business area 2014 – 2017 (EUR m) Comments ■ FY2017 net sales EUR 300.2 million • y-o-y sales growth 14.8% (EUR 38.6 million) • organic growth 9.8% (EUR 25.5 million) • acquisition growth 5.0% (EUR 13
Slide 6: Quarterly performance overview
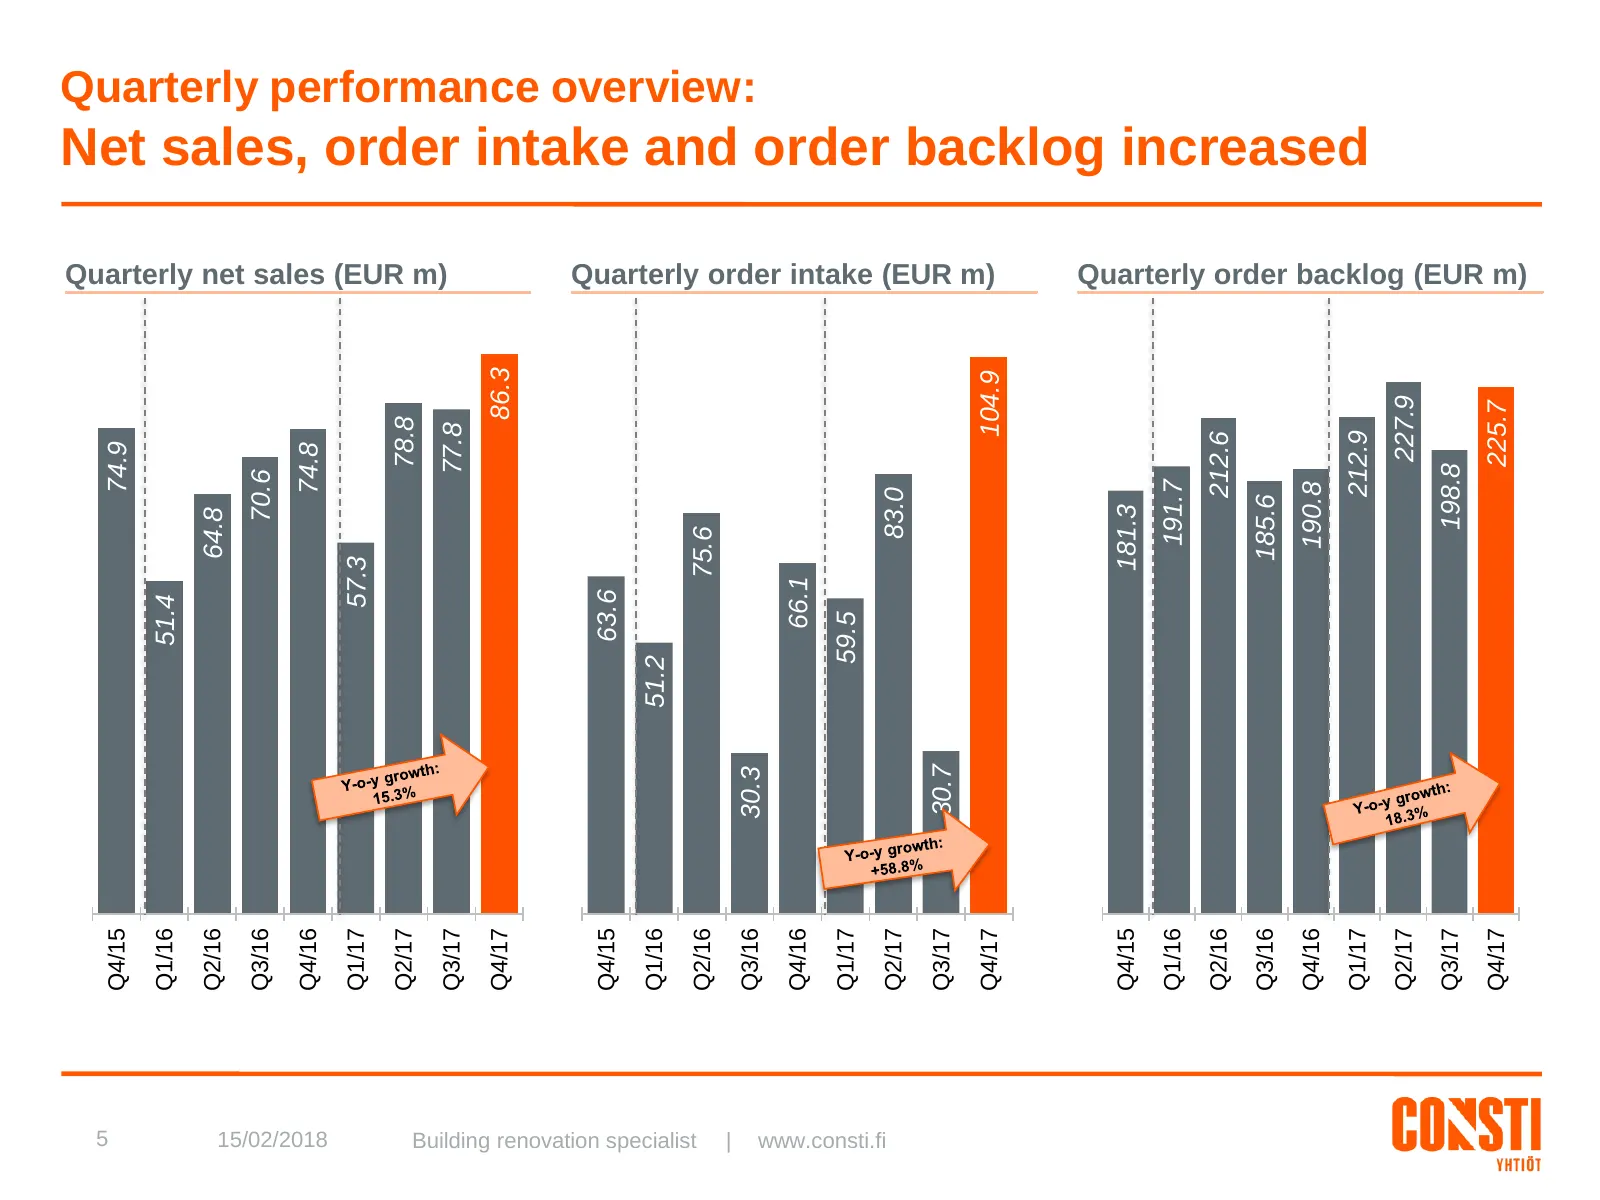
5 Q4/15 74.9 Q1/16 51.4 Q2/16 64.8 Q3/16 70.6 Q4/16 74.8 15/02/2018 Q1/17 57.3 Q2/17 78.8 Quarterly net sales (EUR m) Q3/17 77.8 Q4/17 86.3 Q4/15 63.6 Q1/16 51.2 Building renovation specialist Q2/16 75.6 | Quarterly performance overview: Q3/16 30.3 Q4/16 66.1 Q1/17 59.5 www.consti.fi Q2/17 83.0 Q3/1
Slide 7: Fourth quarter net sales up by 15.3%
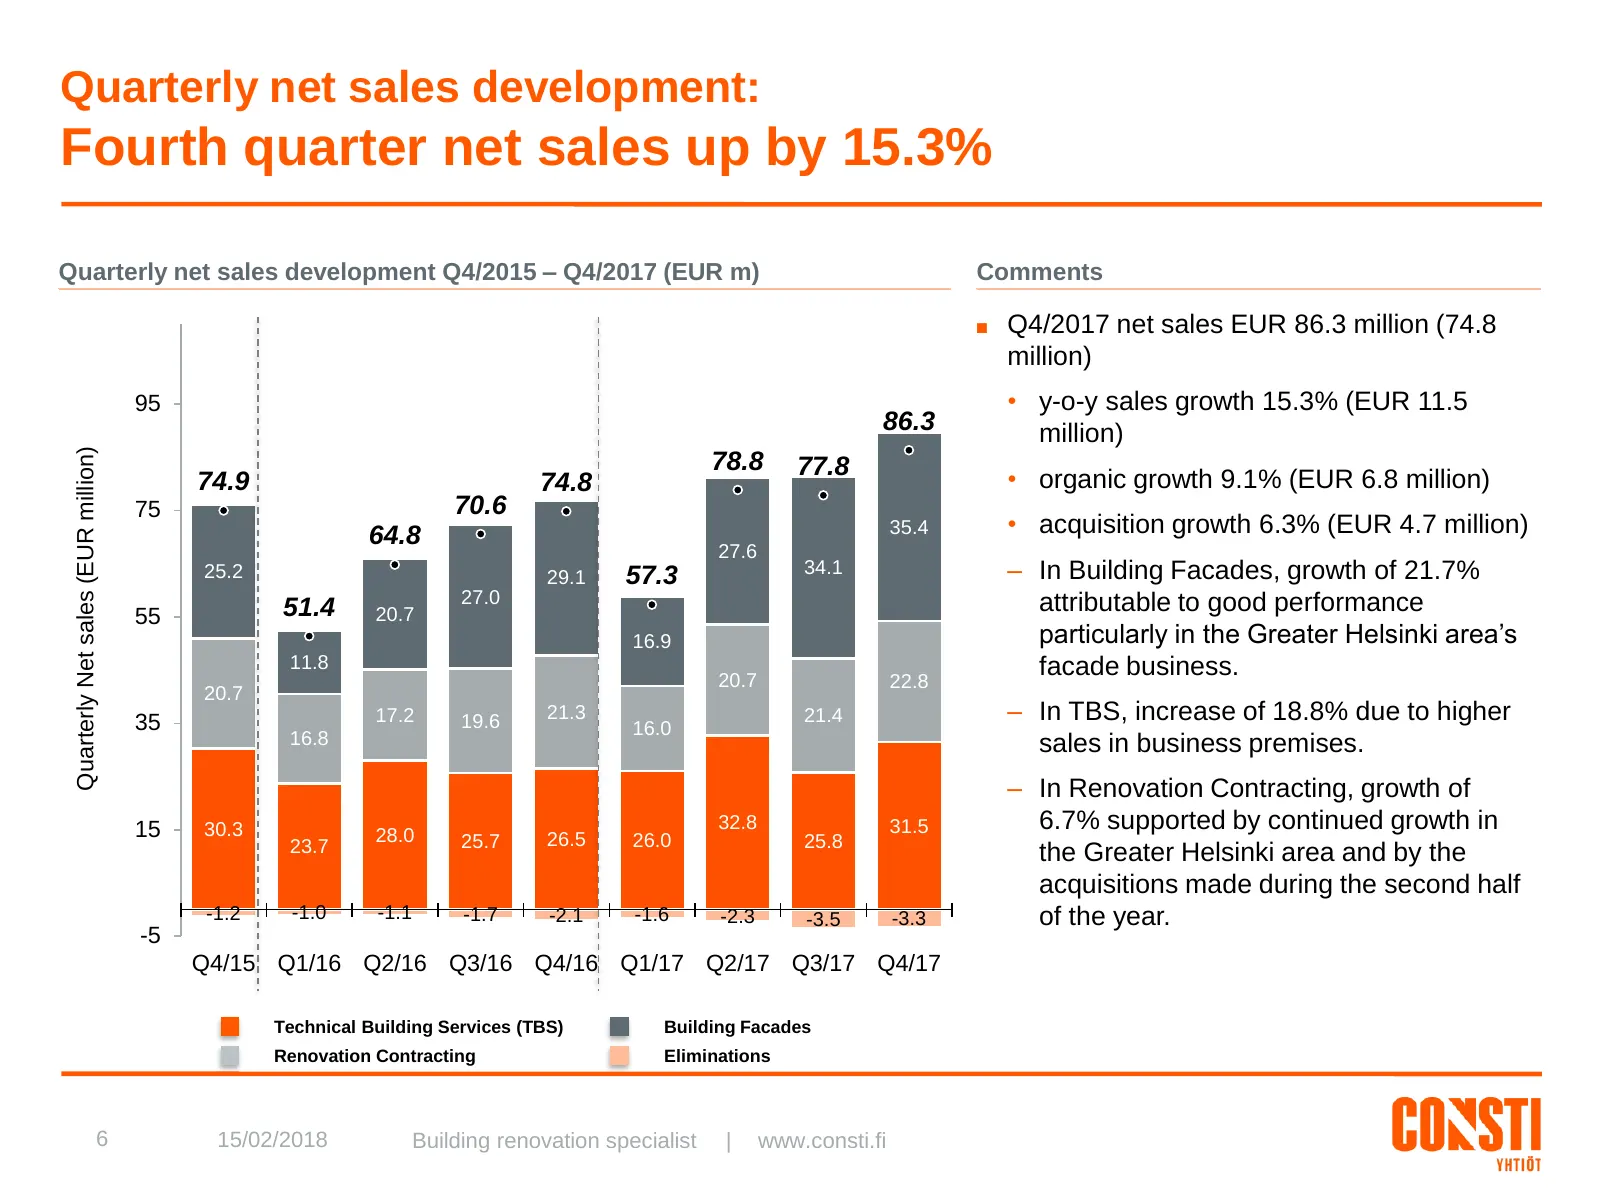
Quarterly net sales development: Fourth quarter net sales up by 15.3% Quarterly net sales development Q4/2015 – Q4/2017 (EUR m) Comments ■ Q4/2017 net sales EUR 86.3 million (74.8 million) 95 • y-o-y sales growth 15.3% (EUR 11.5 86.3 million) Quarterly Net sales (EUR million) 78.8 77.8 74.9 74.8 • o
Slide 8: Quarterly EBIT development: Corrective actions (1/2)
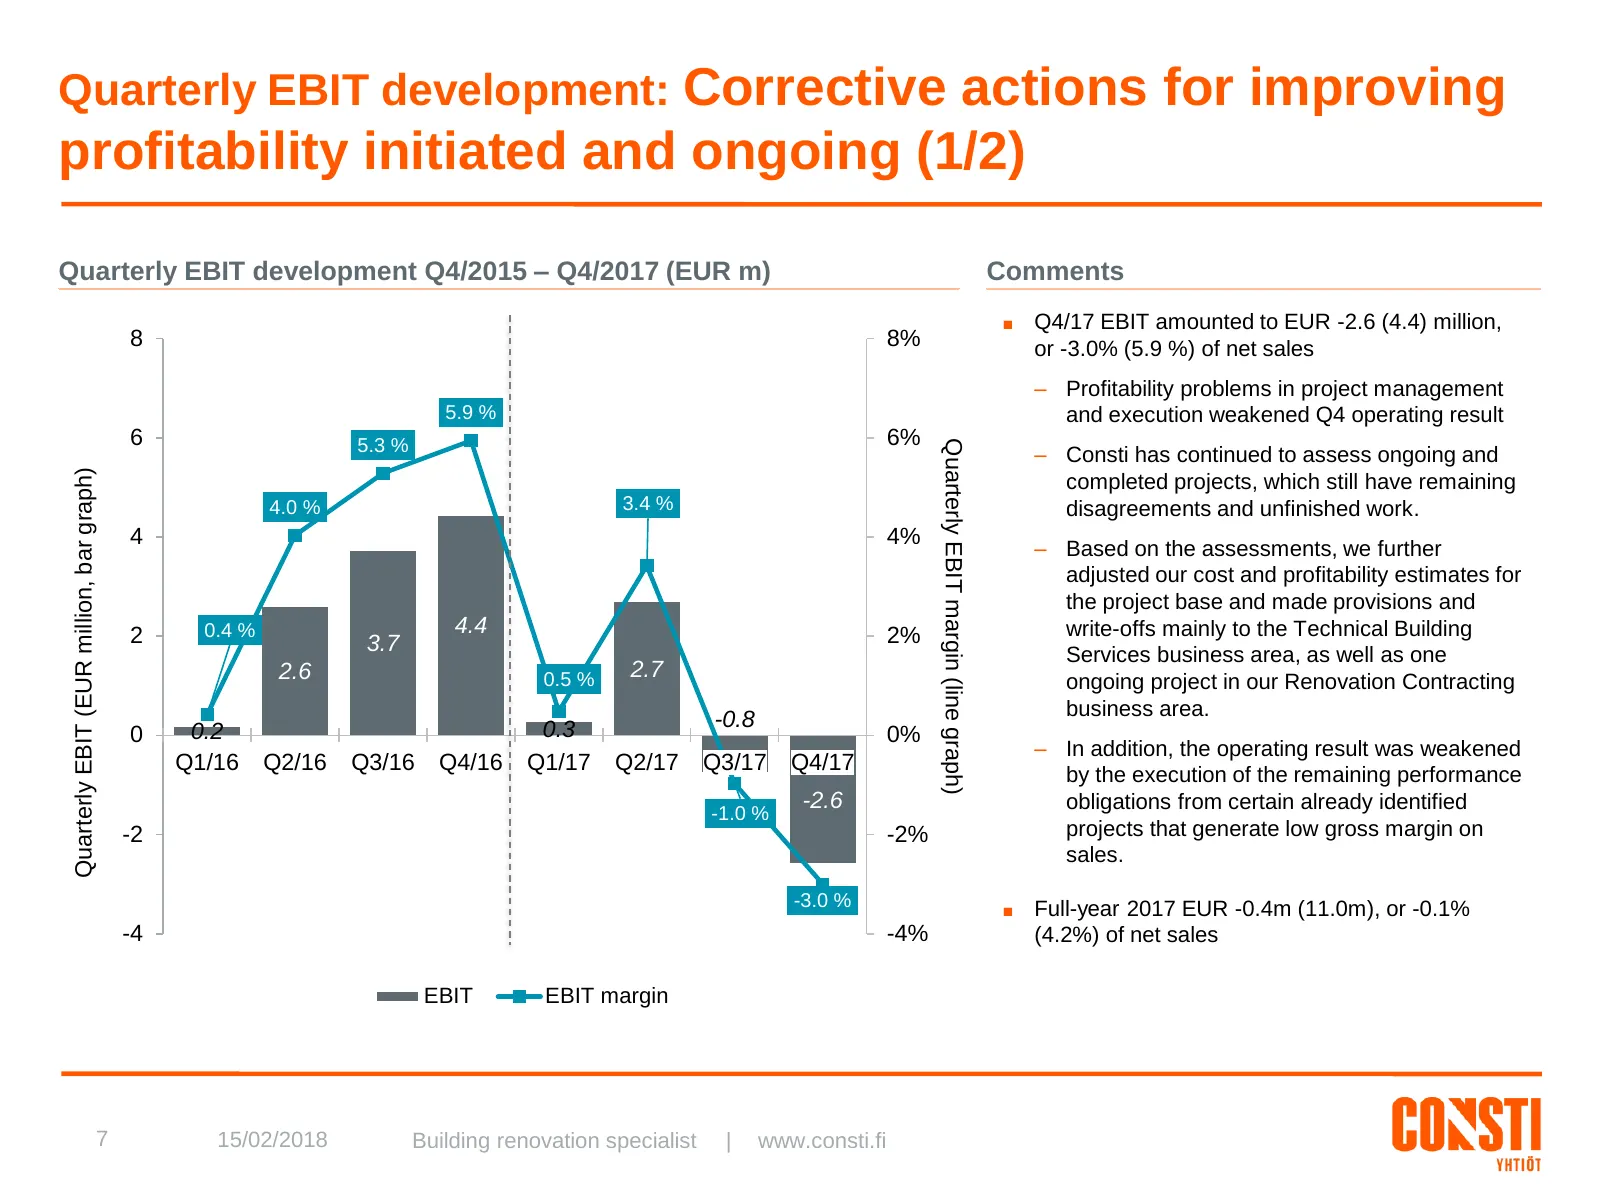
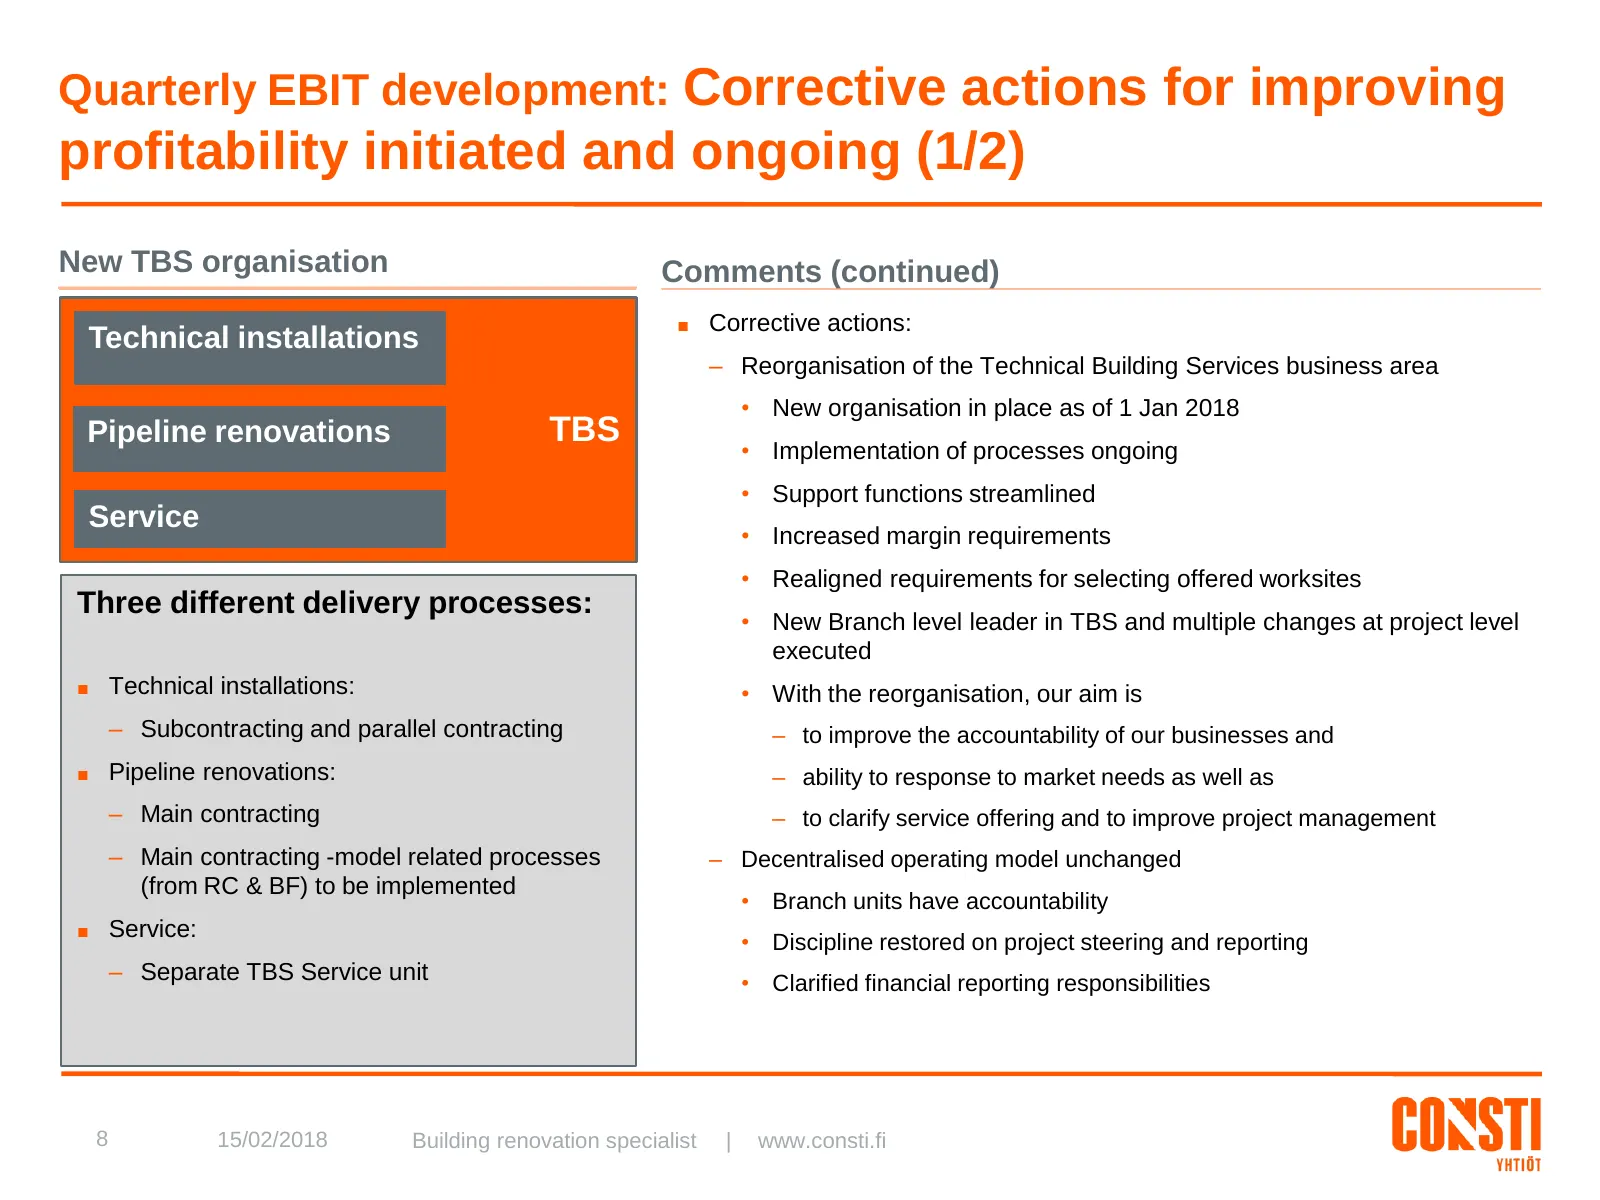
Quarterly EBIT development: Corrective actions for improving profitability initiated and ongoing (1/2) Quarterly EBIT development Q4/2015 – Q4/2017 (EUR m) Comments ■ Q4/17 EBIT amounted to EUR -2.6 (4.4) million, 8 8% or -3.0% (5.9 %) of net sales – Profitability problems in project management 5.9
Slide 9: Quarterly EBIT development: Corrective actions (2/2)
Quarterly EBIT development: Corrective actions for improving profitability initiated and ongoing (1/2) New TBS organisation Comments (continued) ■ Corrective actions: Technical installations – Reorganisation of the Technical Building Services business area • New organisation in place as of 1 Jan 201
Slide 10: Quarterly order intake development
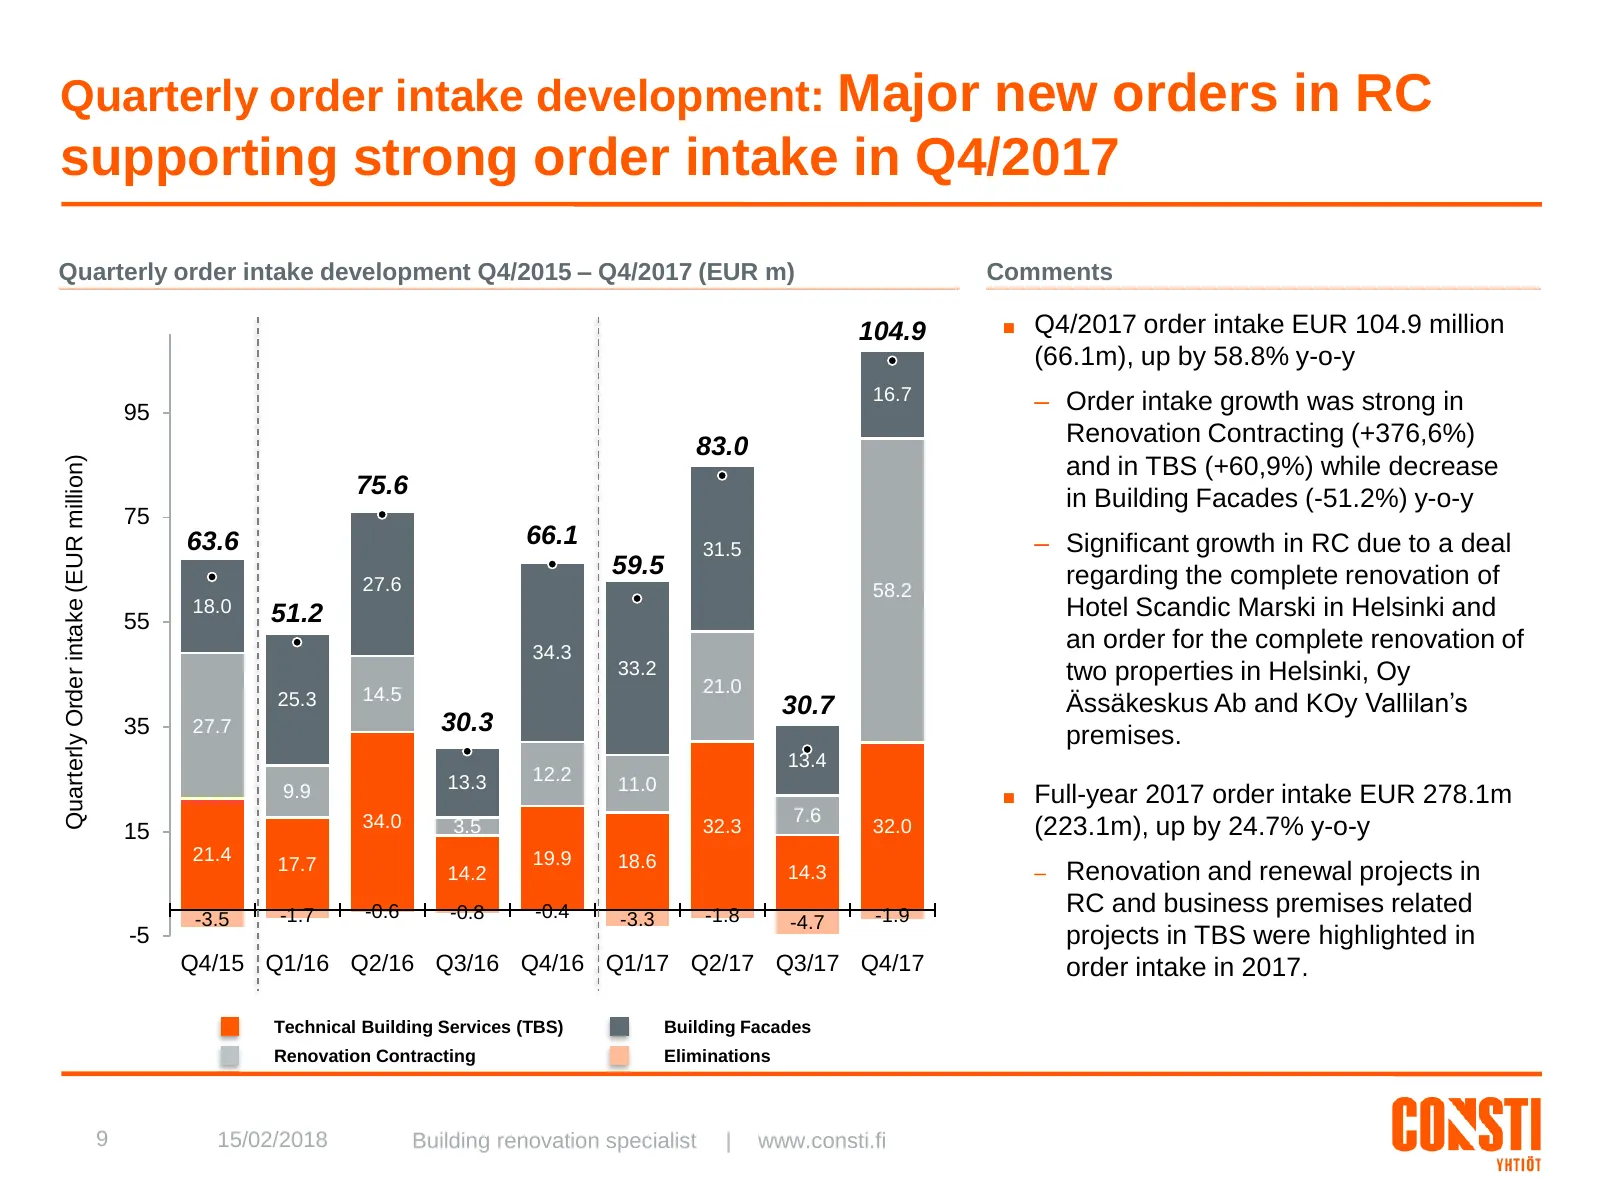
Quarterly order intake development: Major new orders in RC supporting strong order intake in Q4/2017 Quarterly order intake development Q4/2015 – Q4/2017 (EUR m) Comments 104.9 ■ Q4/2017 order intake EUR 104.9 million (66.1m), up by 58.8% y-o-y 95 16.7 – Order intake growth was strong in 83.0 Renova
Slide 11: Strong order intake particularly in Renovation contracting in Q4
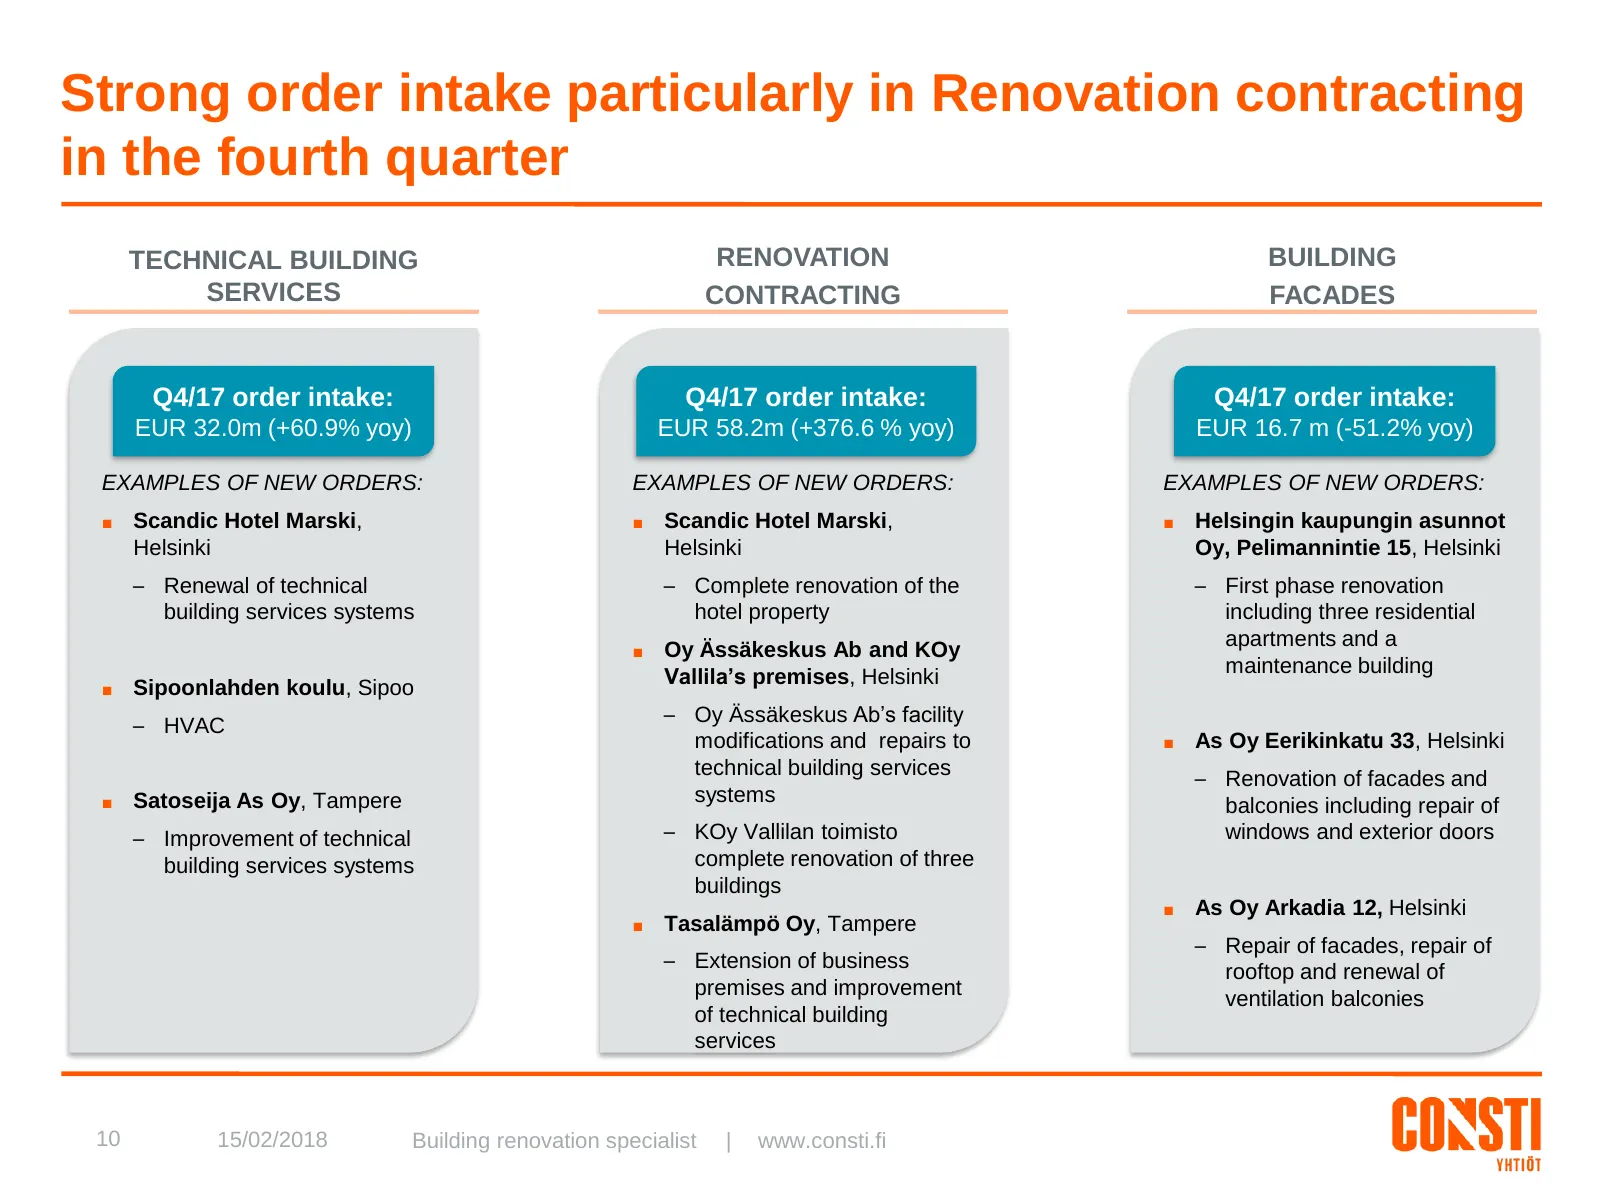
Strong order intake particularly in Renovation contracting in the fourth quarter TECHNICAL BUILDING RENOVATION BUILDING SERVICES CONTRACTING FACADES Q4/17 order intake: Q4/17 order intake: Q4/17 order intake: EUR 32.0m (+60.9% yoy) EUR 58.2m (+376.6 % yoy) EUR 16.7 m (-51.2% yoy) EXAMPLES OF NEW ORD
Slide 12: Quarterly order backlog development
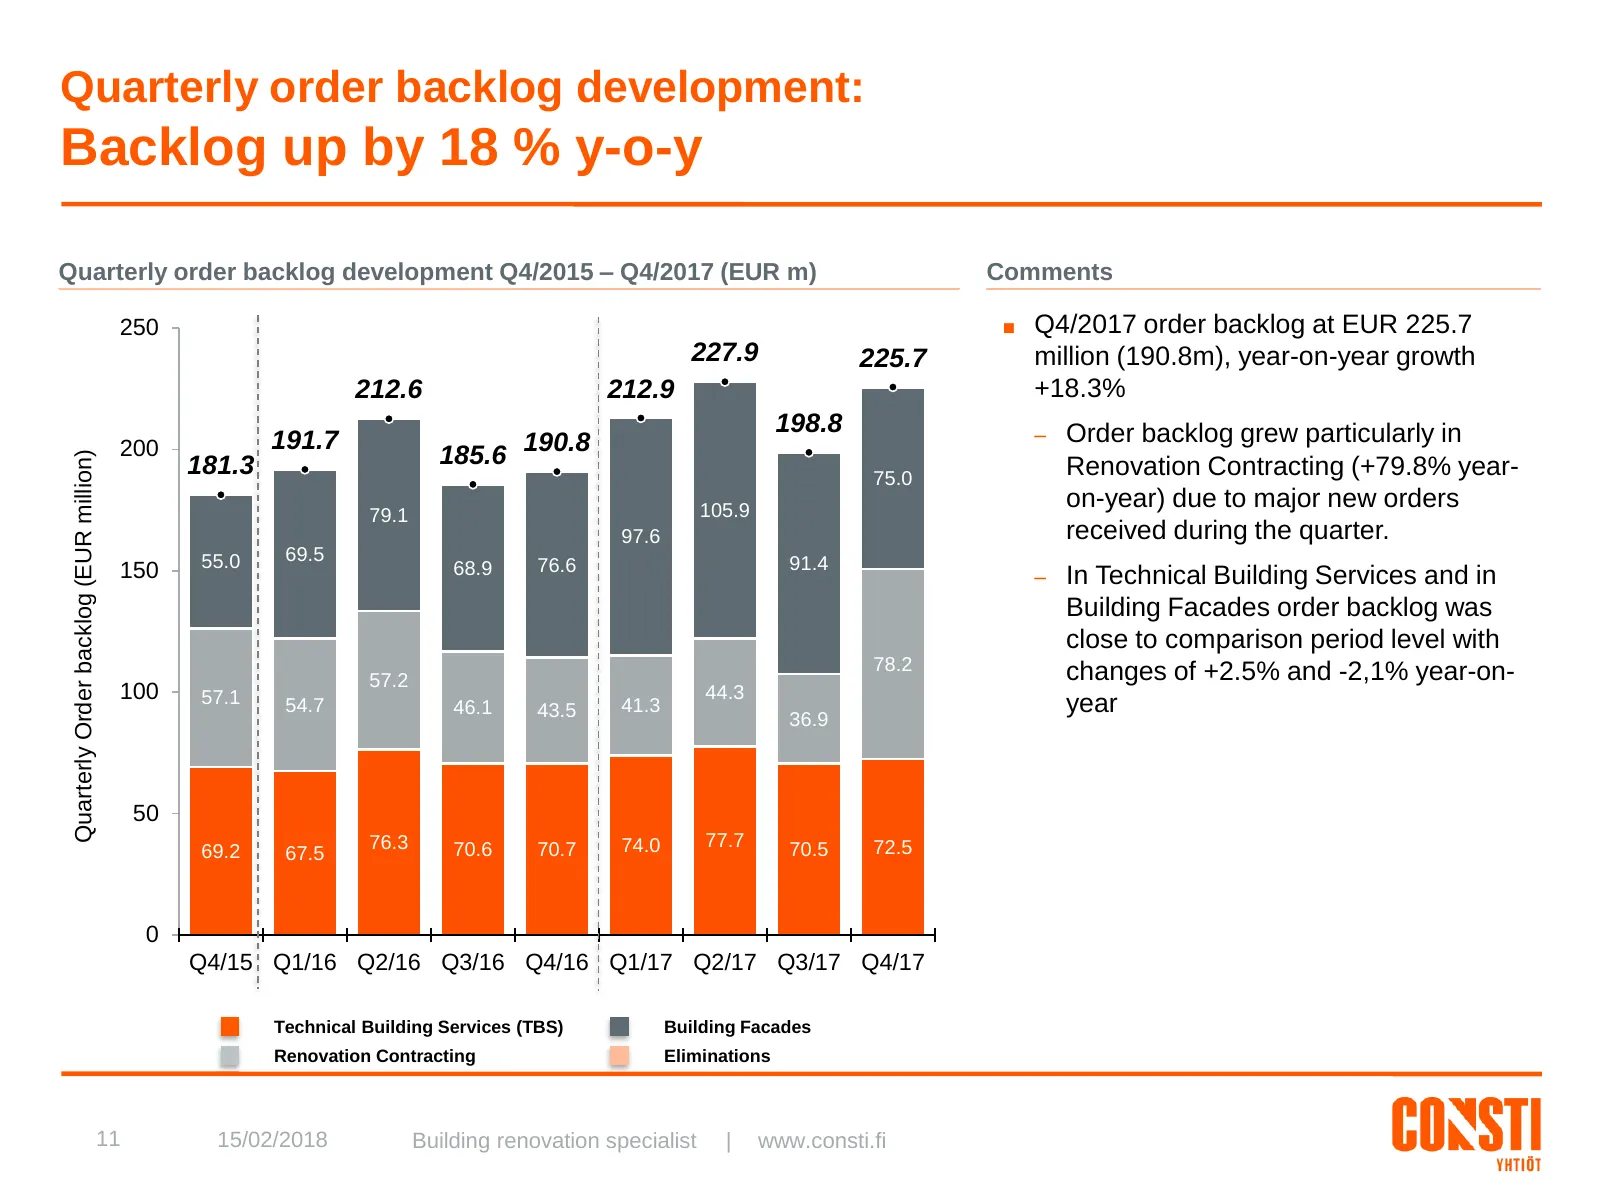
Quarterly order backlog development: Backlog up by 18 % y-o-y Quarterly order backlog development Q4/2015 – Q4/2017 (EUR m) Comments 250 ■ Q4/2017 order backlog at EUR 225.7 227.9 225.7 million (190.8m), year-on-year growth 212.6 212.9 +18.3% 198.8 – Order backlog grew particularly in 191.7 200 185.
Slide 13: Cash Flow and Financial Position
Cash Flow and Financial Position 12 15/02/2018 Building renovation specialist | www.consti.fi
Slide 14: Free cash flow EUR 8.9 million in FY2017
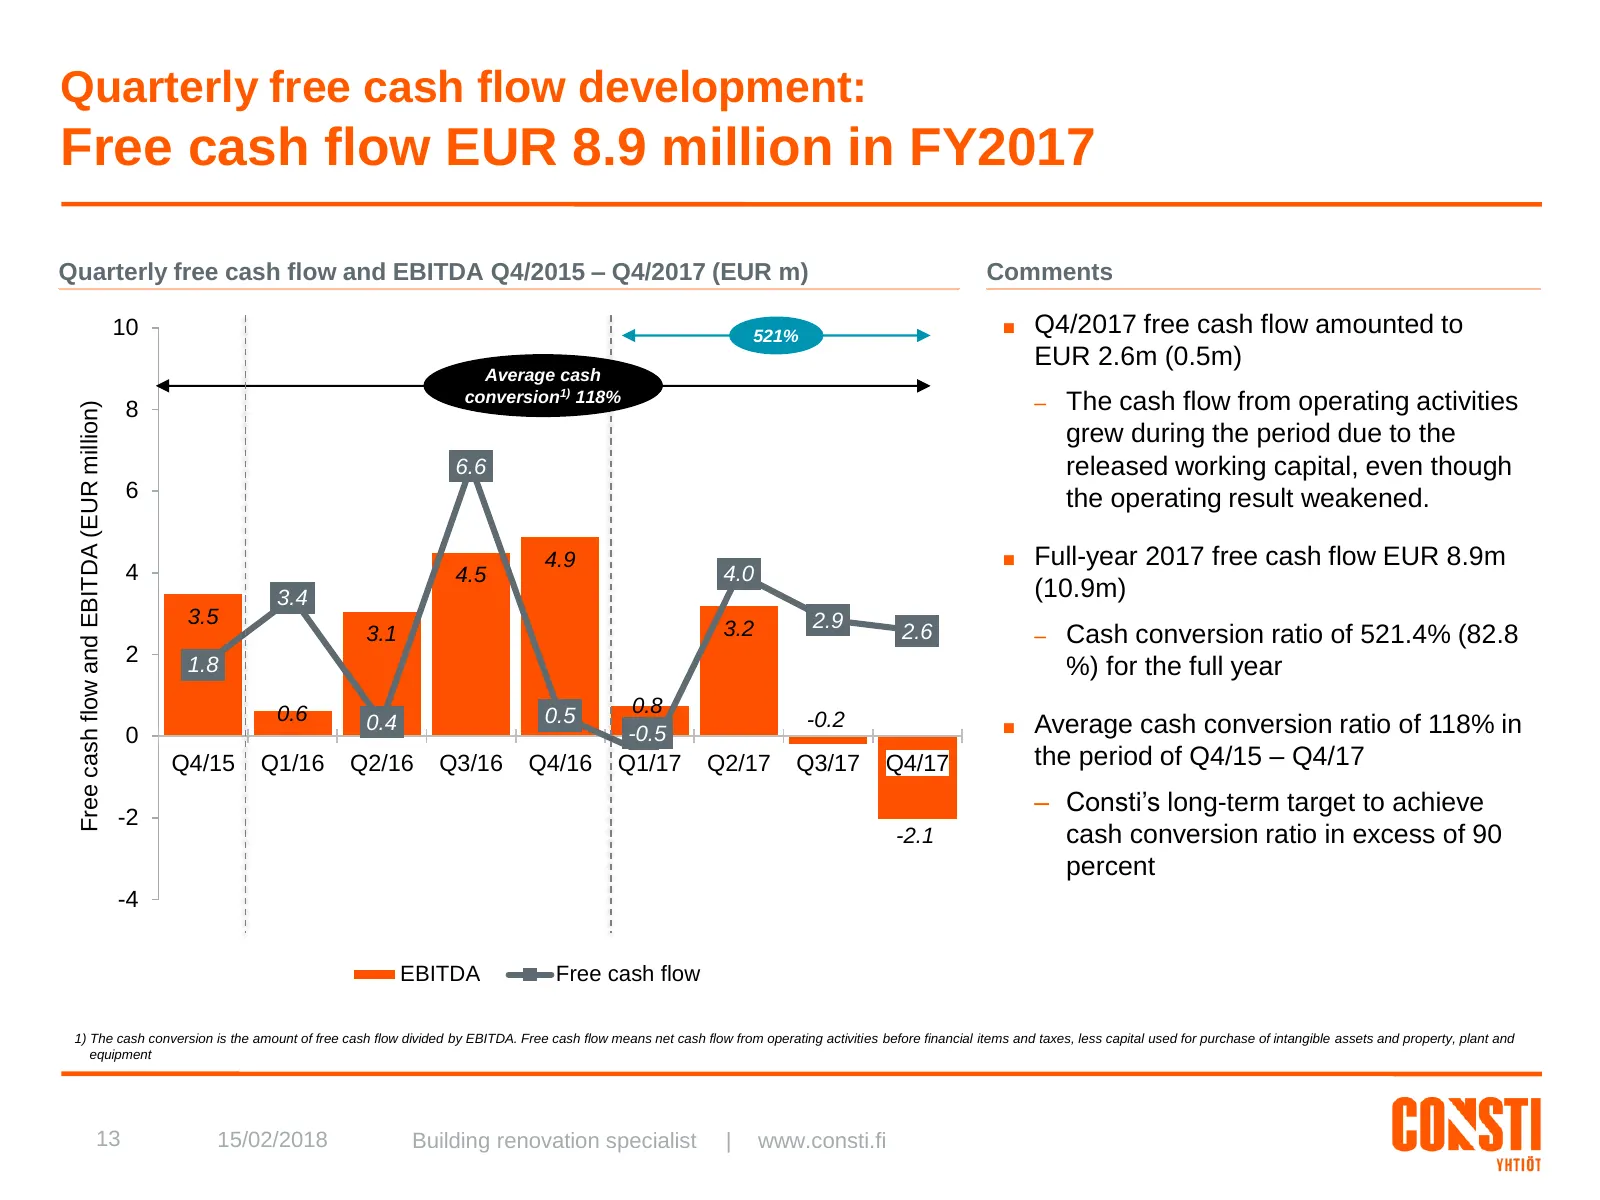
Quarterly free cash flow development: Free cash flow EUR 8.9 million in FY2017 Quarterly free cash flow and EBITDA Q4/2015 – Q4/2017 (EUR m) Comments 10 521% ■ Q4/2017 free cash flow amounted to EUR 2.6m (0.5m) Average cash conversion1) 118% – The cash flow from operating activities 8 Free cash flow
Slide 15: NWC released during Q4/2017
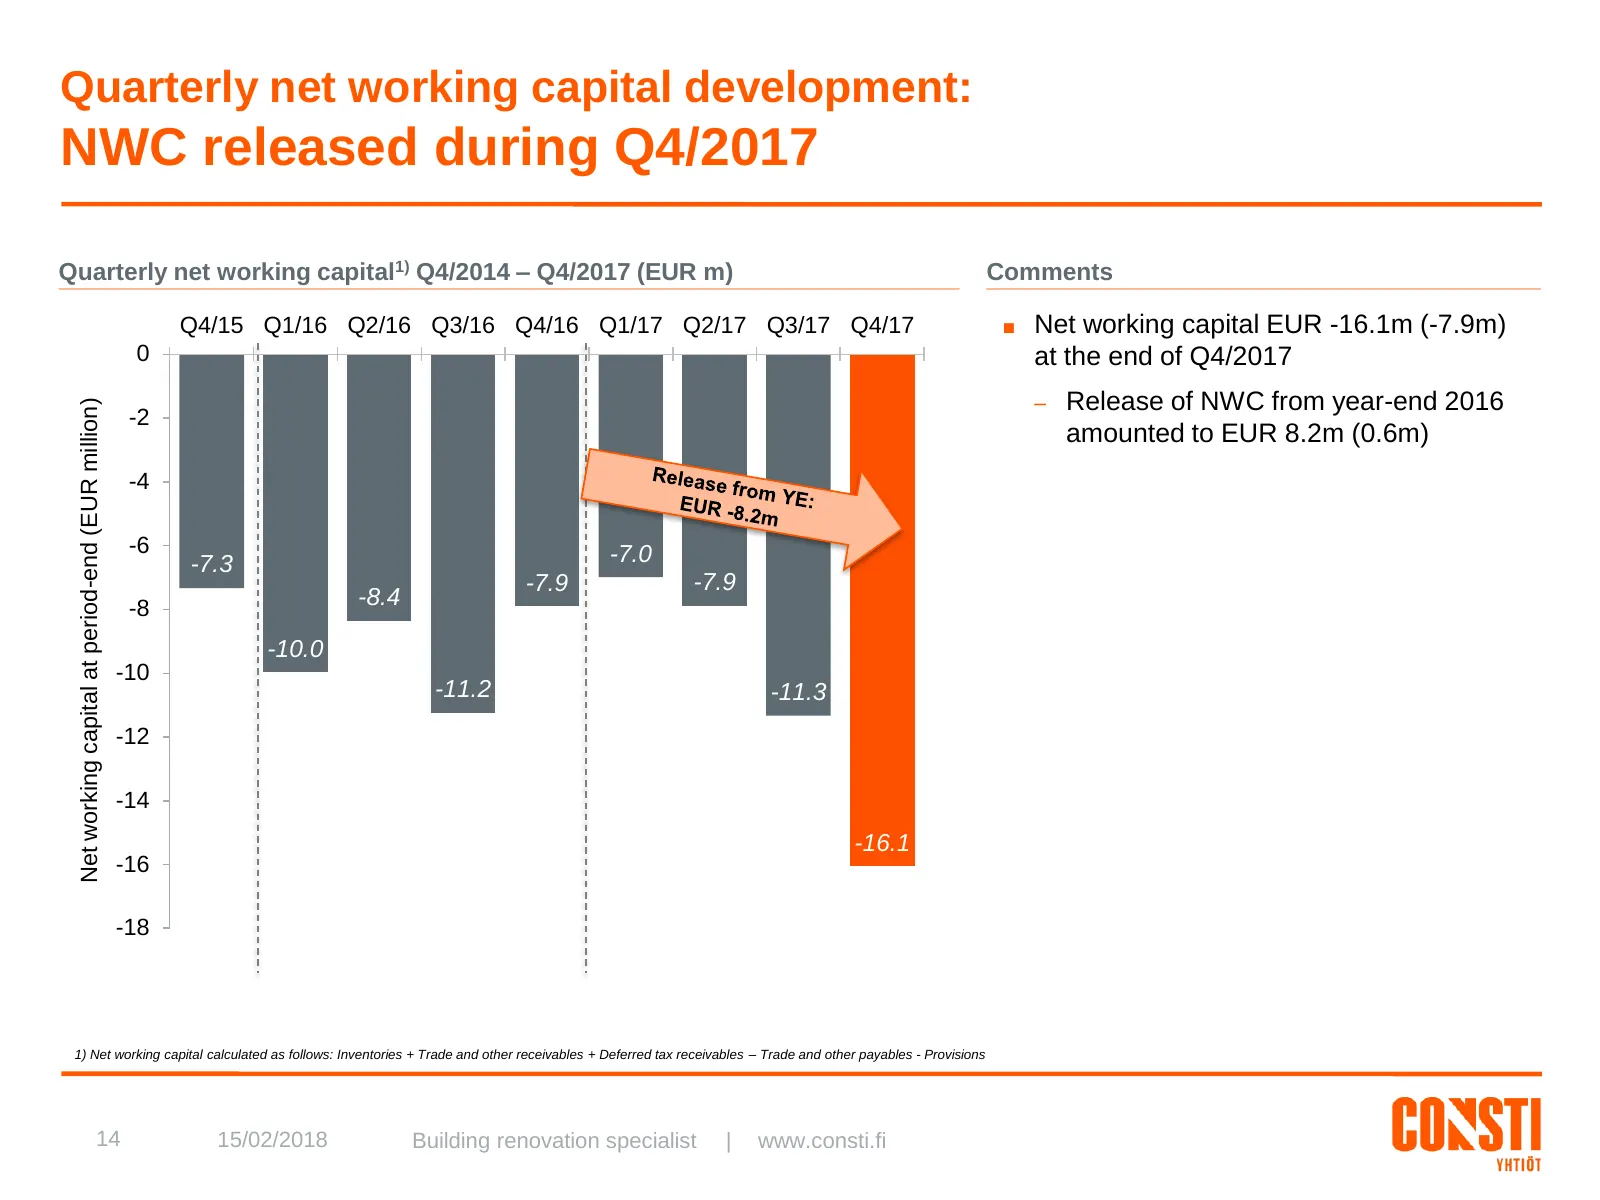
Quarterly net working capital development: NWC released during Q4/2017 Quarterly net working capital1) Q4/2014 – Q4/2017 (EUR m) Comments Q4/15 Q1/16 Q2/16 Q3/16 Q4/16 Q1/17 Q2/17 Q3/17 Q4/17 ■ Net working capital EUR -16.1m (-7.9m) 0 at the end of Q4/2017 – Release of NWC from year-end 2016 Net wor
Slide 16: Net debt level unchanged
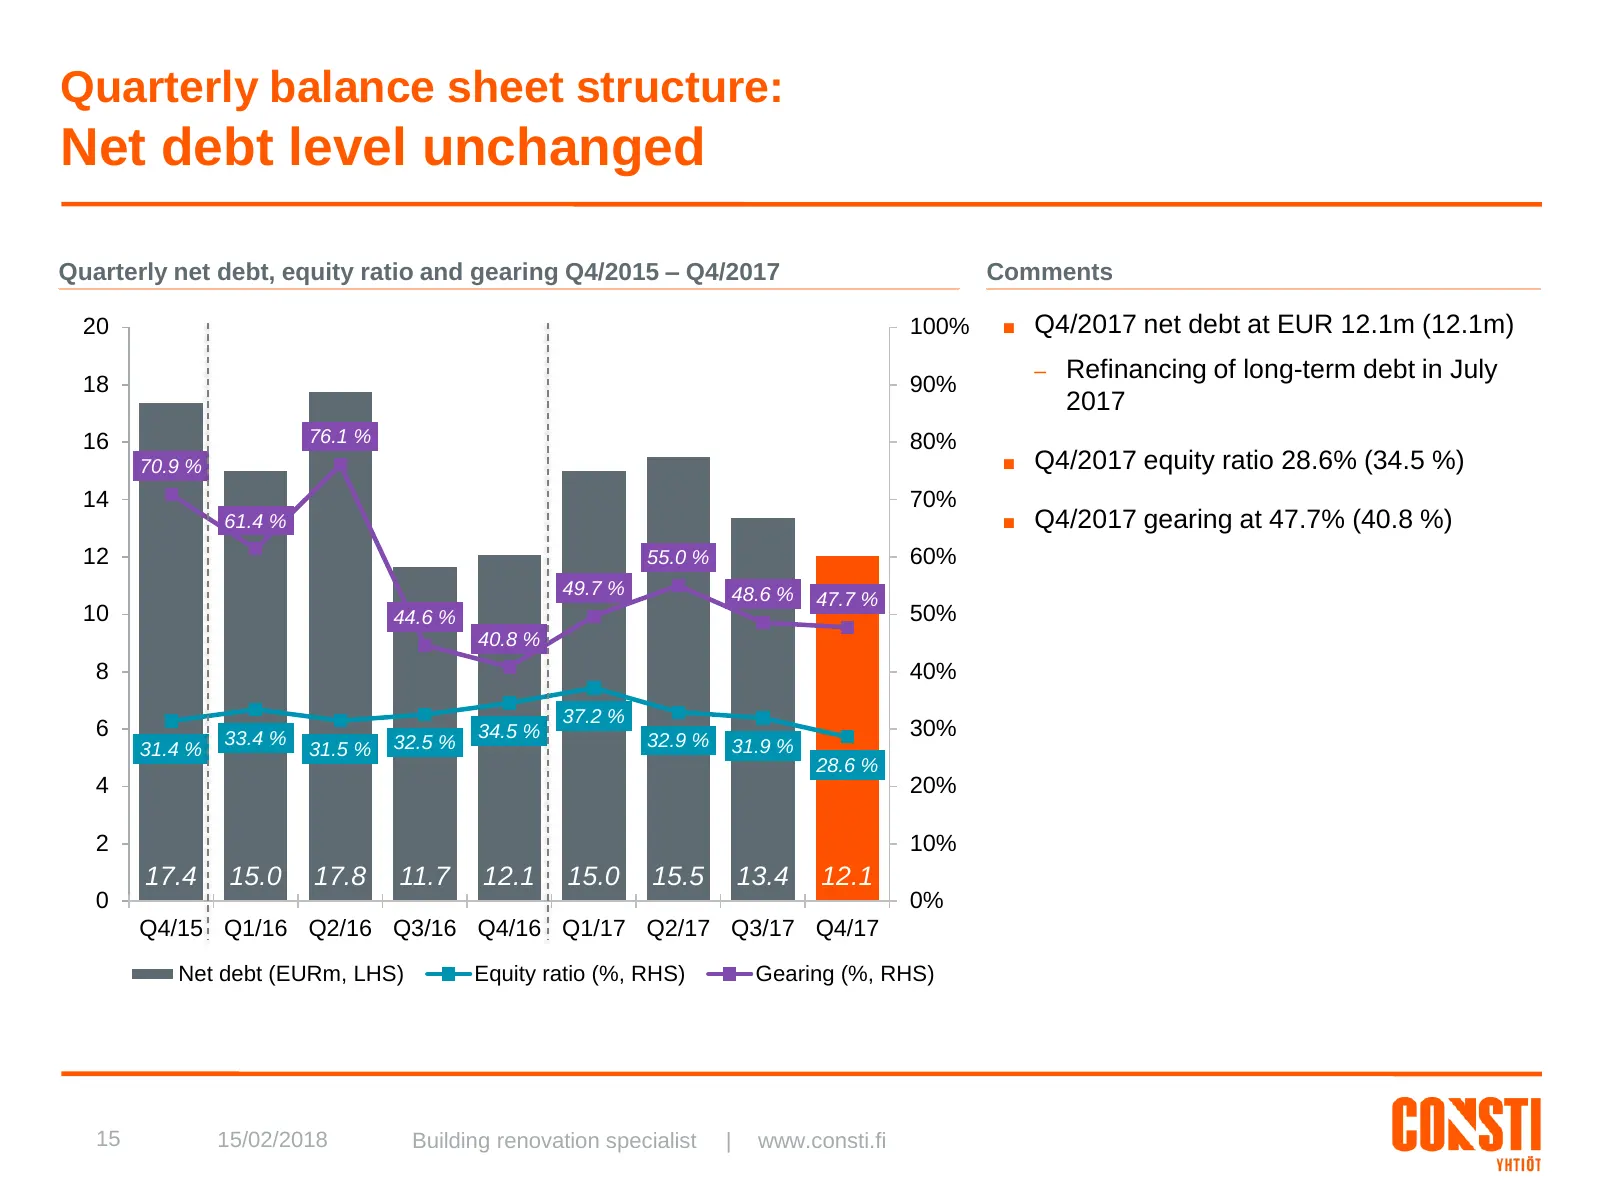
Quarterly balance sheet structure: Net debt level unchanged Quarterly net debt, equity ratio and gearing Q4/2015 – Q4/2017 Comments 20 100% ■ Q4/2017 net debt at EUR 12.1m (12.1m) – Refinancing of long-term debt in July 18 90% 2017 16 76.1 % 80% 70.9 % ■ Q4/2017 equity ratio 28.6% (34.5 %) 14 70% 61
Slide 17: Market Outlook, guidance and summary
Market Outlook, guidance and summary 16 15/02/2018 Building renovation specialist | www.consti.fi
Slide 18: Lead indicators for Finnish construction suggest a favourable market
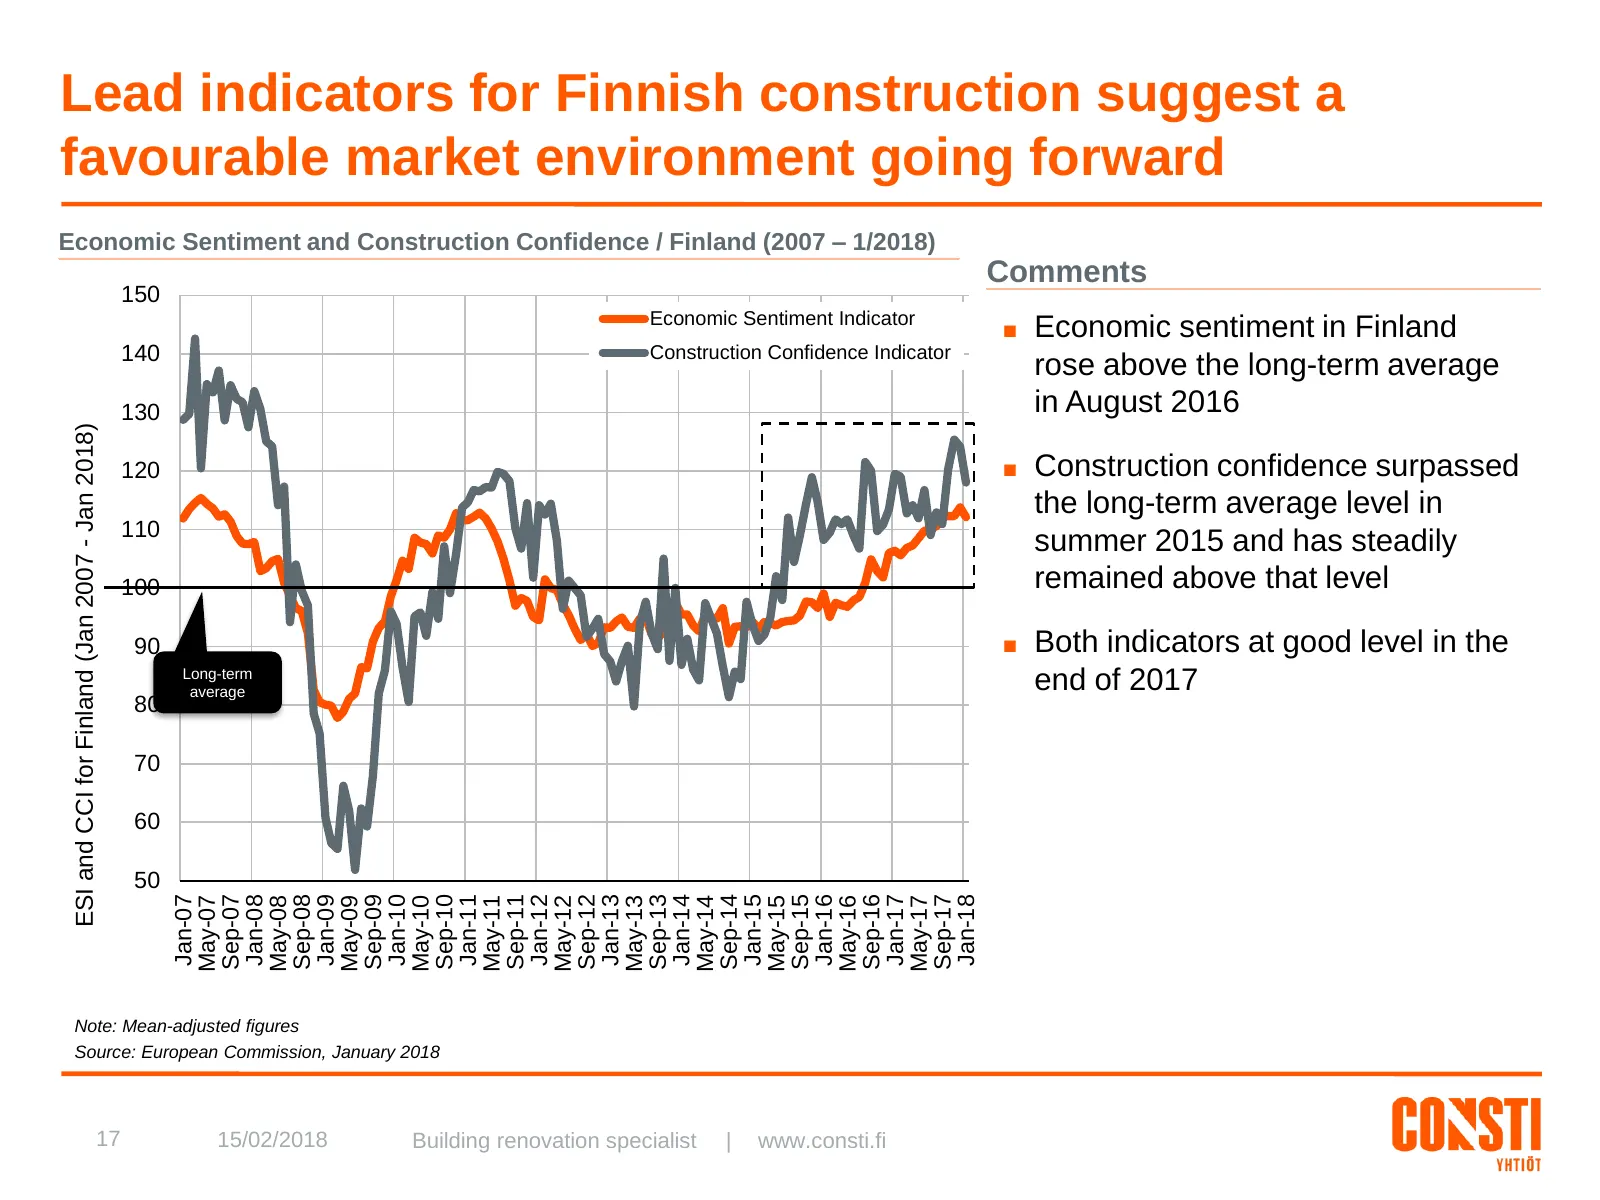
Lead indicators for Finnish construction suggest a favourable market environment going forward Economic Sentiment and Construction Confidence / Finland (2007 – 1/2018) Comments 150 Economic Sentiment Indicator ■ Economic sentiment in Finland 140 Construction Confidence Indicator rose above the long-
Slide 19: Stable growth in renovation to continue
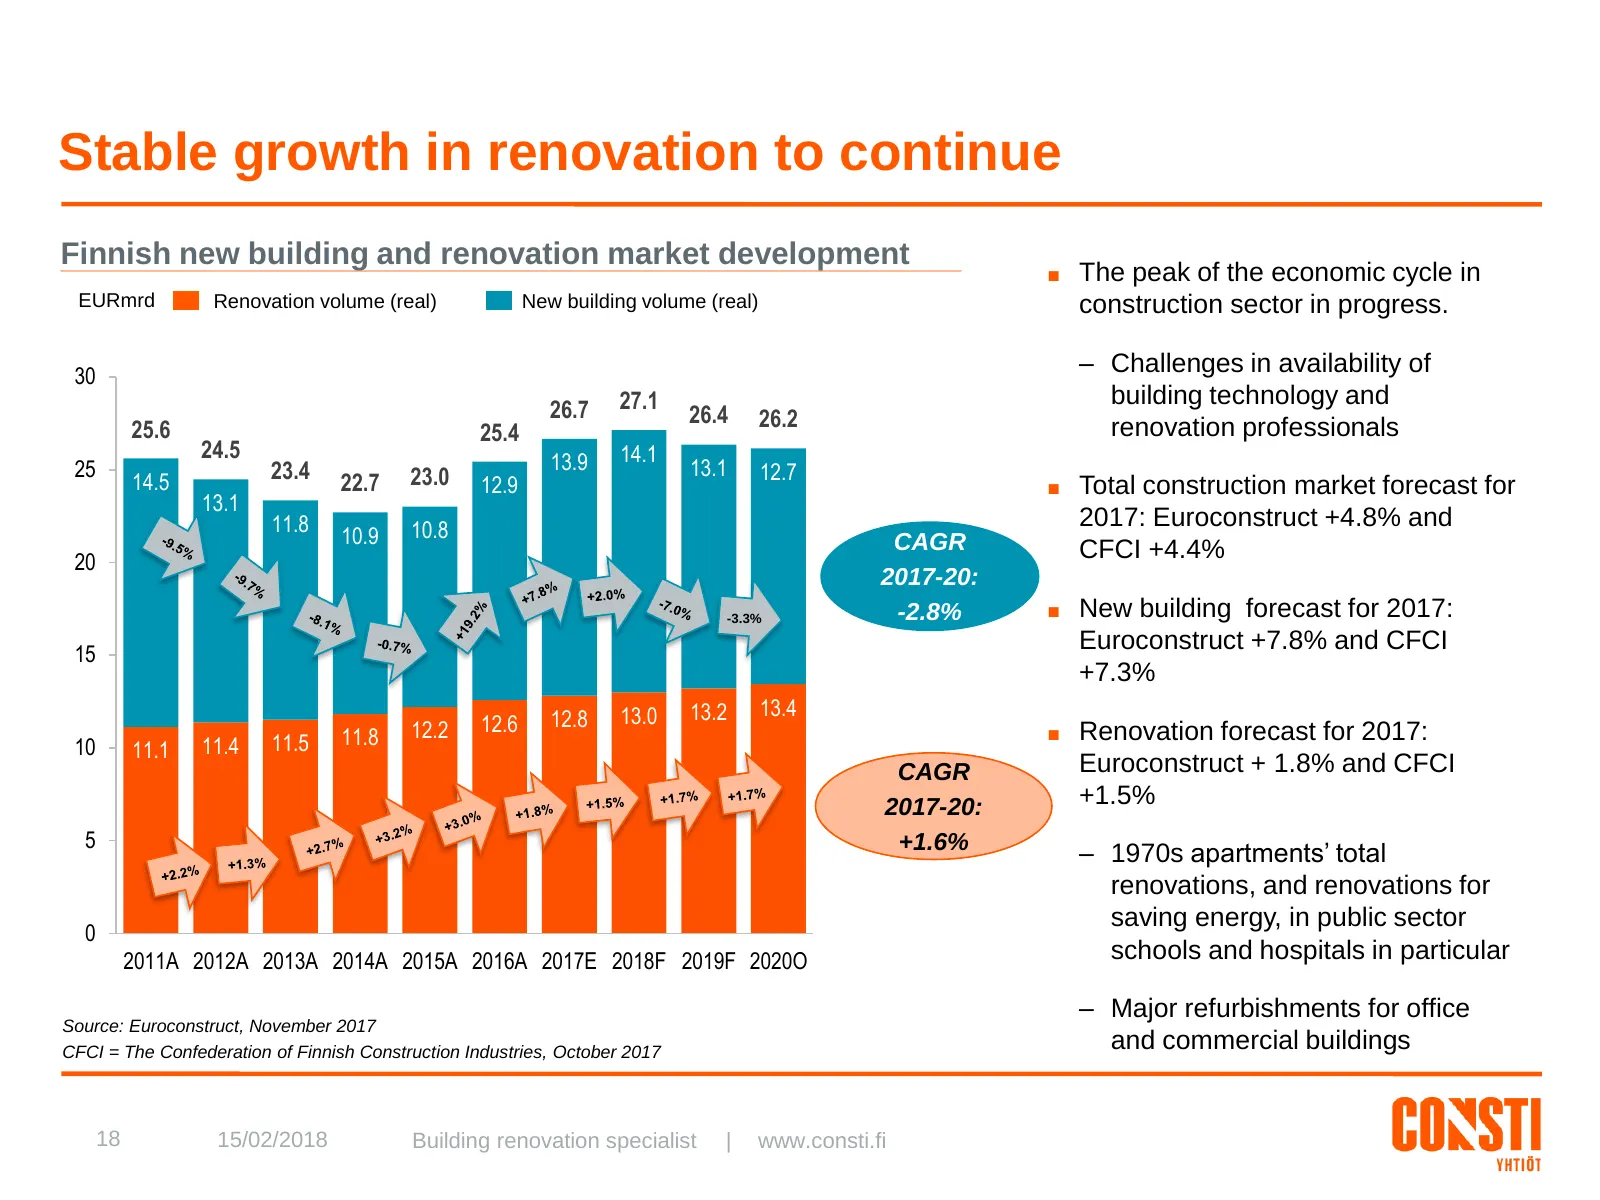
Stable growth in renovation to continue Finnish new building and renovation market development ■ The peak of the economic cycle in EURmrd Renovation volume (real) New building volume (real) construction sector in progress. 30 – Challenges in availability of 27.1 building technology and 26.7 26.4 26.
Slide 20: Demand-driven renovation market growth supported by structural drivers
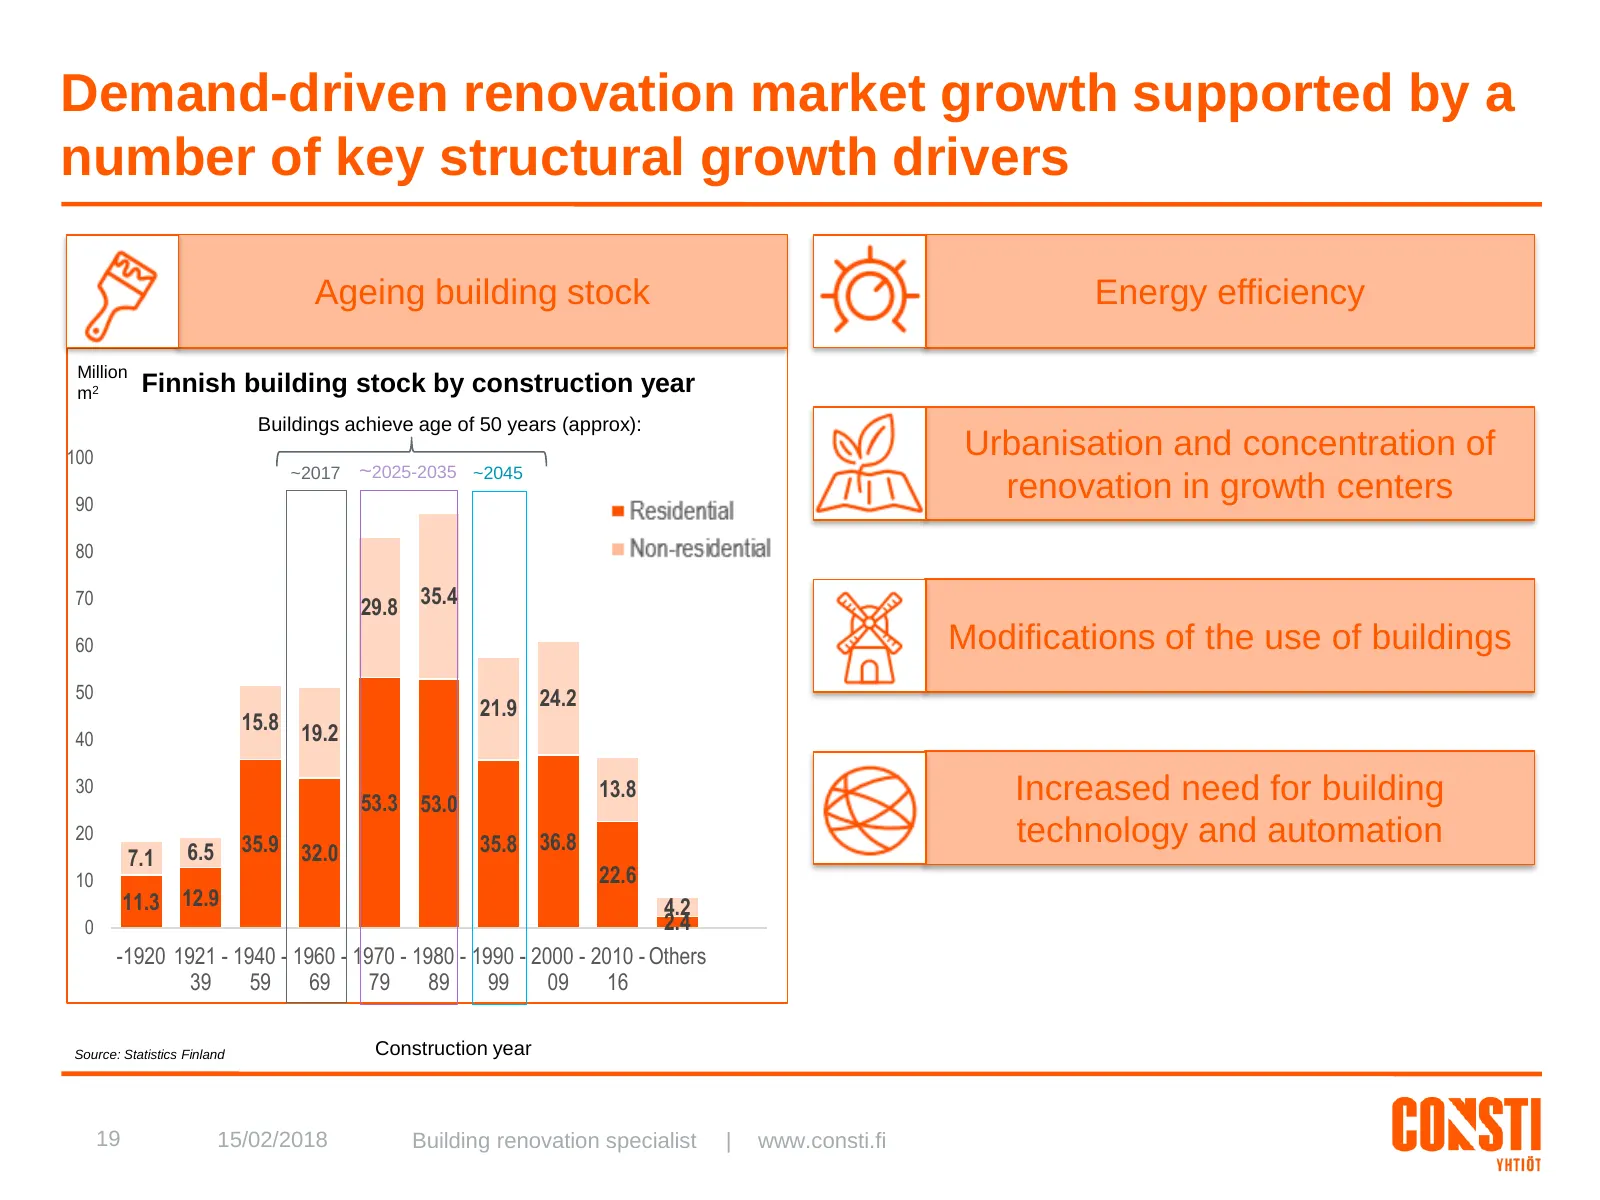
Demand-driven renovation market growth supported by a number of key structural growth drivers Ageing building stock Energy efficiency Million m2 Finnish building stock by construction year Buildings achieve age of 50 years (approx): 100 Urbanisation and concentration of ~2017 ~2025-2035 ~2045 90 88.
Slide 21: Realisation of Consti's long-term financial targets in 2017
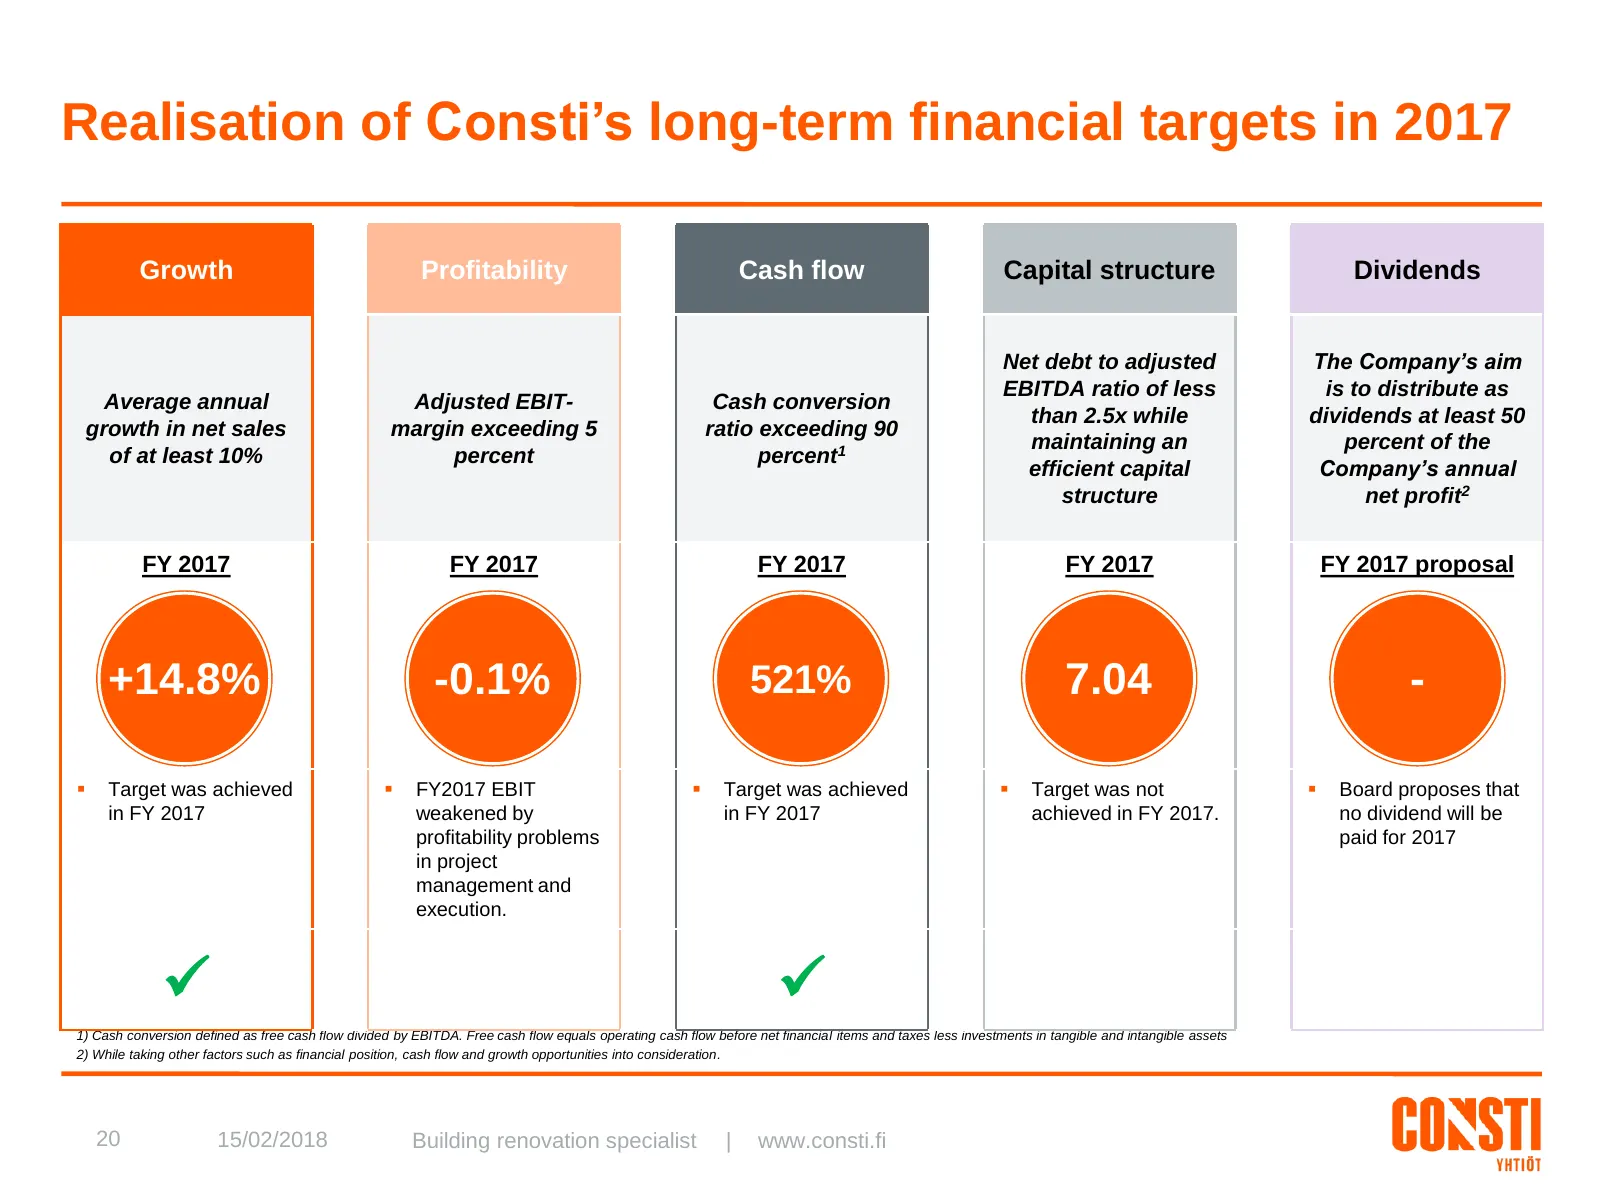
Realisation of Consti’s long-term financial targets in 2017 Growth Profitability Cash flow Capital structure Dividends Net debt to adjusted The Company’s aim EBITDA ratio of less is to distribute as Average annual Adjusted EBIT- Cash conversion than 2.5x while dividends at least 50 growth in net sal
Slide 22: Guidance for financial year 2018
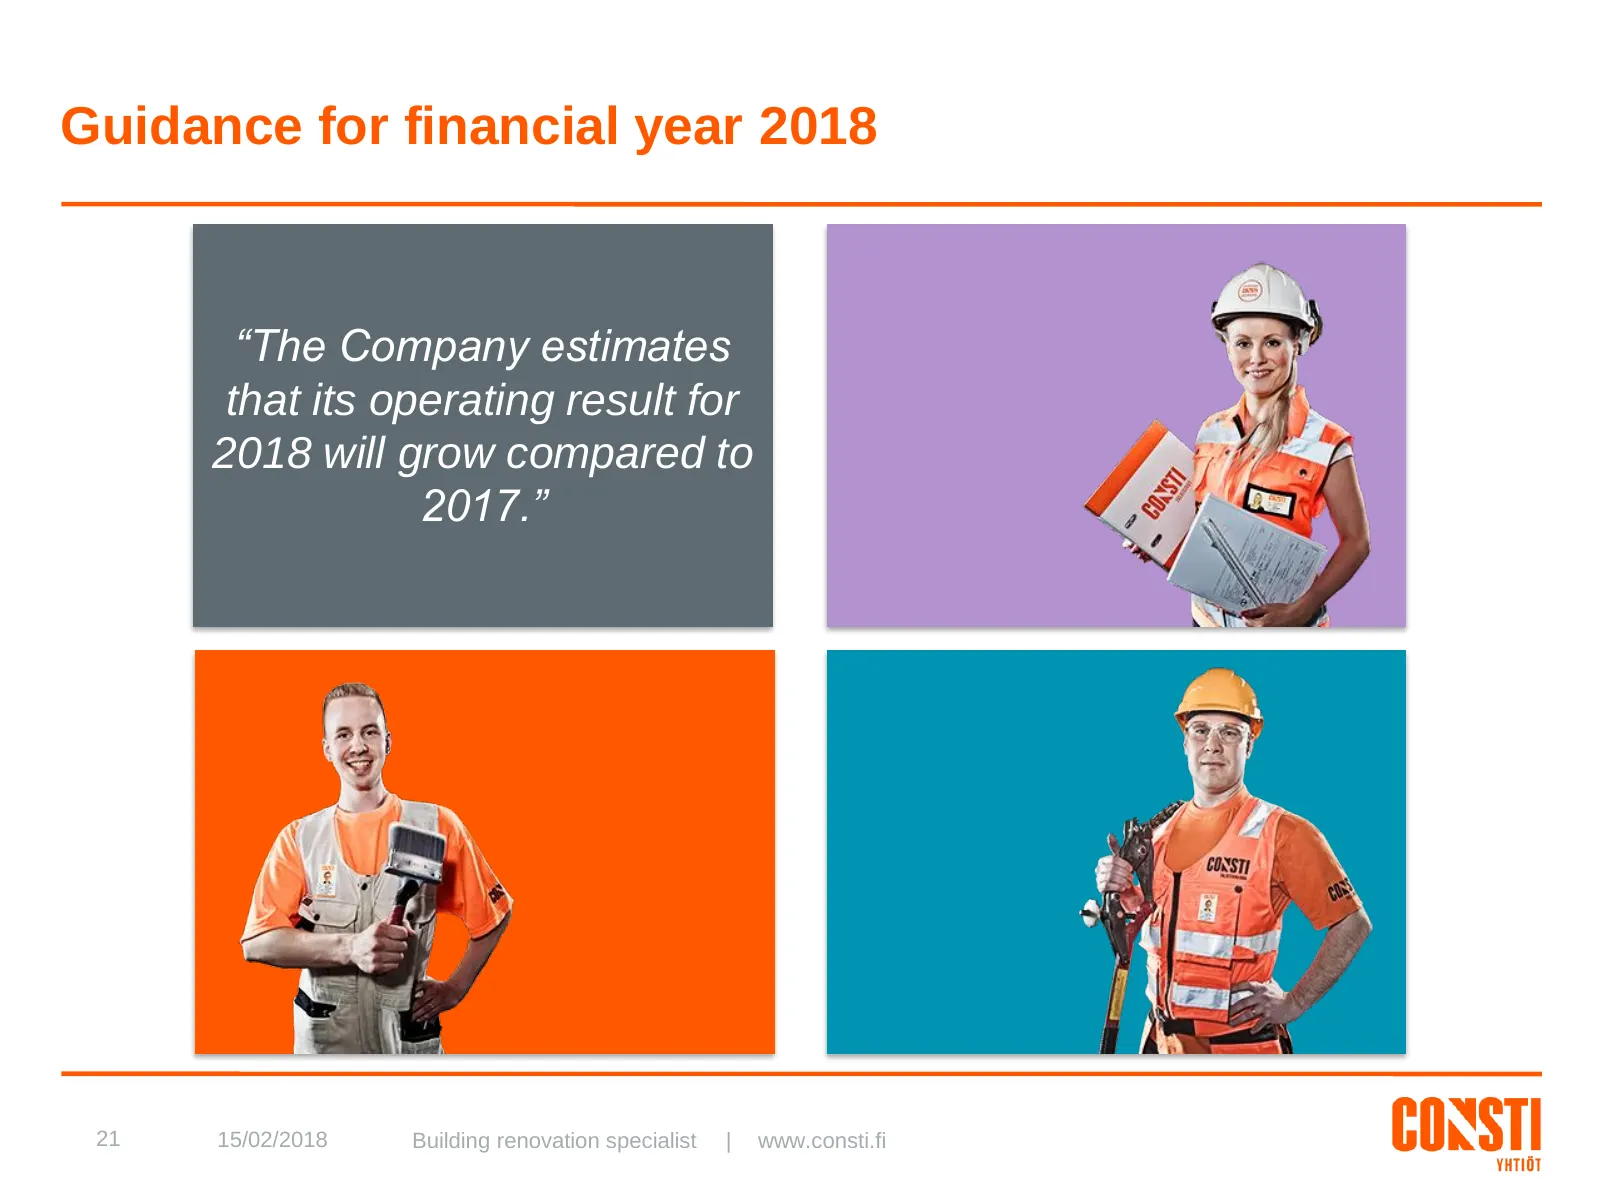
Guidance for financial year 2018 “The Company estimates that its operating result for 2018 will grow compared to 2017.” 21 15/02/2018 Building renovation specialist | www.consti.fi
Slide 23: Summary
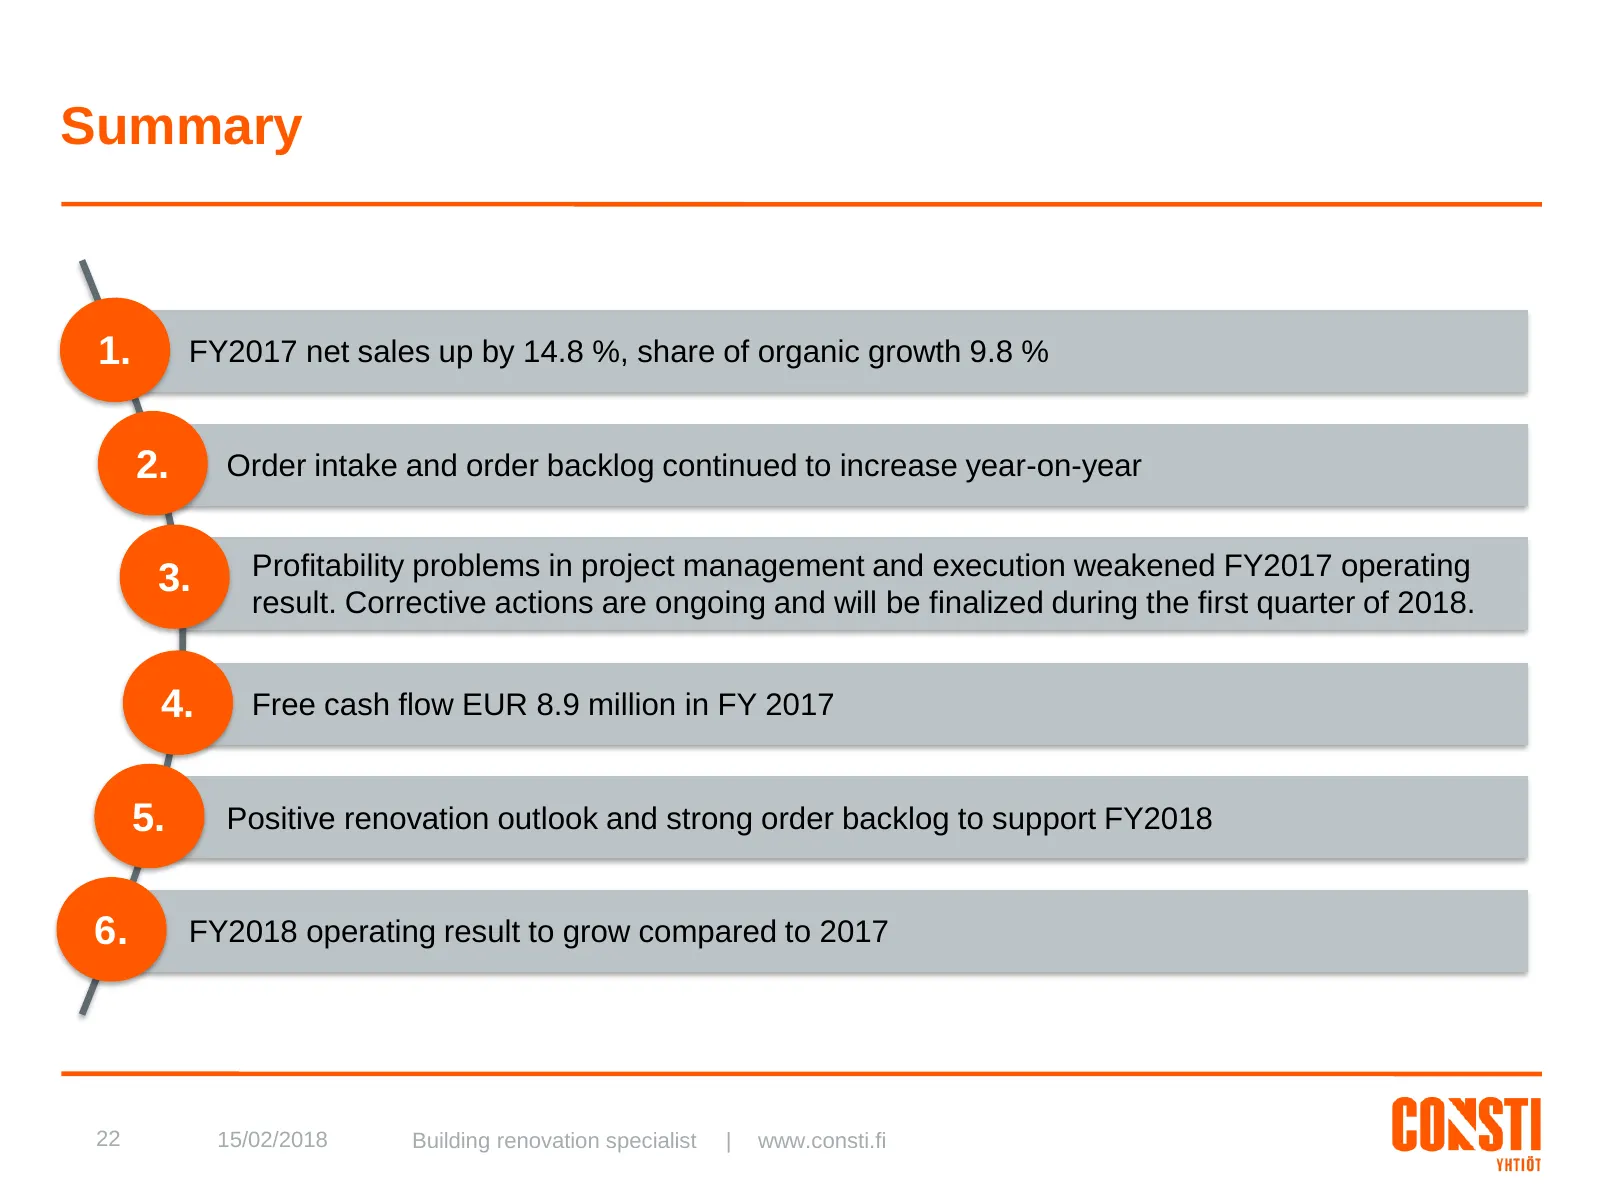
Summary 1. FY2017 net sales up by 14.8 %, share of organic growth 9.8 % 2. Order intake and order backlog continued to increase year-on-year 3. Profitability problems in project management and execution weakened FY2017 operating result. Corrective actions are ongoing and will be finalized during the
Slide 24: Appendix
Appendix 23 15/02/2018 Building renovation specialist | www.consti.fi
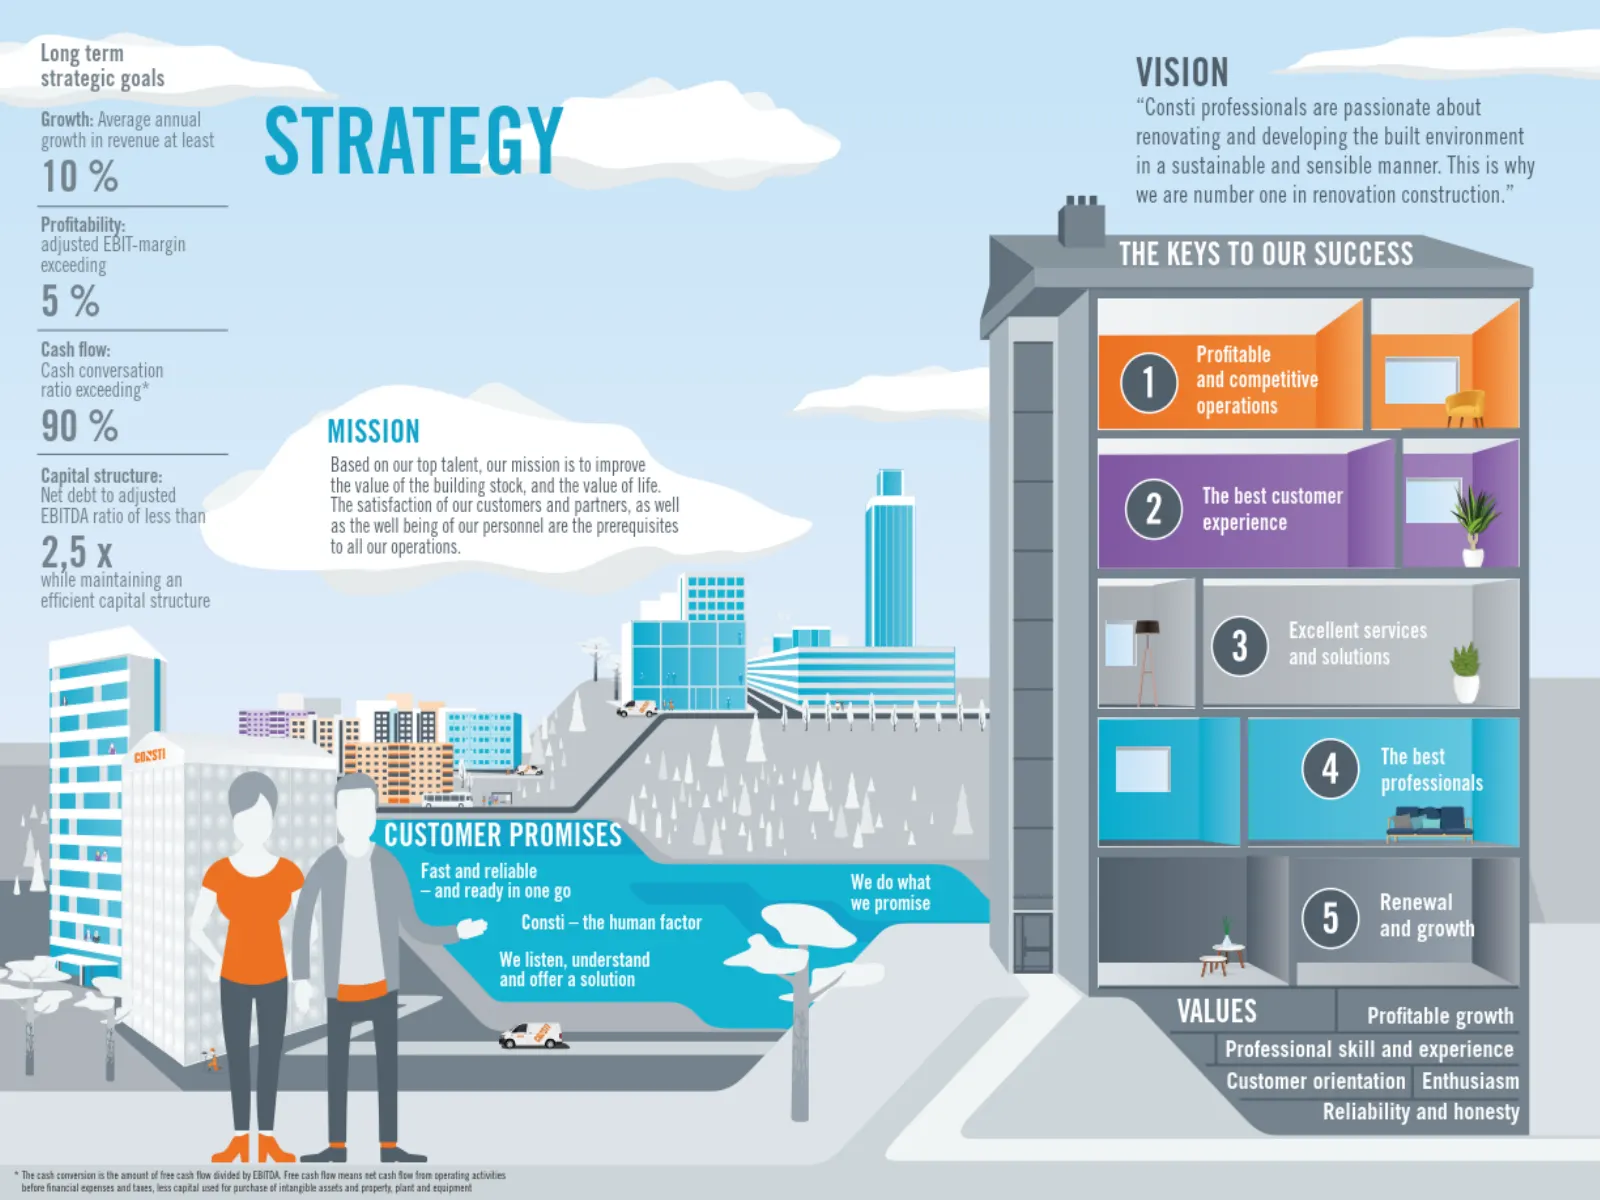
Slide 25: Building renovation specialist www.consti.fi
24 15/02/2018 Building renovation specialist | www.consti.fi
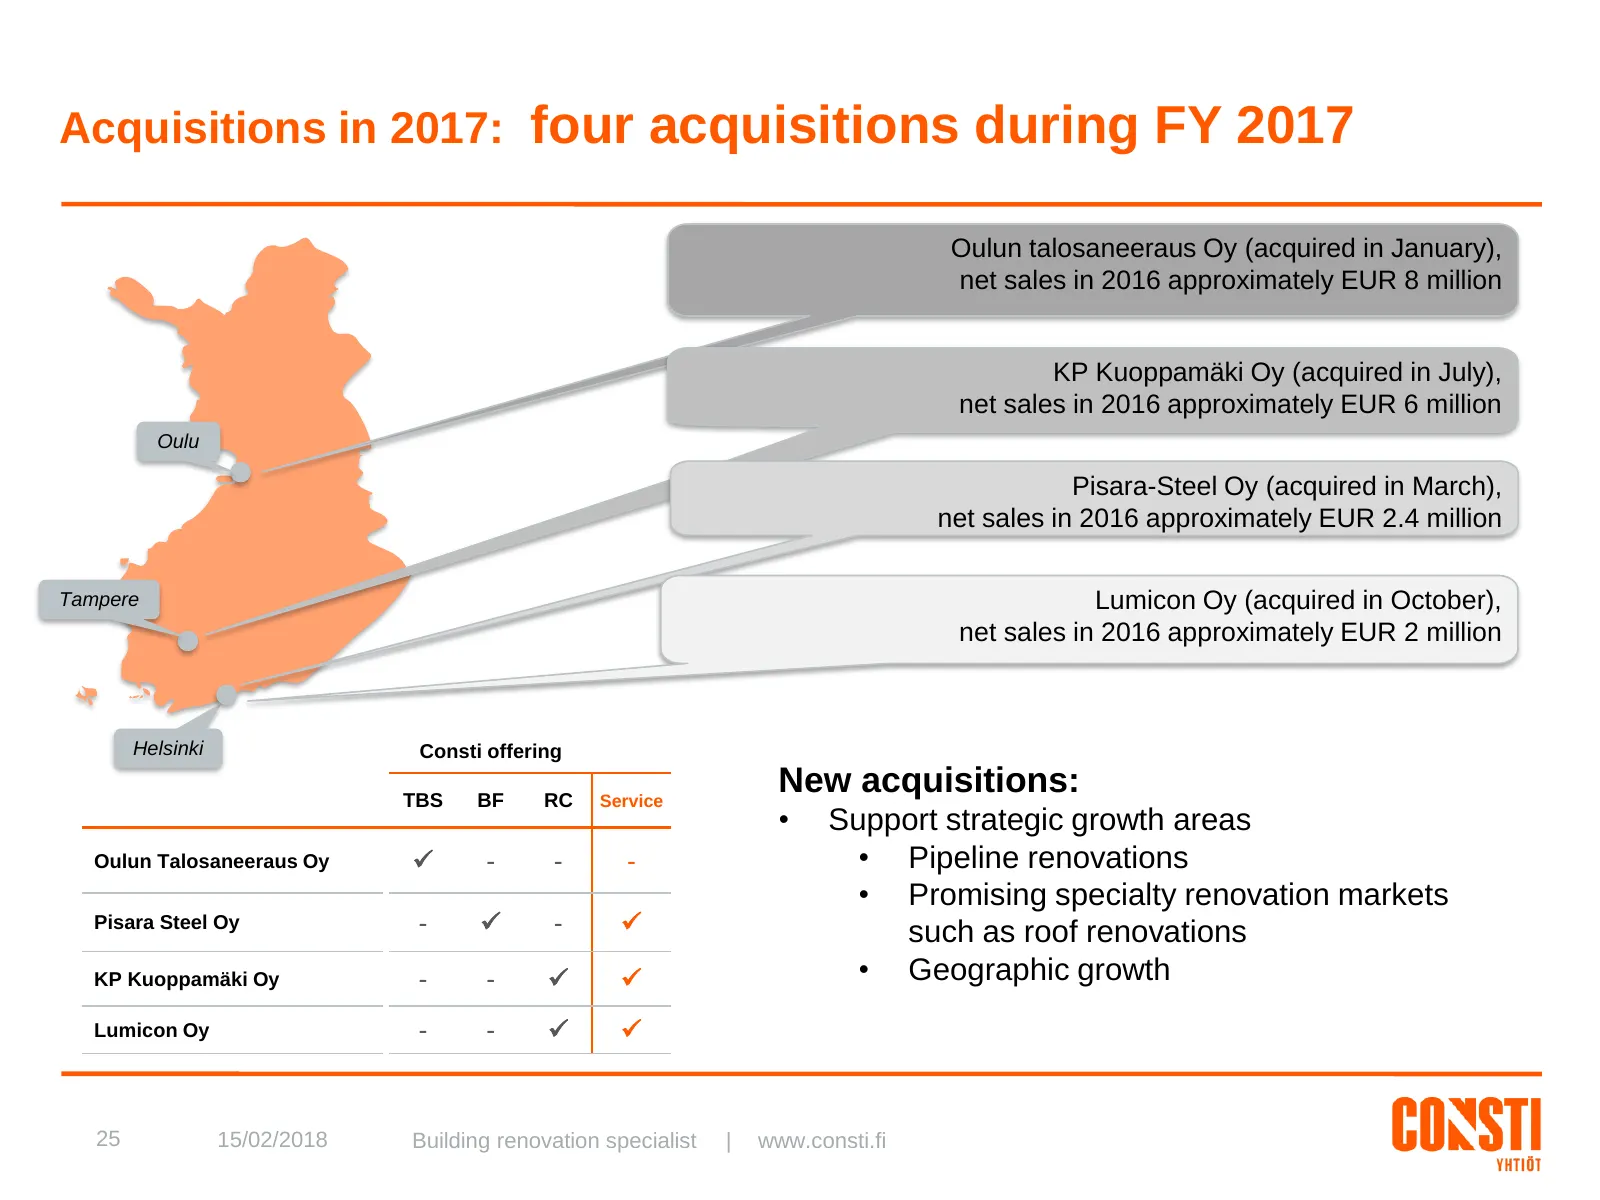
Slide 26: Acquisitions in 2017: four acquisitions during FY 2017
Acquisitions in 2017: four acquisitions during FY 2017 Oulun talosaneeraus Oy (acquired in January), net sales in 2016 approximately EUR 8 million KP Kuoppamäki Oy (acquired in July), net sales in 2016 approximately EUR 6 million Oulu Pisara-Steel Oy (acquired in March), net sales in 2016 approximat
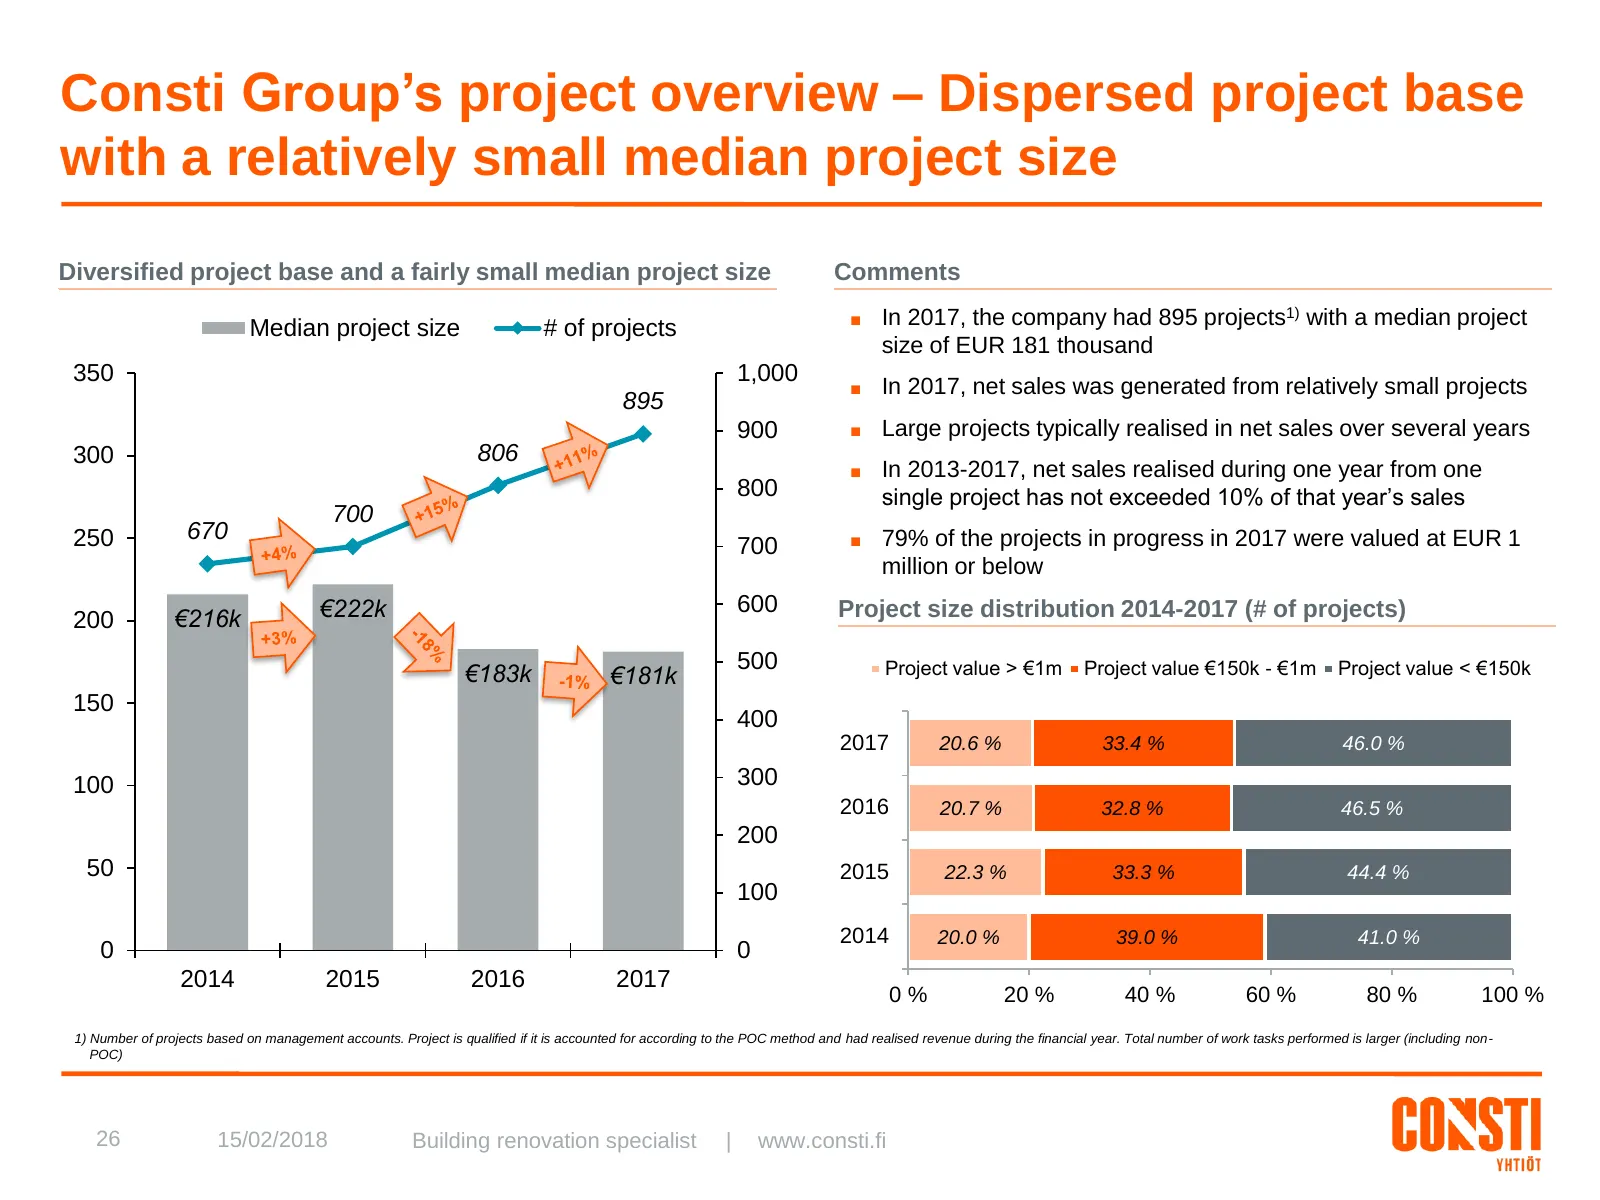
Slide 27: Consti Group's project overview – Dispersed project base
Consti Group’s project overview – Dispersed project base with a relatively small median project size Diversified project base and a fairly small median project size Comments Median project size # of projects ■ In 2017, the company had 895 projects1) with a median project size of EUR 181 thousand 350
Slide 28: Financial Statements 1-12/2017
FINANCIAL STATEMENTS 1-12/2017 CONSTI GROUP PLC FY2017 CONSTI GROUP PLC HOPEATIE 2 FI-00440, HELSINKI BUSINESS ID 2203605-05 WWW.CONSTI.FI 27 15/02/2018 Building renovation specialist | www.consti.fi
Source: Internet Archive copy of investor.consti.fi
More decks from Consti Oyj
 Q3 2026 Earnings Presentation21 slides · Oct 23, 2026
 H1 2026 Earnings Presentation21 slides · Jul 17, 2026
 Q1 2026 Earnings Presentation21 slides · Apr 29, 2026
 Shareholder Meeting (April 2026)19 slides · Apr 9, 2026
 Investor Presentation (February 2026)26 slides · Feb 25, 2026
 FY2025 Earnings Presentation23 slides · Feb 6, 2026