Snap-On Incorporated · NYSE:SNA
Snap-On — Q3 2015 Earnings Presentation
13 slides from Snap-On's earnings presentation, Oct 22, 2015
Slide 1: Quarterly Financial Review Third Quarter 2015
Quarterly Financial Review Third Quarter 2015 Snap-on Tools In-Depth Business Review Q3-2015 Board Quarterly Review of Directors 1April DB-2 1 -1 © 2015 Snap-on 27, 2011 Incorporated
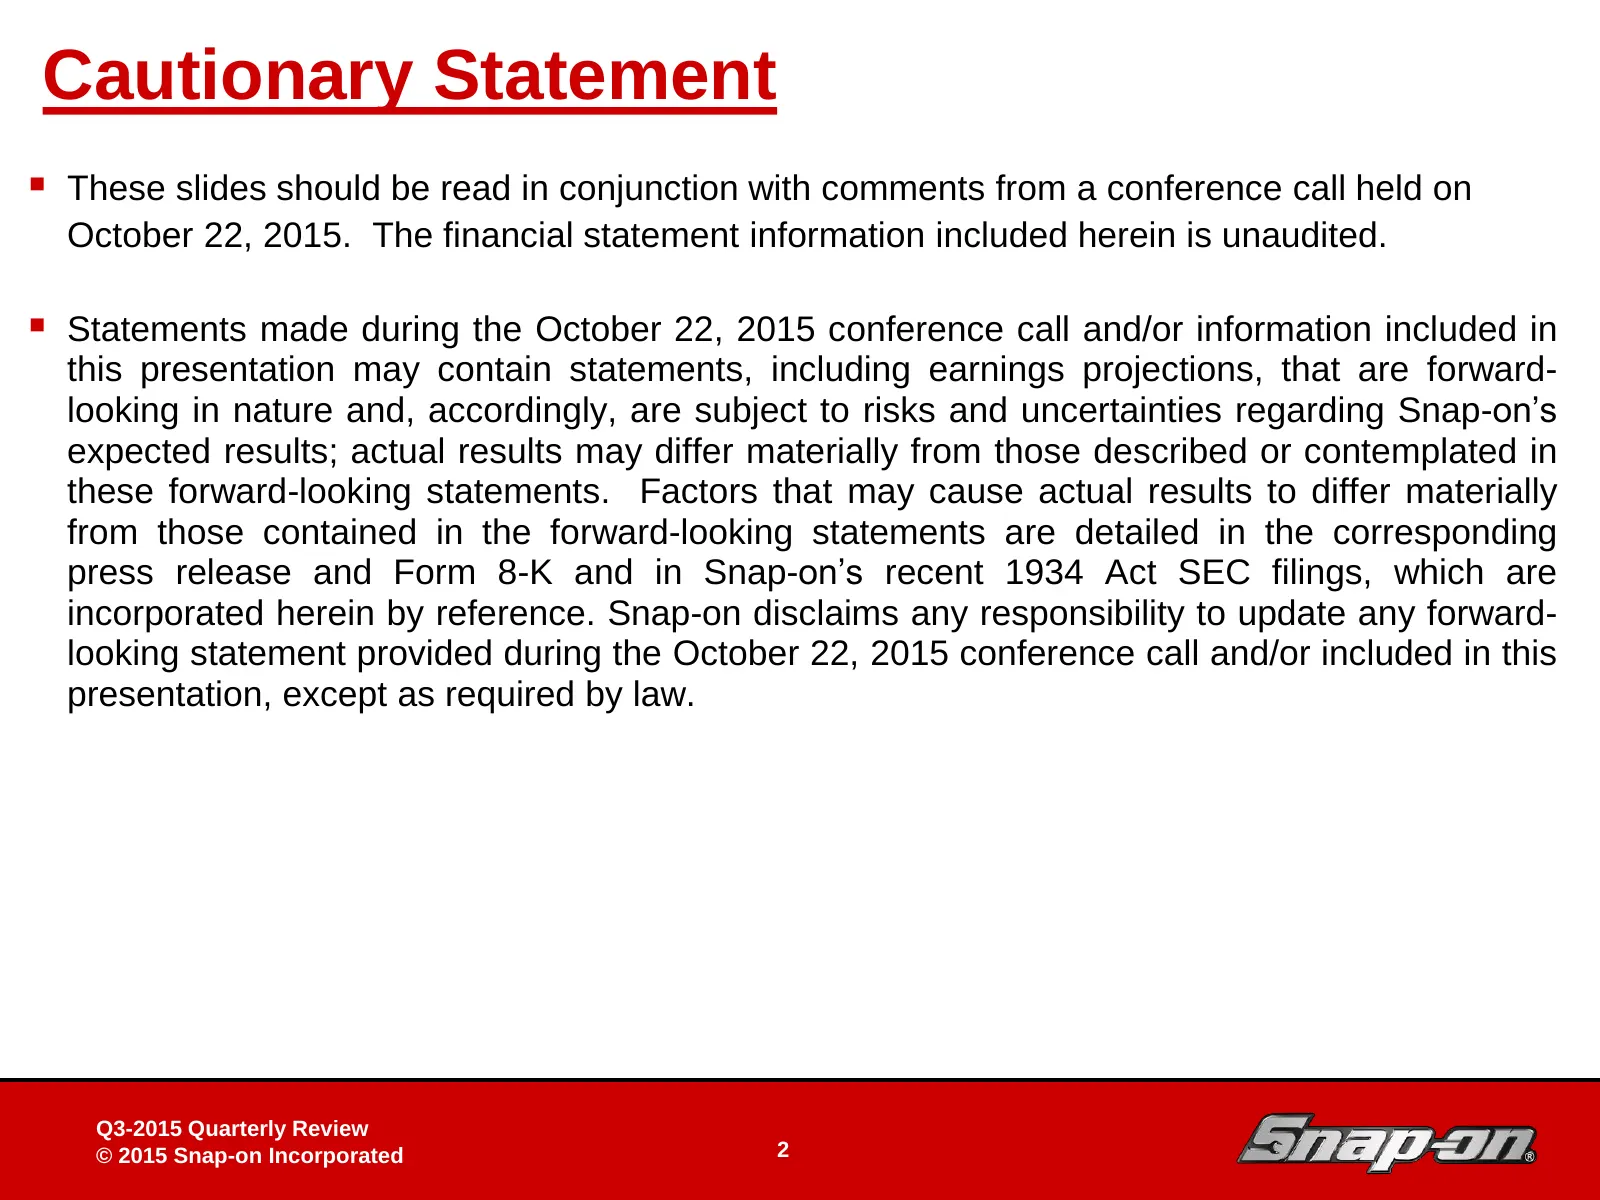
Slide 2: Cautionary Statement
Cautionary Statement These slides should be read in conjunction with comments from a conference call held on October 22, 2015. The financial statement information included herein is unaudited. Statements made during the October 22, 2015 conference call and/or information included in this present

Slide 3: Snap-on Tools In-Depth Business Review
Snap-on Tools In-Depth Business Review Board of Directors DB-2 3April 27, 2011 3 -3

Slide 4: Nick Pinchuk, Chairman and Chief Executive Officer
Nick Pinchuk Chairman and Chief Executive Officer Snap-on Tools In-Depth Business Review Q3-2015 Board Quarterly Review of Directors 4April DB-2 4 -4 © 2015 Snap-on 27, 2011 Incorporated

Slide 5: Aldo Pagliari, Senior Vice President and Chief Financial Officer
Aldo Pagliari Senior Vice President and Chief Financial Officer Snap-on Tools In-Depth Business Review Q3-2015 Board Quarterly Review of Directors 5April DB-2 5 -5 © 2015 Snap-on 27, 2011 Incorporated
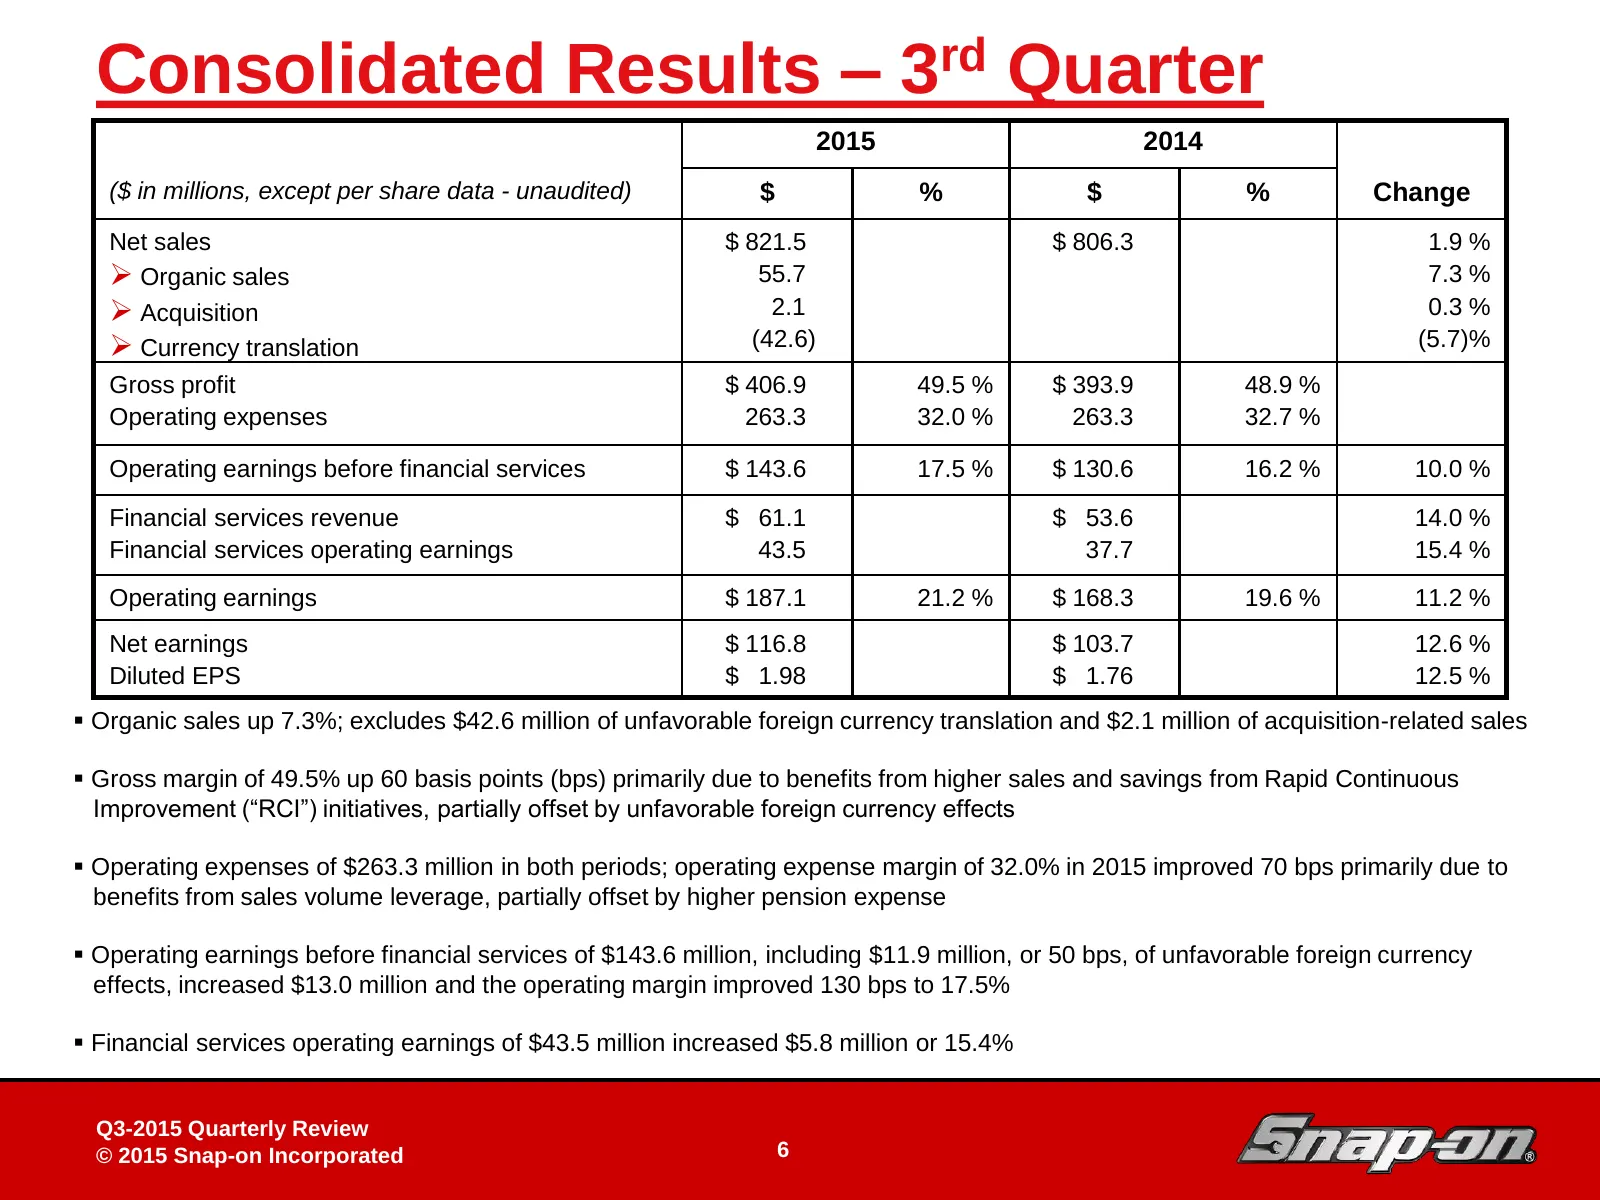
Slide 6: Consolidated Results – 3rd Quarter
Consolidated Results – 3rd Quarter 2015 2014 ($ in millions, except per share data - unaudited) $ % $ % Change Net sales $ 821.5 $ 806.3 1.9 % Organic sales 55.7 7.3 % Acquisition 2.1 0.3 % Currency translation (42.6) (5.7)% Gross profit $ 406.9 49.5 % $ 393.9 48.9 % Operating expenses 263.3 3
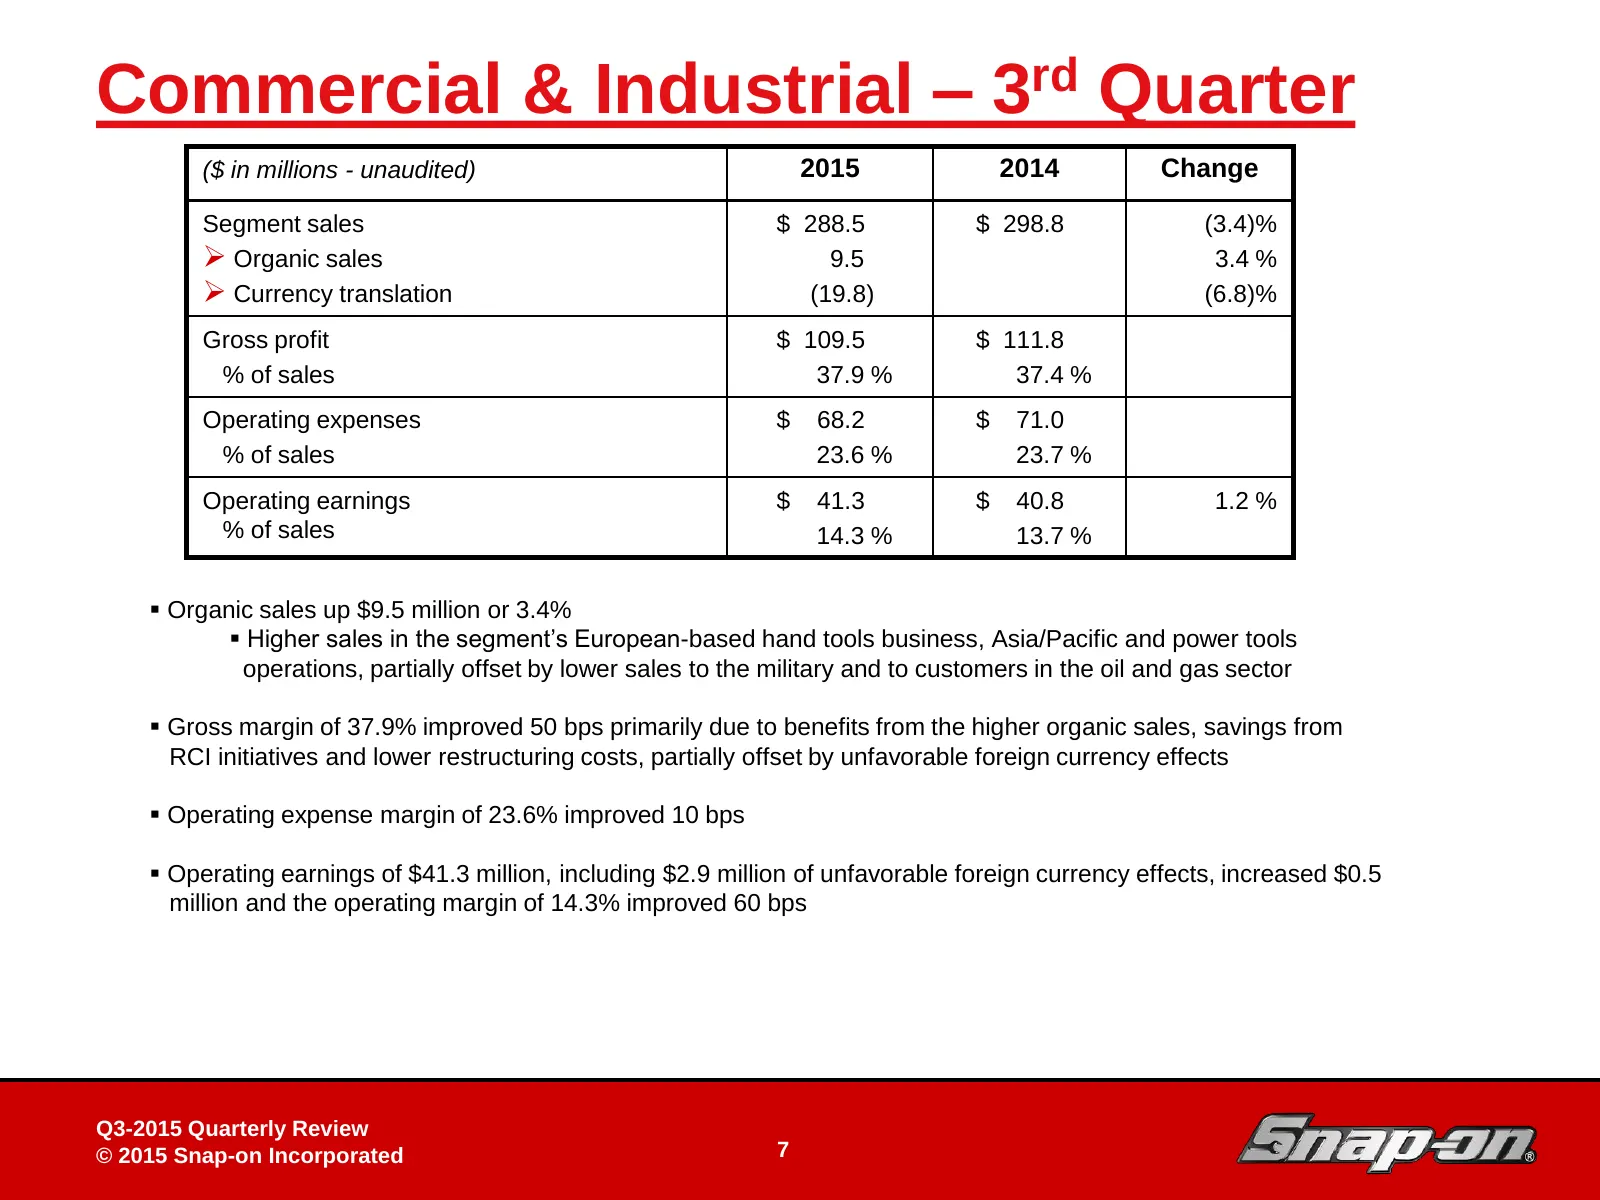
Slide 7: Commercial & Industrial – 3rd Quarter
Commercial & Industrial – 3rd Quarter ($ in millions - unaudited) 2015 2014 Change Segment sales $ 288.5 $ 298.8 (3.4)% Organic sales 9.5 3.4 % Currency translation (19.8) (6.8)% Gross profit $ 109.5 $ 111.8 % of sales 37.9 % 37.4 % Operating expenses $ 68.2 $ 71.0 % of sales 23.6 % 23.7 % Opera
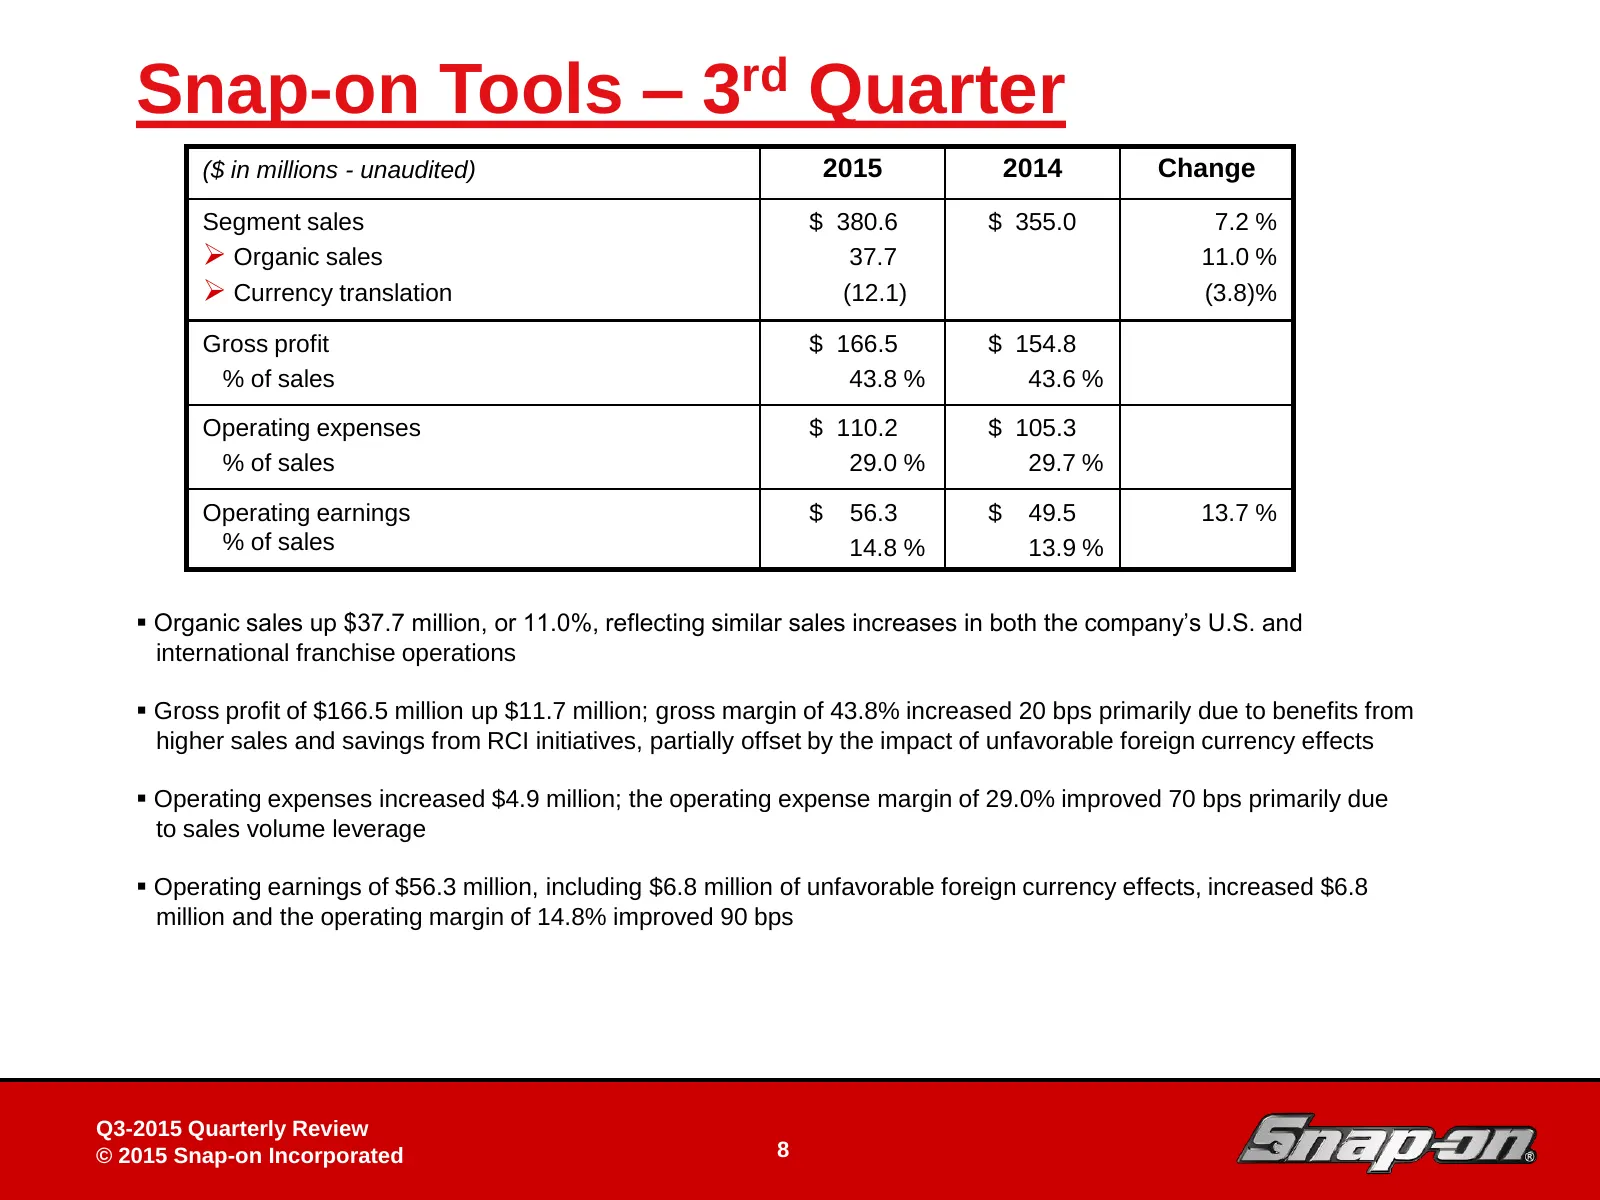
Slide 8: Snap-on Tools – 3rd Quarter
Snap-on Tools – 3rd Quarter ($ in millions - unaudited) 2015 2014 Change Segment sales $ 380.6 $ 355.0 7.2 % Organic sales 37.7 11.0 % Currency translation (12.1) (3.8)% Gross profit $ 166.5 $ 154.8 % of sales 43.8 % 43.6 % Operating expenses $ 110.2 $ 105.3 % of sales 29.0 % 29.7 % Operating ea
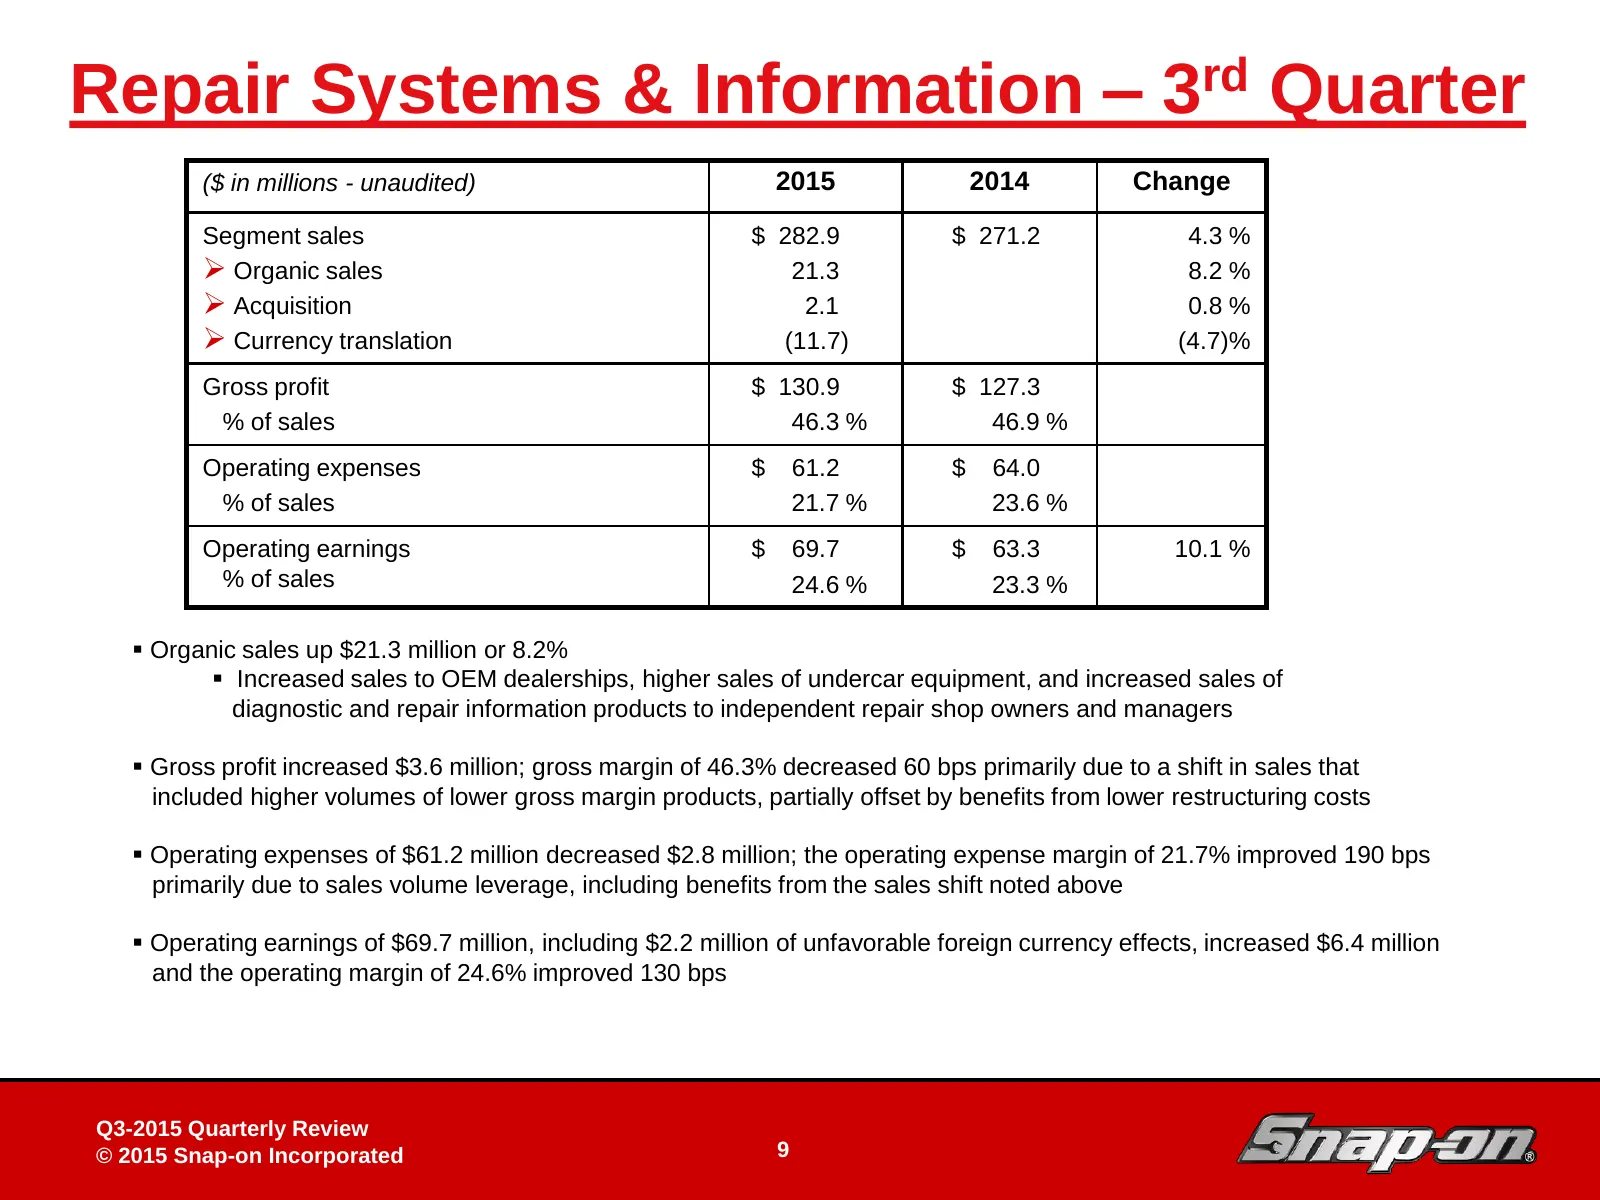
Slide 9: Repair Systems & Information – 3rd Quarter
Repair Systems & Information – 3rd Quarter ($ in millions - unaudited) 2015 2014 Change Segment sales $ 282.9 $ 271.2 4.3 % Organic sales 21.3 8.2 % Acquisition 2.1 0.8 % Currency translation (11.7) (4.7)% Gross profit $ 130.9 $ 127.3 % of sales 46.3 % 46.9 % Operating expenses $ 61.2 $ 64.0 %
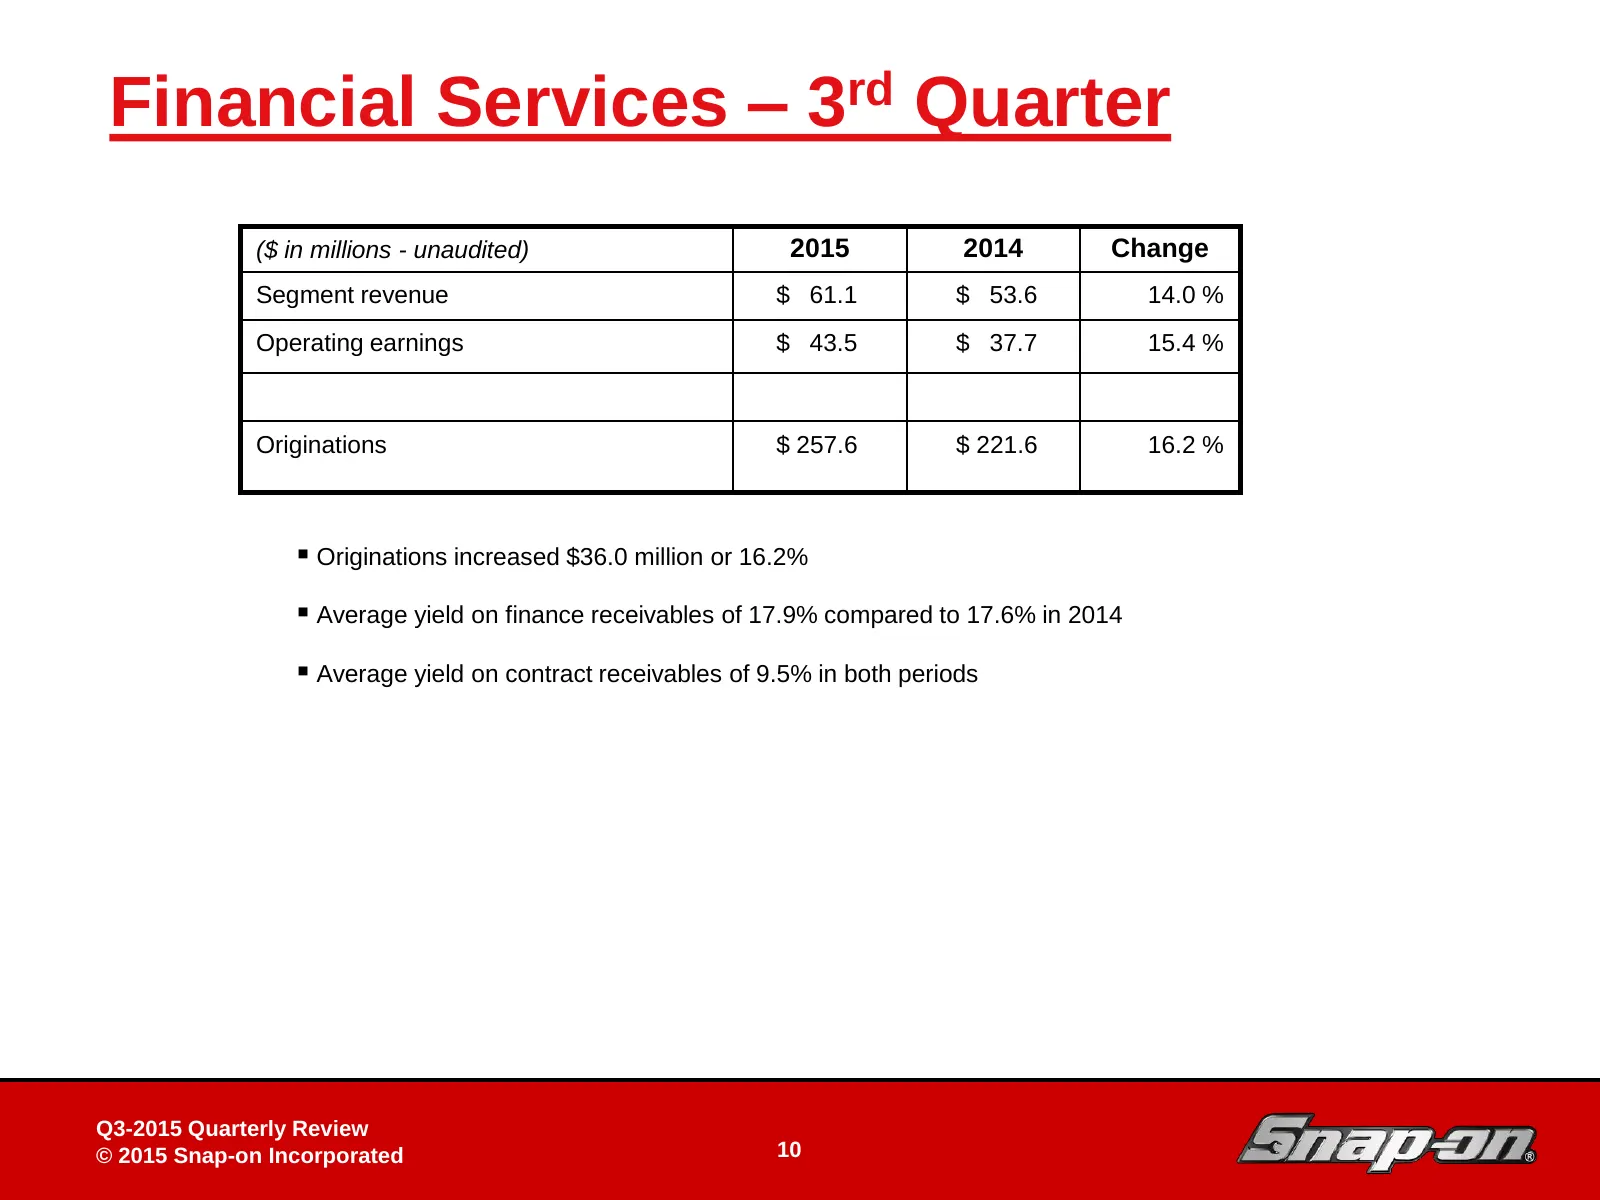
Slide 10: Financial Services – 3rd Quarter
Financial Services – 3rd Quarter ($ in millions - unaudited) 2015 2014 Change Segment revenue $ 61.1 $ 53.6 14.0 % Operating earnings $ 43.5 $ 37.7 15.4 % Originations $ 257.6 $ 221.6 16.2 % Originations increased $36.0 million or 16.2% Average yield on finance receivables of 17.9% compared to 1
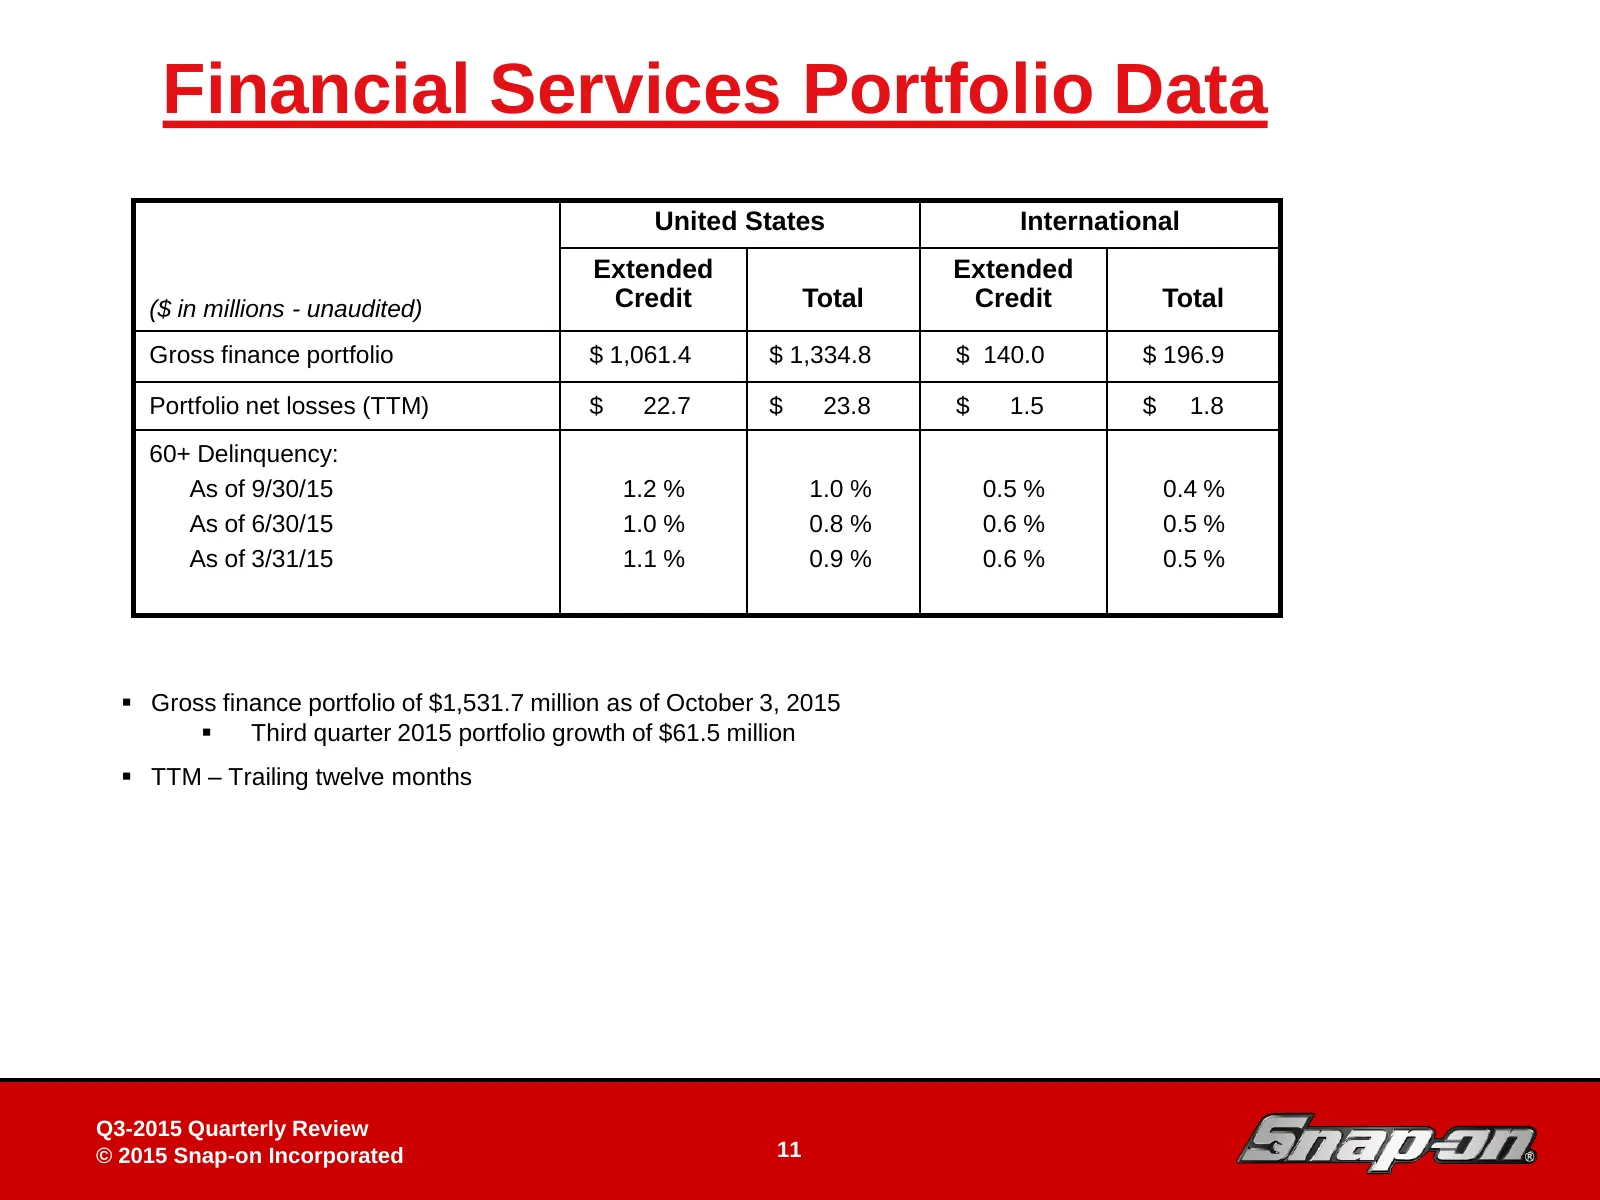
Slide 11: Financial Services Portfolio Data
Financial Services Portfolio Data United States International Extended Extended ($ in millions - unaudited) Credit Total Credit Total Gross finance portfolio $ 1,061.4 $ 1,334.8 $ 140.0 $ 196.9 Portfolio net losses (TTM) $ 22.7 $ 23.8 $ 1.5 $ 1.8 60+ Delinquency: As of 9/30/15 1.2 % 1.0 % 0.5 % 0.4
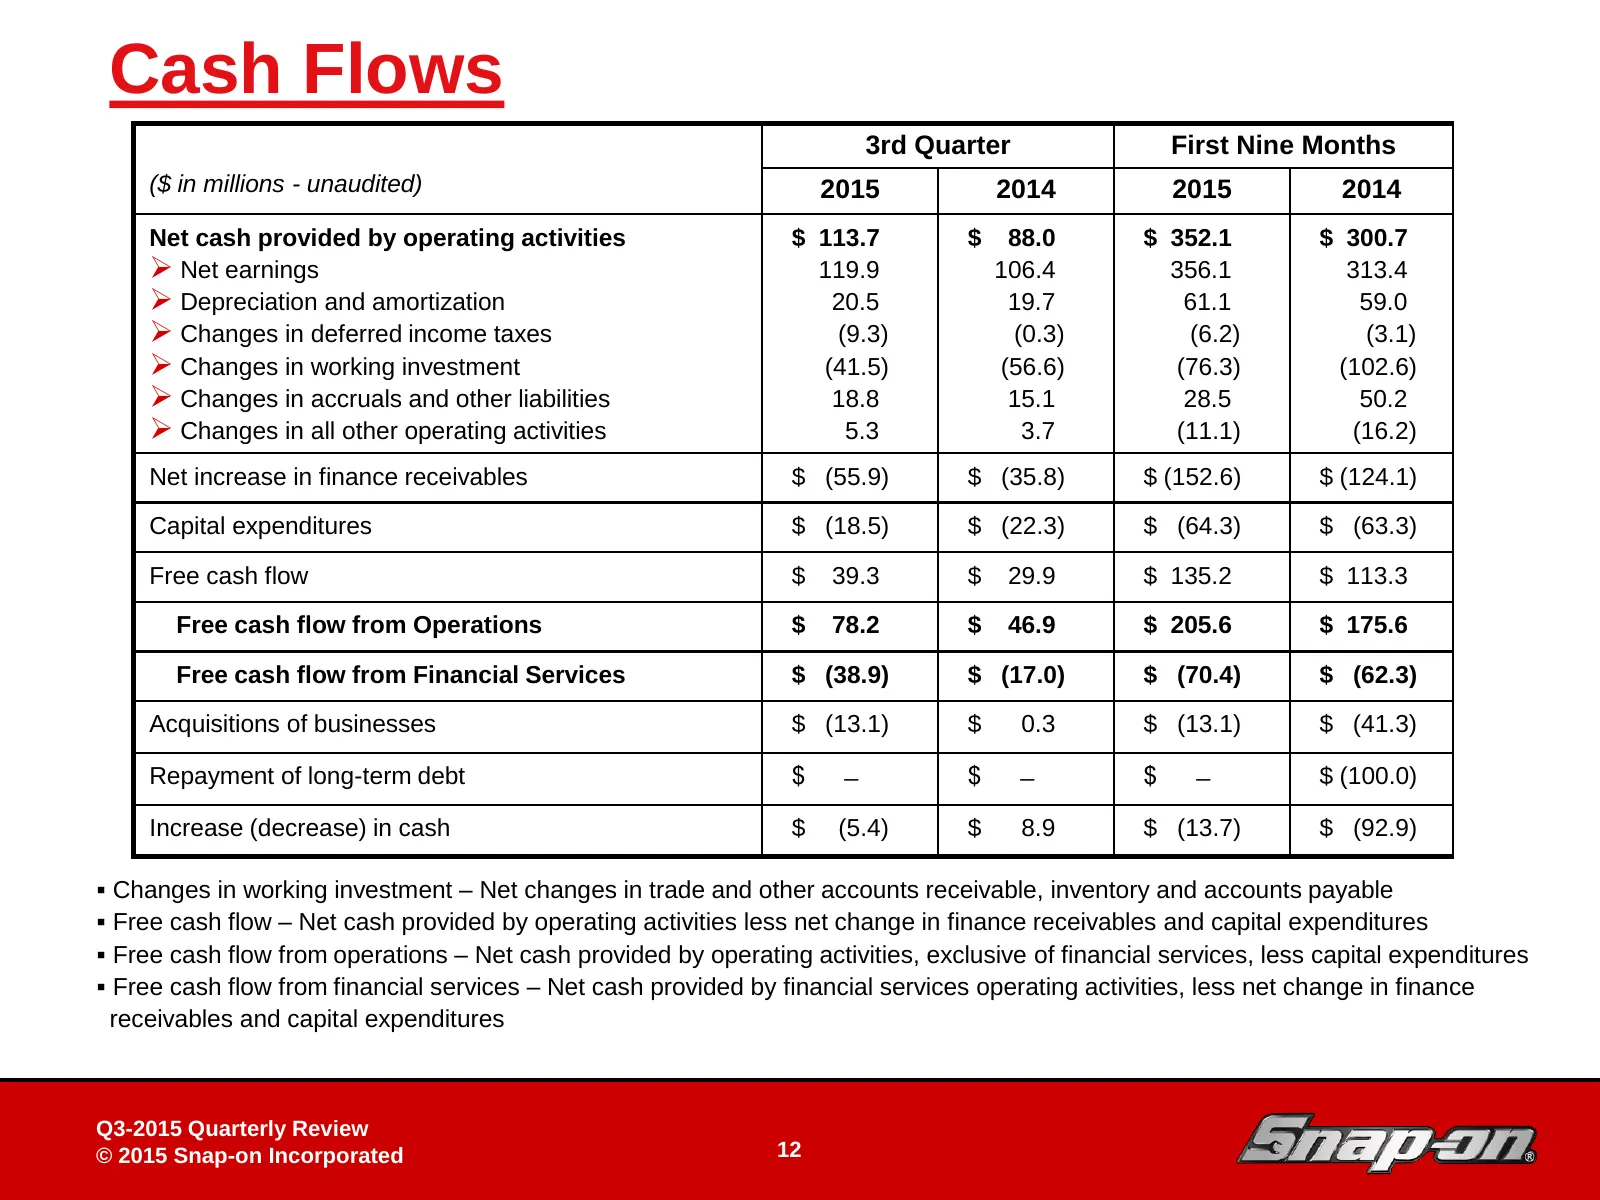
Slide 12: Cash Flows
Cash Flows 3rd Quarter First Nine Months ($ in millions - unaudited) 2015 2014 2015 2014 Net cash provided by operating activities $ 113.7 $ 88.0 $ 352.1 $ 300.7 Net earnings 119.9 106.4 356.1 313.4 Depreciation and amortization 20.5 19.7 61.1 59.0 Changes in deferred income taxes (9.3) (0.3)
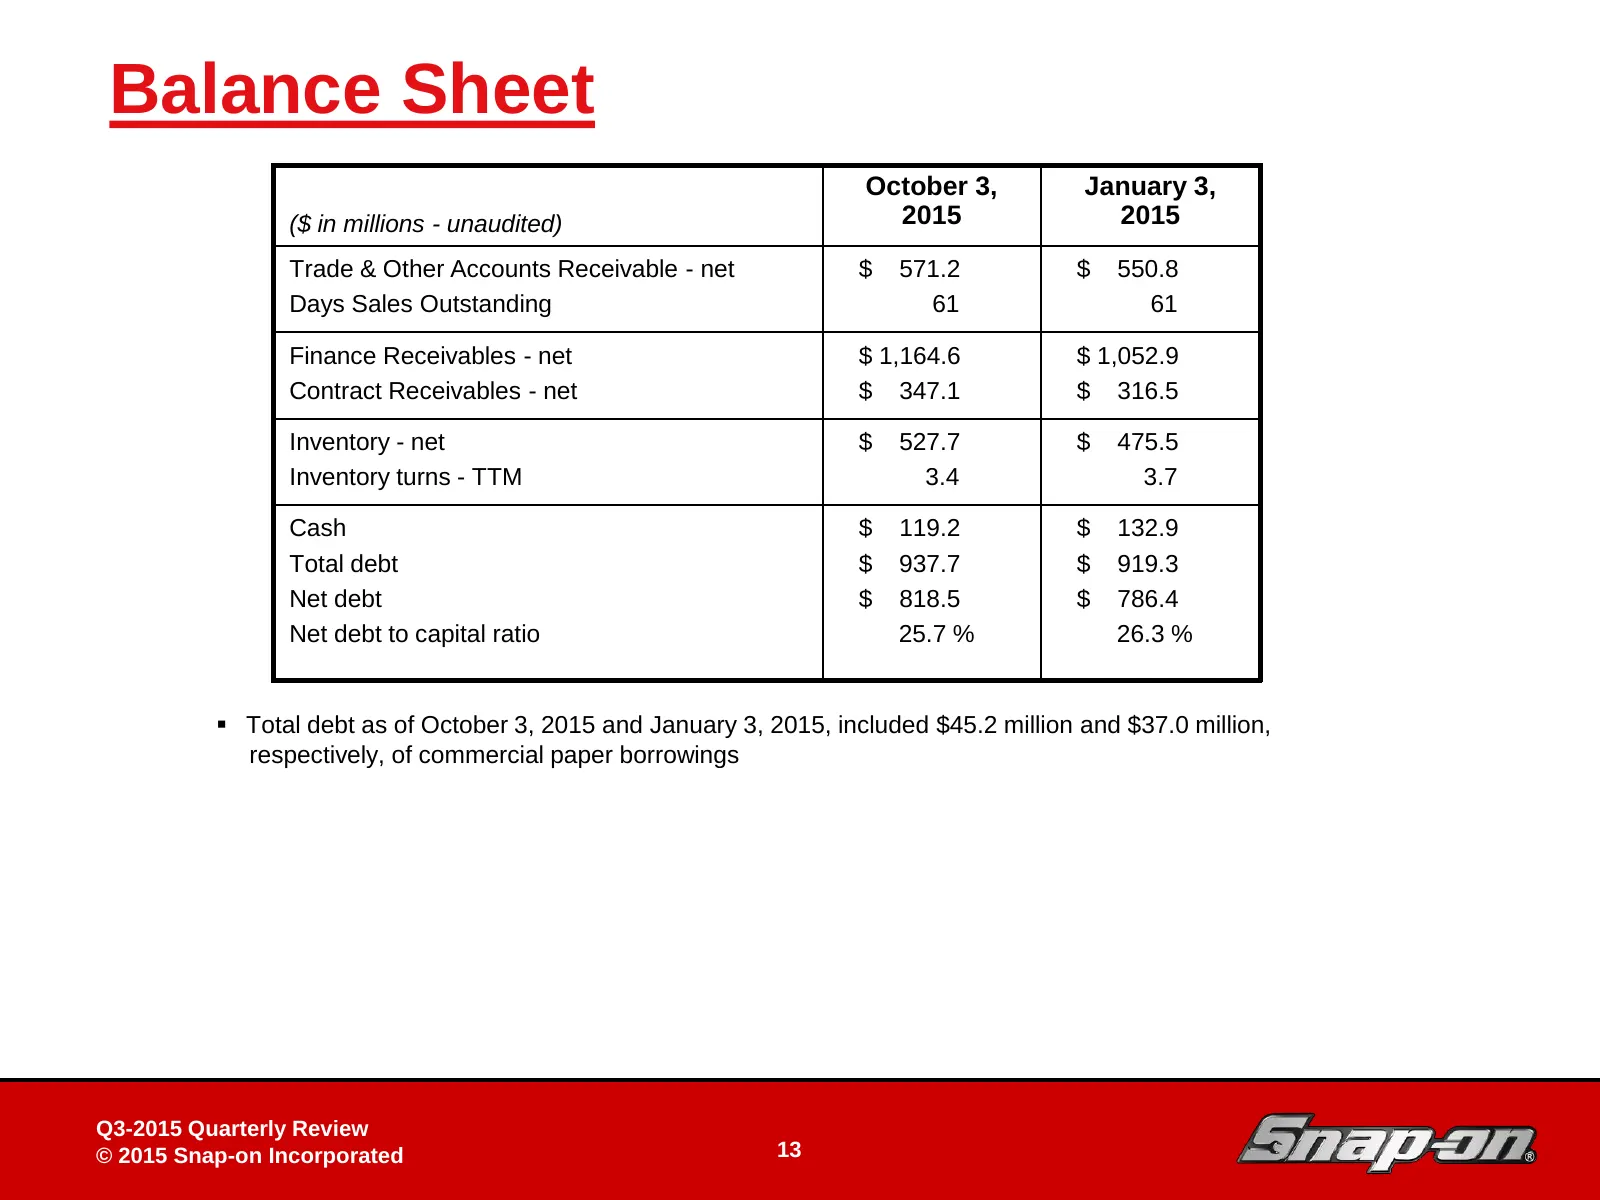
Slide 13: Balance Sheet
Balance Sheet October 3, January 3, ($ in millions - unaudited) 2015 2015 Trade & Other Accounts Receivable - net $ 571.2 $ 550.8 Days Sales Outstanding 61 61 Finance Receivables - net $ 1,164.6 $ 1,052.9 Contract Receivables - net $ 347.1 $ 316.5 Inventory - net $ 527.7 $ 475.5 Inventory turns - TT
Source: Internet Archive copy of snapon.com