Simulations Plus, Inc. · NASDAQ:SLP
Simulations Plus — Q3 FY2023 Earnings Presentation
24 slides from Simulations Plus's earnings presentation, Jul 6, 2023
Slide 1: Earnings Call – Q3 - FY23
Earnings Call – Q3 - FY23 July 6, 2023 1
Slide 2: Safe Harbor Statement
Safe Harbor Statement With the exception of historical information, the matters discussed in this presentation are forward- looking statements that involve a number of risks and uncertainties. Words like “believe,” “expect” and “anticipate” mean that these are our best estimates as of this writing,
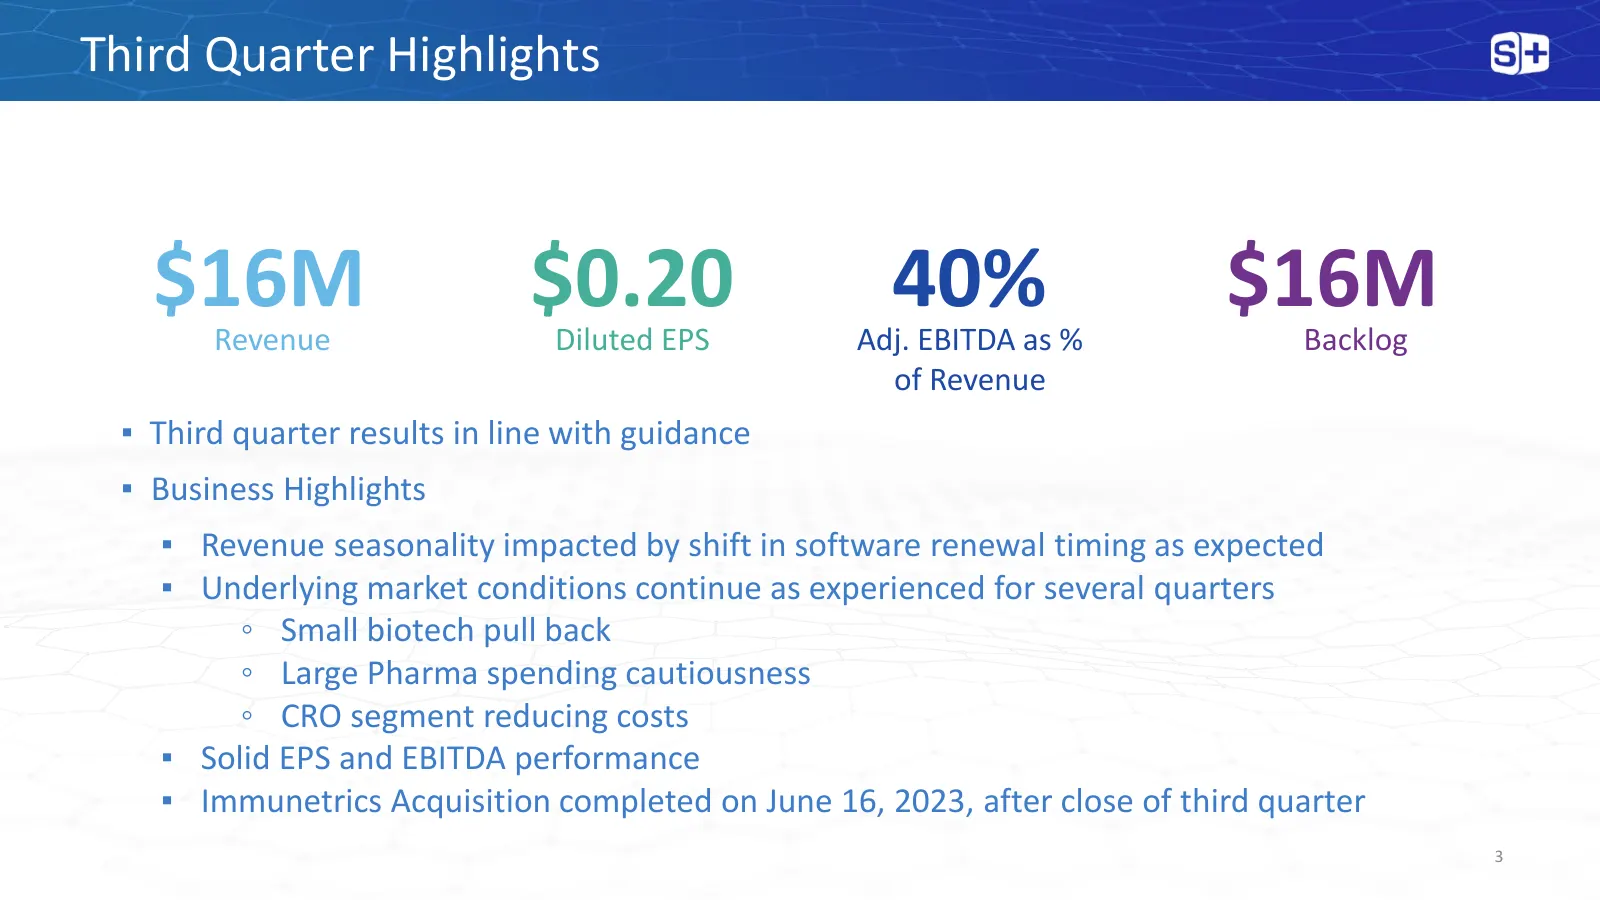
Slide 3: Third Quarter Highlights
Third Quarter Highlights $16MRevenue $0.20 Diluted EPS 40% Adj. EBITDA as % $16M Backlog of Revenue ▪ Third quarter results in line with guidance ▪ Business Highlights ▪ Revenue seasonality impacted by shift in software renewal timing as expected ▪ Underlying market conditions continue as experience
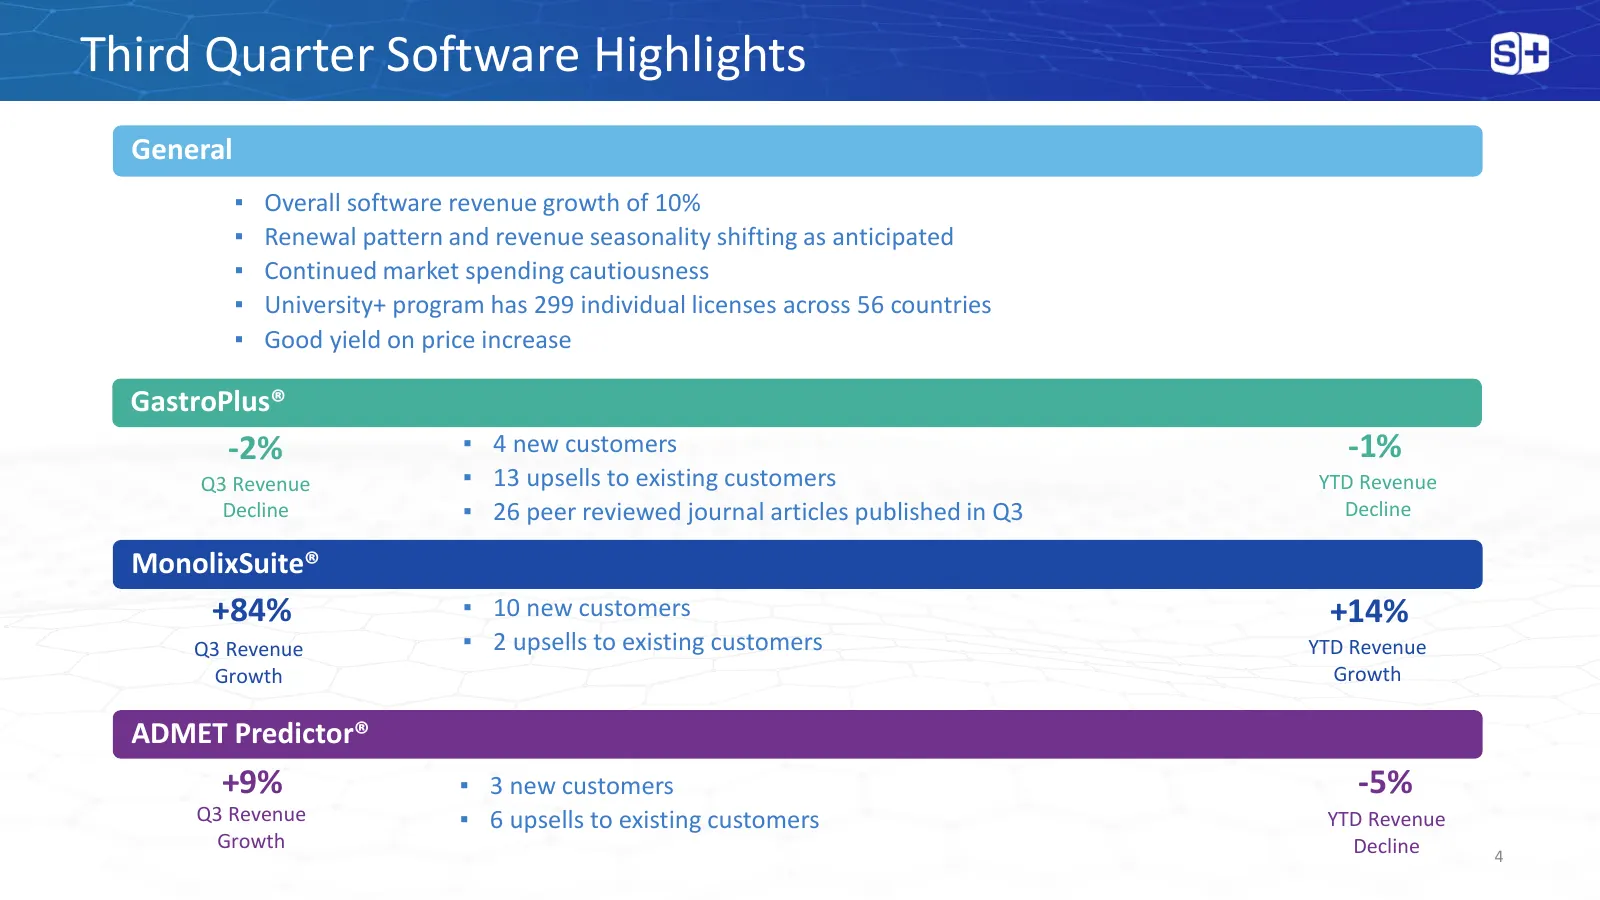
Slide 4: Third Quarter Software Highlights
Third Quarter Software Highlights General ▪ Overall software revenue growth of 10% ▪ Renewal pattern and revenue seasonality shifting as anticipated ▪ Continued market spending cautiousness ▪ University+ program has 299 individual licenses across 56 countries ▪ Good yield on price increase GastroPlu
Slide 5: Third Quarter Services Highlights
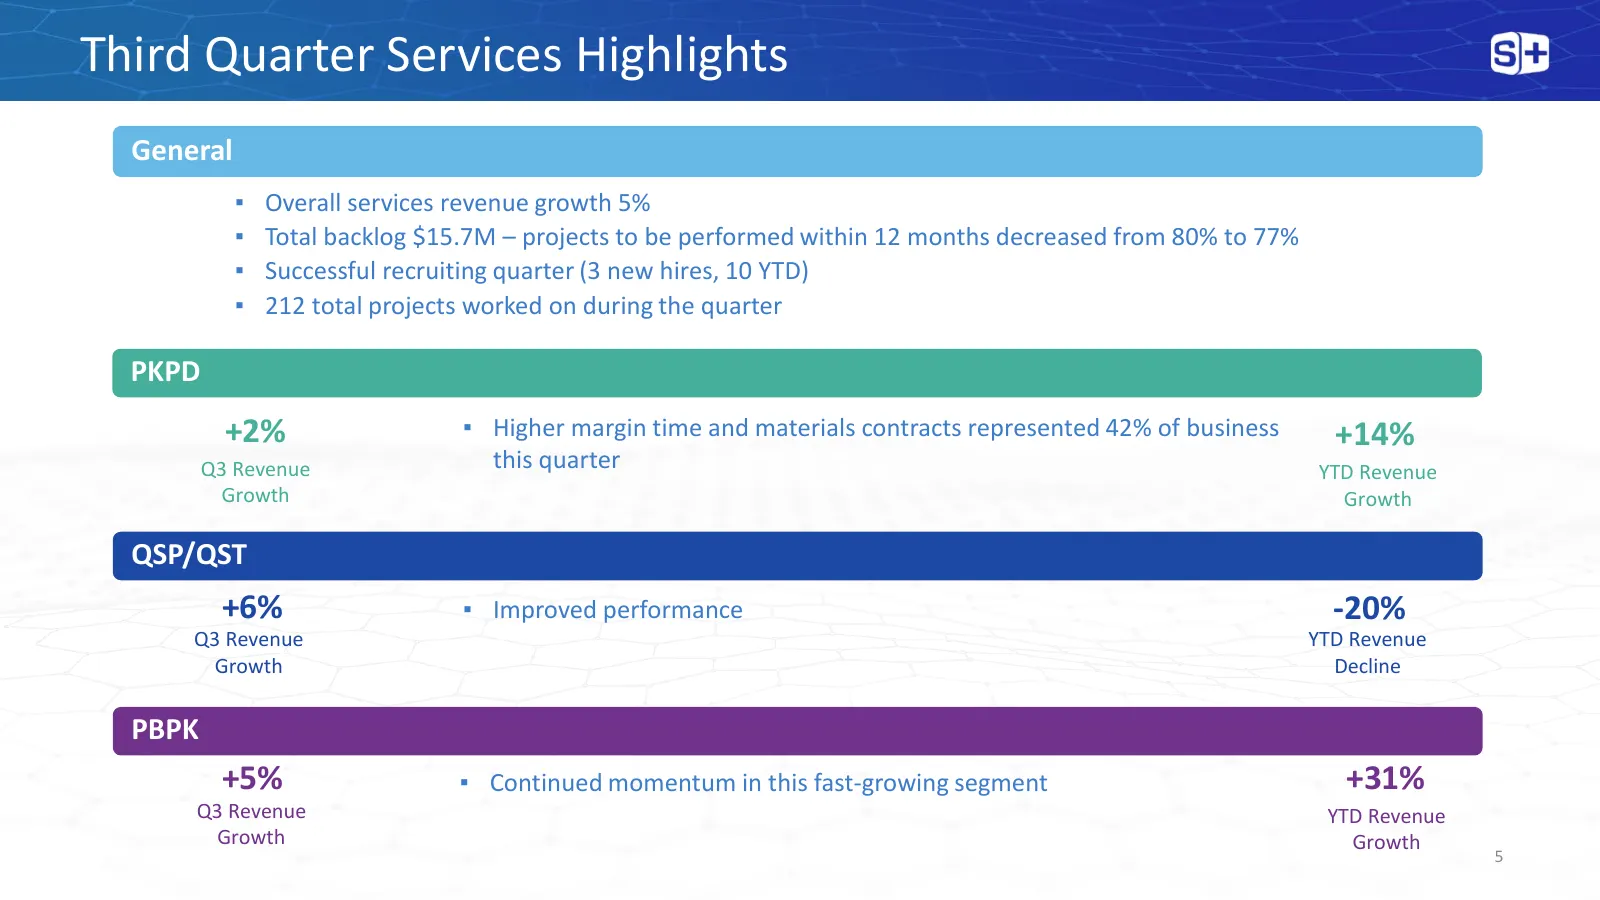
Third Quarter Services Highlights General ▪ Overall services revenue growth 5% ▪ Total backlog $15.7M – projects to be performed within 12 months decreased from 80% to 77% ▪ Successful recruiting quarter (3 new hires, 10 YTD) ▪ 212 total projects worked on during the quarter PKPD +2% ▪ Higher margin
Slide 6: Capital Allocation Strategy Update
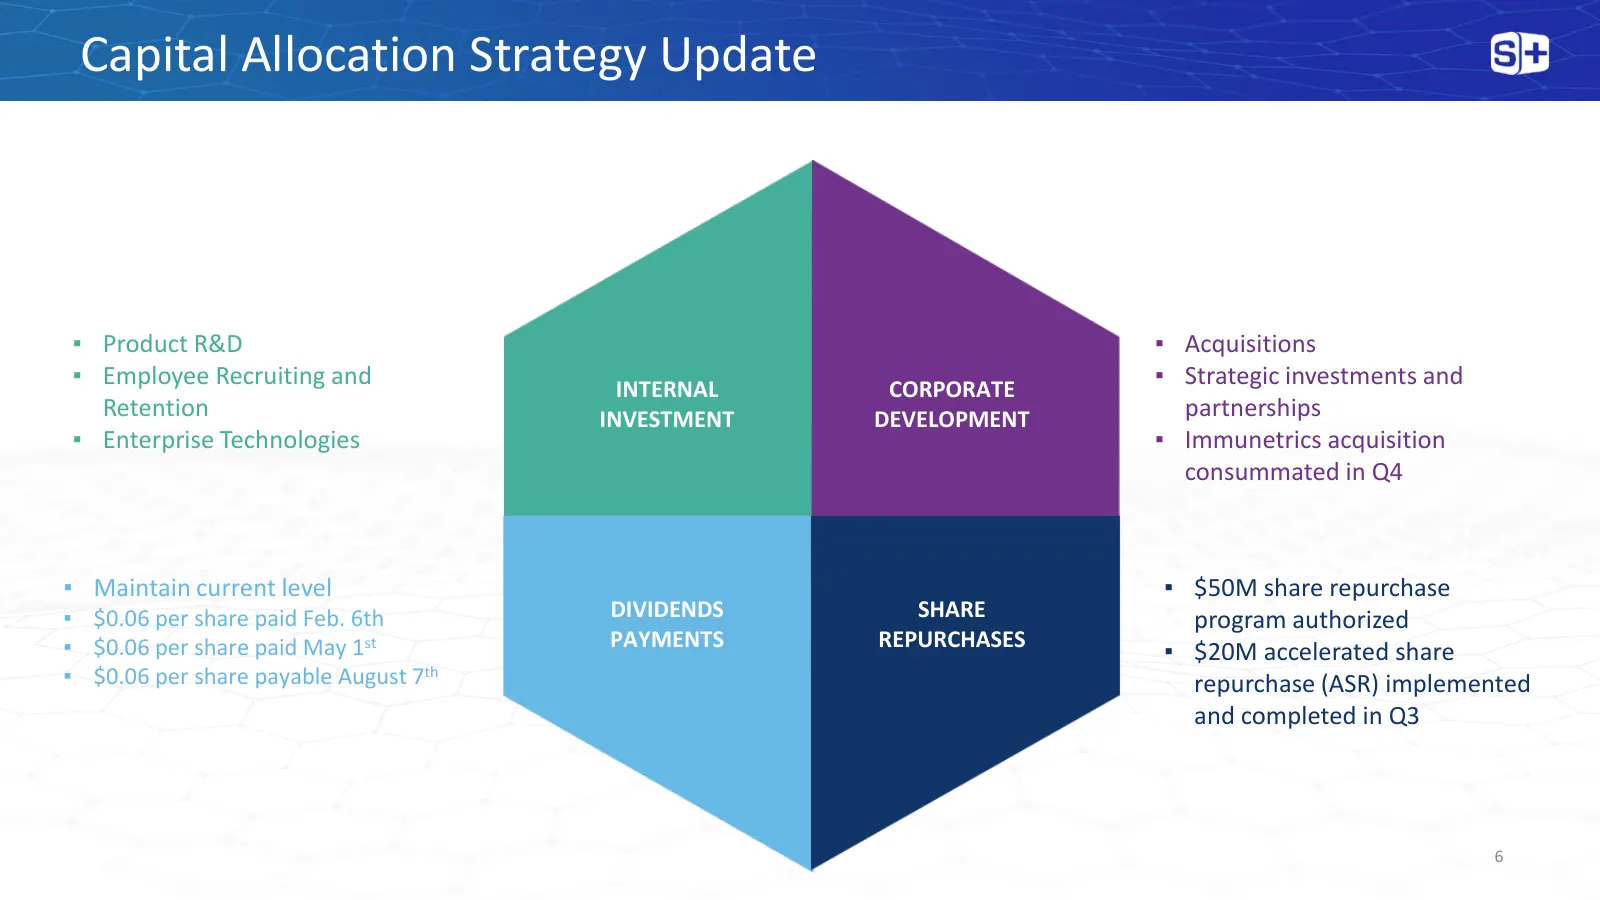
Capital Allocation Strategy Update ▪ Product R&D ▪ Acquisitions ▪ Employee Recruiting and ▪ Strategic investments and INTERNAL CORPORATE Retention INVESTMENT DEVELOPMENT partnerships ▪ Enterprise Technologies ▪ Immunetrics acquisition consummated in Q4 ▪ Maintain current level ▪ $50M share repurchas
Slide 7: Immunetrics Acquisition | June 2023
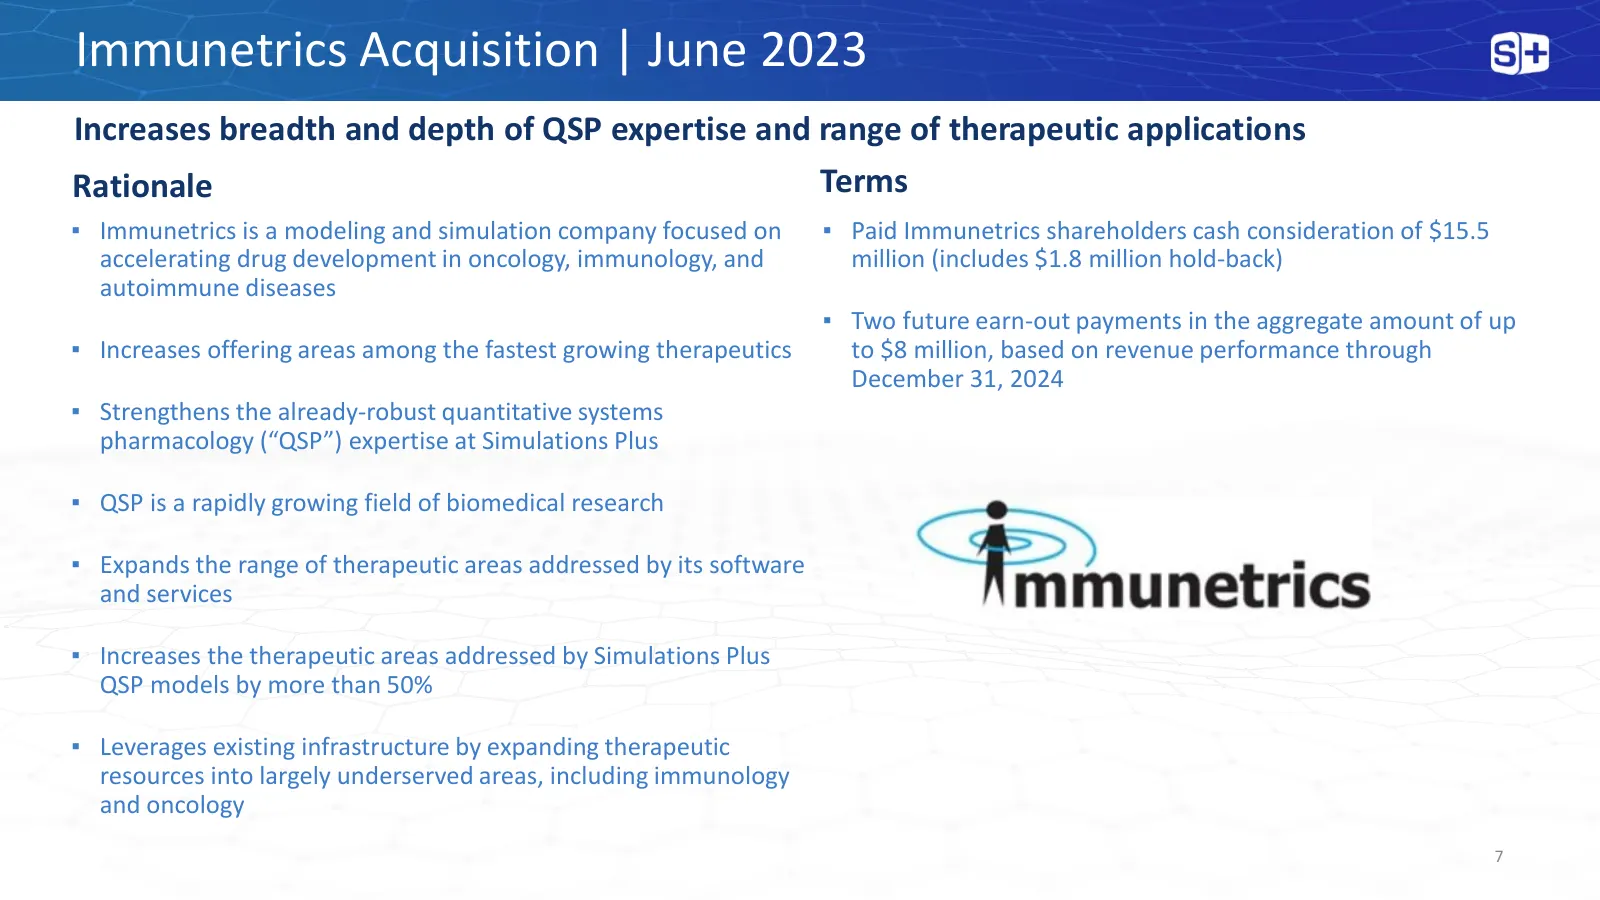
Immunetrics Acquisition | June 2023 Increases breadth and depth of QSP expertise and range of therapeutic applications Rationale Terms ▪ Immunetrics is a modeling and simulation company focused on ▪ Paid Immunetrics shareholders cash consideration of $15.5 accelerating drug development in oncology,
Slide 8: Maintaining FY23 Guidance
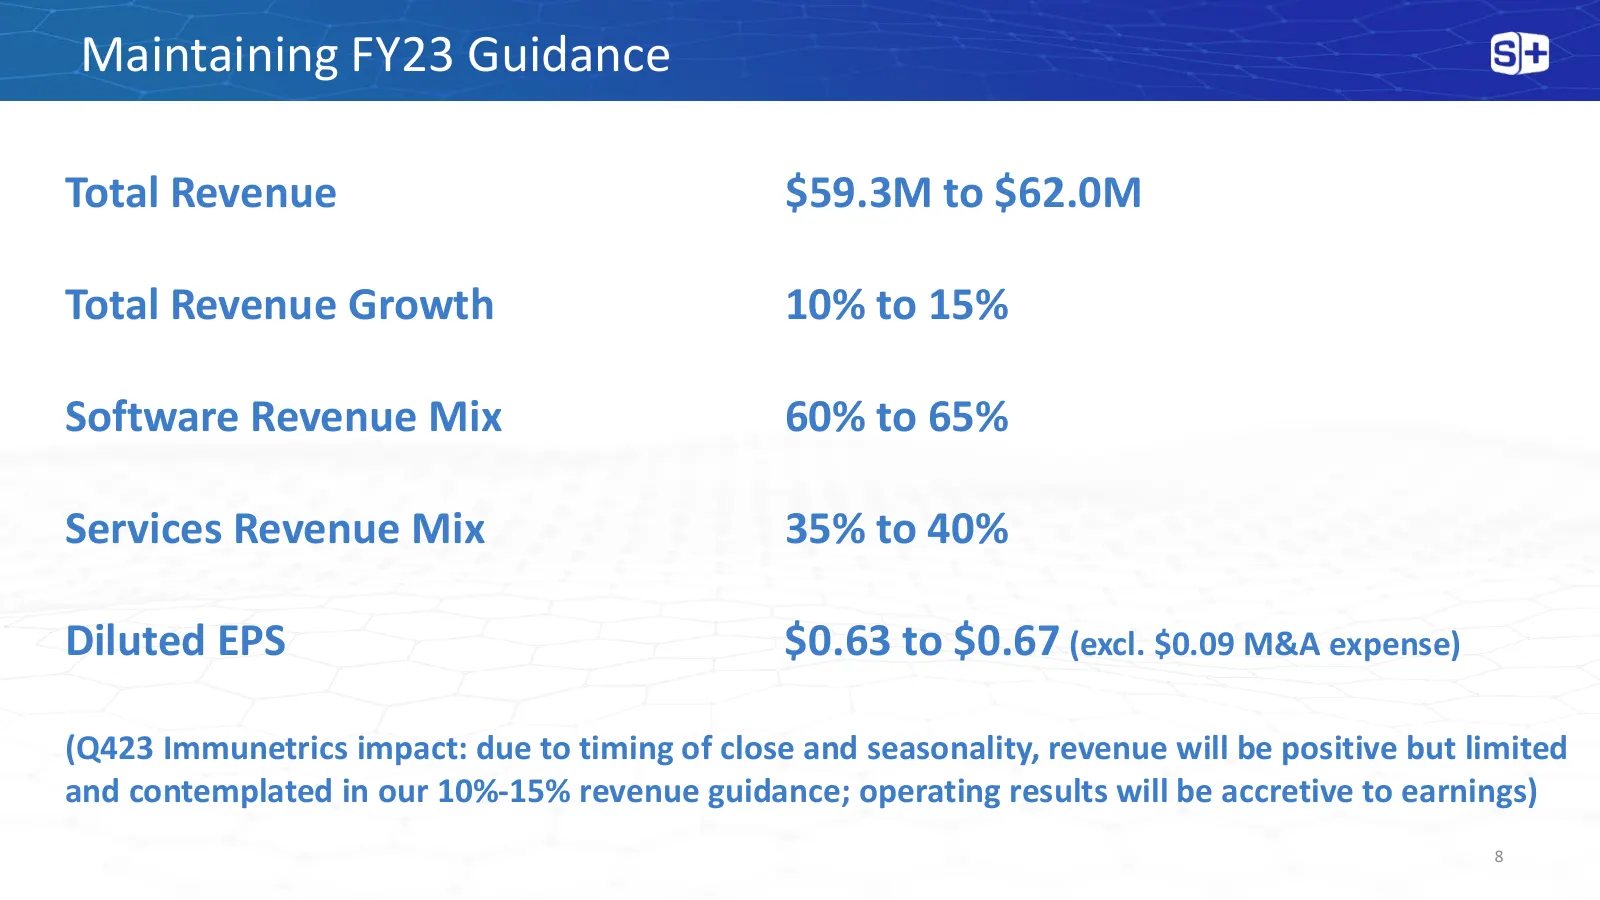
Maintaining FY23 Guidance Total Revenue $59.3M to $62.0M Total Revenue Growth 10% to 15% Software Revenue Mix 60% to 65% Services Revenue Mix 35% to 40% Diluted EPS $0.63 to $0.67 (excl. $0.09 M&A expense) (Q423 Immunetrics impact: due to timing of close and seasonality, revenue will be positive but

Slide 9: Financial Results
Financial Results
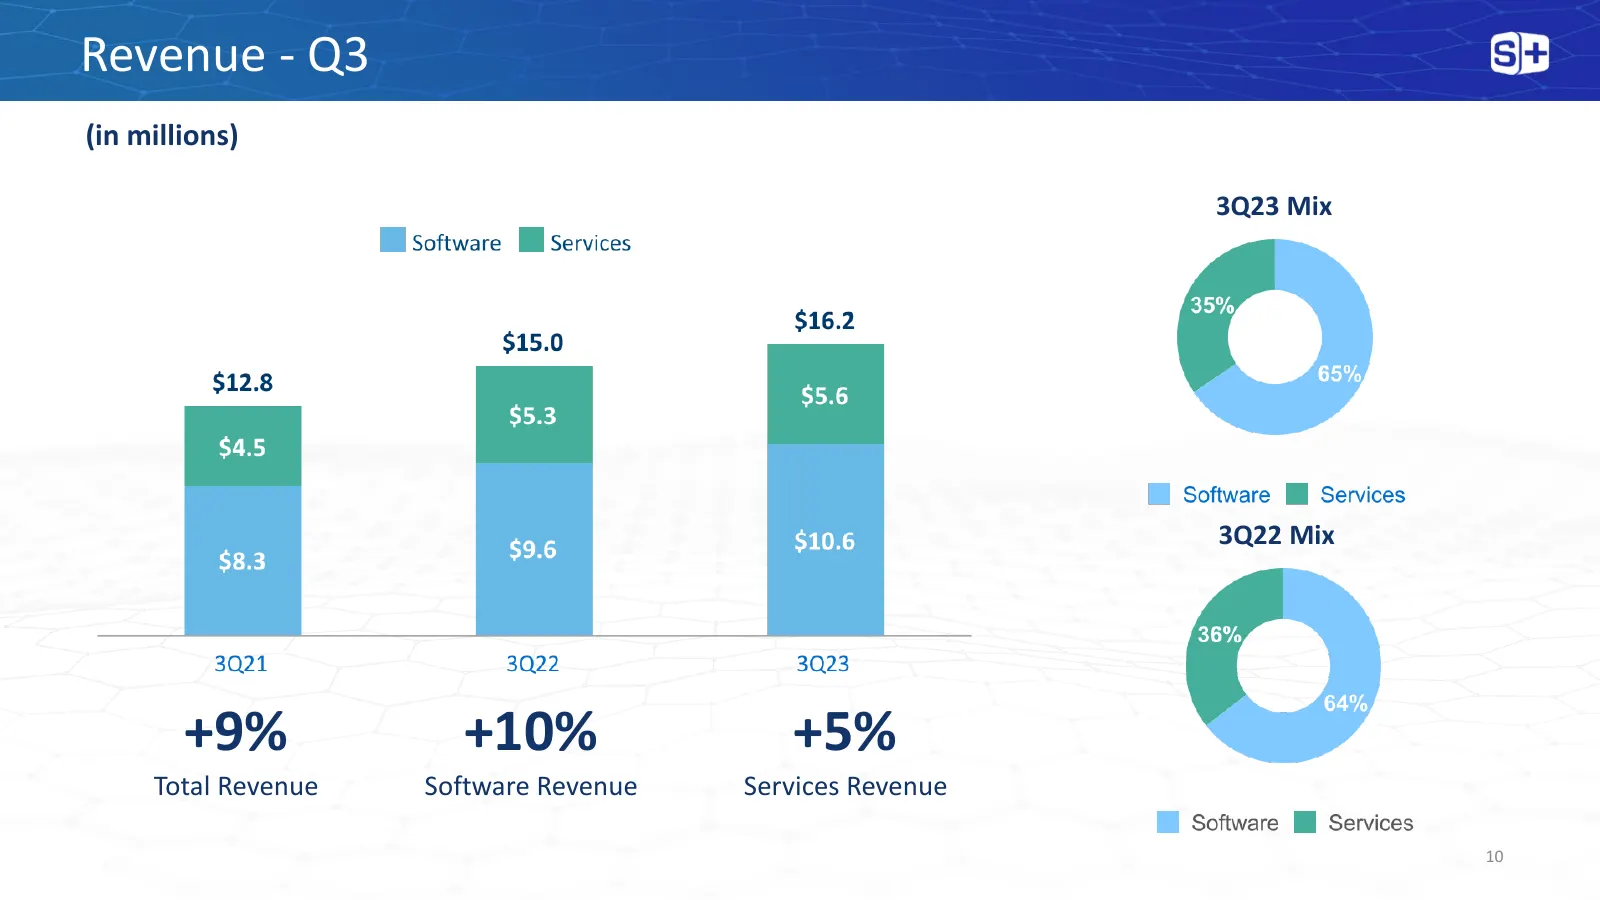
Slide 10: Revenue - Q3
Revenue - Q3 (in millions) 3Q23 Mix 3Q22 Mix +9% +10% +5% Total Revenue Software Revenue Services Revenue 10
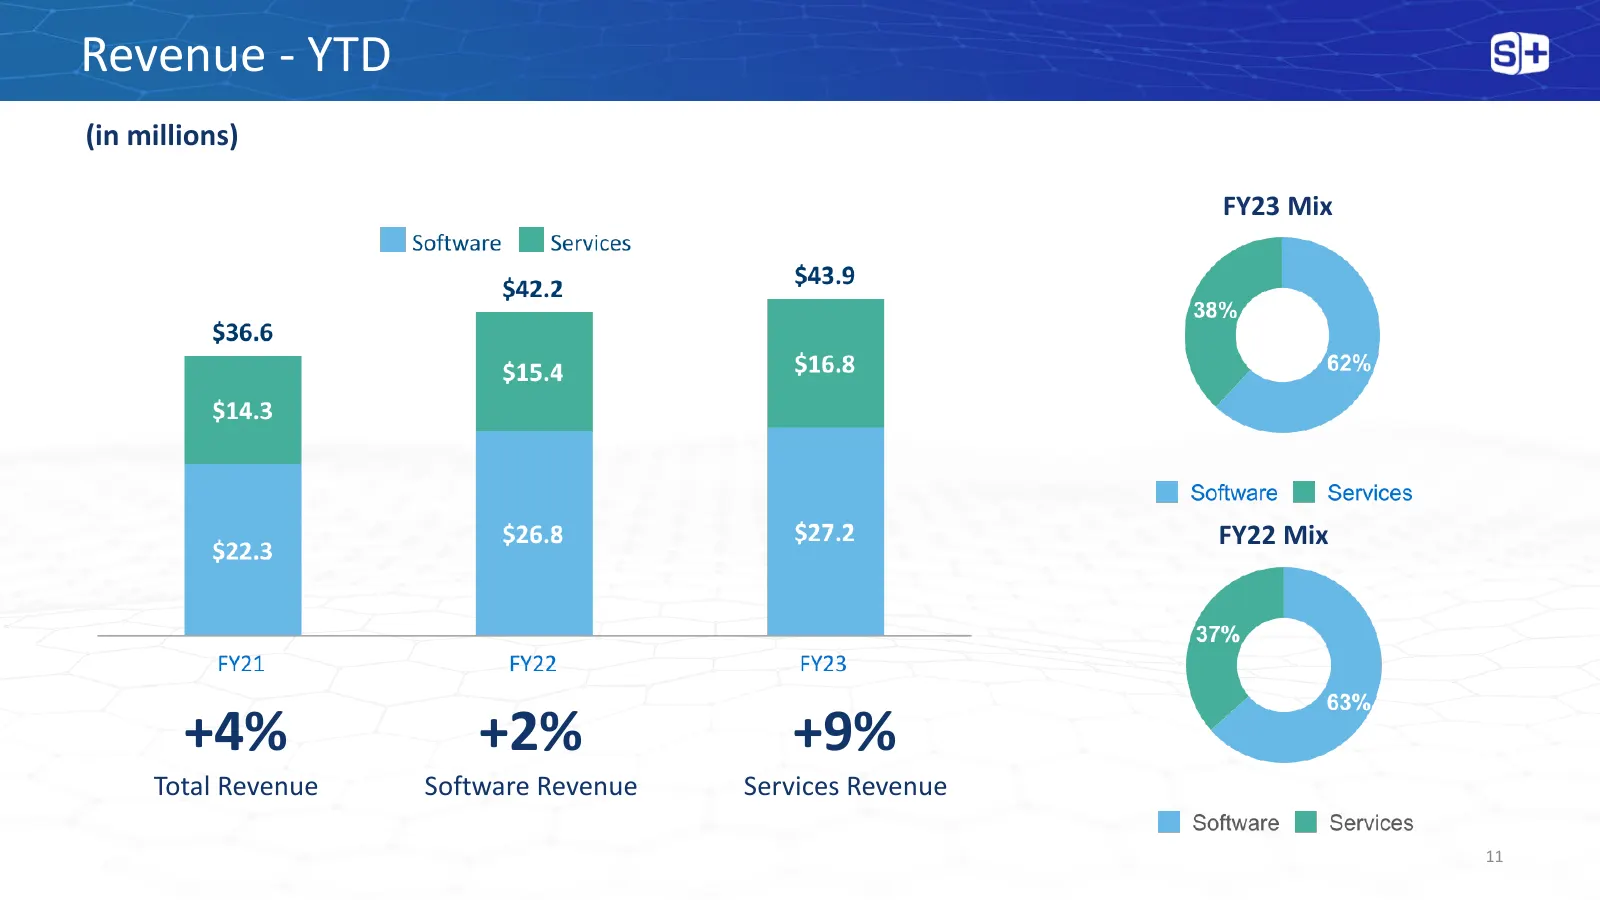
Slide 11: Revenue - YTD
Revenue - YTD (in millions) FY23 Mix FY22 Mix +4% +2% +9% Total Revenue Software Revenue Services Revenue 11
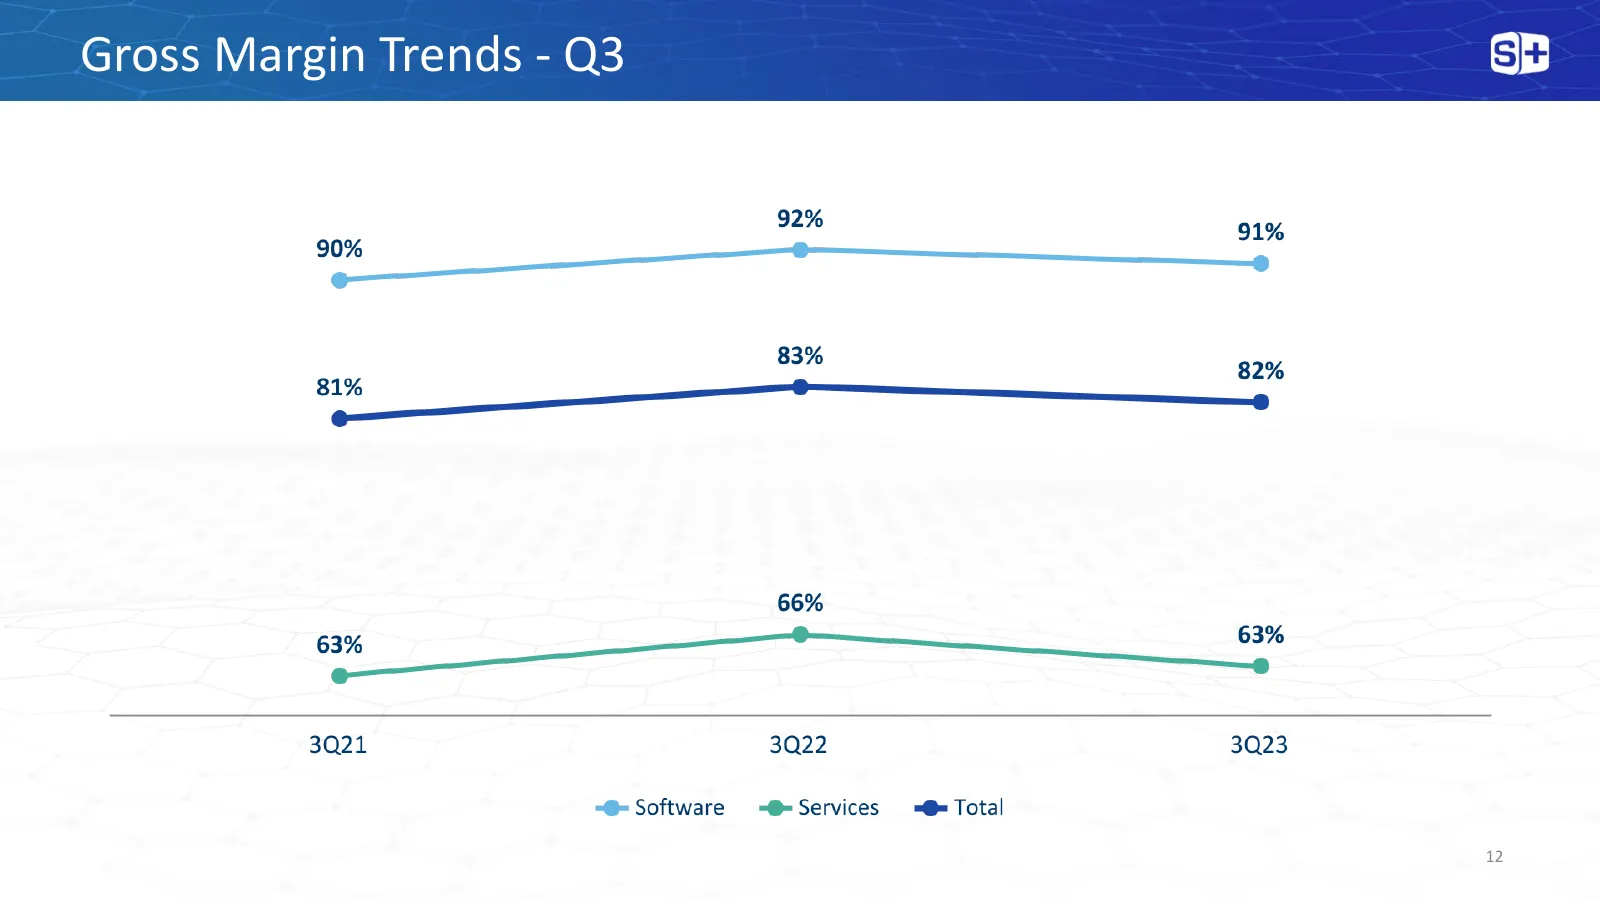
Slide 12: Gross Margin Trends - Q3
Gross Margin Trends - Q3 90% —> owe eo 83% 81% => aoe C= 66% 63% —o— 63% — —o 3Q21 3Q22 3Q23 =@ Software -@®=Services =@= Total 12
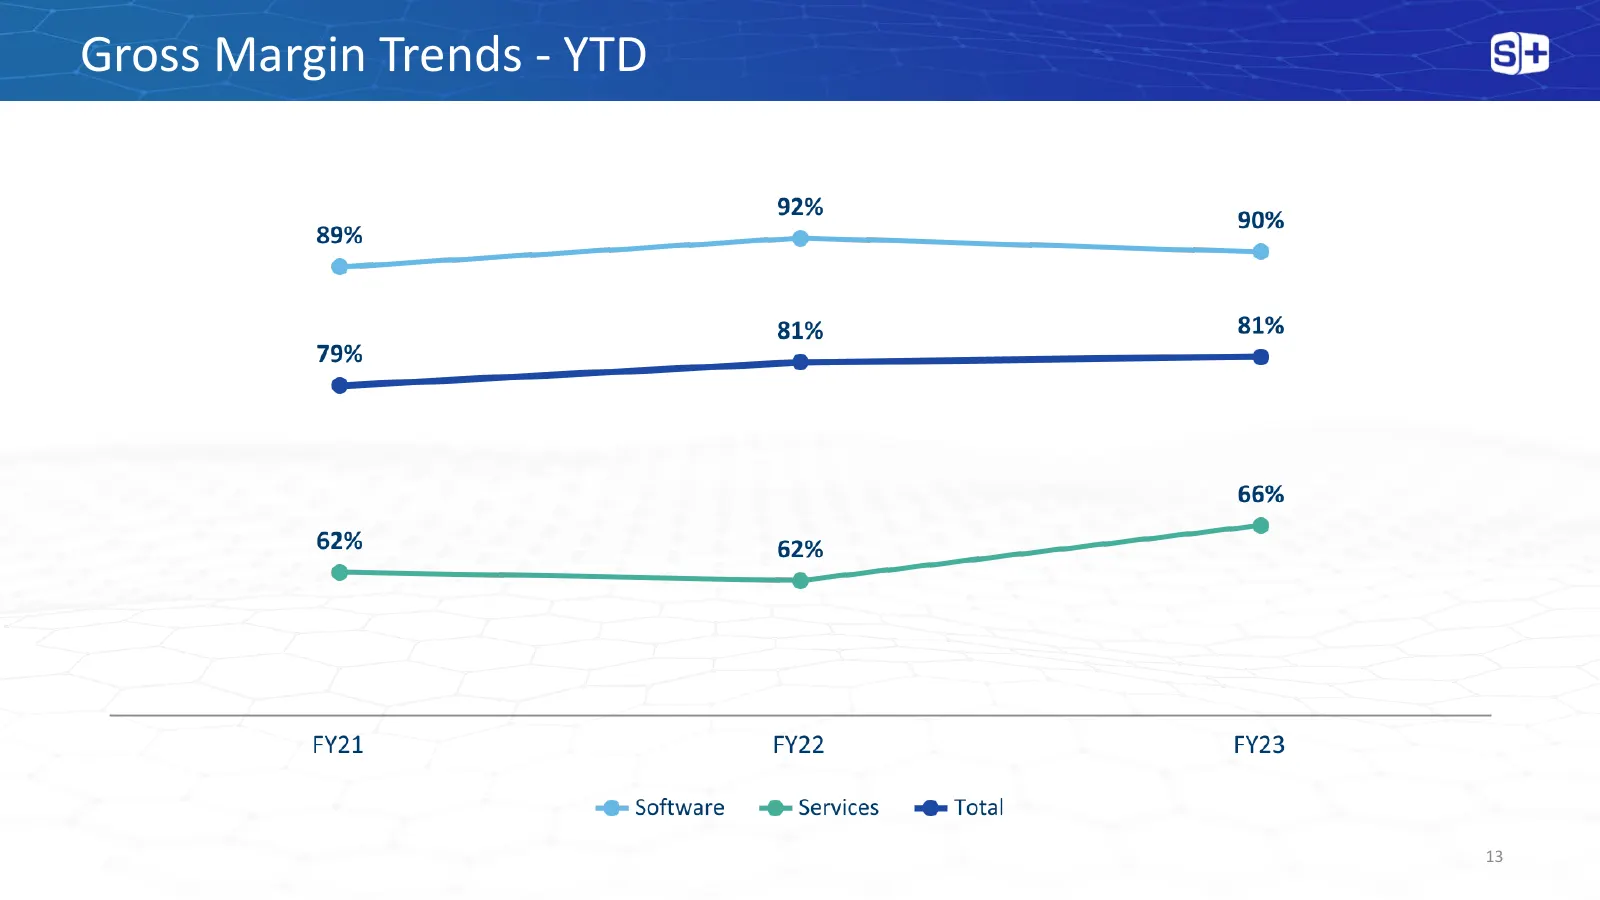
Slide 13: Gross Margin Trends - YTD
Gross Margin Trends - YTD 92% 89% o> ore io 81% 81% 79% —® = J = 66% 62% 62% e —o— FY21 FY22 FY23 =@ Software -@®=Services =@= Total 13
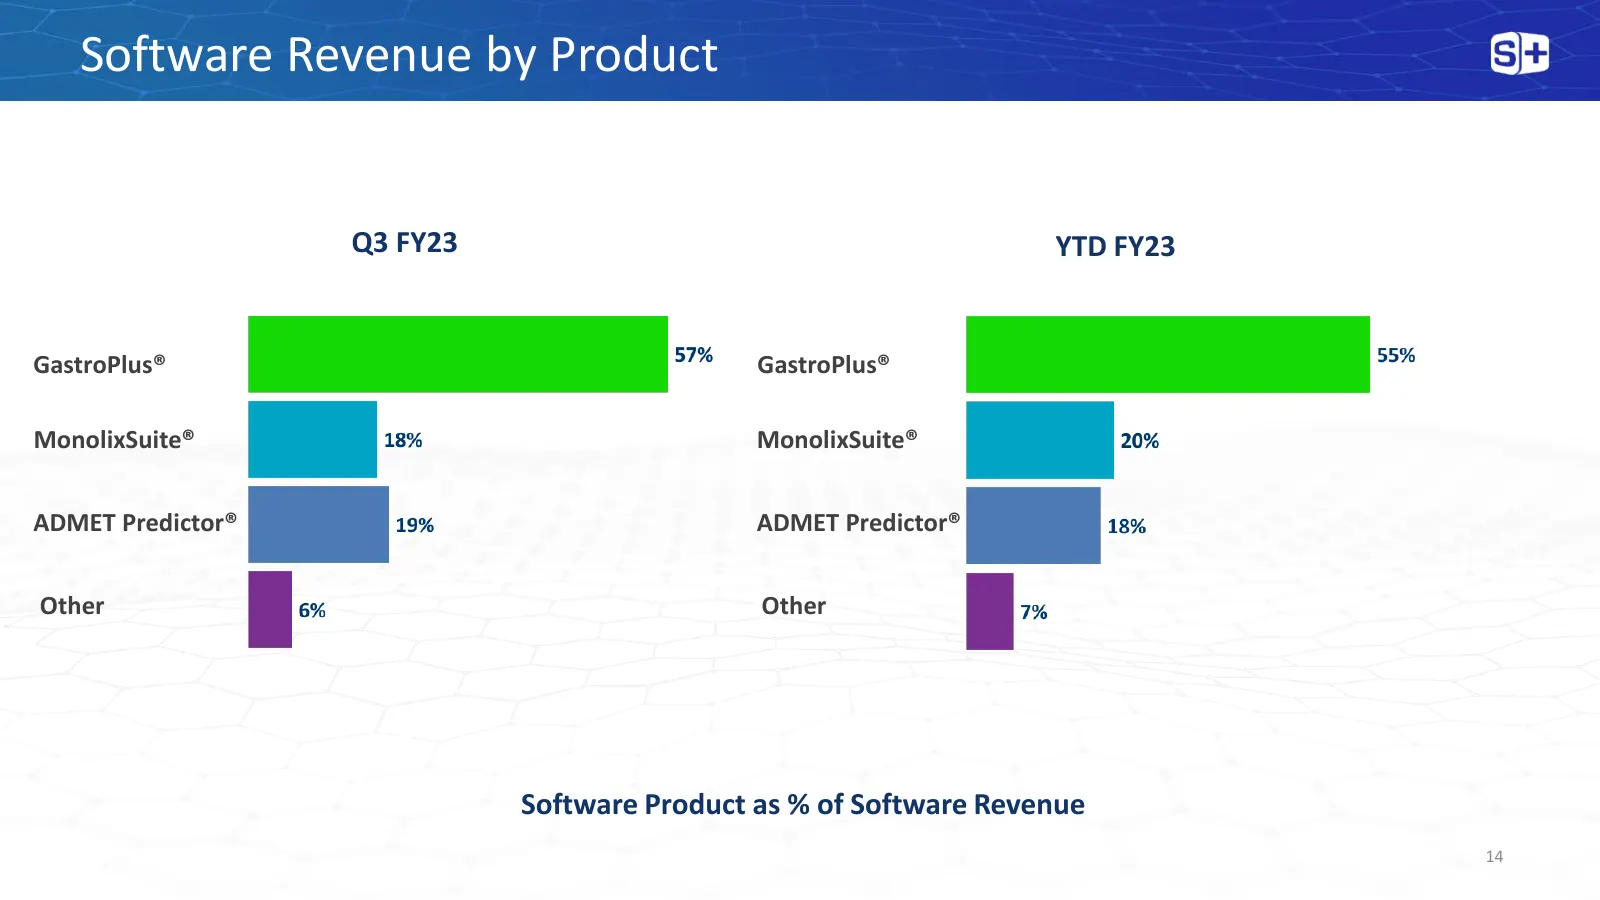
Slide 14: Software Revenue by Product
Software Revenue by Product Q3 FY23 YTD FY23 GastroPlus® GastroPlus® MonolixSuite® MonolixSuite® ADMET Predictor® ADMET Predictor® Other Other Software Product as % of Software Revenue 14
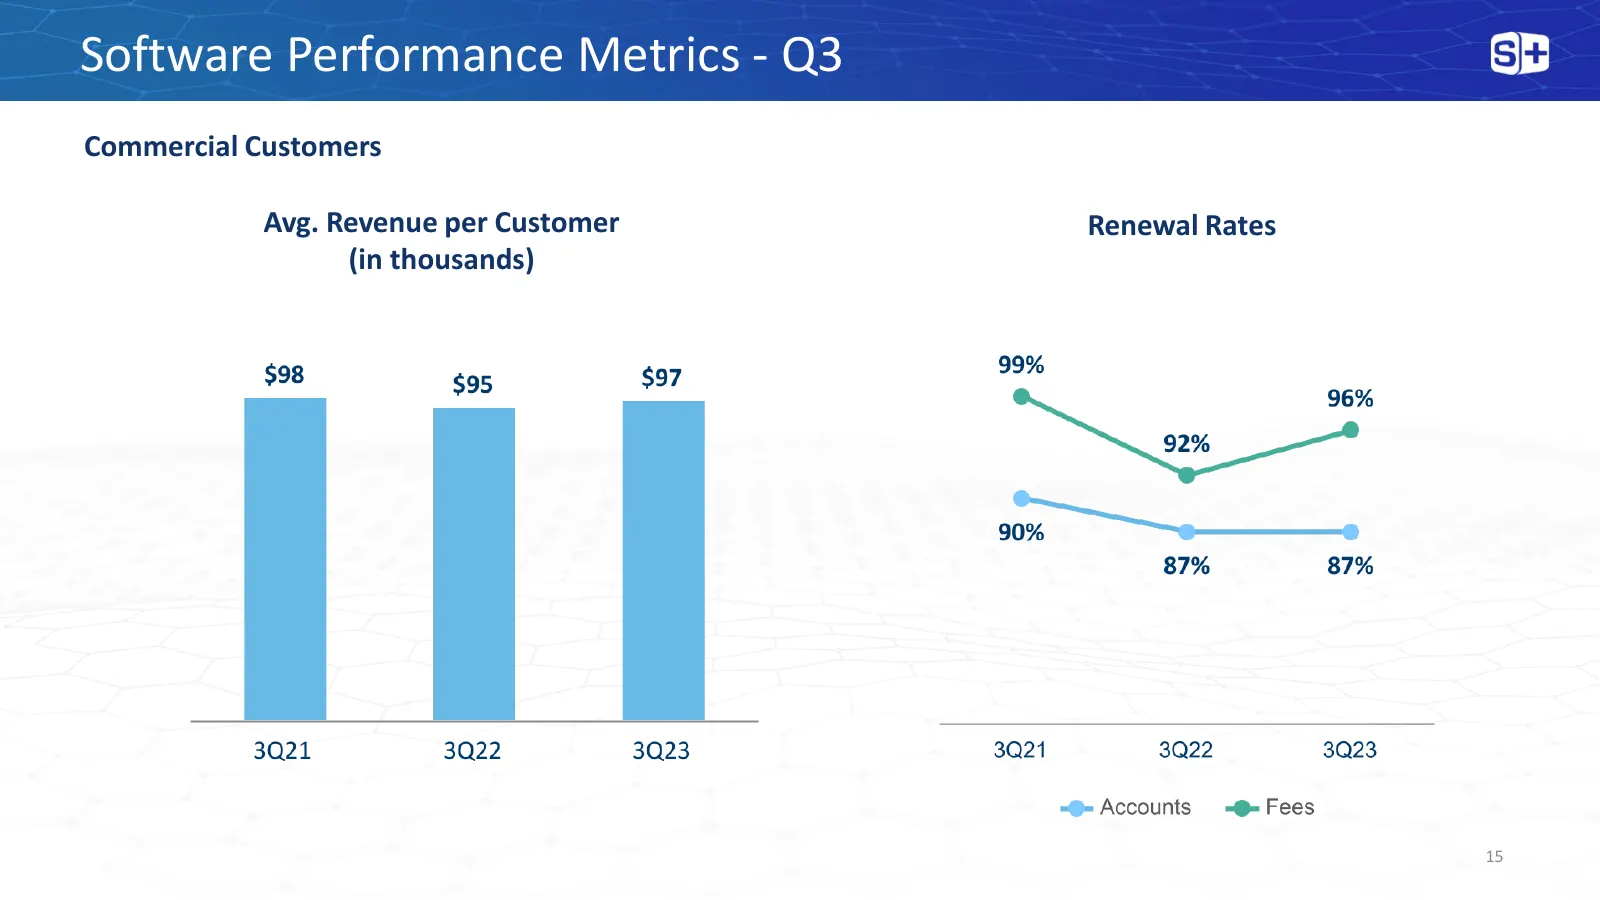
Slide 15: Software Performance Metrics - Q3
Software Performance Metrics - Q3 Commercial Customers Avg. Revenue per Customer Renewal Rates (in thousands) 15
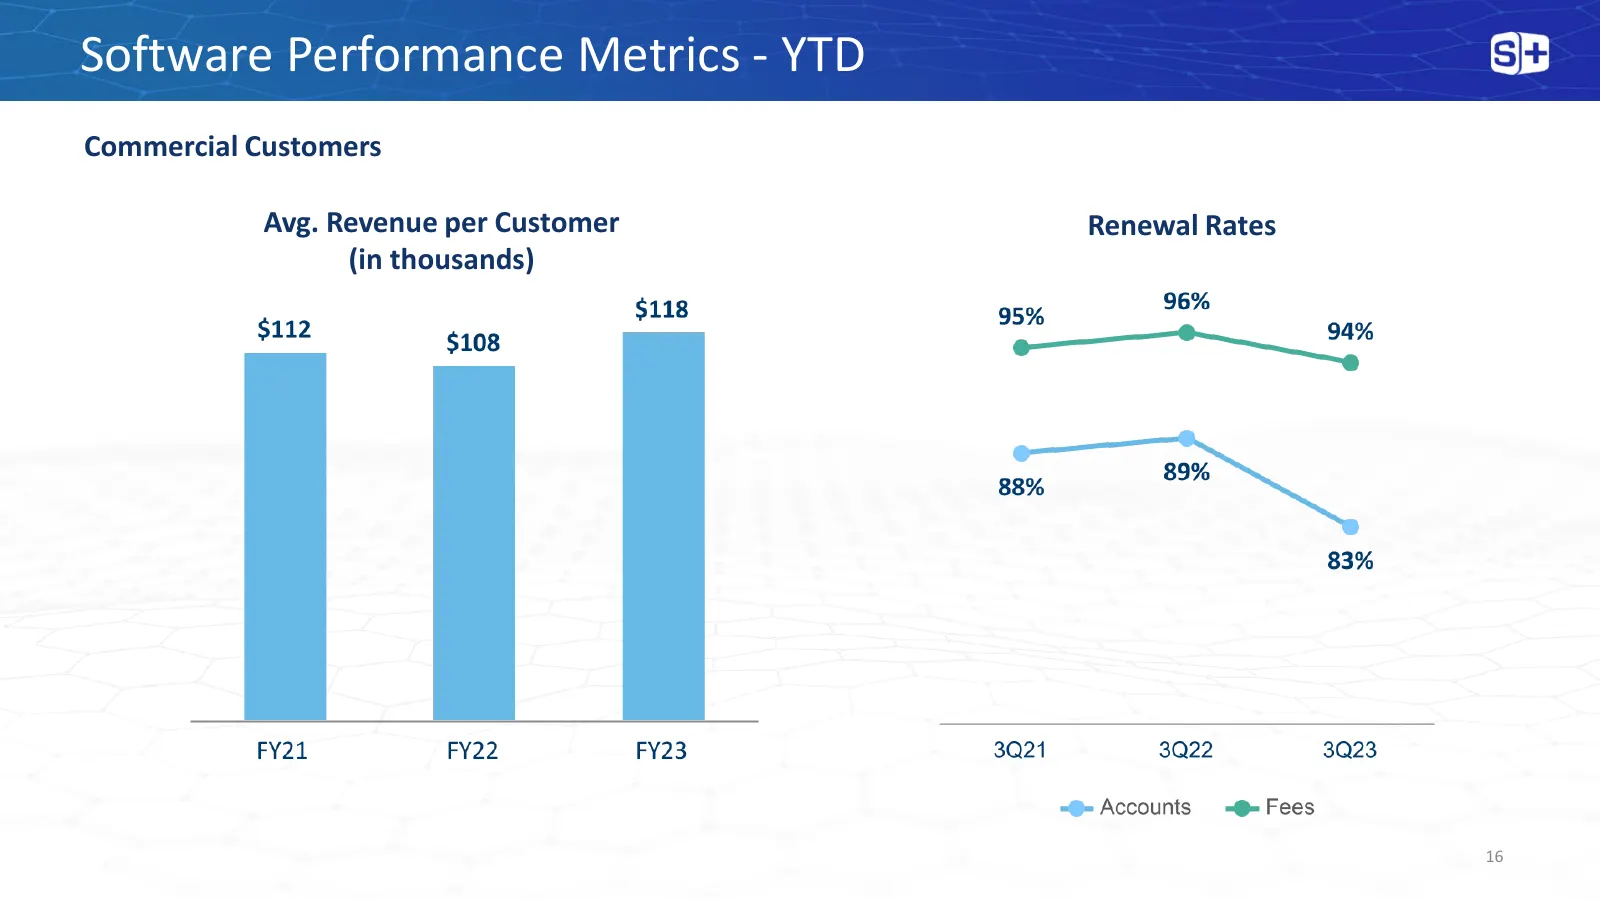
Slide 16: Software Performance Metrics - YTD
Software Performance Metrics - YTD Commercial Customers Avg. Revenue per Customer Renewal Rates (in thousands) 16
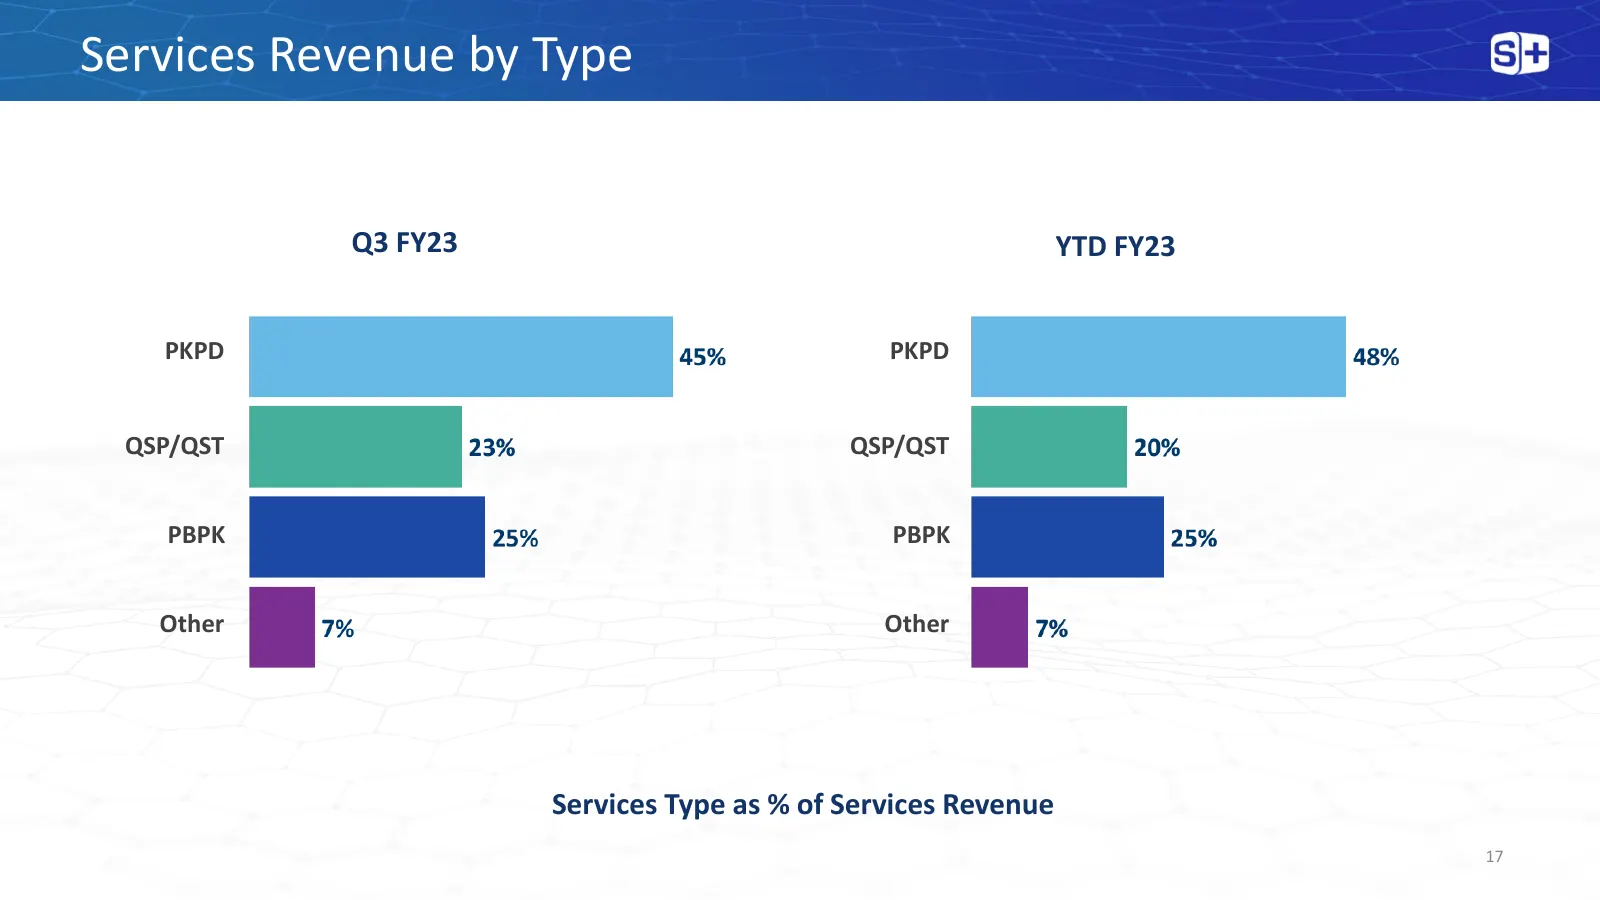
Slide 17: Services Revenue by Type
Services Revenue by Type Q3 FY23 YTD FY23 PKPD PKPD QSP/QST QSP/QST PBPK PBPK Other Other Services Type as % of Services Revenue 17
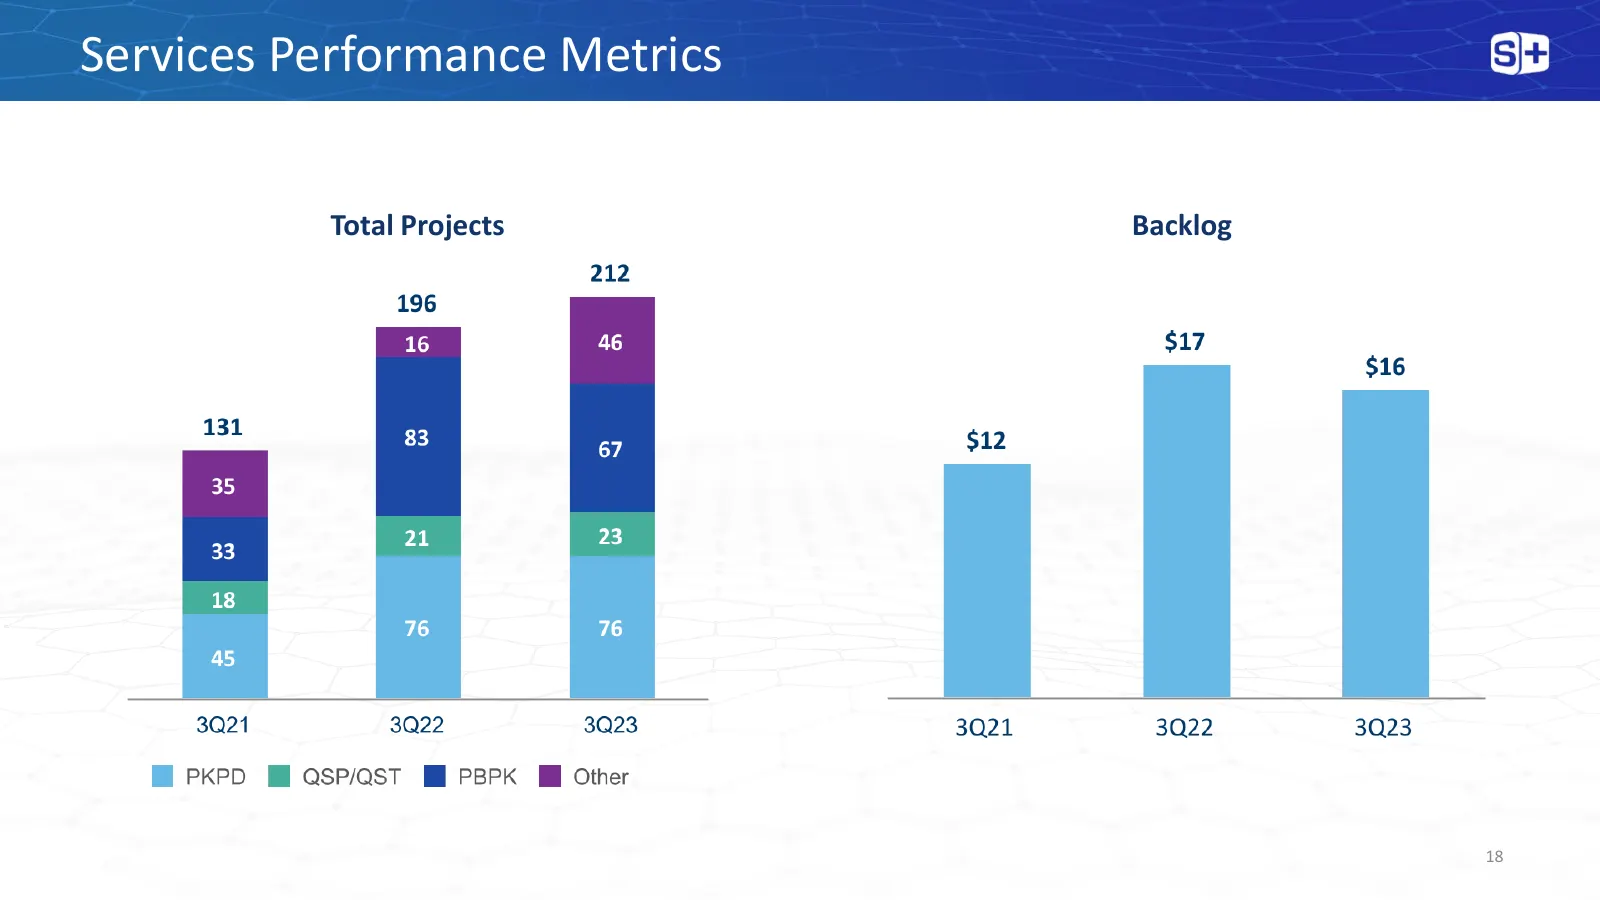
Slide 18: Services Performance Metrics
Services Performance Metrics Total Projects Backlog 18
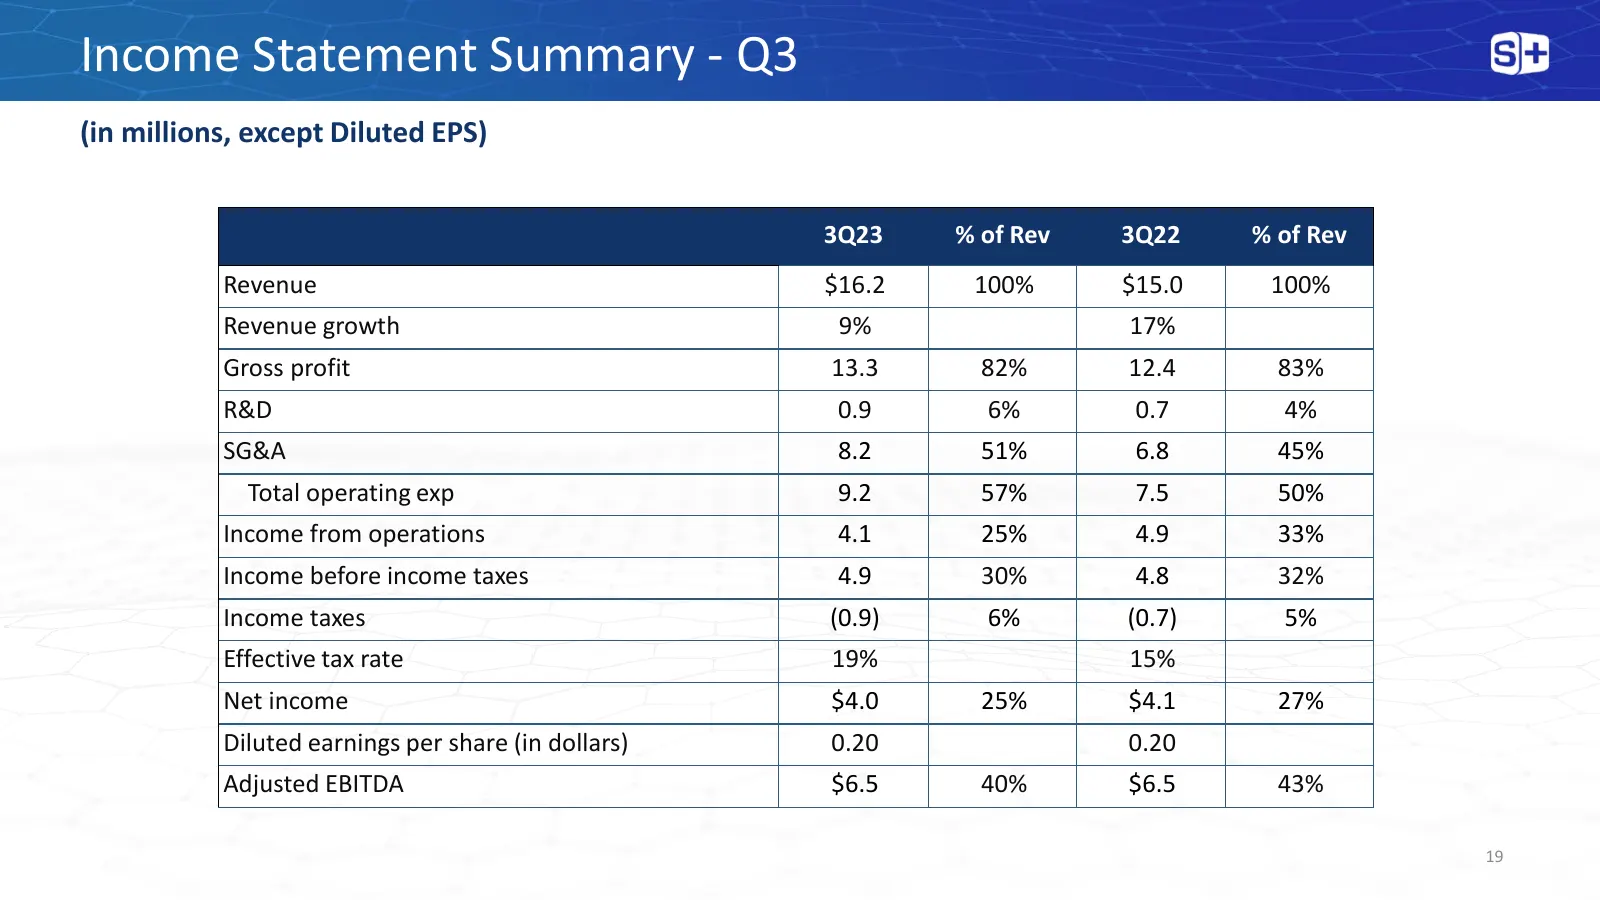
Slide 19: Income Statement Summary - Q3
Income Statement Summary - Q3 (in millions, except Diluted EPS) 3Q23 % of Rev 3Q22 % of Rev Revenue $16.2 100% $15.0 100% Revenue growth 9% 17% Gross profit 13.3 82% 12.4 83% R&D 0.9 6% 0.7 4% SG&A 8.2 51% 6.8 45% Total operating exp 9.2 57% 7.5 50% Income from operations 4.1 25% 4.9 33% Income befo
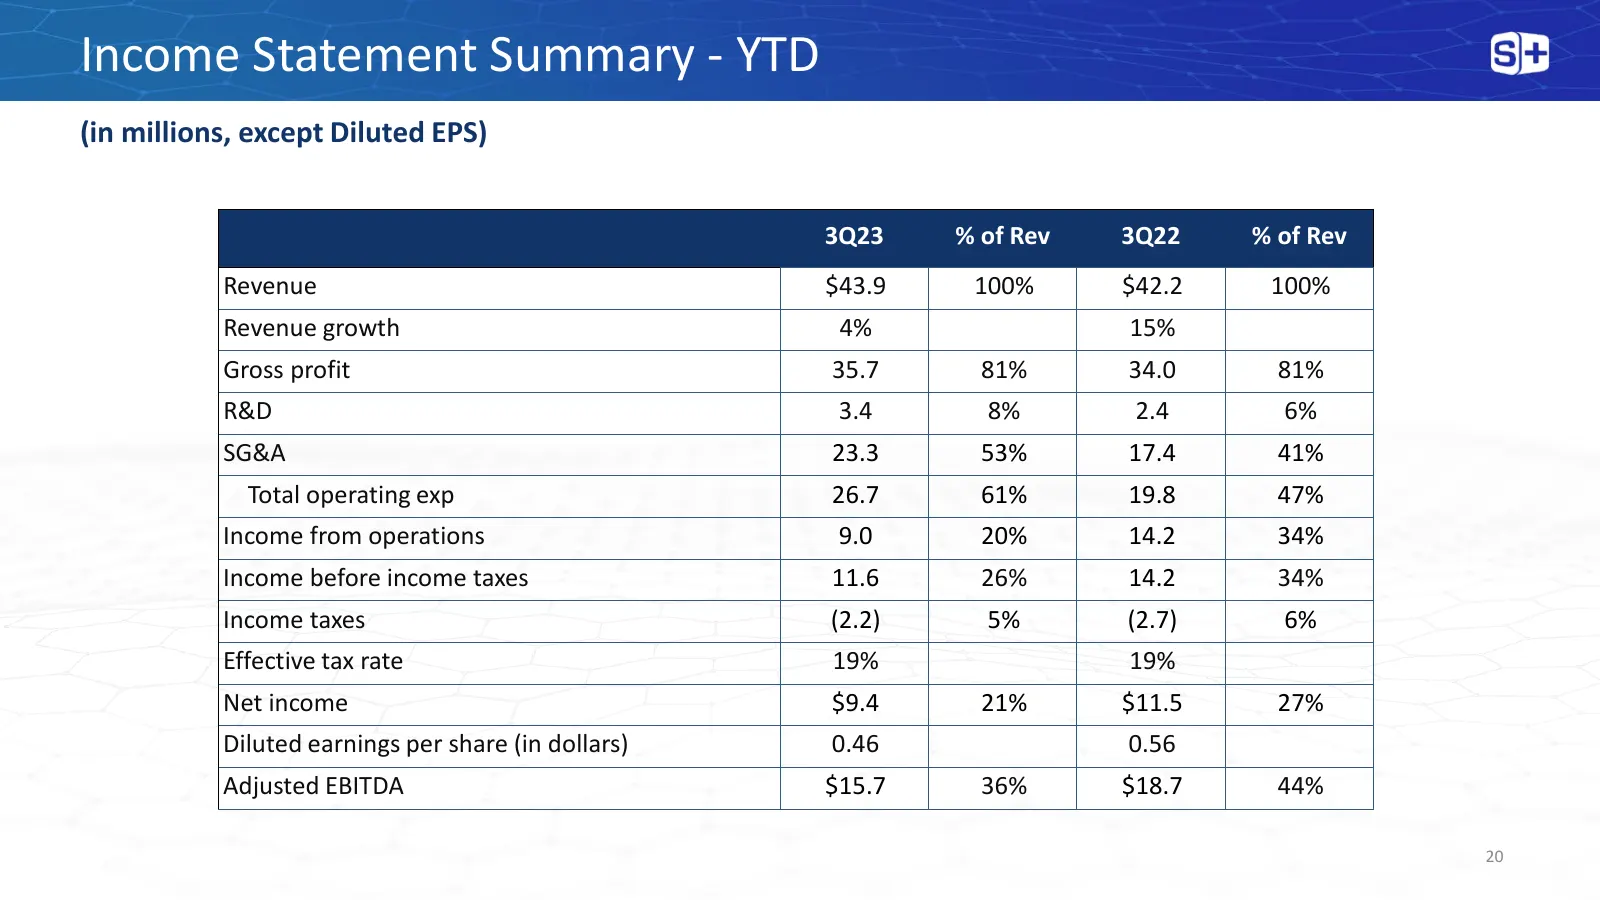
Slide 20: Income Statement Summary - YTD
Income Statement Summary - YTD (in millions, except Diluted EPS) 3Q23 % of Rev 3Q22 % of Rev Revenue $43.9 100% $42.2 100% Revenue growth 4% 15% Gross profit 35.7 81% 34.0 81% R&D 3.4 8% 2.4 6% SG&A 23.3 53% 17.4 41% Total operating exp 26.7 61% 19.8 47% Income from operations 9.0 20% 14.2 34% Incom
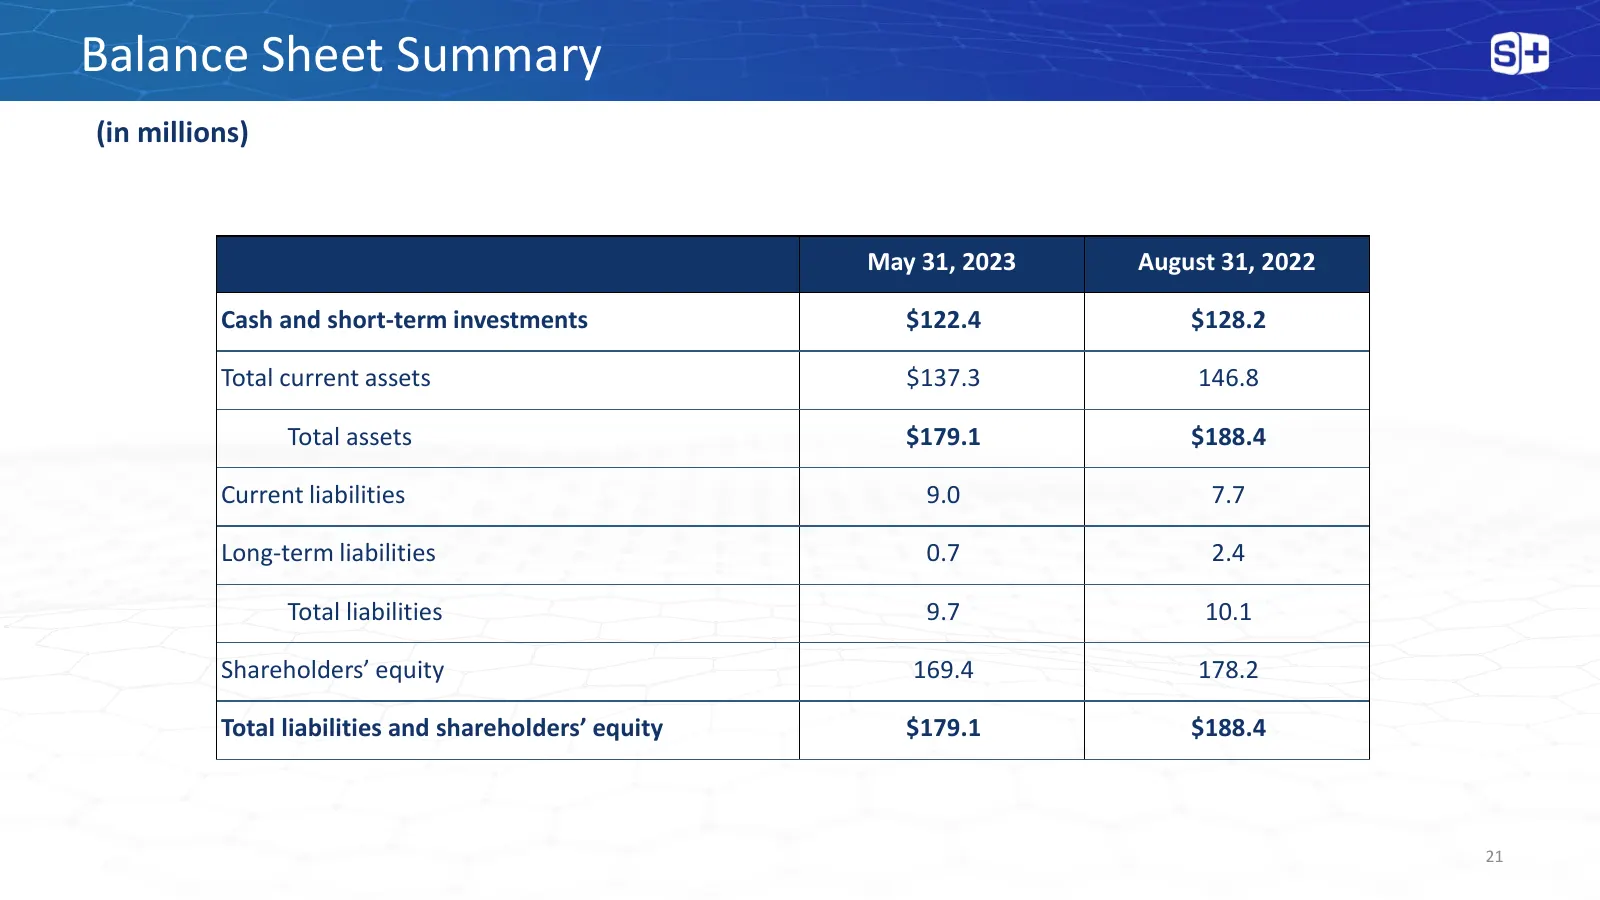
Slide 21: Balance Sheet Summary
Balance Sheet Summary (in millions) May 31, 2023 August 31, 2022 Cash and short-term investments $122.4 $128.2 Total current assets $137.3 146.8 Total assets $179.1 $188.4 Current liabilities 9.0 7.7 Long-term liabilities 0.7 2.4 Total liabilities 9.7 10.1 Shareholders’ equity 169.4 178.2 Total liab
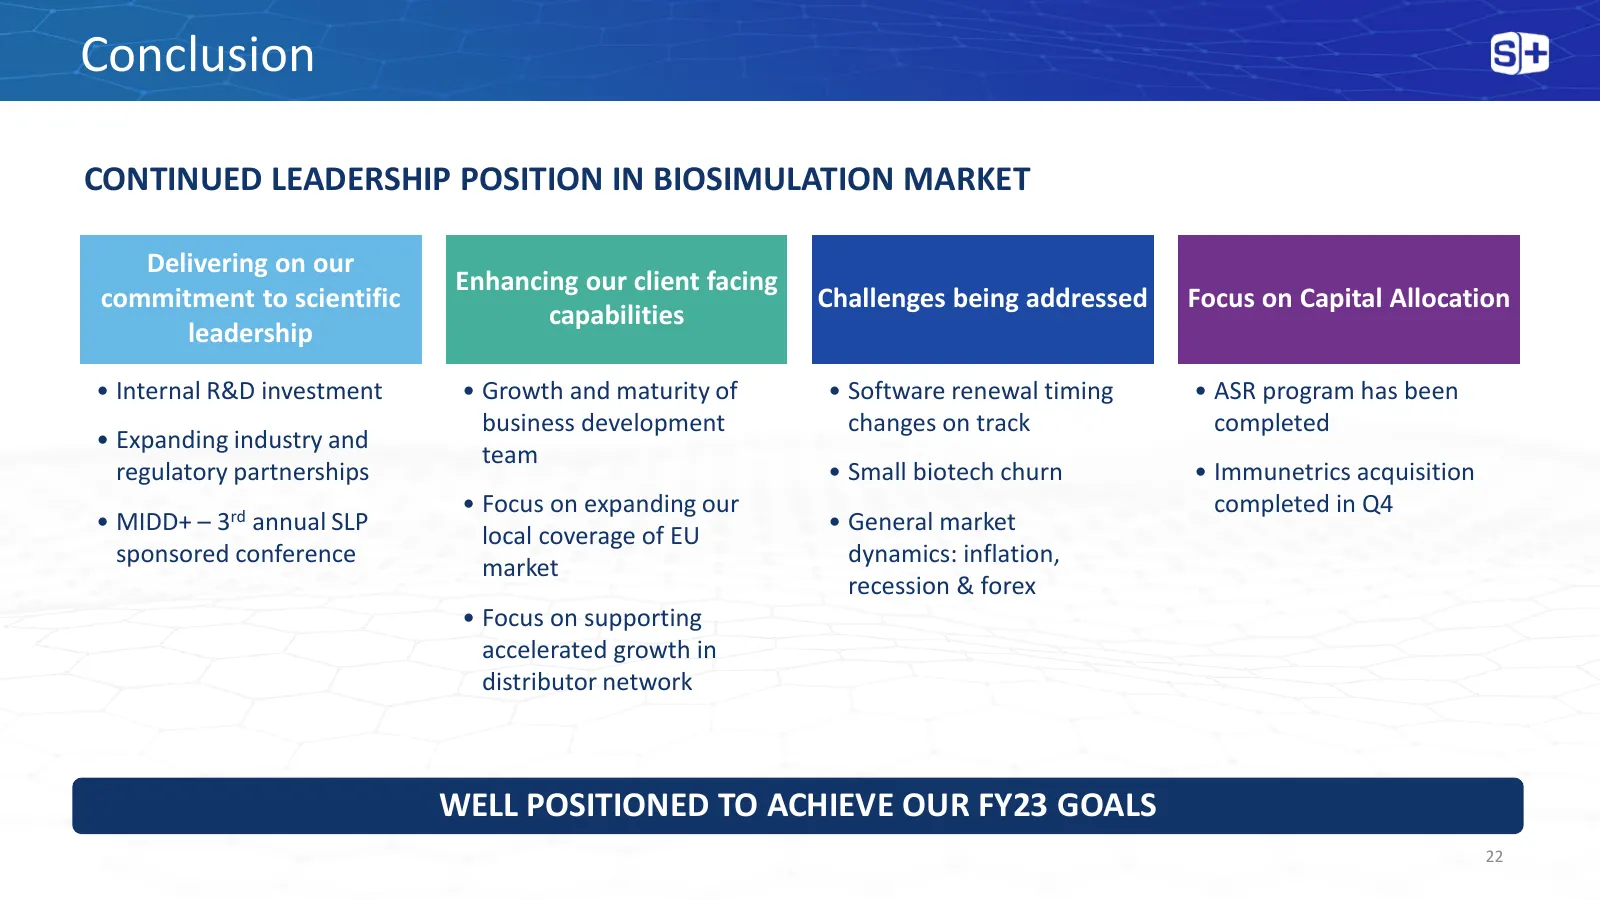
Slide 22: Conclusion
Conclusion CONTINUED LEADERSHIP POSITION IN BIOSIMULATION MARKET Delivering on our Enhancing our client facing commitment to scientific Challenges being addressed Focus on Capital Allocation capabilities leadership • Internal R&D investment • Growth and maturity of • Software renewal timing • ASR pr

Slide 23: Questions
Questions 23

Slide 24: Simulations Plus
iS]+ SimulationsPlus
Source: Internet Archive copy of simulations-plus.com
More decks from Simulations Plus, Inc.
 Q3 FY2026 Earnings Presentation21 slides · Jul 9, 2026
 Q2 FY2026 Earnings Presentation21 slides · Apr 9, 2026
 Q2 2026 Earnings Presentation21 slides · Apr 9, 2026
 Technical Presentation (January 2026)37 slides · Jan 22, 2026
 Q1 2026 Earnings Presentation19 slides · Jan 8, 2026
 Investor Day (2026)76 slides · 2026