Rexel SA · EURONEXT:RXL
Rexel SA — H1 2012 Earnings Presentation
70 slides from Rexel SA's earnings presentation, 2012
Slide 1: Roadshow Presentation Post-Q2 & H1 2012 Results
ROADSHOW PRESENTATION Post-Q2 & H1 2012 RESULTS

Slide 2: Company Overview
COMPANY OVERVIEW
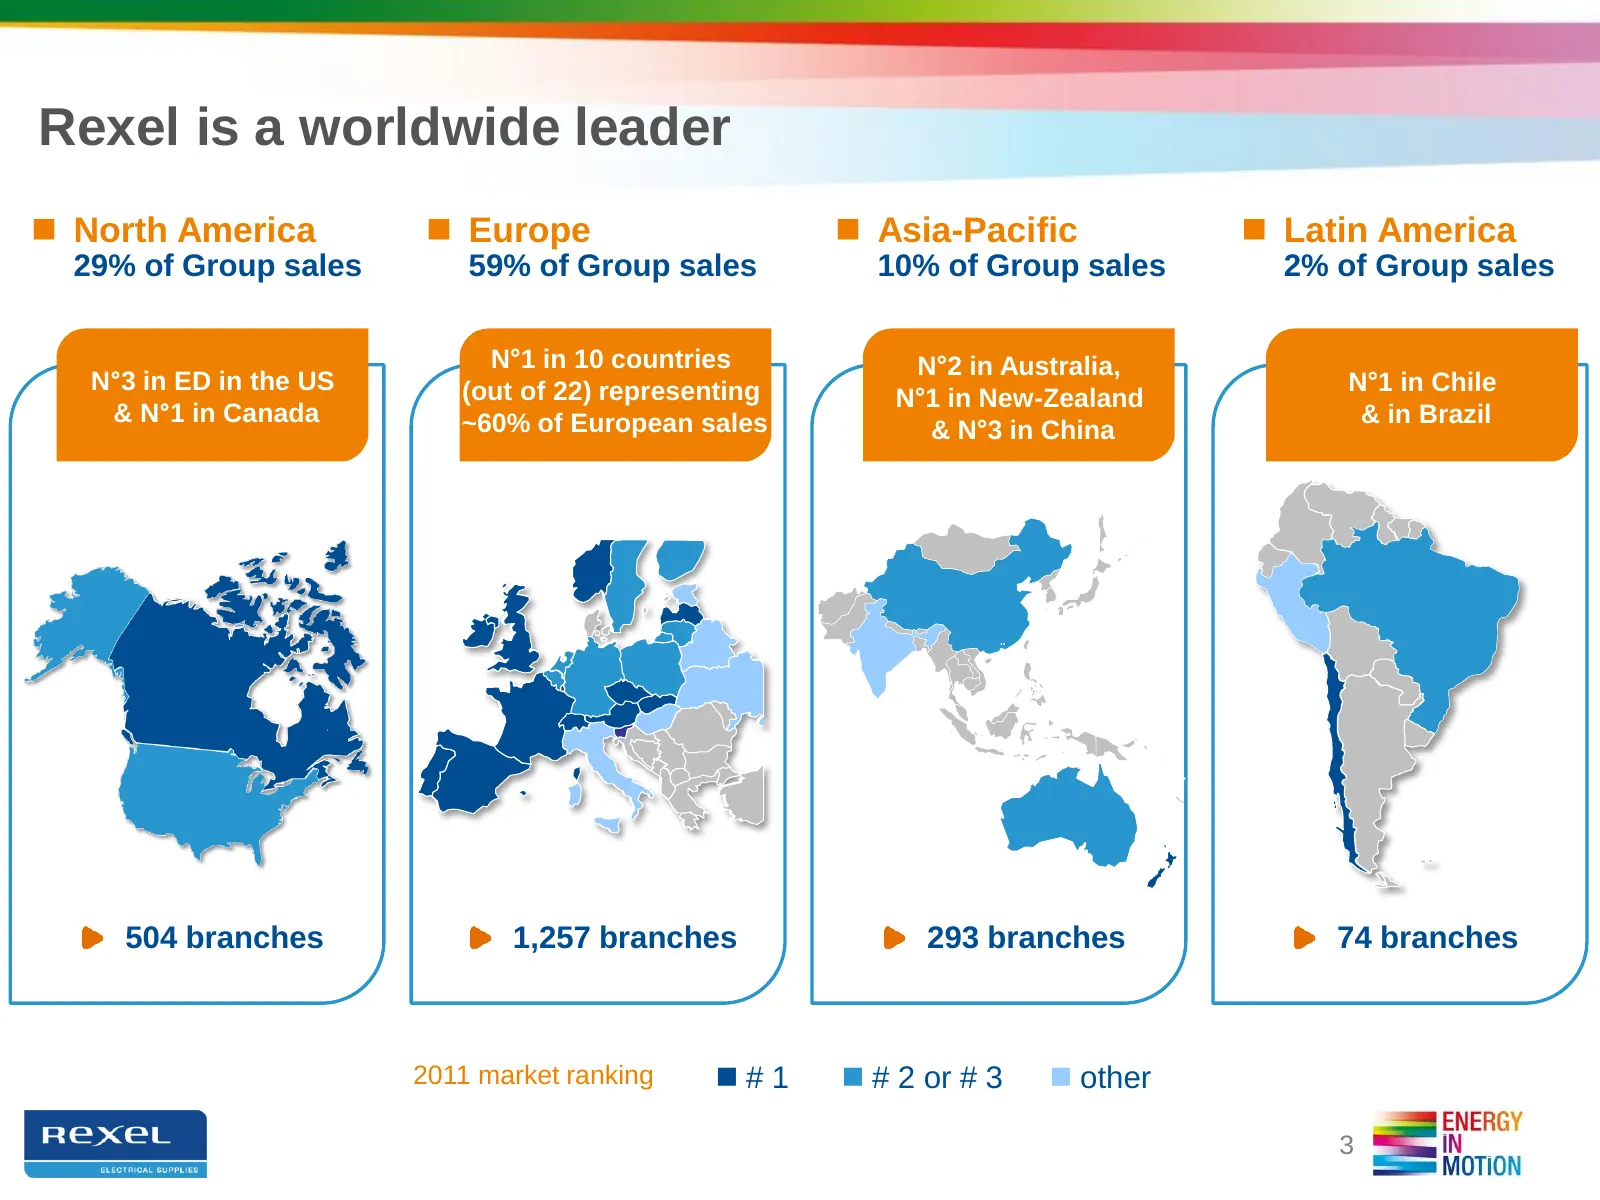
Slide 3: Rexel is a worldwide leader
Rexel is a worldwide leader North America Europe Asia-Pacific Latin America 29% of Group sales 59% of Group sales 10% of Group sales 2% of Group sales N°1 in 10 countries N°2 in Australia, N°3 in ED in the US (out of 22) representing N°1 in Chile N°1 in New-Zealand & N°1 in Canada ~60% of Eu
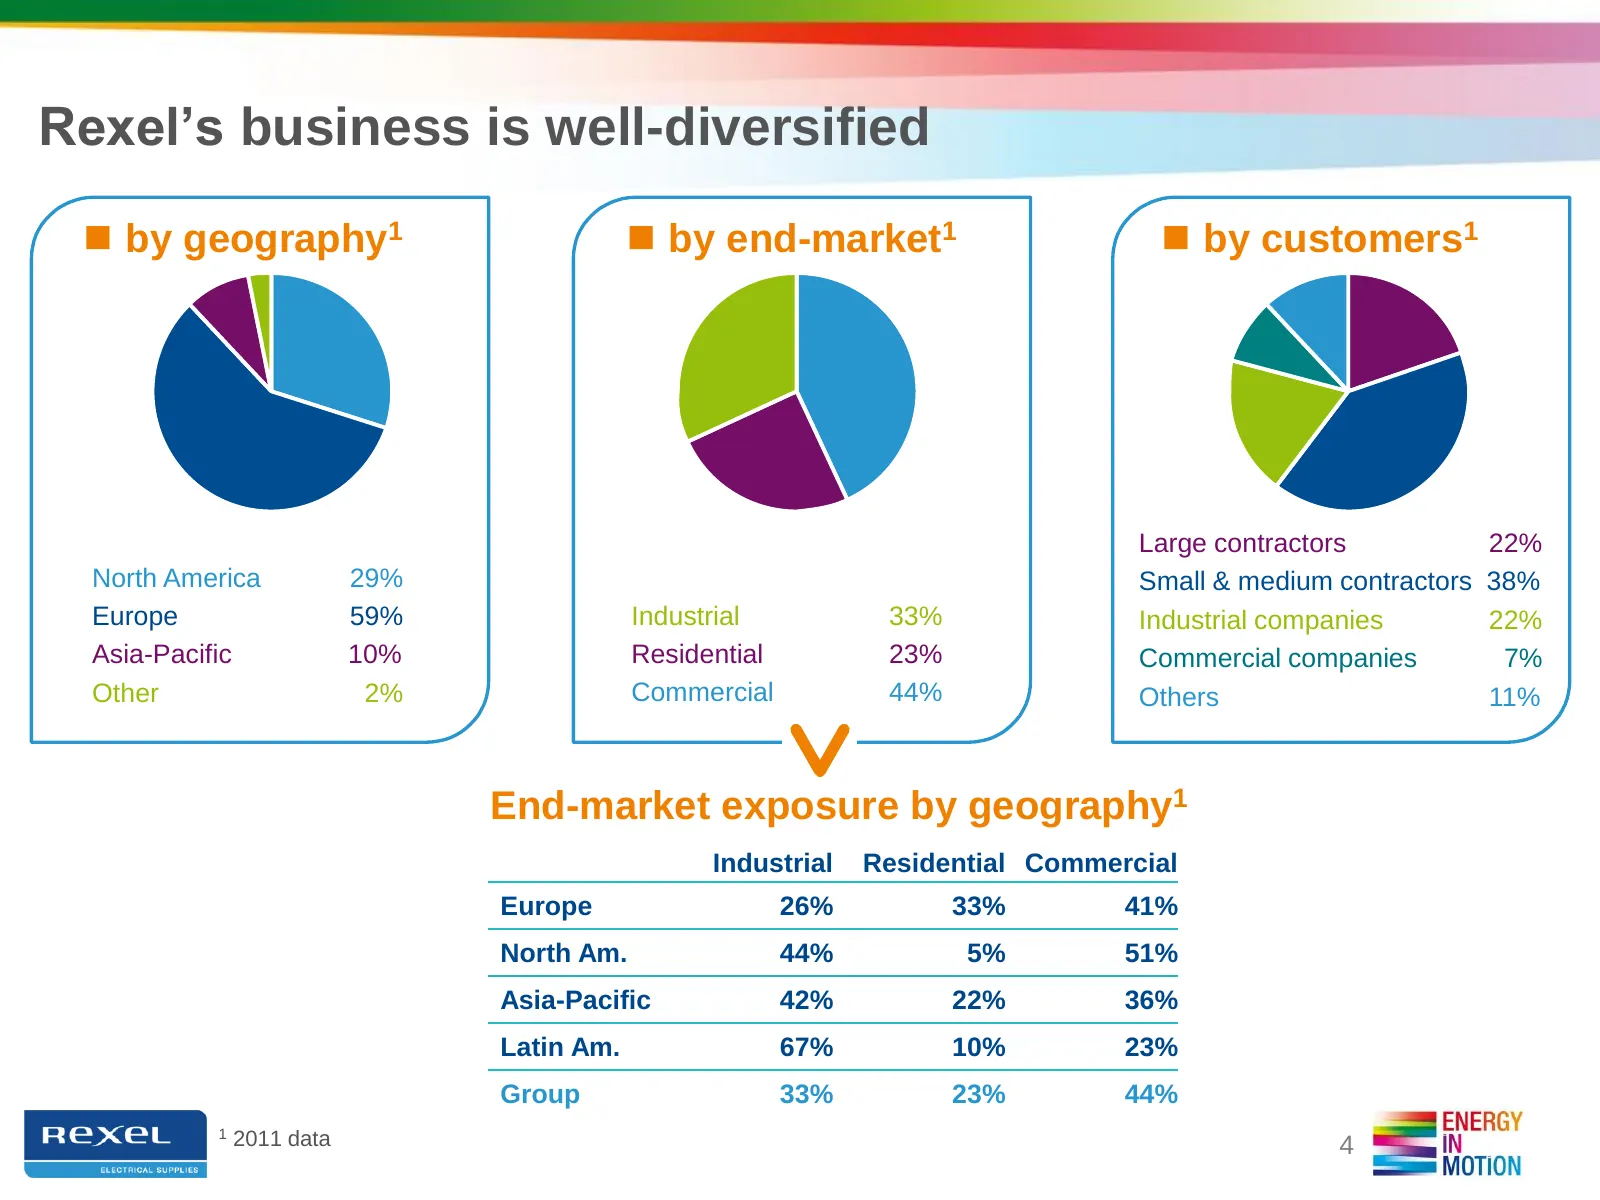
Slide 4: Rexel's business is well-diversified
Rexel’s business is well-diversified by geography1 by end-market1 by customers1 Large contractors 22% North America 29% Small & medium contractors 38% Europe 59% Industrial 33% Industrial companies 22% Asia-Pacific 10% Residential 23% Commercial companies 7% Other 2% Commercial 44% Others 11%
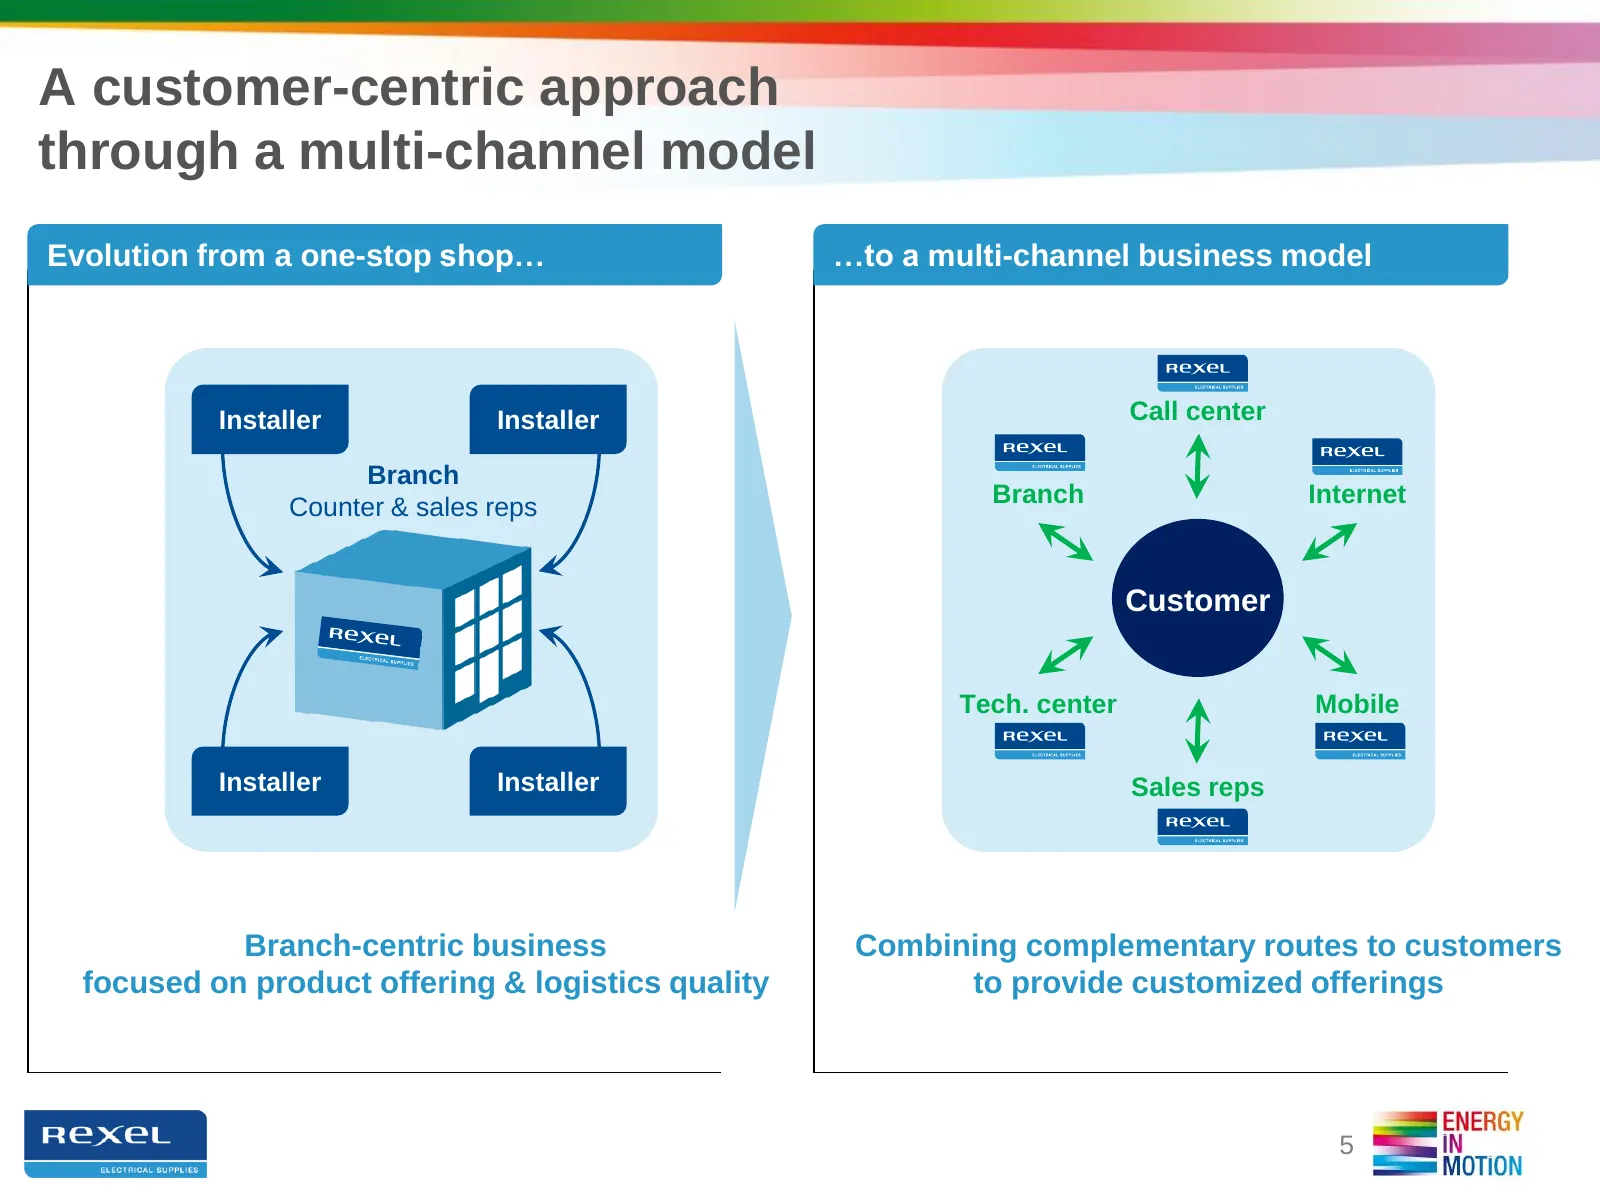
Slide 5: A customer-centric approach through a multi-channel model
A customer-centric approach through a multi-channel model Evolution from a one-stop shop… …to a multi-channel business model Installer Installer Call center Branch Counter & sales reps Branch Internet Customer Tech. center Mobile Installer Installer Sales reps Branch-centric business Combining compl
Slide 6: Rexel has strong relationships with its suppliers
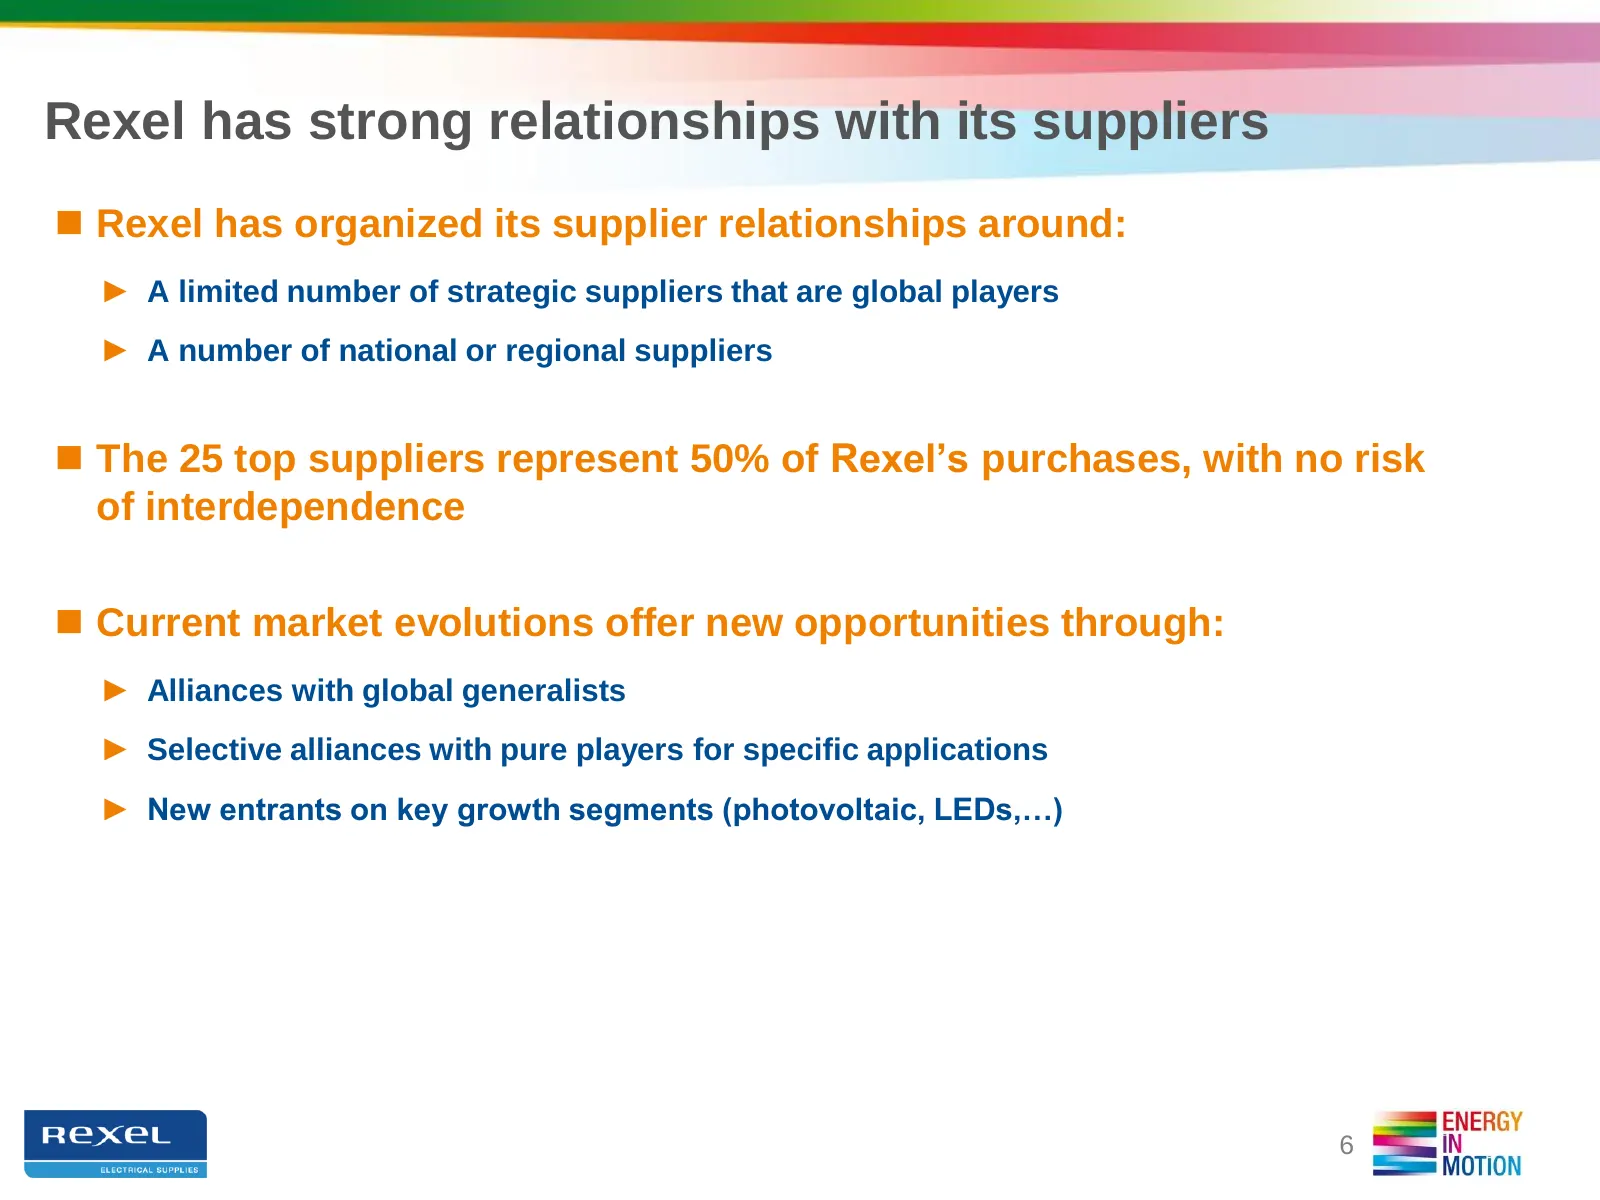
Rexel has strong relationships with its suppliers Rexel has organized its supplier relationships around: ► A limited number of strategic suppliers that are global players ► A number of national or regional suppliers The 25 top suppliers represent 50% of Rexel’s purchases, with no risk of interde
Slide 7: Rexel: a market consolidator with a proven capacity to extract synergies
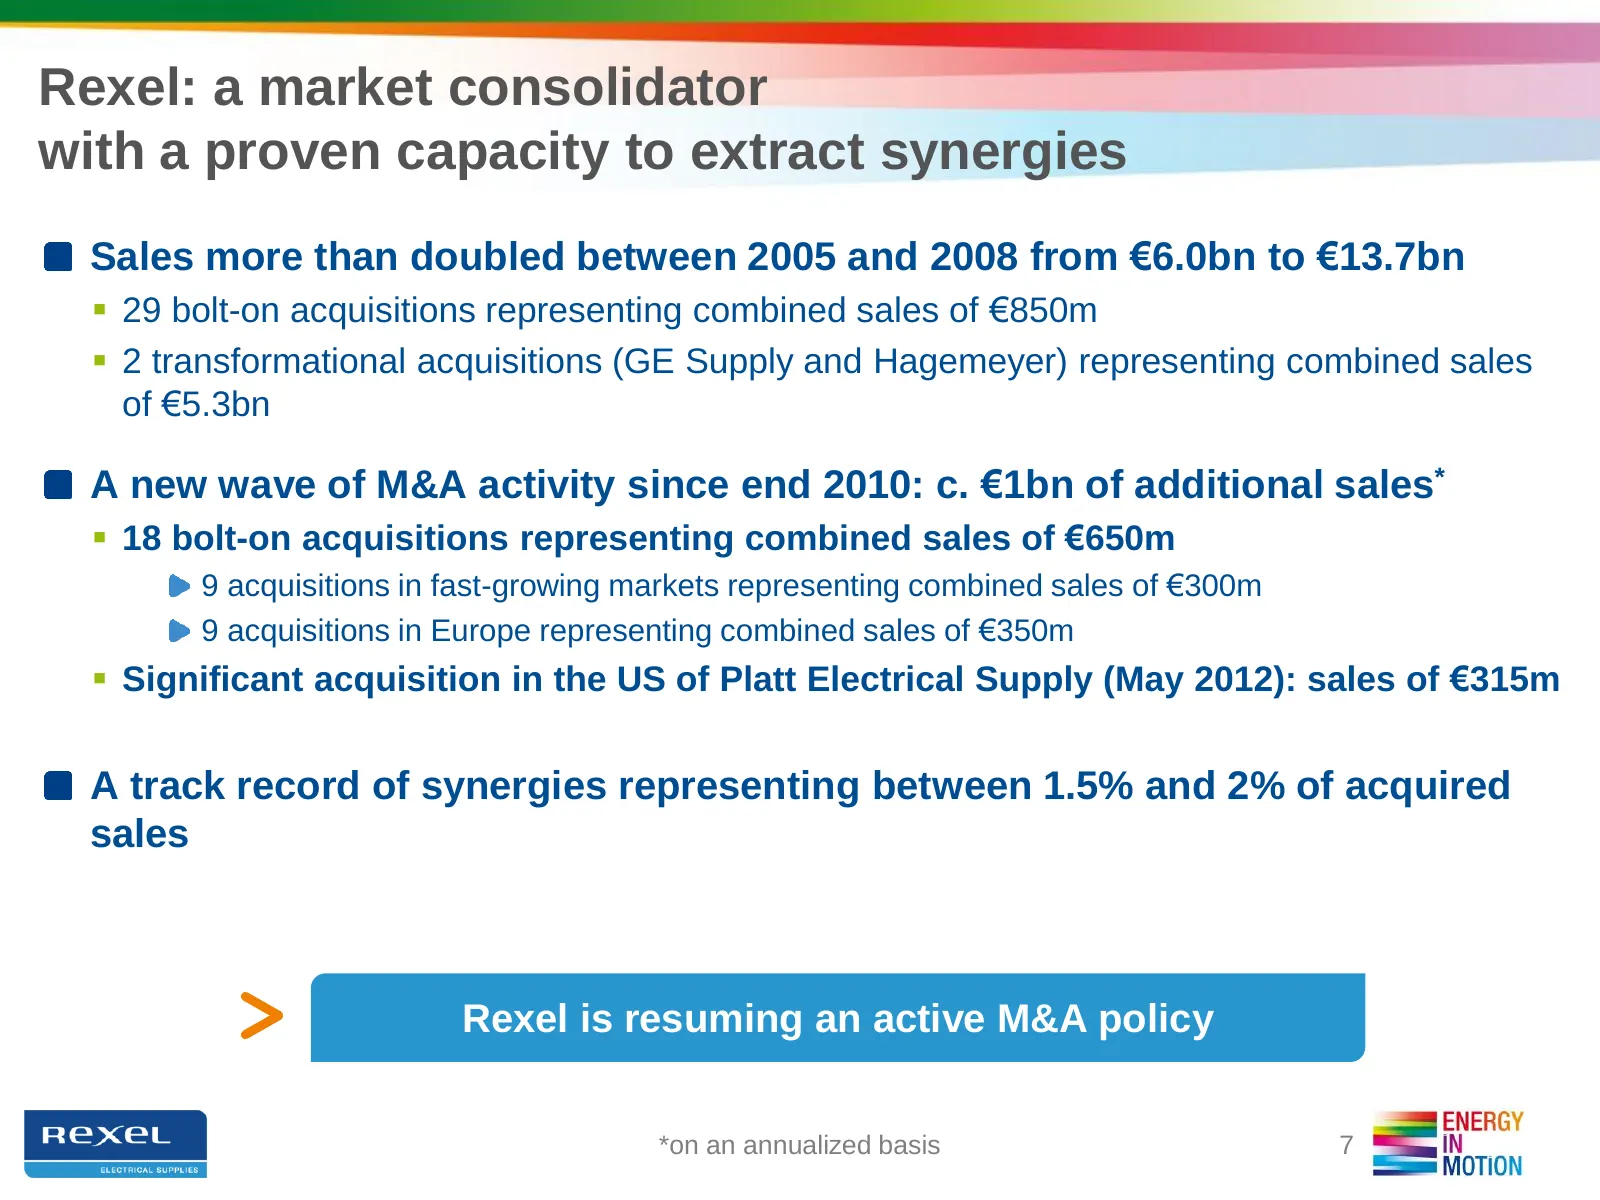
Rexel: a market consolidator with a proven capacity to extract synergies Sales more than doubled between 2005 and 2008 from €6.0bn to €13.7bn 29 bolt-on acquisitions representing combined sales of €850m 2 transformational acquisitions (GE Supply and Hagemeyer) representing combined sales of €5.3
Slide 8: Resilience across cycles thanks to margin discipline and cost management
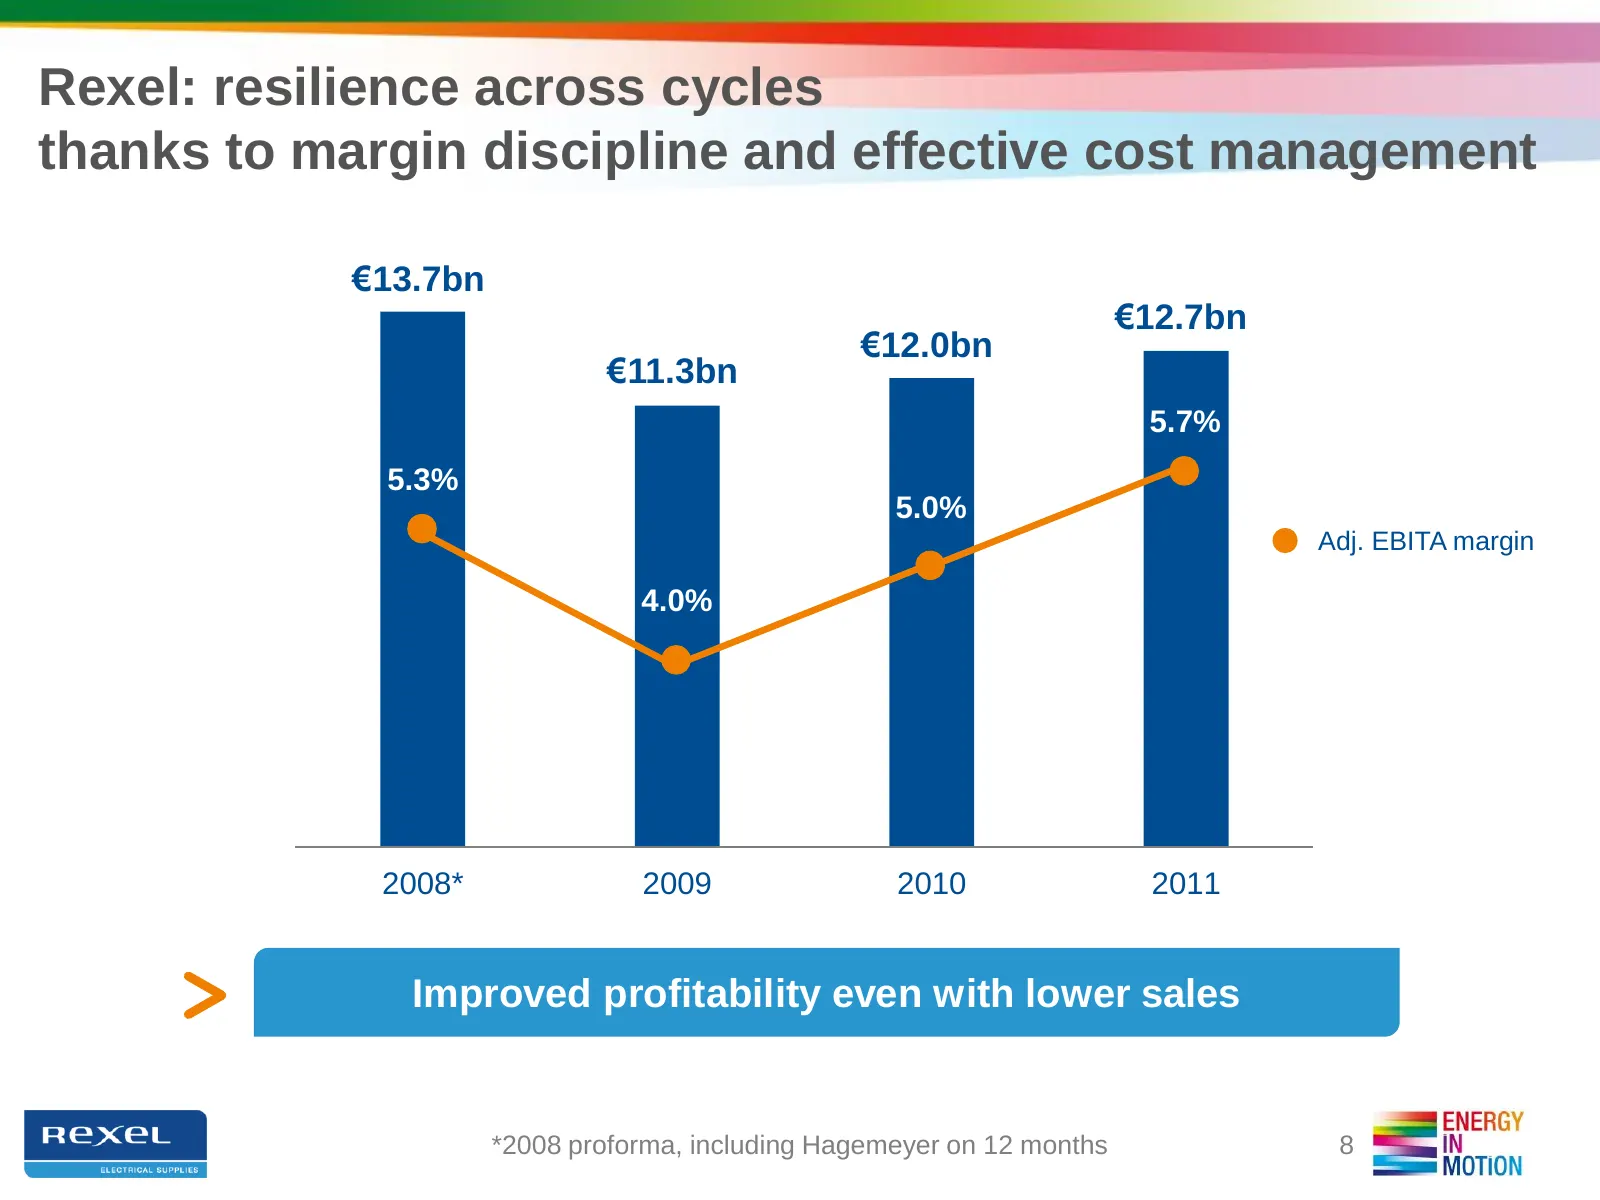
Rexel: resilience across cycles thanks to margin discipline and effective cost management €13.7bn €12.7bn €12.0bn €11.3bn 5.7% 5.3% 5.0% Adj. EBITA margin 4.0% 2008* 2009 2010 2011 Improved profitability even with lower sales *2008 proforma, including Hagemeyer on 12 months 8
Slide 9: Solid cash-flow generation supporting rapid deleveraging
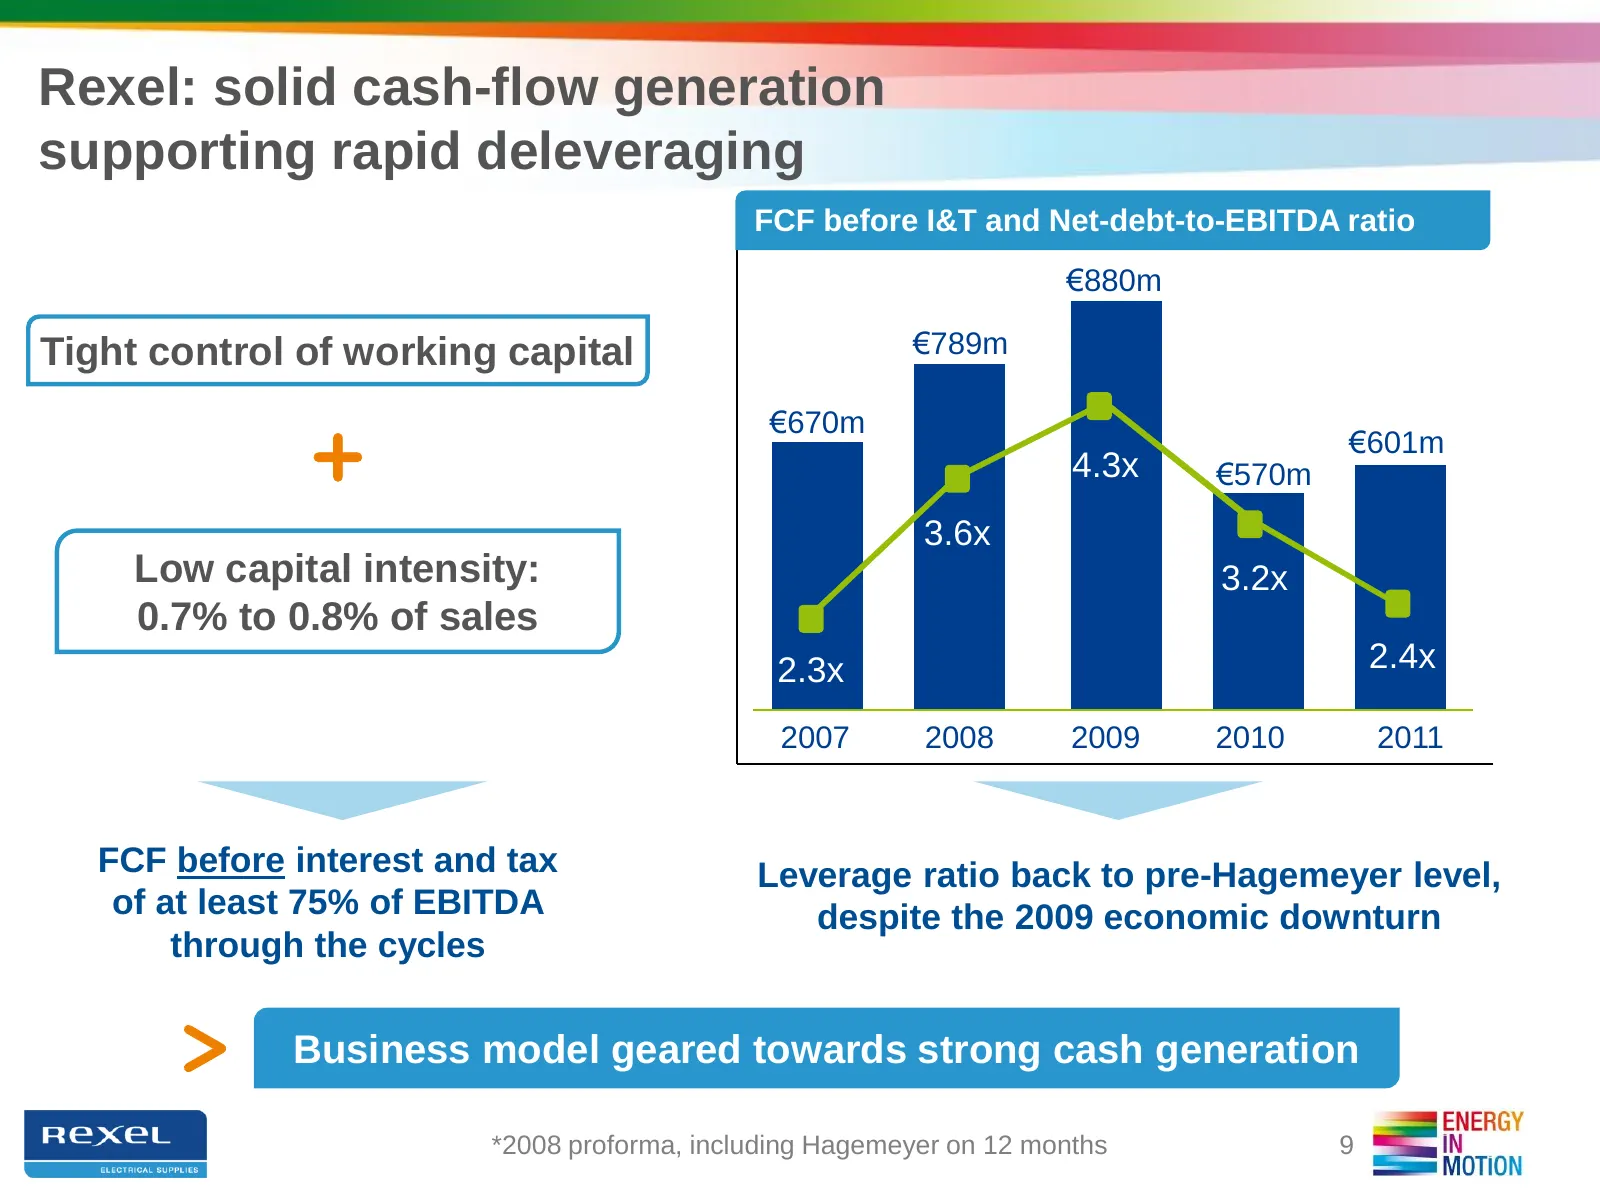
Rexel: solid cash-flow generation supporting rapid deleveraging FCF before I&T and Net-debt-to-EBITDA ratio €880m Tight control of working capital €789m €670m €601m 4.3x €570m 3.6x Low capital intensity: 3.2x 0.7% to 0.8% of sales 2.3x 2.4x 2007 2008 2009 2010 2011 FCF before interest and tax Levera
Slide 10: Q2 & H1 Results
Q2 & H1 RESULTS (unaudited) Financial statements at June 30, 2012 were authorized for issue by the Management Board on July 19, 2012. The condensed consolidated interim financial statements as of June 30, 2012 have been subjected to a limited review by Rexel’s statutory auditors.
Slide 11: Improved profitability and solid cash-flow in Q2
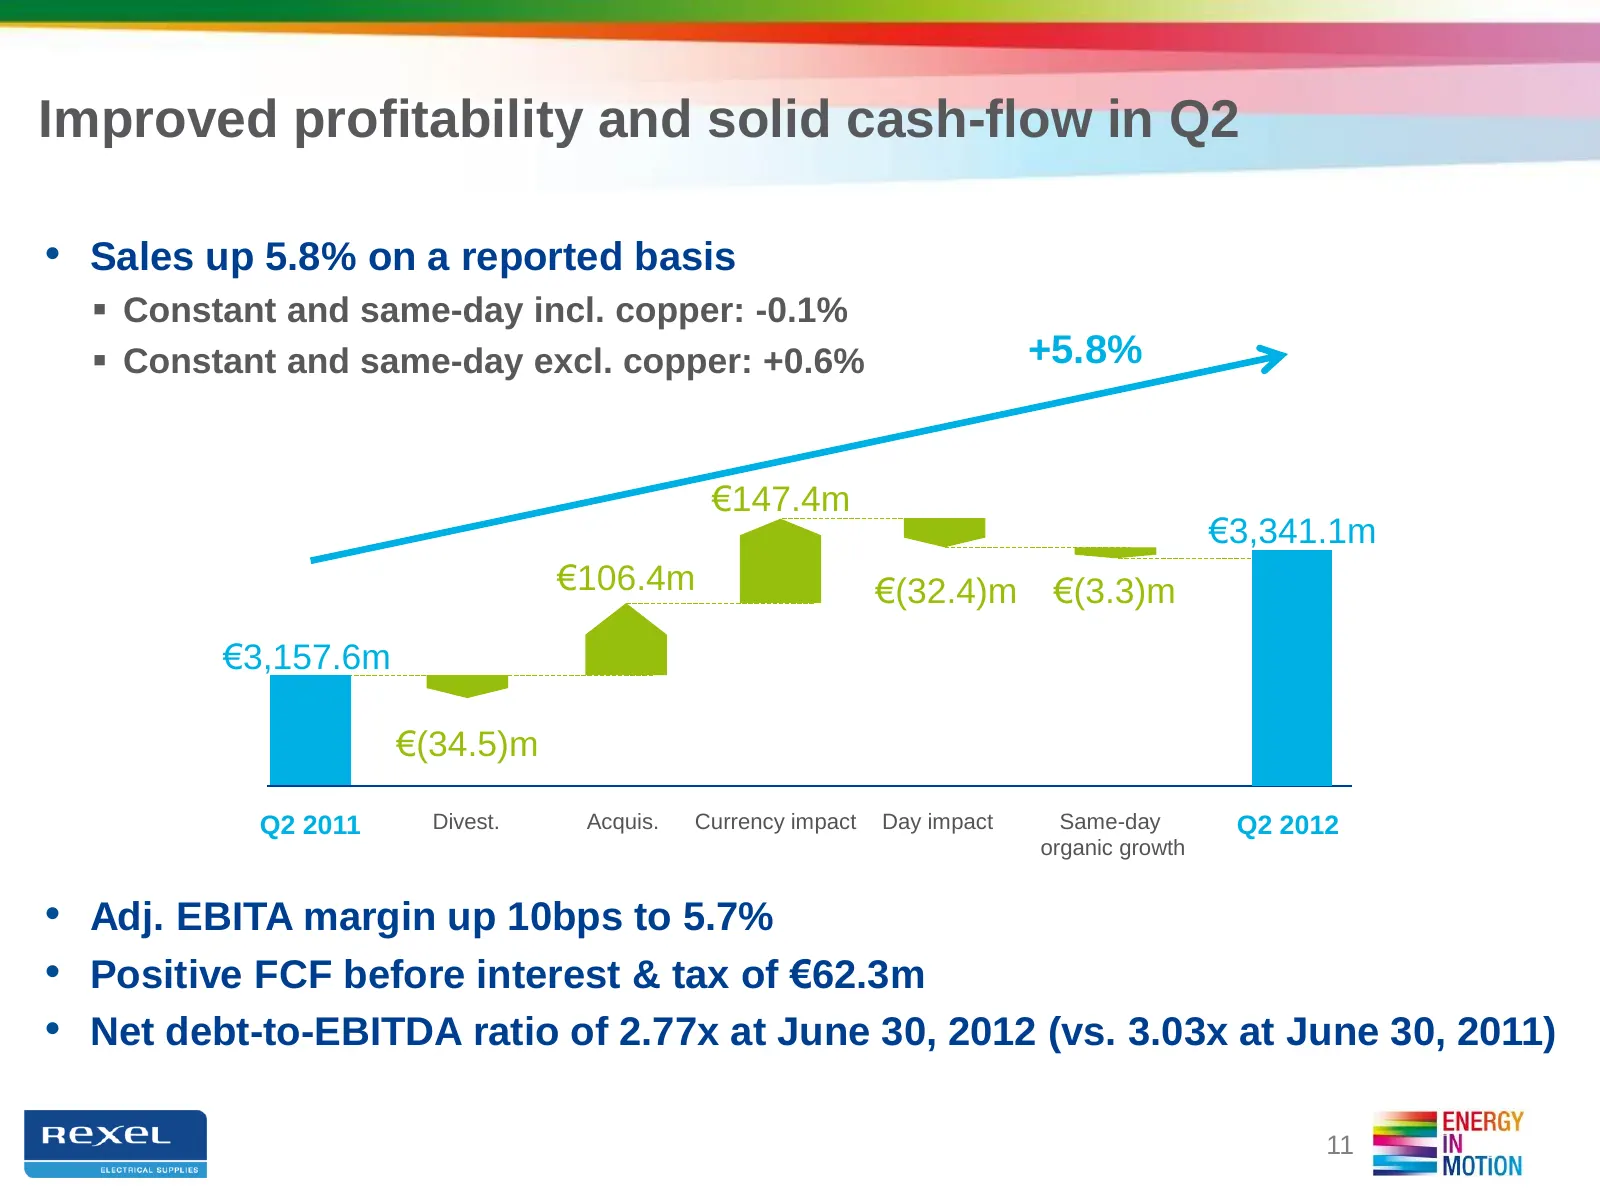
Improved profitability and solid cash-flow in Q2 • Sales up 5.8% on a reported basis Constant and same-day incl. copper: -0.1% Constant and same-day excl. copper: +0.6% +5.8% €147.4m €3,341.1m €106.4m €(32.4)m €(3.3)m €3,157.6m €(34.5)m Q2 2011 Divest. Acquis. Currency impact Day impact Same-day
Slide 12: Solid performance in H1
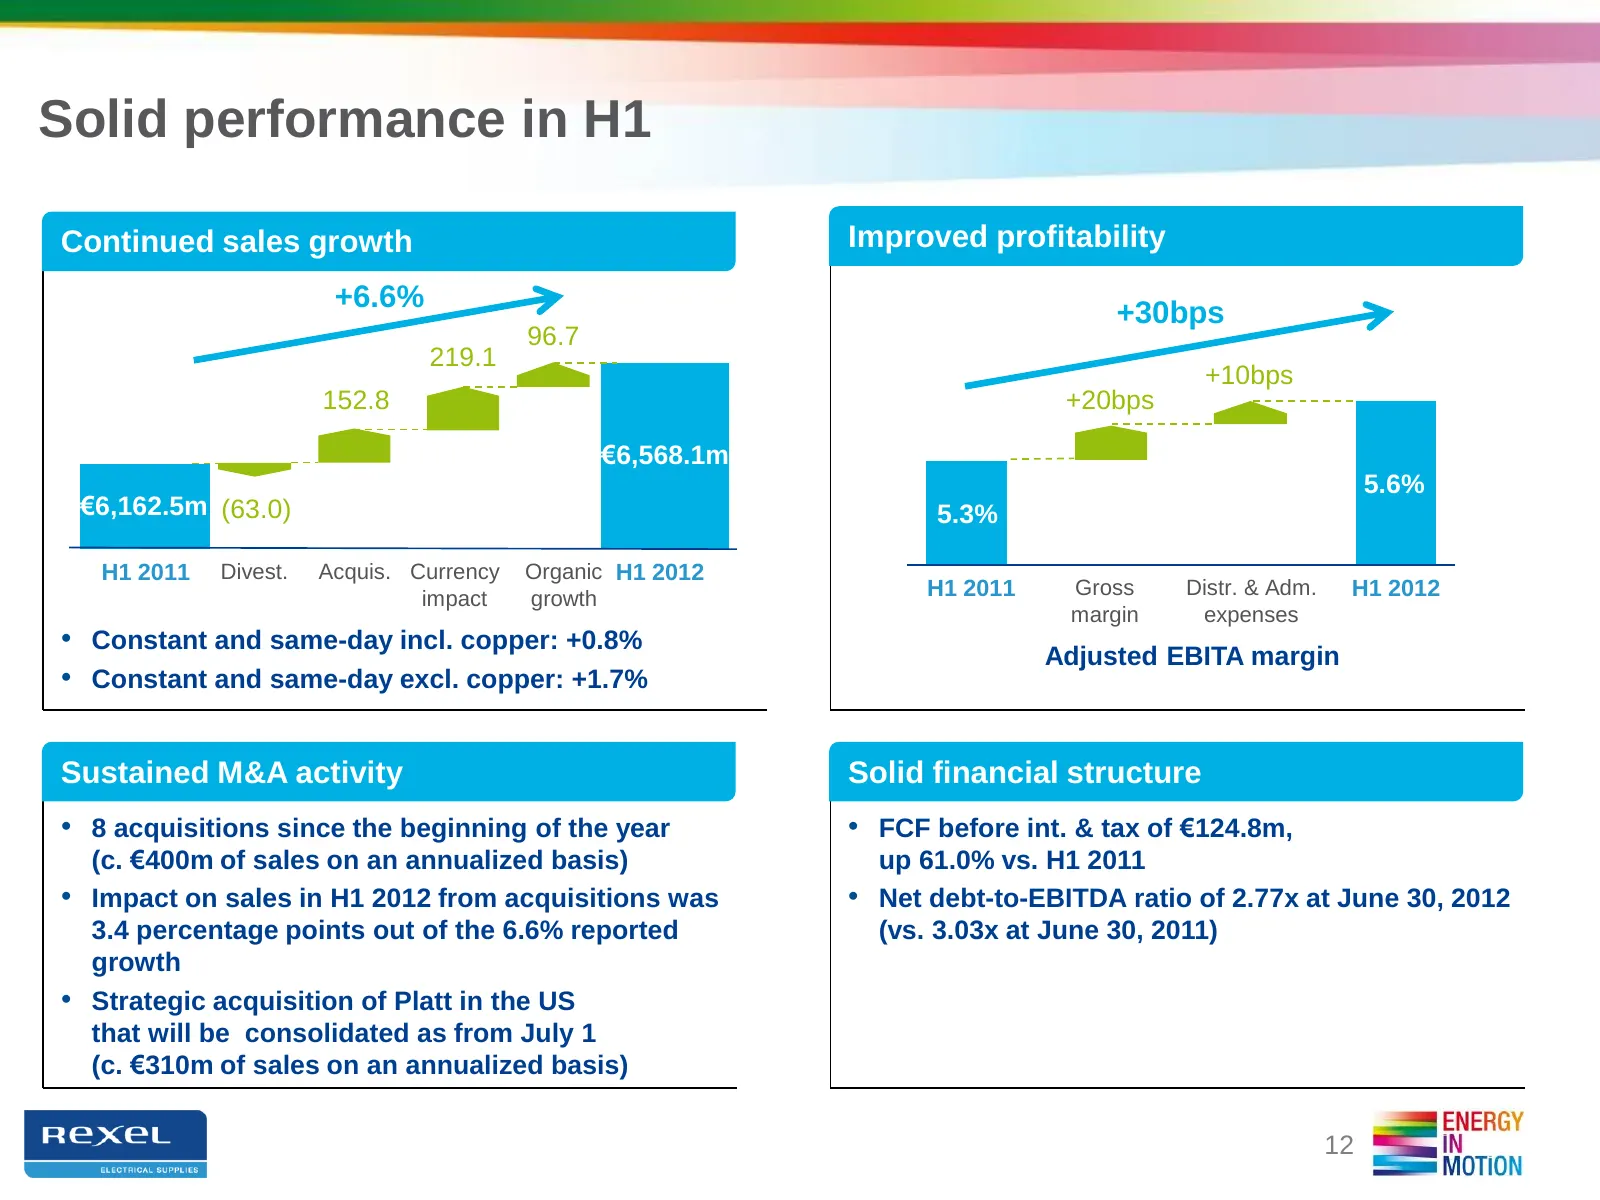
Solid performance in H1 Continued sales growth Improved profitability +6.6% +30bps 96.7 219.1 +10bps 152.8 +20bps 5.5% €6,568.1m 5.6% €6,162.5m (63.0) 5.3% H1 2011 Divest. Acquis. Currency Organic H1 2012 impact growth H1 2011 Gross Distr. & Adm. H1 2012 margin expenses • Constant and same-day incl.
Slide 13: Europe: Improved profitability despite slowdown in sales
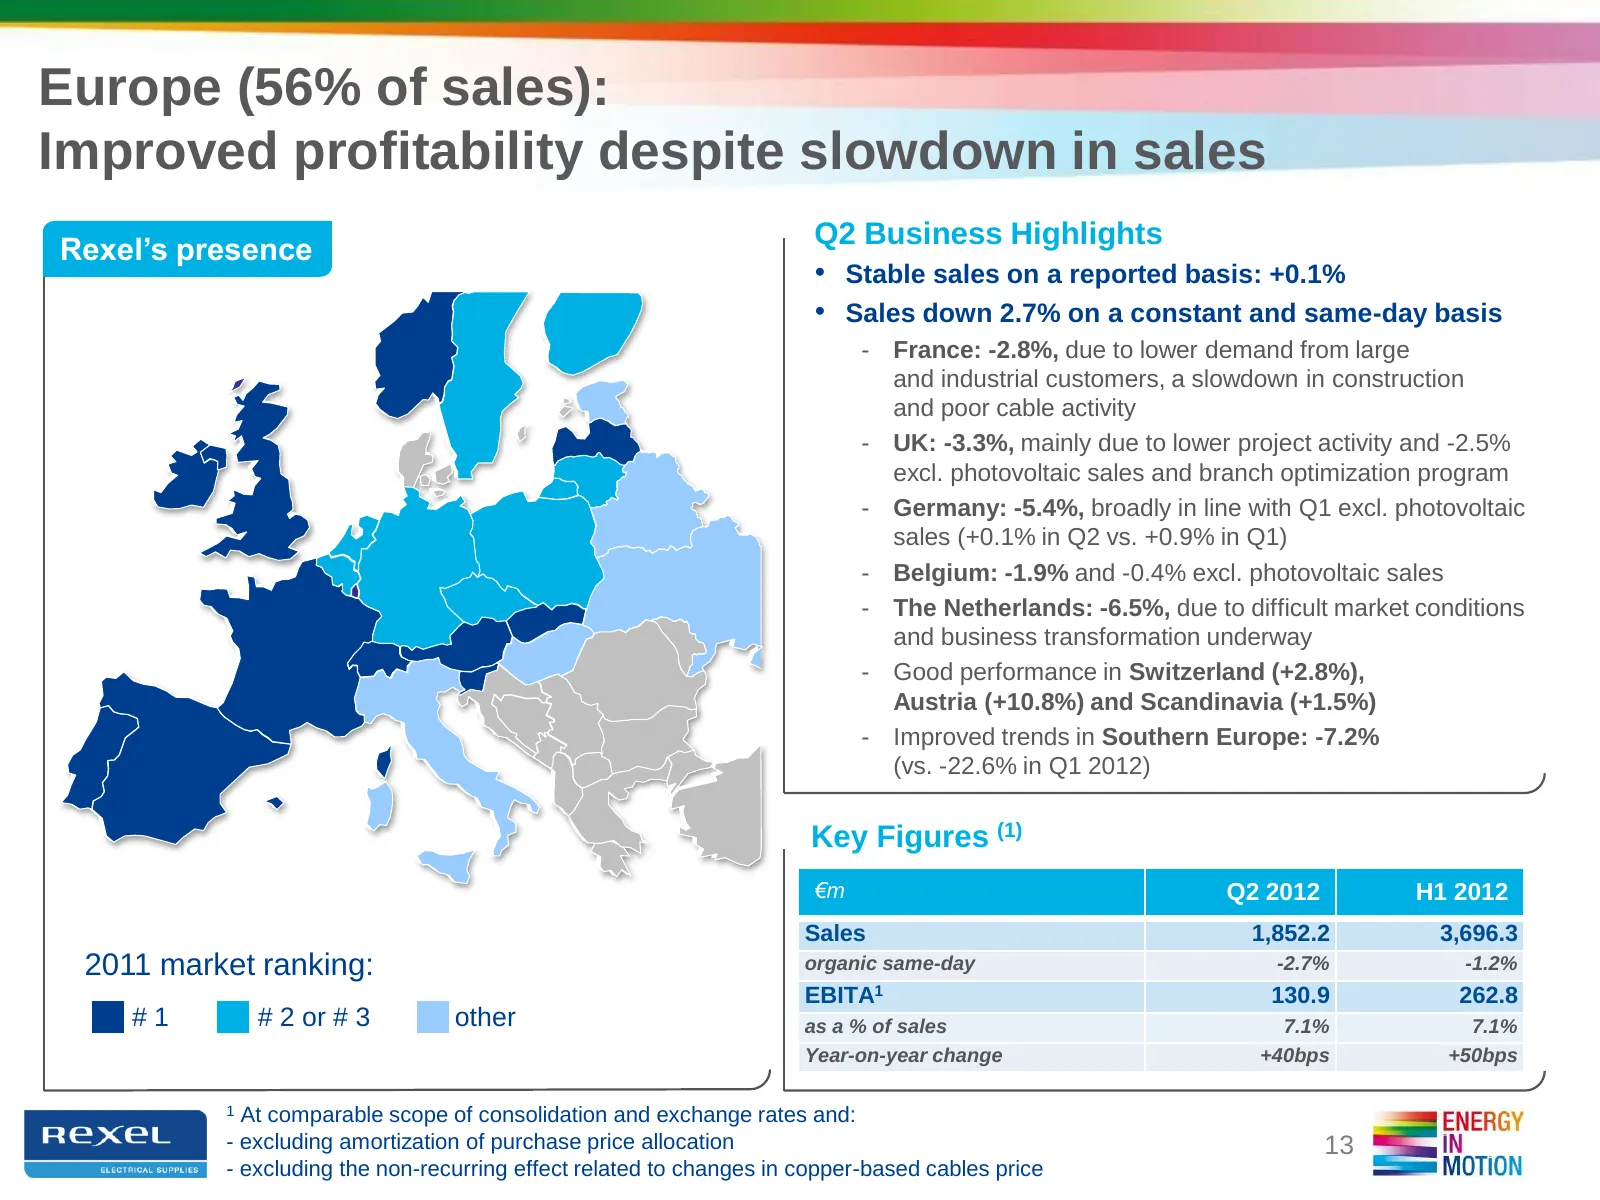
Europe (56% of sales): Improved profitability despite slowdown in sales Q2 Business Highlights Rexel’s presence • Stable sales on a reported basis: +0.1% • Sales down 2.7% on a constant and same-day basis - France: -2.8%, due to lower demand from large and industrial customers, a slowdown in constru
Slide 14: North America: Continued growth and improvement in profitability
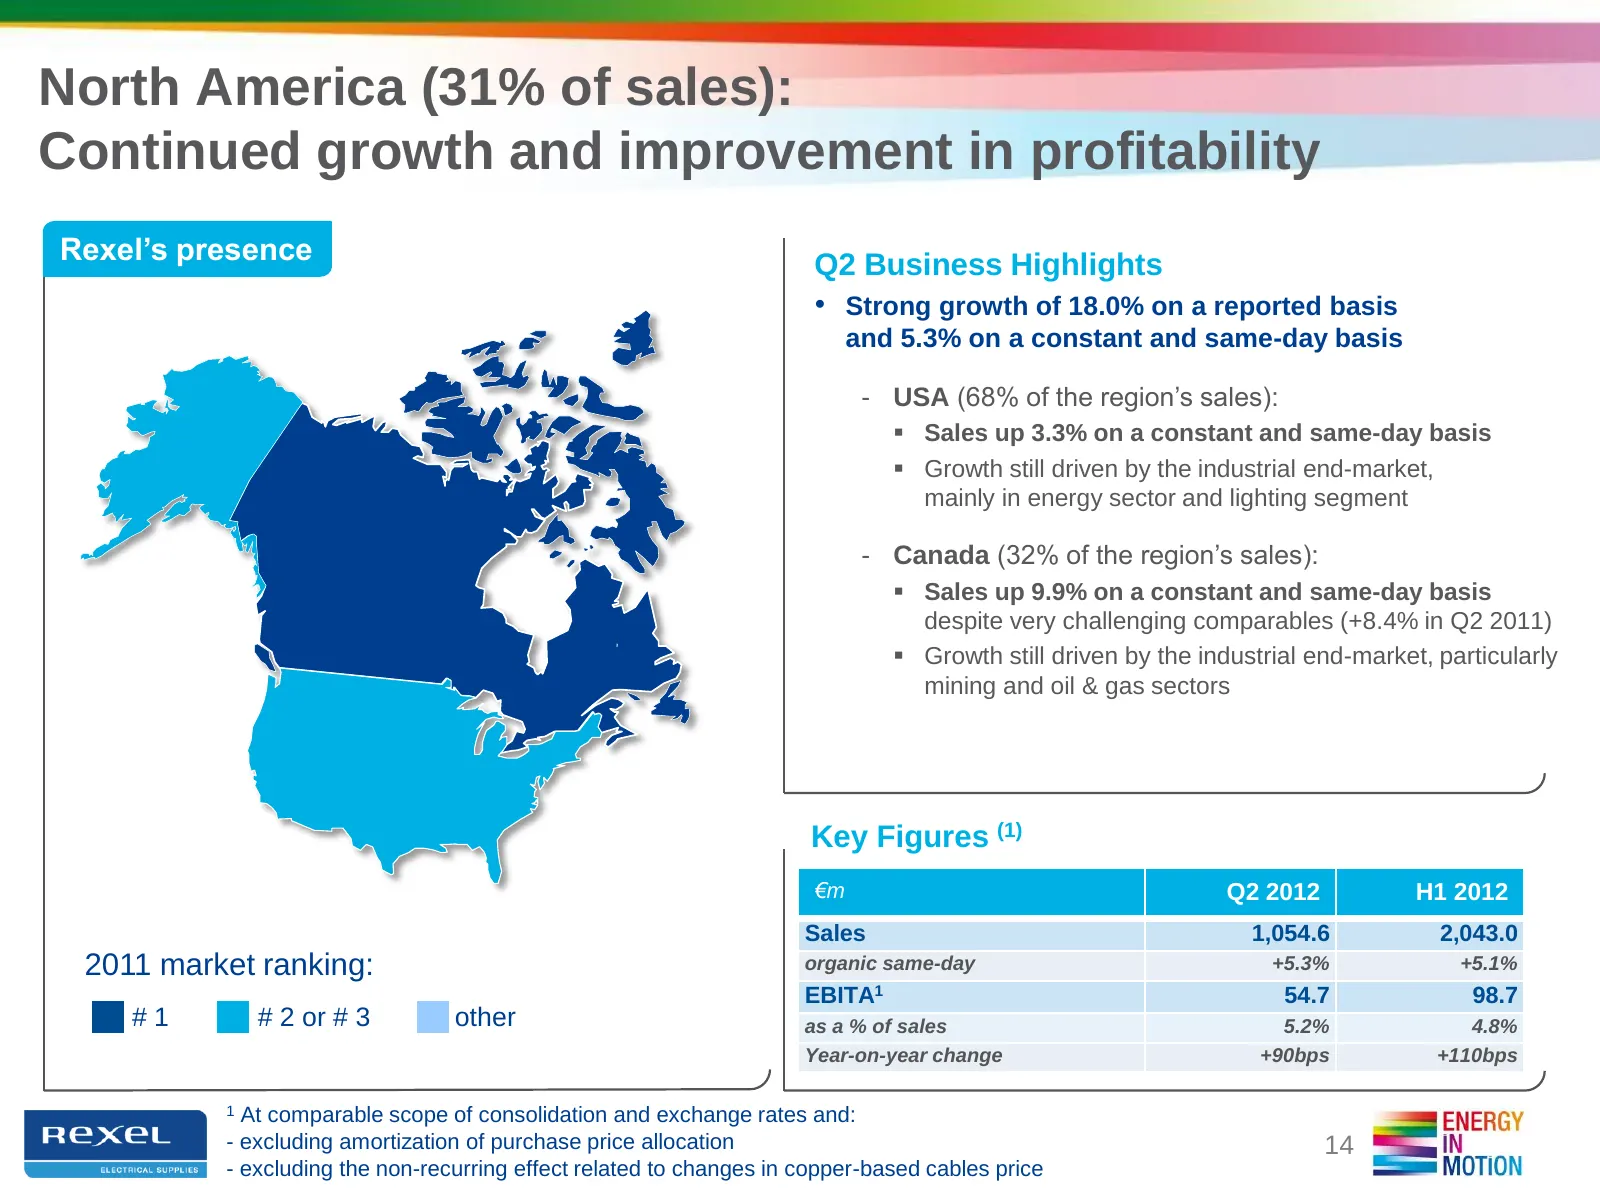
North America (31% of sales): Continued growth and improvement in profitability Rexel’s presence Q2 Business Highlights • Strong growth of 18.0% on a reported basis and 5.3% on a constant and same-day basis - USA (68% of the region’s sales): Sales up 3.3% on a constant and same-day basis Growth
Slide 15: Asia-Pacific: Solid growth in China but underperformance in the Pacific
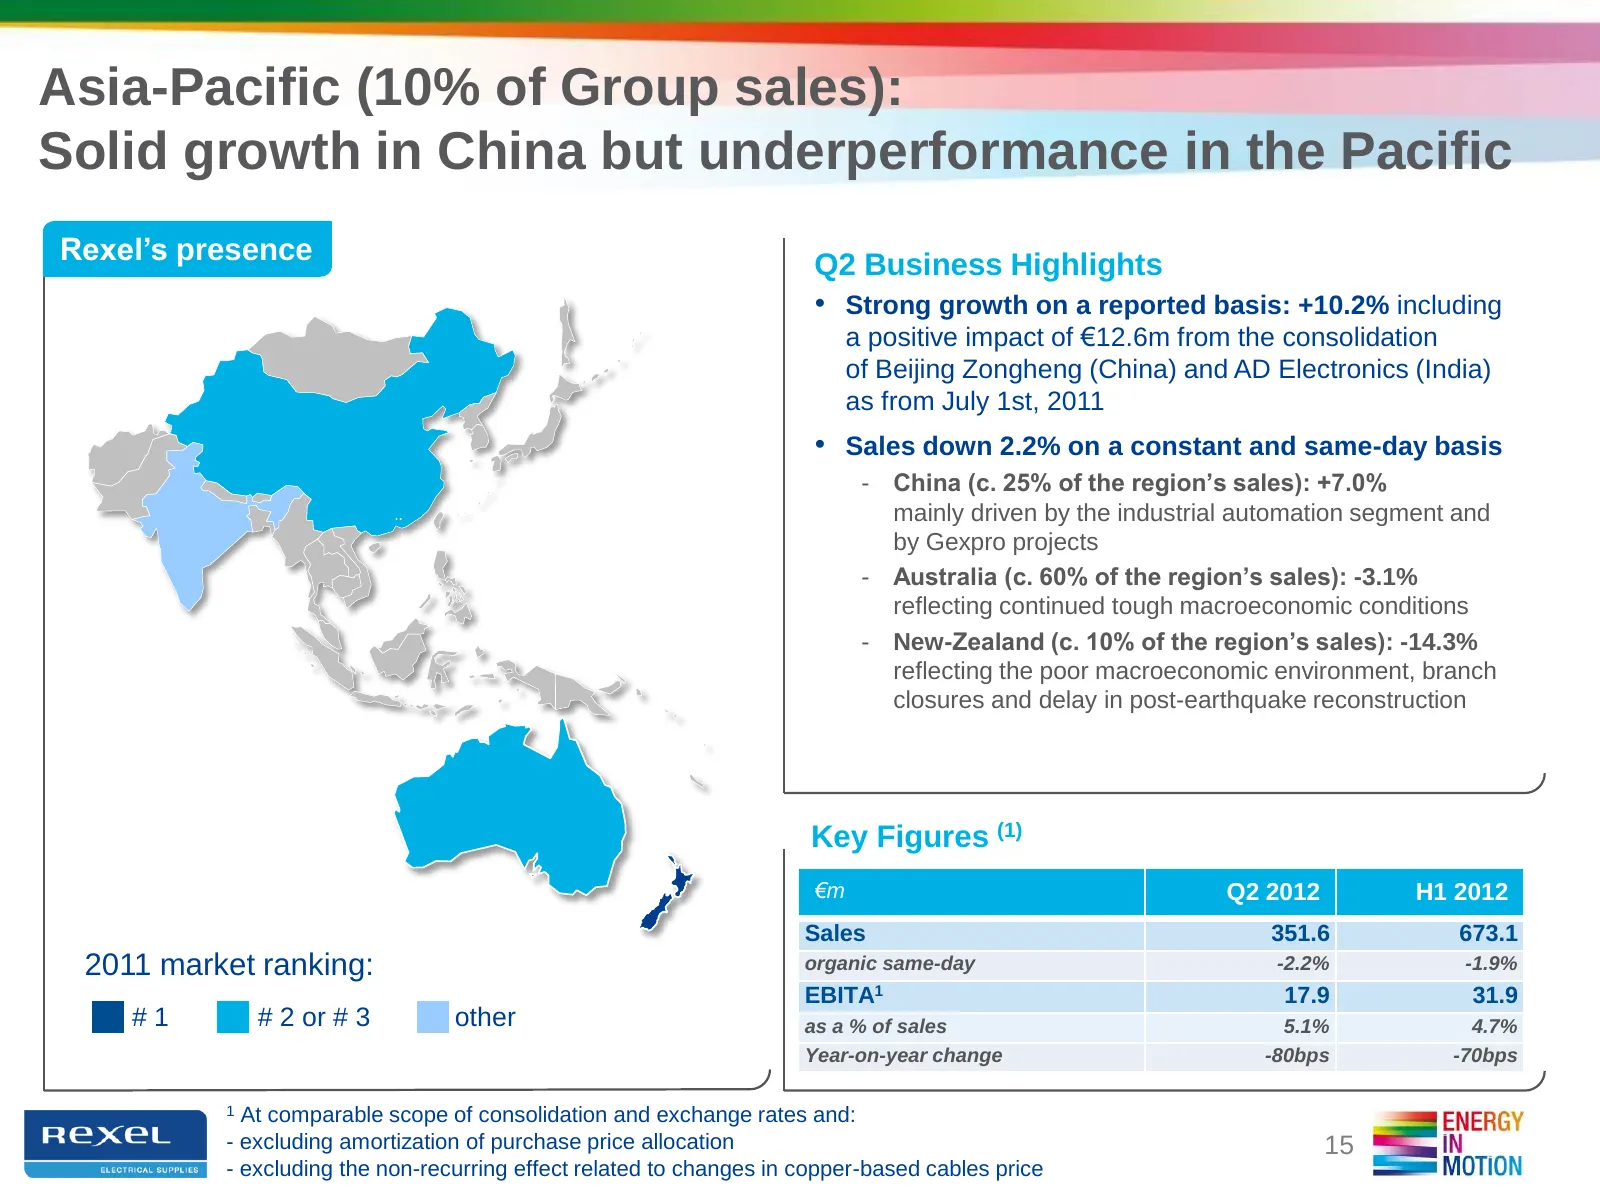
Asia-Pacific (10% of Group sales): Solid growth in China but underperformance in the Pacific Rexel’s presence Q2 Business Highlights • Strong growth on a reported basis: +10.2% including a positive impact of €12.6m from the consolidation of Beijing Zongheng (China) and AD Electronics (India) as from
Slide 16: Latin America: Sustained organic growth and focused investments
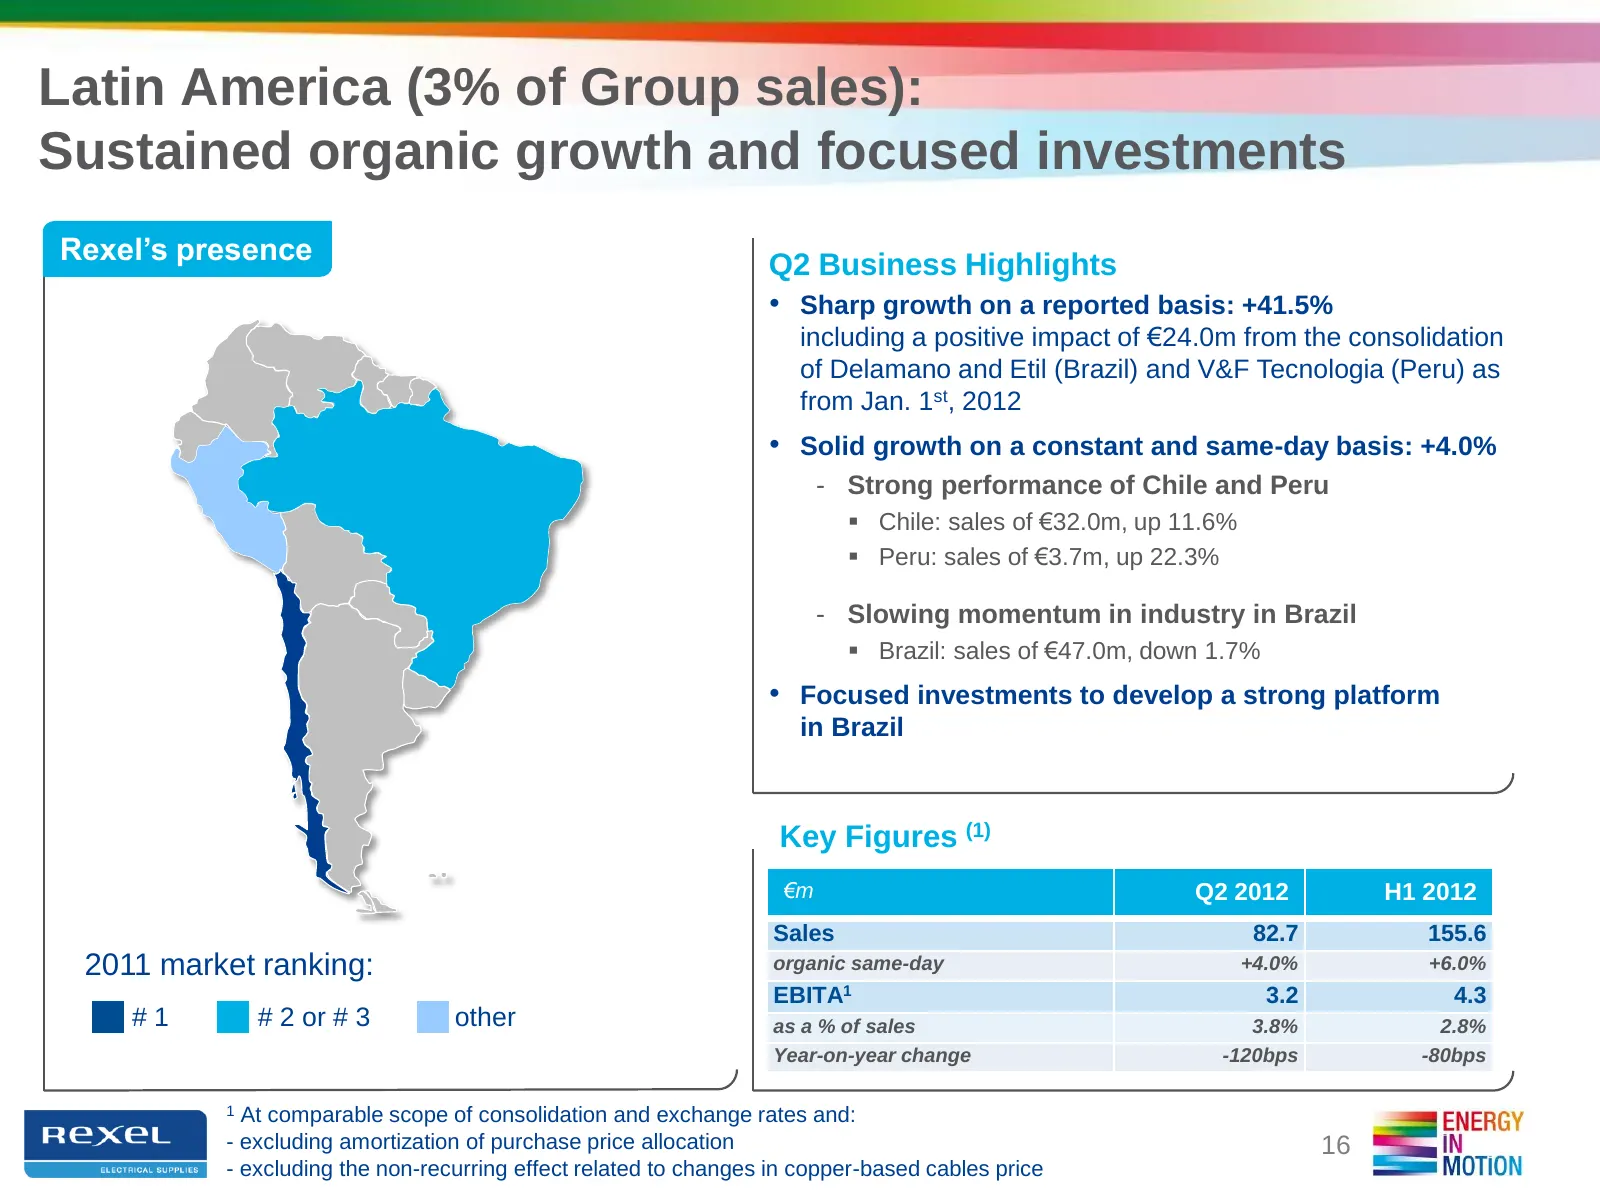
Latin America (3% of Group sales): Sustained organic growth and focused investments Rexel’s presence Q2 Business Highlights • Sharp growth on a reported basis: +41.5% including a positive impact of €24.0m from the consolidation of Delamano and Etil (Brazil) and V&F Tecnologia (Peru) as from Jan. 1st
Slide 17: Reported sales up 5.8% in Q2
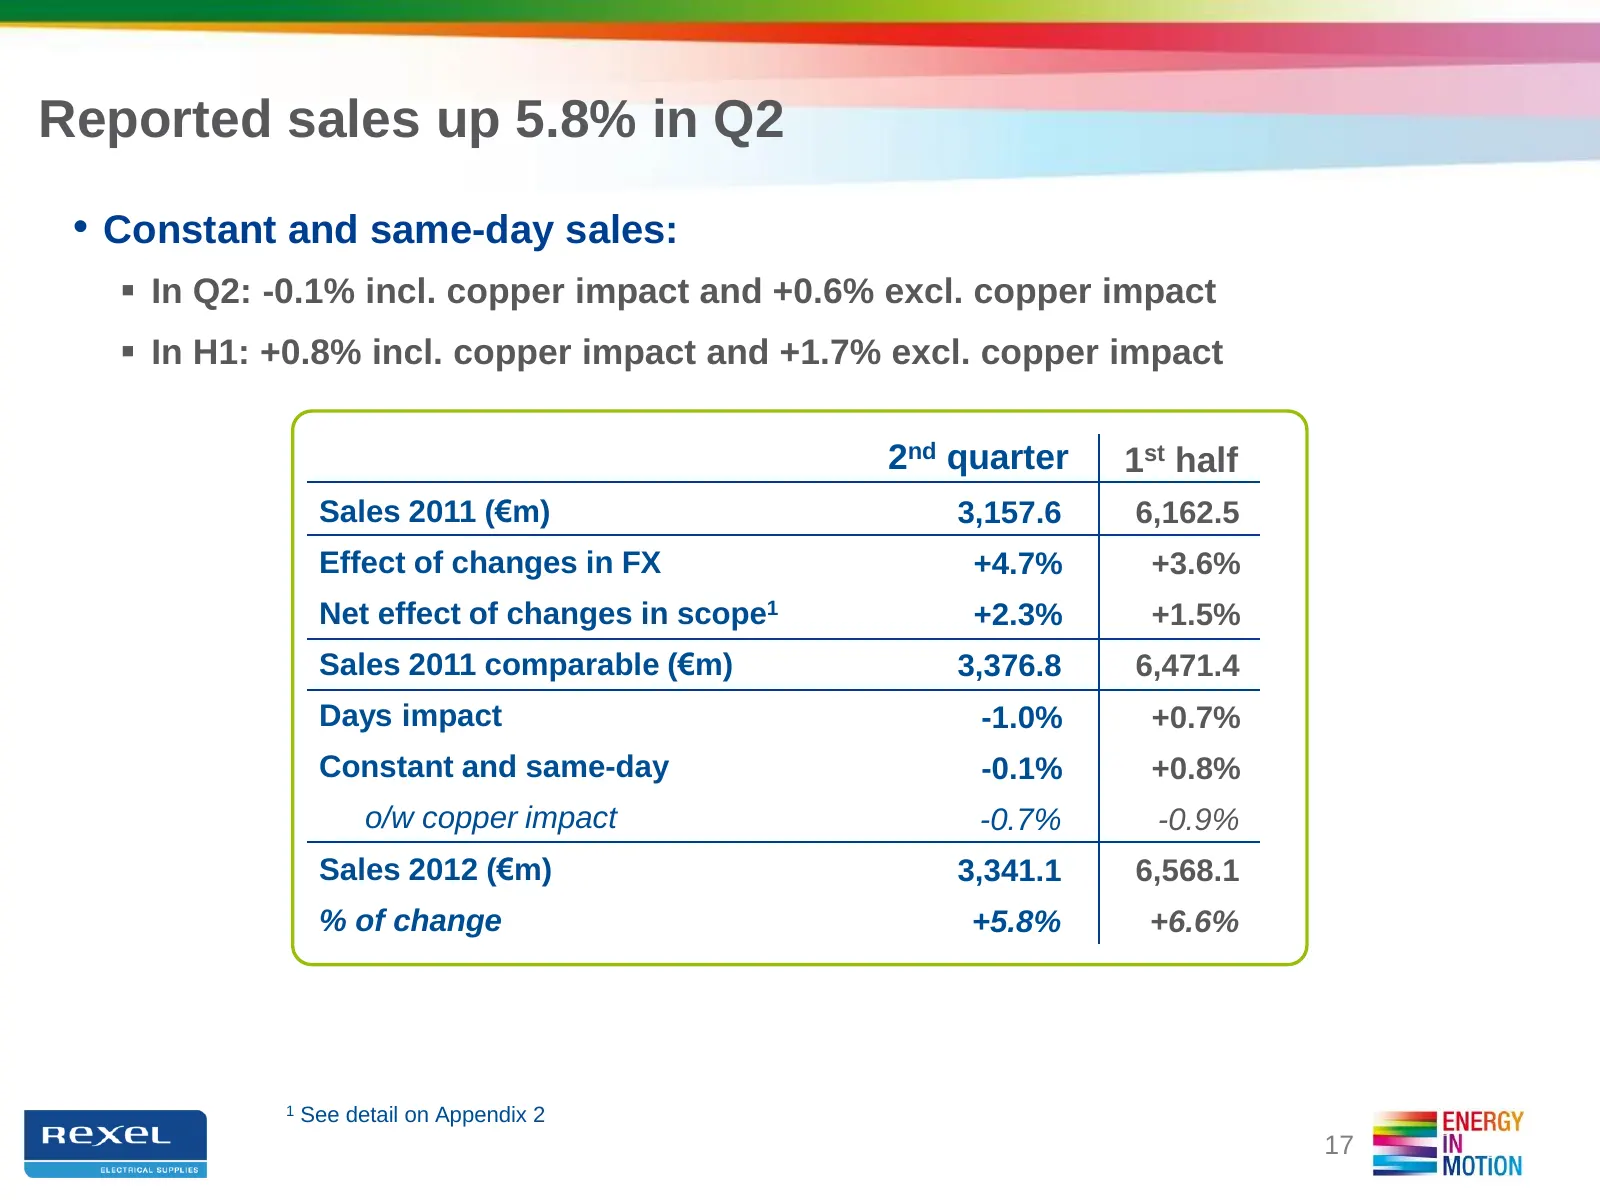
Reported sales up 5.8% in Q2 • Constant and same-day sales: In Q2: -0.1% incl. copper impact and +0.6% excl. copper impact In H1: +0.8% incl. copper impact and +1.7% excl. copper impact 2nd quarter 1st half Sales 2011 (€m) 3,157.6 6,162.5 Effect of changes in FX +4.7% +3.6% Net effect of changes
Slide 18: Improved profitability
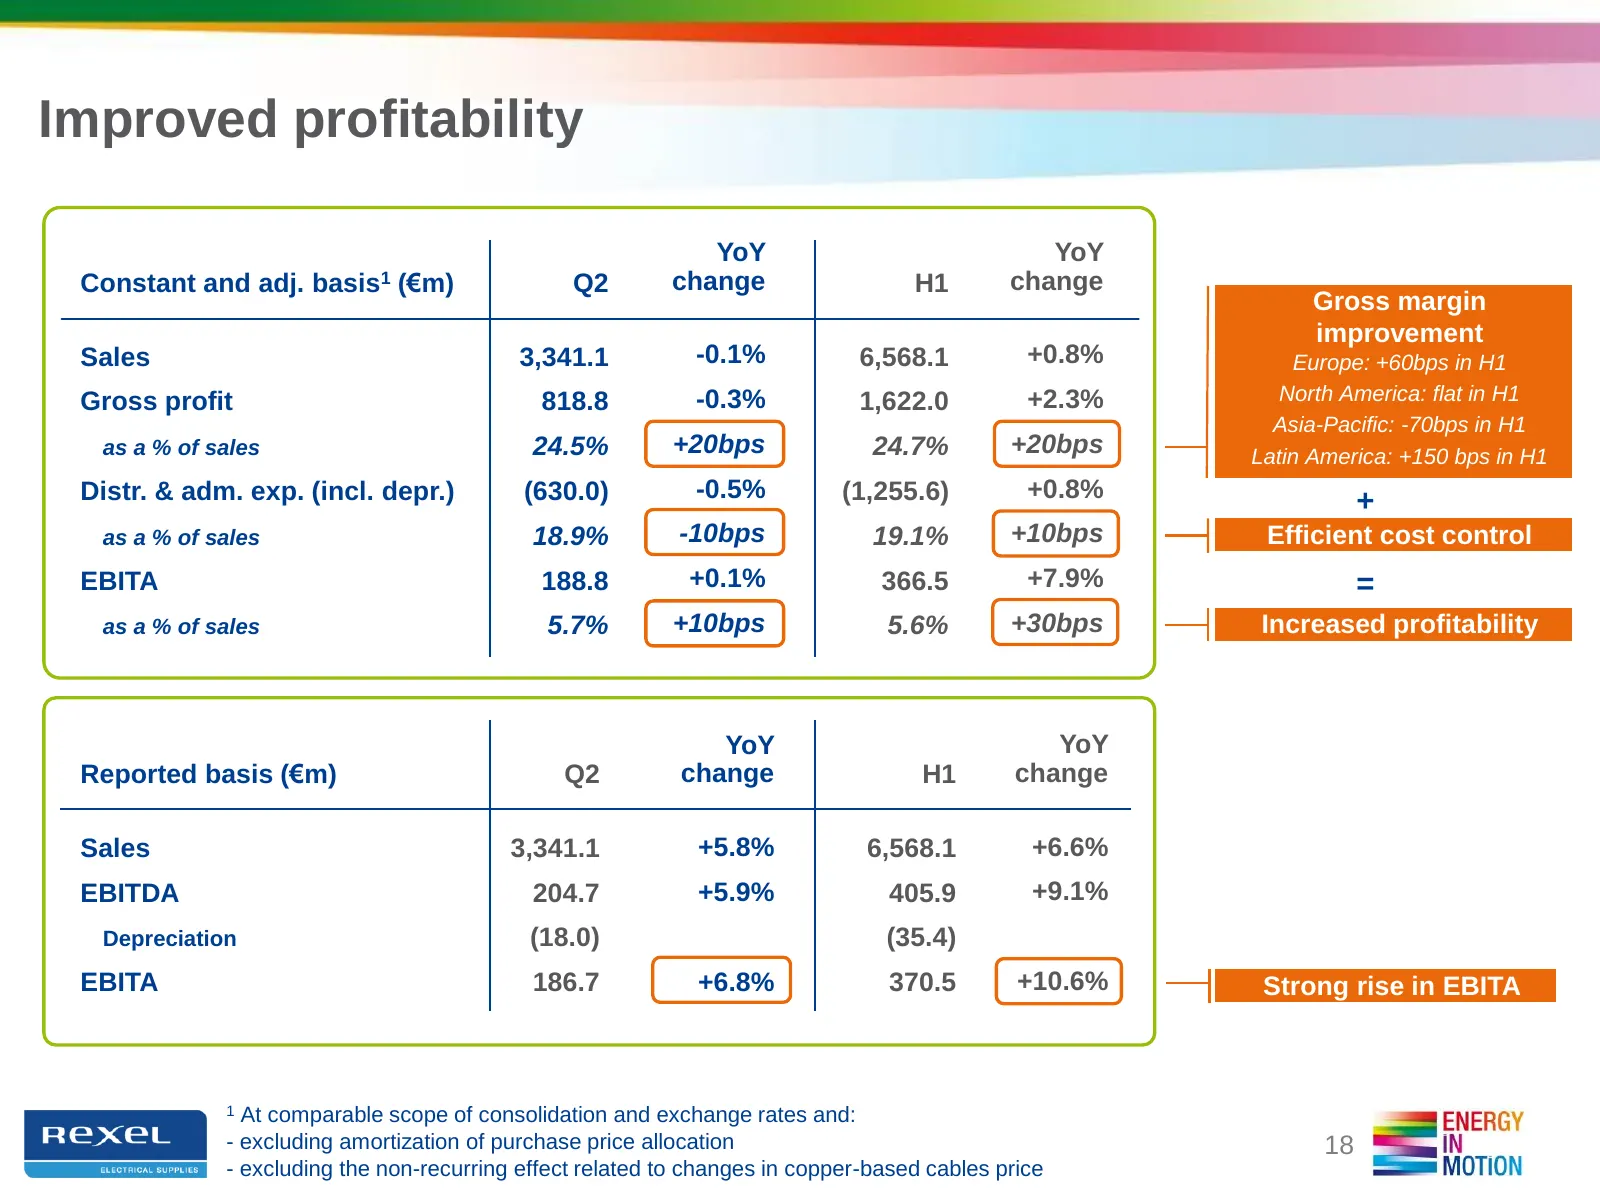
Improved profitability YoY YoY Constant and adj. basis1 (€m) Q2 change H1 change Gross margin improvement Sales 3,341.1 -0.1% 6,568.1 +0.8% Europe: +60bps in H1 Gross profit 818.8 -0.3% 1,622.0 +2.3% North America: flat in H1 Asia-Pacific: -70bps in H1 as a % of sales 24.5% +20bps 24.7% +20bps Latin
Slide 19: Stable operating income and net income impacted by rise in tax rate
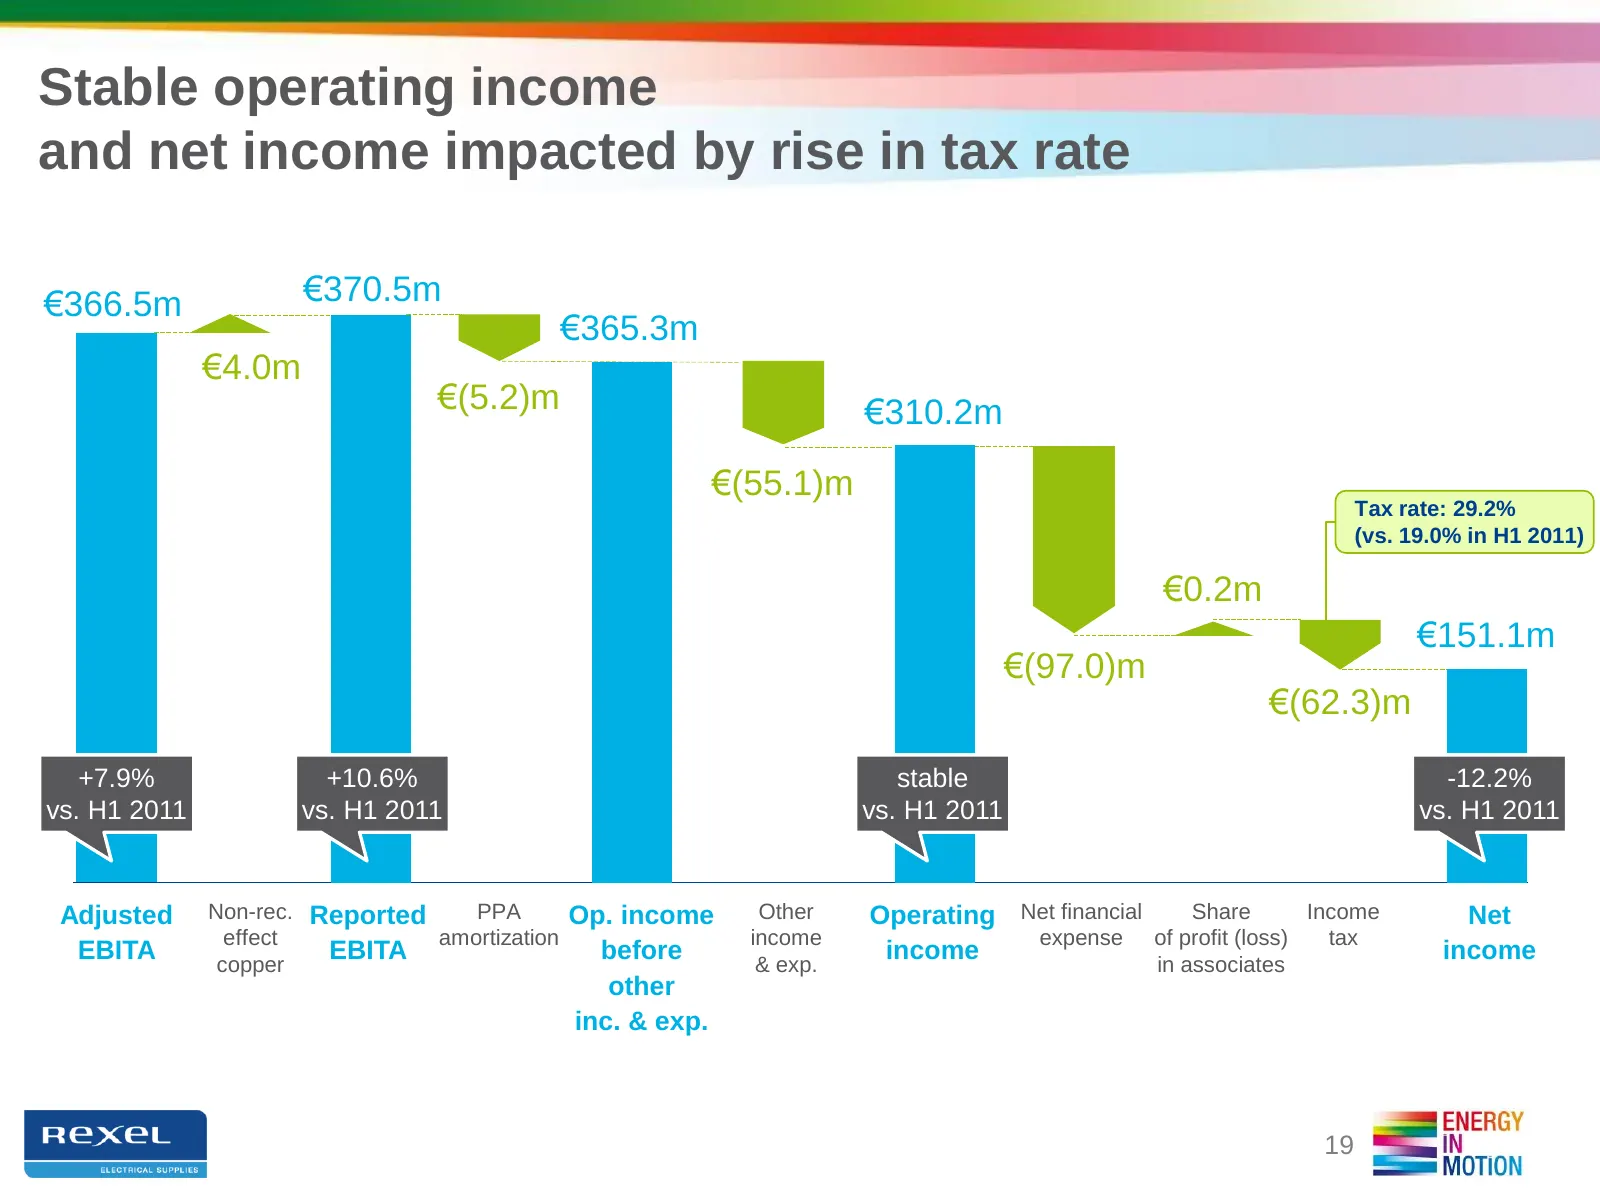
Stable operating income and net income impacted by rise in tax rate €366.5m €370.5m €365.3m €4.0m €(5.2)m €310.2m €(55.1)m Tax rate: 29.2% (vs. 19.0% in H1 2011) €0.2m €151.1m €(97.0)m €(62.3)m +7.9% +10.6% stable -12.2% vs. H1 2011 vs. H1 2011 vs. H1 2011 vs. H1 2011 Adjusted Non-rec. Reported PPA
Slide 20: Positive FCF before interest and tax
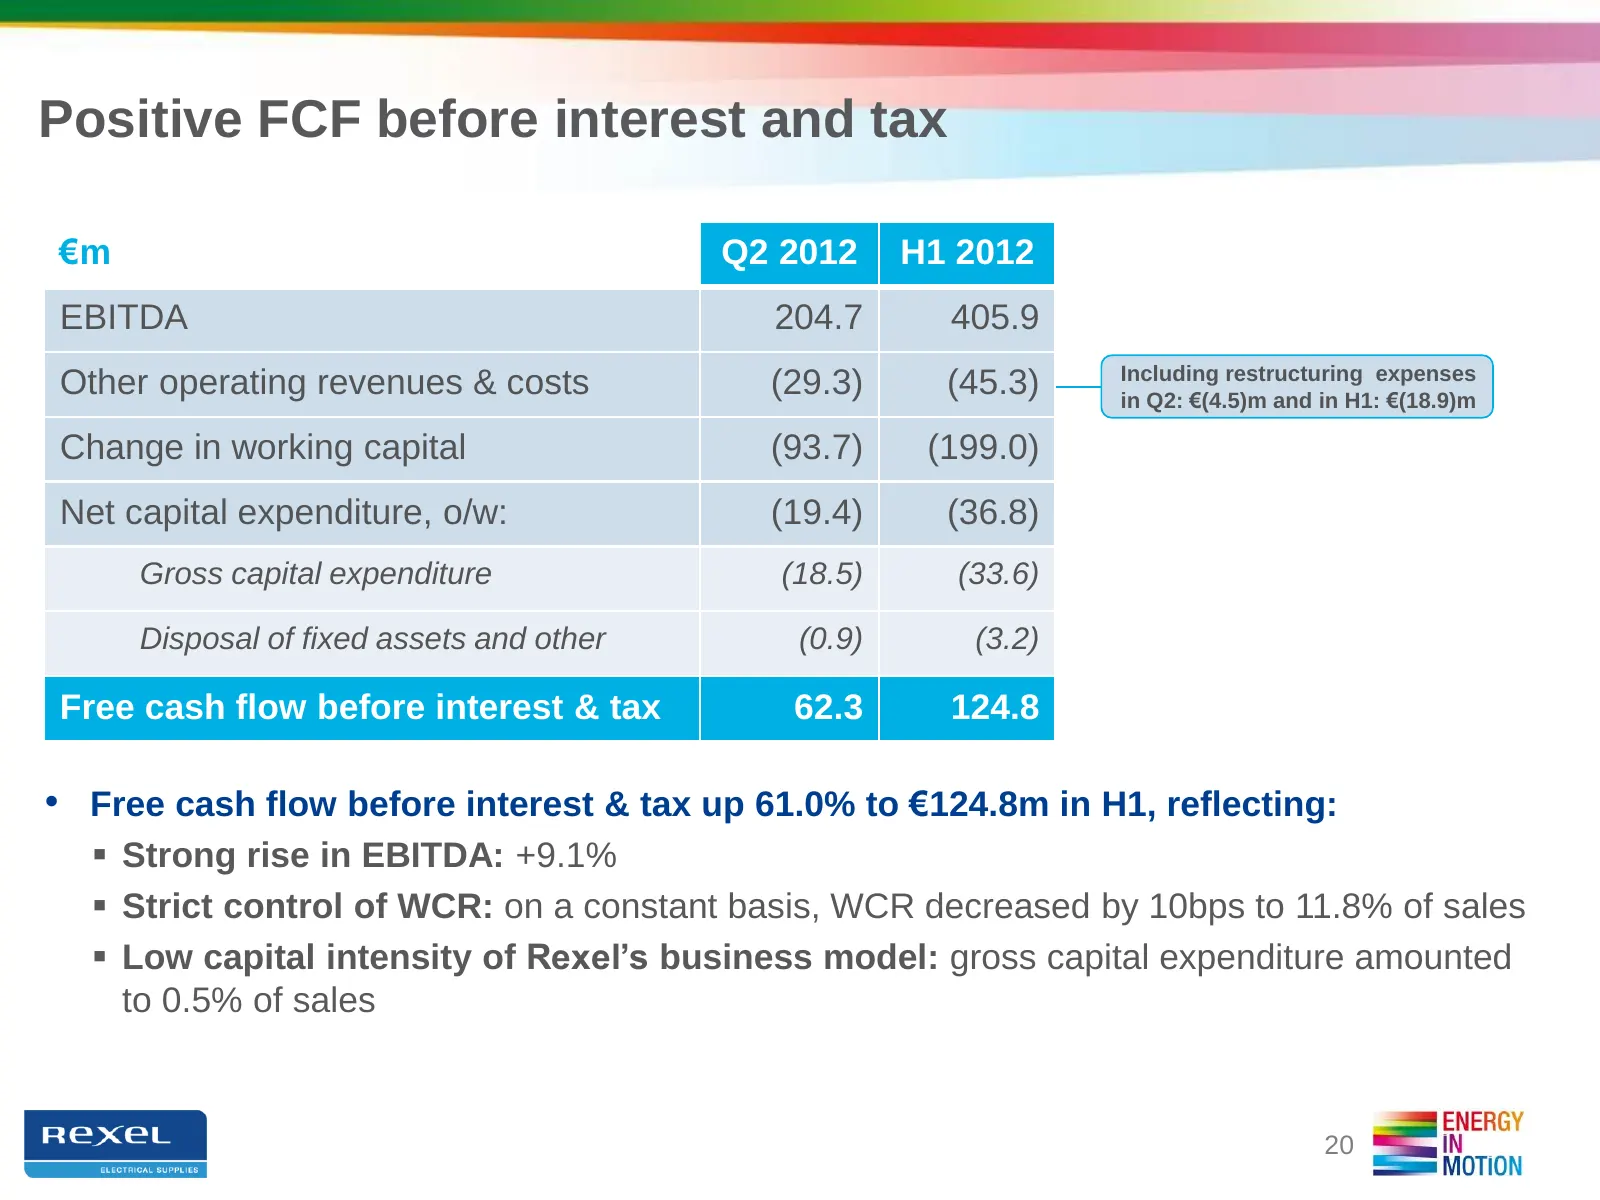
Positive FCF before interest and tax €m Q2 2012 H1 2012 EBITDA 204.7 405.9 Including restructuring expenses Other operating revenues & costs (29.3) (45.3) in Q2: €(4.5)m and in H1: €(18.9)m Change in working capital (93.7) (199.0) Net capital expenditure, o/w: (19.4) (36.8) Gross capital expenditure
Slide 21: Continued deleveraging year-on-year
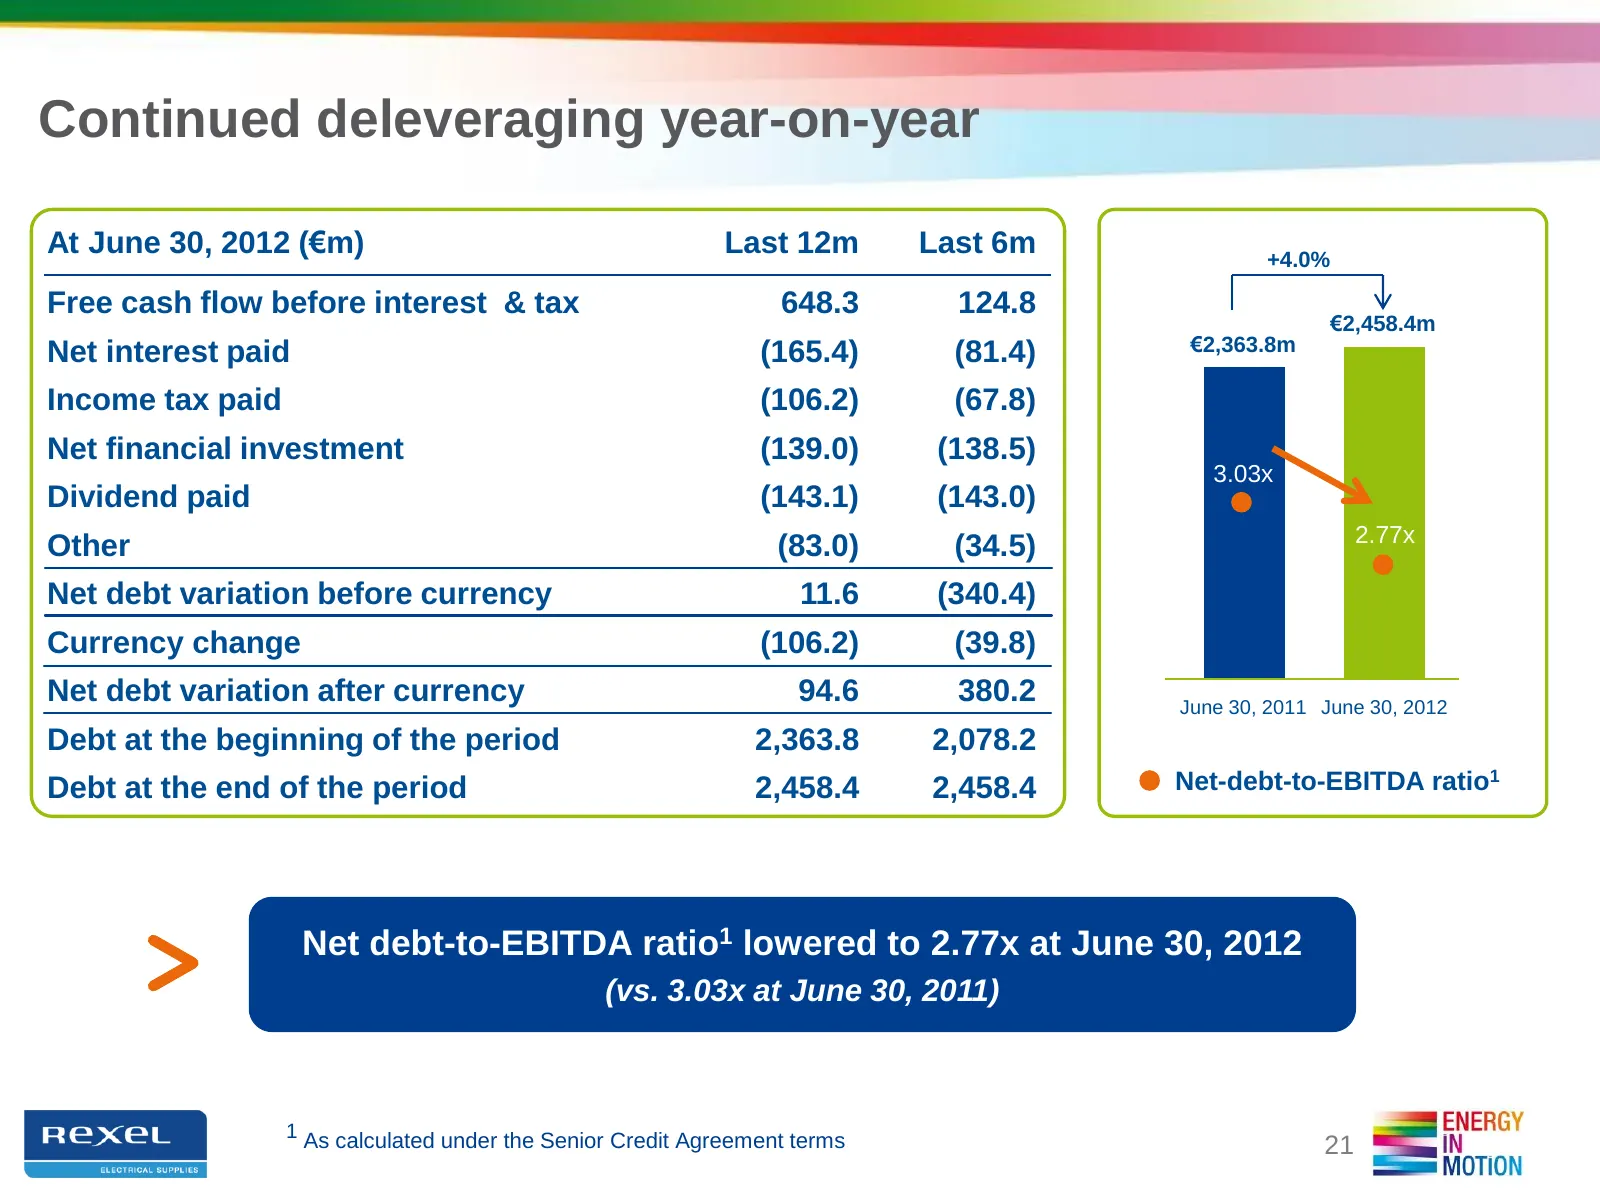
Continued deleveraging year-on-year At June 30, 2012 (€m) Last 12m Last 6m +4.0% Free cash flow before interest & tax 648.3 124.8 €2,458.4m Net interest paid (165.4) (81.4) €2,363.8m Income tax paid (106.2) (67.8) Net financial investment (139.0) (138.5) 3.03x Dividend paid (143.1) (143.0) 2.77x Oth
Slide 22: Sound liquidity and financial structure
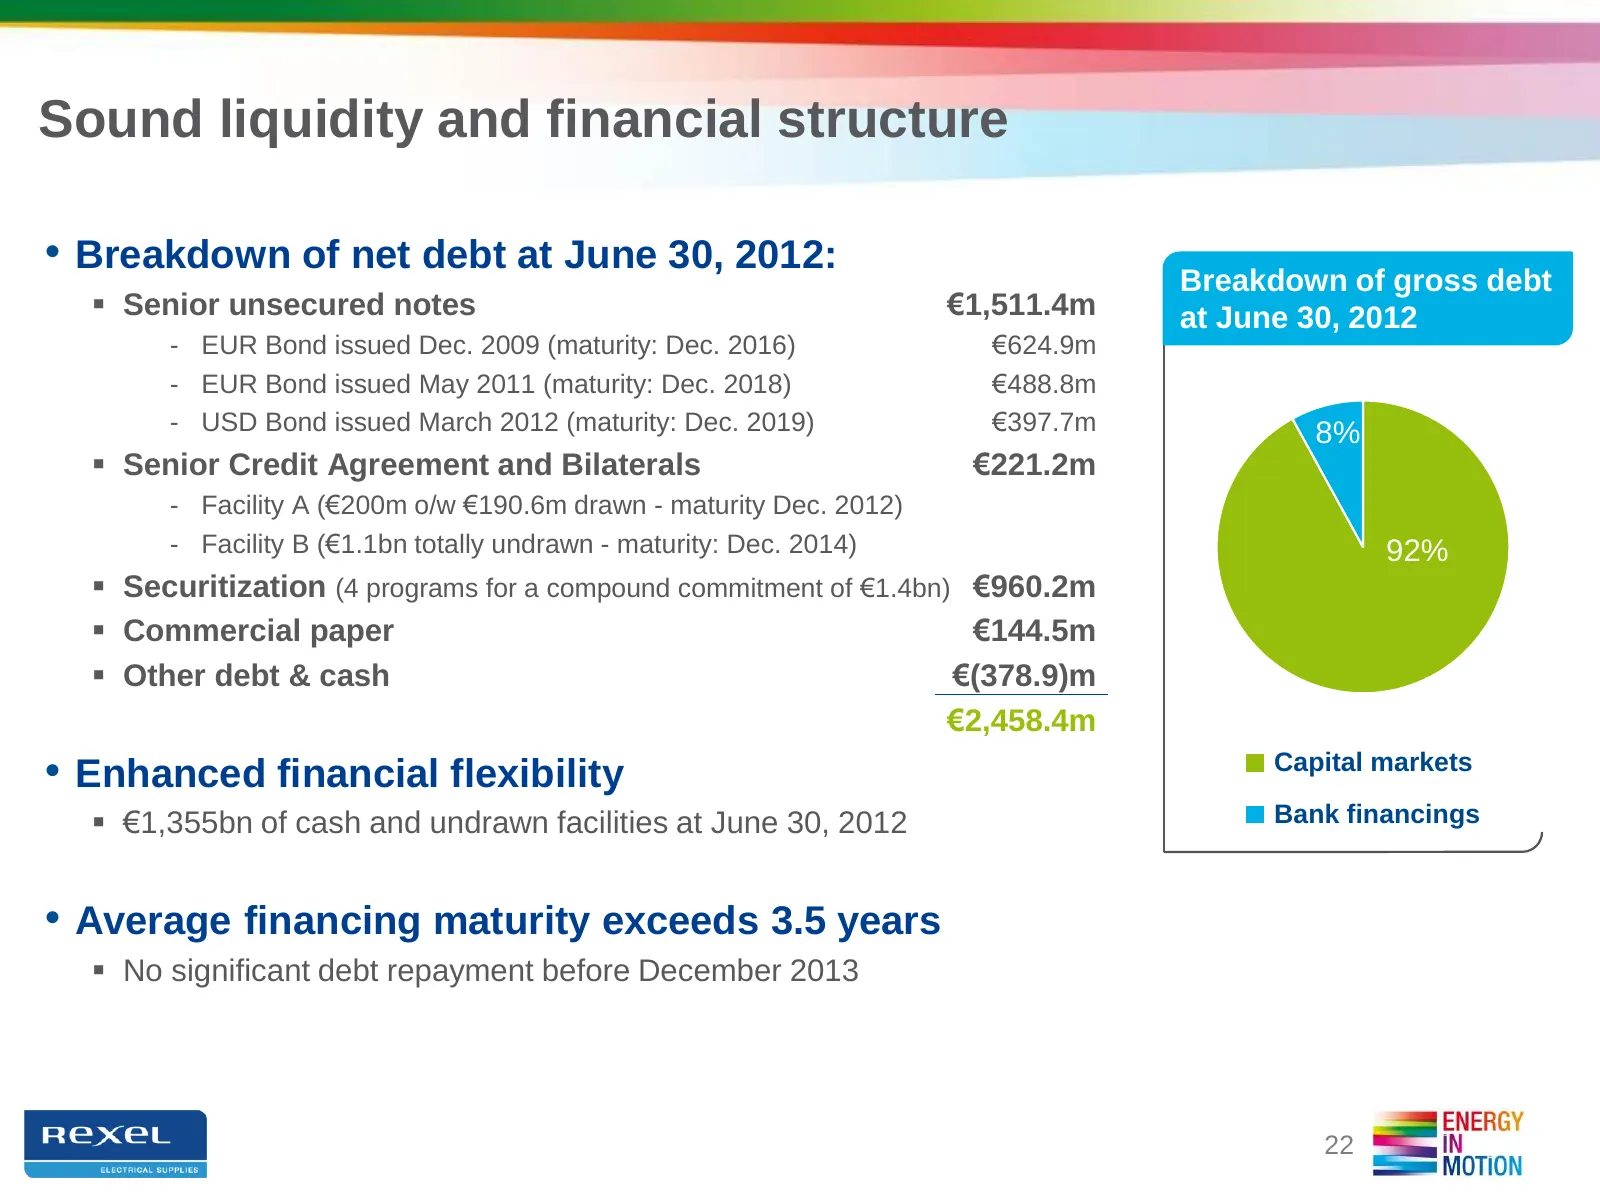
Sound liquidity and financial structure • Breakdown of net debt at June 30, 2012: Breakdown Breakdown ofofgross gross debt debt Senior unsecured notes €1,511.4m at Dec. 31, 2011 at June 30, 2012 - EUR Bond issued Dec. 2009 (maturity: Dec. 2016) €624.9m - EUR Bond issued May 2011 (maturity: Dec. 20

Slide 23: Update on Priorities & 2012 Outlook
UPDATE ON PRIORITIES & 2012 OUTLOOK
Slide 24: Accelerating organic growth through Energy in Motion drivers
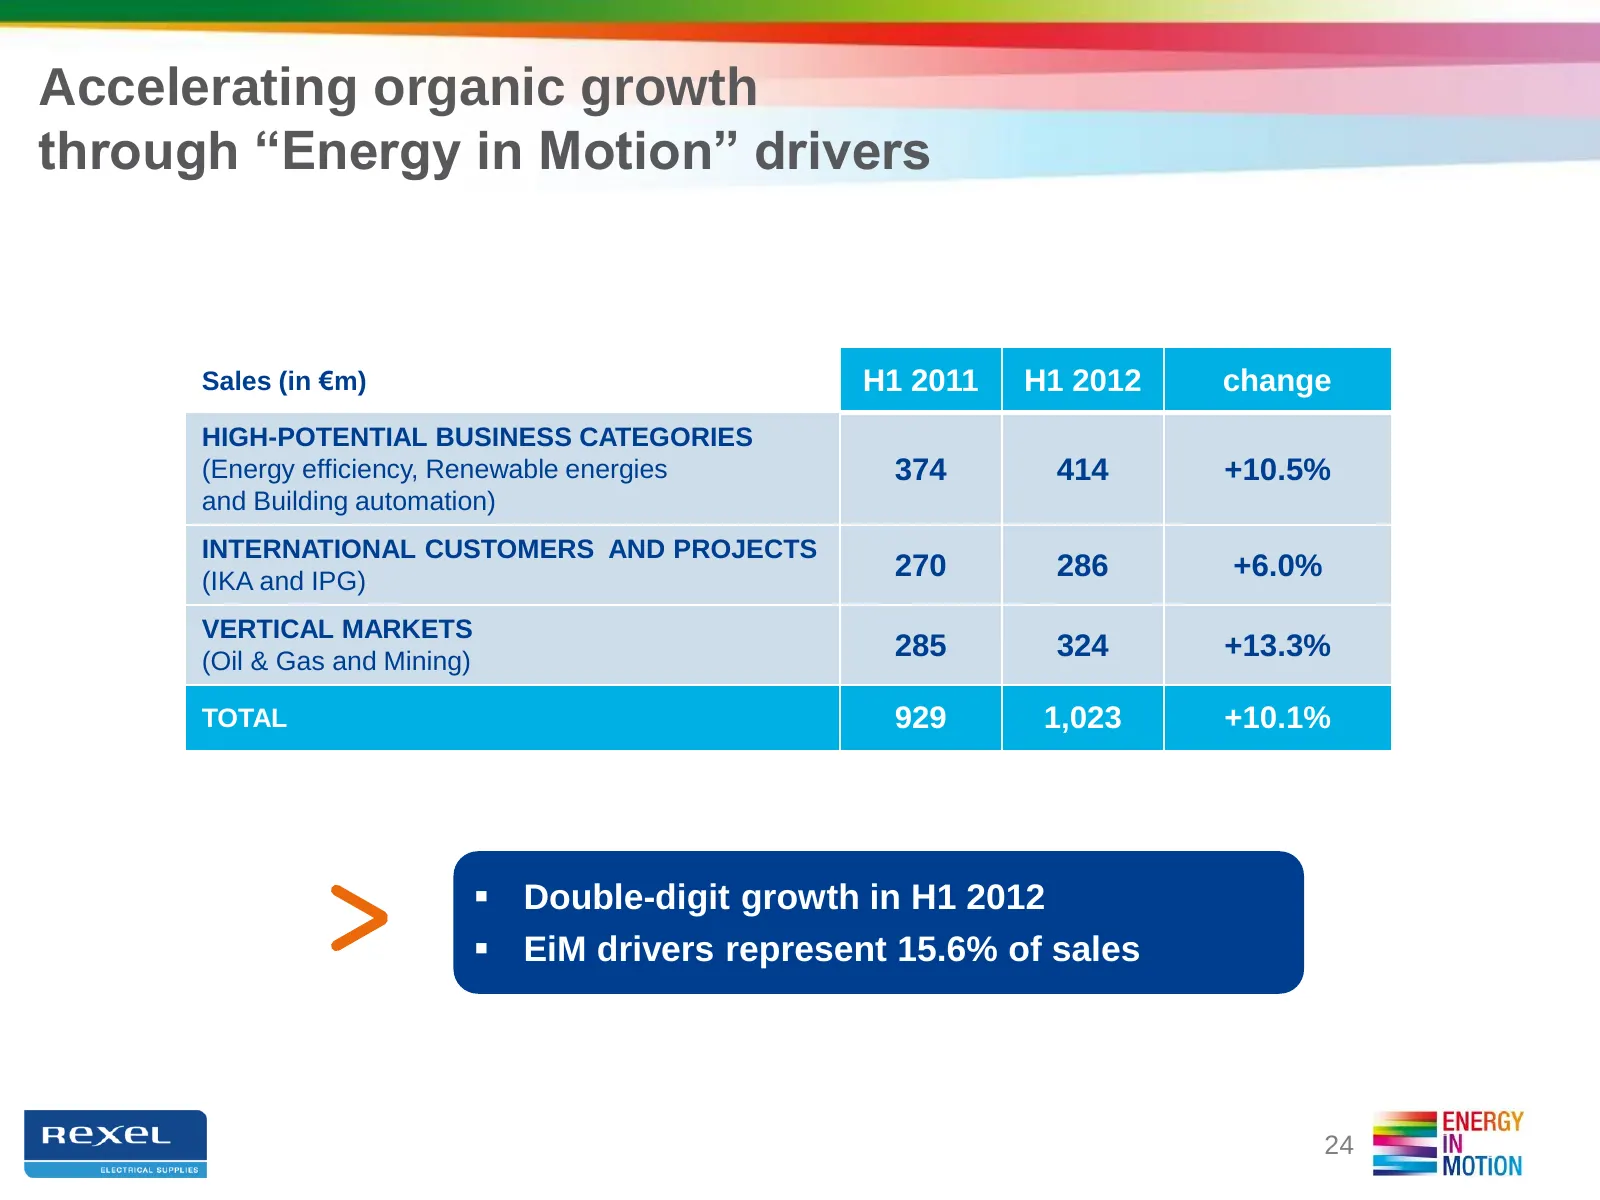
Accelerating organic growth through “Energy in Motion” drivers Sales (in €m) H1 2011 H1 2012 change HIGH-POTENTIAL BUSINESS CATEGORIES (Energy efficiency, Renewable energies 374 414 +10.5% and Building automation) INTERNATIONAL CUSTOMERS AND PROJECTS (IKA and IPG) 270 286 +6.0% VERTICAL MARKETS (Oil
Slide 25: Case study: Capitol Light in the USA
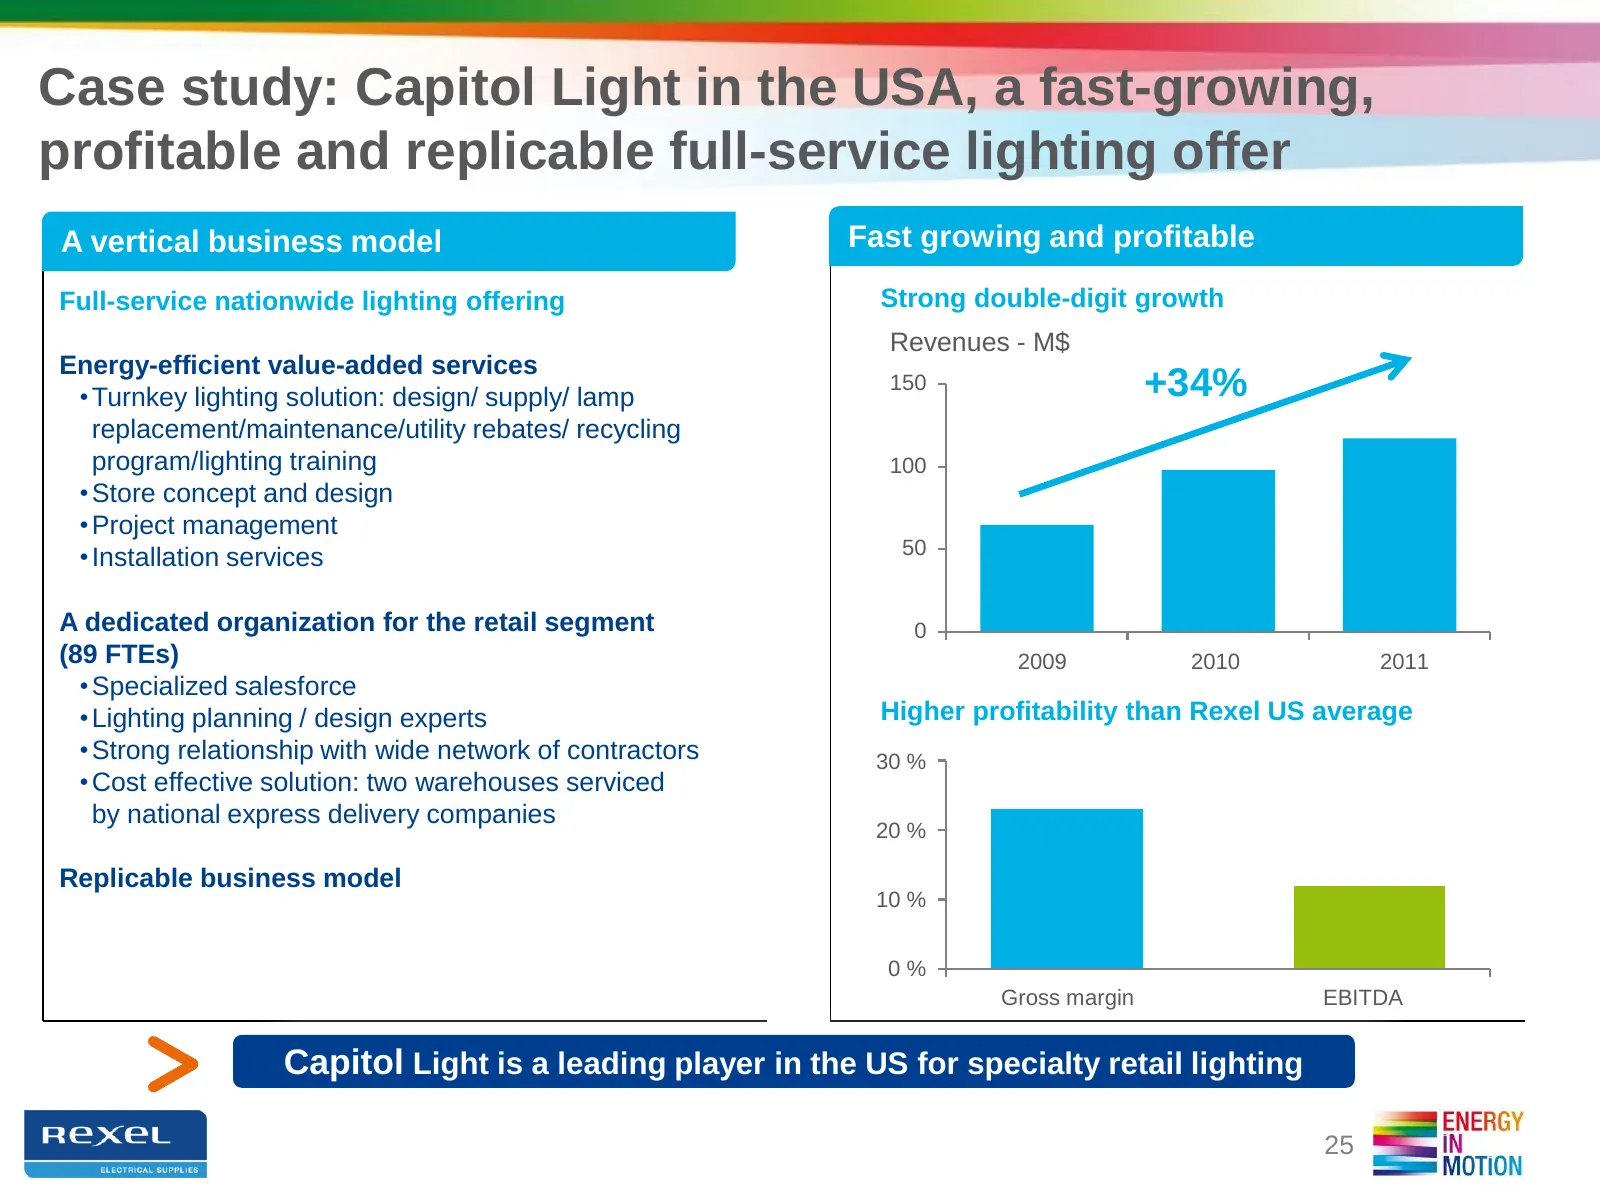
Case study: Capitol Light in the USA, a fast-growing, profitable and replicable full-service lighting offer A vertical business model Fast growing and profitable Full-service nationwide lighting offering Strong double-digit growth Revenues - M$ Energy-efficient value-added services • Turnkey lightin
Slide 26: Case study: Significant MRO contract in North America
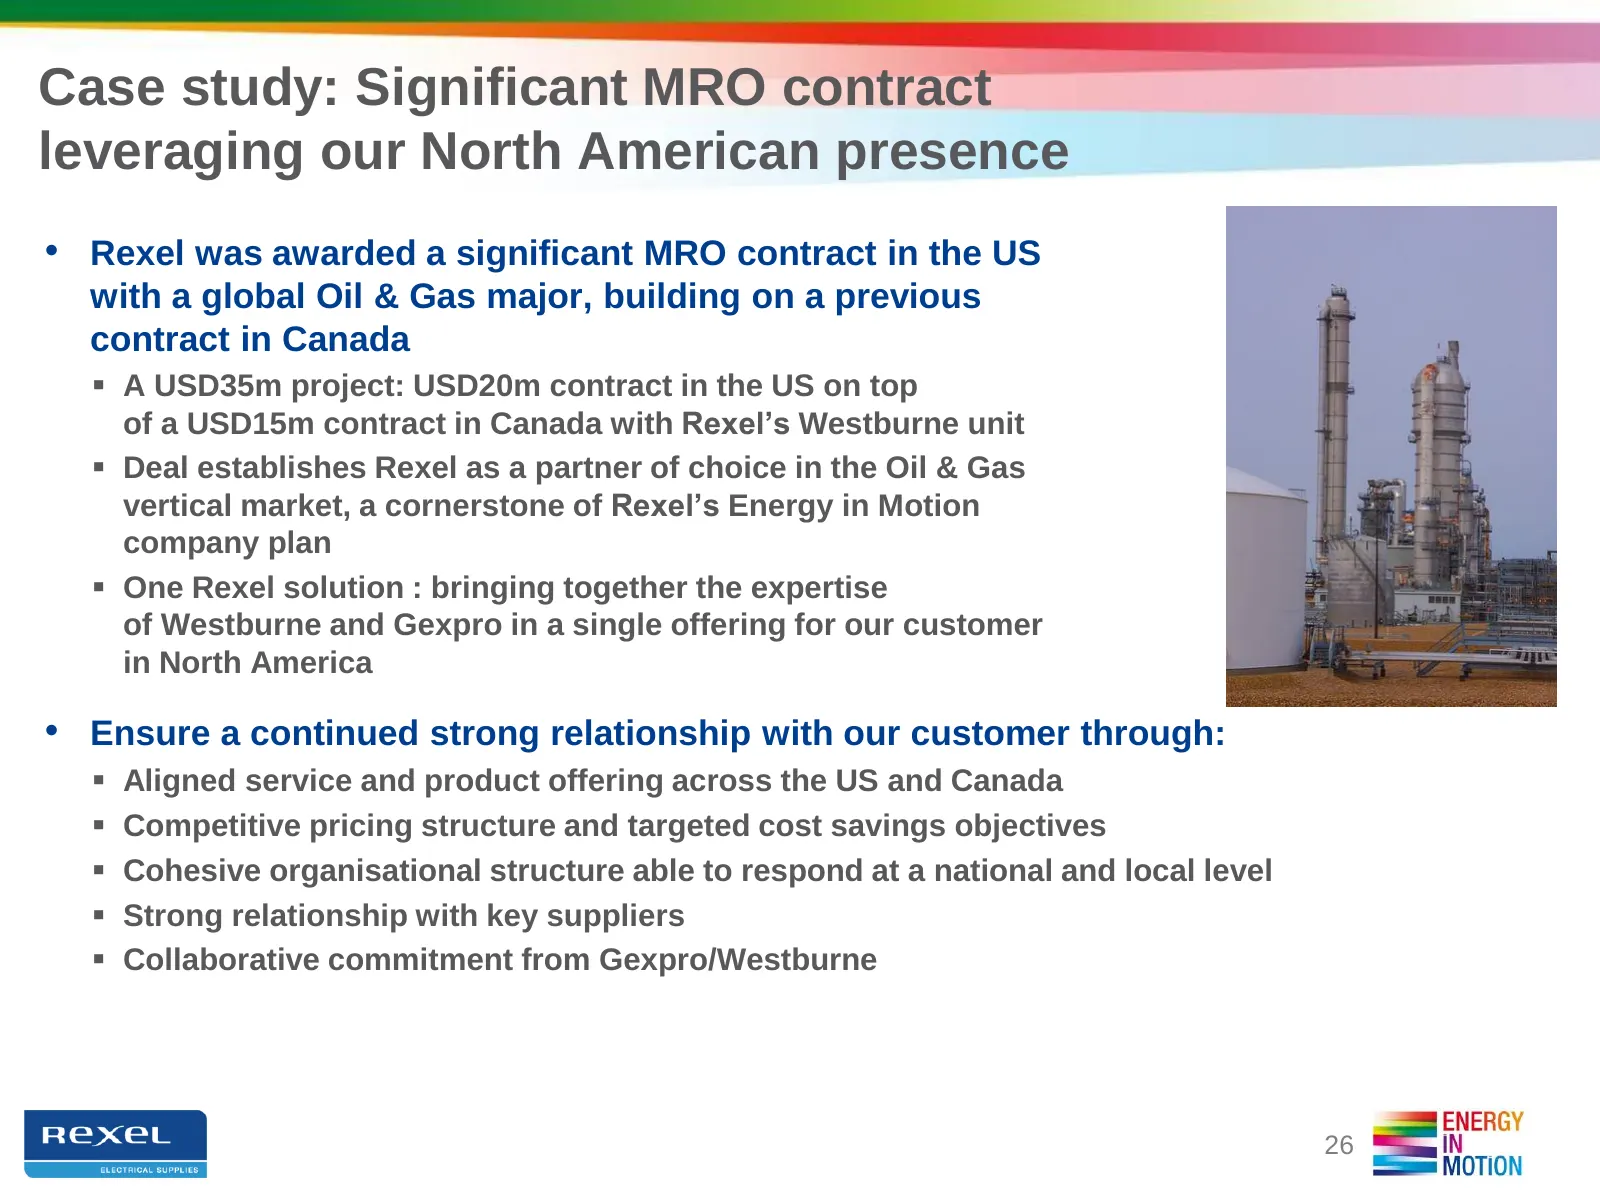
Case study: Significant MRO contract leveraging our North American presence • Rexel was awarded a significant MRO contract in the US with a global Oil & Gas major, building on a previous contract in Canada A USD35m project: USD20m contract in the US on top of a USD15m contract in Canada with Rexel
Slide 27: 2012 Outlook Confirmed
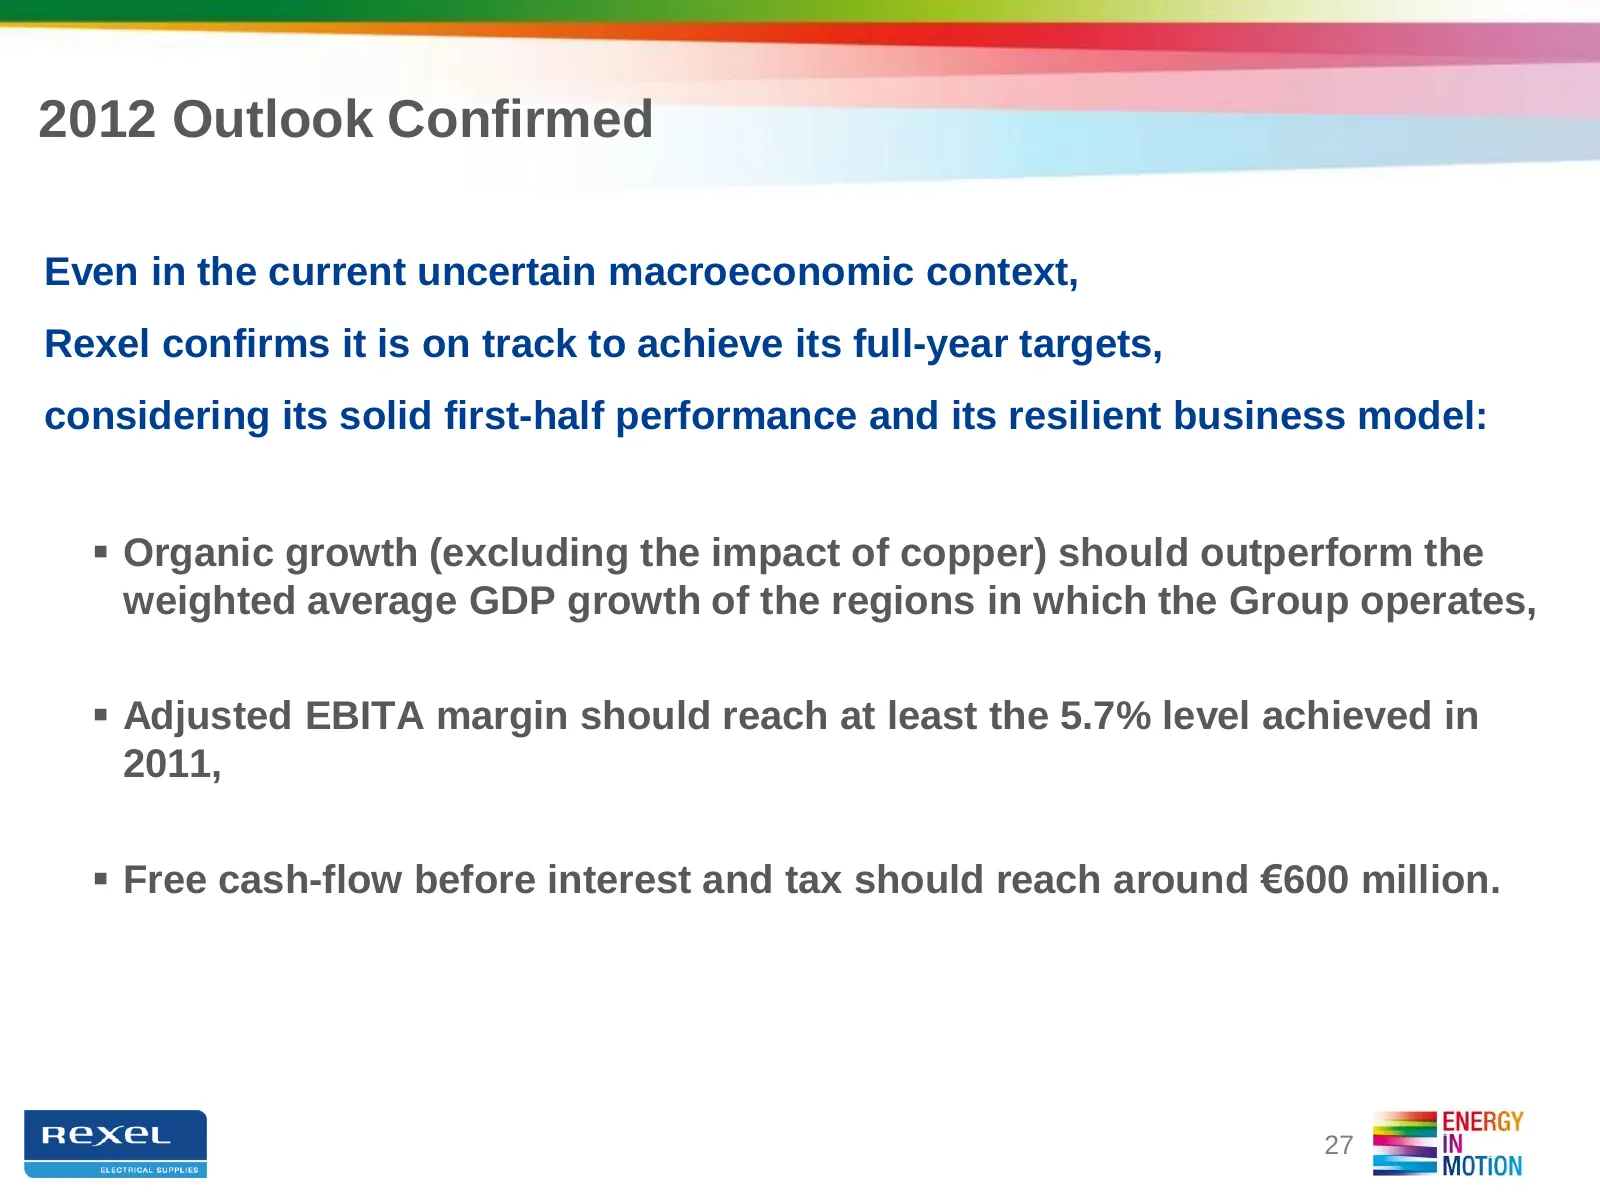
2012 Outlook Confirmed Even in the current uncertain macroeconomic context, Rexel confirms it is on track to achieve its full-year targets, considering its solid first-half performance and its resilient business model: Organic growth (excluding the impact of copper) should outperform the weighted
Slide 28: Energy in Motion 2015 Ambitions
ENERGY IN MOTION 2015 AMBITIONS (Investor Day May 29, 2012)
Slide 29: Rexel: ready for a new phase of development
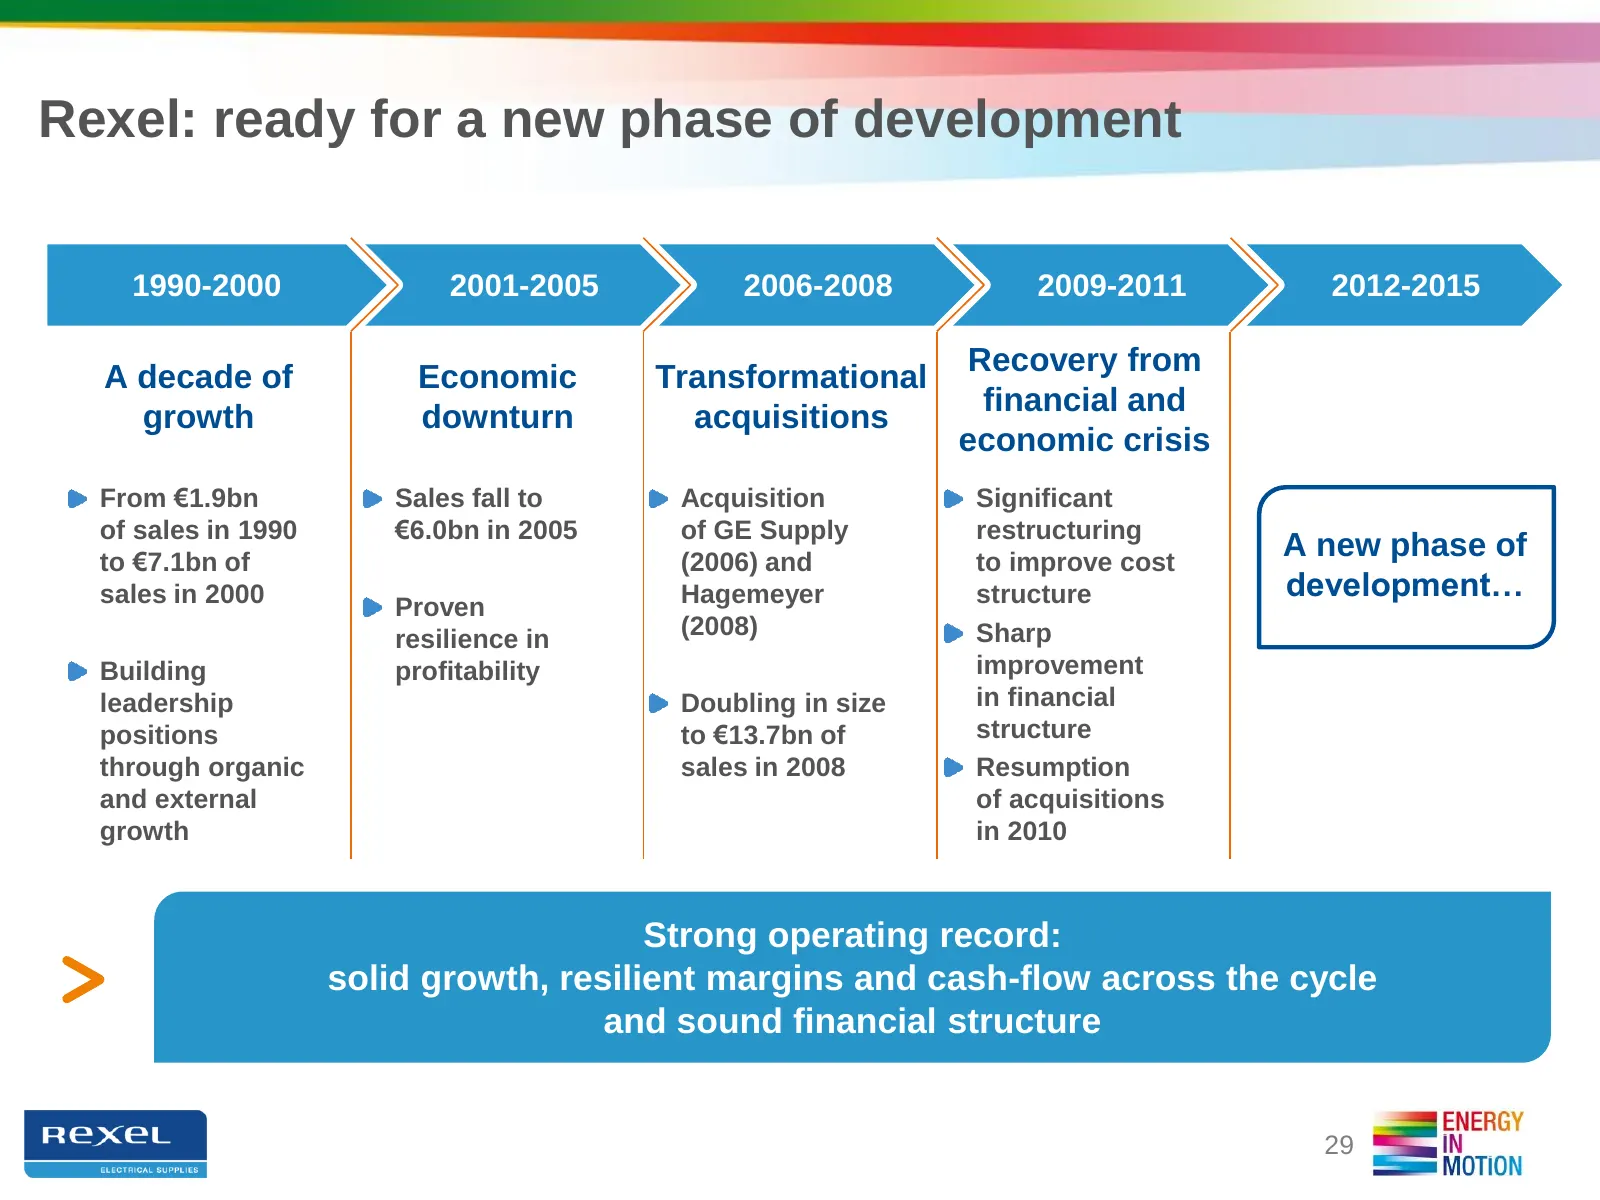
Rexel: ready for a new phase of development 1990-2000 2001-2005 2006-2008 2009-2011 2012-2015 A decade of Economic Transformational Recovery from growth downturn acquisitions financial and economic crisis From €1.9bn Sales fall to Acquisition Significant of sales in 1990 €6.0bn in 2005 of GE Supply
Slide 30: A new roadmap for new ambitions
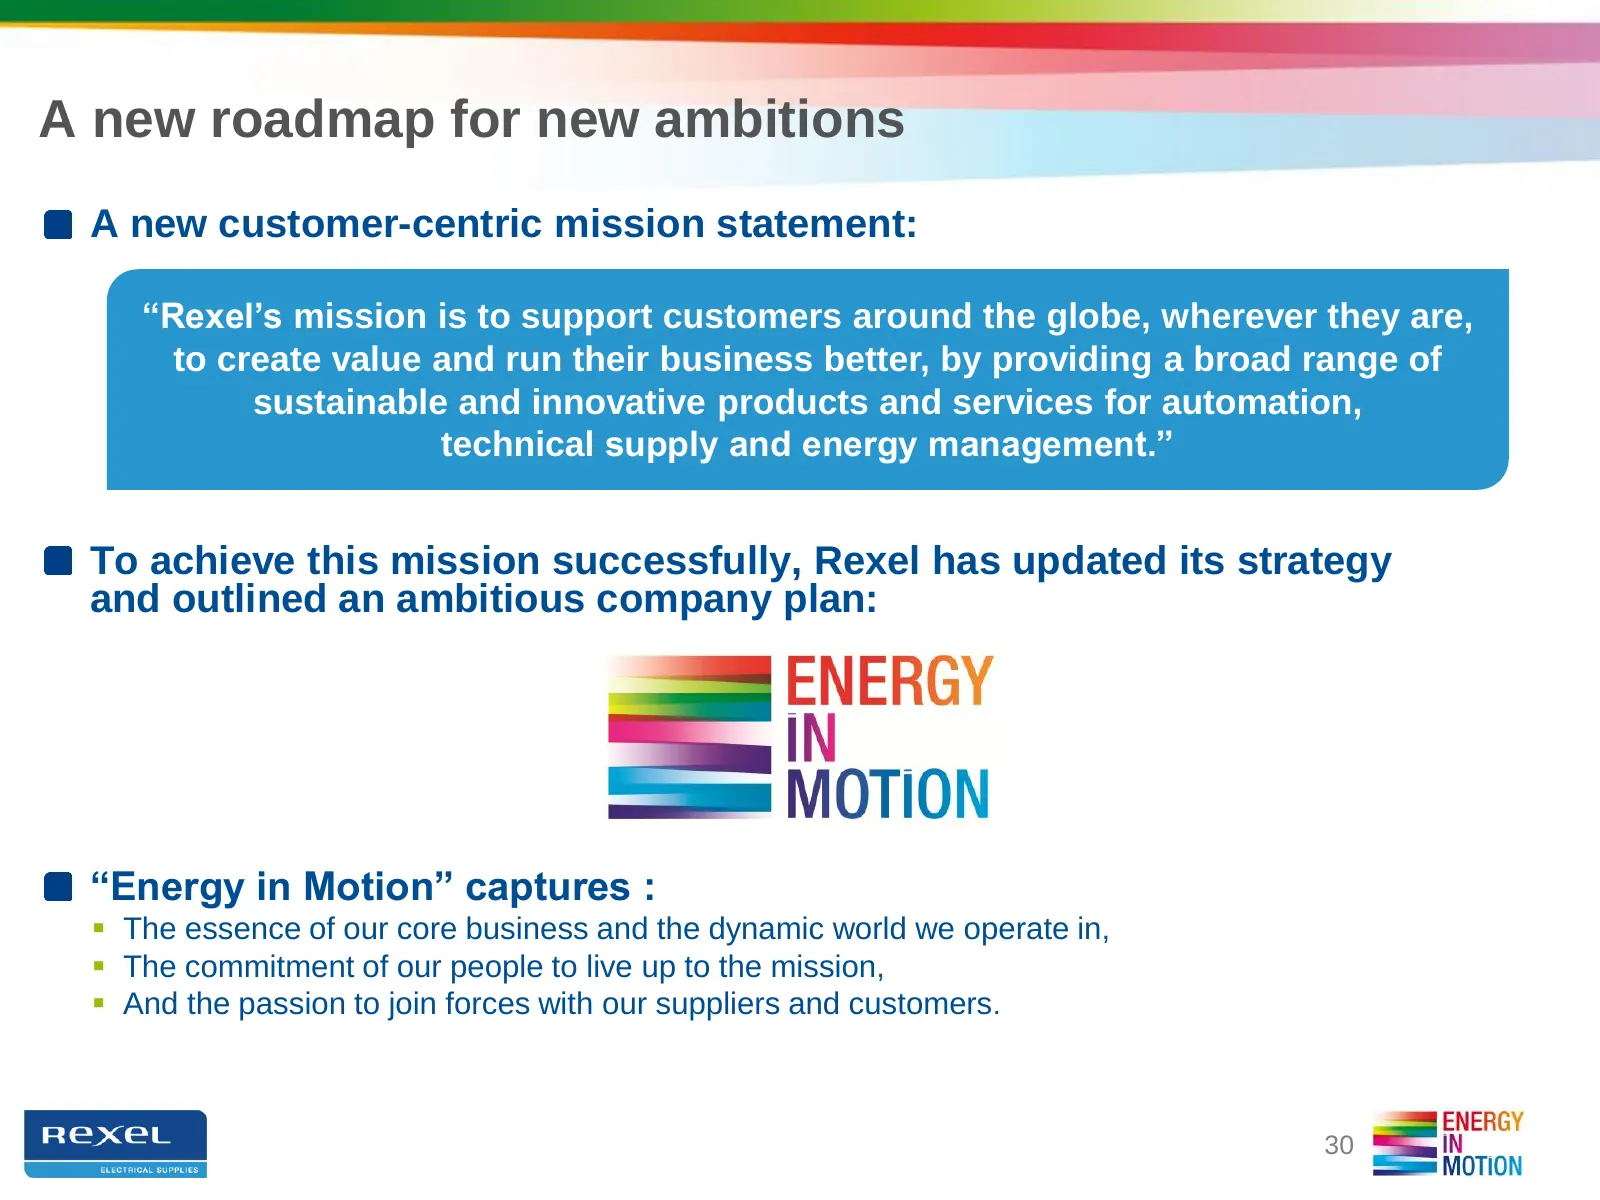
A new roadmap for new ambitions A new customer-centric mission statement: “Rexel’s mission is to support customers around the globe, wherever they are, to create value and run their business better, by providing a broad range of sustainable and innovative products and services for automation, techni
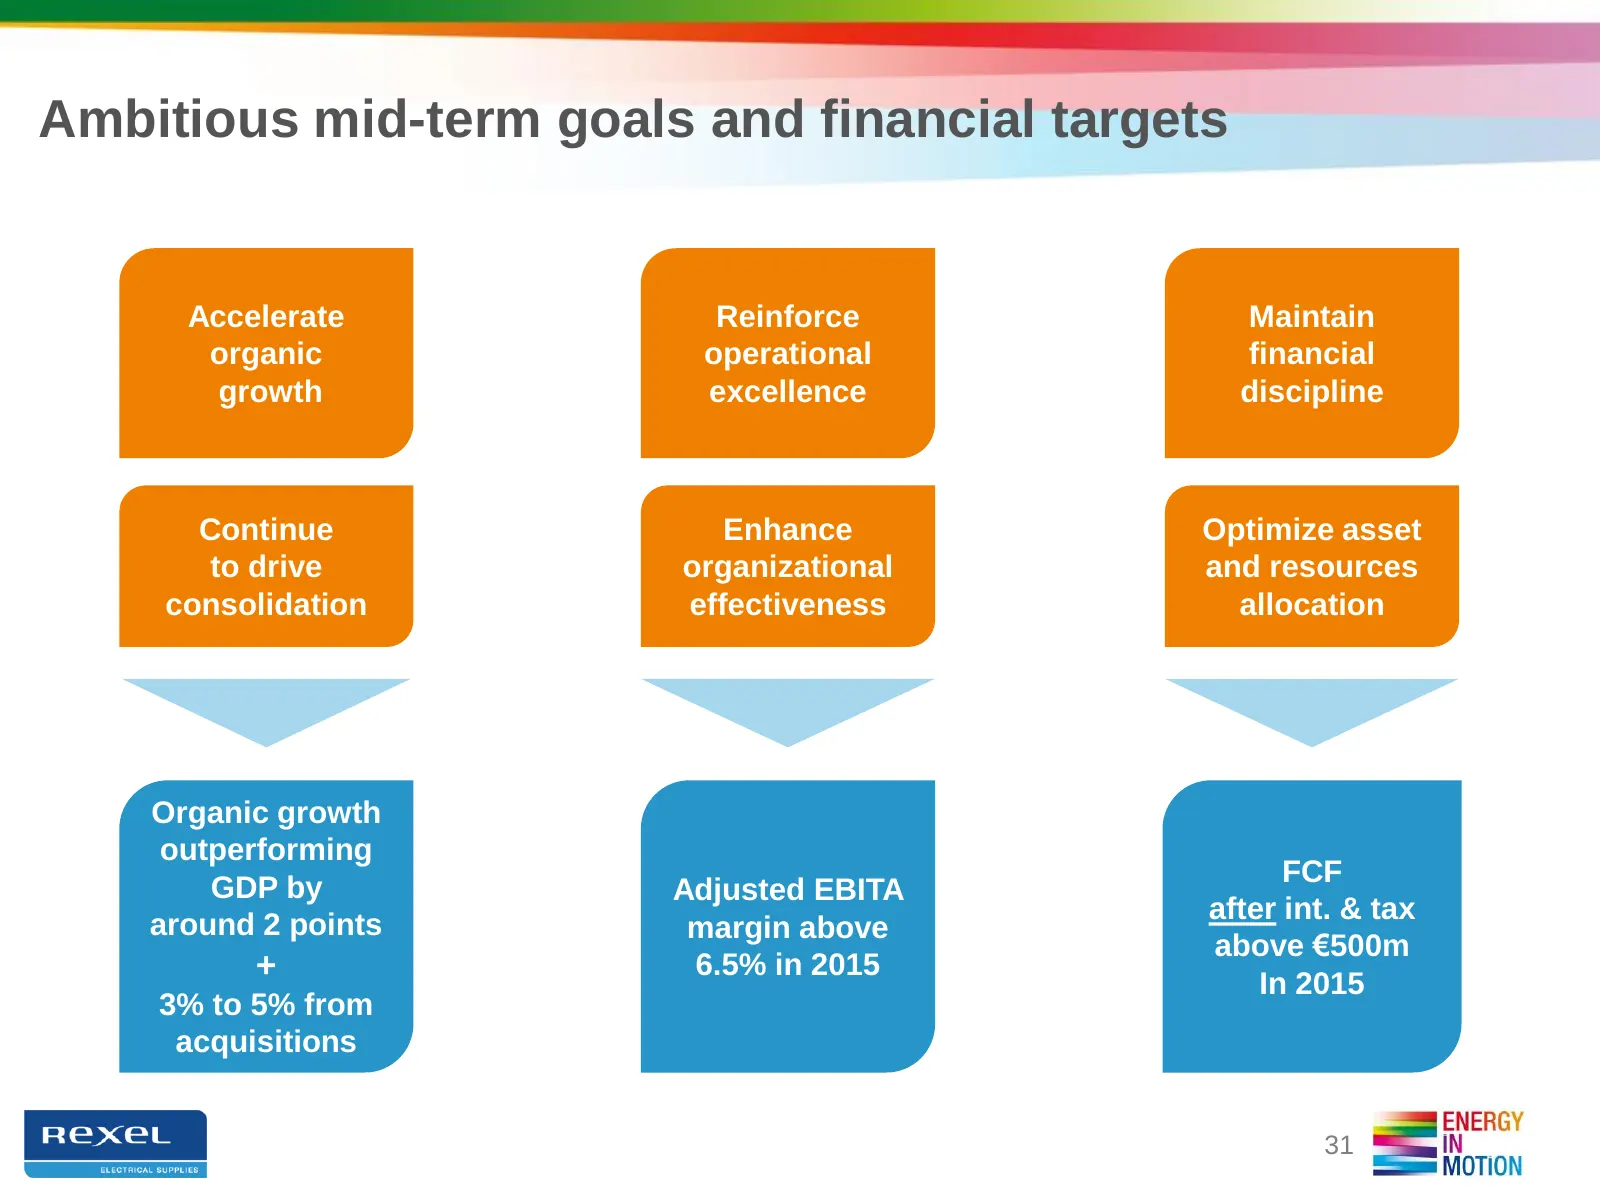
Slide 31: Ambitious mid-term goals and financial targets
Ambitious mid-term goals and financial targets Accelerate Reinforce Maintain organic operational financial growth excellence discipline Continue Enhance Optimize asset to drive organizational and resources consolidation effectiveness allocation Organic growth outperforming FCF GDP by Adjusted EBITA
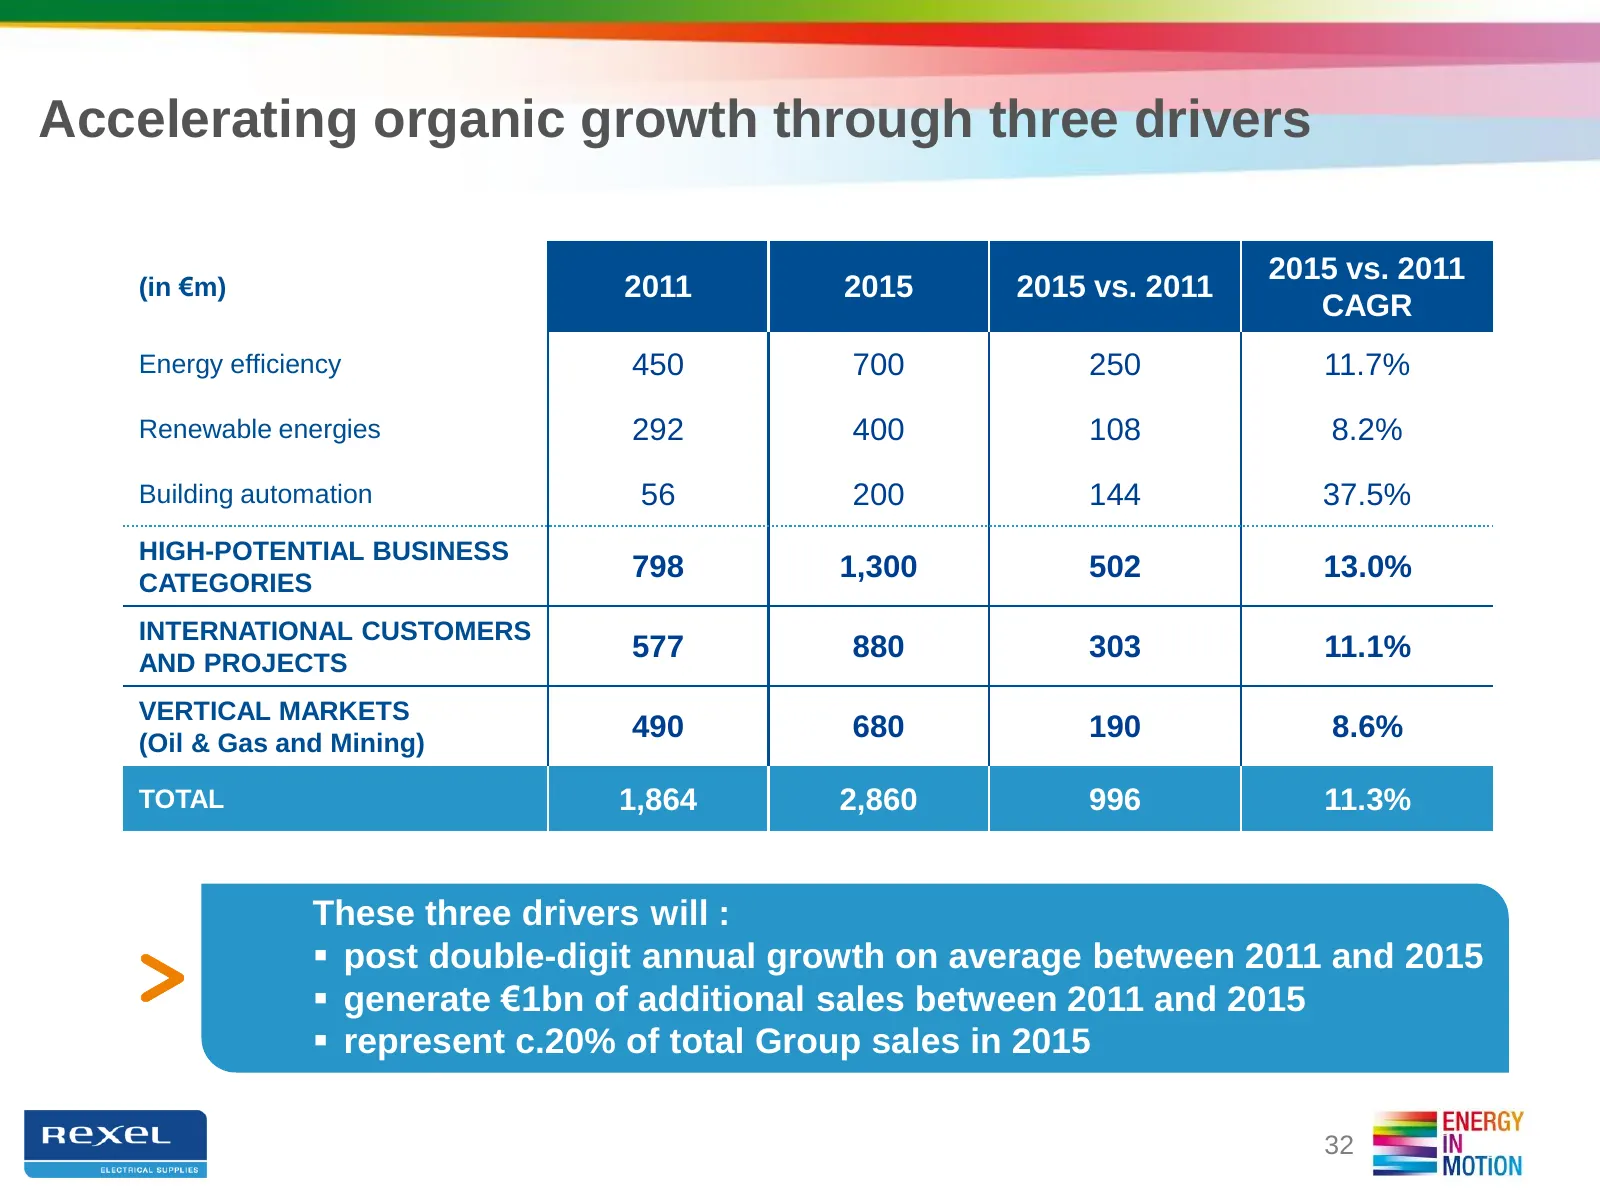
Slide 32: Accelerating organic growth through three drivers
Accelerating organic growth through three drivers 2015 vs. 2011 (in €m) 2011 2015 2015 vs. 2011 CAGR Energy efficiency 450 700 250 11.7% Renewable energies 292 400 108 8.2% Building automation 56 200 144 37.5% HIGH-POTENTIAL BUSINESS CATEGORIES 798 1,300 502 13.0% INTERNATIONAL CUSTOMERS AND PROJECT
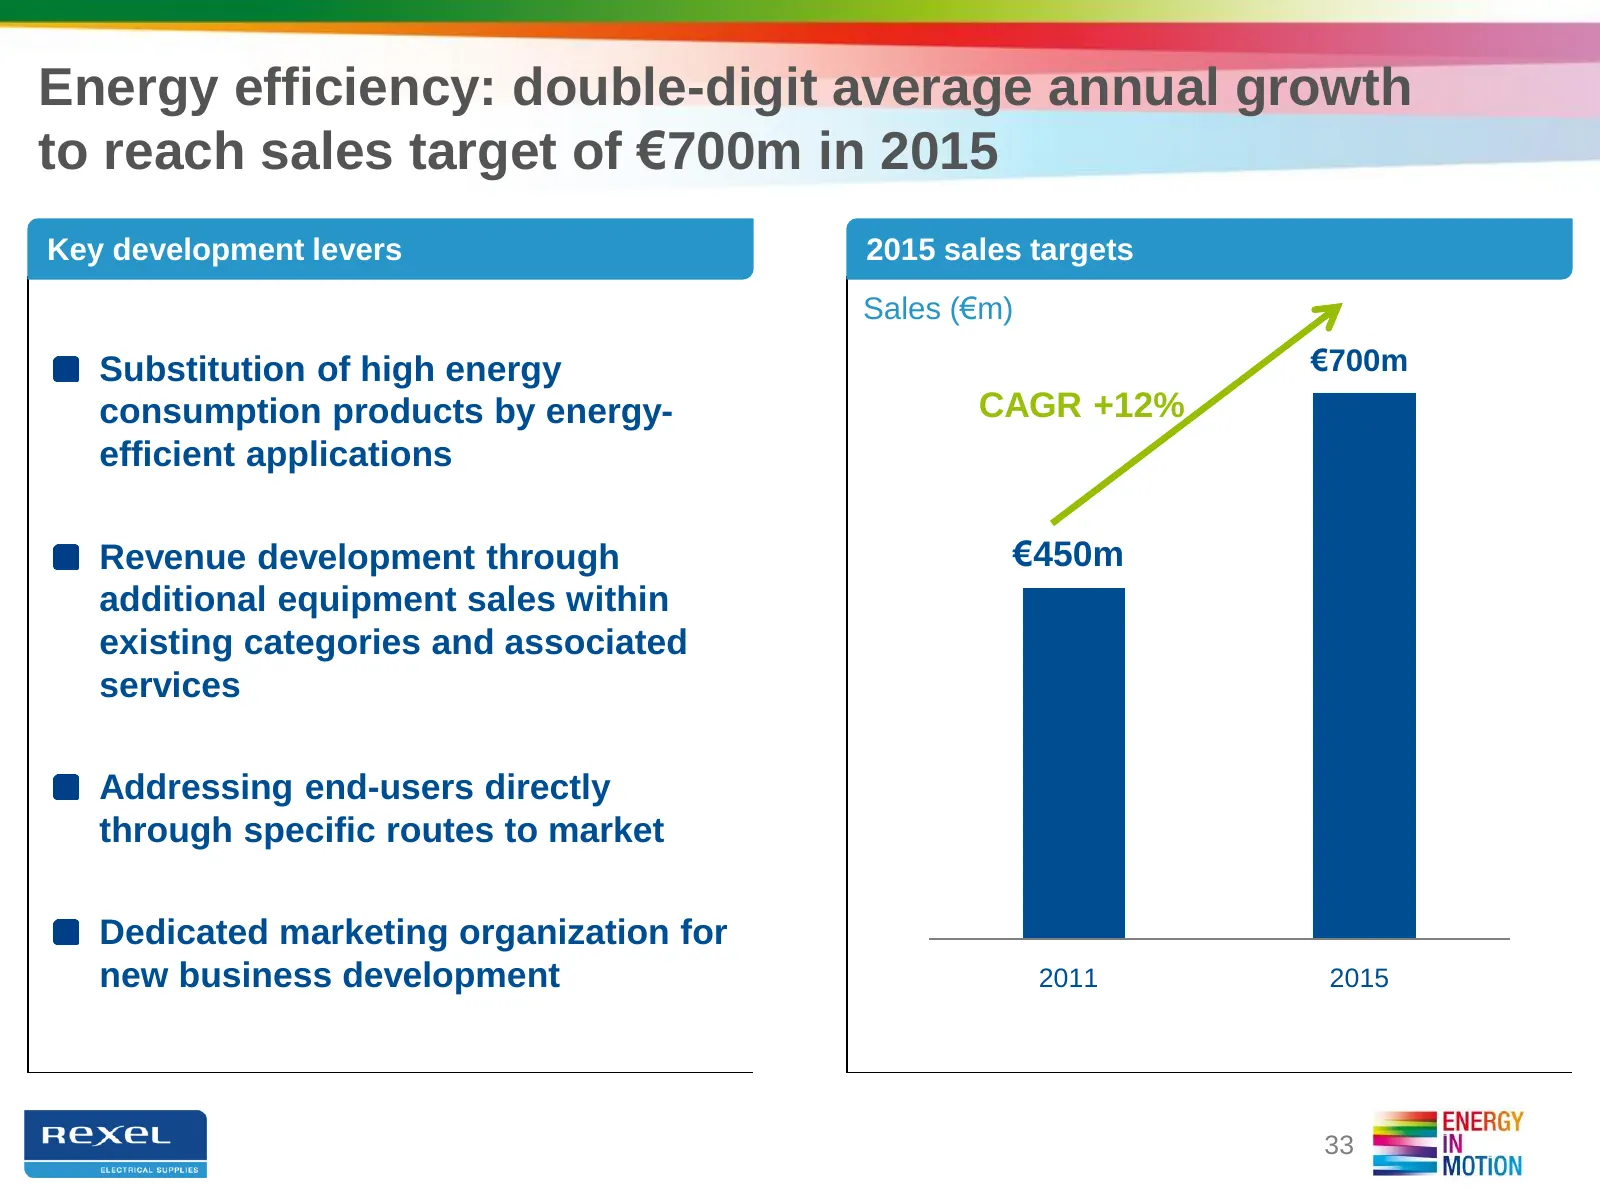
Slide 33: Energy efficiency: double-digit average annual growth
Energy efficiency: double-digit average annual growth to reach sales target of €700m in 2015 Key development levers 2015 sales targets Sales (€m) Substitution of high energy €700m consumption products by energy- CAGR +12% efficient applications Revenue development through €450m additional equipment
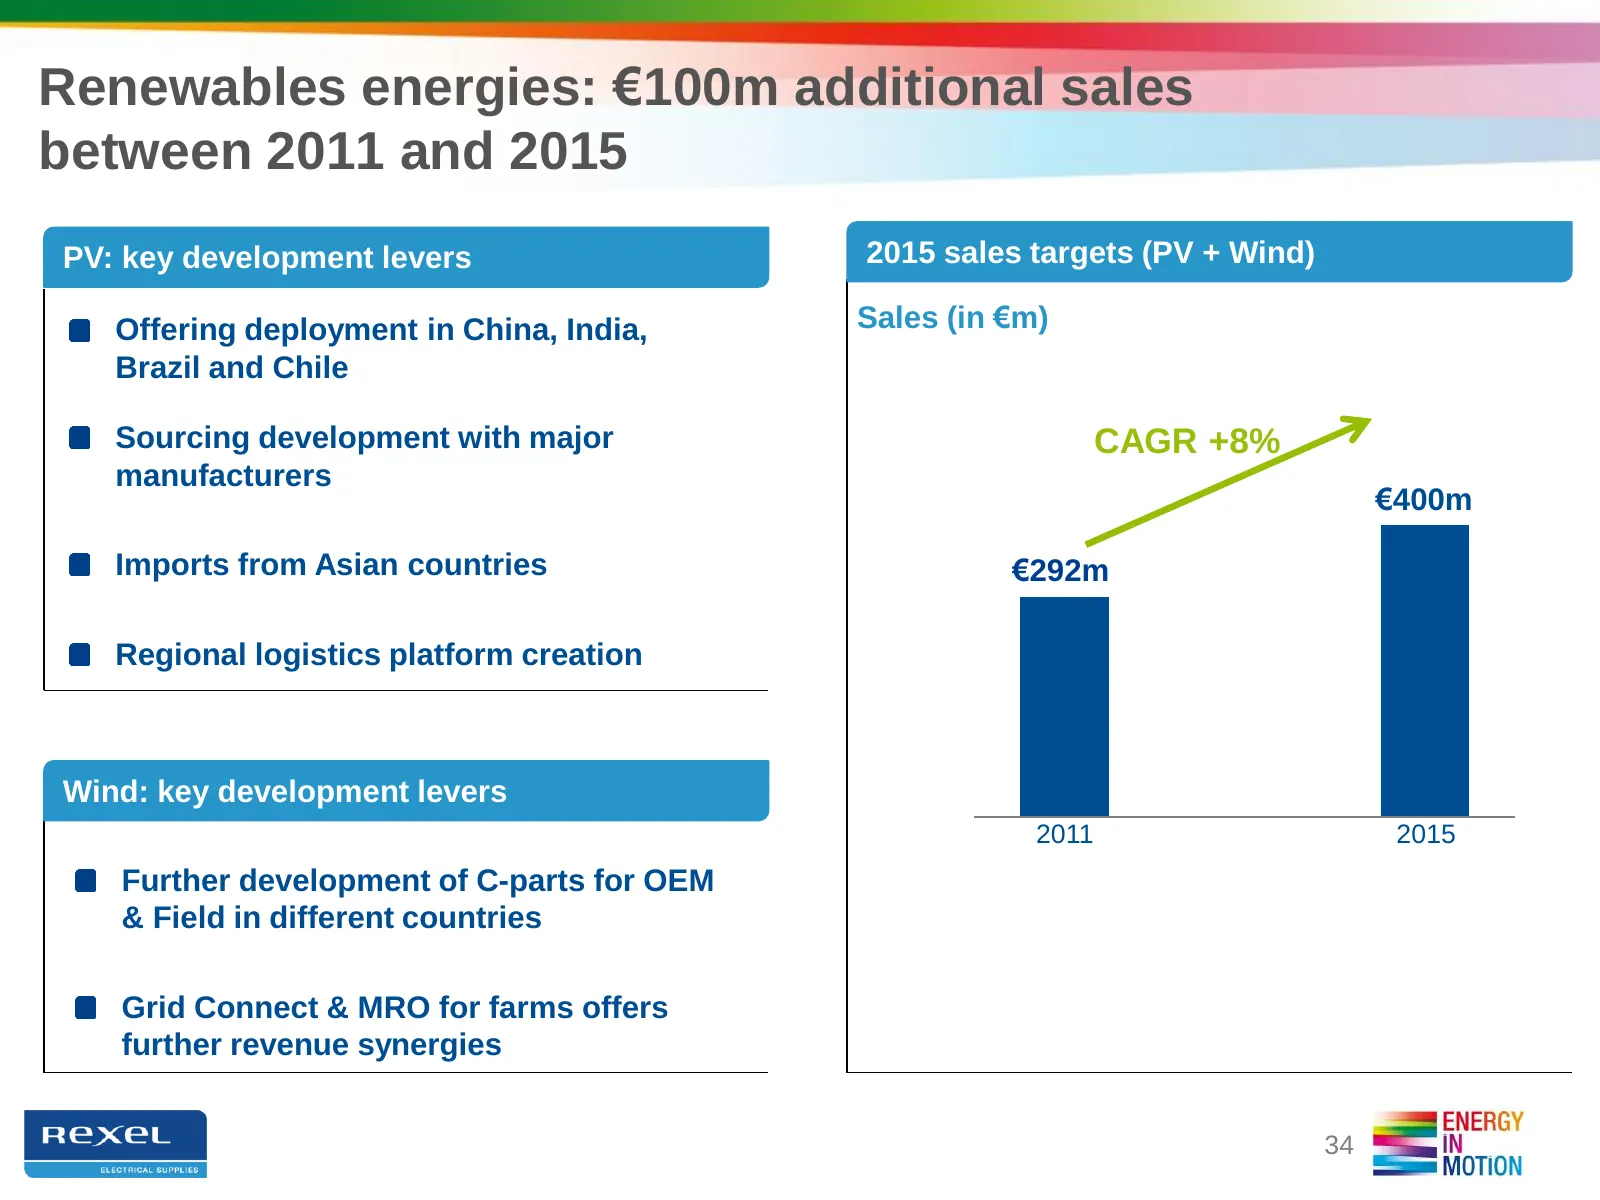
Slide 34: Renewable energies: €100m additional sales by 2015
Renewables energies: €100m additional sales between 2011 and 2015 PV: key development levers 2015 sales targets (PV + Wind) Offering deployment in China, India, Sales (in €m) Brazil and Chile Sourcing development with major CAGR +8% manufacturers €400m €292m Imports from Asian countries €292m Region
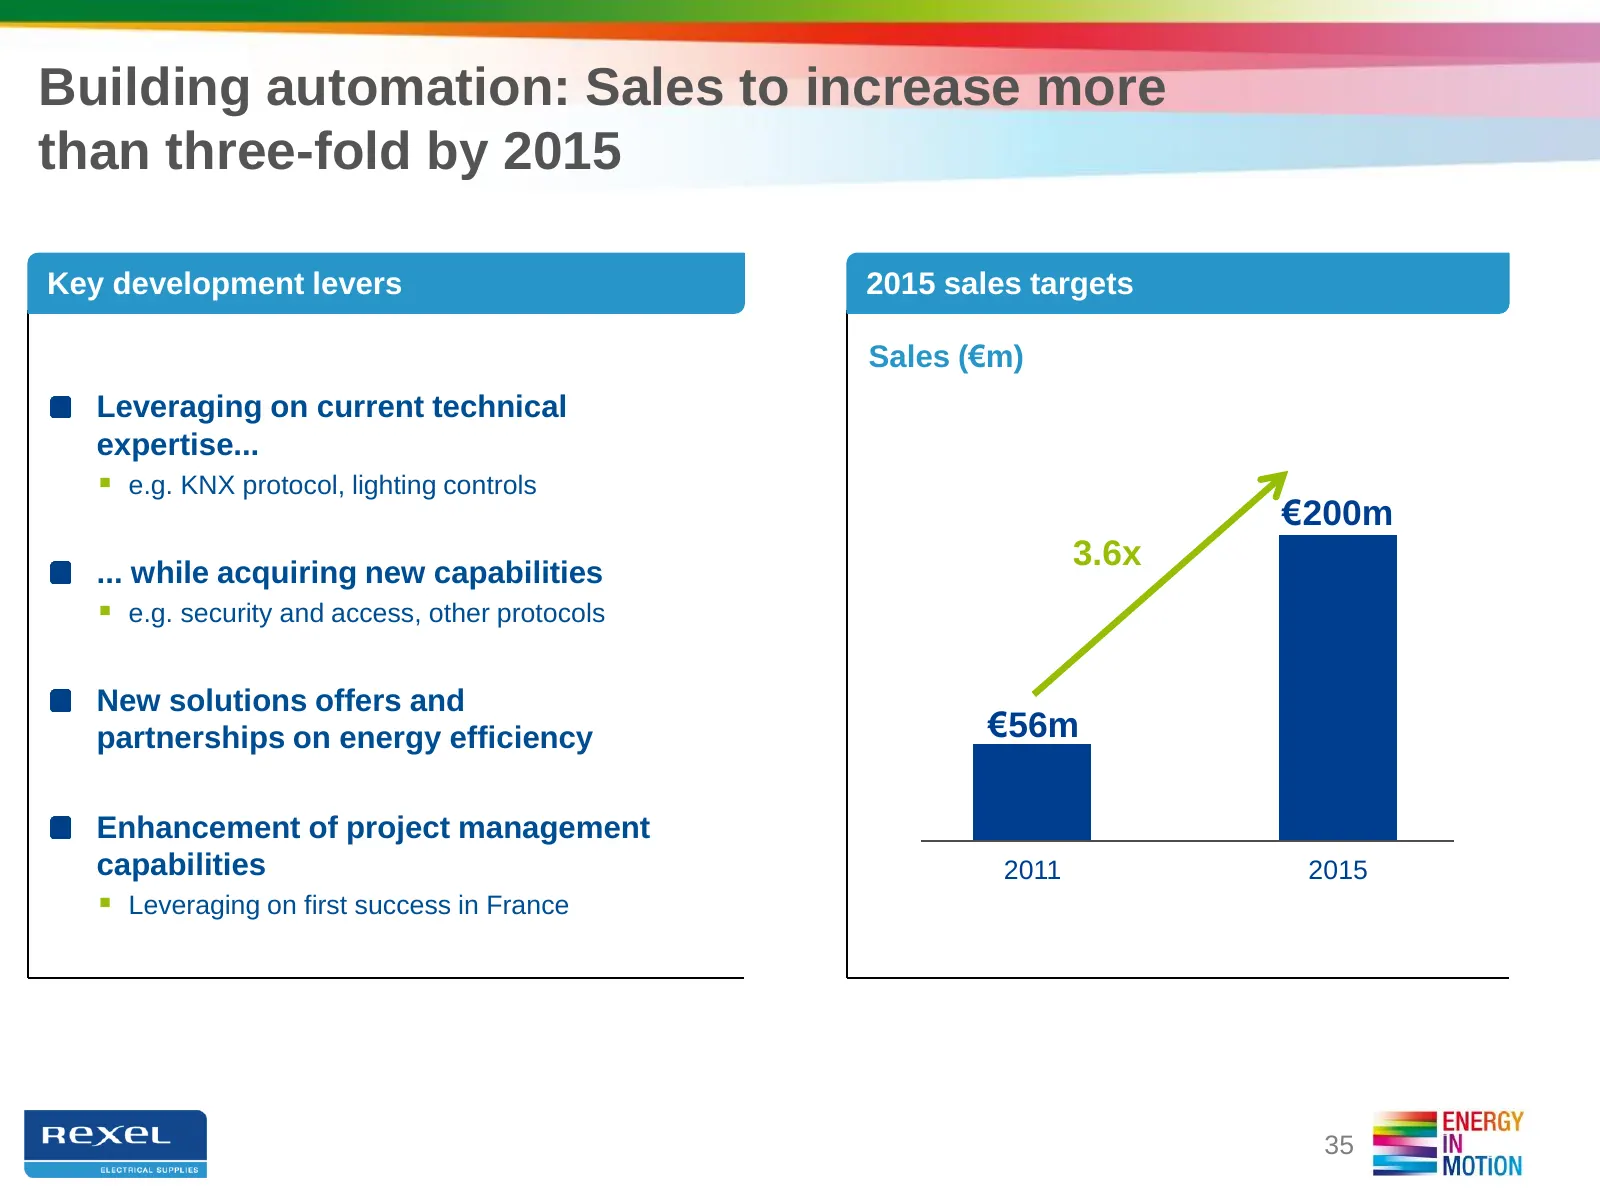
Slide 35: Building automation: sales to increase more than three-fold
Building automation: Sales to increase more than three-fold by 2015 Key development levers 2015 sales targets Sales (€m) Leveraging on current technical expertise... e.g. KNX protocol, lighting controls €200m ... while acquiring new capabilities 3.6x e.g. security and access, other protocols New
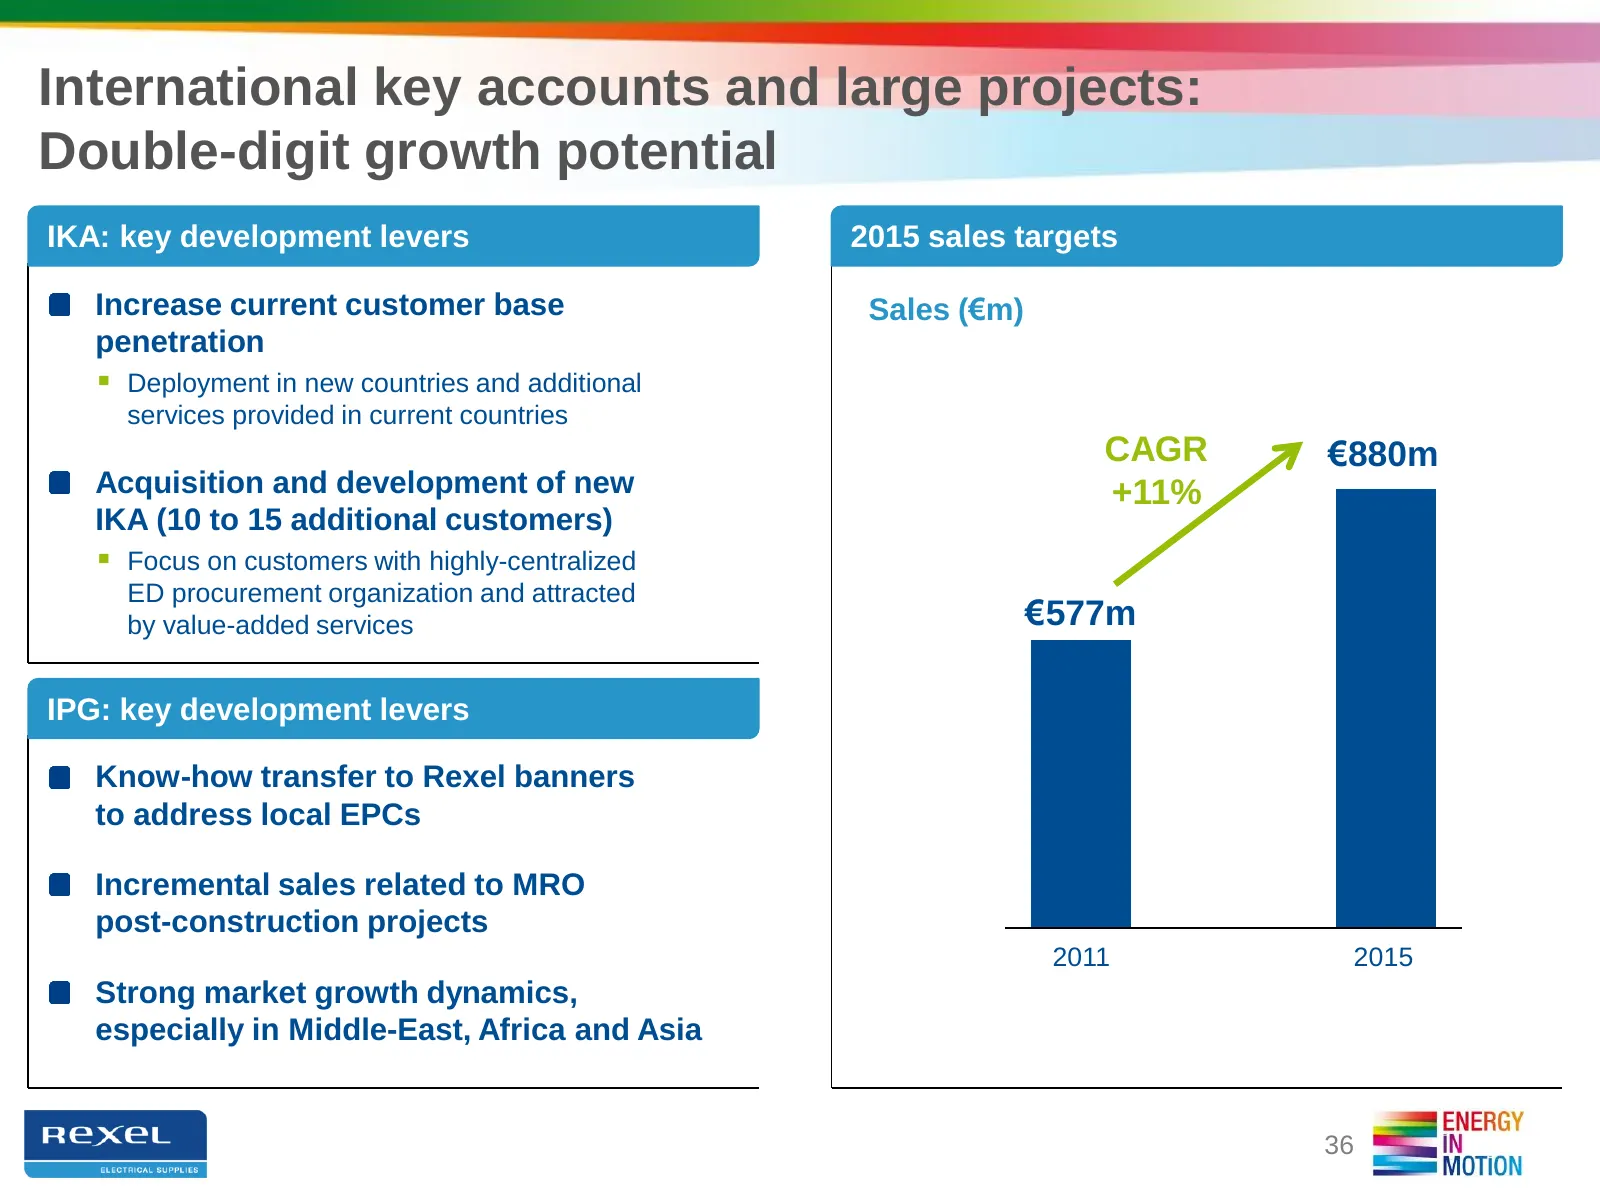
Slide 36: International key accounts and large projects
International key accounts and large projects: Double-digit growth potential IKA: key development levers 2015 sales targets Increase current customer base Sales (€m) penetration Deployment in new countries and additional services provided in current countries CAGR €880m Acquisition and development
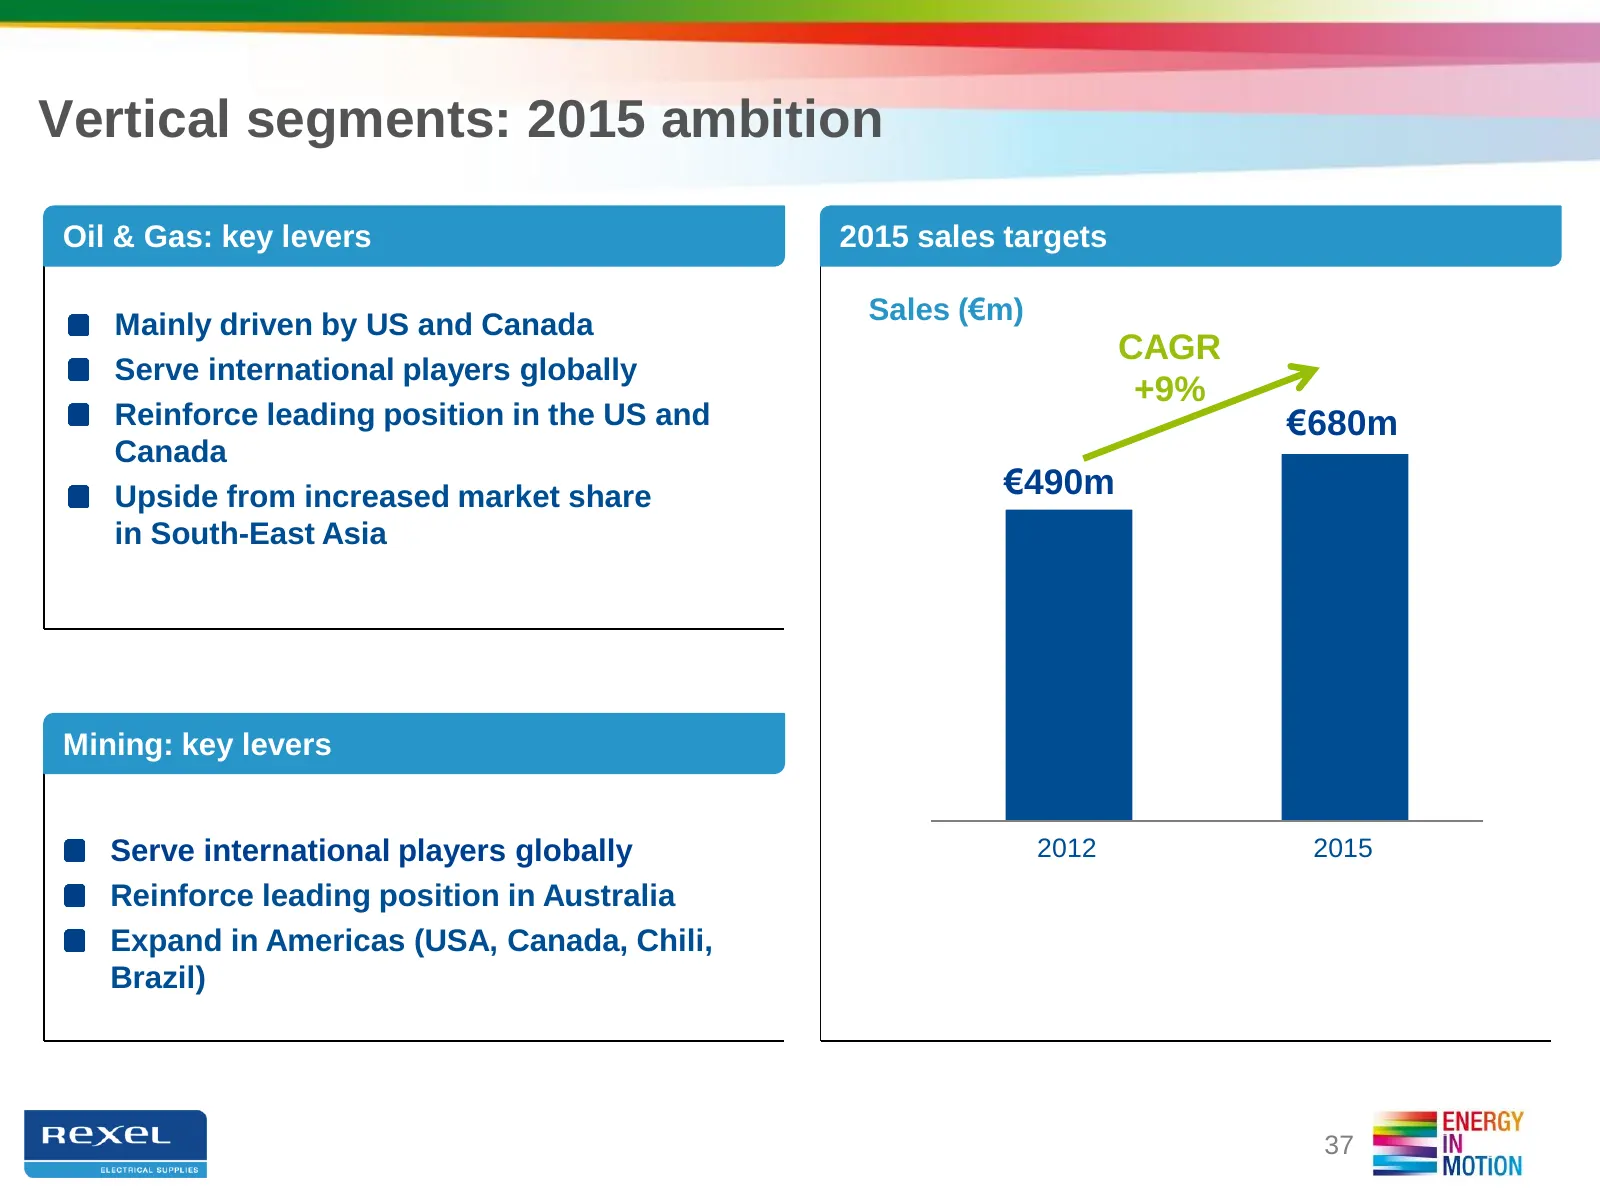
Slide 37: Vertical segments: 2015 ambition
Vertical segments: 2015 ambition Oil & Gas: key levers 2015 sales targets Mainly driven by US and Canada Sales (€m) CAGR Serve international players globally +9% Reinforce leading position in the US and €680m Canada Upside from increased market share €490m in South-East Asia Mining: key levers Serve
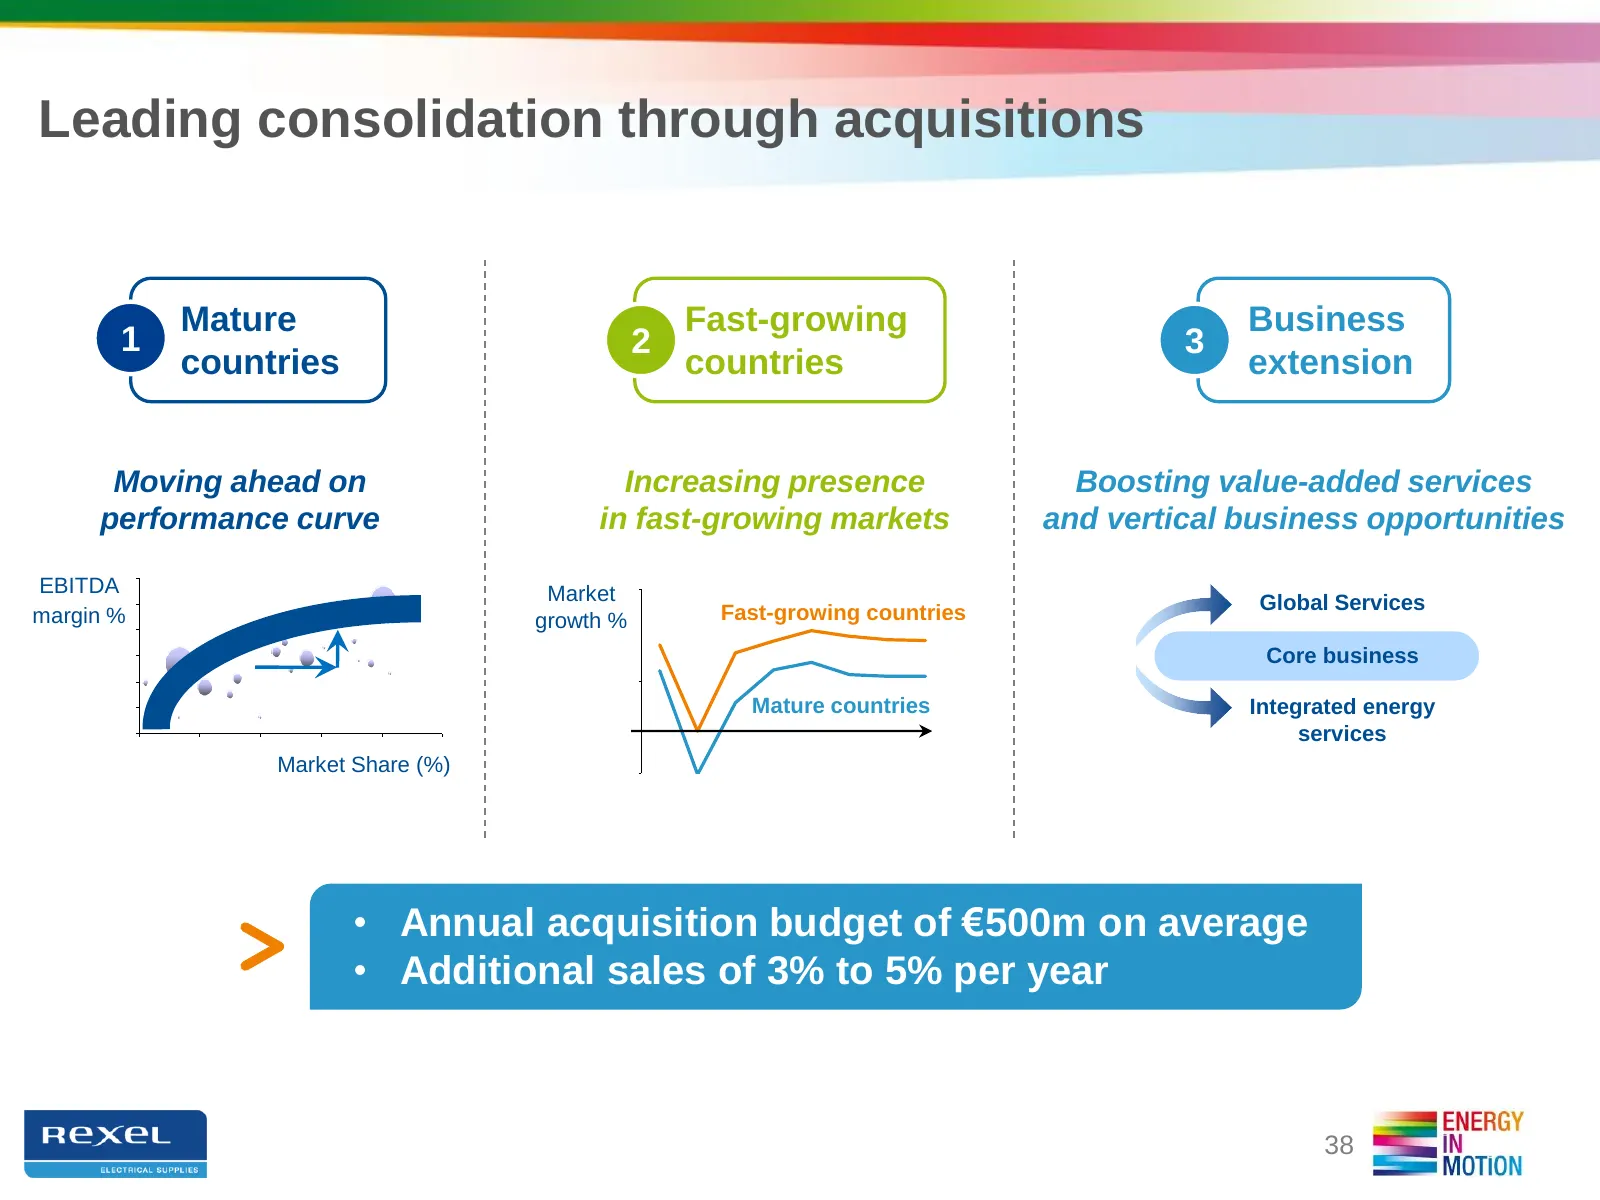
Slide 38: Leading consolidation through acquisitions
Leading consolidation through acquisitions Mature Fast-growing Business 1 2 3 countries countries extension Moving ahead on Increasing presence Boosting value-added services performance curve in fast-growing markets and vertical business opportunities 12% EBITDA Market 10% Fast-growing countries Glo
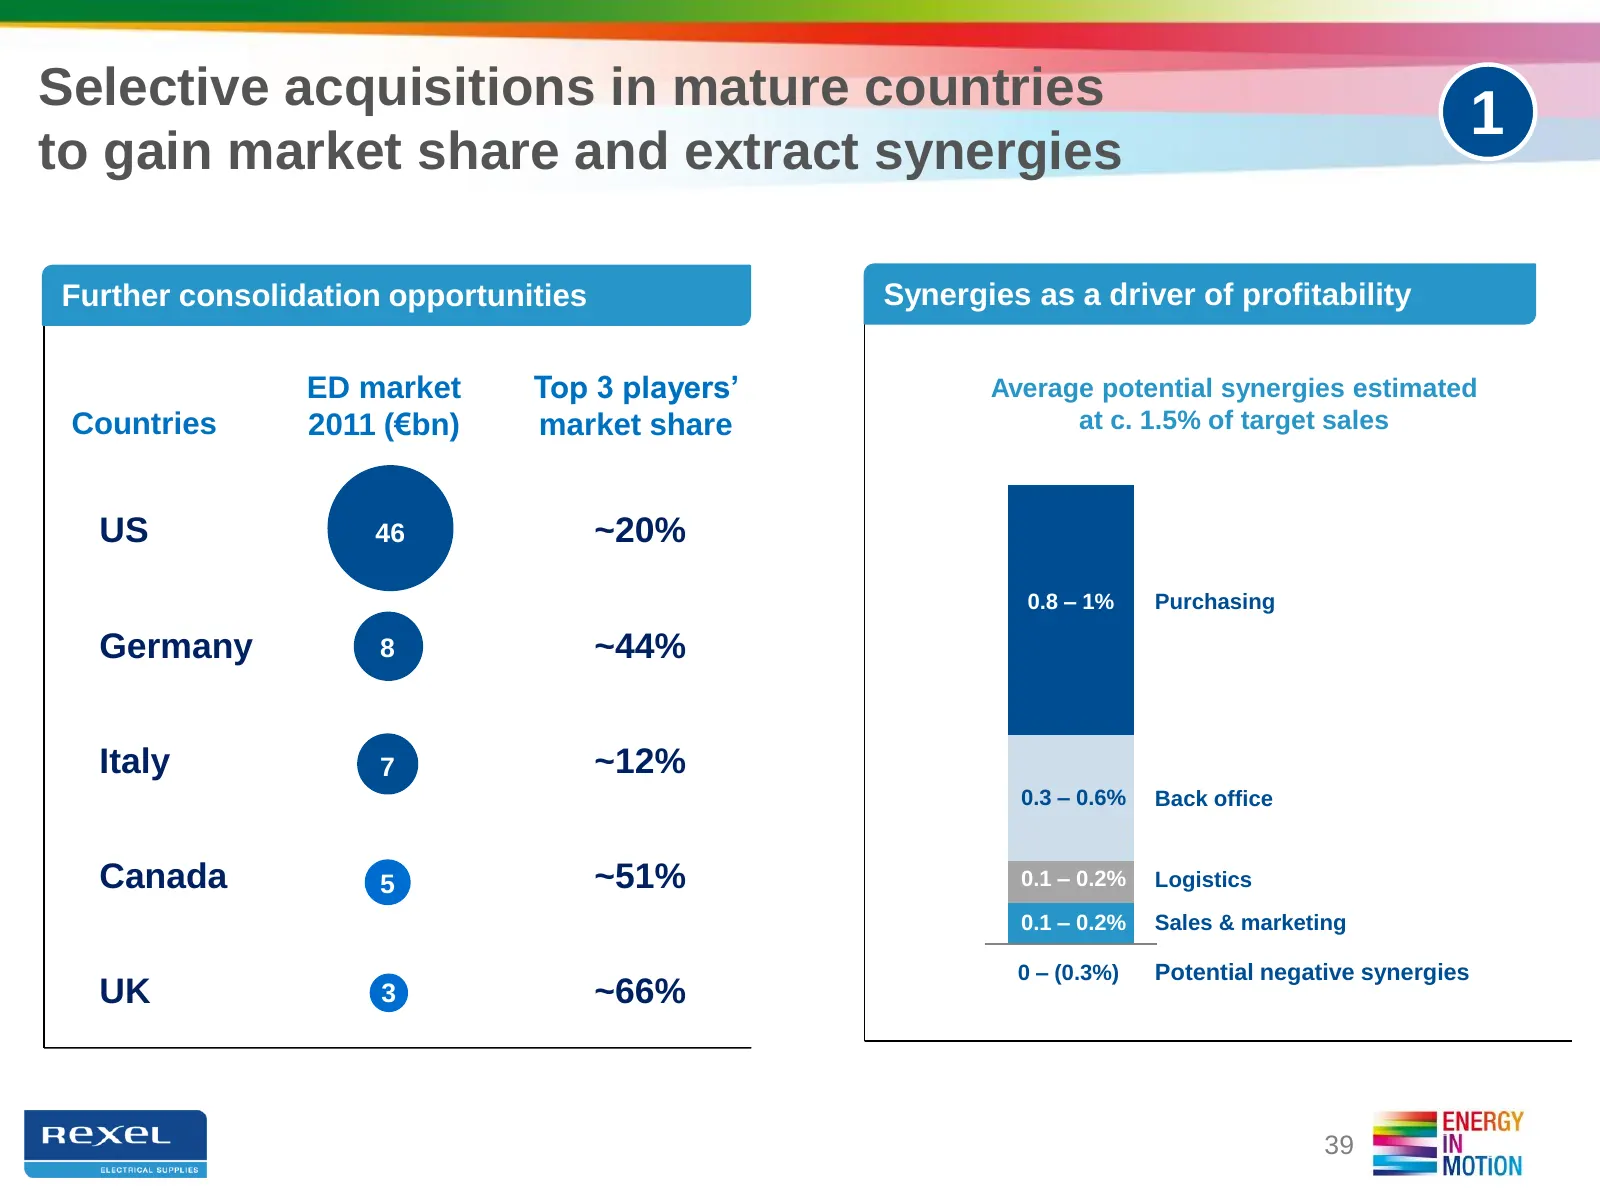
Slide 39: Selective acquisitions in mature countries
Selective acquisitions in mature countries 1 to gain market share and extract synergies Further consolidation opportunities Synergies as a driver of profitability ED market Top 3 players’ Average potential synergies estimated Countries 2011 (€bn) market share at c. 1.5% of target sales US 46 ~20% 0.
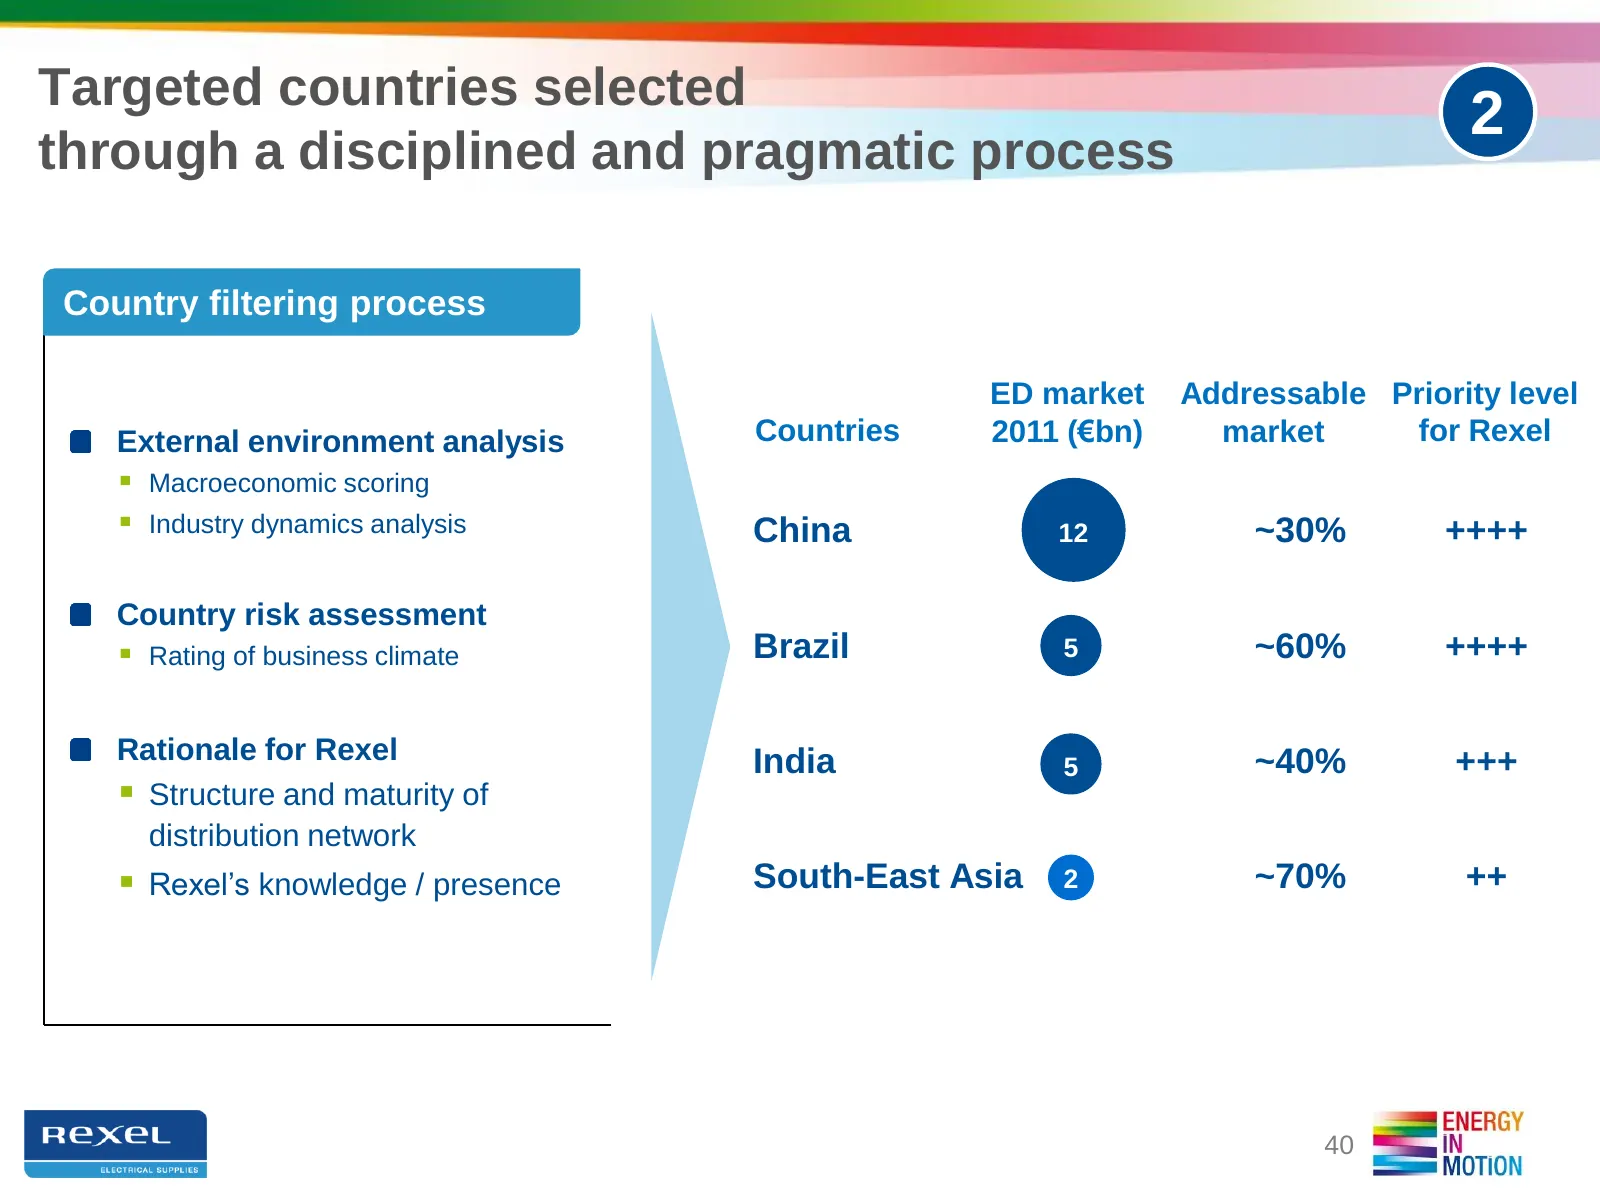
Slide 40: Targeted countries selected through a disciplined process
Targeted countries selected 2 through a disciplined and pragmatic process Country filtering process ED market Addressable Priority level External environment analysis Countries 2011 (€bn) market for Rexel Macroeconomic scoring Industry dynamics analysis China 12 ~30% ++++ Country risk assessment
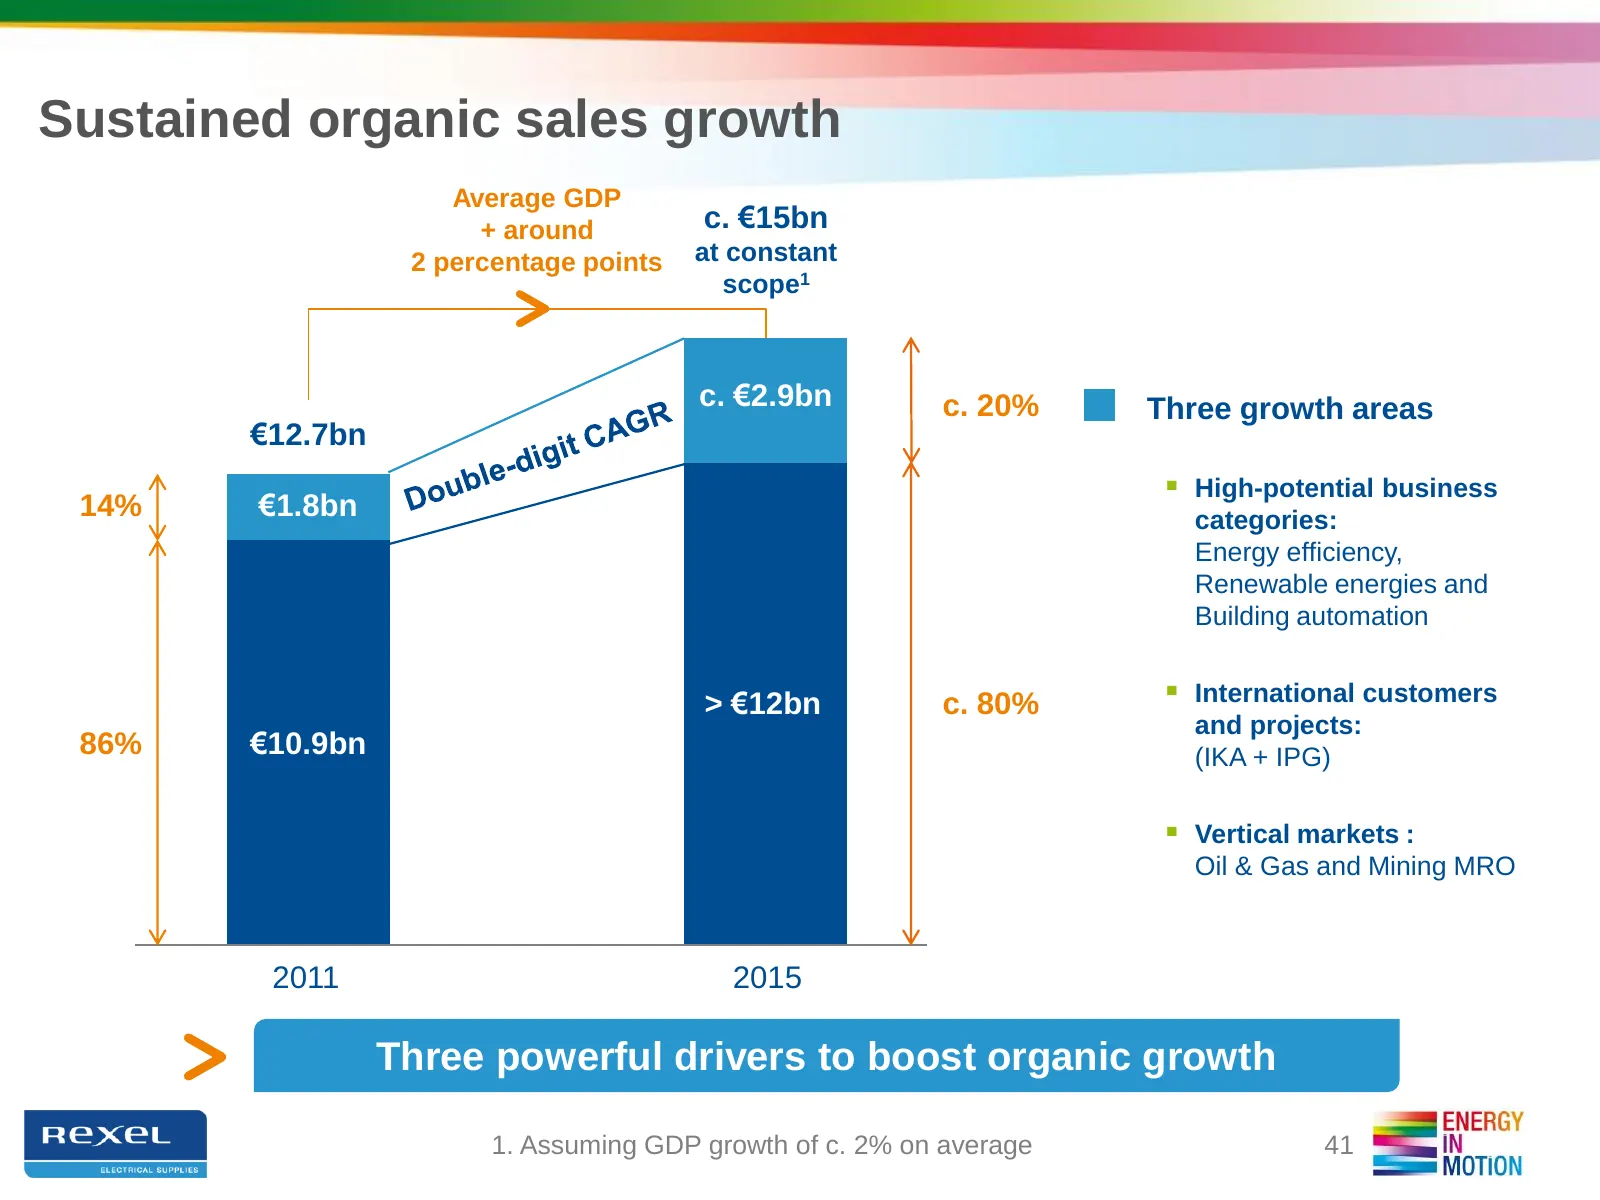
Slide 41: Sustained organic sales growth
Sustained organic sales growth Average GDP + around c. €15bn 2 percentage points at constant scope1 c. €2.9bn c. 20% Three growth areas €12.7bn High-potential business 14% €1.8bn categories: Energy efficiency, Renewable energies and Building automation > €12bn c. 80% International customers and
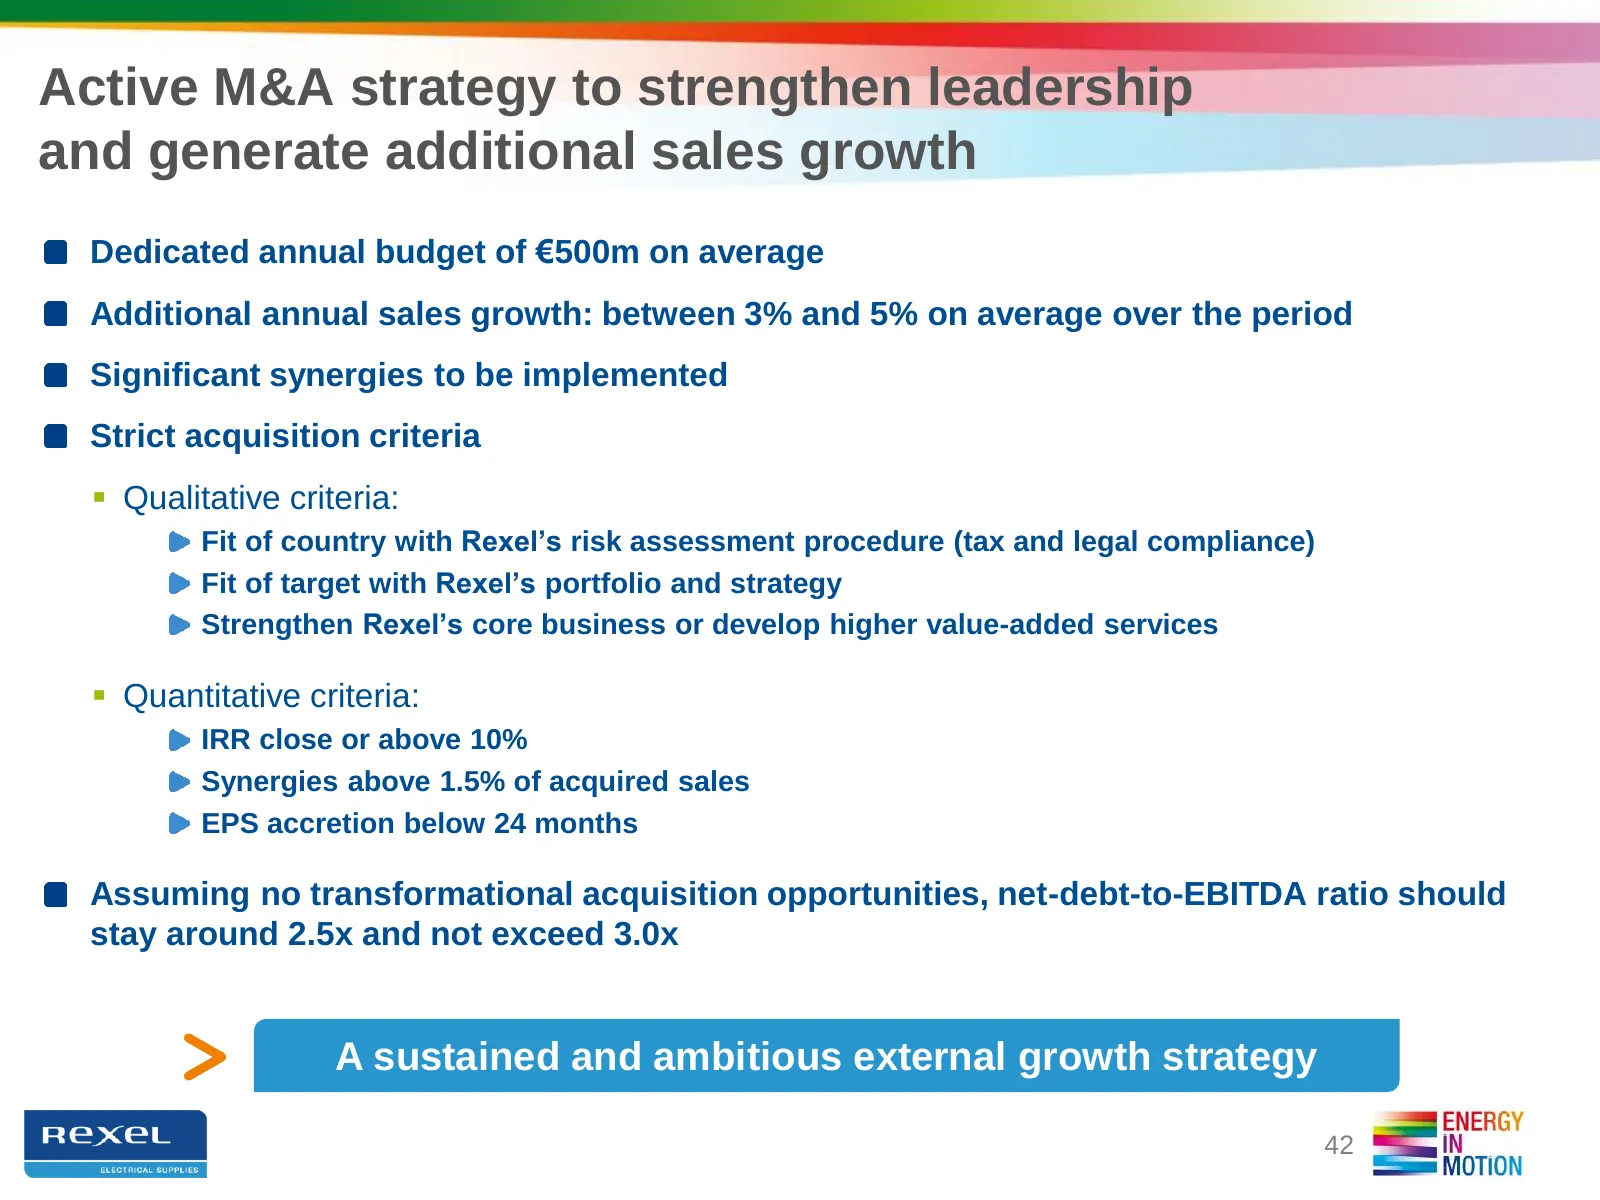
Slide 42: Active M&A strategy to strengthen leadership
Active M&A strategy to strengthen leadership and generate additional sales growth Dedicated annual budget of €500m on average Additional annual sales growth: between 3% and 5% on average over the period Significant synergies to be implemented Strict acquisition criteria Qualitative criteria: Fit o
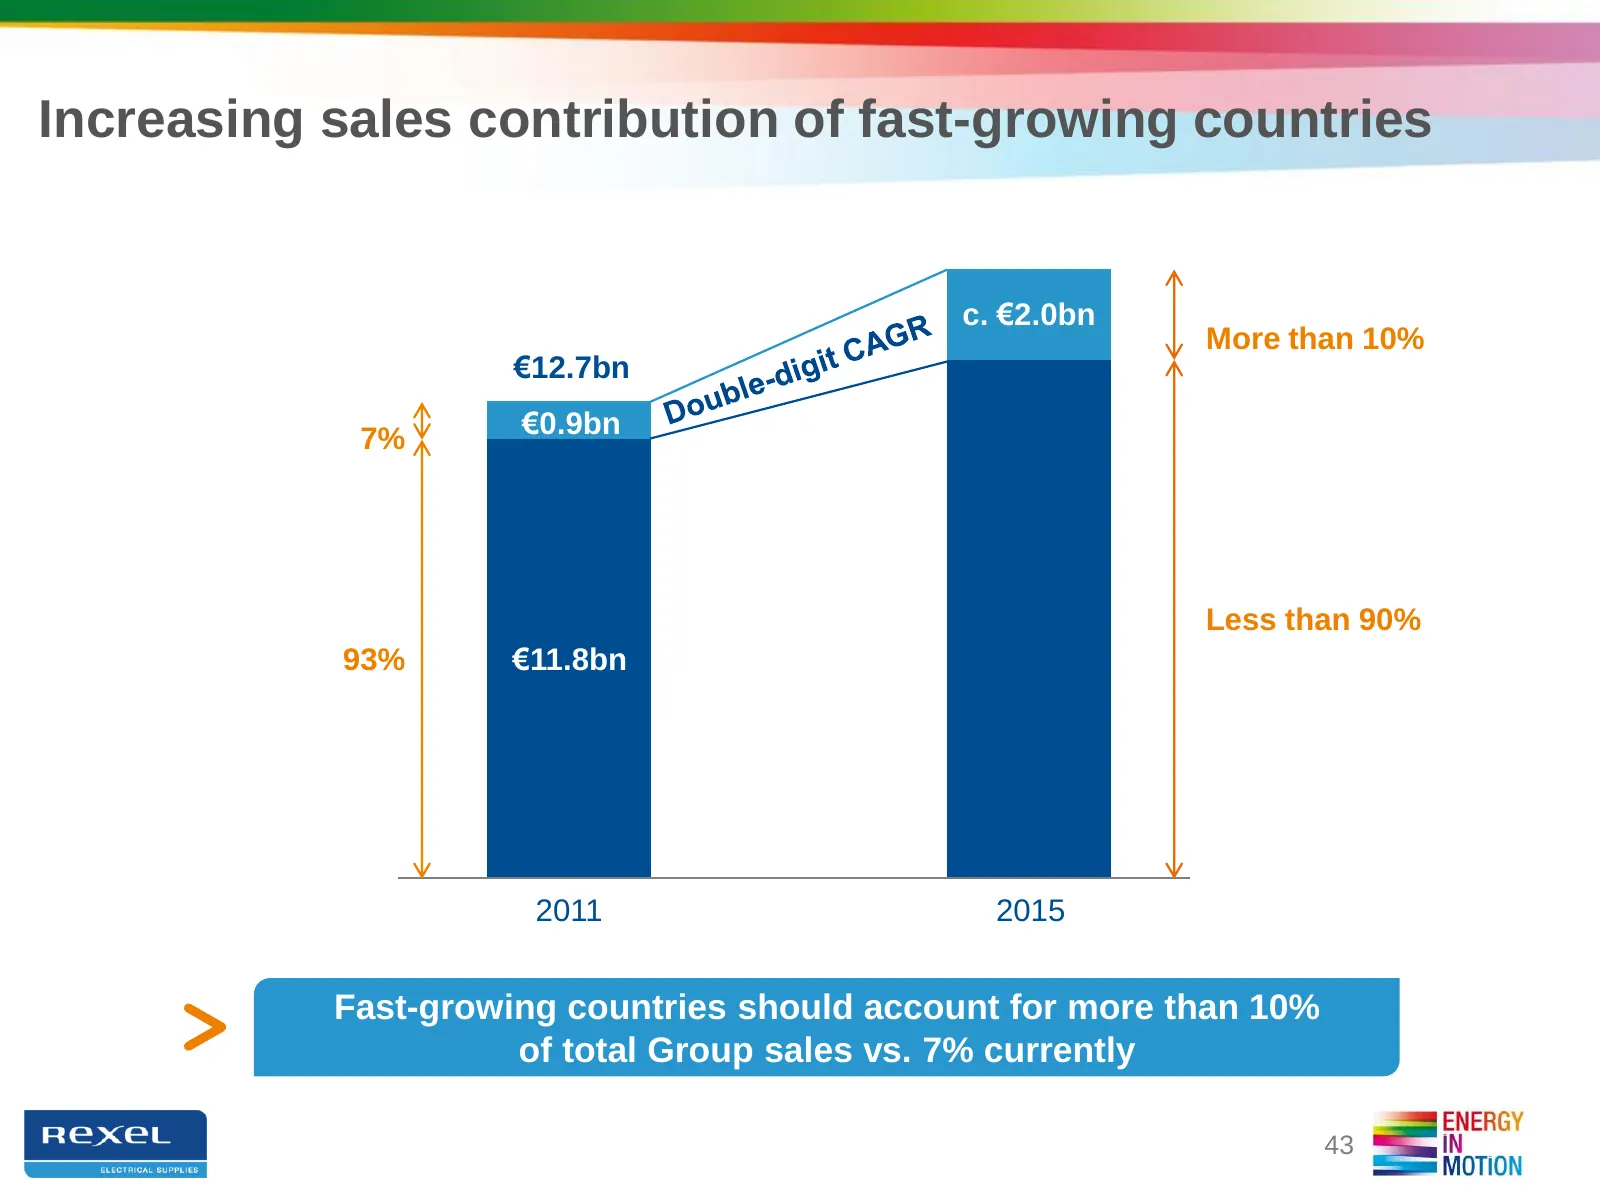
Slide 43: Increasing sales contribution of fast-growing countries
Increasing sales contribution of fast-growing countries c. €2.0bn More than 10% €12.7bn 7% €0.9bn Less than 90% 93% €11.8bn 2011 2015 Fast-growing countries should account for more than 10% of total Group sales vs. 7% currently 43
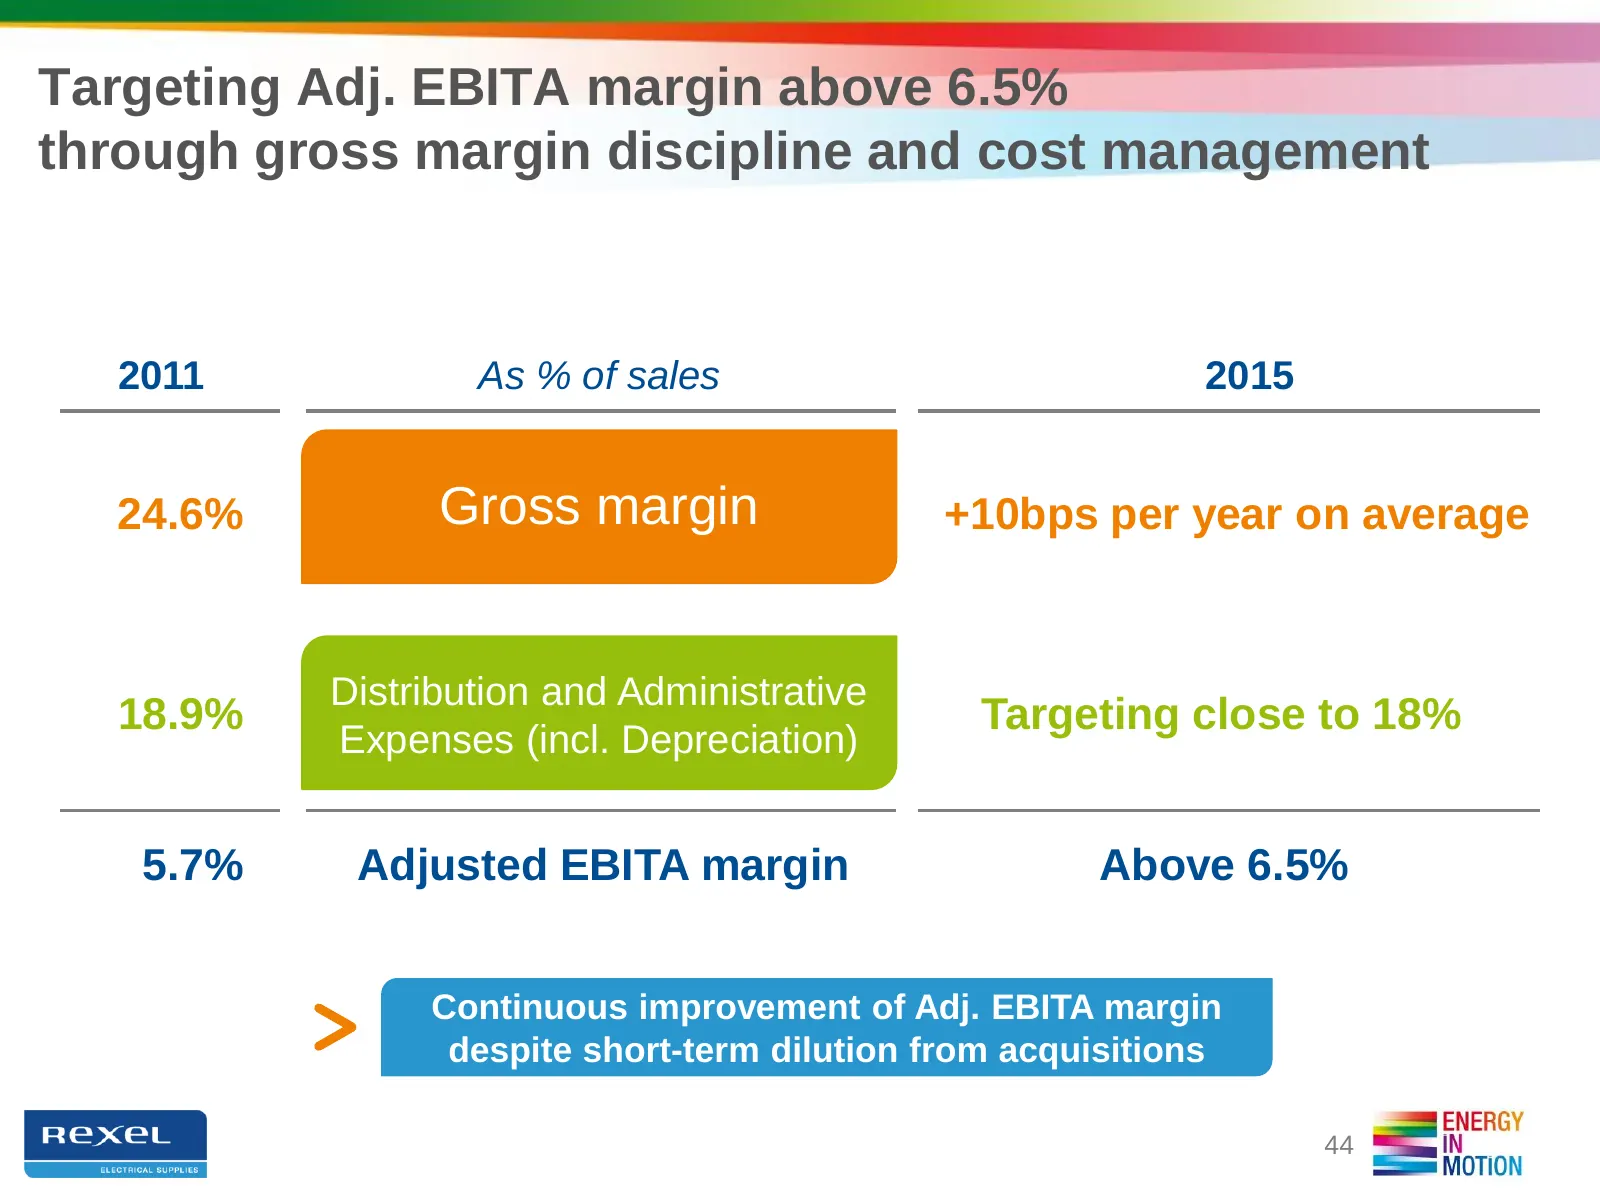
Slide 44: Targeting Adj. EBITA margin above 6.5%
Targeting Adj. EBITA margin above 6.5% through gross margin discipline and cost management 2011 As % of sales 2015 24.6% Gross margin +10bps per year on average Distribution and Administrative 18.9% Targeting close to 18% Expenses (incl. Depreciation) 5.7% Adjusted EBITA margin Above 6.5% Continuous
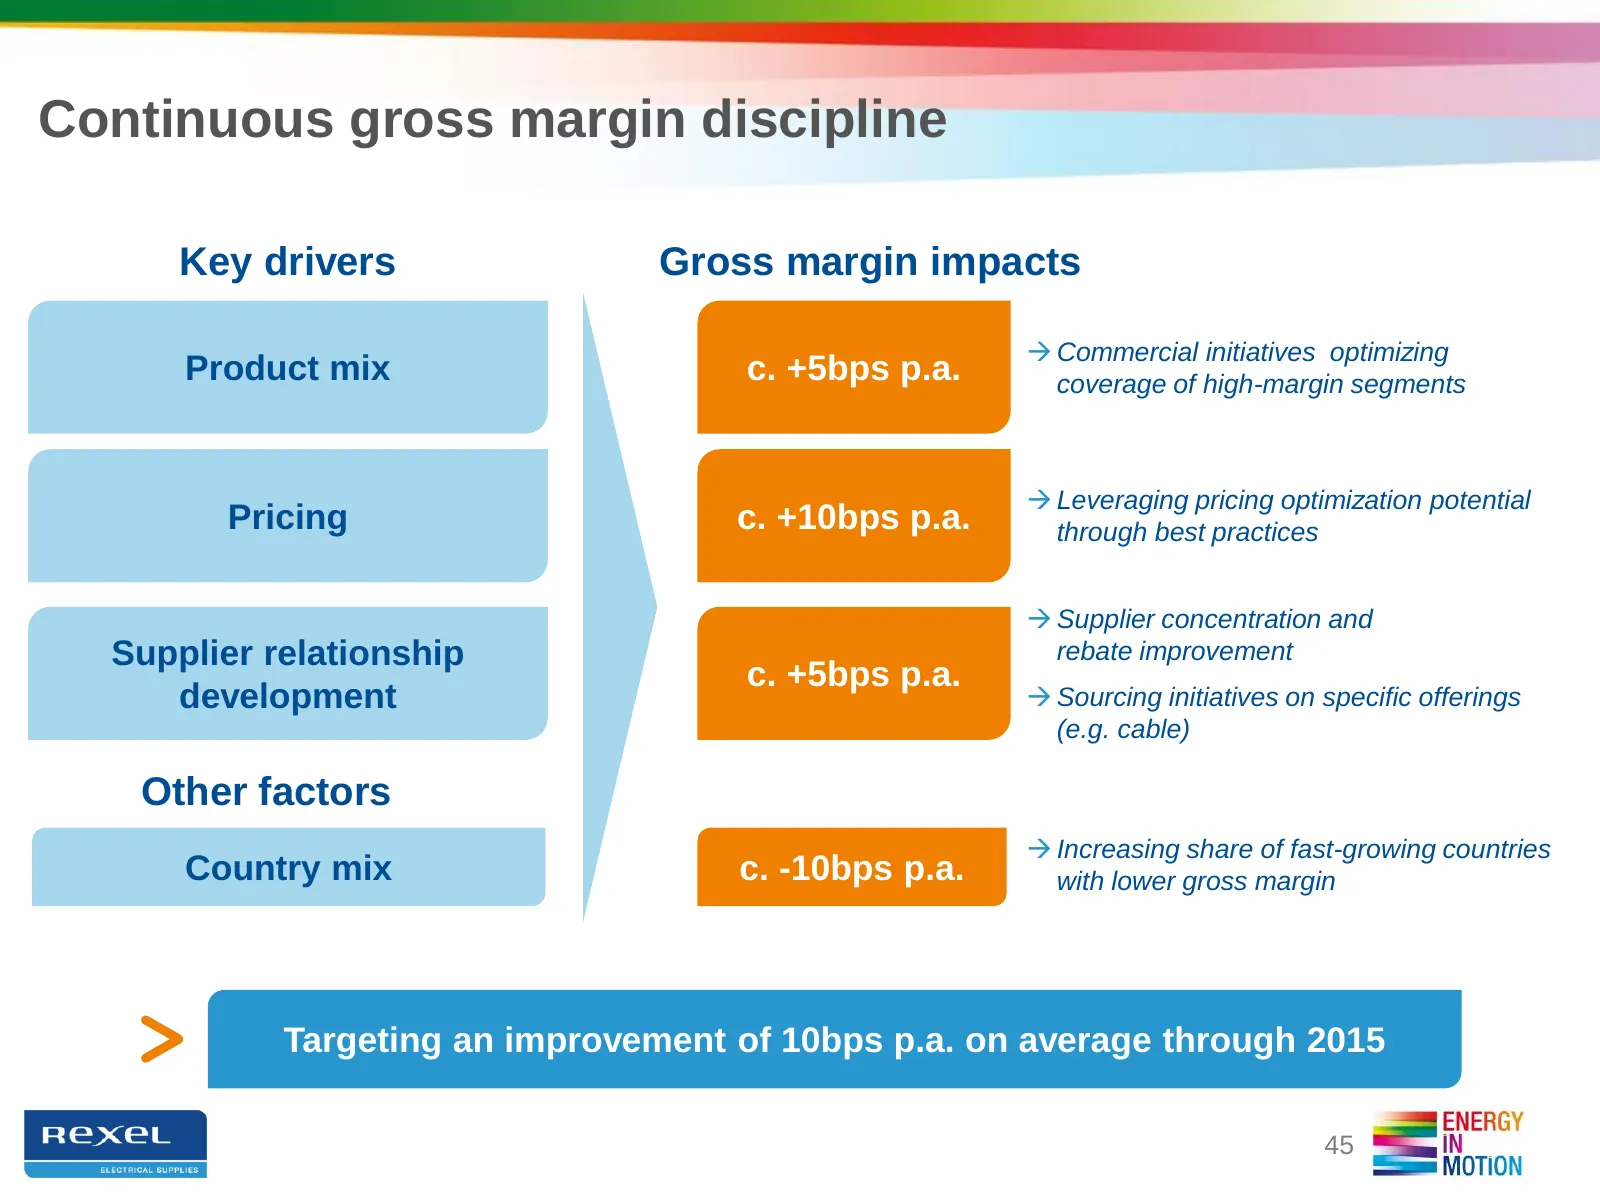
Slide 45: Continuous gross margin discipline
Continuous gross margin discipline Key drivers Gross margin impacts Commercial initiatives optimizing Product mix c. +5bps p.a. coverage of high-margin segments Leveraging pricing optimization potential Pricing c. +10bps p.a. through best practices Supplier concentration and Supplier relations
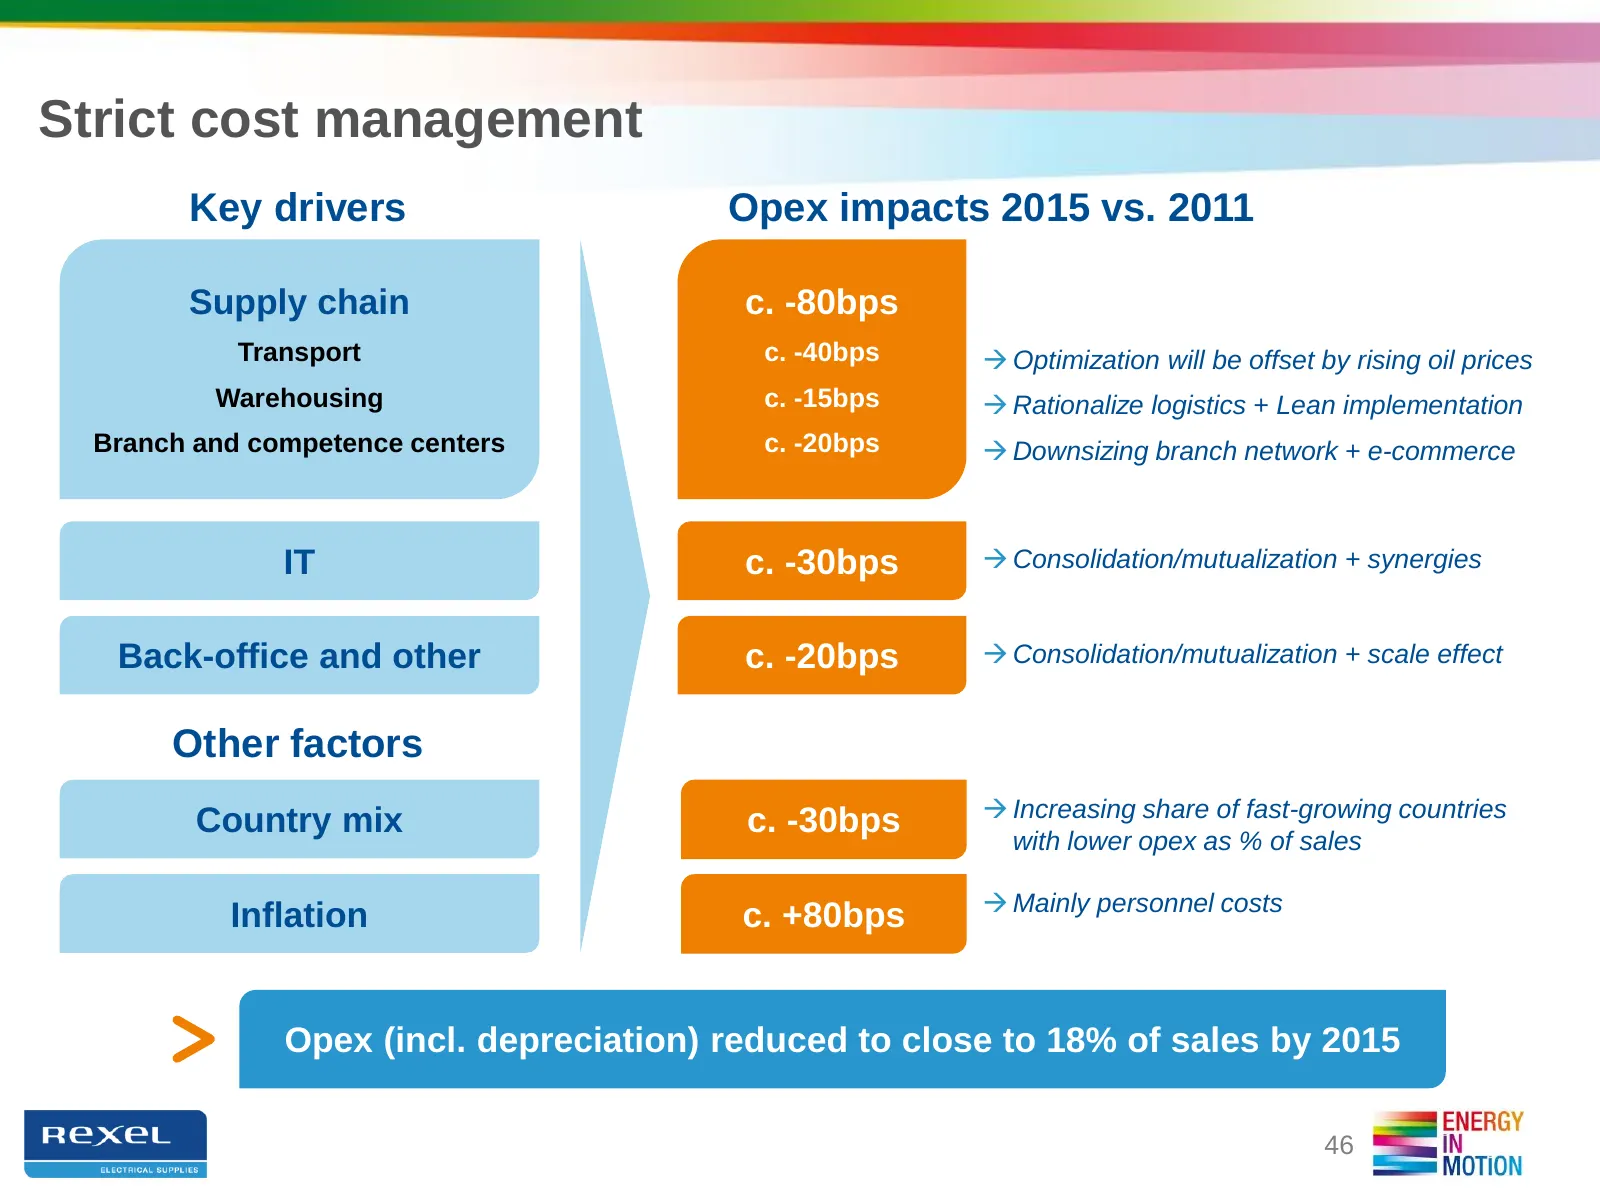
Slide 46: Strict cost management
Strict cost management Key drivers Opex impacts 2015 vs. 2011 Supply chain c. -80bps Transport c. -40bps Optimization will be offset by rising oil prices Warehousing c. -15bps Rationalize logistics + Lean implementation Branch and competence centers c. -20bps Downsizing branch network + e-comm
Slide 47: Tight control of working capital
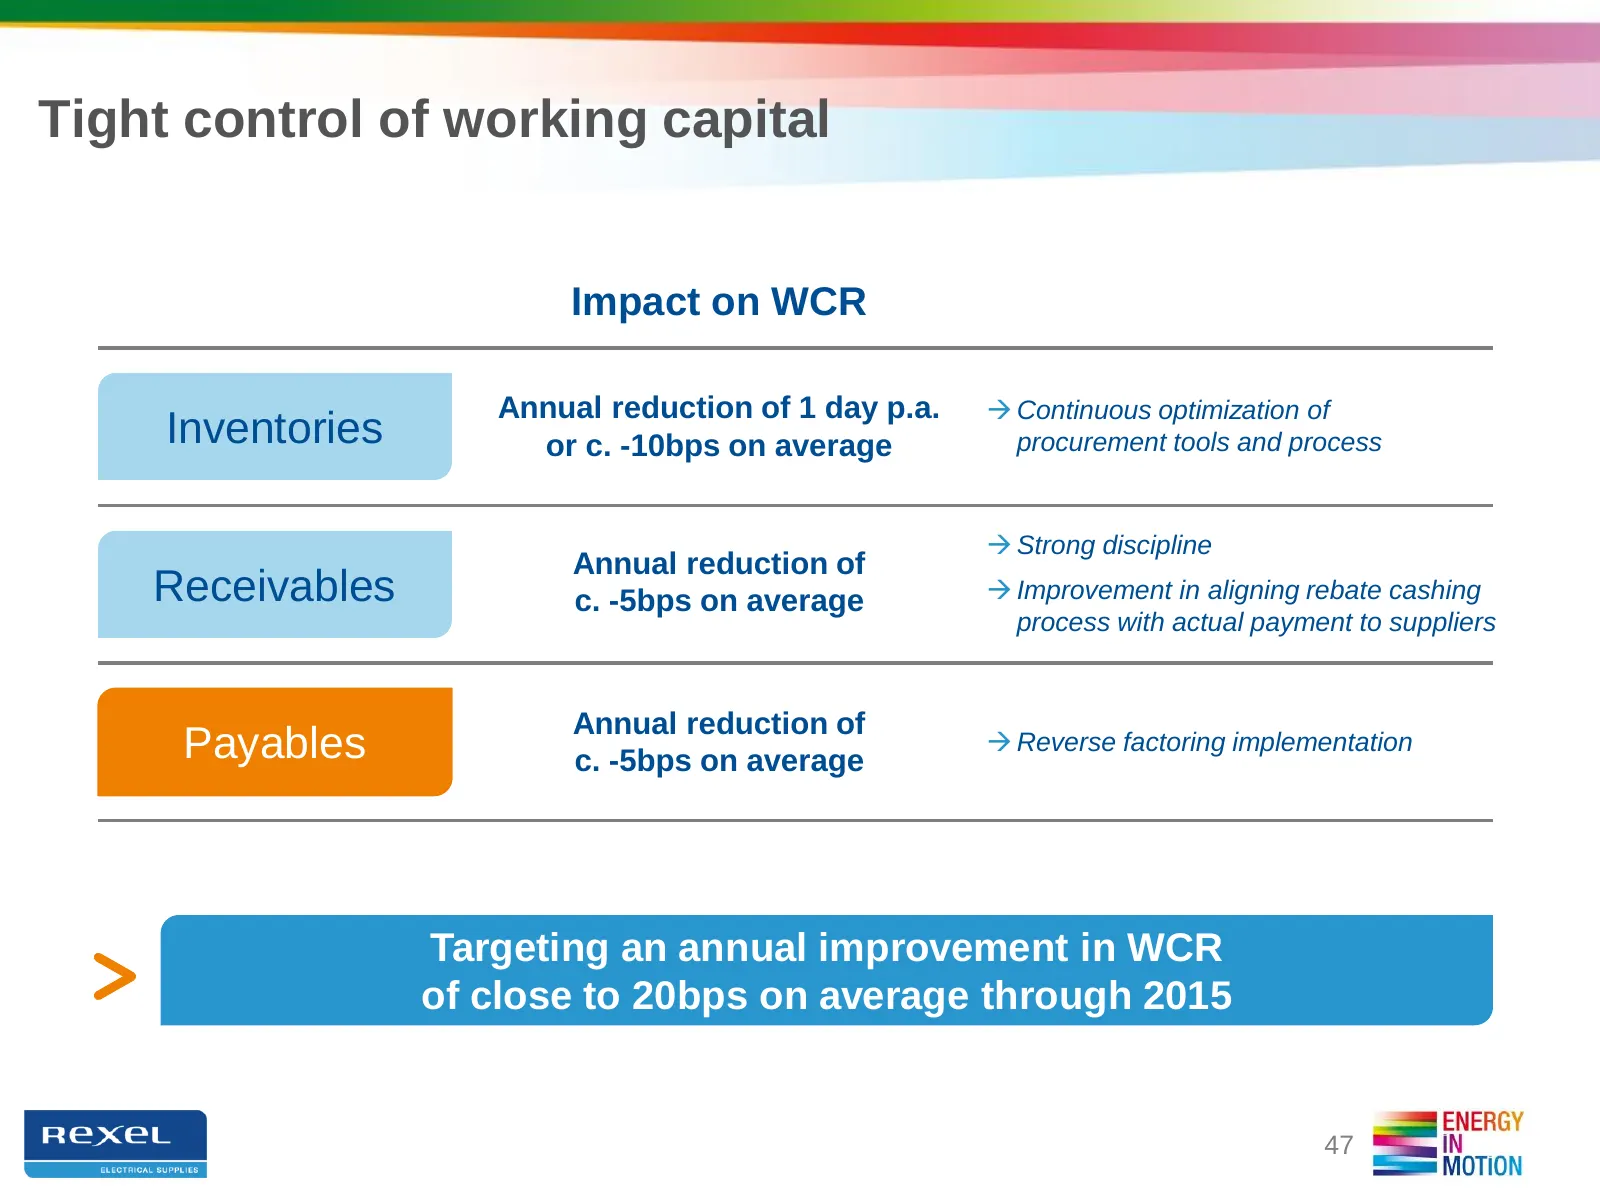
Tight control of working capital Impact on WCR Annual reduction of 1 day p.a. Continuous optimization of Inventories or c. -10bps on average procurement tools and process Strong discipline Annual reduction of Receivables c. -5bps on average Improvement in aligning rebate cashing process with a
Slide 48: Solid cash-flow generation
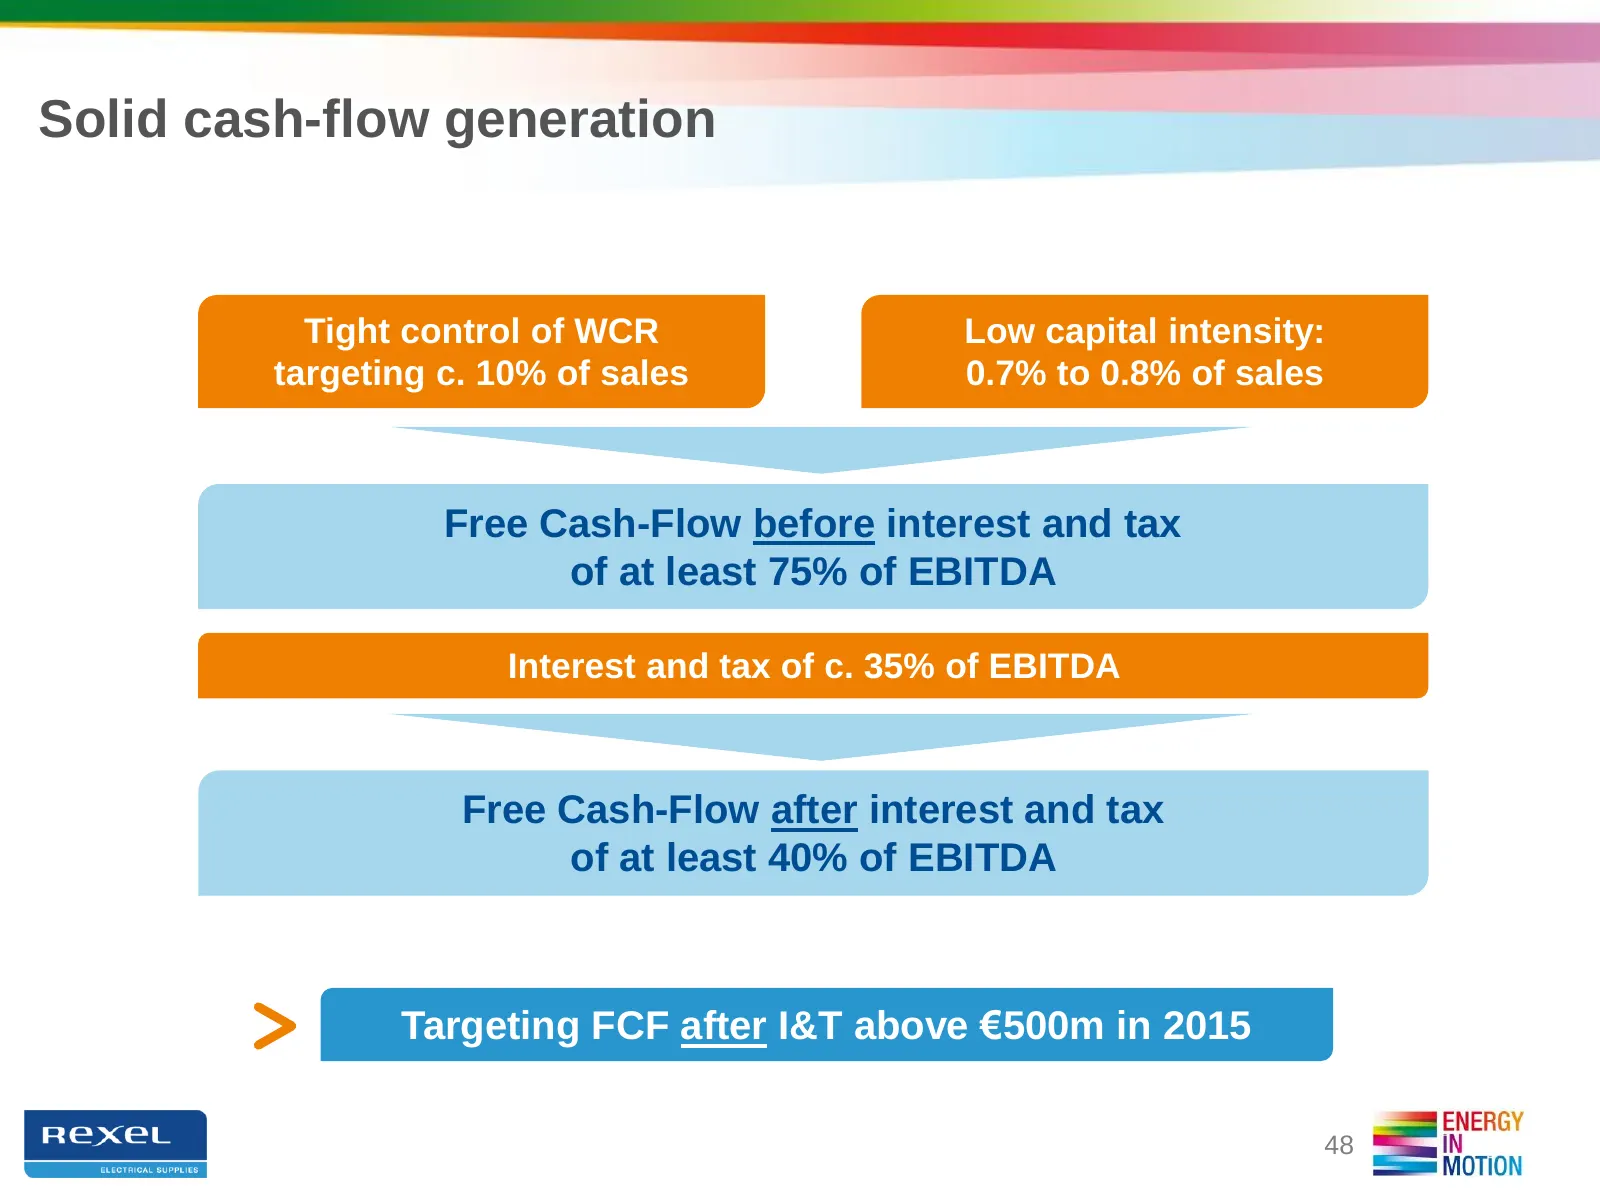
Solid cash-flow generation Tight control of WCR Low capital intensity: targeting c. 10% of sales 0.7% to 0.8% of sales Free Cash-Flow before interest and tax of at least 75% of EBITDA Interest and tax of c. 35% of EBITDA Free Cash-Flow after interest and tax of at least 40% of EBITDA Targeting FCF a
Slide 49: Improved flexibility through a three-pronged financial strategy
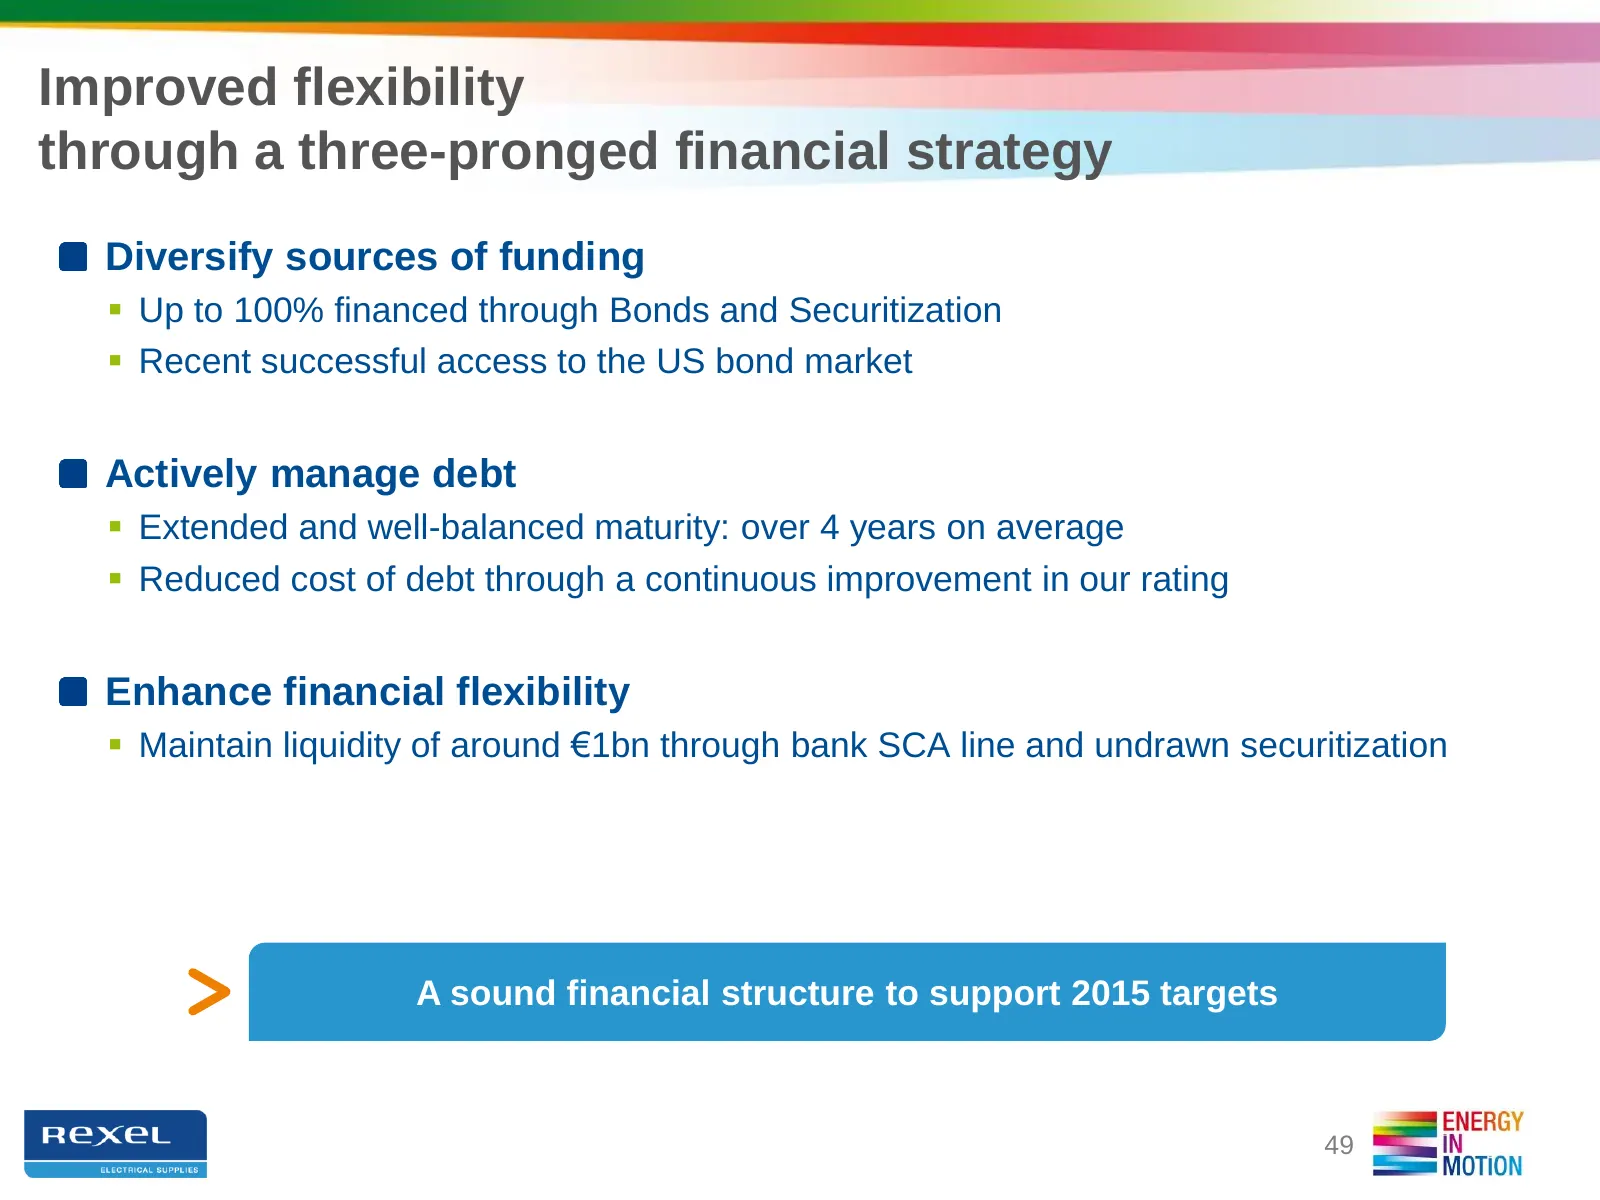
Improved flexibility through a three-pronged financial strategy Diversify sources of funding Up to 100% financed through Bonds and Securitization Recent successful access to the US bond market Actively manage debt Extended and well-balanced maturity: over 4 years on average Reduced cost of d
Slide 50: 2015 Financial Targets
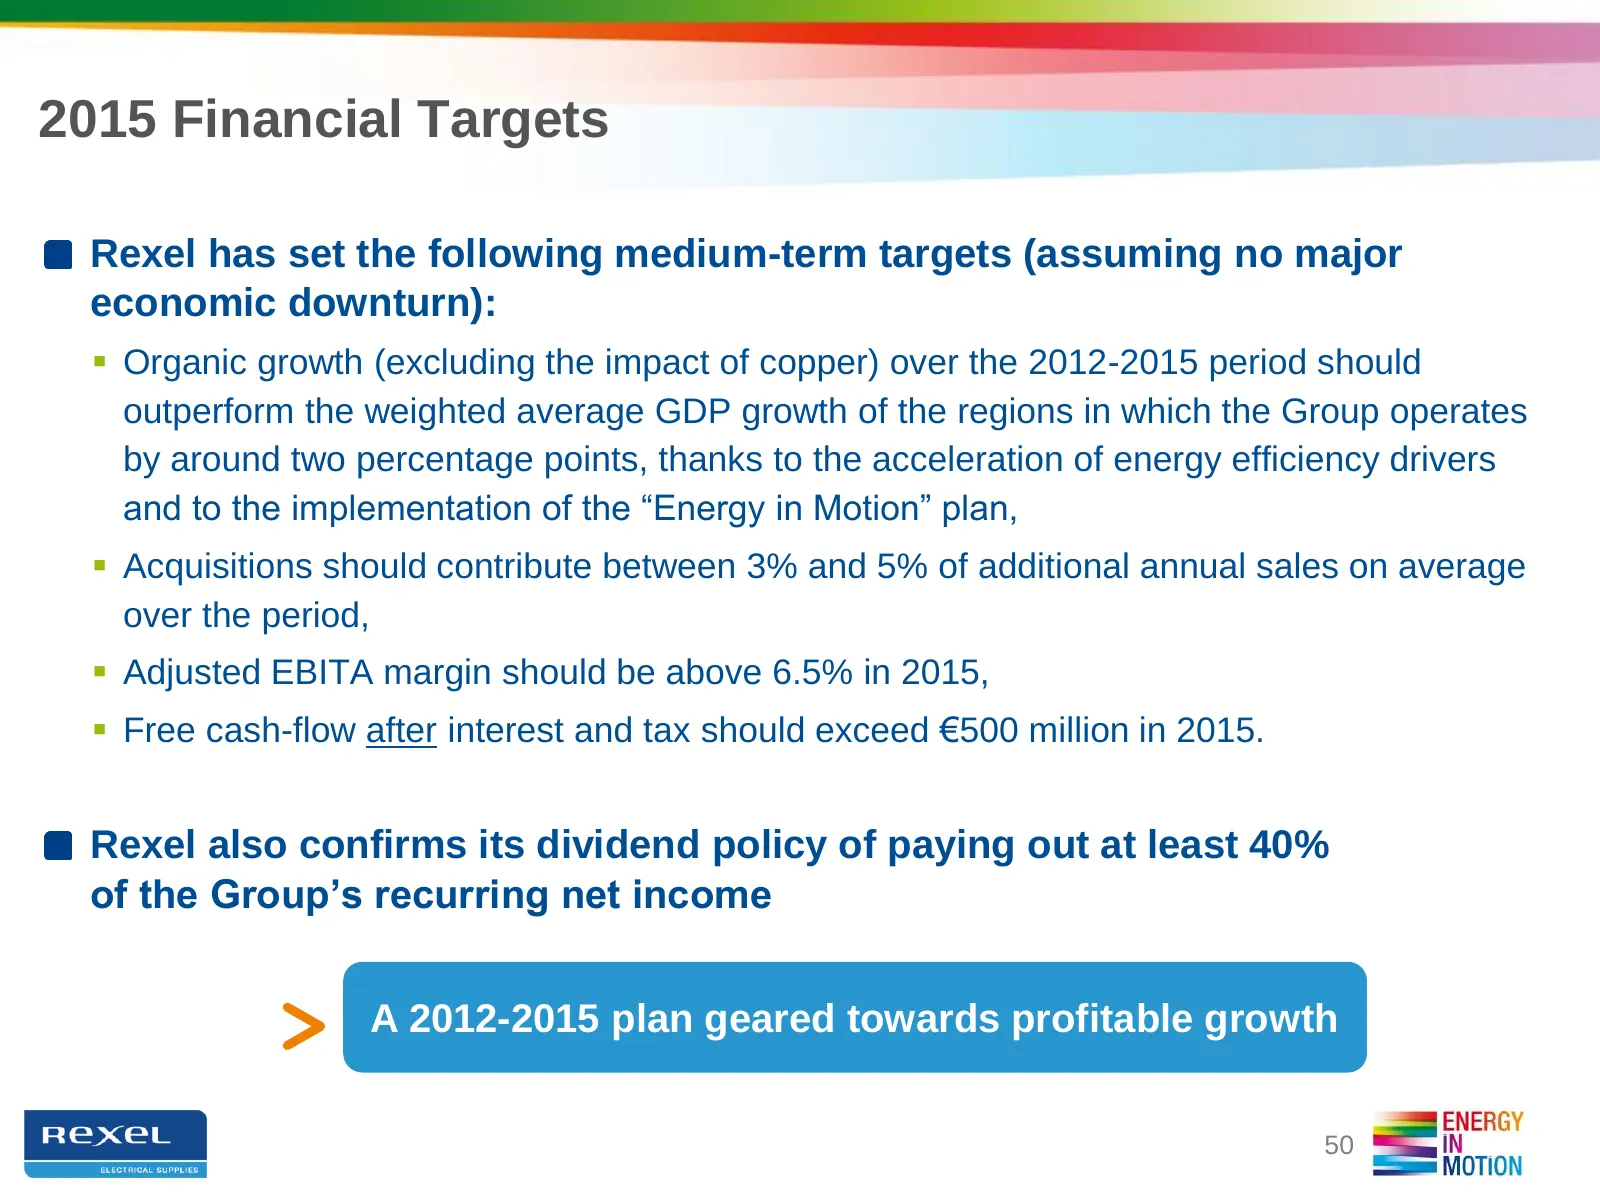
2015 Financial Targets Rexel has set the following medium-term targets (assuming no major economic downturn): Organic growth (excluding the impact of copper) over the 2012-2015 period should outperform the weighted average GDP growth of the regions in which the Group operates by around two percent

Slide 51: Appendices: US & UK Focus
APPENDICES : US & UK FOCUS
Slide 52: USA: the largest ED market in the world
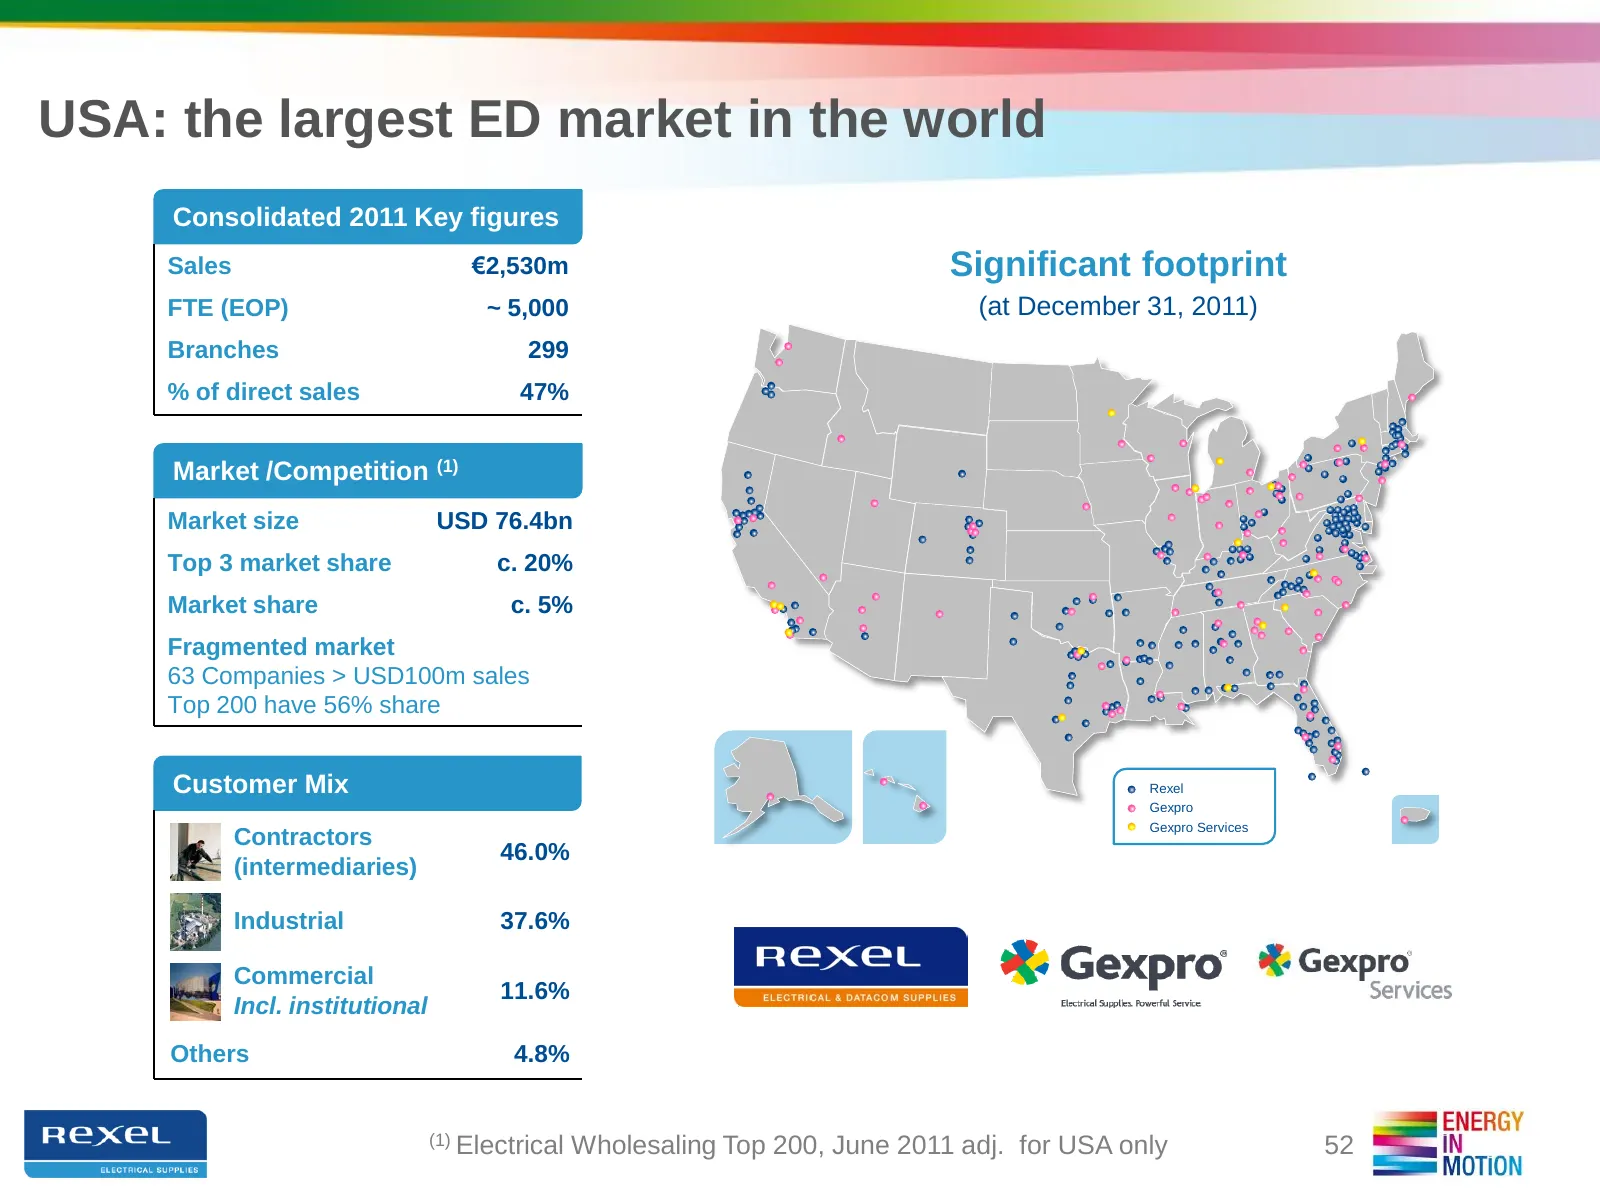
USA: the largest ED market in the world Consolidated 2011 Key figures Sales €2,530m Significant footprint FTE (EOP) ~ 5,000 (at December 31, 2011) Branches 299 % of direct sales 47% Market /Competition (1) Market size USD 76.4bn Top 3 market share c. 20% Market share c. 5% Fragmented market 63 Compa
Slide 53: USA: strong upside potential in all end-markets
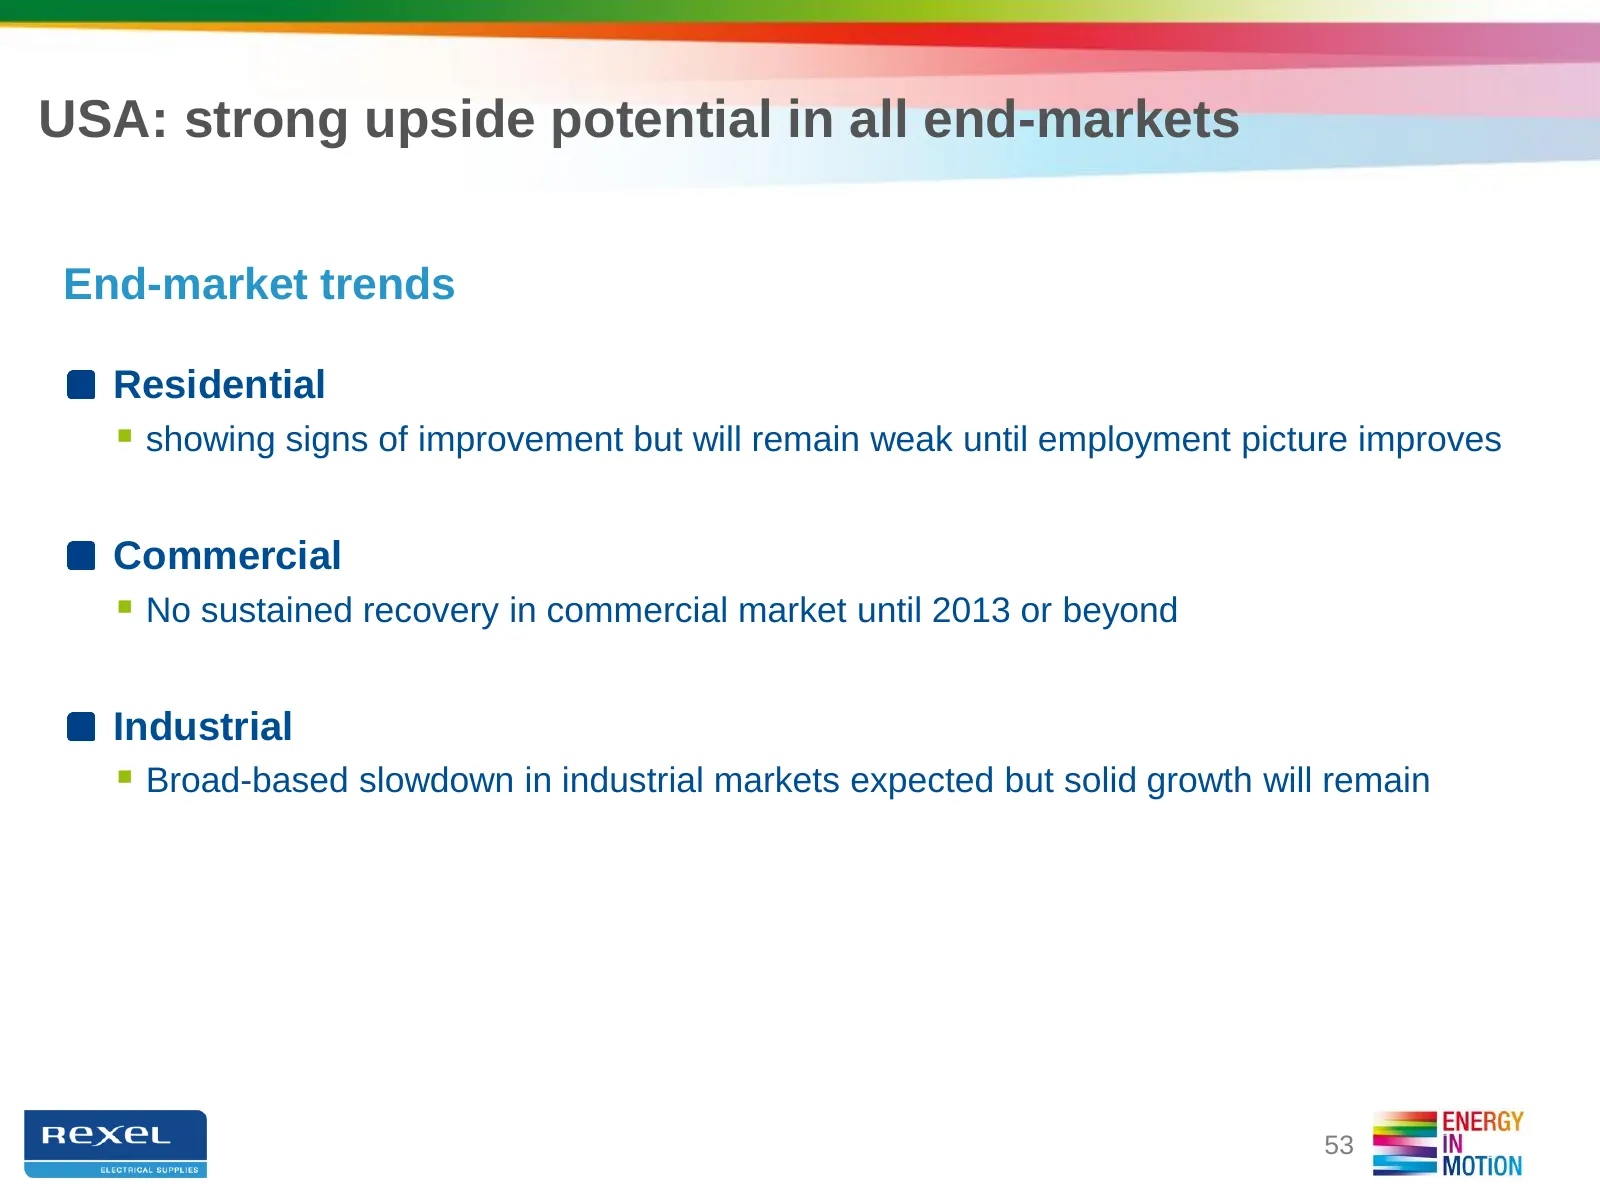
USA: strong upside potential in all end-markets End-market trends Residential showing signs of improvement but will remain weak until employment picture improves Commercial No sustained recovery in commercial market until 2013 or beyond Industrial Broad-based slowdown in industrial markets exp
Slide 54: USA: 2015 financial and productivity targets
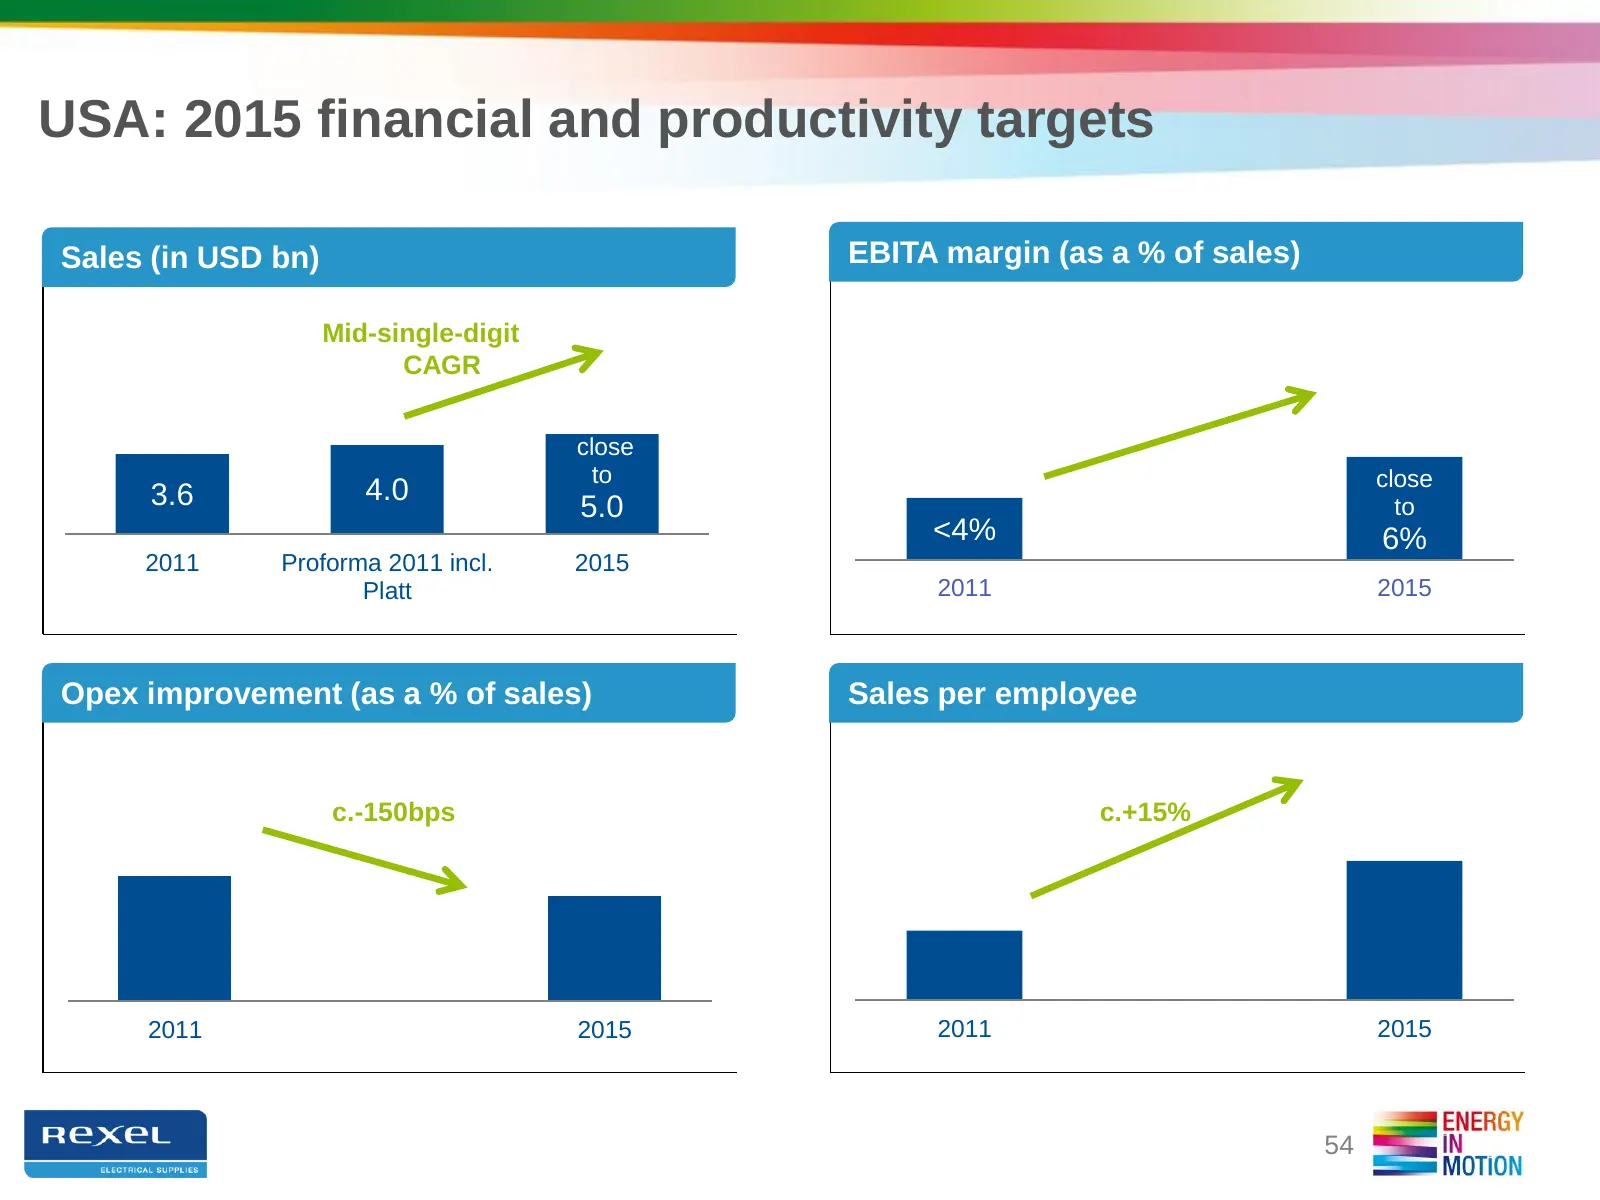
USA: 2015 financial and productivity targets Sales (in USD bn) EBITA margin (as a % of sales) Mid-single-digit CAGR close to close 3.6 4.0 5.0 to <4% 6% 2011 Proforma 2011 incl. 2015 Platt 2011 2015 Opex improvement (as a % of sales) Sales per employee c.-150bps c.+15% 2011 2015 2011 2015 54
Slide 55: Strategic acquisition of Platt Electric Supply in the US
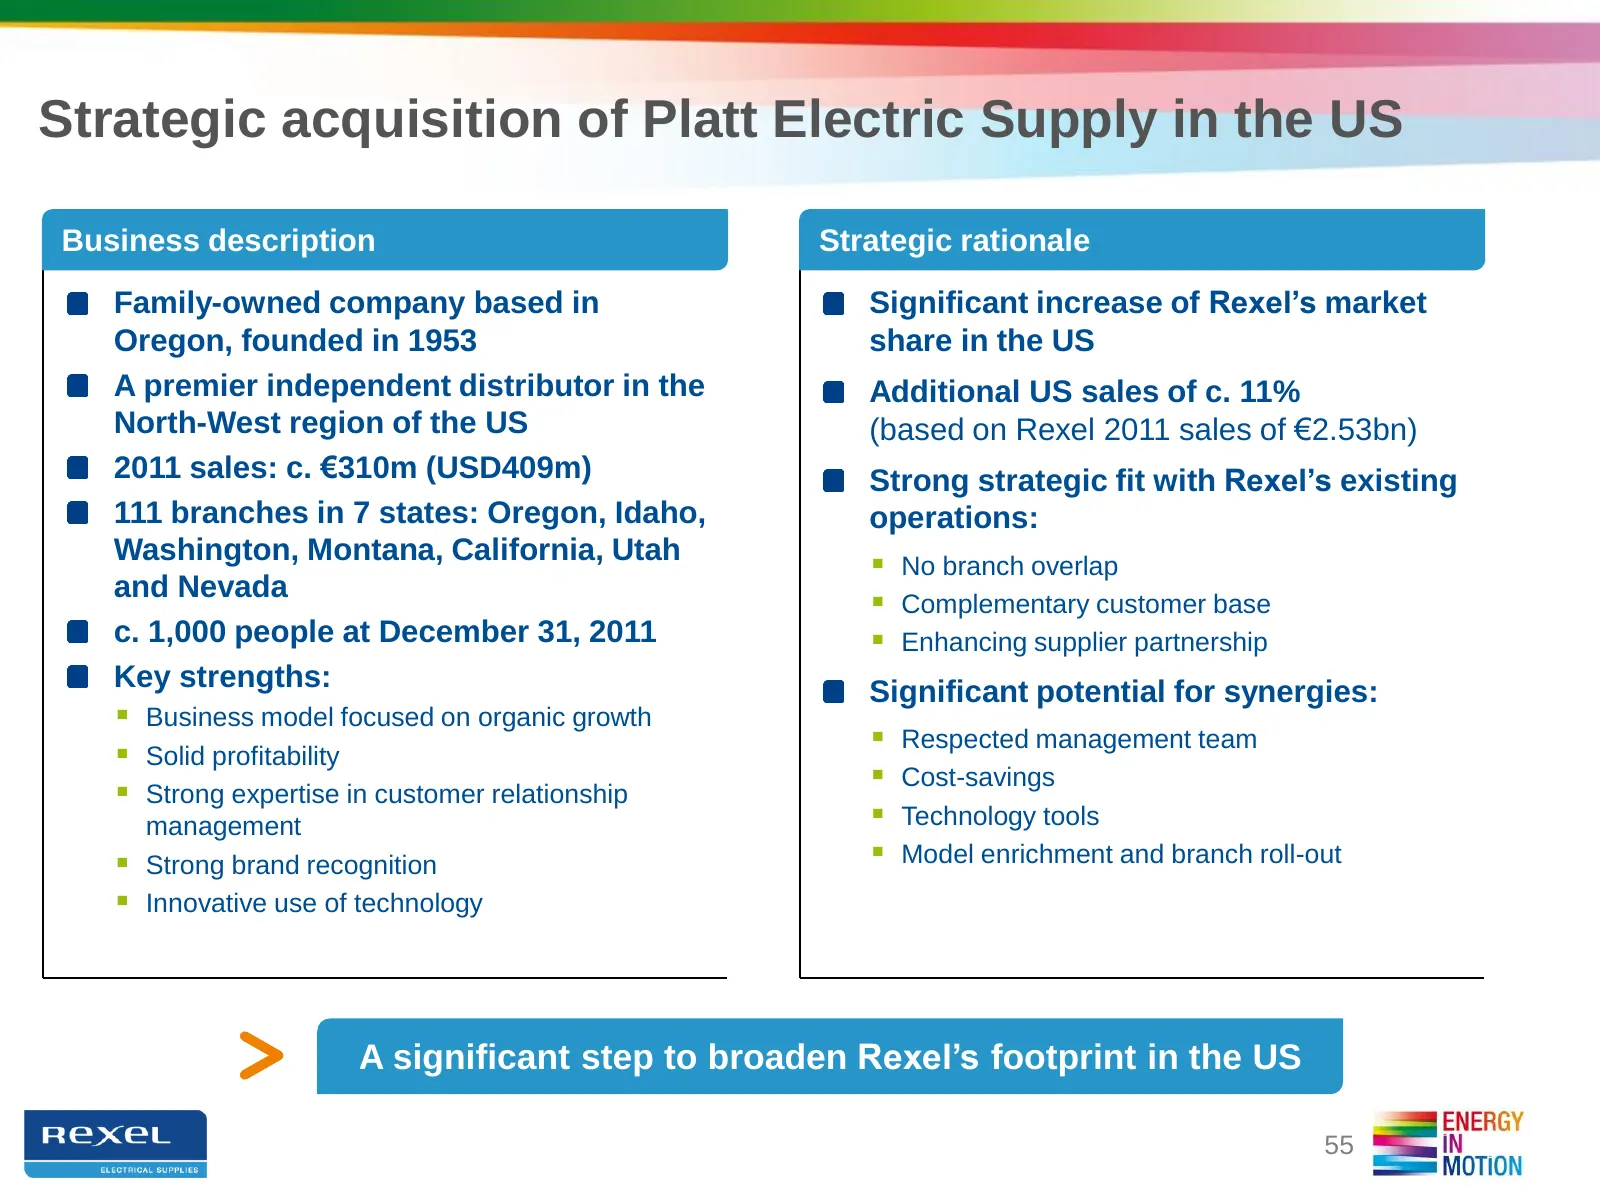
Strategic acquisition of Platt Electric Supply in the US Business description Strategic rationale Family-owned company based in Significant increase of Rexel’s market Oregon, founded in 1953 share in the US A premier independent distributor in the Additional US sales of c. 11% North-West region of t
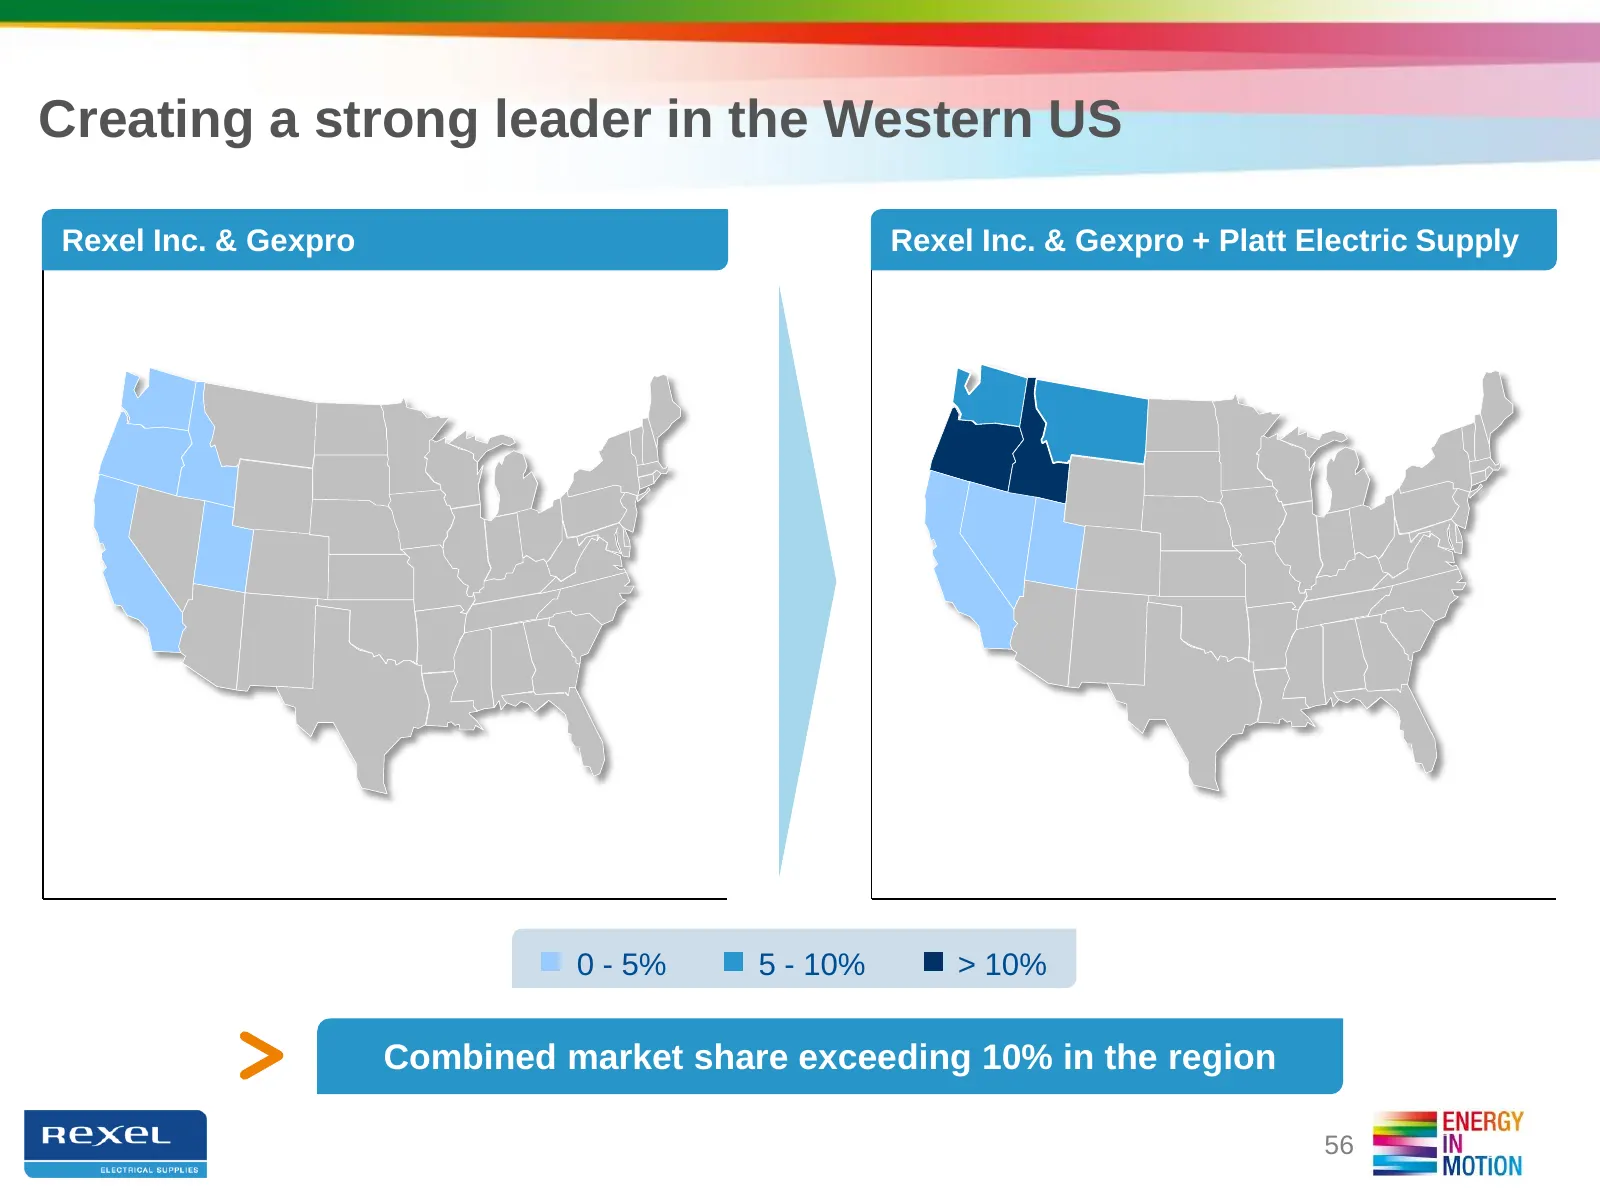
Slide 56: Creating a strong leader in the Western US
Creating a strong leader in the Western US Rexel Inc. & Gexpro Rexel Inc. & Gexpro + Platt Electric Supply 0 - 5% 5 - 10% > 10% Combined market share exceeding 10% in the region 56
Slide 57: Platt: an attractive acquisition in line with Rexel's strategy
Platt: an attractive acquisition in line with Rexel’s strategy Acquisition price: c. €300m Strong synergies representing at least 1.8% of acquired sales Cost synergies: mainly purchasing synergies and operating cost optimization Revenue synergies: mainly product offering and branches EV/EBITDA m
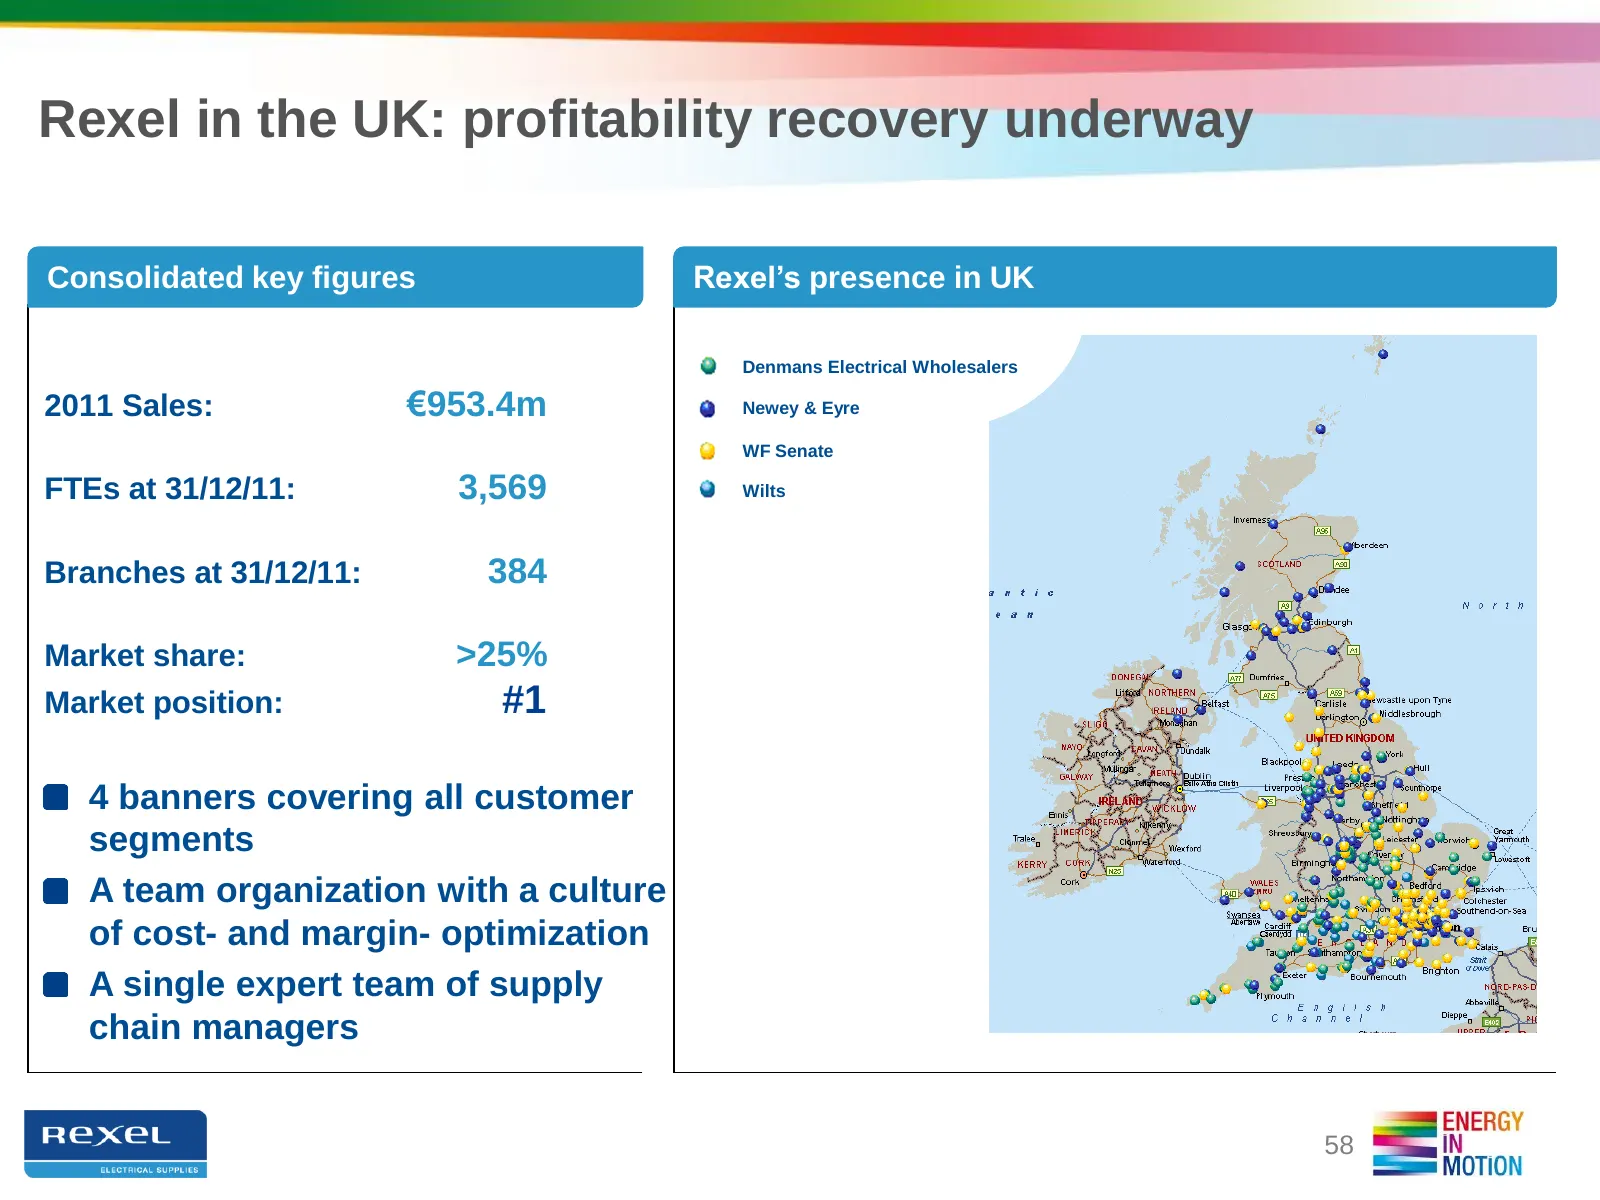
Slide 58: Rexel in the UK: profitability recovery underway
Rexel in the UK: profitability recovery underway Consolidated key figures Rexel’s presence in UK Denmans Electrical Wholesalers 2011 Sales: €953.4m Newey & Eyre WF Senate FTEs at 31/12/11: 3,569 Wilts Branches at 31/12/11: 384 Market share: >25% Market position: #1 4 banners covering all customer se
Slide 59: UK: a new significant step for 2015
UK: a new significant step for 2015 2015 ambitions Outperform the traditional market Excellence of service Market intelligence Differentiate offers New routes for market Focus on “high-entry ticket” segments Main position as an "Energy Solutions Provider" Building Automation Energy Effic
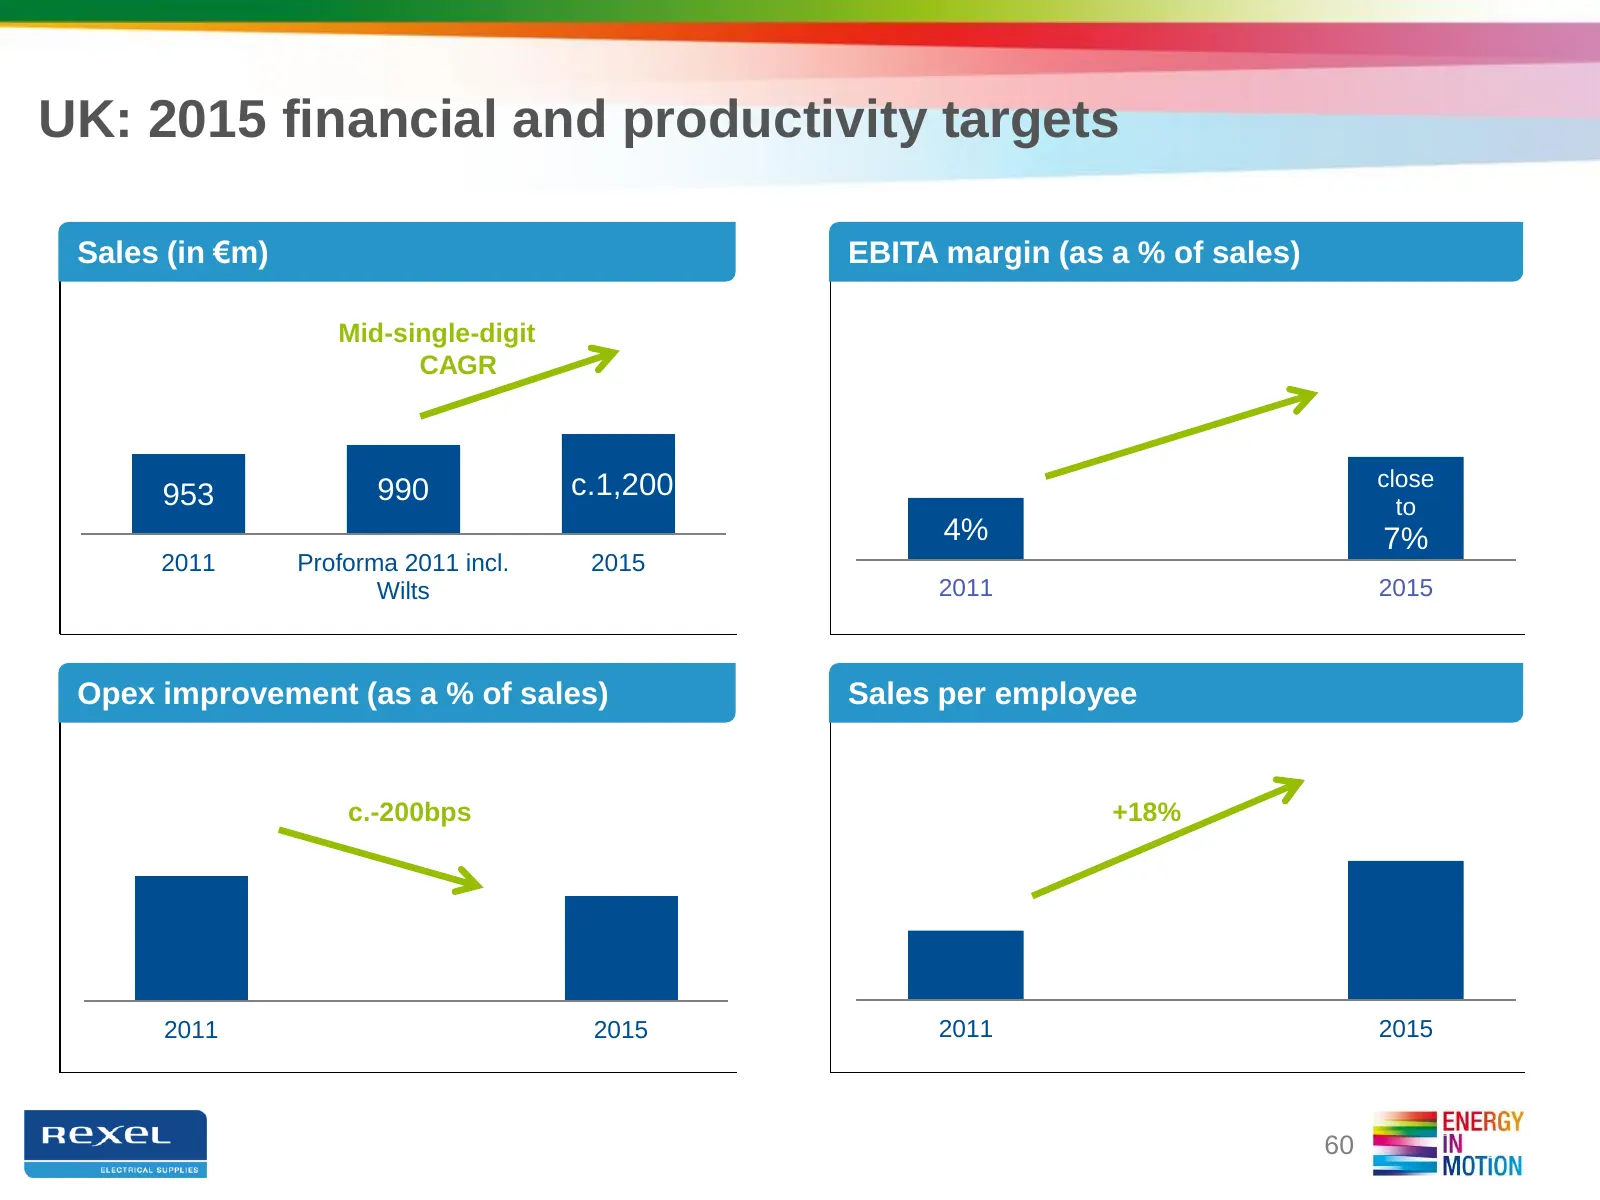
Slide 60: UK: 2015 financial and productivity targets
UK: 2015 financial and productivity targets Sales (in €m) EBITA margin (as a % of sales) Mid-single-digit CAGR c.1,200 close 953 990 to 4% 7% 2011 Proforma 2011 incl. 2015 Wilts 2011 2015 Opex improvement (as a % of sales) Sales per employee c.-200bps +18% 2011 2015 2011 2015 60

Slide 61: General Appendices
GENERAL APPENDICES
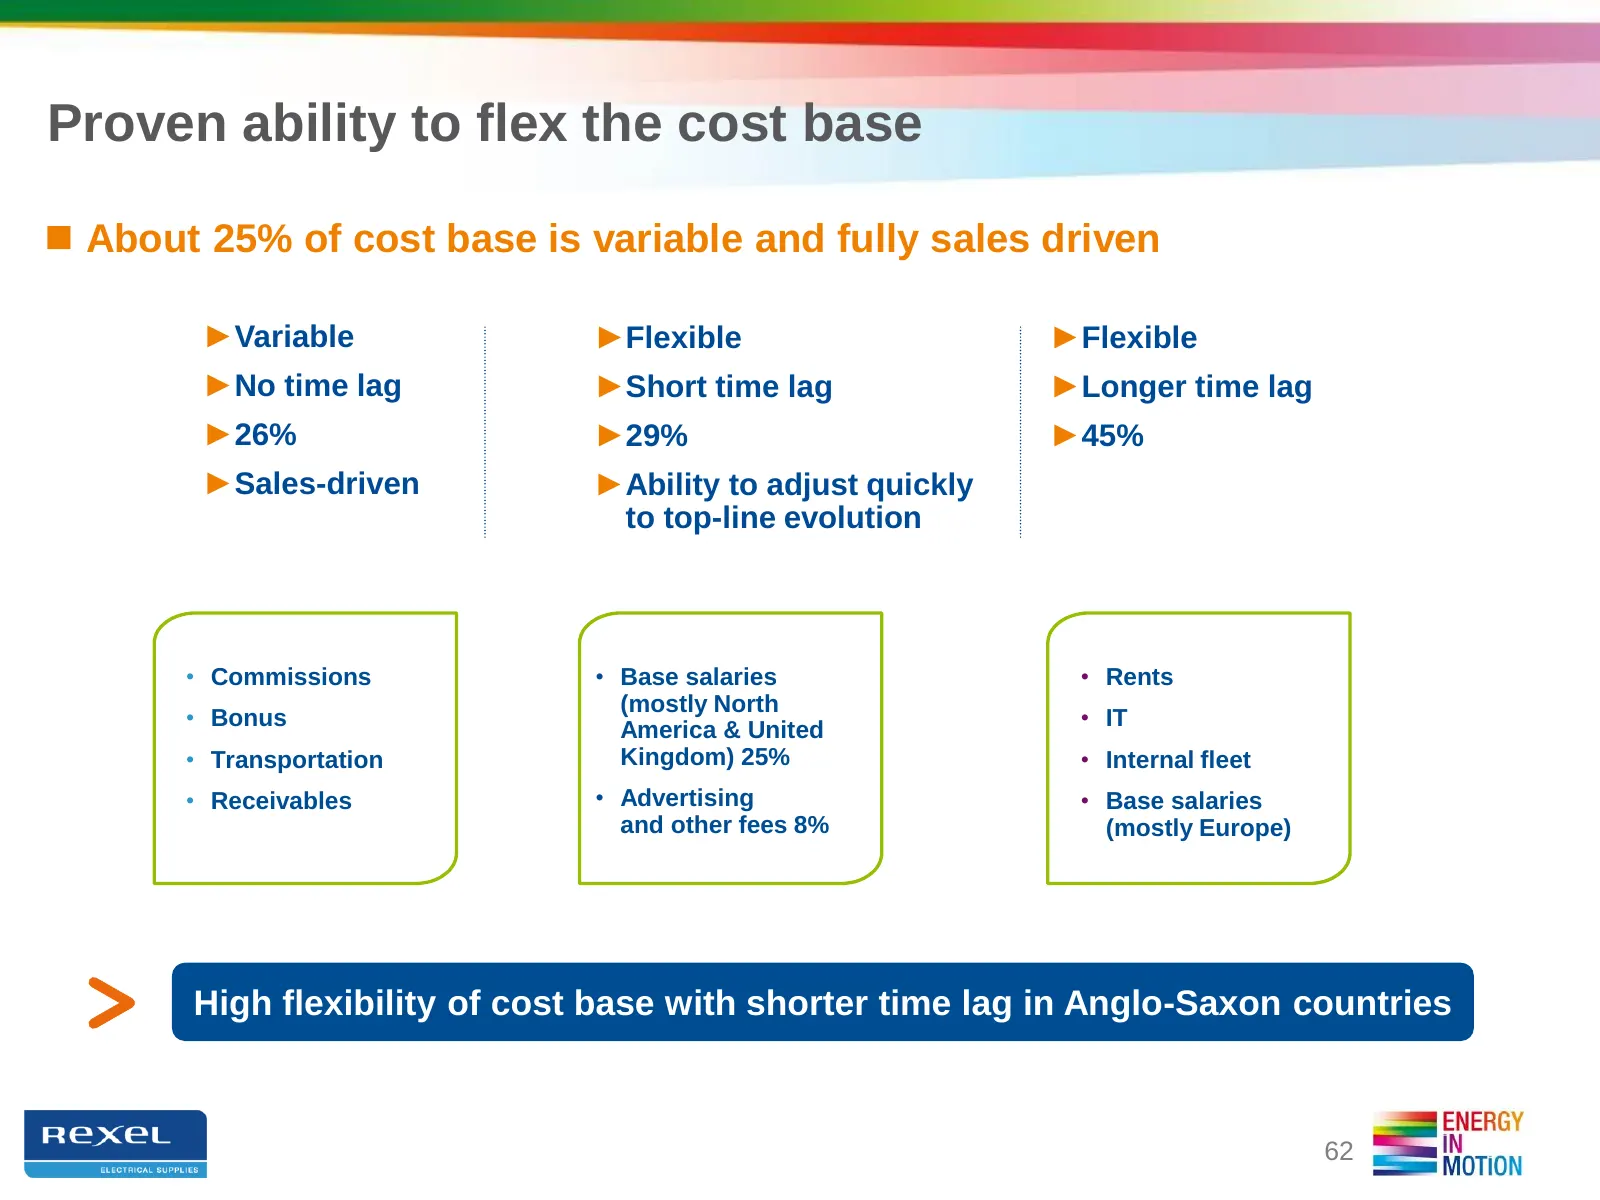
Slide 62: Proven ability to flex the cost base
Proven ability to flex the cost base About 25% of cost base is variable and fully sales driven ►Variable ►Flexible ►Flexible ►No time lag ►Short time lag ►Longer time lag ►26% ►29% ►45% ►Sales-driven ►Ability to adjust quickly to top-line evolution • Commissions • Base salaries • Rents (mostly Nor
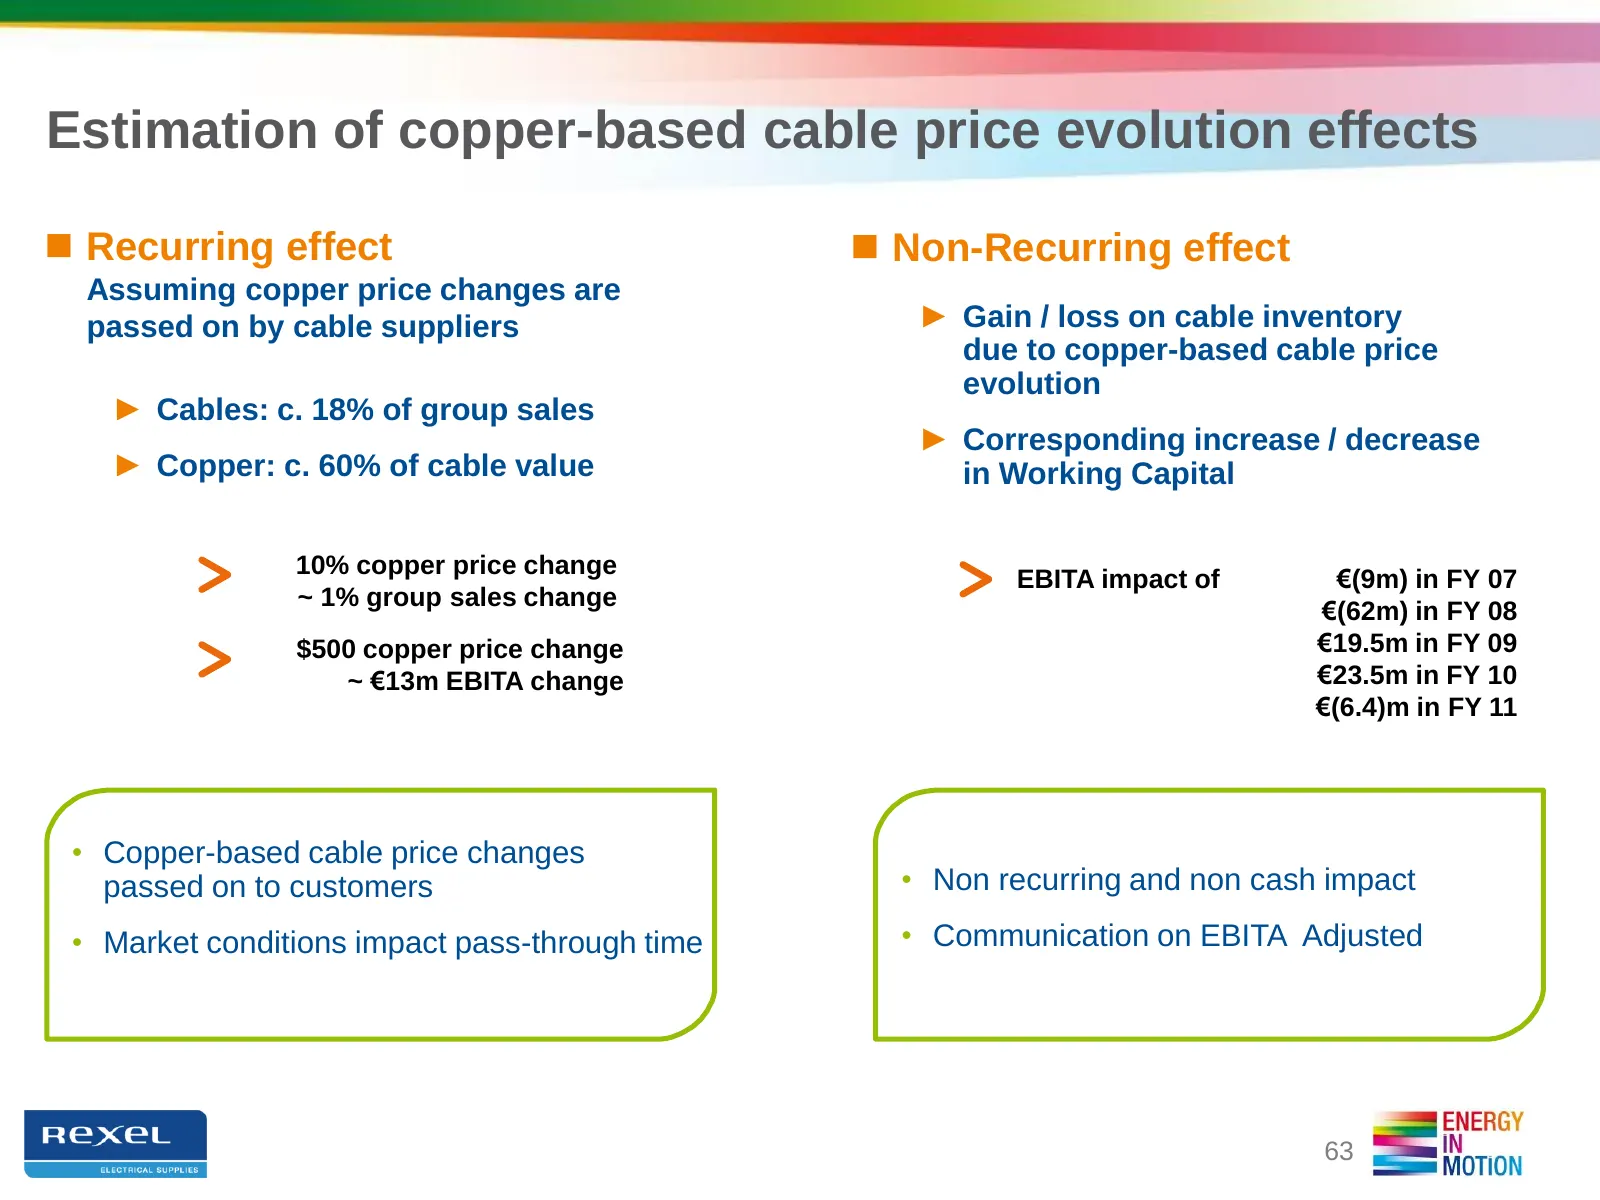
Slide 63: Estimation of copper-based cable price evolution effects
Estimation of copper-based cable price evolution effects Recurring effect Non-Recurring effect Assuming copper price changes are passed on by cable suppliers ► Gain / loss on cable inventory due to copper-based cable price evolution ► Cables: c. 18% of group sales ► Corresponding increase / decr
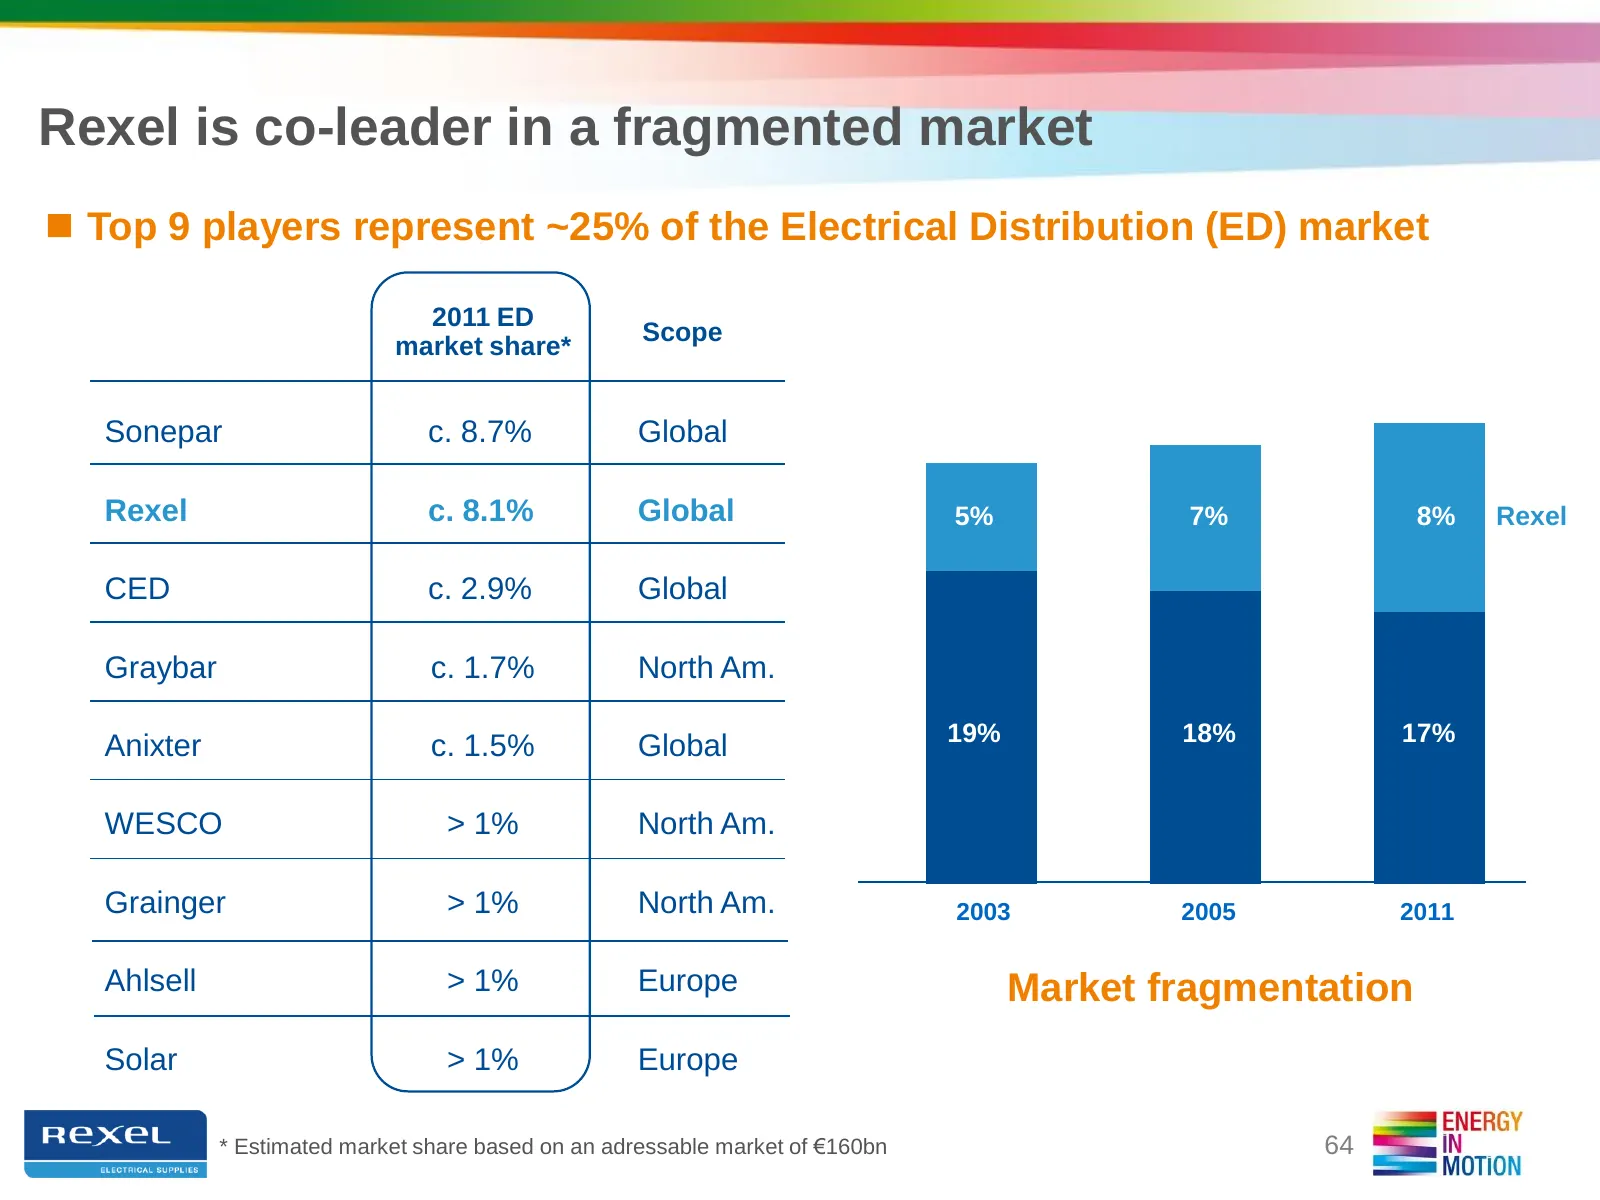
Slide 64: Rexel is co-leader in a fragmented market
Rexel is co-leader in a fragmented market Top 9 players represent ~25% of the Electrical Distribution (ED) market 2011 ED Scope market share* Sonepar c. 8.7% Global Rexel c. 8.1% Global 5% 7% 8% Rexel CED c. 2.9% Global Graybar c. 1.7% North Am. 19% 18% 17% Anixter c. 1.5% Global WESCO > 1% North
Slide 65: Ownership overview
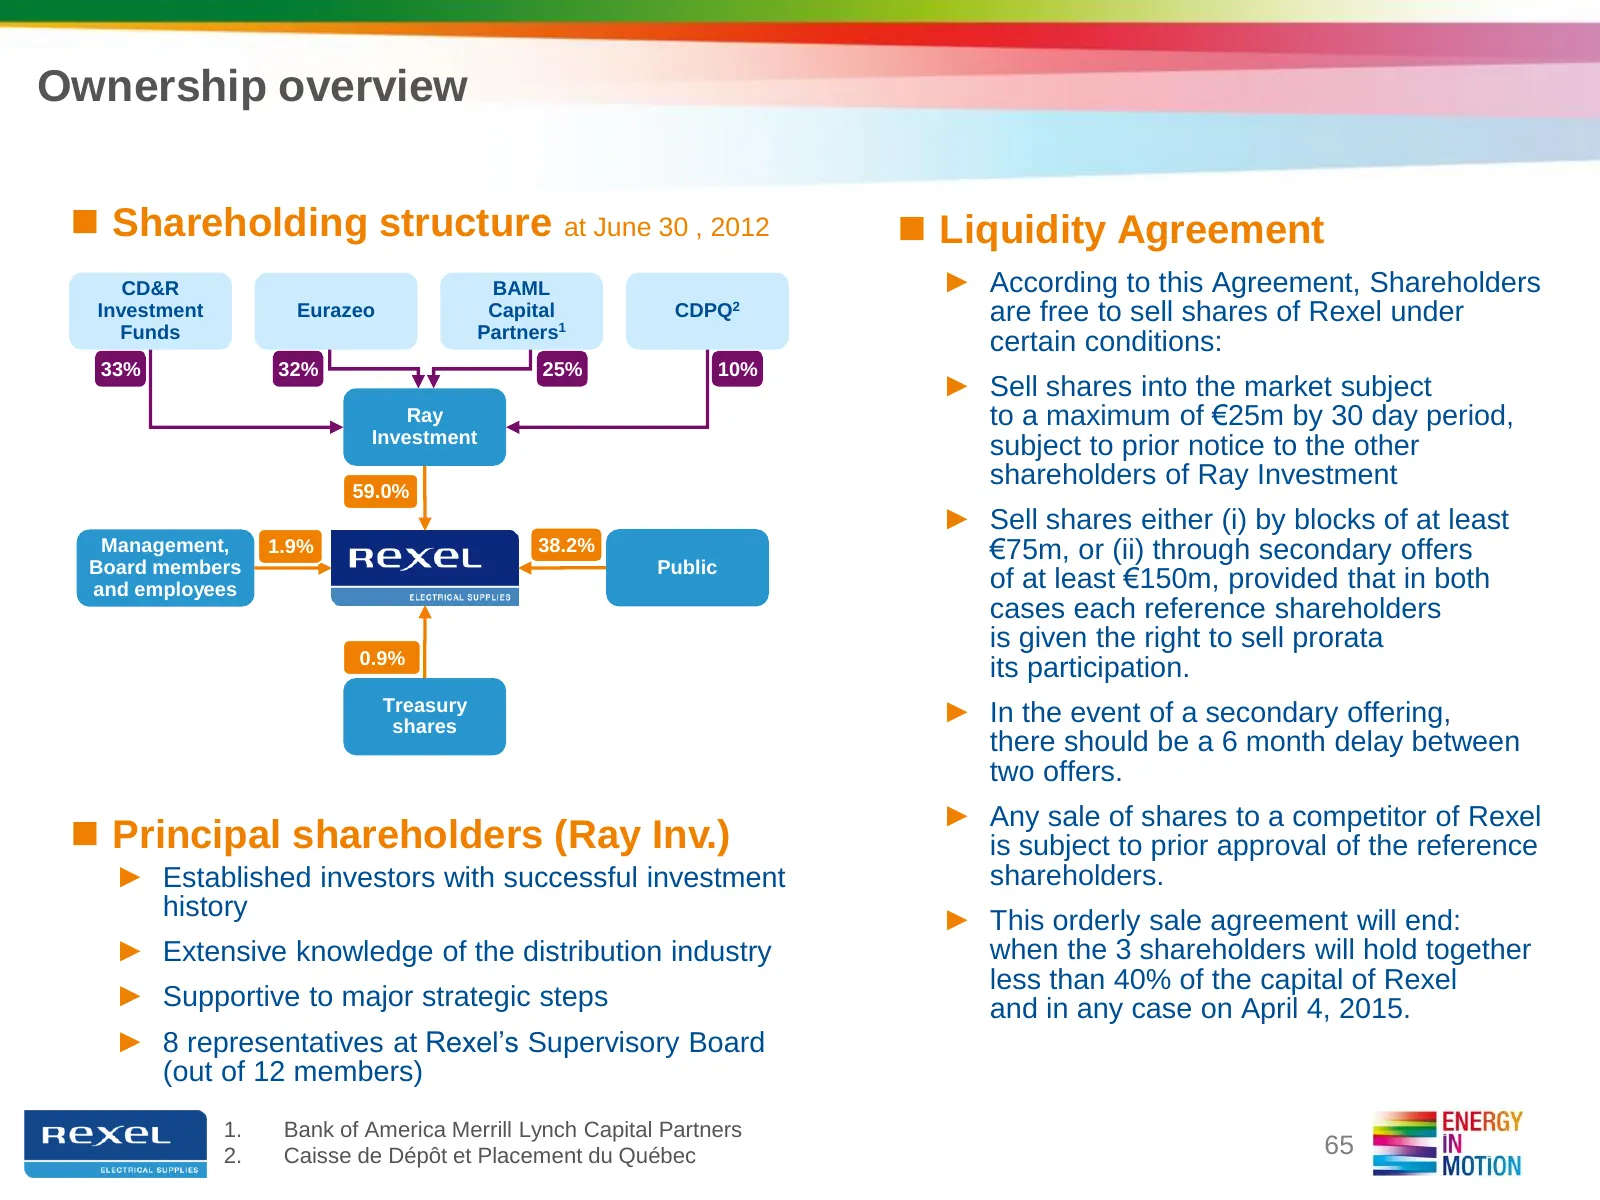
Ownership overview Shareholding structure at June 30 , 2012 Liquidity Agreement CD&R BAML ► According to this Agreement, Shareholders Investment Eurazeo Capital CDPQ2 are free to sell shares of Rexel under Funds Partners1 certain conditions: 33% 32% 25% 10% ► Sell shares into the market subject
Slide 66: Appendix 5: Senior Credit Agreement
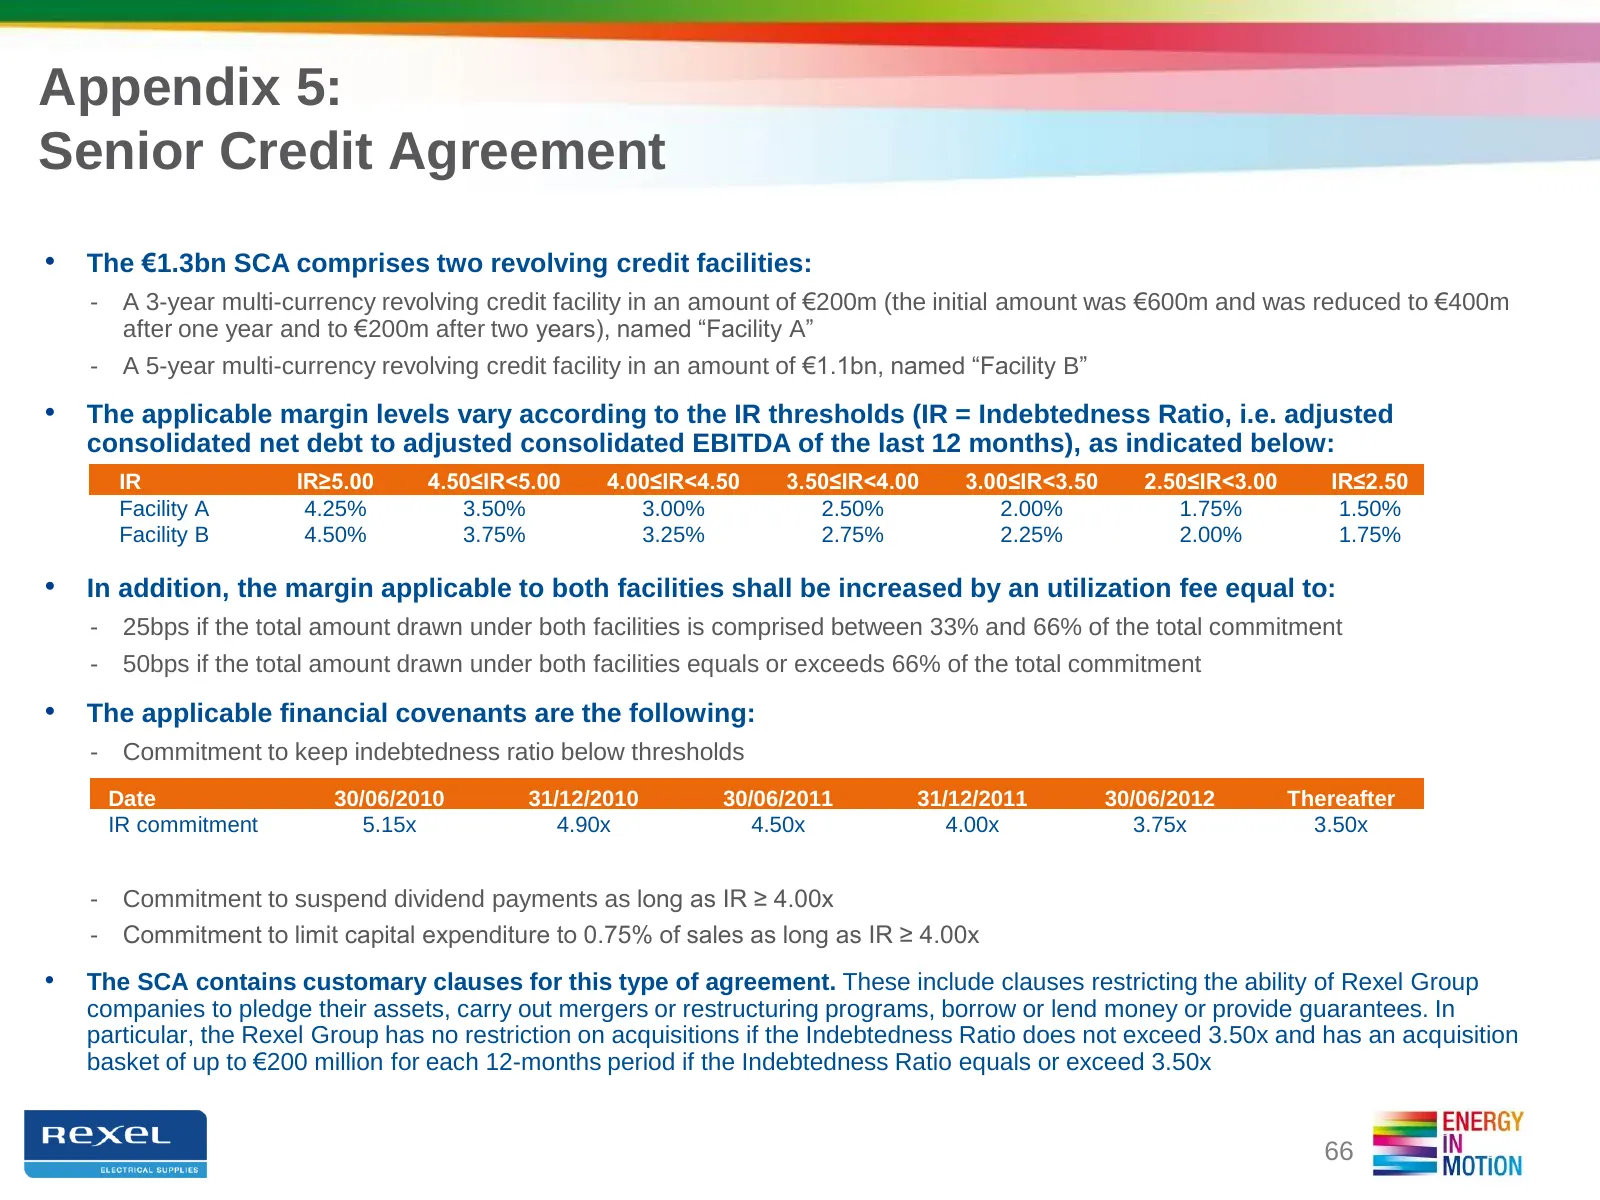
Appendix 5: Senior Credit Agreement • The €1.3bn SCA comprises two revolving credit facilities: - A 3-year multi-currency revolving credit facility in an amount of €200m (the initial amount was €600m and was reduced to €400m after one year and to €200m after two years), named “Facility A” - A 5-year
Slide 67: Appendix 7: Three-month Copper Price Evolution
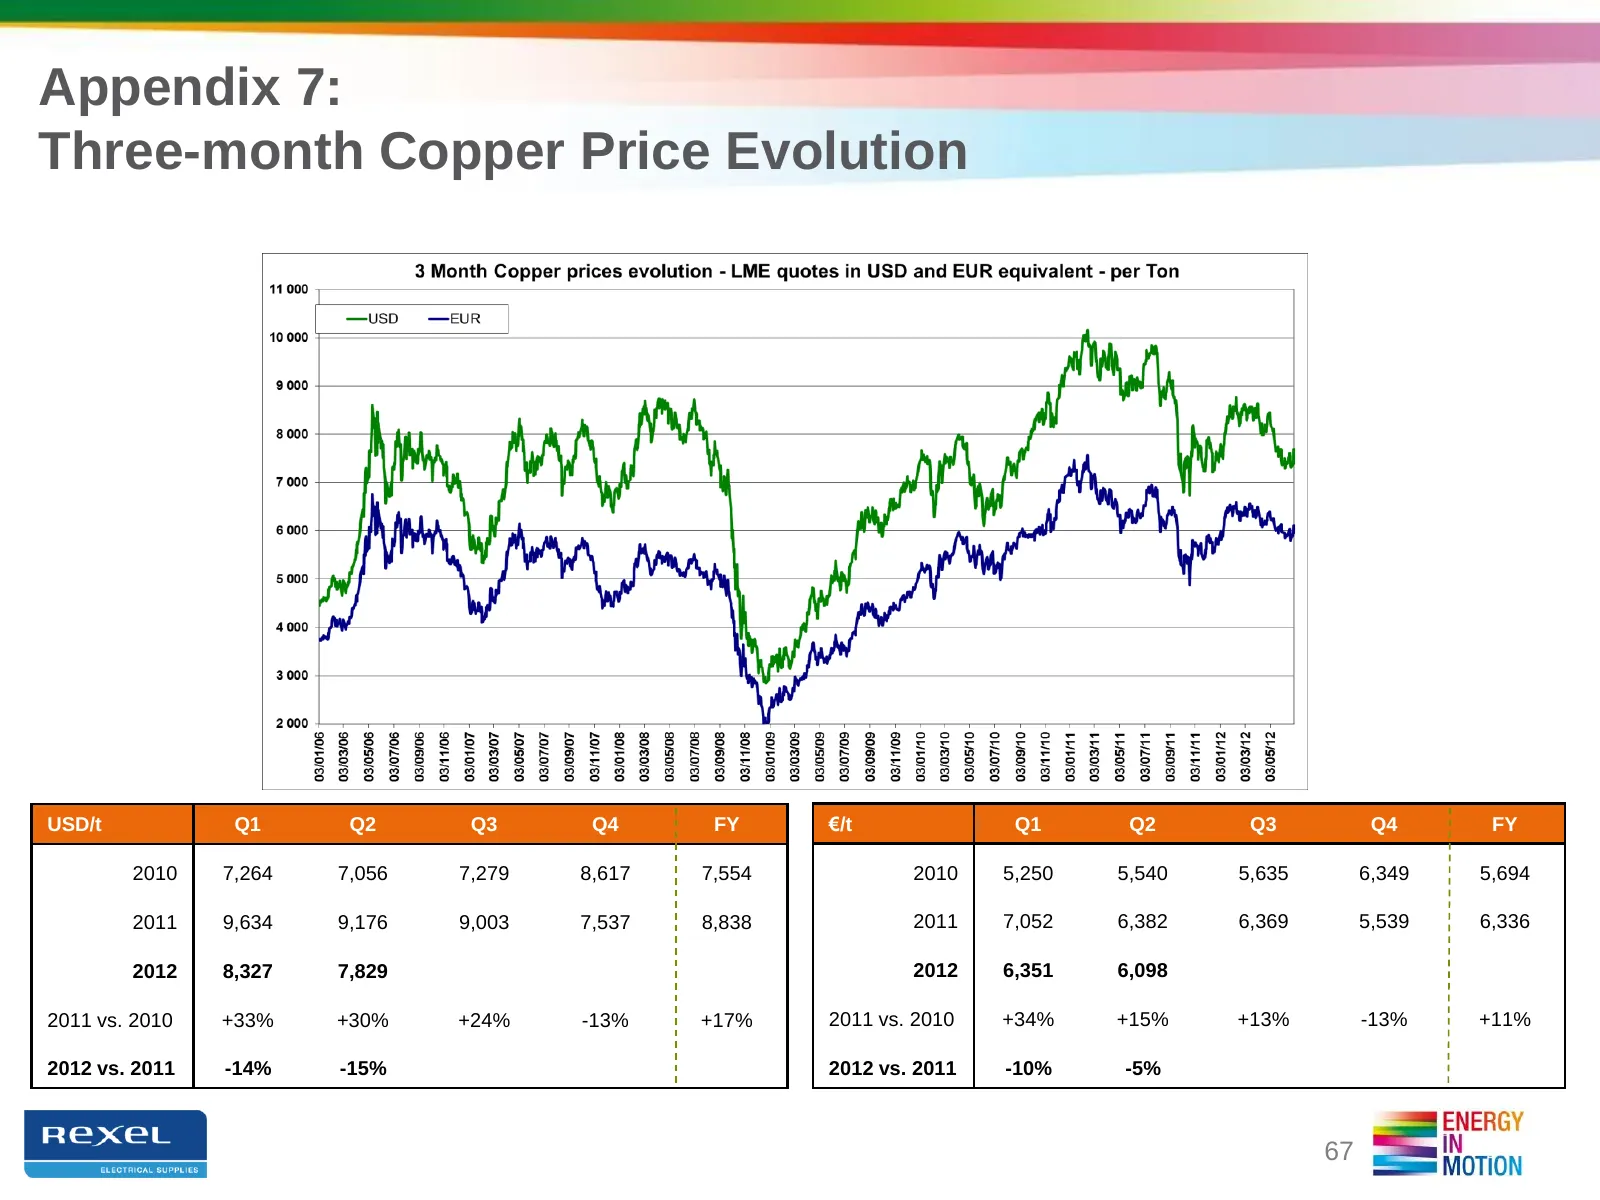
Appendix 7: Three-month Copper Price Evolution USD/t Q1 Q2 Q3 Q4 FY €/t Q1 Q2 Q3 Q4 FY 2010 7,264 7,056 7,279 8,617 7,554 2010 5,250 5,540 5,635 6,349 5,694 2011 9,634 9,176 9,003 7,537 8,838 2011 7,052 6,382 6,369 5,539 6,336 2012 8,327 7,829 2012 6,351 6,098 2011 vs. 2010 +33% +30% +24% -13% +17%

Slide 68: Financial Calendar & Contacts
FINANCIAL CALENDAR & CONTACTS
Slide 69: Financial Calendar and contacts
Financial Calendar and contacts Financial Calendar Contacts • October 31, 2012 • Investors & Analysts Third-quarter and 9-months 2012 results Marc MAILLET Tel: +33 1 42 85 76 12 Email: mmaillet@rexel.com Florence MEILHAC Tel: +33 1 42 85 57 61 Email: fmeilhac@rexel.com • Press Pénélope LINAGE-COHEN
Slide 70: Disclaimer
Disclaimer The Group is exposed to fluctuations in copper prices in connection with its distribution of cable products. Cables accounted for approximately 17% of the Group's sales, and copper accounts for approximately 60% of the composition of cables. This exposure is indirect since cable prices al
Source: Internet Archive copy of rexel.com
More decks from Rexel SA
 Q3 2026 Earnings Presentation13 slides · Oct 22, 2026
 Q2 2026 Earnings Presentation24 slides · Jul 27, 2026
 FY 2025 Earnings Presentation31 slides · Feb 11, 2026
 Q3 2025 Earnings Presentation15 slides · Oct 15, 2025
 Q2 2025 Earnings Presentation20 slides · Jul 28, 2025
 Q1 2025 Earnings Presentation16 slides · Apr 29, 2025