Navistar International Corporation
Navistar International — Q1 2017 Earnings Presentation
23 slides from Navistar International's earnings presentation, Mar 7, 2017
Slide 1: Q1 2017 Earnings Presentation
Q1 2017 EARNINGS PRESENTATION March 7, 2017 Exhibit 99.2
Slide 2: Safe Harbor Statement and Other Cautionary Notes
Safe Harbor Statement and Other Cautionary Notes Information provided and statements contained in this presentation that are not purely historical are forward-looking statements within the meaning of the federal securities laws. Such forward-looking statements only speak as of the date of this prese
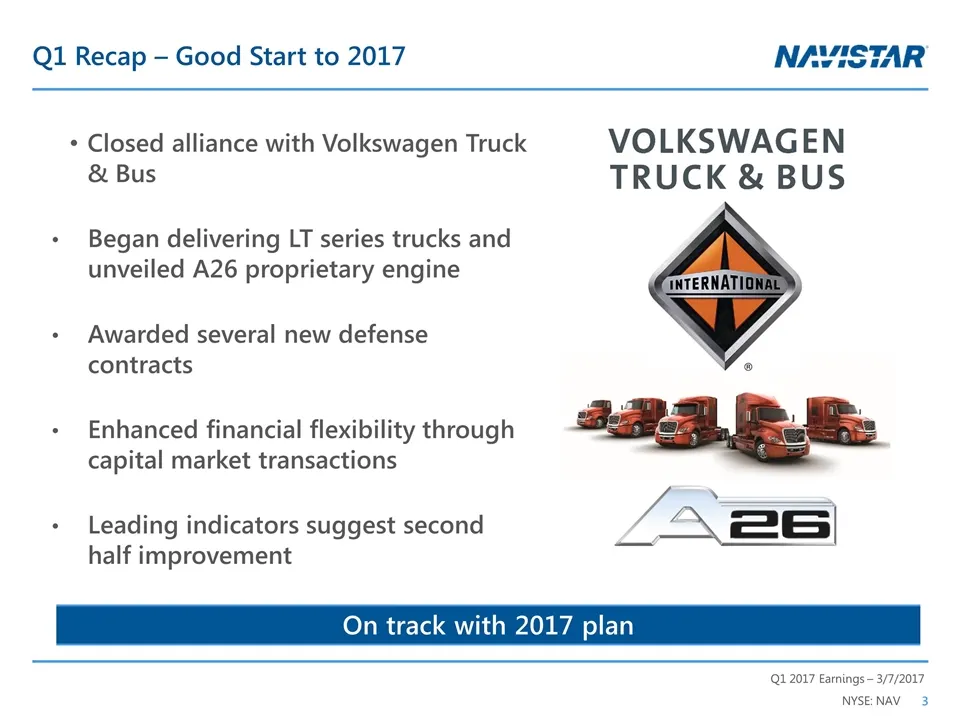
Slide 3: Q1 Recap – Good Start to 2017
Q1 Recap – Good Start to 2017 Closed alliance with Volkswagen Truck & Bus Began delivering LT series trucks and unveiled A26 proprietary engine Awarded several new defense contracts Enhanced financial flexibility through capital market transactions Leading indicators suggest second half improvement
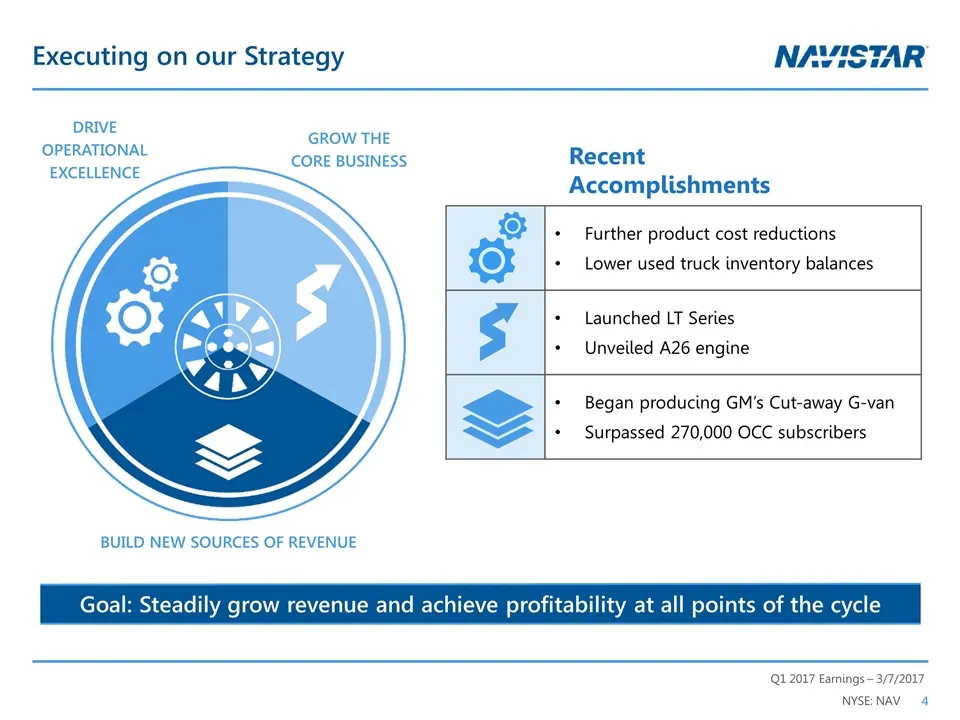
Slide 4: Executing on our Strategy
Executing on our Strategy GROW THE CORE BUSINESS DRIVE OPERATIONAL EXCELLENCE BUILD NEW SOURCES OF REVENUE Goal: Steadily grow revenue and achieve profitability at all points of the cycle Further product cost reductions Lower used truck inventory balances Launched LT Series Unveiled A26 engine Began
Slide 5: Steady Cadence of New Product Introductions
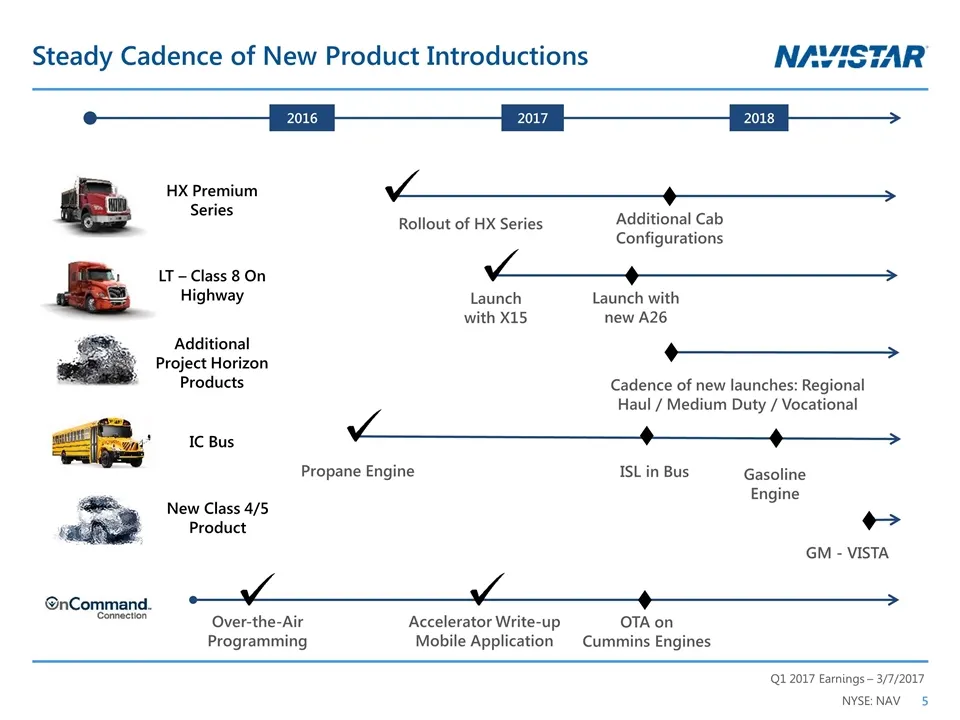
2016 Steady Cadence of New Product Introductions Launch with new A26 LT – Class 8 On Highway Launch with X15 Propane Engine IC Bus Gasoline Engine New Class 4/5 Product GM - VISTA HX Premium Series Additional Project Horizon Products Cadence of new launches: Regional Haul / Medium Duty / Vocational
Slide 6: Weathering Weaker Industry Conditions
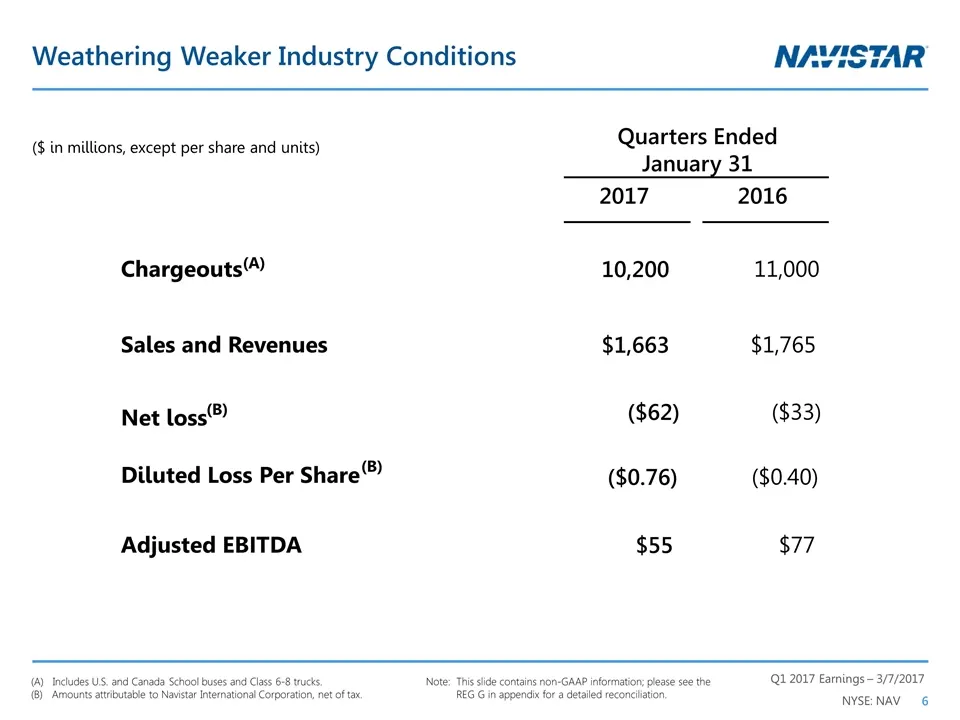
Weathering Weaker Industry Conditions Note:This slide contains non-GAAP information; please see the REG G in appendix for a detailed reconciliation. (A) Includes U.S. and Canada School buses and Class 6-8 trucks. (B) Amounts attributable to Navistar International Corporation, net of tax. Chargeouts
Slide 7: First Quarter Segment Results
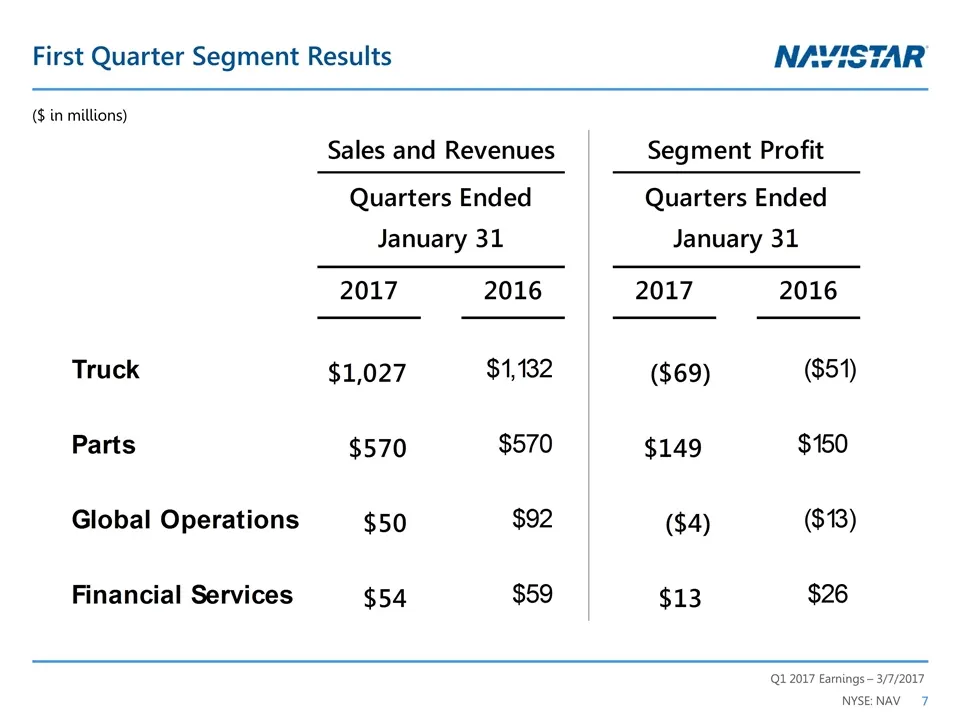
First Quarter Segment Results ($ in millions)
Slide 8: Lower Used Truck Inventories
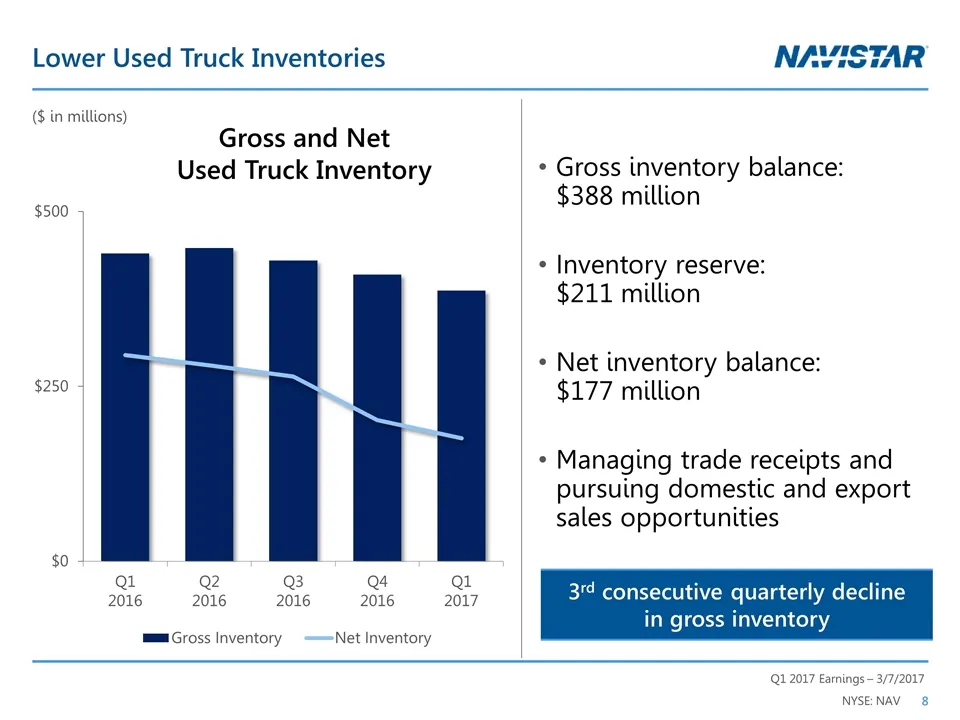
Lower Used Truck Inventories Gross inventory balance: $388 million Inventory reserve: $211 million Net inventory balance: $177 million Managing trade receipts and pursuing domestic and export sales opportunities Gross and Net Used Truck Inventory ($ in millions) 3rd consecutive quarterly decline in
Slide 9: Improving Financial Flexibility
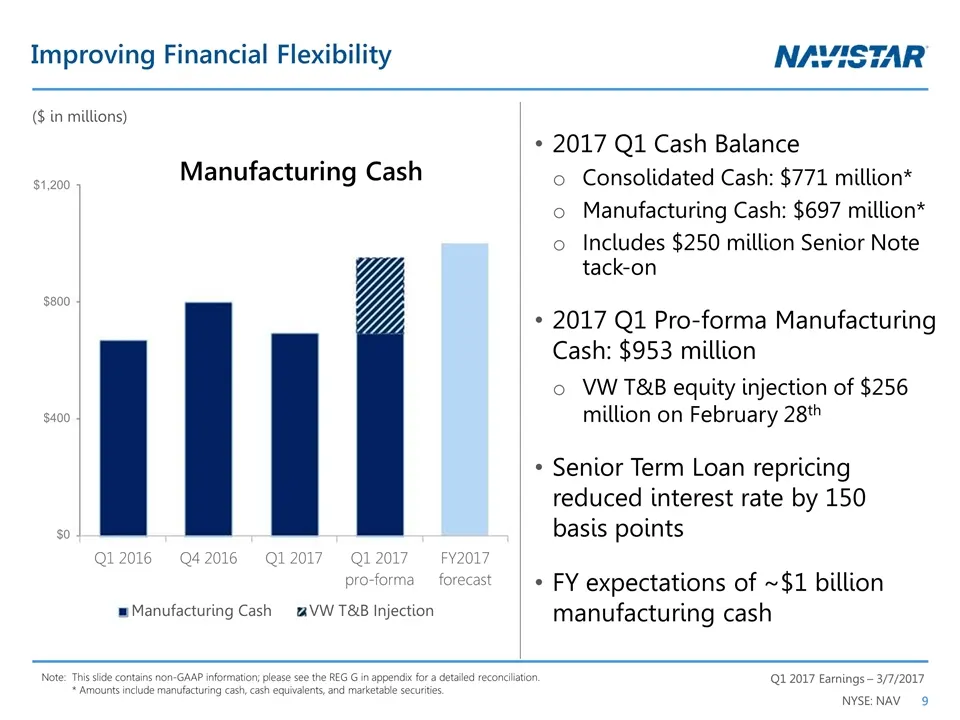
Improving Financial Flexibility 2017 Q1 Cash Balance Consolidated Cash: $771 million* Manufacturing Cash: $697 million* Includes $250 million Senior Note tack-on 2017 Q1 Pro-forma Manufacturing Cash: $953 million VW T&B equity injection of $256 million on February 28th Senior Term Loan repricing red
Slide 10: Guidance Summary
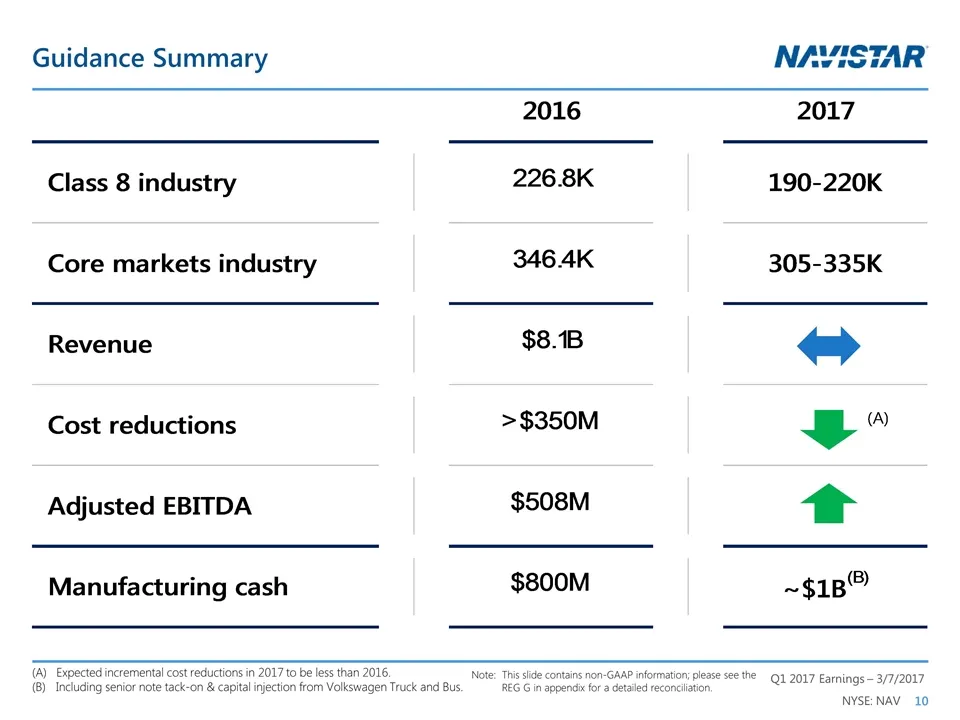
Guidance Summary (A) Expected incremental cost reductions in 2017 to be less than 2016. (B)Including senior note tack-on & capital injection from Volkswagen Truck and Bus. Note:This slide contains non-GAAP information; please see the REG G in appendix for a detailed reconciliation.
Slide 11: Appendix
Appendix NAVISTAR
Slide 12: U.S. and Canada Dealer Stock Inventory
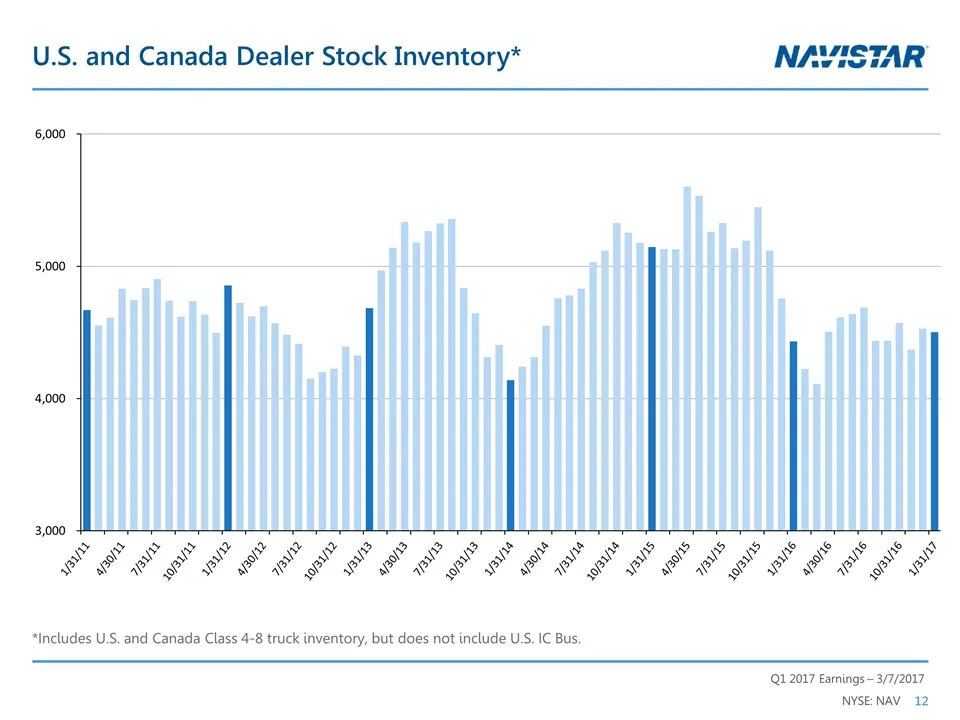
U.S. and Canada Dealer Stock Inventory* *Includes U.S. and Canada Class 4-8 truck inventory, but does not include U.S. IC Bus.
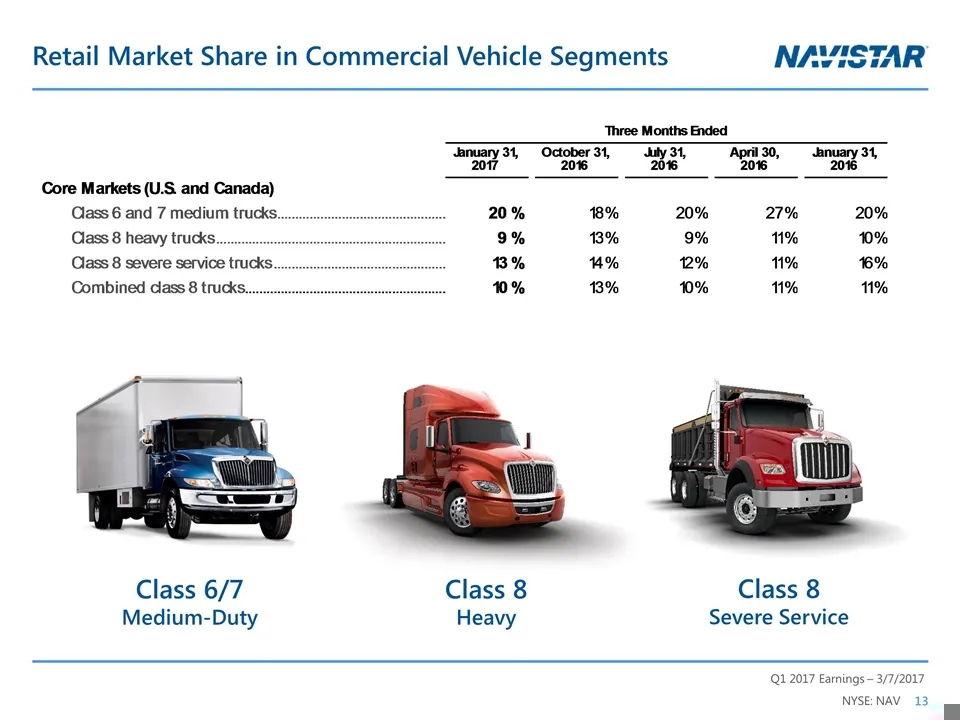
Slide 13: Retail Market Share in Commercial Vehicle Segments
Retail Market Share in Commercial Vehicle Segments Class 6/7 Medium-Duty Class 8 Severe Service Class 8 Heavy
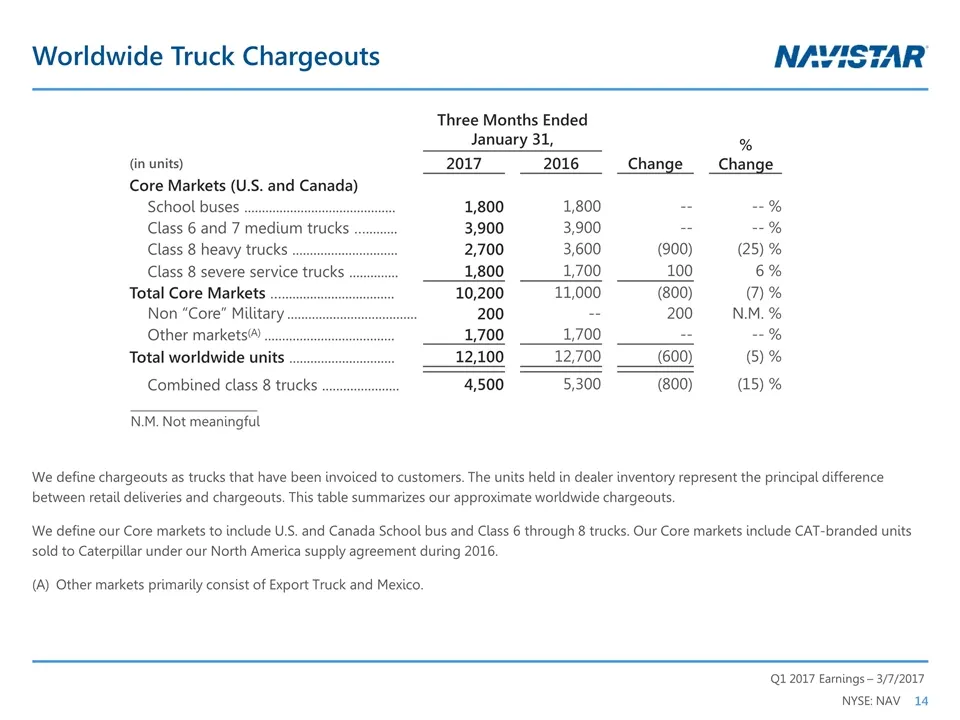
Slide 14: Worldwide Truck Chargeouts
Worldwide Truck Chargeouts We define chargeouts as trucks that have been invoiced to customers. The units held in dealer inventory represent the principal difference between retail deliveries and chargeouts. This table summarizes our approximate worldwide chargeouts. We define our Core markets to in
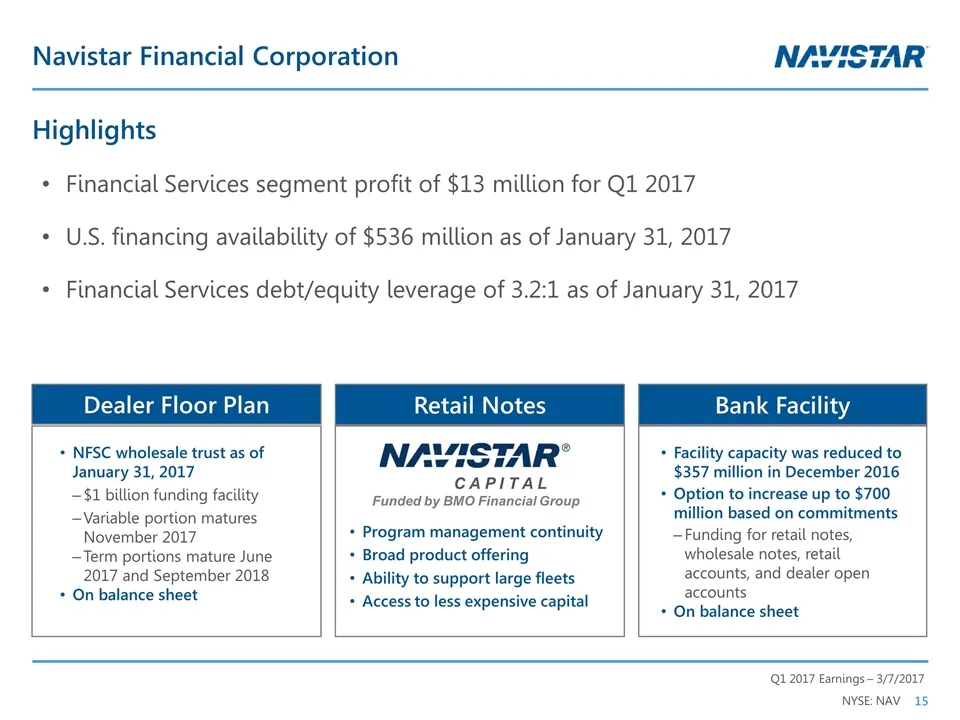
Slide 15: Navistar Financial Corporation Highlights
Navistar Financial Corporation Highlights Financial Services segment profit of $13 million for Q1 2017 U.S. financing availability of $536 million as of January 31, 2017 Financial Services debt/equity leverage of 3.2:1 as of January 31, 2017 Retail Notes Bank Facility Dealer Floor Plan Facility capa
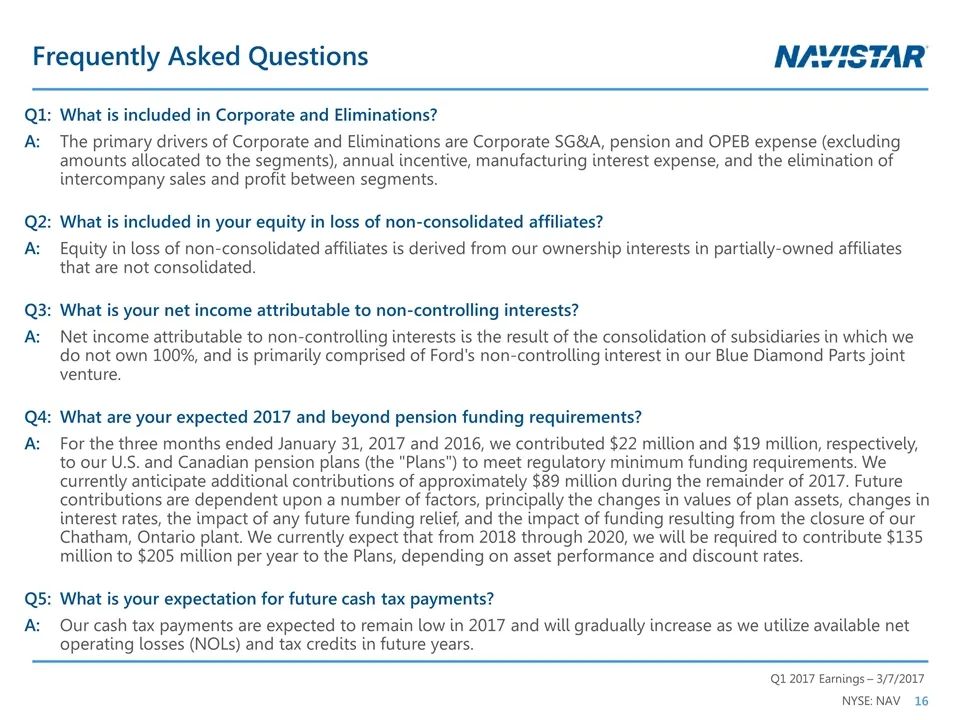
Slide 16: Frequently Asked Questions
Frequently Asked Questions Q1: What is included in Corporate and Eliminations? A:The primary drivers of Corporate and Eliminations are Corporate SG&A, pension and OPEB expense (excluding amounts allocated to the segments), annual incentive, manufacturing interest expense, and the elimination of inte
Slide 17: Frequently Asked Questions
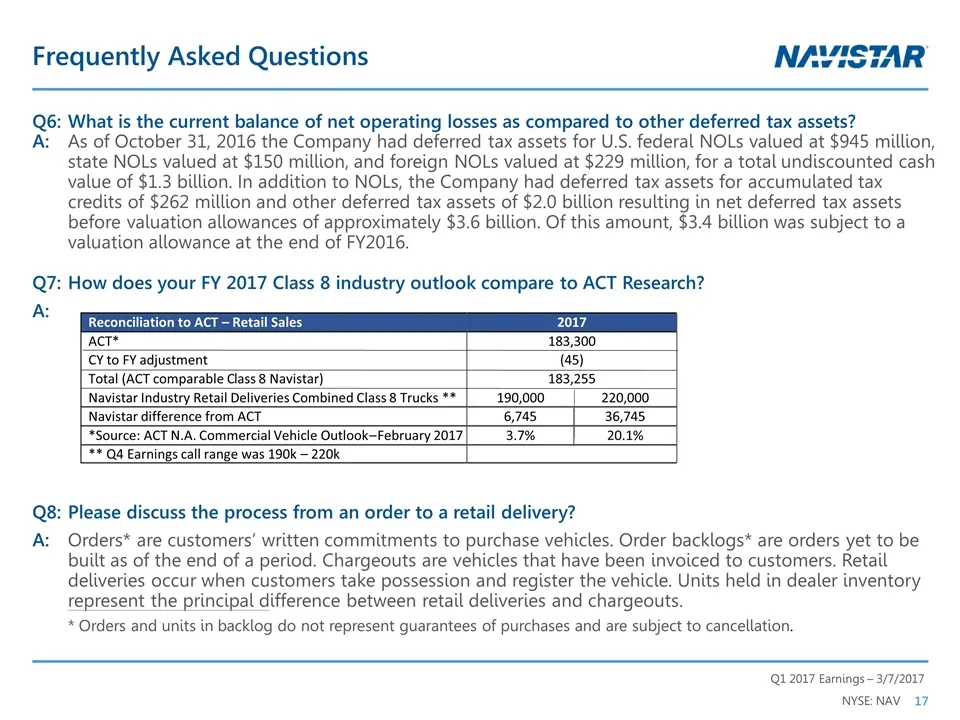
Frequently Asked Questions Q6:What is the current balance of net operating losses as compared to other deferred tax assets? A: As of October 31, 2016 the Company had deferred tax assets for U.S. federal NOLs valued at $945 million, state NOLs valued at $150 million, and foreign NOLs valued at $229 m
Slide 18: Frequently Asked Questions
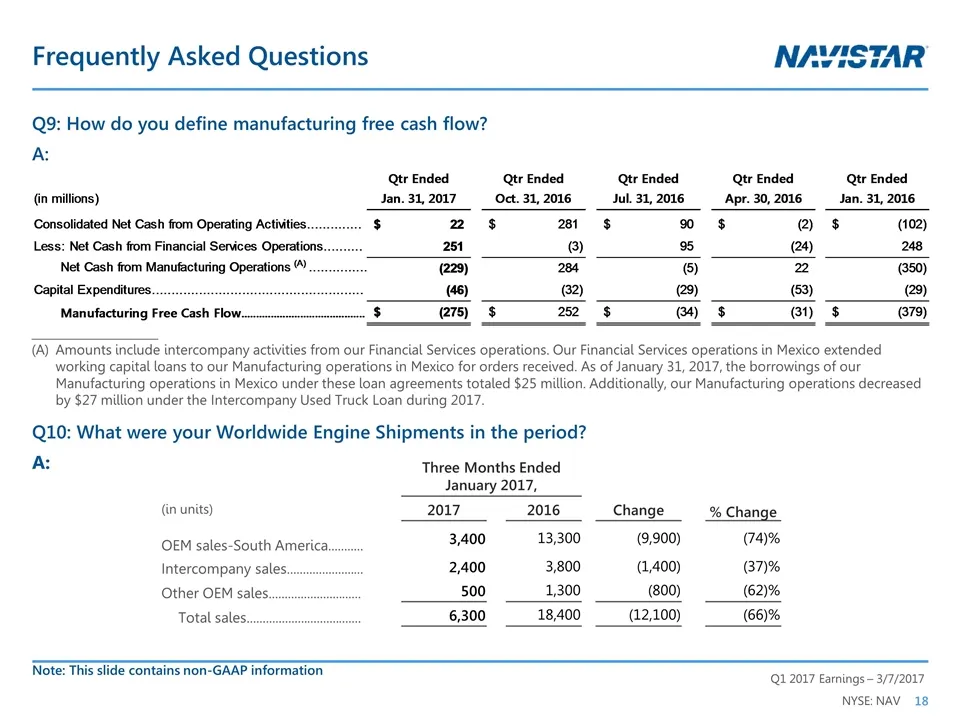
Three Months Ended January 2017, % Change (in units) 2017 2016 Change OEM sales-South America........... 3,400 13,300 (9,900) (74)% Intercompany sales........................ 2,400 3,800 (1,400) (37)% Other OEM sales............................. 500 1,300 (800) (62)% Total sales.....................
Slide 19: Outstanding Debt Balances
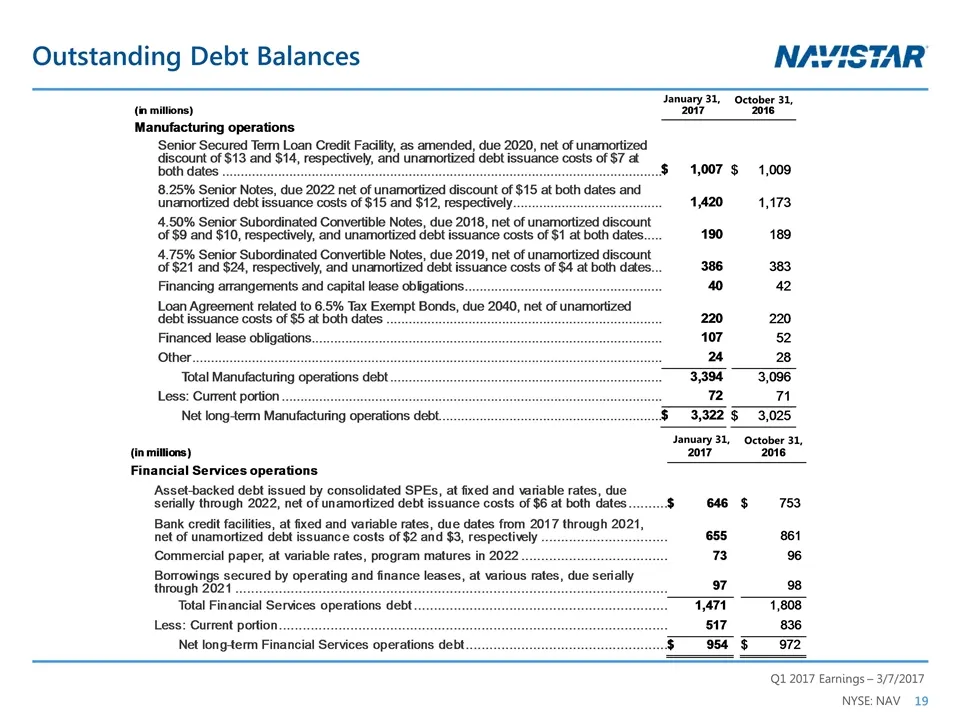
Outstanding Debt Balances January 31, October 31, January 31, October 31,(in millions)20172016Manufacturing operationsSenior Secured Term Loan Credit Facility, as amended, due 2020, net of unamortized discount of $13 and $14, respectively, and unamortized debt issuance costs of $7 at both dates$ 1,0
Slide 20: SEC Regulation G Non-GAAP Reconciliation
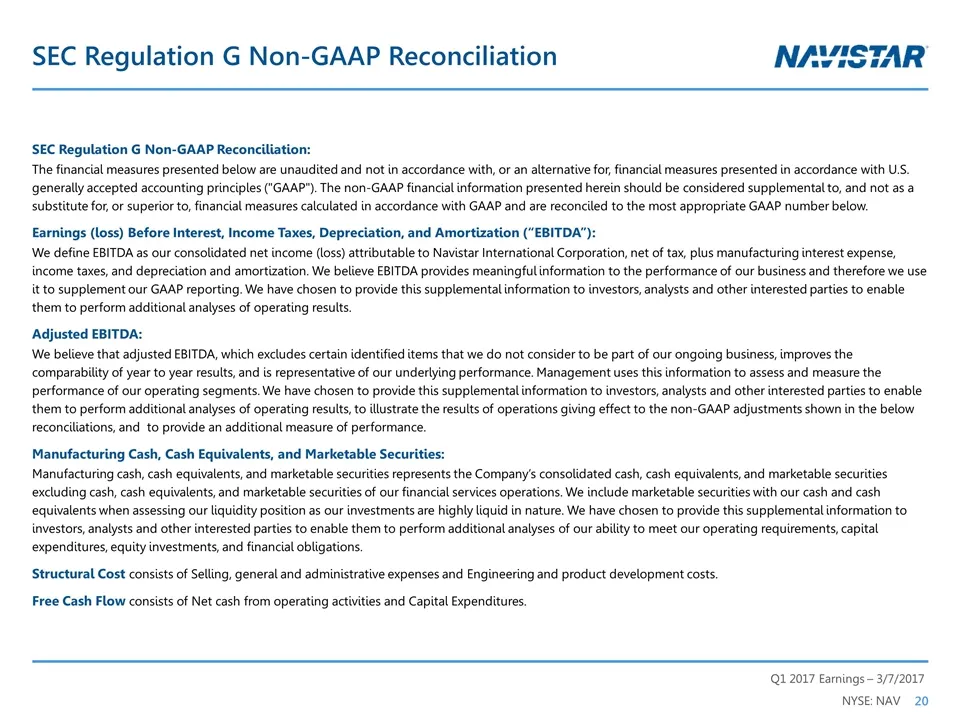
SEC Regulation G Non-GAAP Reconciliation SEC Regulation G Non-GAAP Reconciliation: The financial measures presented below are unaudited and not in accordance with, or an alternative for, financial measures presented in accordance with U.S. generally accepted accounting principles ("GAAP"). The non-G
Slide 21: Manufacturing Cash and Marketable Securities Reconciliation
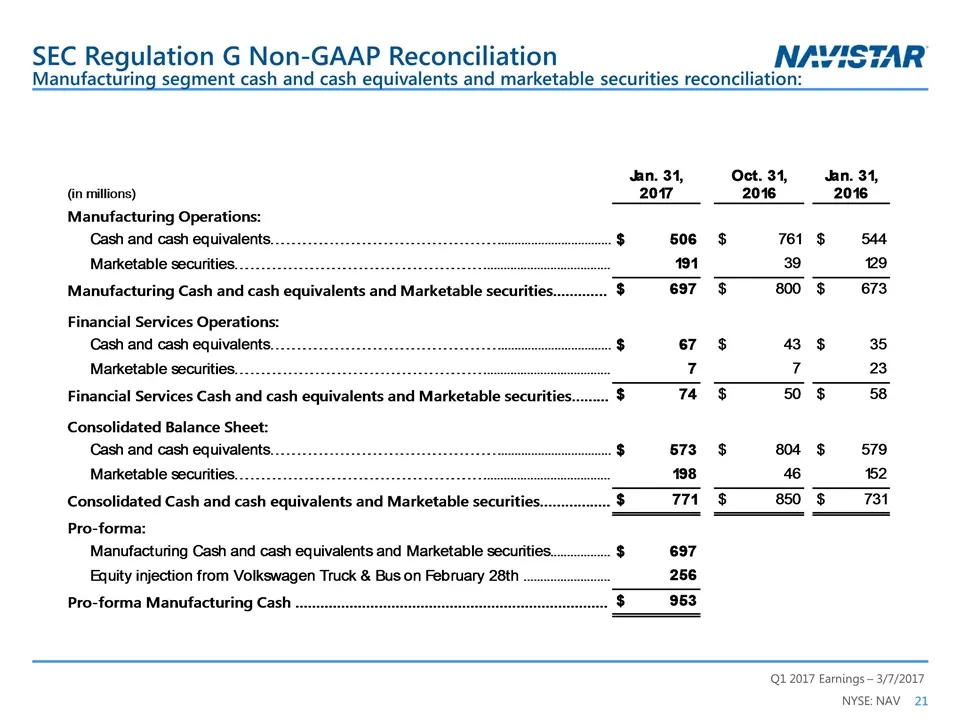
Manufacturing segment cash and cash equivalents and marketable securities reconciliation: SEC Regulation G Non-GAAP Reconciliation Jan. 31, Oct. 31, Jan. 31, Oct. 31, Oct. 31, (in millions) 2017 2016 2016 2014 2013 Manufacturing Operations: Cash and cash equivalents……………………………………………………… $ 506 $ 761
Slide 22: SEC Regulation G Non-GAAP Reconciliations
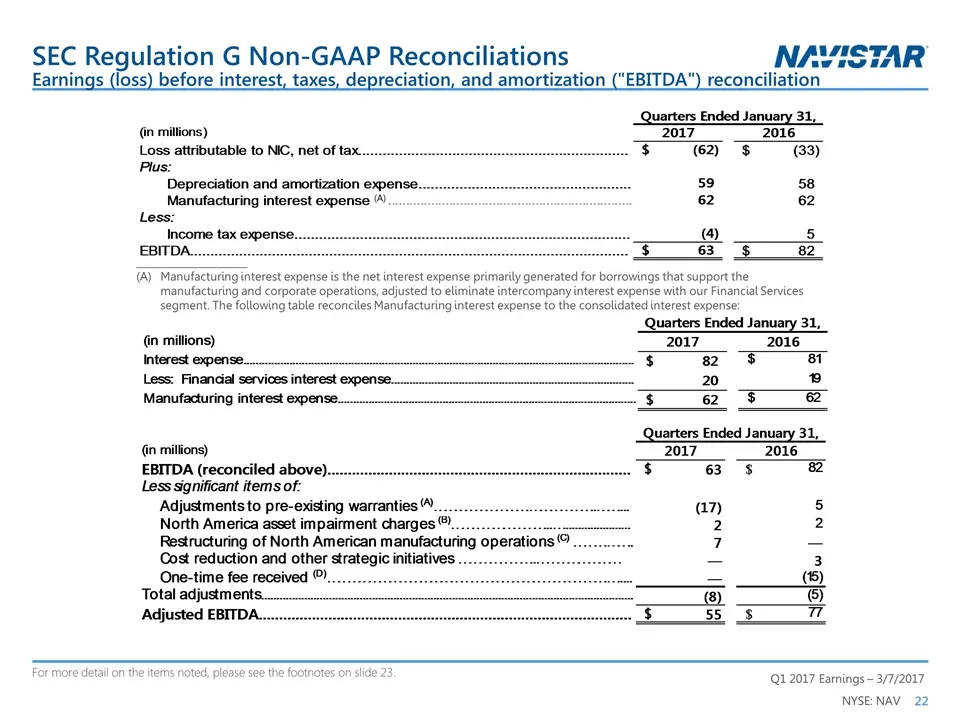
SEC Regulation G Non-GAAP Reconciliations ______________________ (A) Manufacturing interest expense is the net interest expense primarily generated for borrowings that support the manufacturing and corporate operations, adjusted to eliminate intercompany interest expense with our Financial Services
Slide 23: ______________________ Adjustments to pre-existing warranties reflect changes in our estimate of warranty costs for
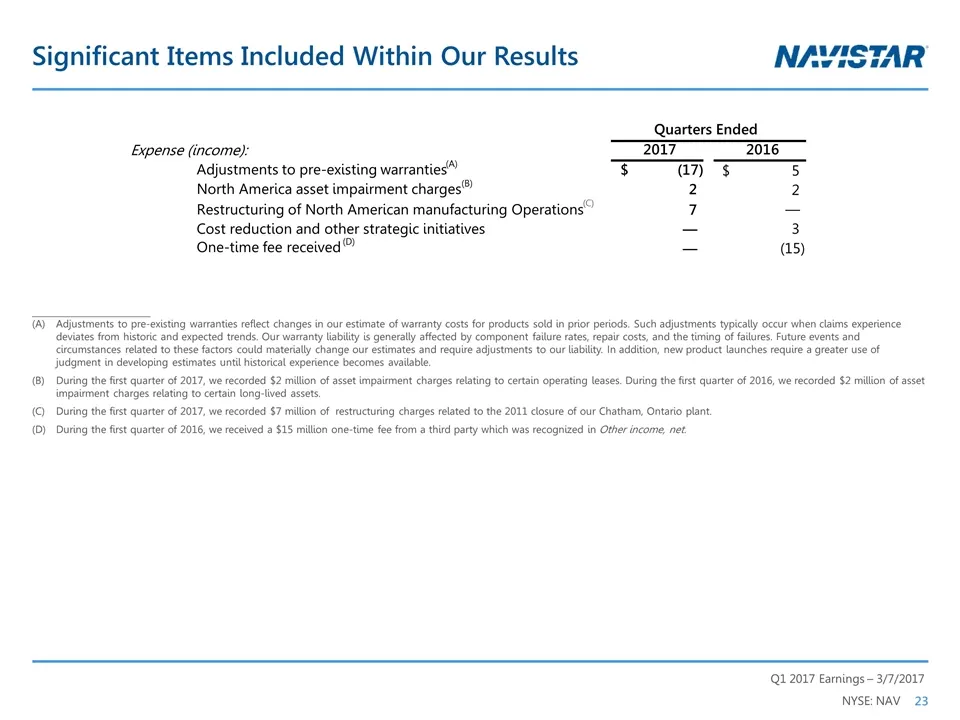
______________________ Adjustments to pre-existing warranties reflect changes in our estimate of warranty costs for products sold in prior periods. Such adjustments typically occur when claims experience deviates from historic and expected trends. Our warranty liability is generally affected by comp
Source: SEC EDGAR · 8-K filed Mar 7, 2017
More decks from Navistar International Corporation
 Q2 2021 Earnings Presentation20 slides · Jun 8, 2021
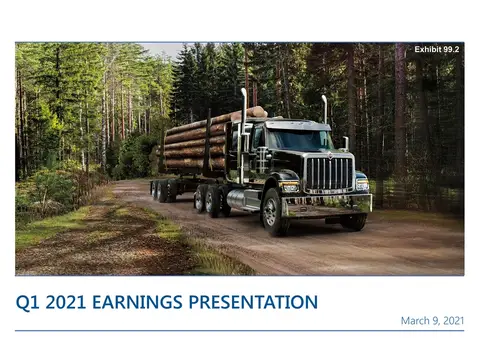 Q1 2021 Earnings Presentation20 slides · Mar 9, 2021
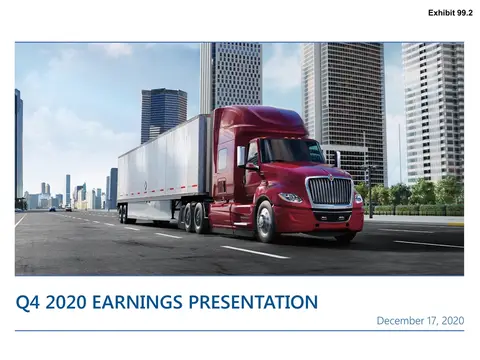 Q4 2020 Earnings Presentation22 slides · Dec 17, 2020
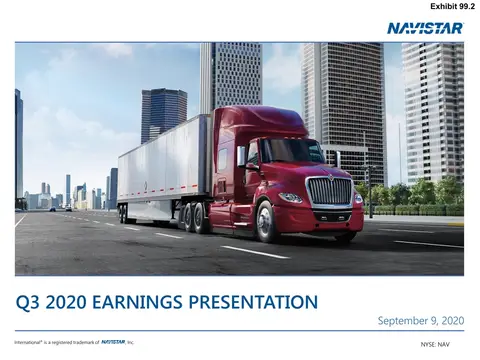 Q3 2020 Earnings Presentation21 slides · Sep 9, 2020
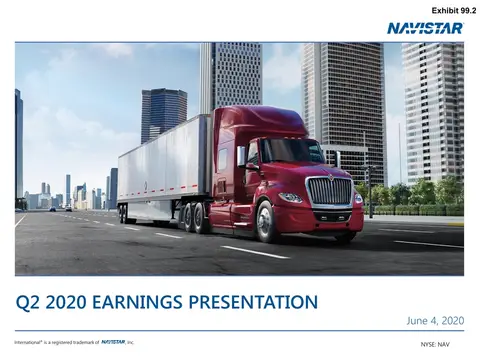 Q2 2020 Earnings Presentation21 slides · Jun 4, 2020
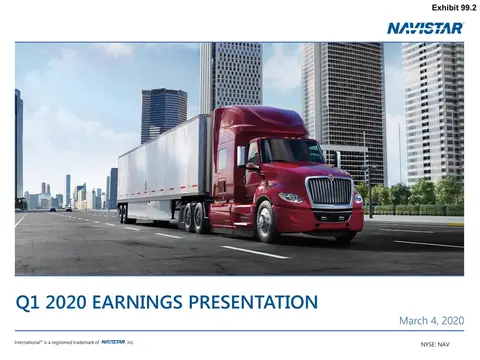 Q1 2020 Earnings Presentation21 slides · Mar 4, 2020