Duke Realty — REIT Week: NAREIT Investor Forum 2011
33 slides from Duke Realty's conference presentation, Jun 7, 2011
Slide 1: REIT Week: NAREIT Investor Forum
RELIABLE. ANSWERS. REIT Week: NAREIT Investor Forum June 7-9, 2011 Exhibit 99.1
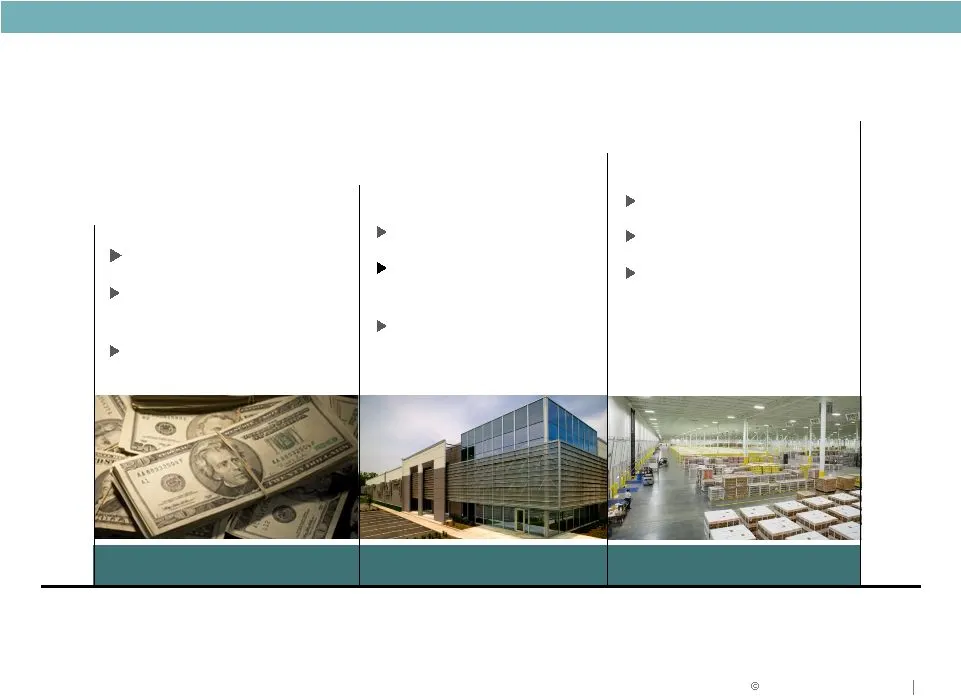
Slide 2: Where we've been and where we're going
RELIABLE. ANSWERS . 2009 2010 2011 and beyond FOCUS: Liquidity More than $1.5 billion capital raised Strategy refined FOCUS: Strategy execution Operating fundamentals Balance sheet strength FOCUS: Asset quality Cash flow growth Shareholder return Where we’ve been and where we’re going…
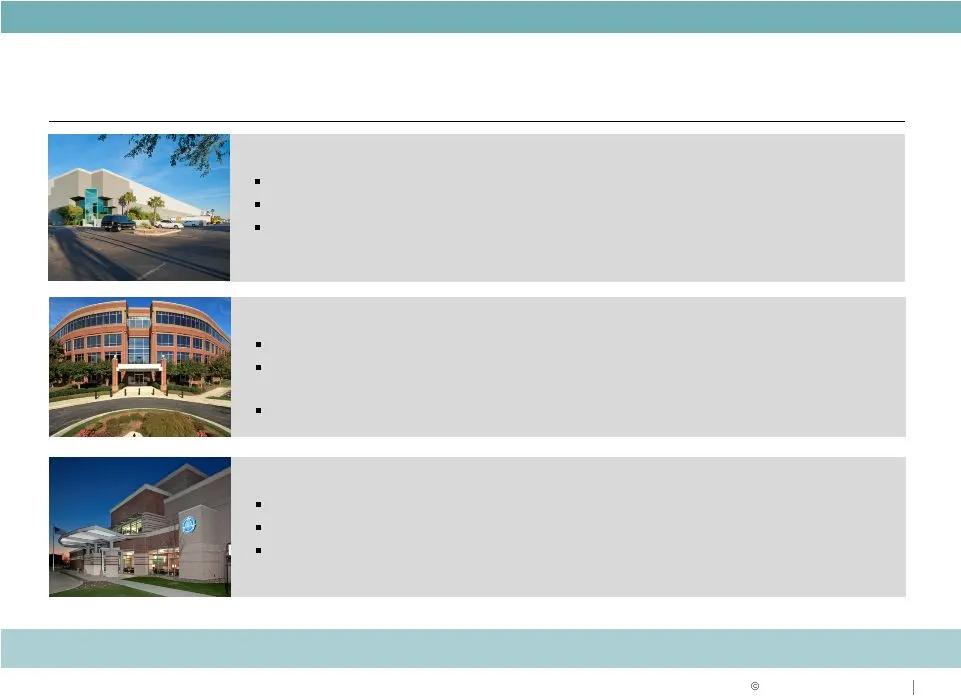
Slide 3: Market Outlook
RELIABLE. ANSWERS . Suburban Office Market Still Challenging Economic uncertainty limiting business investment and expansion decisions Continued improvements in consumer spending, corporate profits and job outlook will be catalyst Recovery will be at slower pace Medical Office Regaining Traction Ope
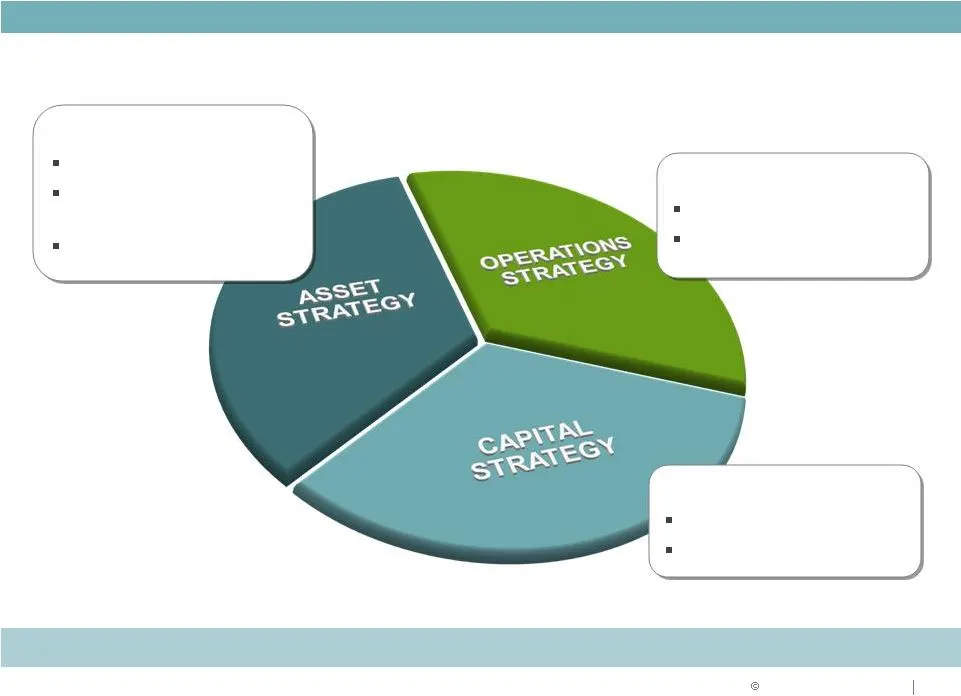
Slide 4: Strategy for Success
RELIABLE. ANSWERS . Focus on: Increasing cash flow Maximizing return on assets Strategy for Success Focus on: Improving coverage ratios Improving ratings Focus on: Portfolio repositioning Strategic acquisitions & dispositions Development opportunities Delivering on what we say we will do
Slide 5: 2011 Goals and Objectives Q1 2011 Update
RELIABLE. ANSWERS . 2011 Goals and Objectives Q1 2011 Update Strategic Focus • Lease-up portfolio, manage cap ex; reach positive same property income growth • Balance execution with capital strategy relative to level and quality of cash flow and same property NOI; Debt to EBITDA <7.0x • Development

Slide 6: Asset Strategy
ASSET STRATEGY
Slide 7: Asset Strategy: Proven Performance
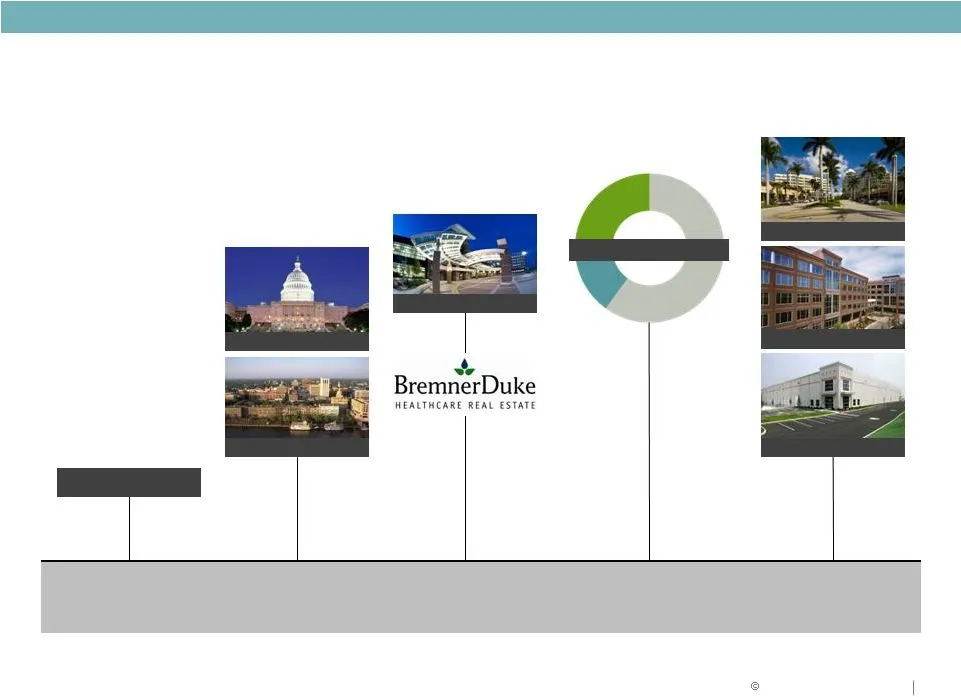
ASSET STRATEGY Flex disposition Savannah Washington DC Healthcare Asset Strategy Dugan CBRERT Premier Depth & experience of team = Consistent execution Proven Performance $1 Billion
Slide 8: Portfolio Strategy
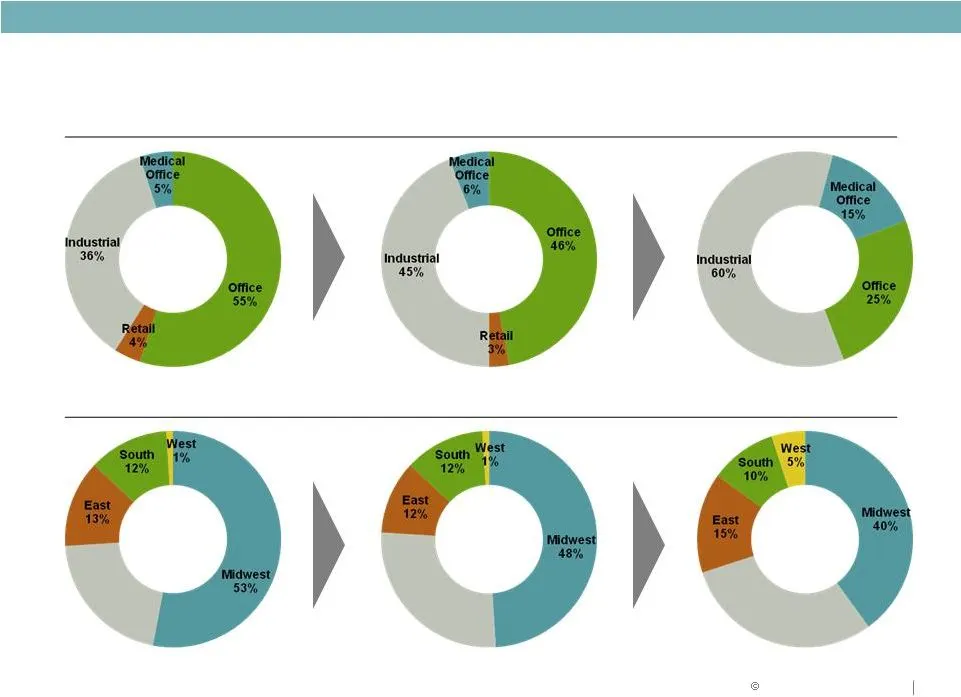
ASSET STRATEGY Portfolio Strategy BY PRODUCT BY GEOGRAPHY Q1 2011 Q1 2011 Southeast 21% Southeast 27% Southeast 30%
Slide 9: Asset Strategy: Road Map
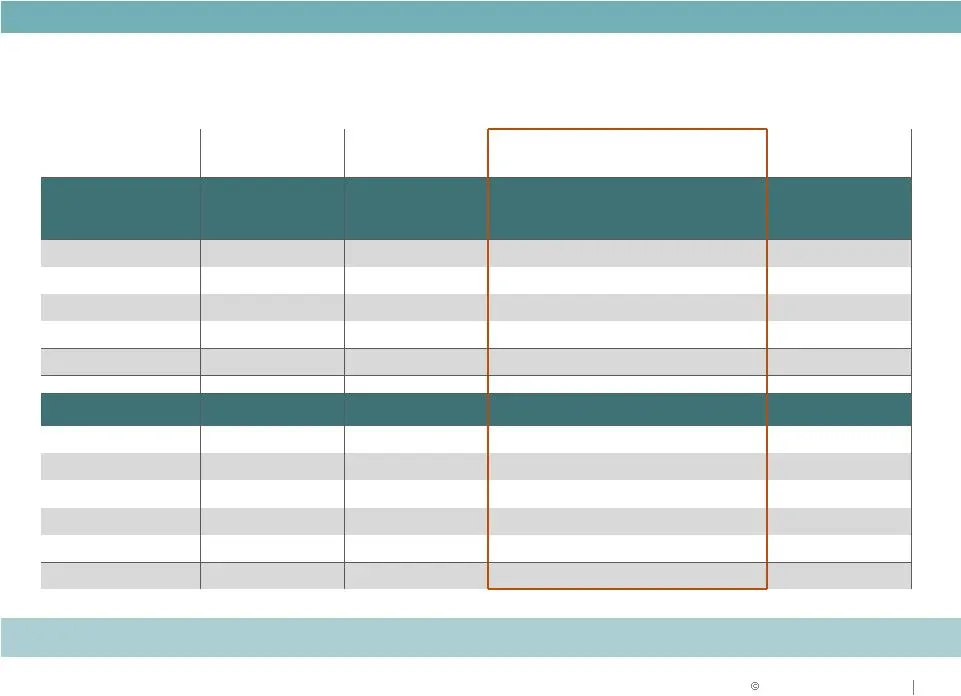
PRODUCT TYPE Amount % Amount % Proceeds from Targeted Dispositions Acquisitions/ Developments/ Repositioning Amount % REGION ASSET STRATEGY Asset Strategy: Road Map ($ in millions) Investment 9/30/09 Investment 3/31/11 ACTION PLAN Investment Industrial $2,930 36% $3,650 45% ($55) $1,250 $4,920 60% O

Slide 10: Operations Strategy
OPERATIONS STRATEGY
Slide 11: Focus on Fundamentals
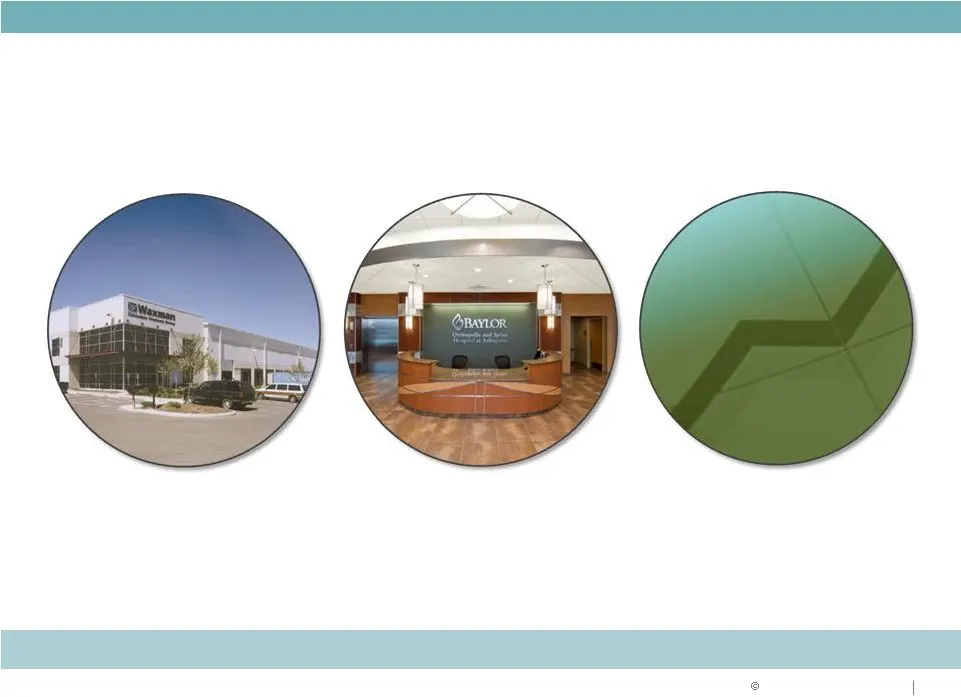
OPERATIONS STRATEGY Focus on Fundamentals LEASING OF PORTFOLIO STRATEGIC NEW DEVELOPMENT AND LAND DISPOSITION AFFO PAYOUT Maximize return on assets

Slide 12: Portfolio Occupancy and 2011 Guidance
OPERATIONS STRATEGY Portfolio Occupancy Unstabilized Portfolio Same Property NOI Recurring AFFO Payout Ratio 2011 Guidance: Average Occupancy 87.5% to 90.5% • Occupancy at March 31, 2011 at 88.9% • Managing through anticipated tenant terminations • Upside to guidance from lease-up of portfolio and r
Slide 13: Consistent Operating Performance
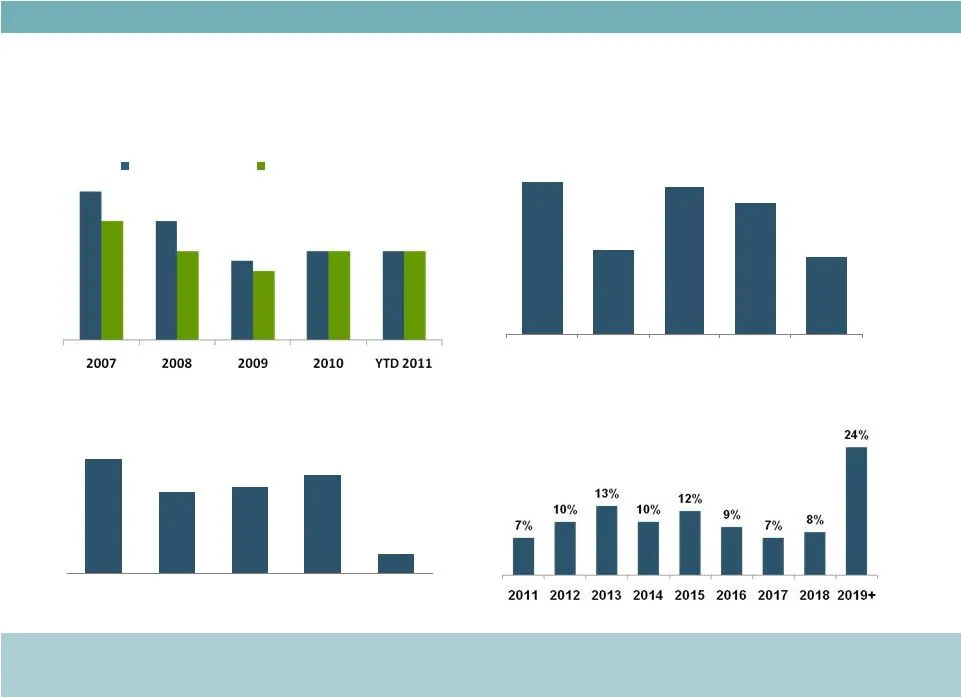
OPERATIONS STRATEGY Operations Strategy: Consistent Operating Performance Stabilized Occupancy (%) Strong historical stabilized occupancy – fundamentals improving Lease Renewals (%) Strong lease renewal percentages Stabilized occupancy In-service occupancy 80% 72% 79% 77% YTD 2011 70% 29.9 21.4 22.7
Slide 14: New, High Quality Portfolio with Long-term Leases
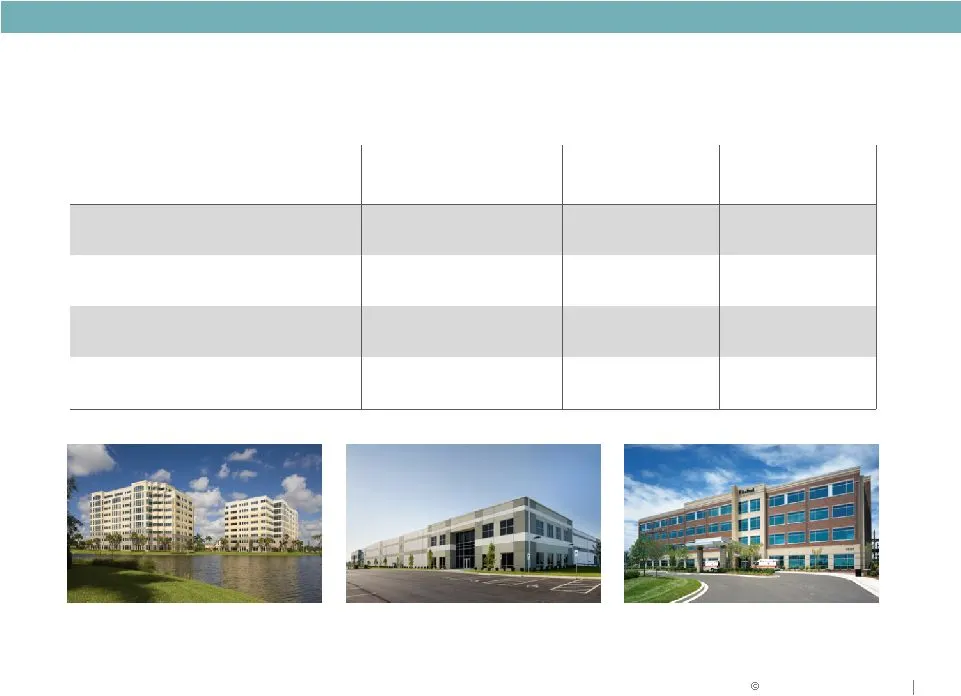
OPERATIONS STRATEGY New, High Quality Portfolio with Long-term Leases Bulk Industrial Suburban Office Medical Office Property age 10.1 years 11.7 years 2.0 years Property size 212,000 SF 118,000 SF 97,000 SF Lease term 7.0 years 7.2 years 11.7 years Tenant size 70,000 SF 12,000 SF 11,000 SF
Slide 15: Historical Focus on Occupancy
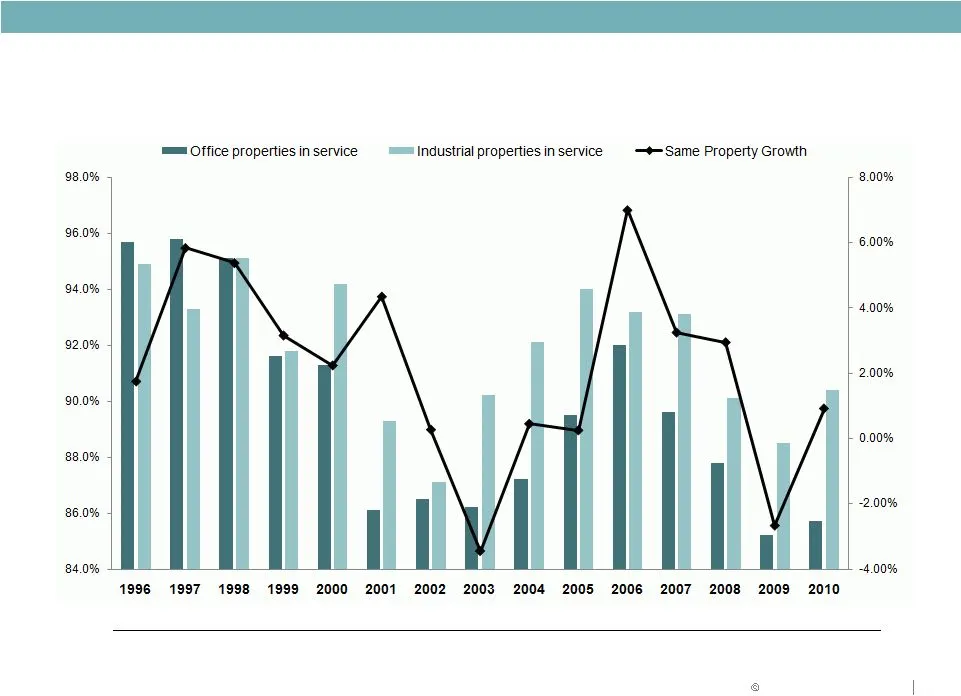
OPERATIONS STRATEGY December 31 Historical Focus on Occupancy

Slide 16: Regional Market Overviews
REGIONAL MARKET OVERVIEWS
Slide 17: Midwest Overview
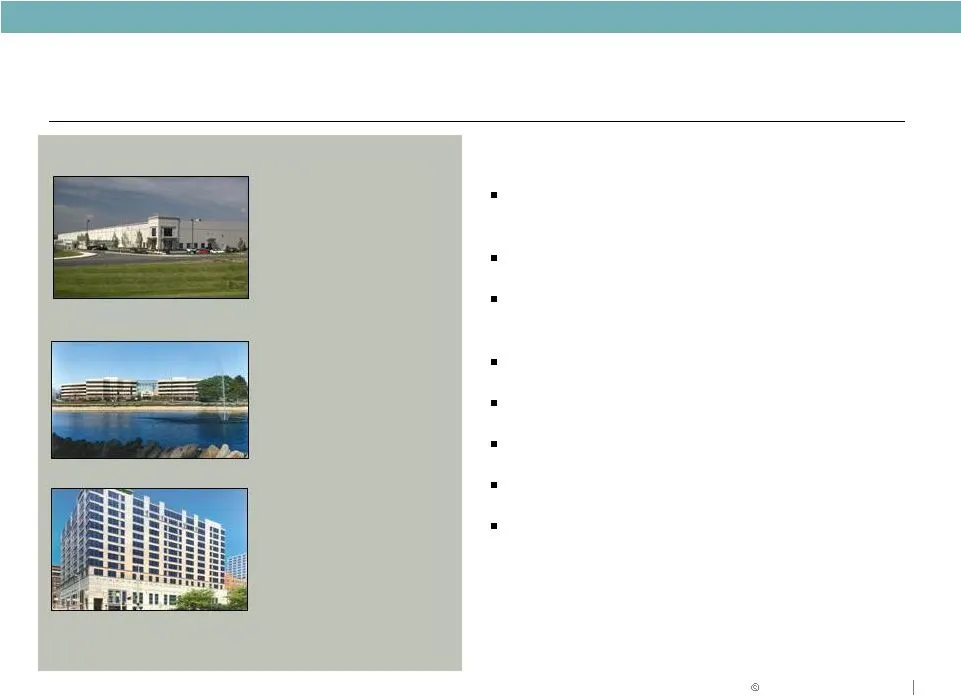
MIDWEST OVERVIEW RECENT TRANSACTIONS Midwest Renewal Industrial Hebron I - Cincinnati 646,000 SF 100% leased New Lease Office Atrium II - Columbus 121,000 SF Tenant: Alcatel - Lucent MARKET OVERVIEW & KEY POINTS Strong distribution base: Over 30% of U.S. population within one day’s drive 74 Fortune
Slide 18: Midwest Overview
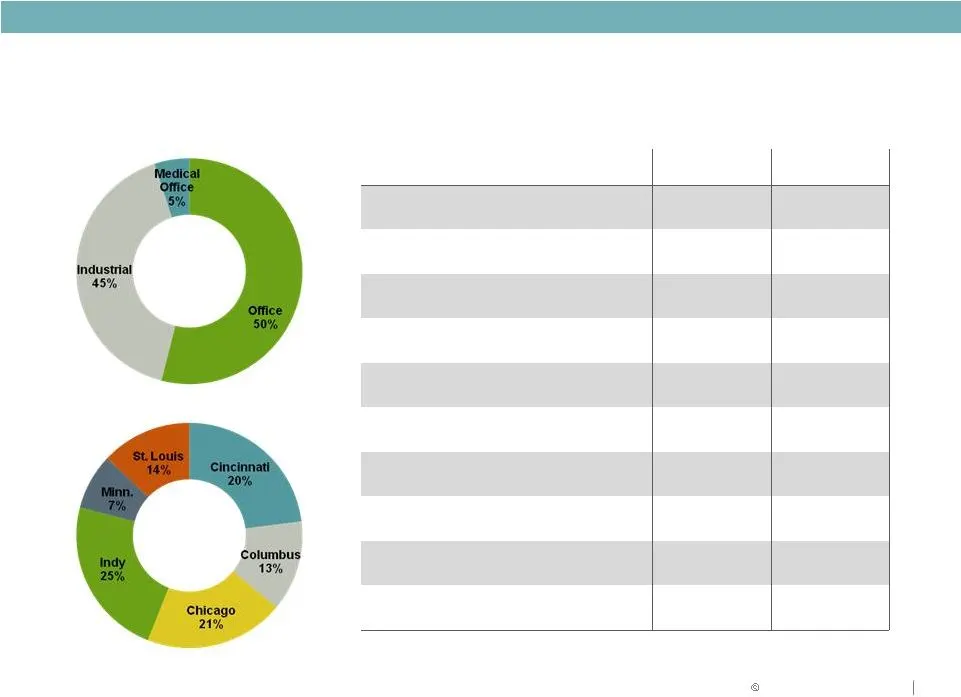
MIDWEST OVERVIEW Midwest Overview Location Product Type Industrial Office Average Age 11.6 years 16.3 years Average Building Size 236,000 SF 130,000 SF Total Square Footage 51.5 million 16.4 million Current Occupancy 93.0% 84.4% Indianapolis 96.7% 86.5% Chicago 96.1% 88.6% Cincinnati 86.4% 82.5% St.
Slide 19: Southwest Overview
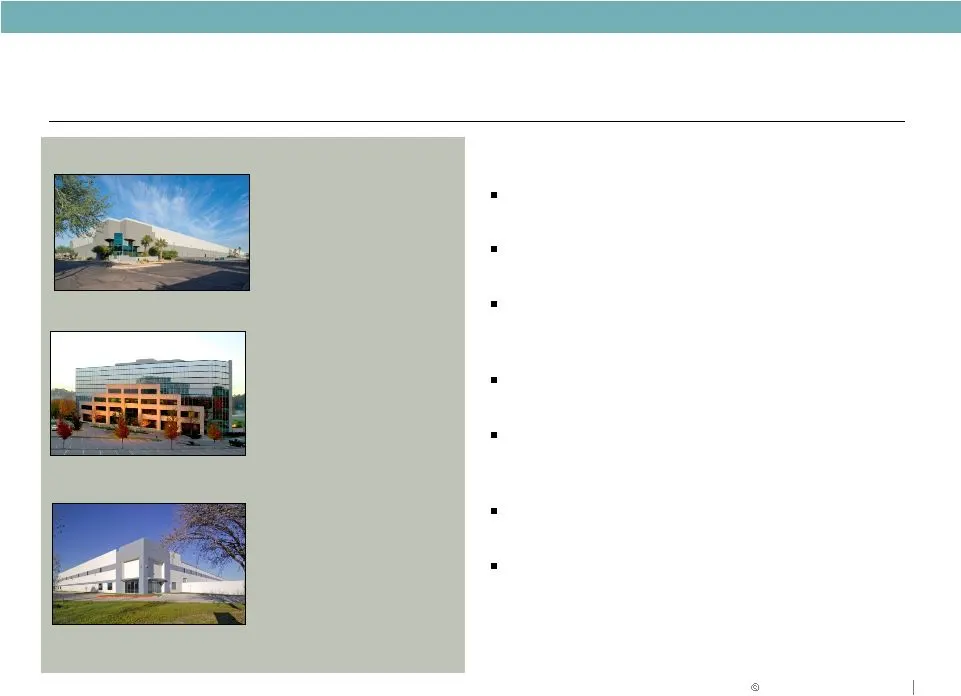
SOUTHWEST OVERVIEW RECENT TRANSACTIONS Southwest Acquisition - Industrial Estrella Buckeye – Phoenix 250,000 SF 100% Leased Disposition Office Lakeview office assets- Nashville 379,000 SF MARKET OVERVIEW & KEY POINTS Duke Realty presence since 1999 (Weeks merger) 52 Fortune 500 headquarters Demograp
Slide 20: Southwest Overview
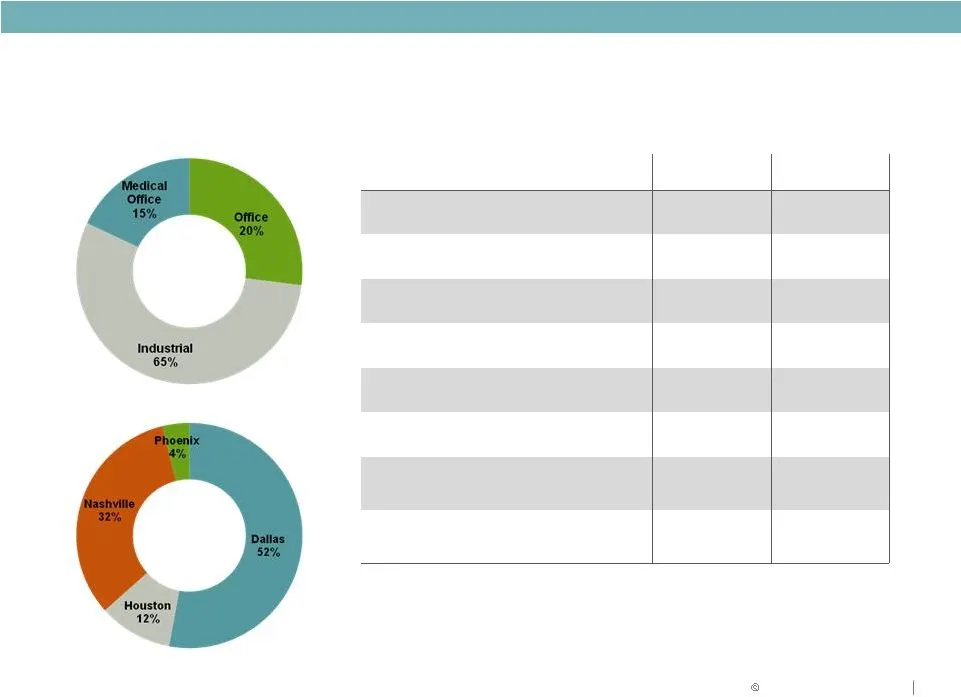
SOUTHWEST OVERVIEW Southwest Overview Location Product Type Industrial Office Average Age 8.6 years 6.5 years Average Building Size 256,500 SF 108,600 SF Total Square Footage 20.0 million 2.1 million Current Occupancy 85.6% 91.9% Dallas 83.8% 83.3% Nashville 80.9% 95.0% Houston 98.0% 100% Phoenix 97
Slide 21: East & Southeast Overview
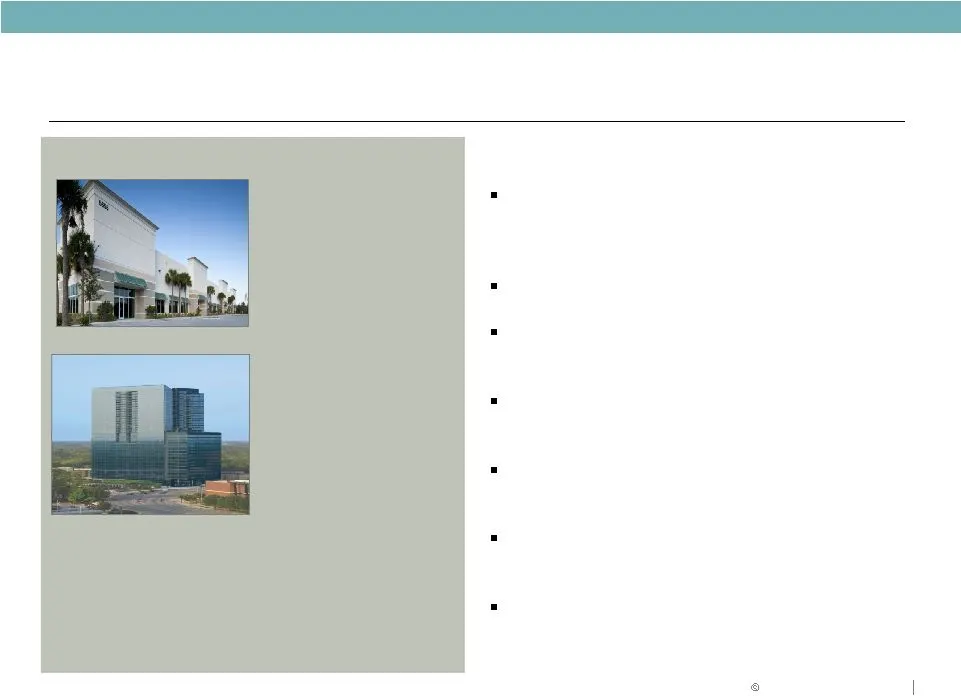
EAST & SOUTHEAST OVERVIEW RECENT TRANSACTIONS East & Southeast Overview Acquisition – Office/Industrial Premier Portfolio - South Fl 4.9 million SF MARKET OVERVIEW & KEY POINTS Strong presence: entered Southeast in 1999 (Weeks merger) and East in 2006 (acquisition of Winkler portfolio) 15 Fortune 50
Slide 22: East and Southeast Overview
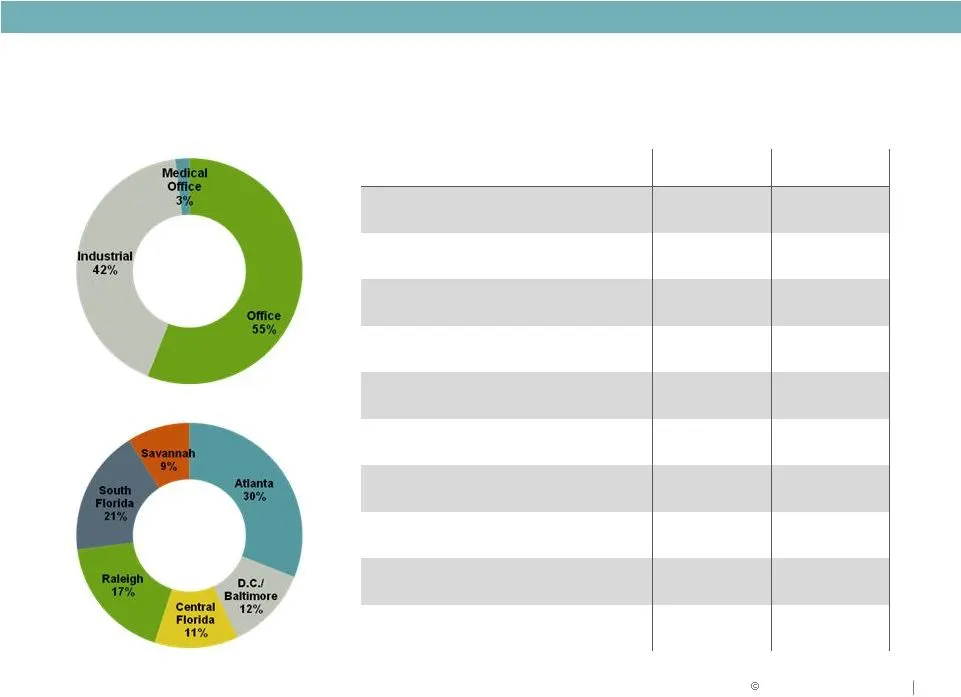
EAST & SOUTHEAST OVERVIEW East and Southeast Overview Location Product Type Industrial Office Average Age 8.8 years 9.7 years Average Building Size 225,000 SF 110,000 SF Total Square Footage 26.9 million 13.7 million Current Occupancy 89.0% 88.5% Atlanta 85.2% 87.3% South Florida 80.5% 89.2% Raleigh

Slide 23: Medical Office Overview
MEDICAL OFFICE OVERVIEW
Slide 24: Portfolio Strategy
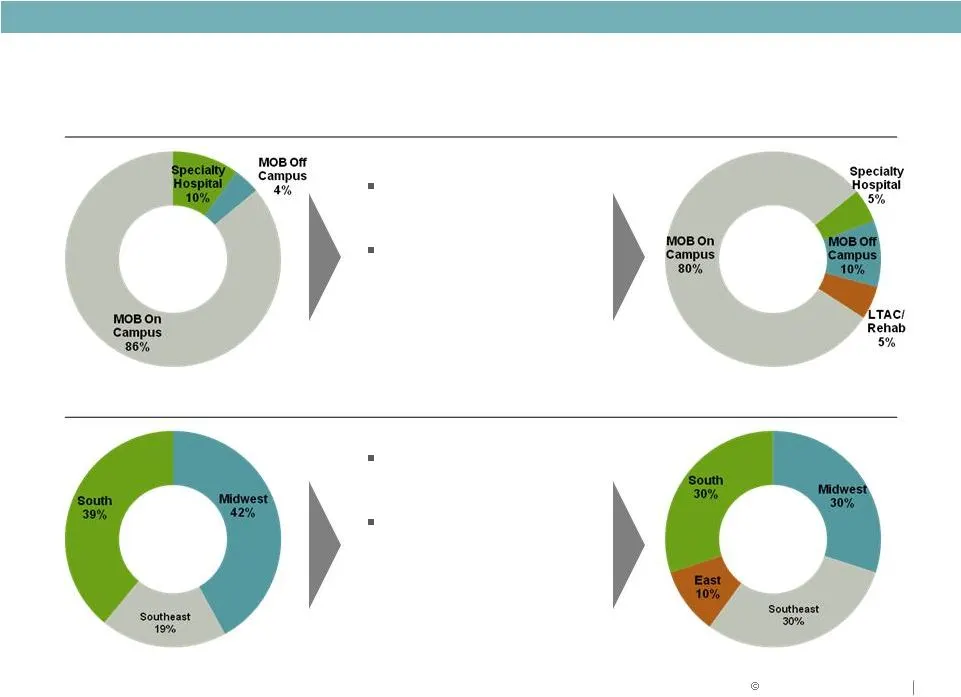
MEDICAL OFFICE OVERVIEW Portfolio Strategy BY PRODUCT BY GEOGRAPHY Focus on “core” assets (on-campus) Focus on national and regional Hospital system relationships Focus on Duke Realty office locations Focus on demographic healthcare growth cities
Slide 25: Duke Realty Markets: Demographic Focus
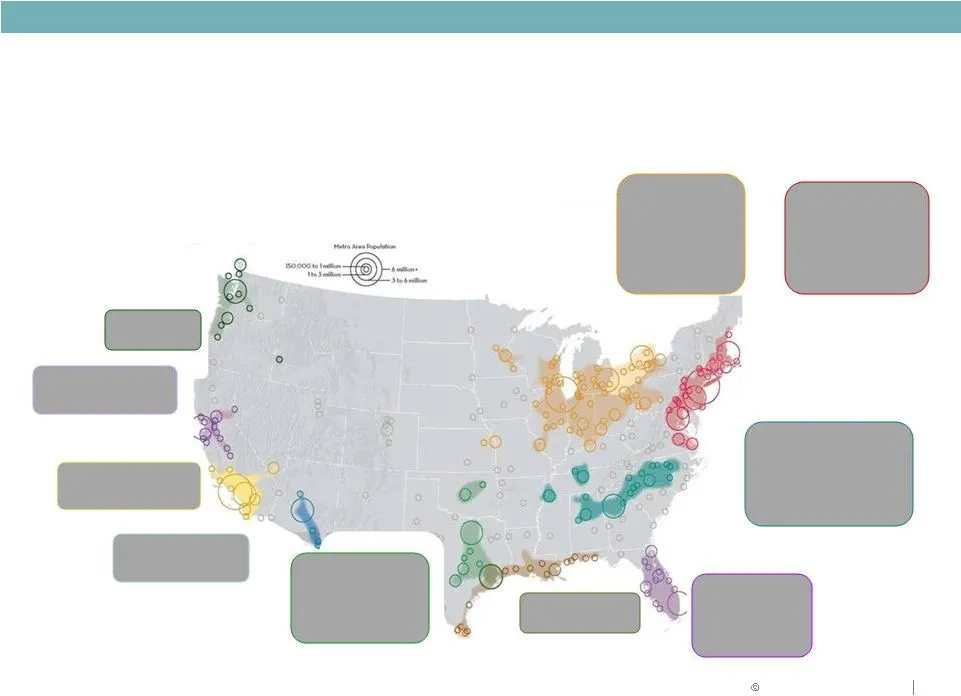
MEDICAL OFFICE OVERVIEW PIEDMONT ATLANTIC Atlanta * Birmingham Charlotte Nashville * Raleigh * NORTHEAST Baltimore * Boston Philadelphia Richmond Washington, D.C. * GREAT LAKES Chicago * Columbus * Indianapolis * Louisville Minneapolis * St. Louis* FLORIDA Jacksonville Miami Orlando * Tampa * GULF C
Slide 26: Healthcare Data Points
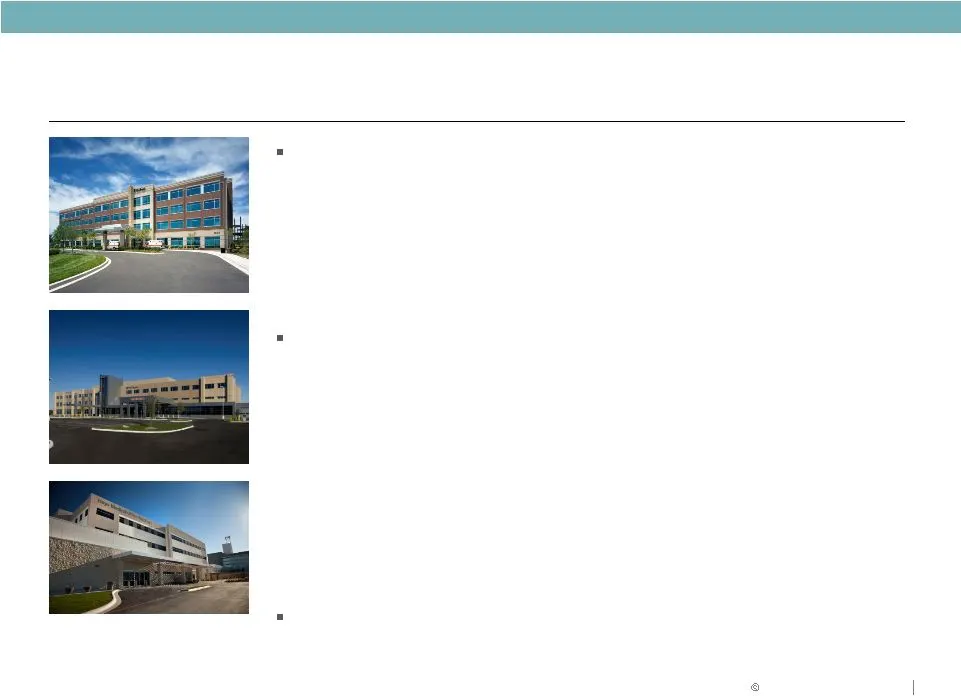
MEDICAL OFFICE OVERVIEW Healthcare Data Points The nation’s largest industry • Represents more than 17% of GDP, predicted to exceed 23% by 2020 • Americans spend more than 5% of pre-tax income on healthcare. Lower income brackets pay 15% or more ($7,800 per capita health expenditures in 2008/2009) R

Slide 27: Capital Strategy
CAPITAL STRATEGY
Slide 28: Key Metrics & Goals
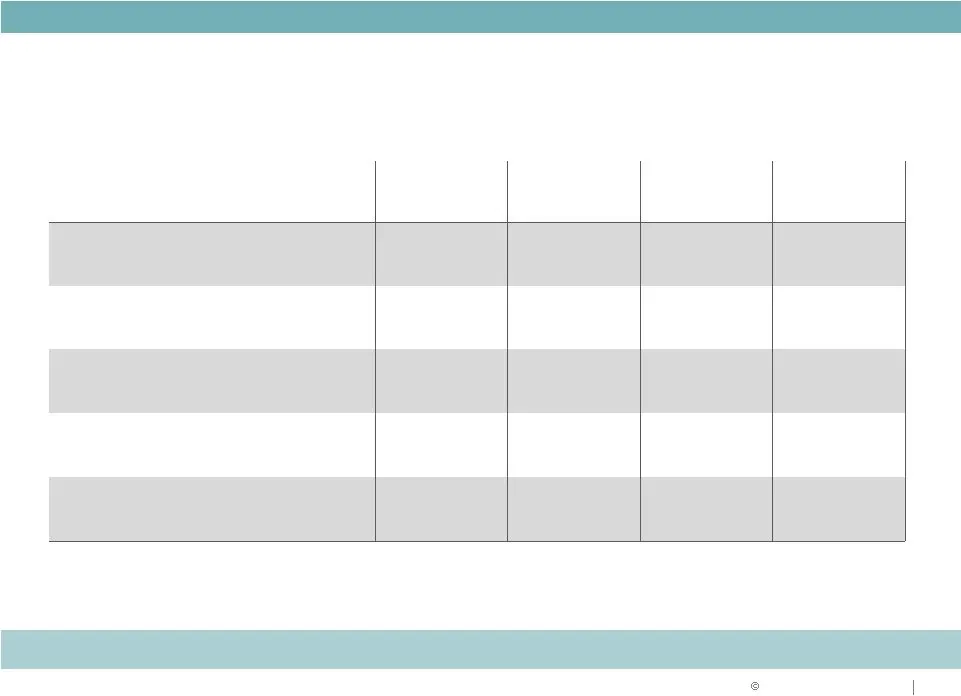
CAPITAL STRATEGY Key Metrics & Goals Actual Actual Q1 2011 Actual Goal Debt to Gross Assets 44.5% 46.3% 46.1% 45.0% Debt + Preferred to Gross Assets 54.9% 55.5% 55.3% 50.0% Fixed Charge Coverage Ratio 1.79 : 1 1.79 : 1 1.81 : 1 2.00 : 1 Debt/EBITDA 6.65 7.31 6.66 < 6.00 Debt + Preferred/EBITDA 8.47
Slide 29: Current Liquidity Position
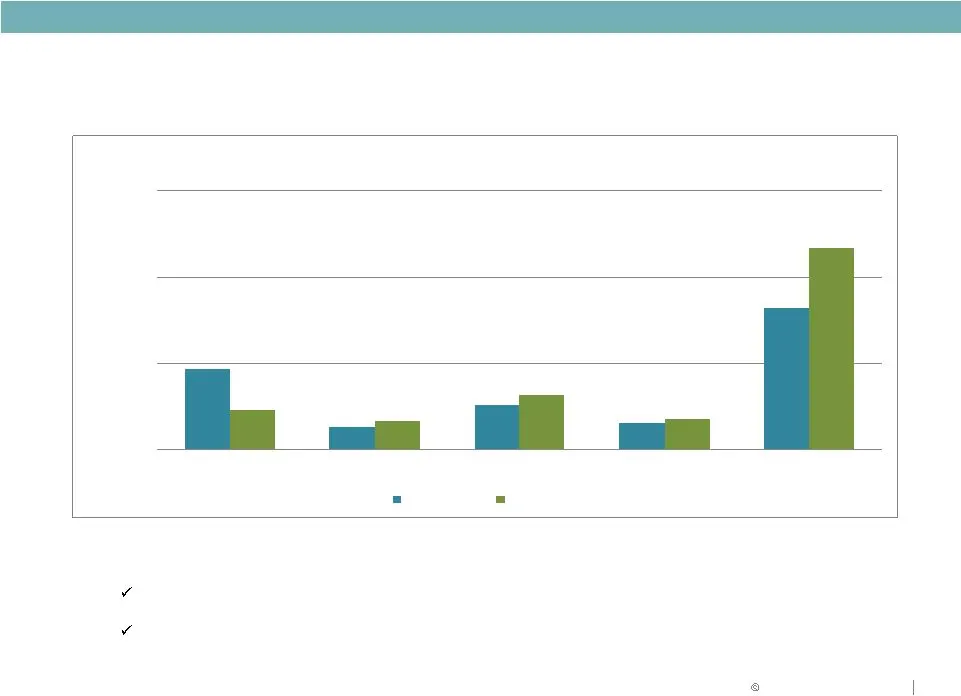
CAPITAL STRATEGY Current Liquidity Position $934 $256 $516 $310 $1,644 $460 $332 $632 $351 $2,335 $0 $1,000 $2,000 $3,000 Thereafter Debt Maturity and Amortization Schedule ($ in millions) 3/31/2009 3/31/2011 • Provide for $290 Million 2011 Unsecured Bond Maturities $122 million due 8/15/11 $168 mil

Slide 30: Key Takeaways
KEY TAKEAWAYS
Slide 31: 2010 Accomplishments and 2011 Opportunities
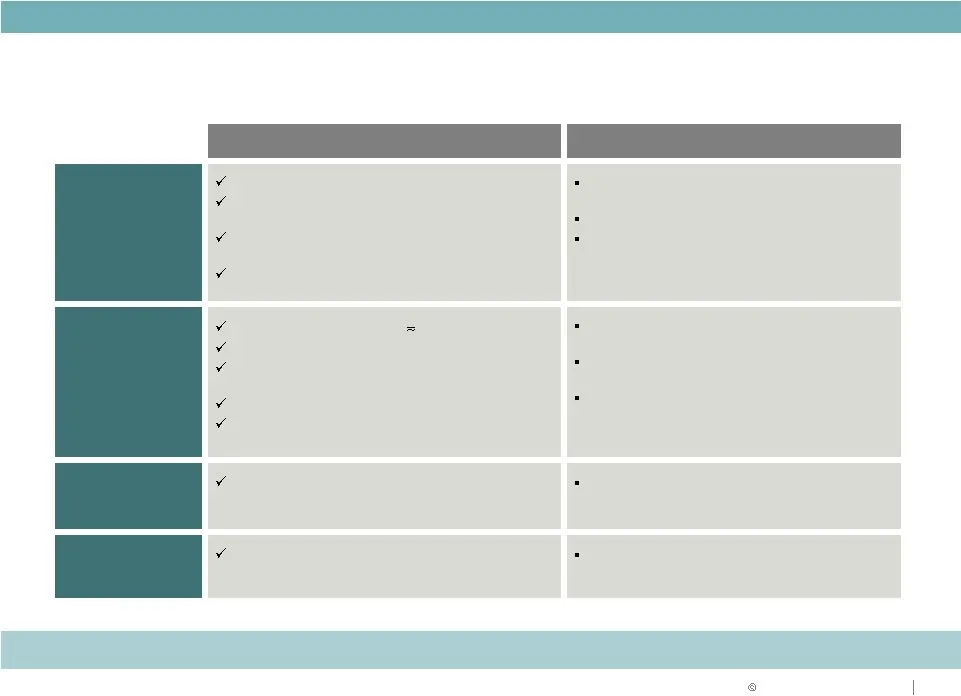
2010 2011 Capital Strategy Operating Strategy Development Expertise Asset Strategy RELIABLE. ANSWERS . 2010 Accomplishments and 2011 Opportunities Drive Shareholder Return Raised nearly $1.1 billion of capital Executed Capital Strategy in alignment with operating and asset strategy Operating with mi

Slide 32: Why Duke Realty?
RELIABLE. ANSWERS . WHY DUKE REALTY? Quality portfolio improving with asset strategy Solid balance sheet improving with capital strategy Unmatched ability to execute on daily operations Development capabilities in place with existing land bank Talent and leadership depth to execute
Slide 33: 2011 Range of Estimates
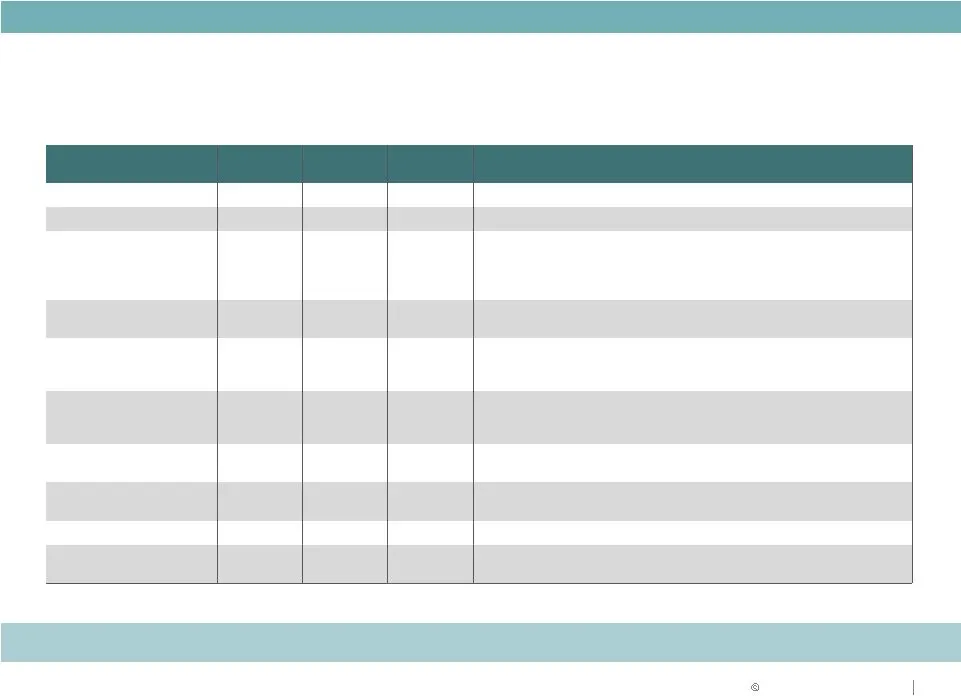
RELIABLE. ANSWERS . Metrics 2010 Actual Pessimistic Optimistic Key Assumptions 2011 Range of Estimates 2011 RANGE Core FFO Per Share $1.15 $1.06 $1.18 AFFO Payout Ratio 89% 100% 85% • Annual dividend maintained at $0.68 per share Average Occupancy 88.2% 87.5% 90.5% • First half expirations cause dip
Source: SEC EDGAR · 8-K filed Jun 7, 2011
More decks from Duke Realty Corporation
 Merger or Acquisition (June 2022)14 slides · Jun 13, 2022
 Investor Presentation (June 2021)58 slides · Jun 7, 2021
 Investor Presentation (May 2021)44 slides · May 10, 2021
 Investor Presentation (February 2021)58 slides · Feb 22, 2021
 NAREIT REITworld Virtual Investor Conference 202056 slides · Nov 16, 2020
 B of A Securities 2020 Global Real Estate Conference56 slides · Sep 15, 2020