Orascom Construction PLC · EGX:ORAS
Orascom Construction — 9M 2023 Earnings Presentation
18 slides from Orascom Construction's earnings presentation, Nov 29, 2023
Slide 1: 9M 2023 Results Presentation
Grand Grand Egyptian Egyptian Museum, Museum, Egypt Egypt 9M 2023 Results Presentation 29 November 2023
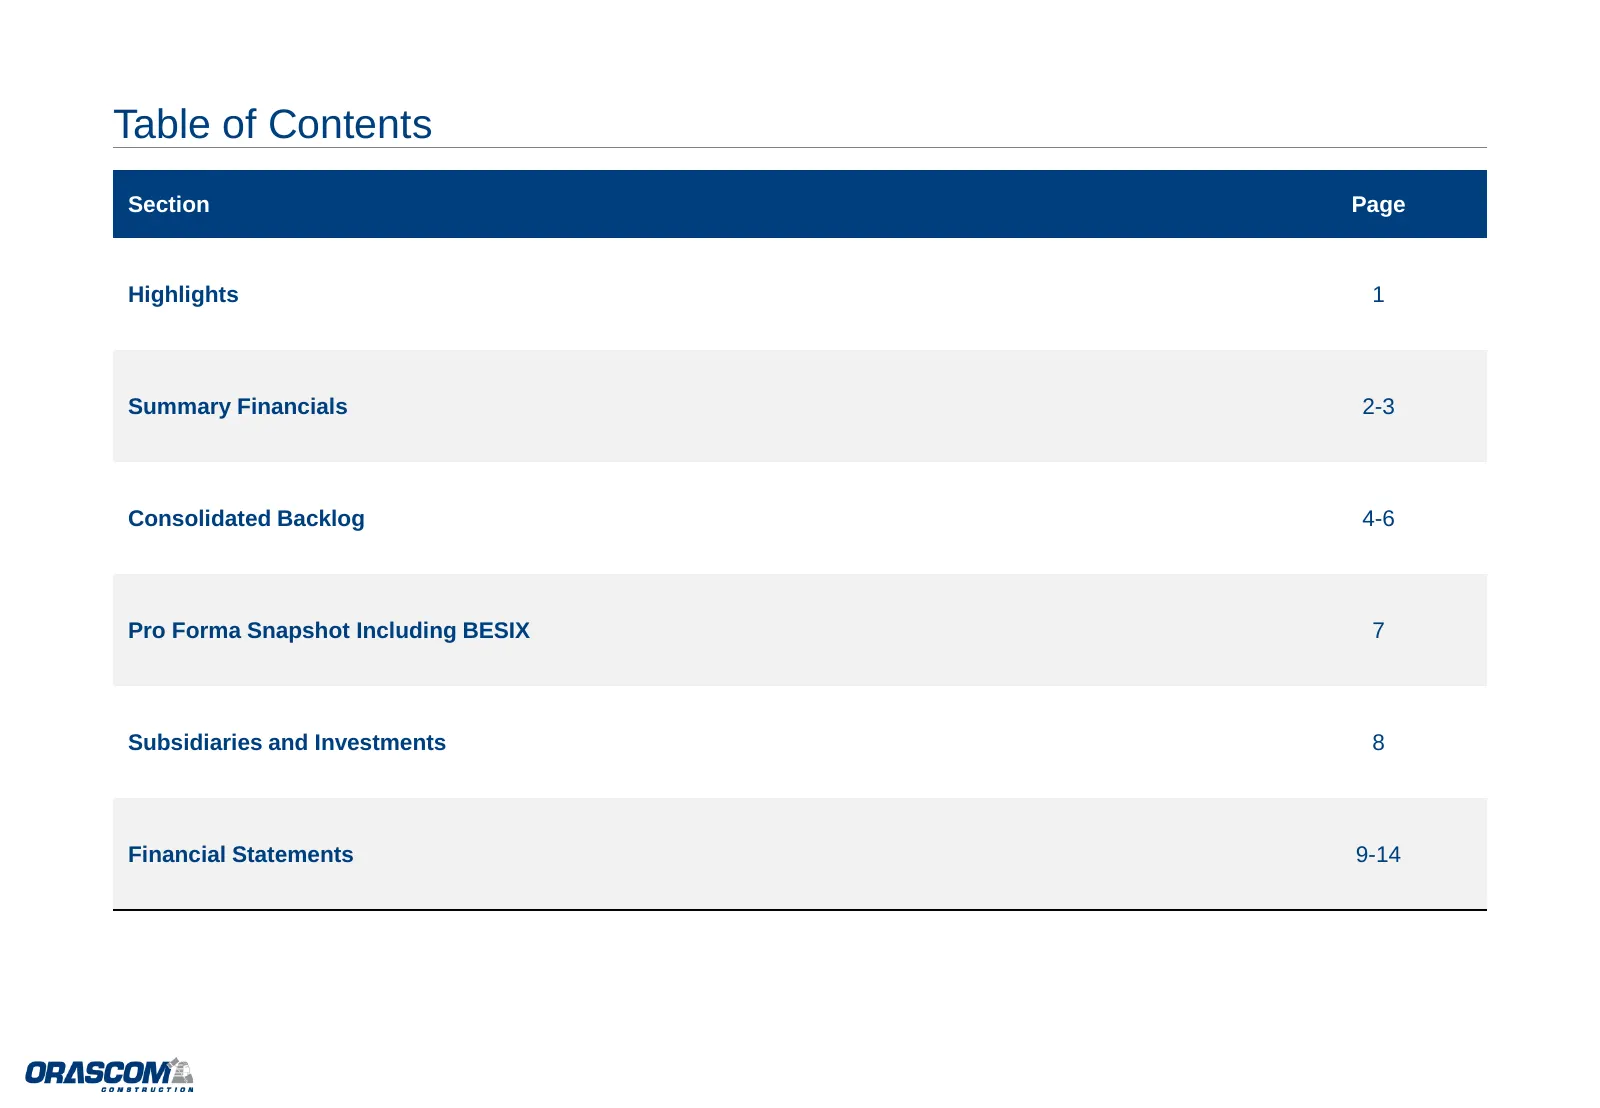
Slide 2: Table of Contents
Table of Contents Section Page Highlights 1 Summary Financials 2-3 Consolidated Backlog 4-6 Pro Forma Snapshot Including BESIX 7 Subsidiaries and Investments 8 Financial Statements 9-14
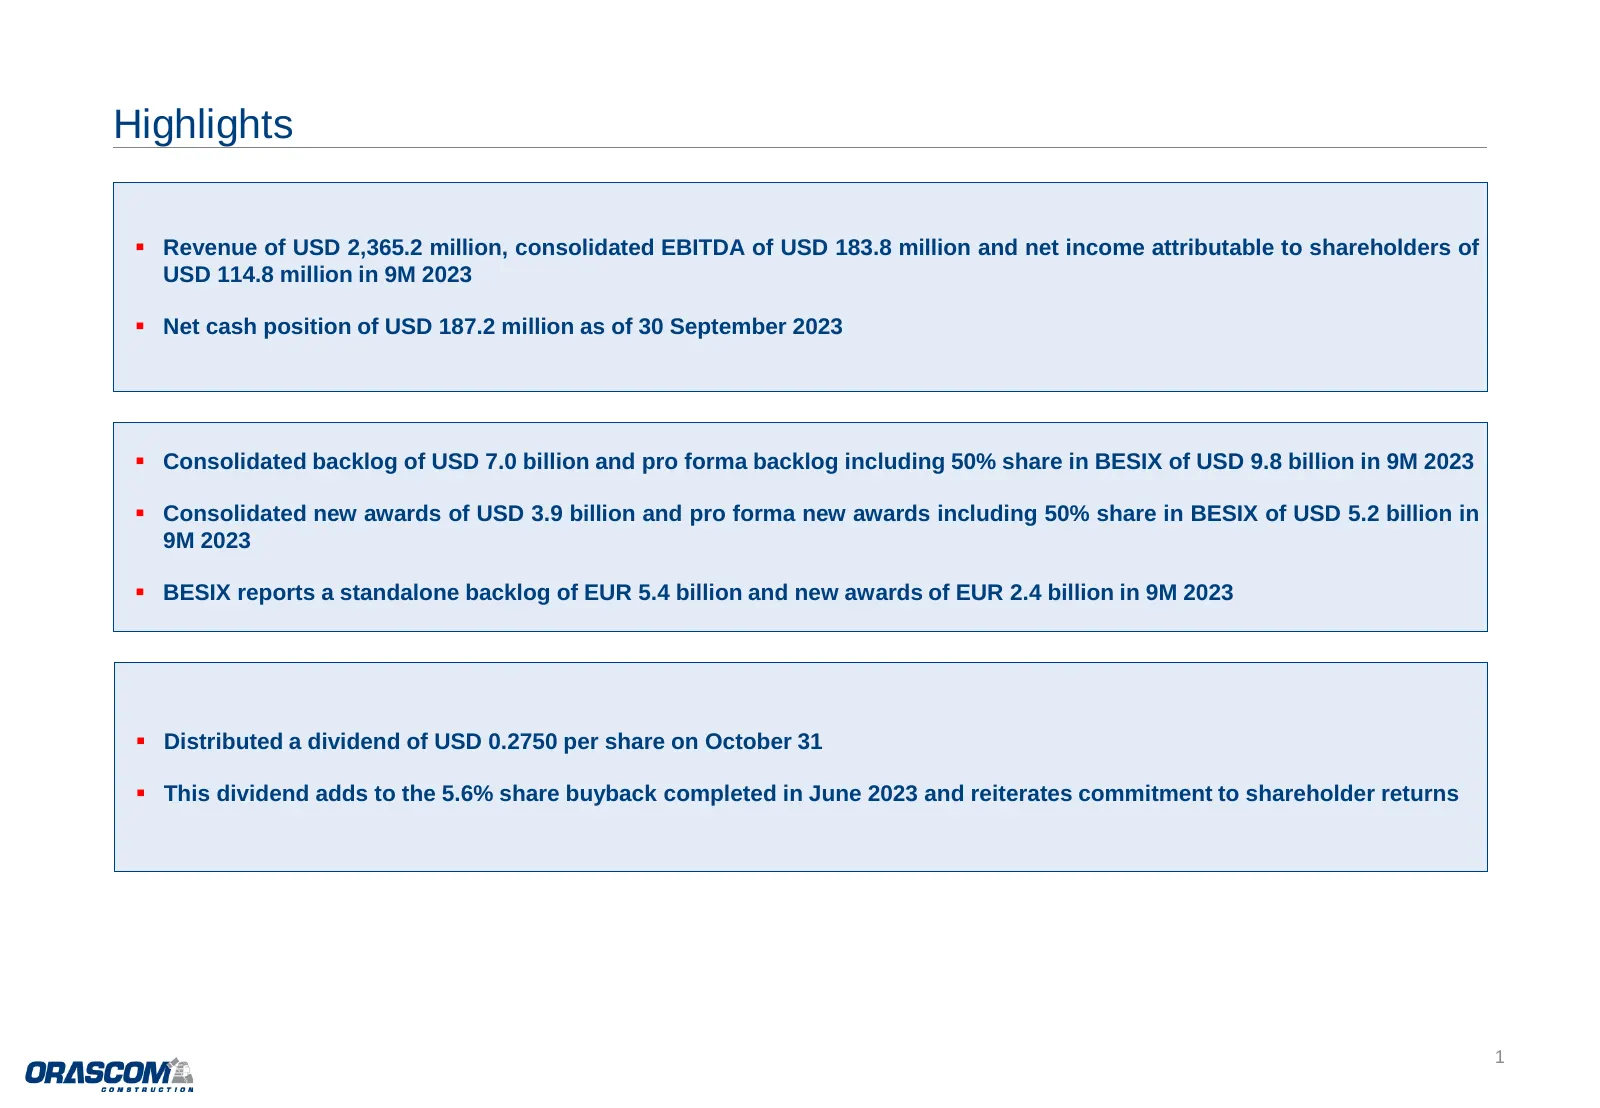
Slide 3: Highlights
Highlights ▪ Revenue of USD 2,365.2 million, consolidated EBITDA of USD 183.8 million and net income attributable to shareholders of USD 114.8 million in 9M 2023 ▪ Net cash position of USD 187.2 million as of 30 September 2023 ▪ Consolidated backlog of USD 7.0 billion and pro forma backlog including
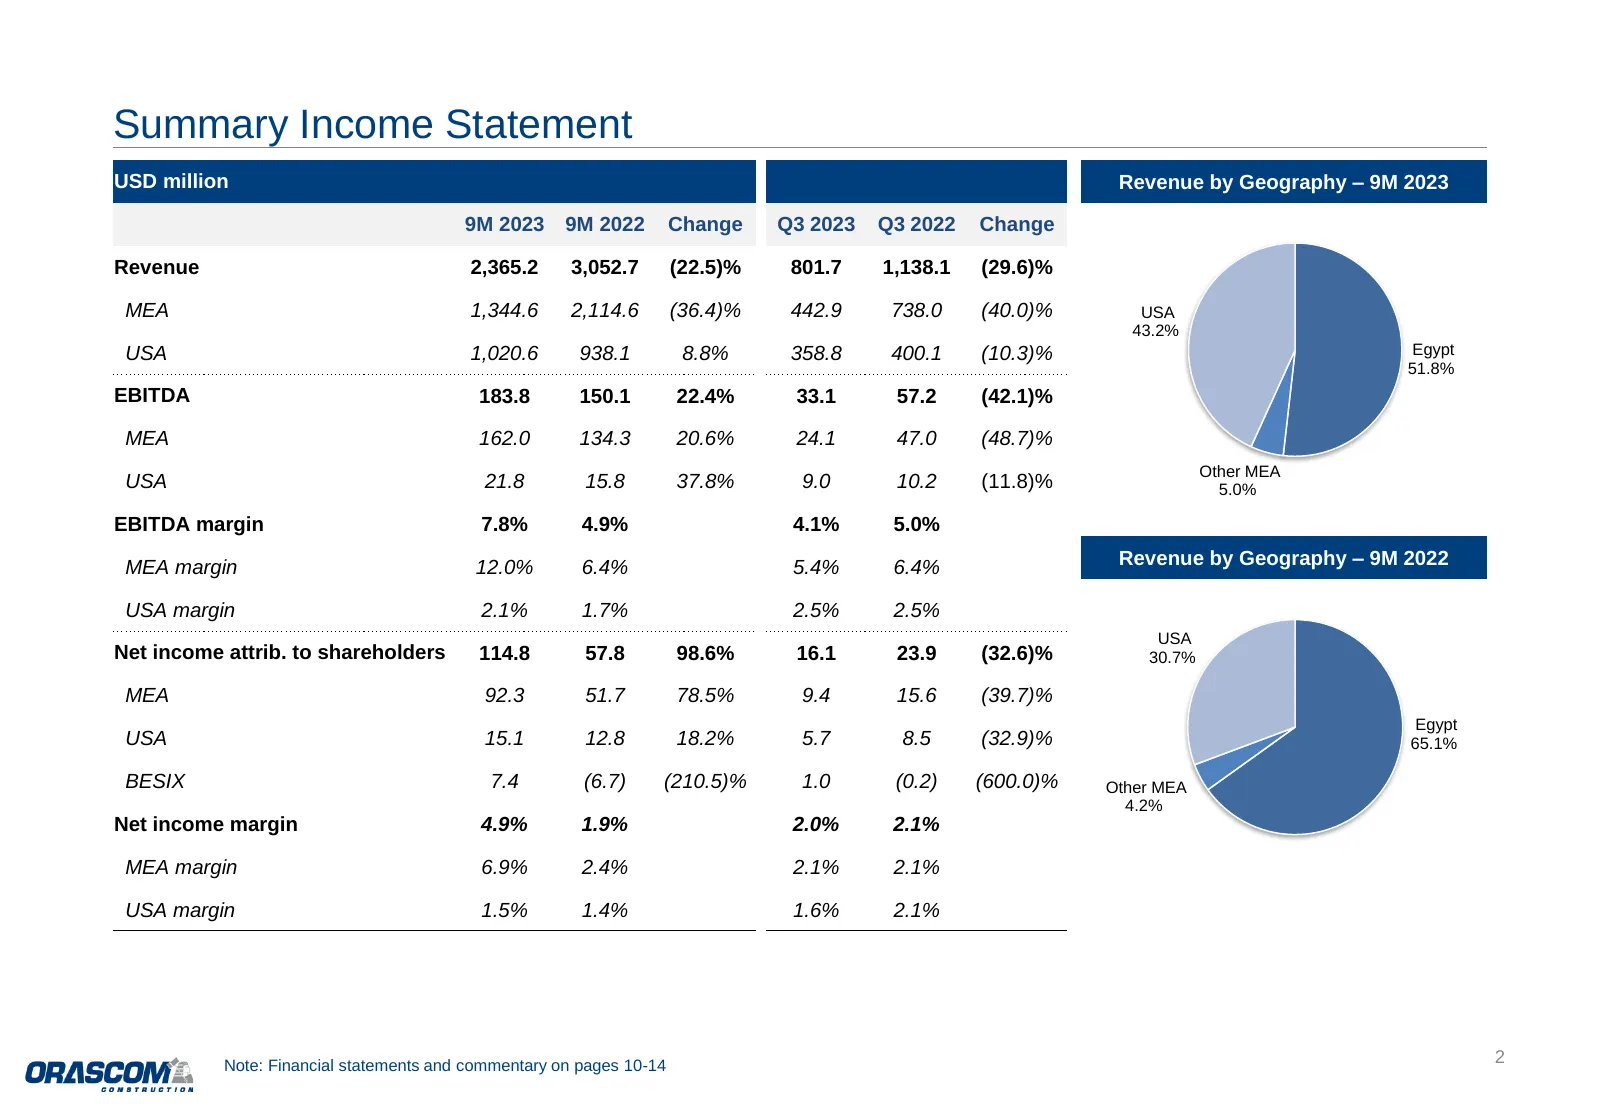
Slide 4: Summary Income Statement
Summary Income Statement USD million Revenue by Geography – 9M 2023 9M 2023 9M 2022 Change Q3 2023 Q3 2022 Change Revenue 2,365.2 3,052.7 (22.5)% 801.7 1,138.1 (29.6)% MEA 1,344.6 2,114.6 (36.4)% 442.9 738.0 (40.0)% USA 43.2% USA 1,020.6 938.1 8.8% 358.8 400.1 (10.3)% Egypt 51.8% EBITDA 183.8 150.1
Slide 5: Net Cash Position
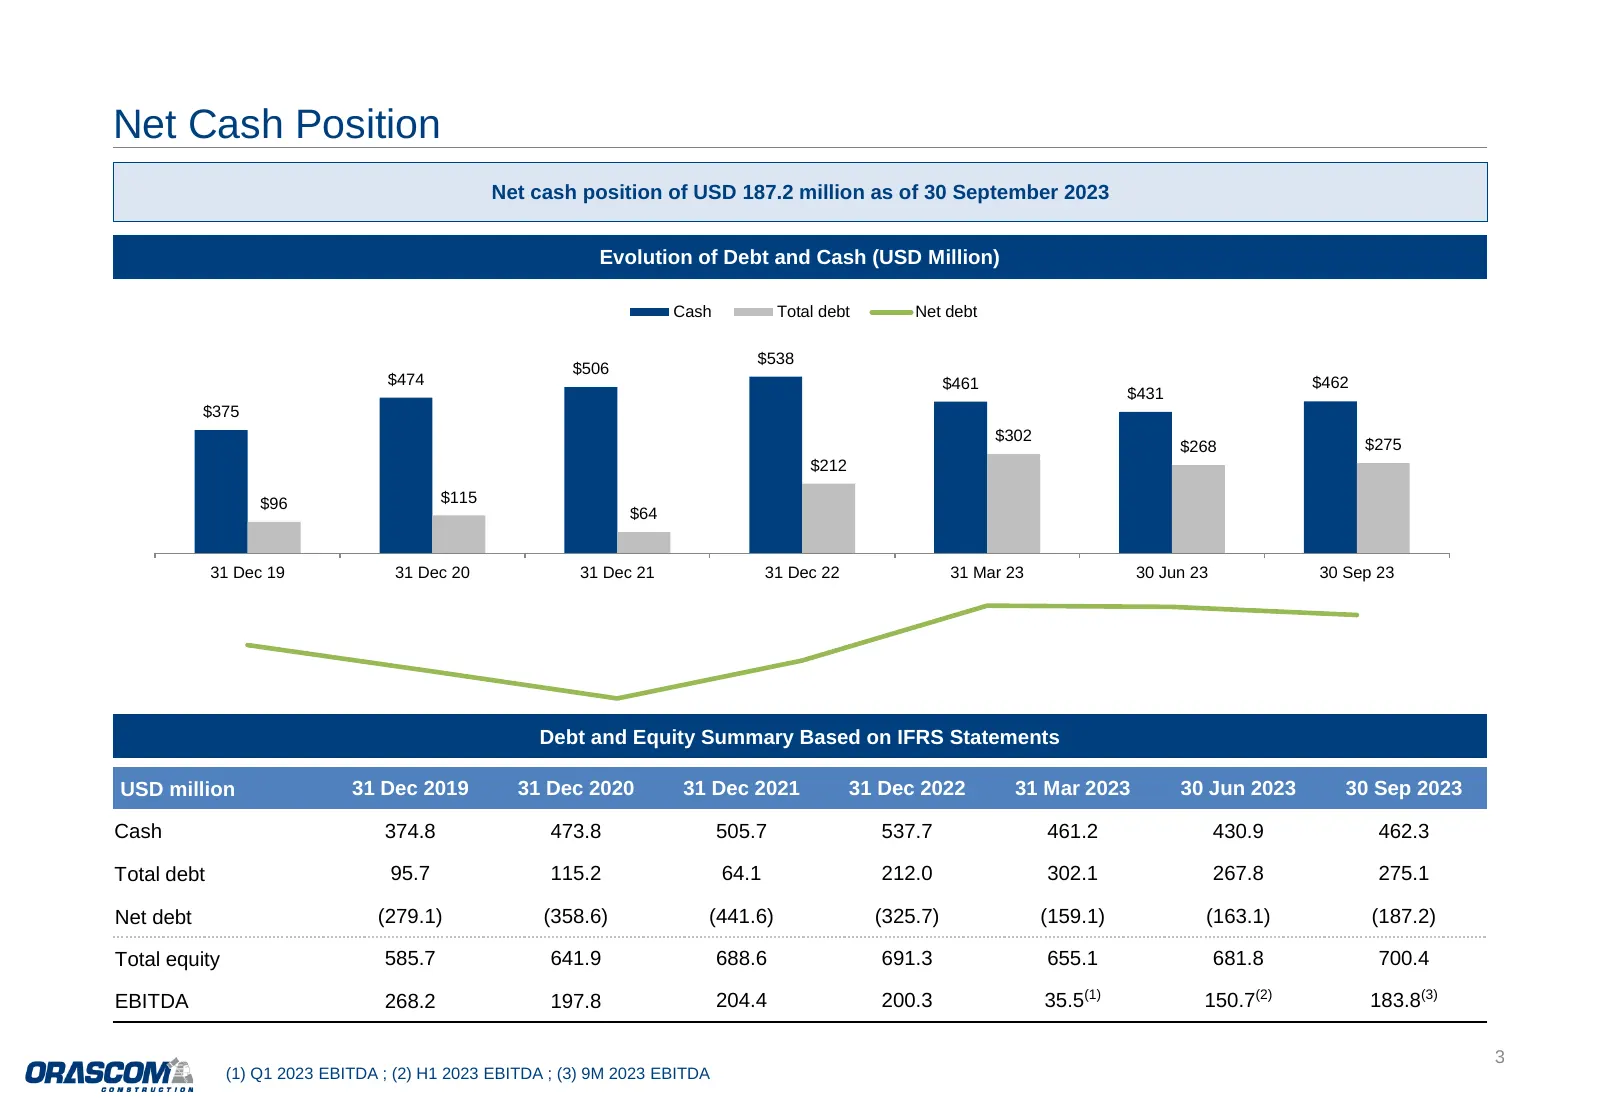
Net Cash Position Net cash position of USD 187.2 million as of 30 September 2023 Evolution of Debt and Cash (USD Million) Cash Total debt Net debt $538 $506 $474 $461 $462 $431 $375 $302 $268 $275 $212 $96 $115 $64 31 Dec 19 31 Dec 20 31 Dec 21 31 Dec 22 31 Mar 23 30 Jun 23 30 Sep 23 Debt and Equity
Slide 6: Consolidated Backlog
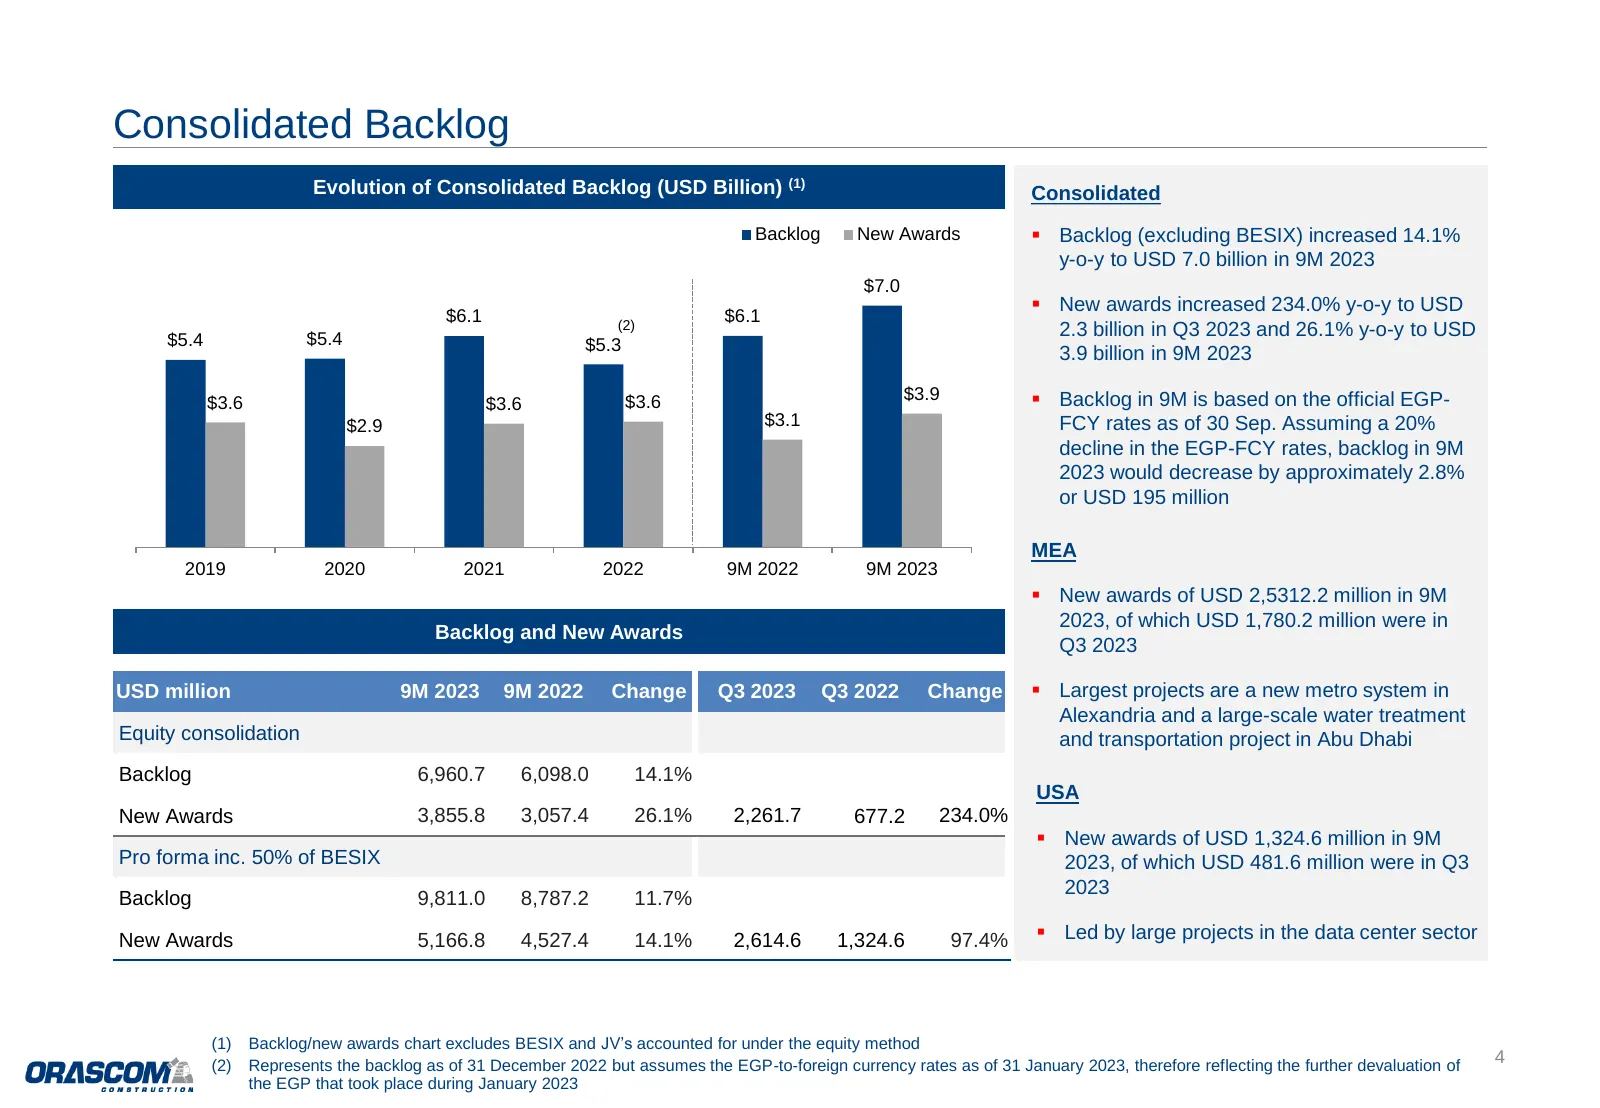
Consolidated Backlog Evolution of Consolidated Backlog (USD Billion) (1) Consolidated Backlog New Awards ▪ Backlog (excluding BESIX) increased 14.1% y-o-y to USD 7.0 billion in 9M 2023 $7.0 ▪ New awards increased 234.0% y-o-y to USD $6.1 (2) $6.1 $5.4 2.3 billion in Q3 2023 and 26.1% y-o-y to USD $5
Slide 7: Consolidated Backlog Breakdown – 30 September 2023
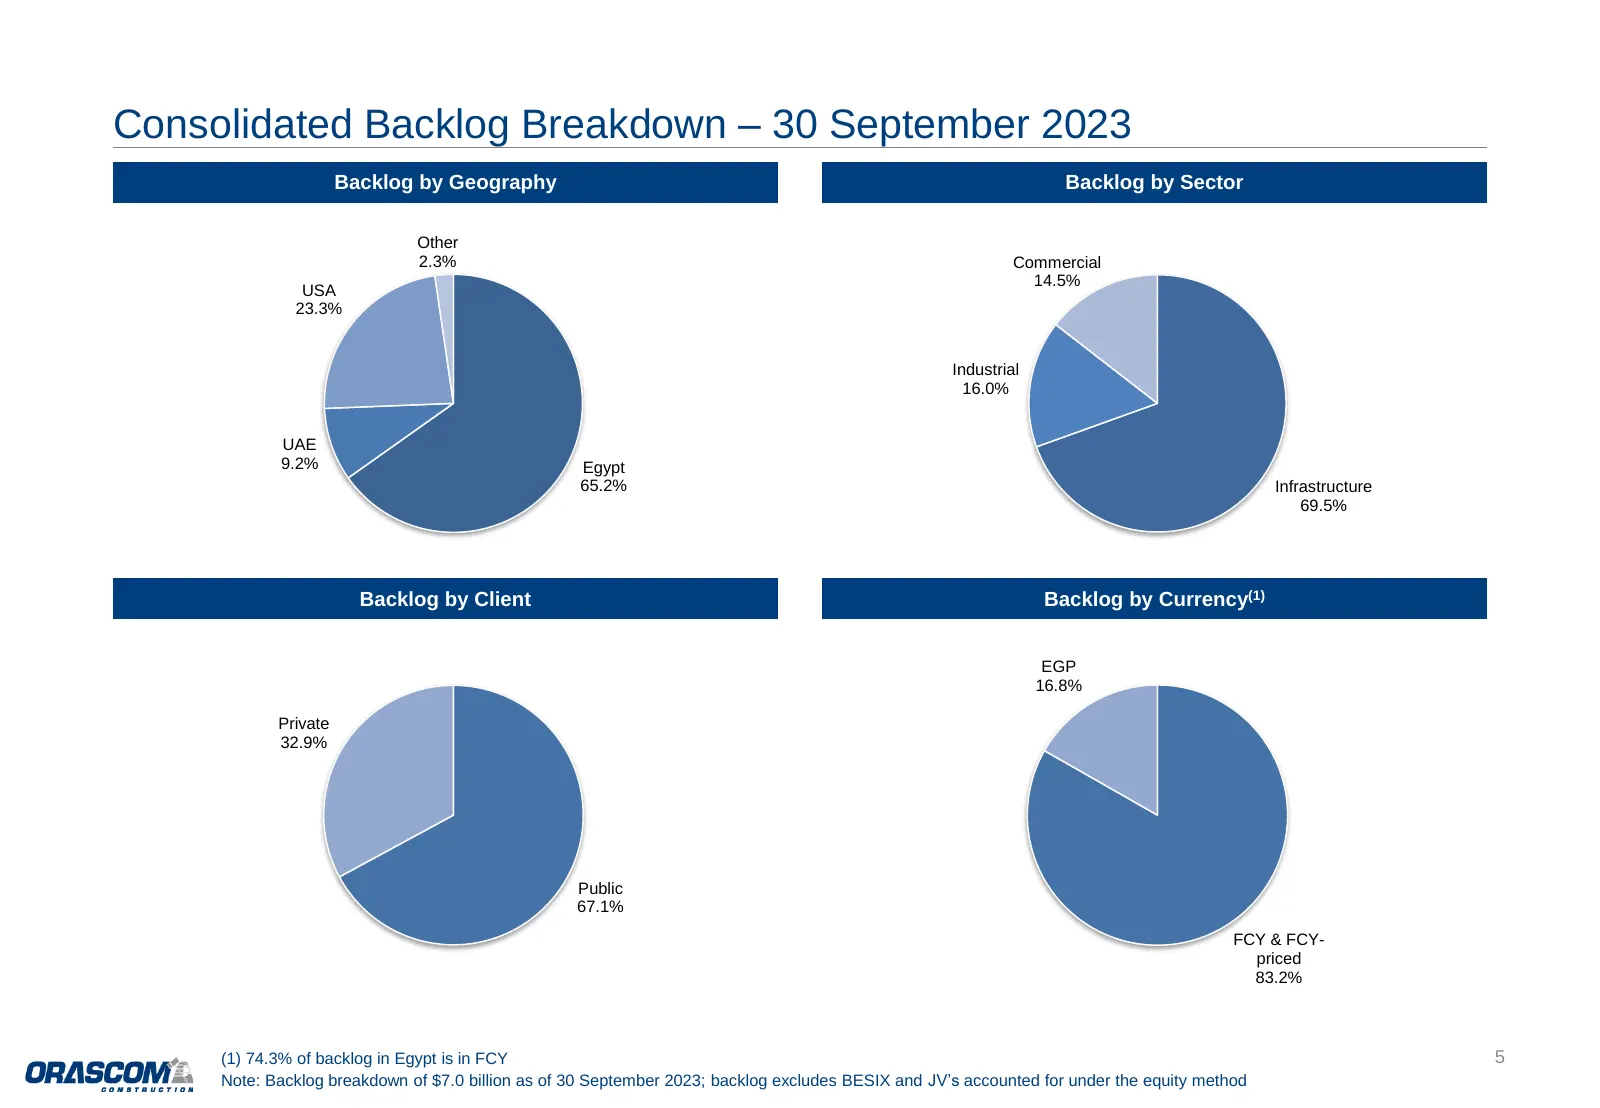
Consolidated Backlog Breakdown – 30 September 2023 Backlog by Geography Backlog by Sector Other 2.3% Commercial 14.5% USA 23.3% Industrial 16.0% UAE 9.2% Egypt 65.2% Infrastructure 69.5% Backlog by Client Backlog by Currency(1) EGP 16.8% Private 32.9% Public 67.1% FCY & FCY- priced 83.2% (1) 74.3% o
Slide 8: Evolution of Backlog by Geography
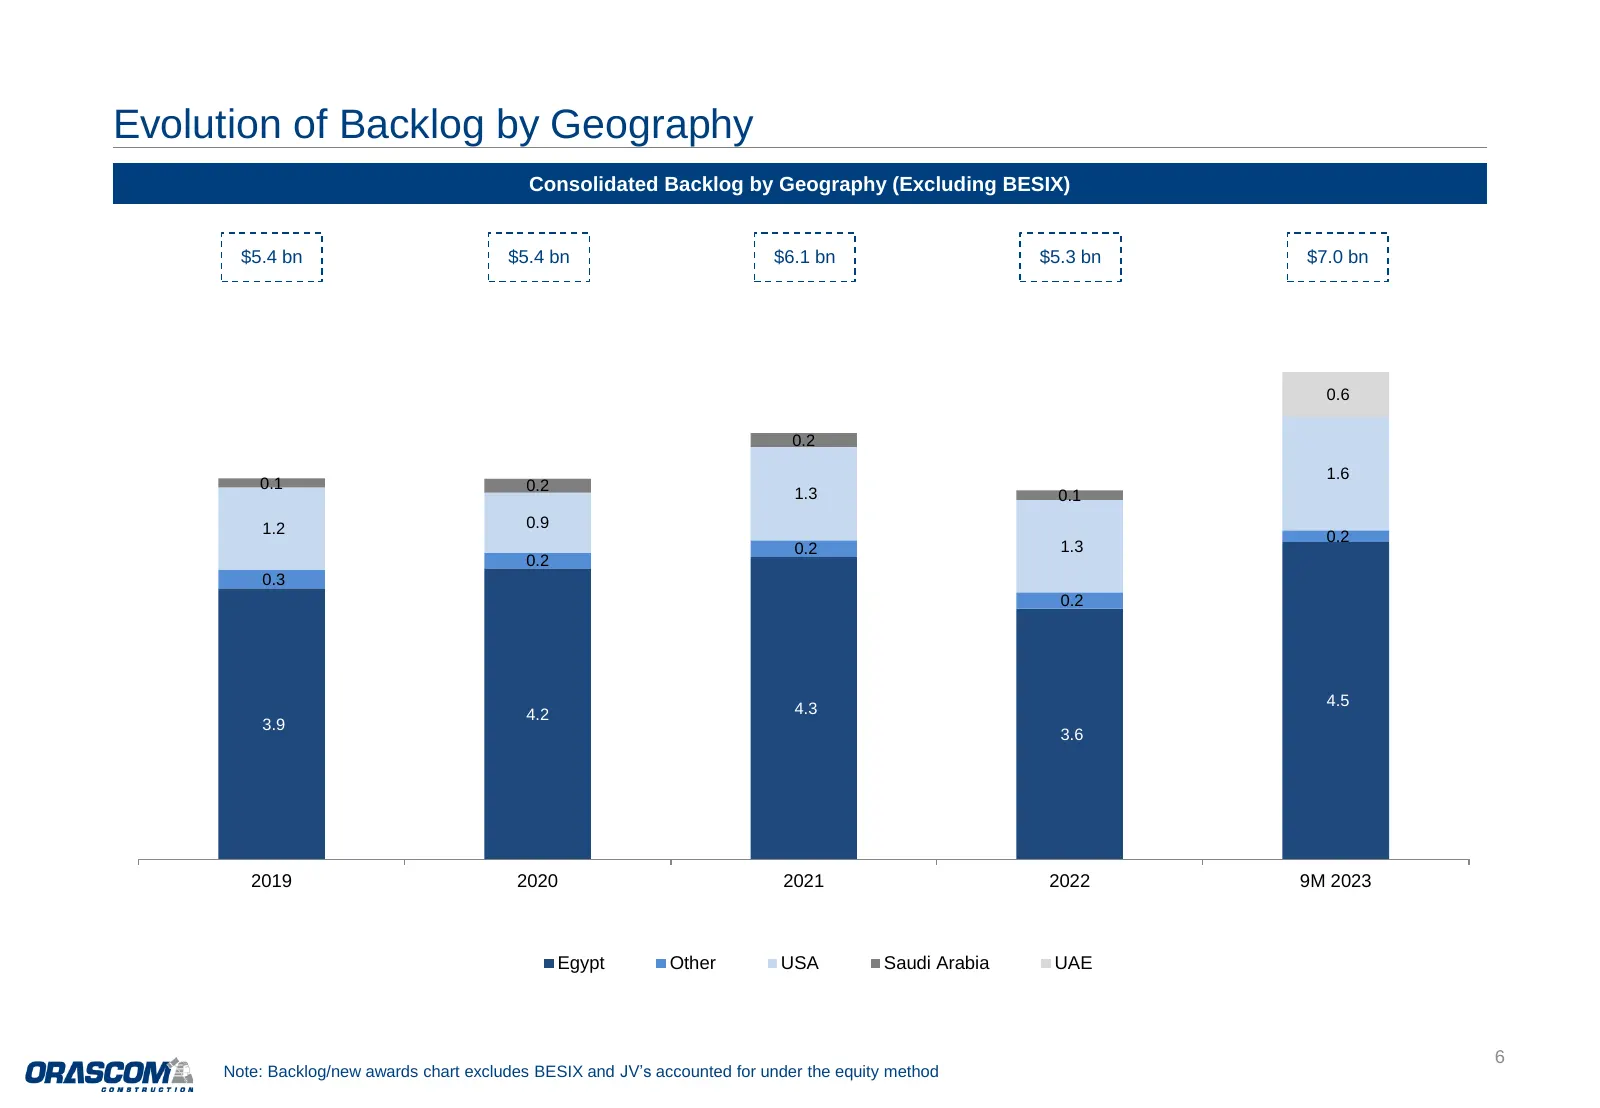
Evolution of Backlog by Geography Consolidated Backlog by Geography (Excluding BESIX) $5.4 bn $5.4 bn $6.1 bn $5.3 bn $7.0 bn 0.6 0.2 1.6 0.1 0.2 1.3 0.1 1.2 0.9 0.2 0.2 1.3 0.2 0.3 0.2 4.3 4.5 4.2 3.9 3.6 2019 2020 2021 2022 9M 2023 Egypt Other USA Saudi Arabia UAE 6 Note: Backlog/new awards chart
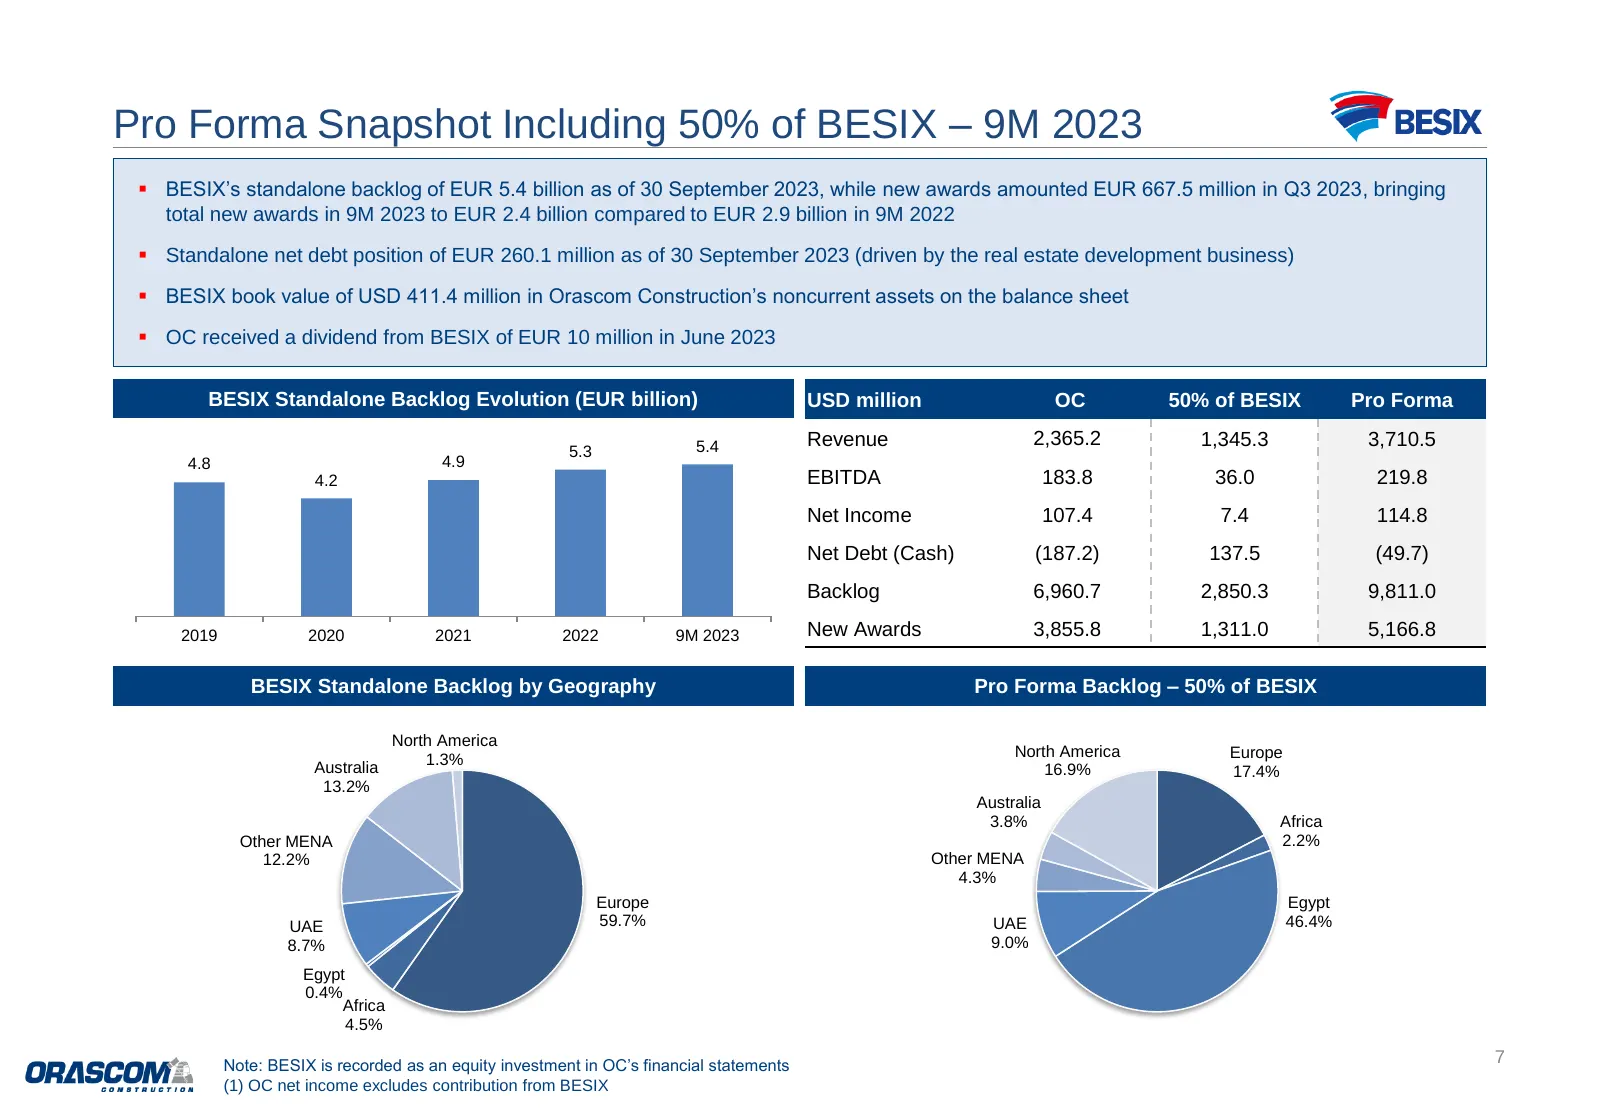
Slide 9: Pro Forma Snapshot Including 50% of BESIX – 9M 2023
Pro Forma Snapshot Including 50% of BESIX – 9M 2023 ▪ BESIX’s standalone backlog of EUR 5.4 billion as of 30 September 2023, while new awards amounted EUR 667.5 million in Q3 2023, bringing total new awards in 9M 2023 to EUR 2.4 billion compared to EUR 2.9 billion in 9M 2022 ▪ Standalone net debt po
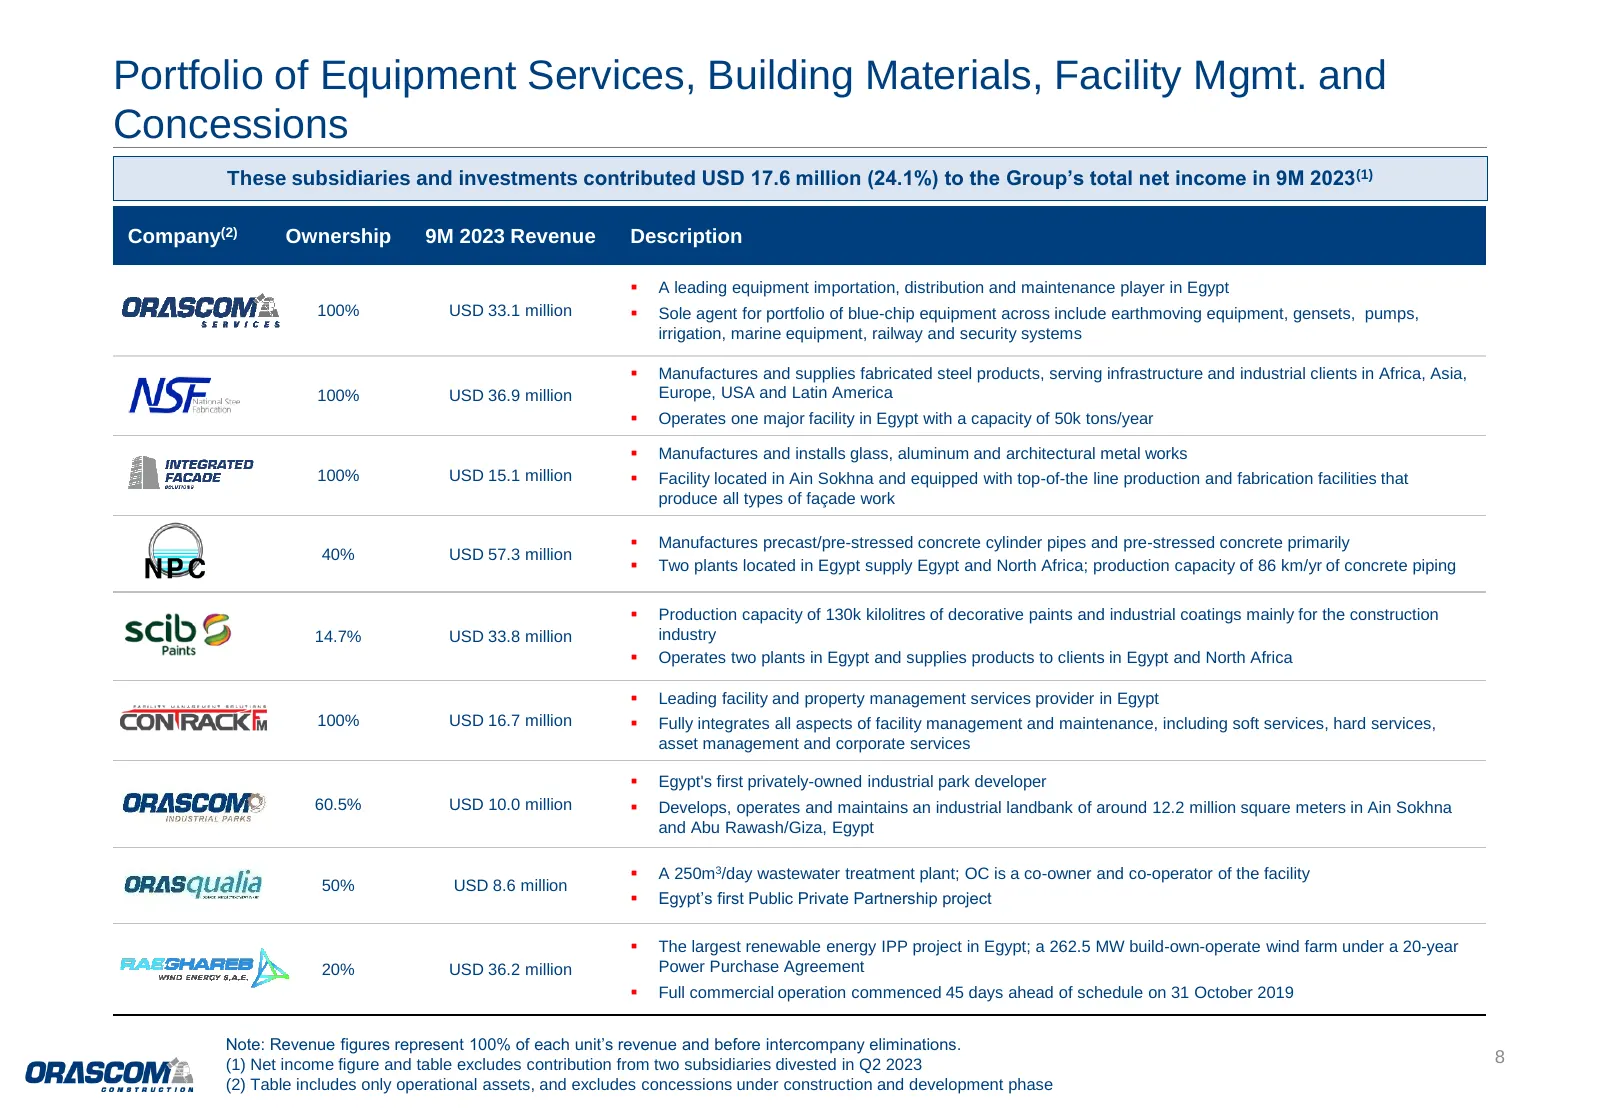
Slide 10: Portfolio of Equipment Services, Building Materials, Facility Mgmt. and Concessions
Portfolio of Equipment Services, Building Materials, Facility Mgmt. and Concessions These subsidiaries and investments contributed USD 17.6 million (24.1%) to the Group’s total net income in 9M 2023 (1) Company(2) Ownership 9M 2023 Revenue Description ▪ A leading equipment importation, distribution
Slide 11: Financial Statements
Financial Statements 10
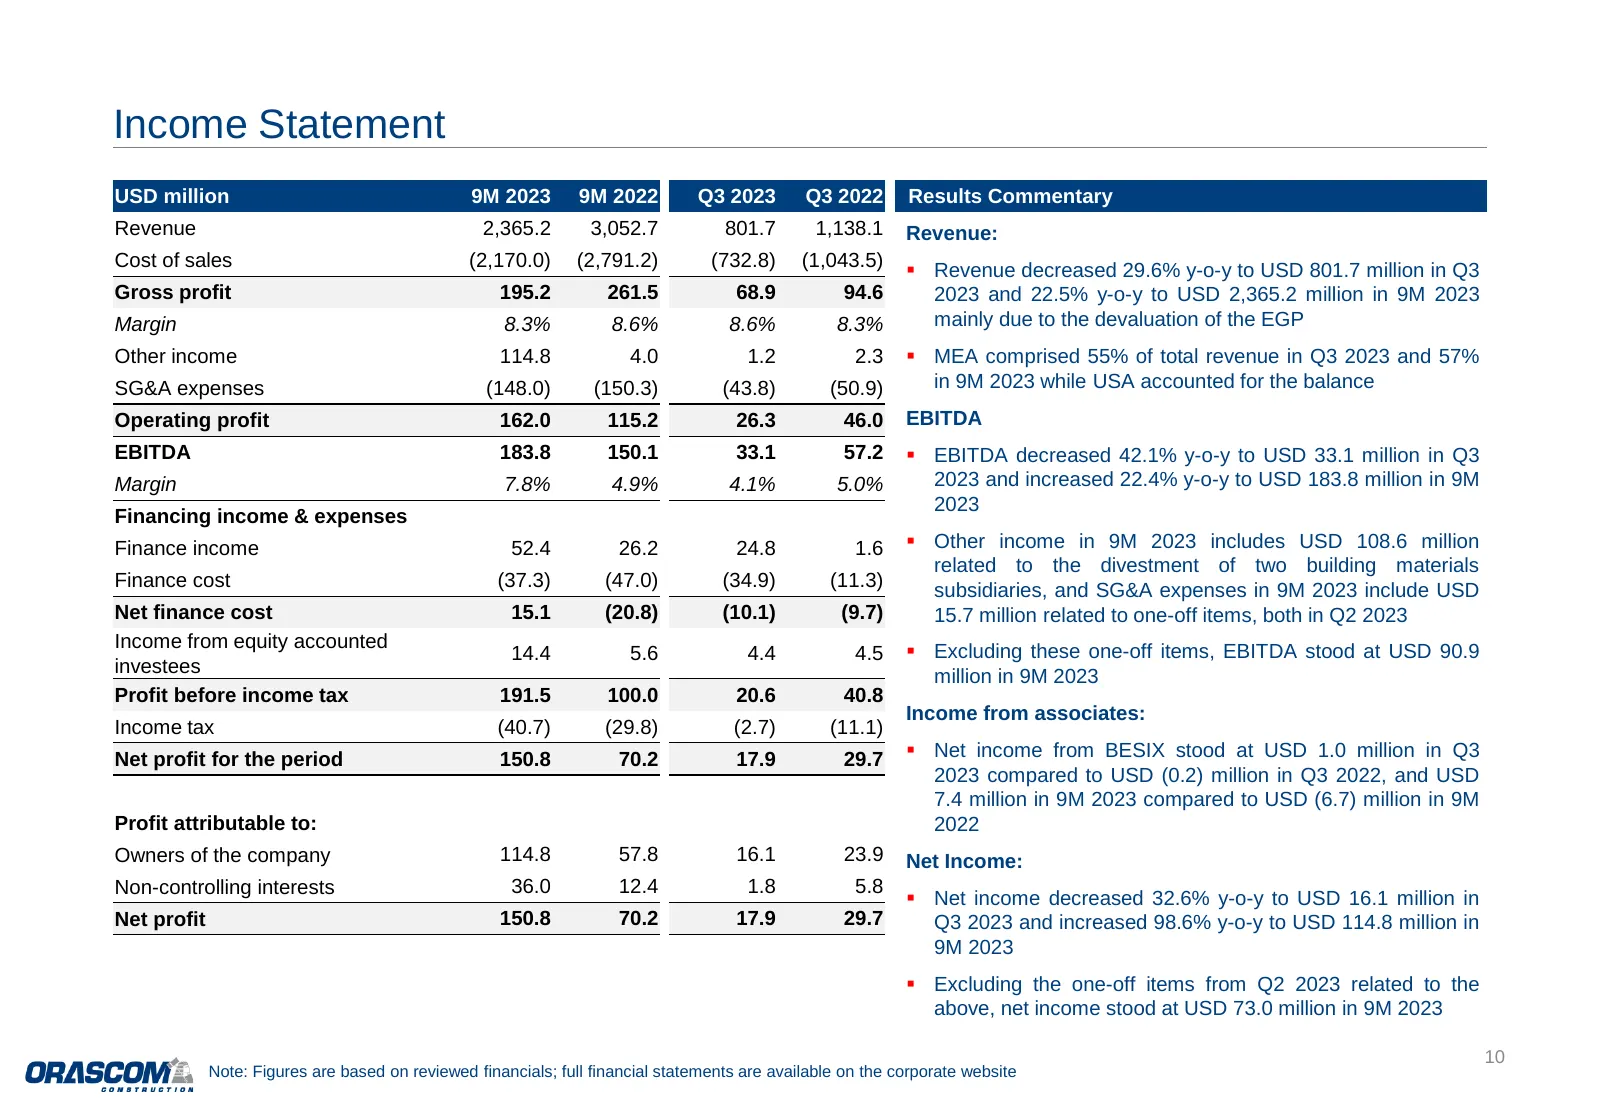
Slide 12: Income Statement
Income Statement USD million 9M 2023 9M 2022 Q3 2023 Q3 2022 Results Commentary Revenue 2,365.2 3,052.7 801.7 1,138.1 Revenue: Cost of sales (2,170.0) (2,791.2) (732.8) (1,043.5) ▪ Revenue decreased 29.6% y-o-y to USD 801.7 million in Q3 Gross profit 195.2 261.5 68.9 94.6 2023 and 22.5% y-o-y to USD
Slide 13: Balance Sheet
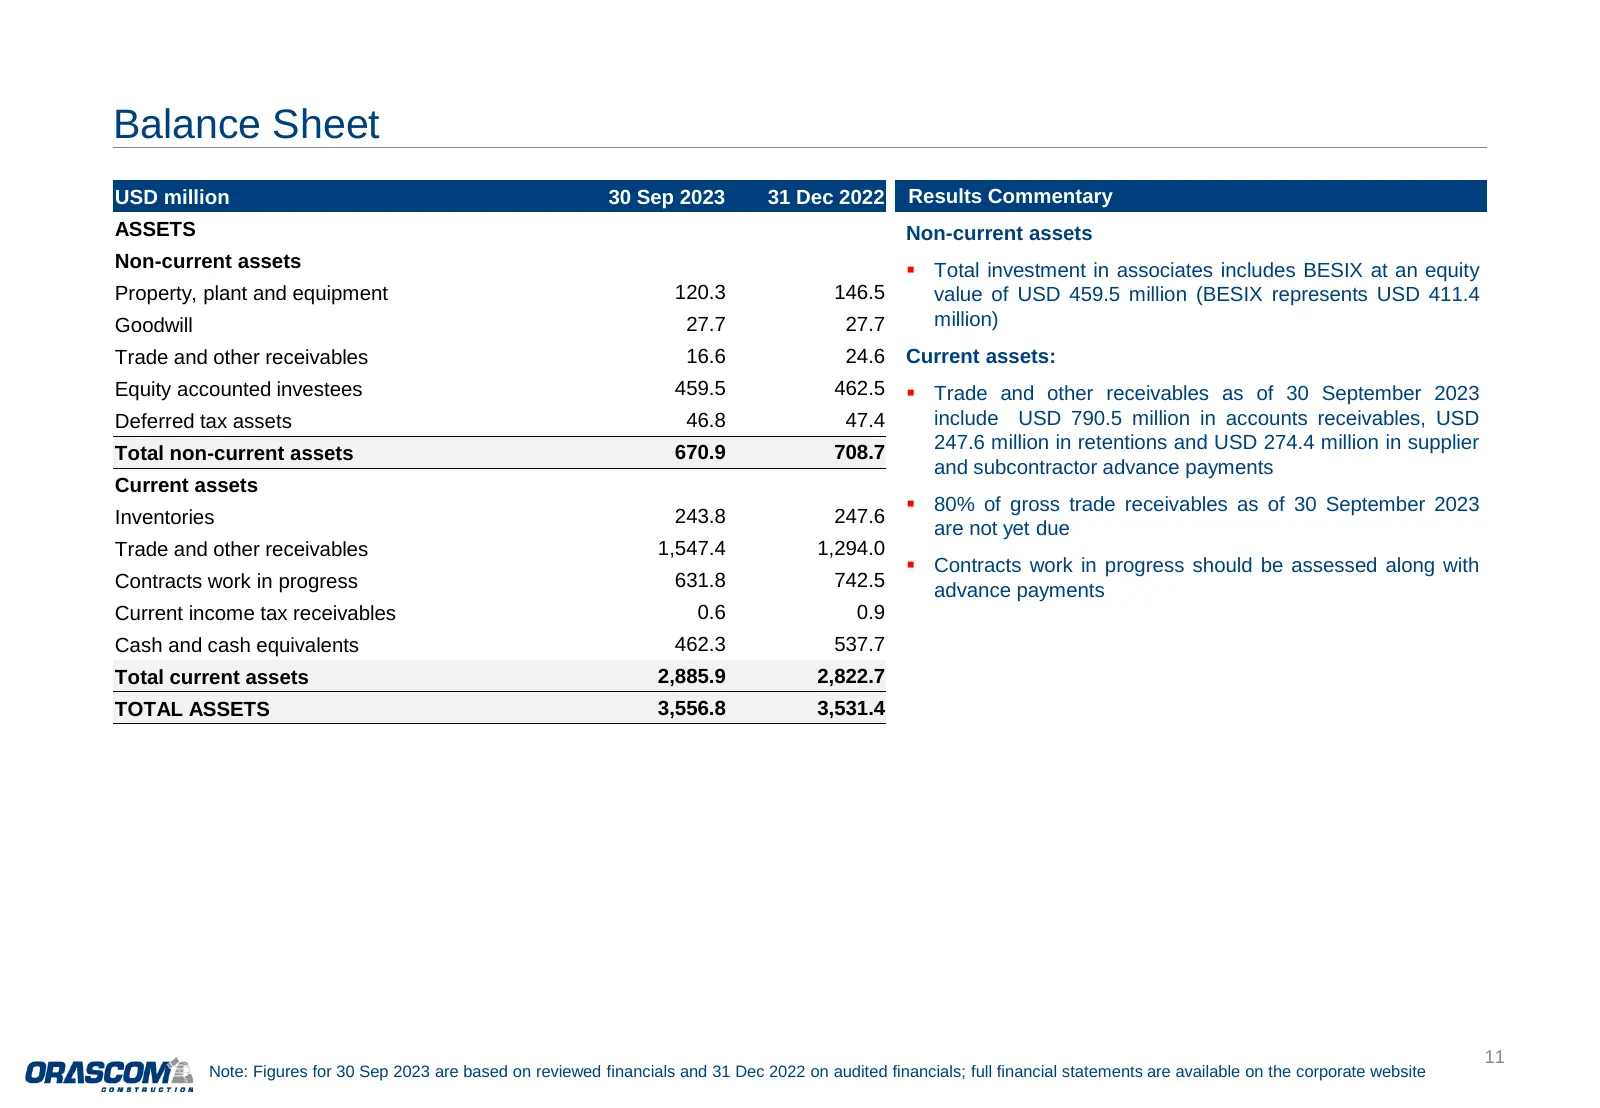
Balance Sheet USD million 30 Sep 2023 31 Dec 2022 Results Commentary ASSETS Non-current assets Non-current assets ▪ Total investment in associates includes BESIX at an equity Property, plant and equipment 120.3 146.5 value of USD 459.5 million (BESIX represents USD 411.4 Goodwill 27.7 27.7 million)
Slide 14: Balance Sheet
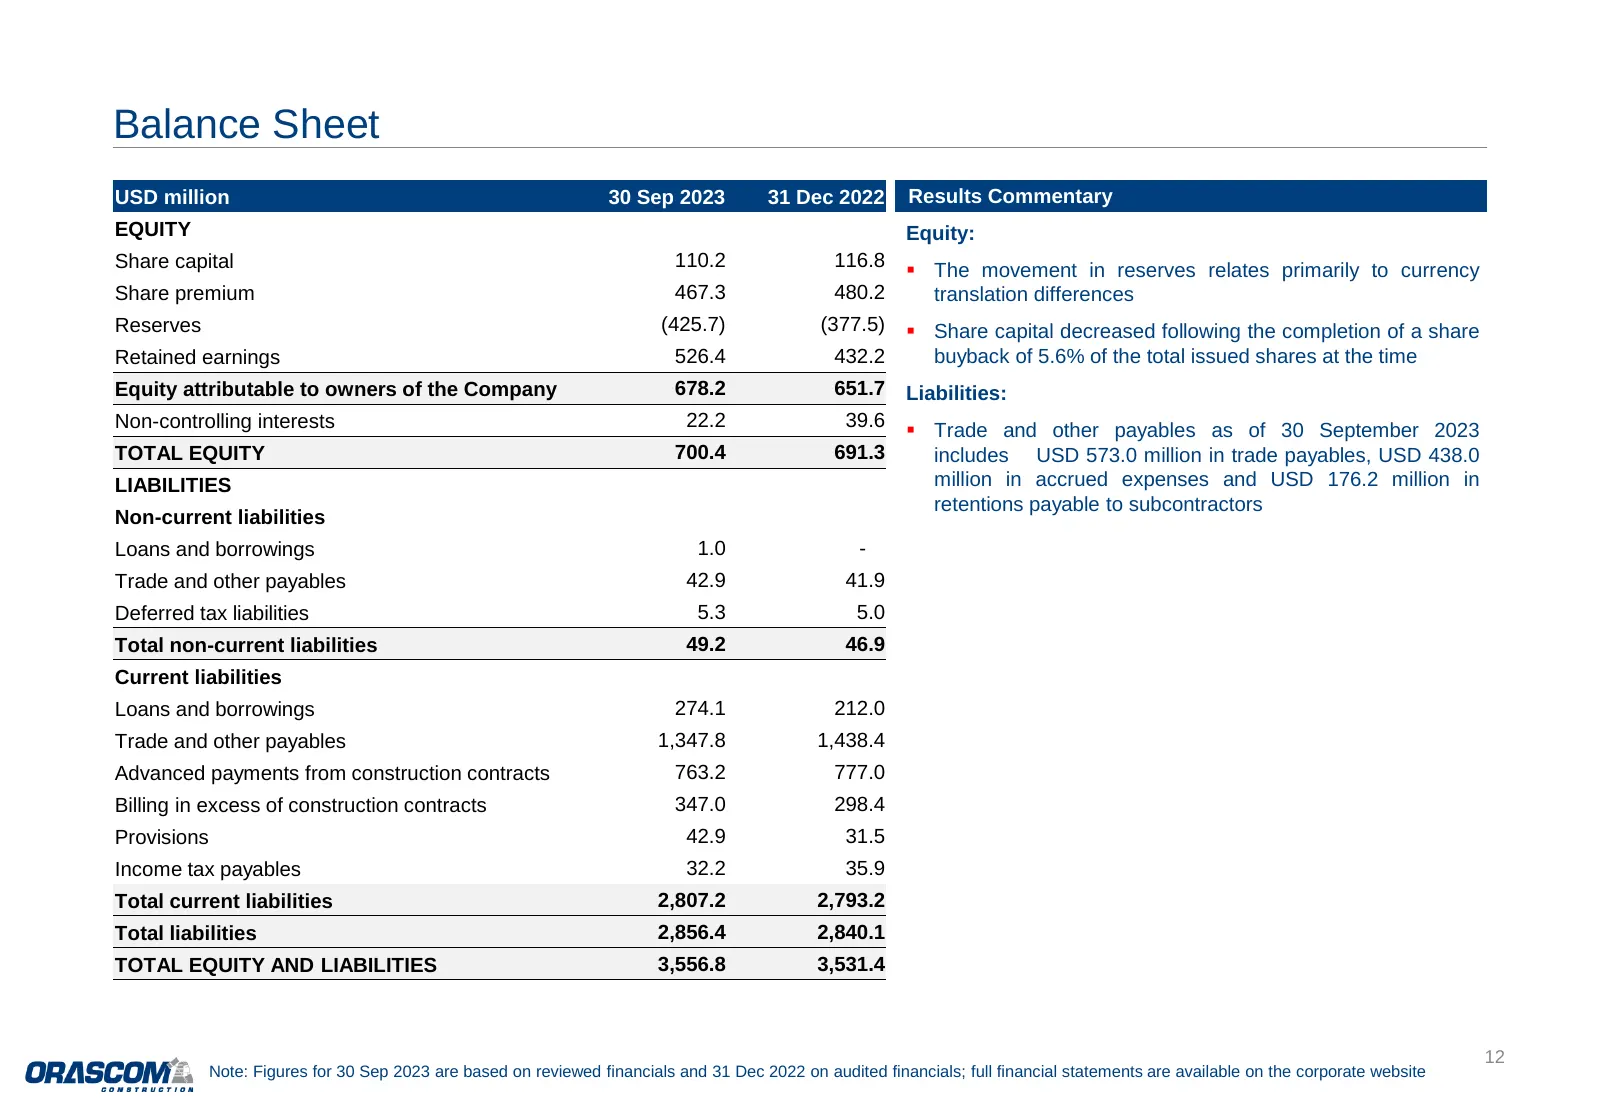
Balance Sheet USD million 30 Sep 2023 31 Dec 2022 Results Commentary EQUITY Equity: Share capital 110.2 116.8 ▪ The movement in reserves relates primarily to currency Share premium 467.3 480.2 translation differences Reserves (425.7) (377.5) ▪ Share capital decreased following the completion of a sh
Slide 15: Cash Flow Statement
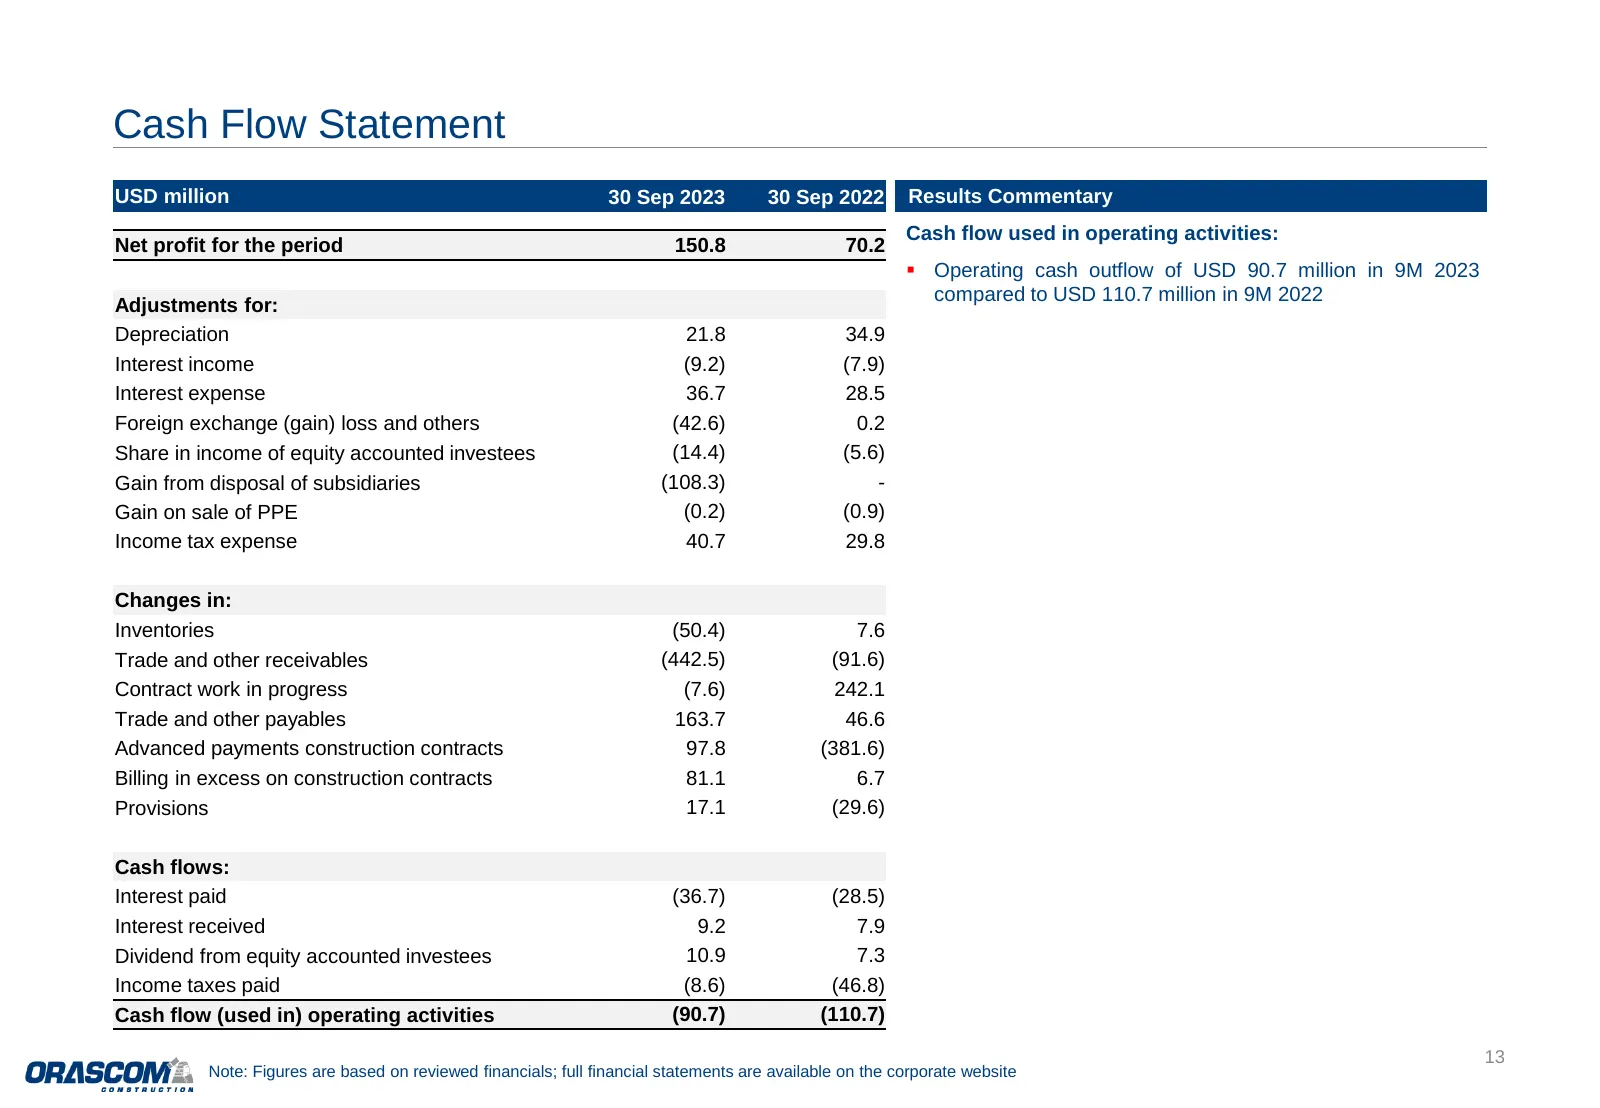
Cash Flow Statement USD million 30 Sep 2023 30 Sep 2022 Results Commentary Cash flow used in operating activities: Net profit for the period 150.8 70.2 ▪ Operating cash outflow of USD 90.7 million in 9M 2023 Adjustments for: compared to USD 110.7 million in 9M 2022 Depreciation 21.8 34.9 Interest in
Slide 16: Cash Flow Statement
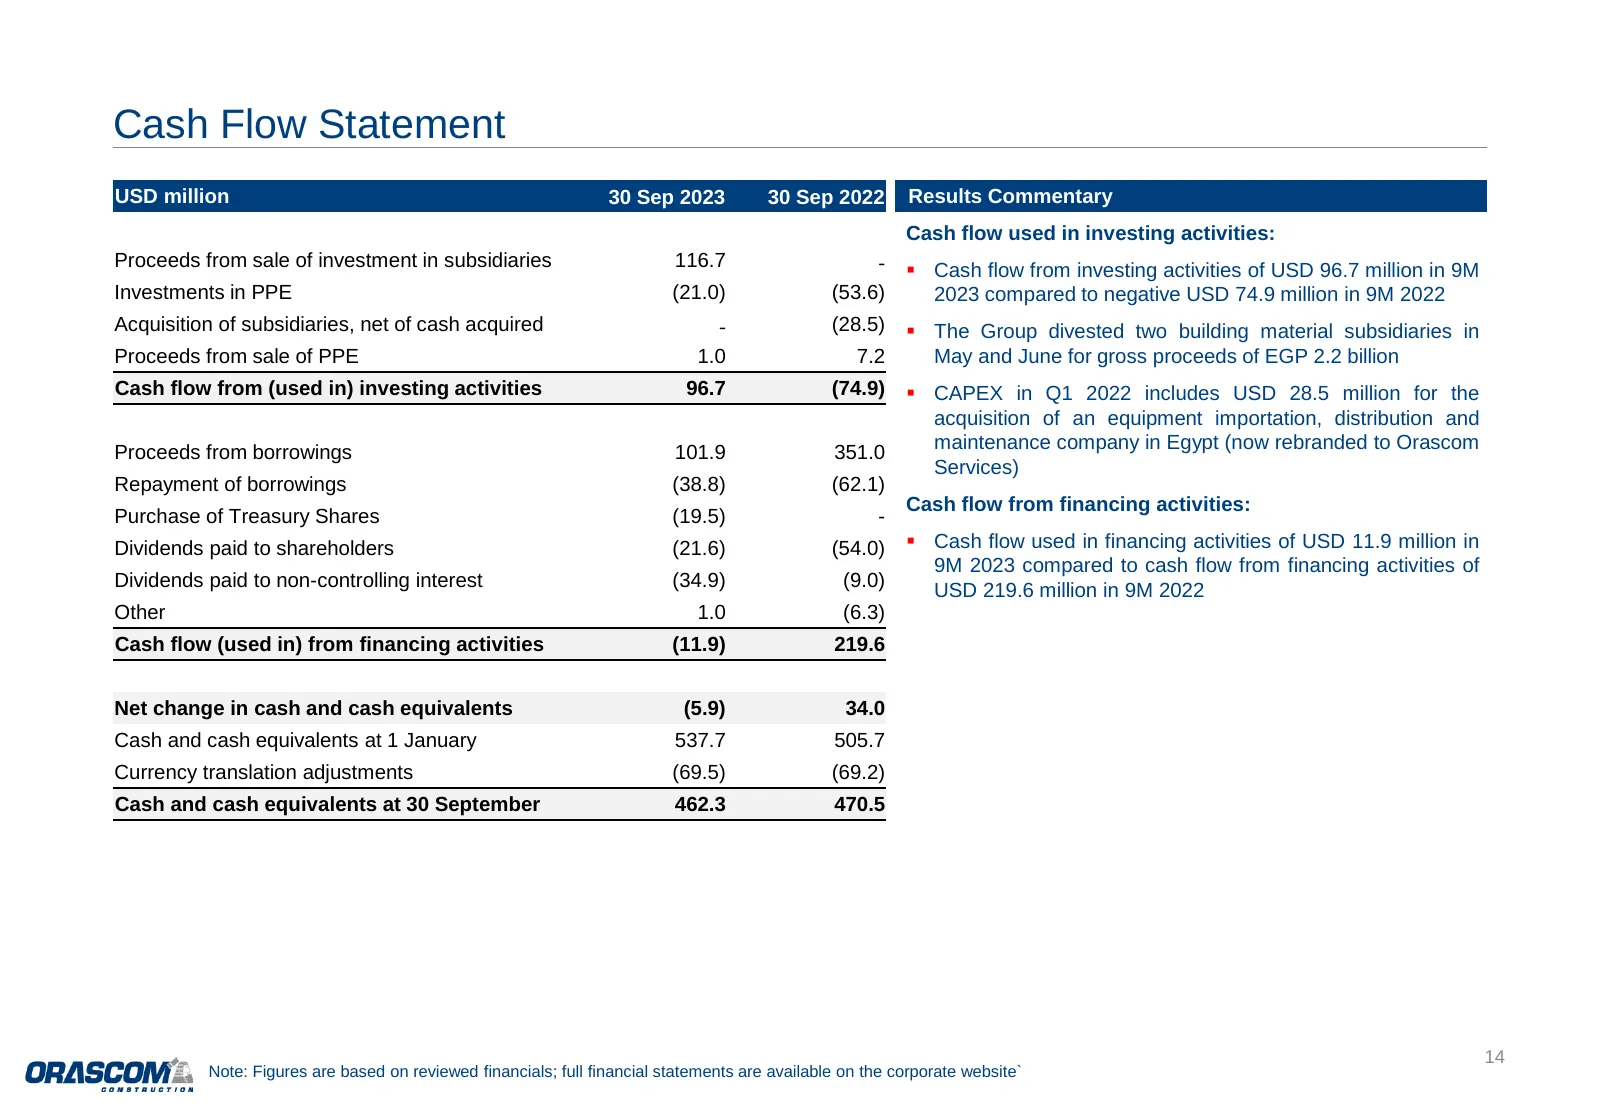
Cash Flow Statement USD million 30 Sep 2023 30 Sep 2022 Results Commentary Cash flow used in investing activities: Proceeds from sale of investment in subsidiaries 116.7 - ▪ Cash flow from investing activities of USD 96.7 million in 9M Investments in PPE (21.0) (53.6) 2023 compared to negative USD 7
Slide 17: Important Notice and Disclaimer
Important Notice and Disclaimer This document has been provided to you for information purposes only. This document does not constitute an offer of, or an invitation to invest or deal in, the securities of Orascom Construction PLC (the “Company”). The information set out in this document shall not f

Slide 18: Contact Investor Relations
Contact Investor Relations: Hesham El Halaby Director hesham.elhalaby@orascom.com T: +971 4 318 0900 NASDAQ Dubai: OC EGX: ORAS www.orascom.com
Source: Internet Archive copy of orascom.com
More decks from Orascom Construction PLC
 9M 2026 Earnings Presentation17 slides · Nov 18, 2026
 H1 2026 Earnings Presentation17 slides · Aug 14, 2026
 Investor Presentation (August 2026)27 slides · August 2026
 Q1 2026 Earnings Presentation16 slides · May 14, 2026
 Investor Presentation (May 2026)26 slides · May 2026
 Investor Presentation (April 2026)26 slides · April 2026