RFA Financial Inc. · TSX:RFA
RFA Financial — Artis Real Estate Investment Trust — Q4 2016 Earnings Presentation
22 slides from RFA Financial's earnings presentation, March 2017
Slide 1: Artis Real Estate Investment Trust Investor Presentation Q4 2016
Artis Real Estate Investment Trust Investor Presentation Q4 – 2016 PROPERTIES OF SUCCESS 1
Slide 2: Forward-Looking Statements
ARTIS REAL ESTATE INVESTMENT TRUST FORWARD-LOOKING STATEMENTS This presentation may contain forward-looking statements. For this purpose, any statements contained herein that are not statements of historical fact may be deemed to be forward-looking statements. Without limiting the foregoing, the wor
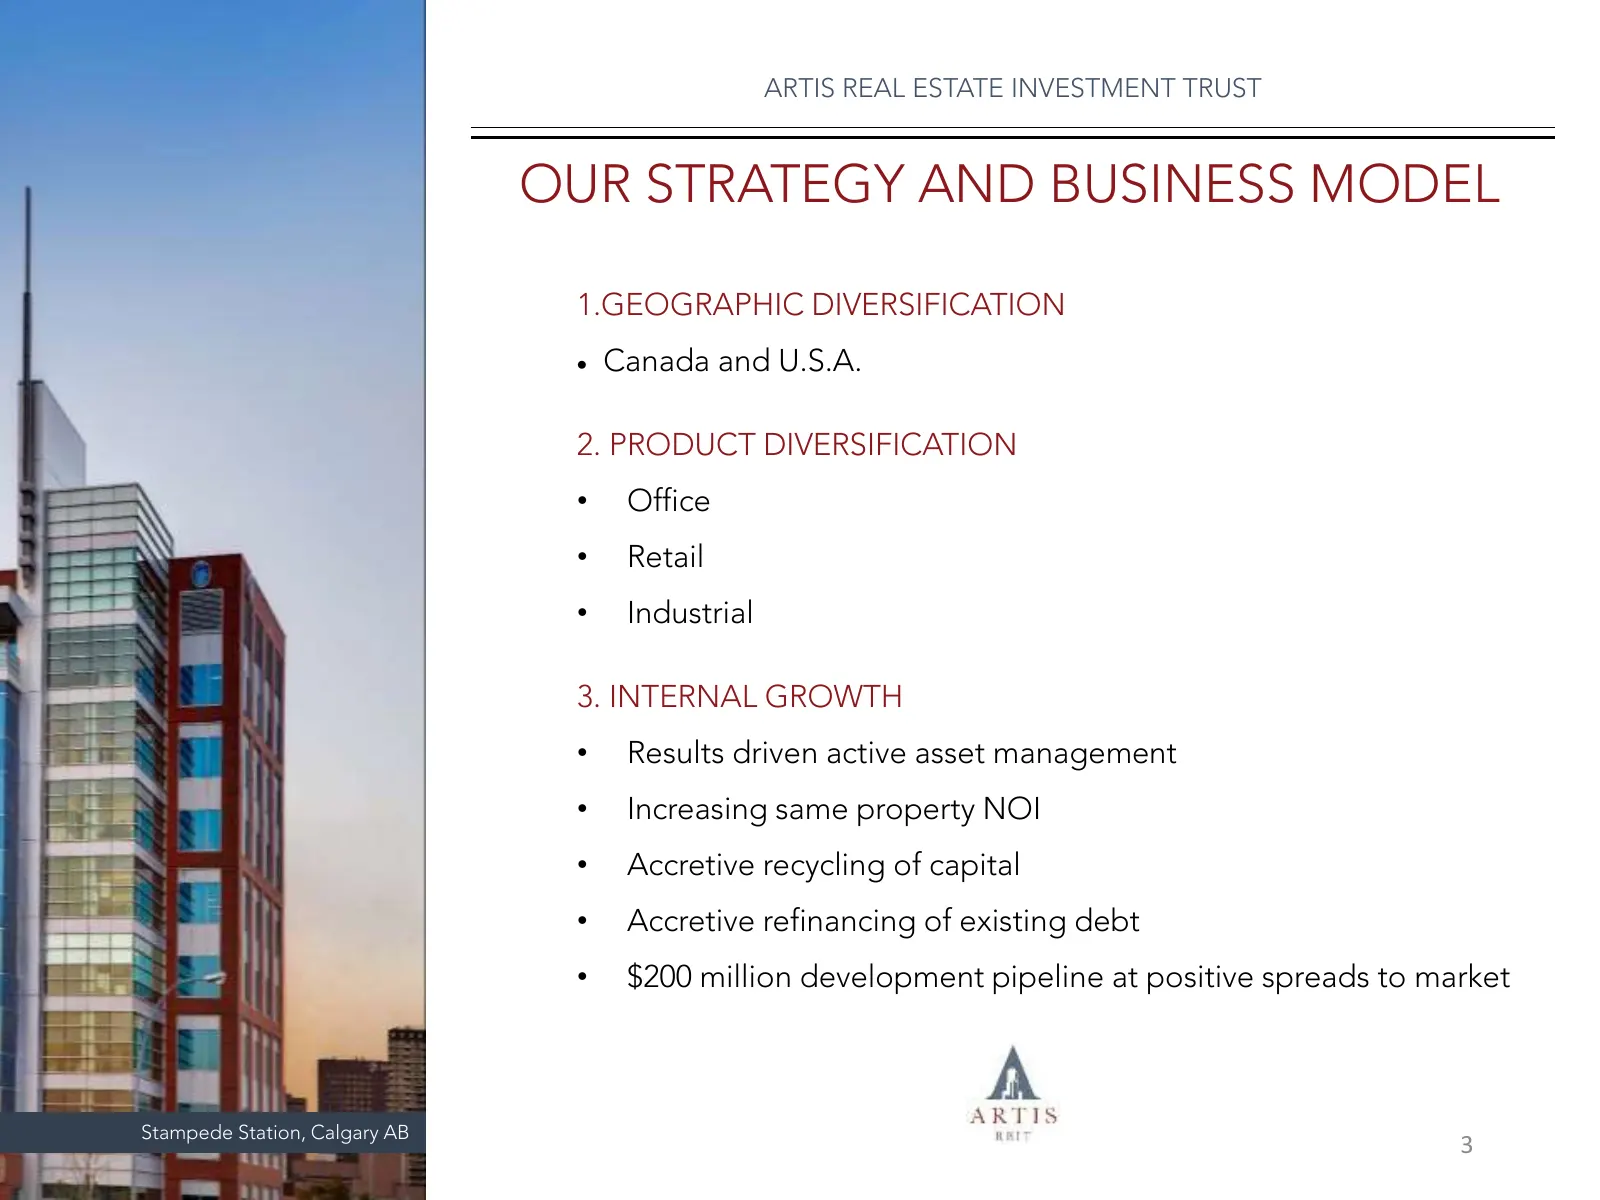
Slide 3: Our Strategy and Business Model
ARTIS REAL ESTATE INVESTMENT TRUST OUR STRATEGY AND BUSINESS MODEL 1.GEOGRAPHIC DIVERSIFICATION • Canada and U.S.A. 2. PRODUCT DIVERSIFICATION • Office • Retail • Industrial 3. INTERNAL GROWTH • Results driven active asset management • Increasing same property NOI • Accretive recycling of capital •
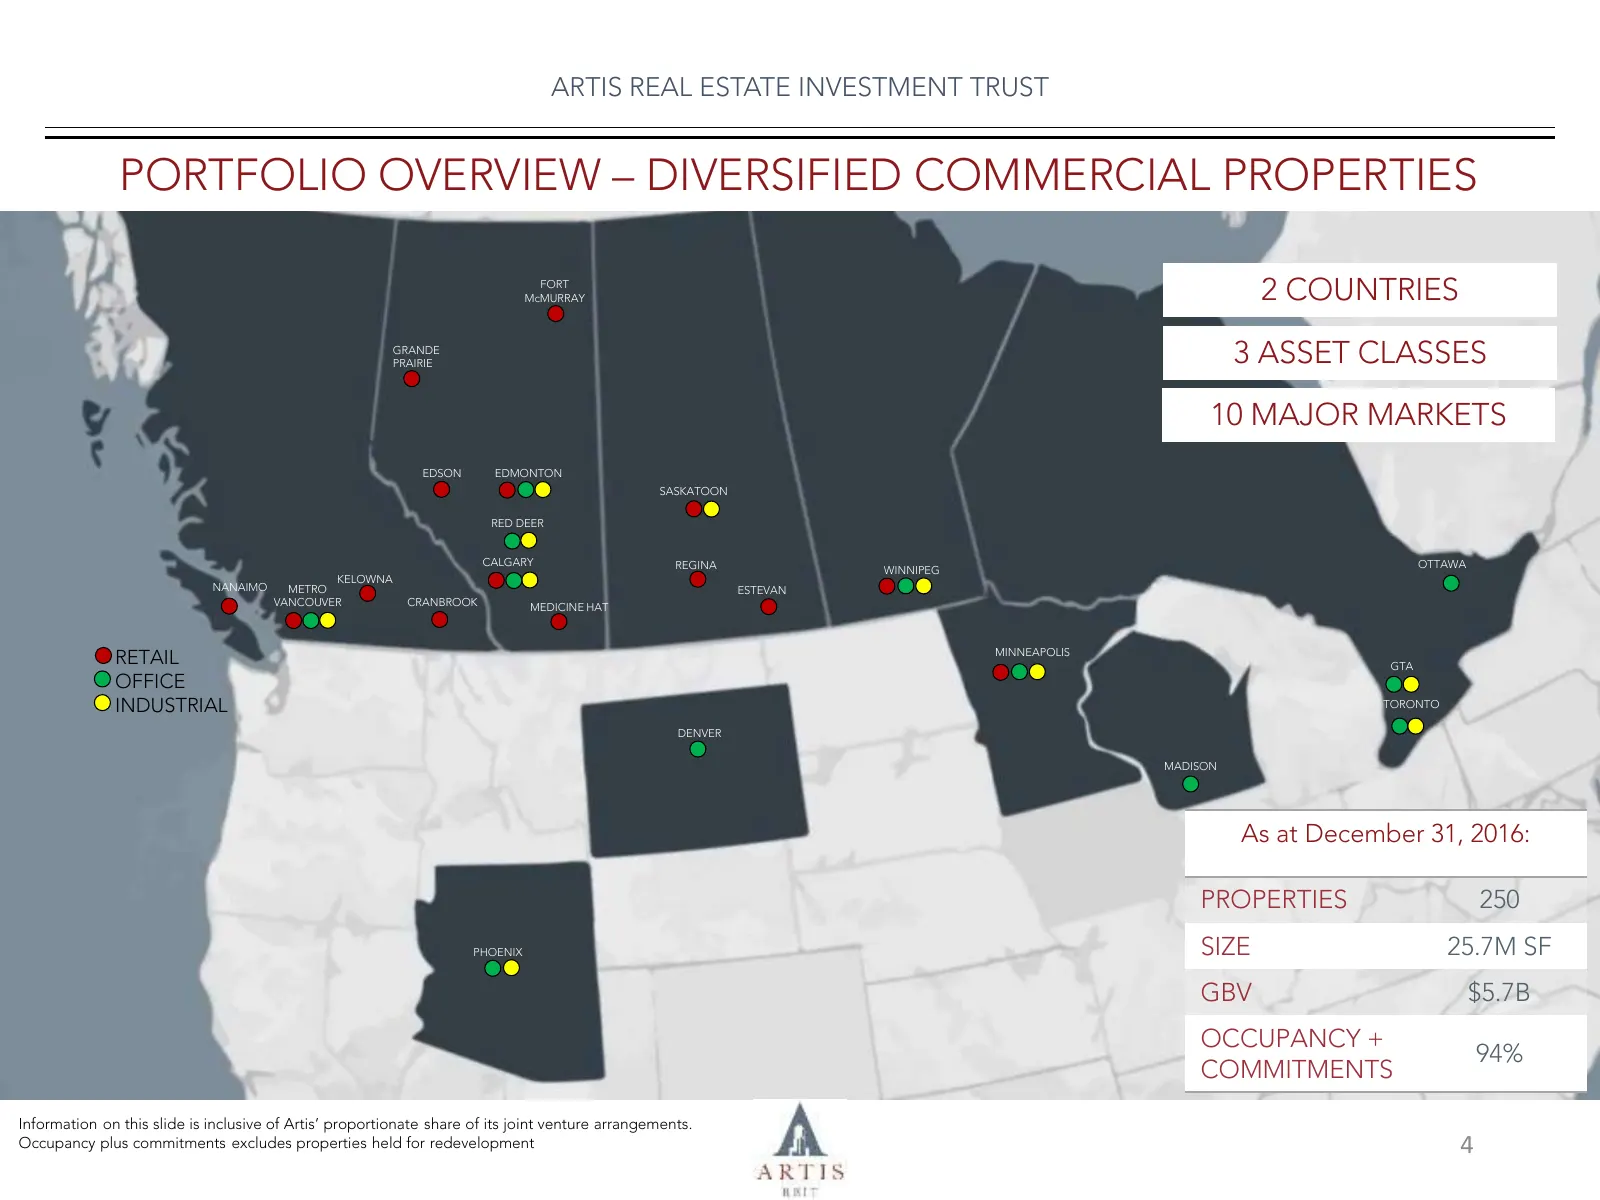
Slide 4: Portfolio Overview – Diversified Commercial Properties
ARTIS REAL ESTATE INVESTMENT TRUST PORTFOLIO OVERVIEW – DIVERSIFIED COMMERCIAL PROPERTIES FORT McMURRAY 2 COUNTRIES GRANDE PRAIRIE 3 ASSET CLASSES 10 MAJOR MARKETS EDSON EDMONTON SASKATOON RED DEER CALGARY REGINA OTTAWA WINNIPEG KELOWNA NANAIMO METRO ESTEVAN VANCOUVER CRANBROOK MEDICINE HAT RETAIL M
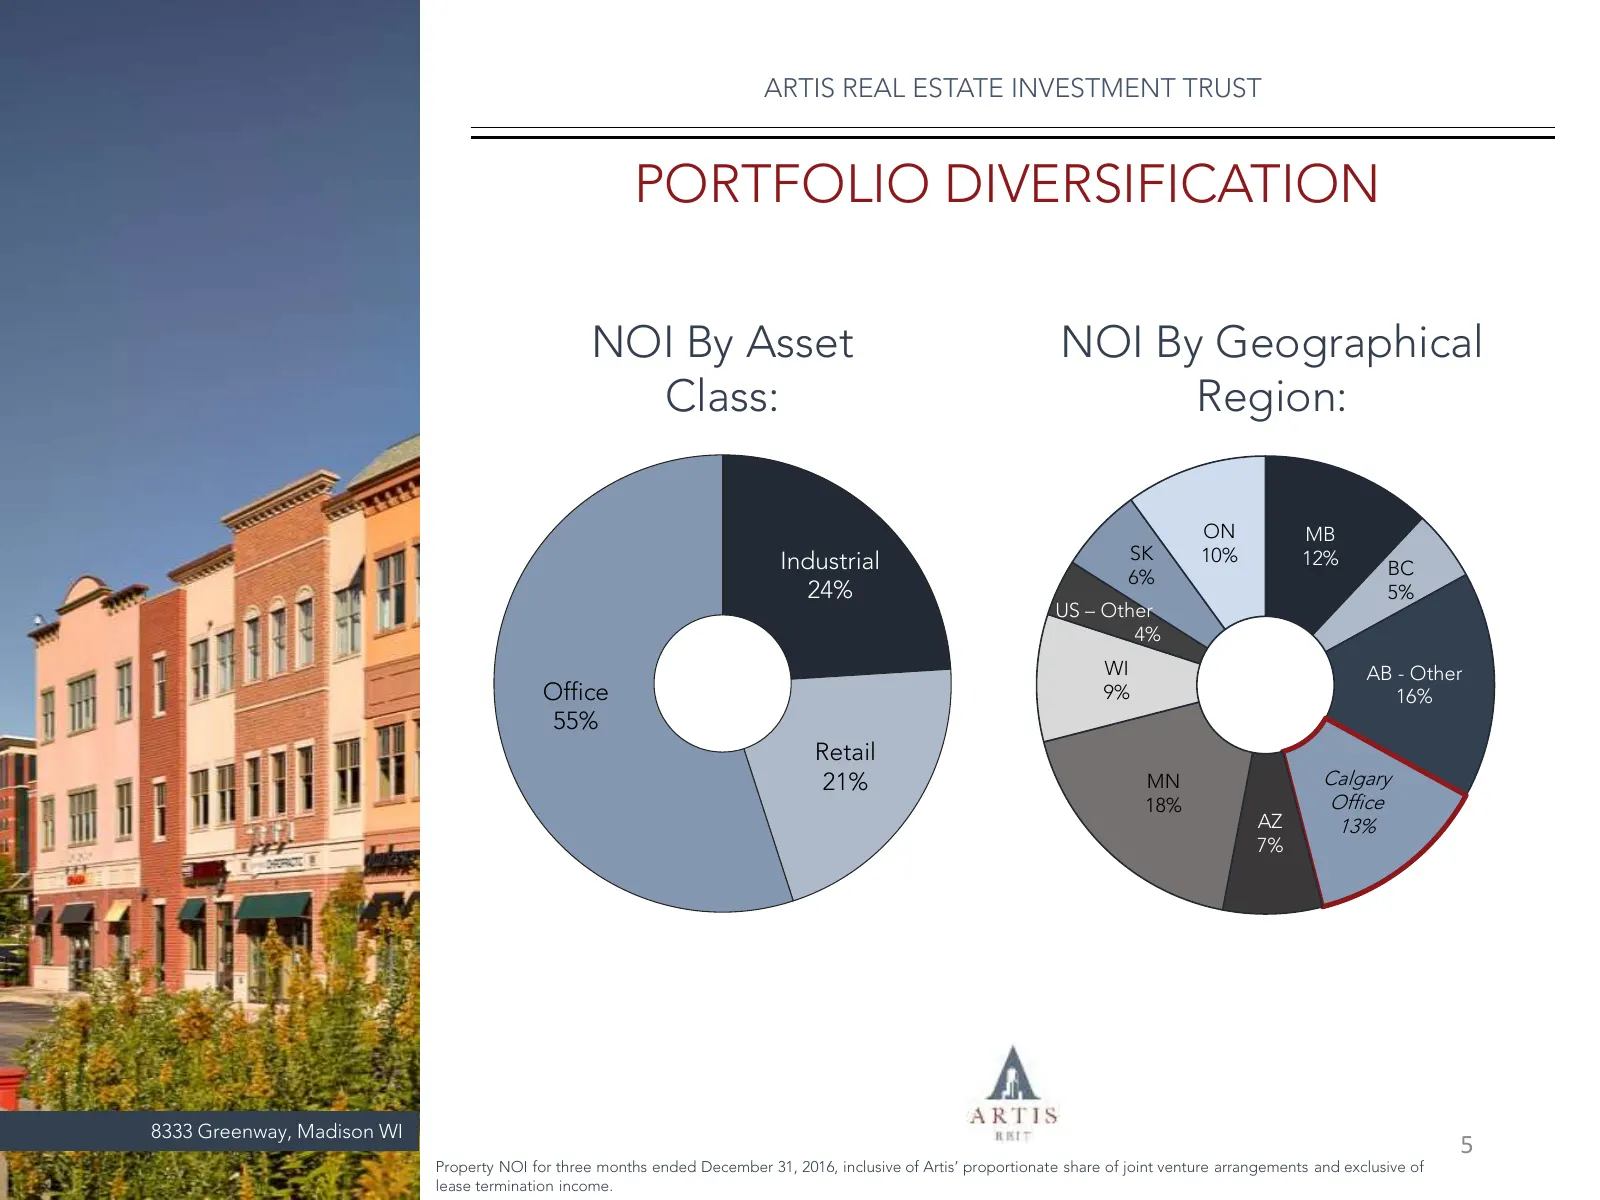
Slide 5: Portfolio Diversification
ARTIS REAL ESTATE INVESTMENT TRUST PORTFOLIO DIVERSIFICATION NOI By Asset NOI By Geographical Class: Region: ON MB Industrial SK 10% 12% 6% BC 24% 5% US – Other 4% WI AB - Other Office 9% 16% 55% Retail 21% MN Calgary 18% Office AZ 13% 7% 8333 Greenway, Madison WI 5 Property NOI for three months end
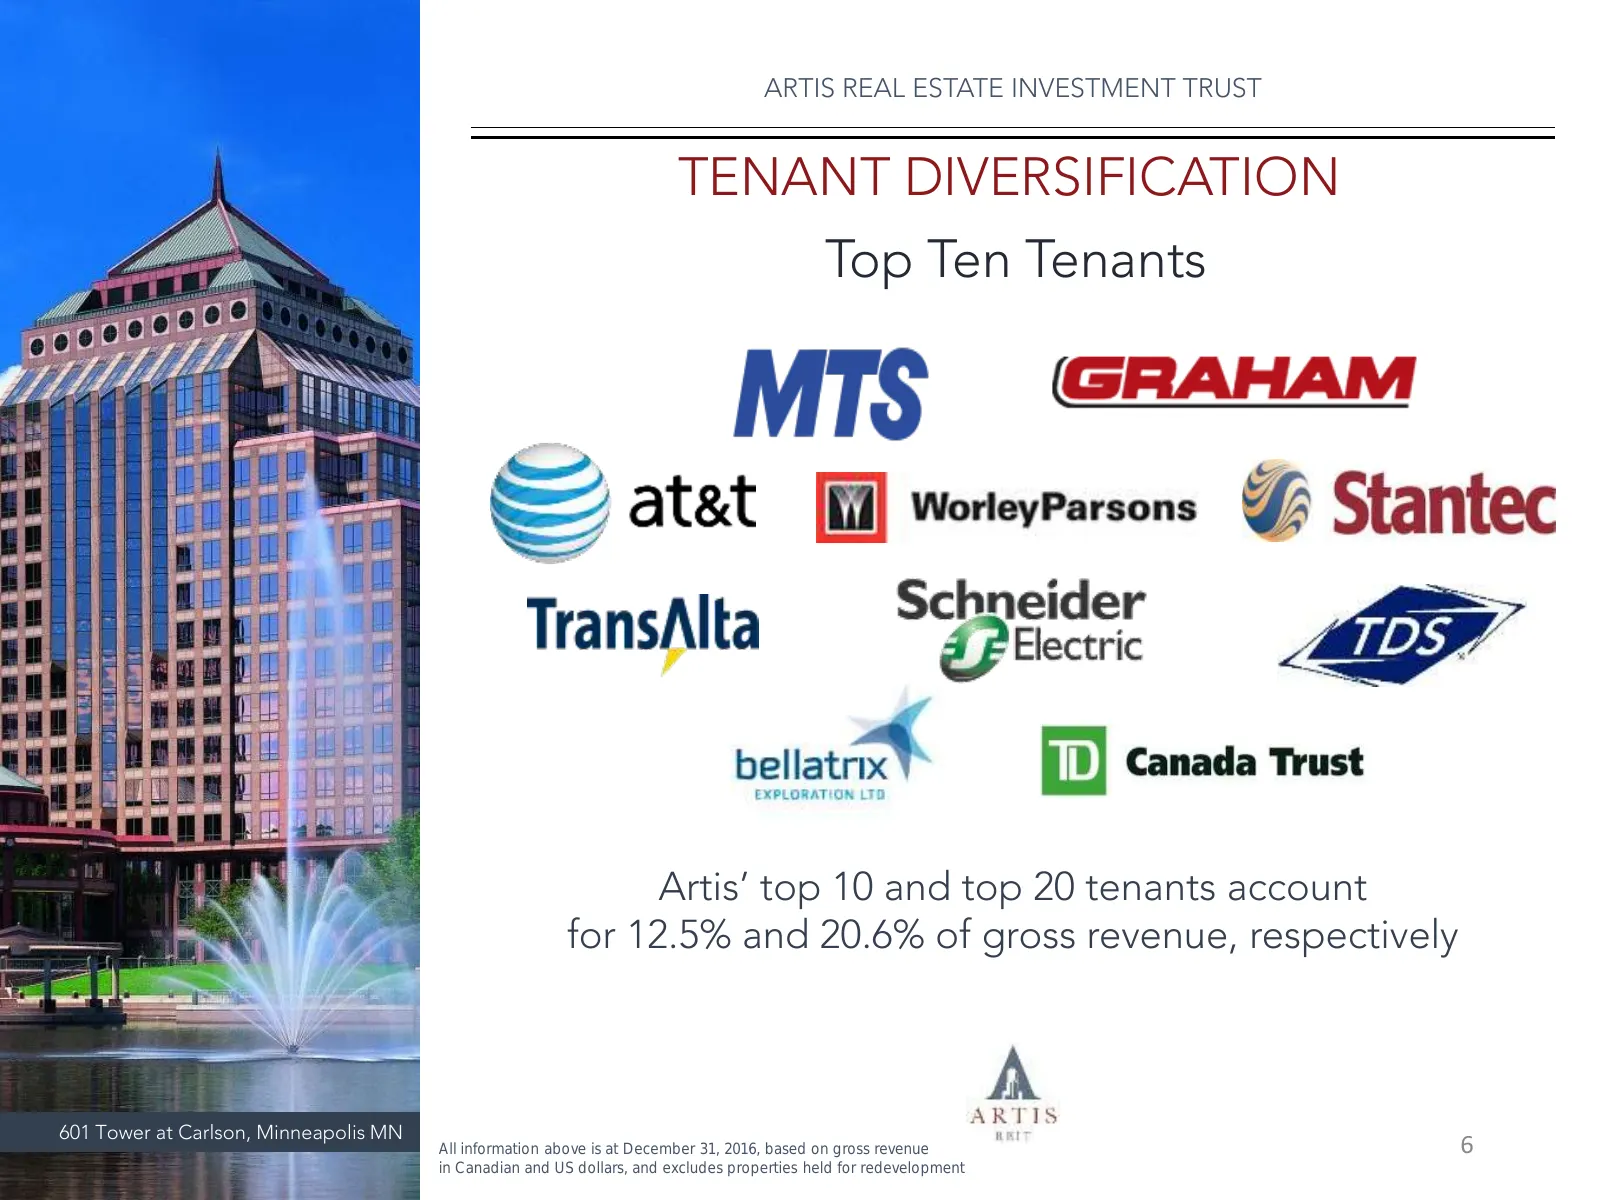
Slide 6: Tenant Diversification
ARTIS REAL ESTATE INVESTMENT TRUST TENANT DIVERSIFICATION Top Ten Tenants Artis’ top 10 and top 20 tenants account for 12.5% and 20.6% of gross revenue, respectively 601 Tower at Carlson, Minneapolis MN All information above is at December 31, 2016, based on gross revenue 6 in Canadian and US dollar
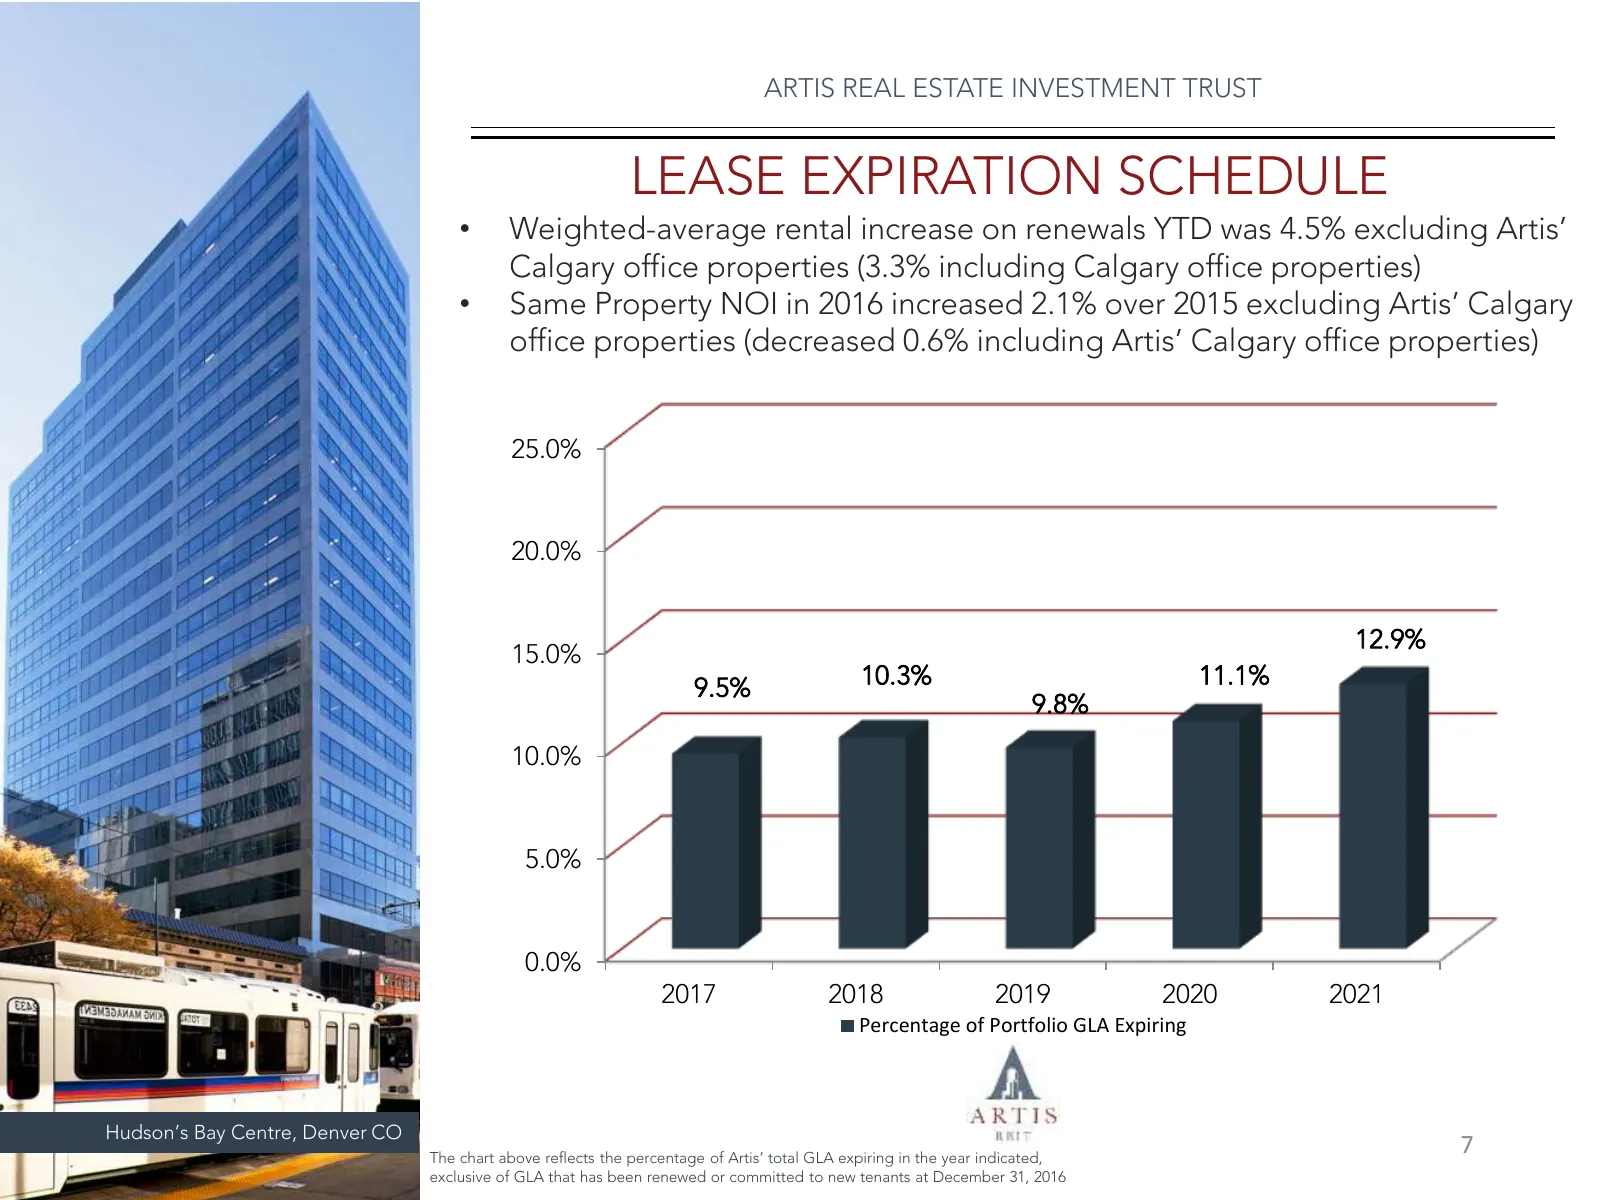
Slide 7: Lease Expiration Schedule
ARTIS REAL ESTATE INVESTMENT TRUST LEASE EXPIRATION SCHEDULE • Weighted-average rental increase on renewals YTD was 4.5% excluding Artis’ Calgary office properties (3.3% including Calgary office properties) • Same Property NOI in 2016 increased 2.1% over 2015 excluding Artis’ Calgary office properti
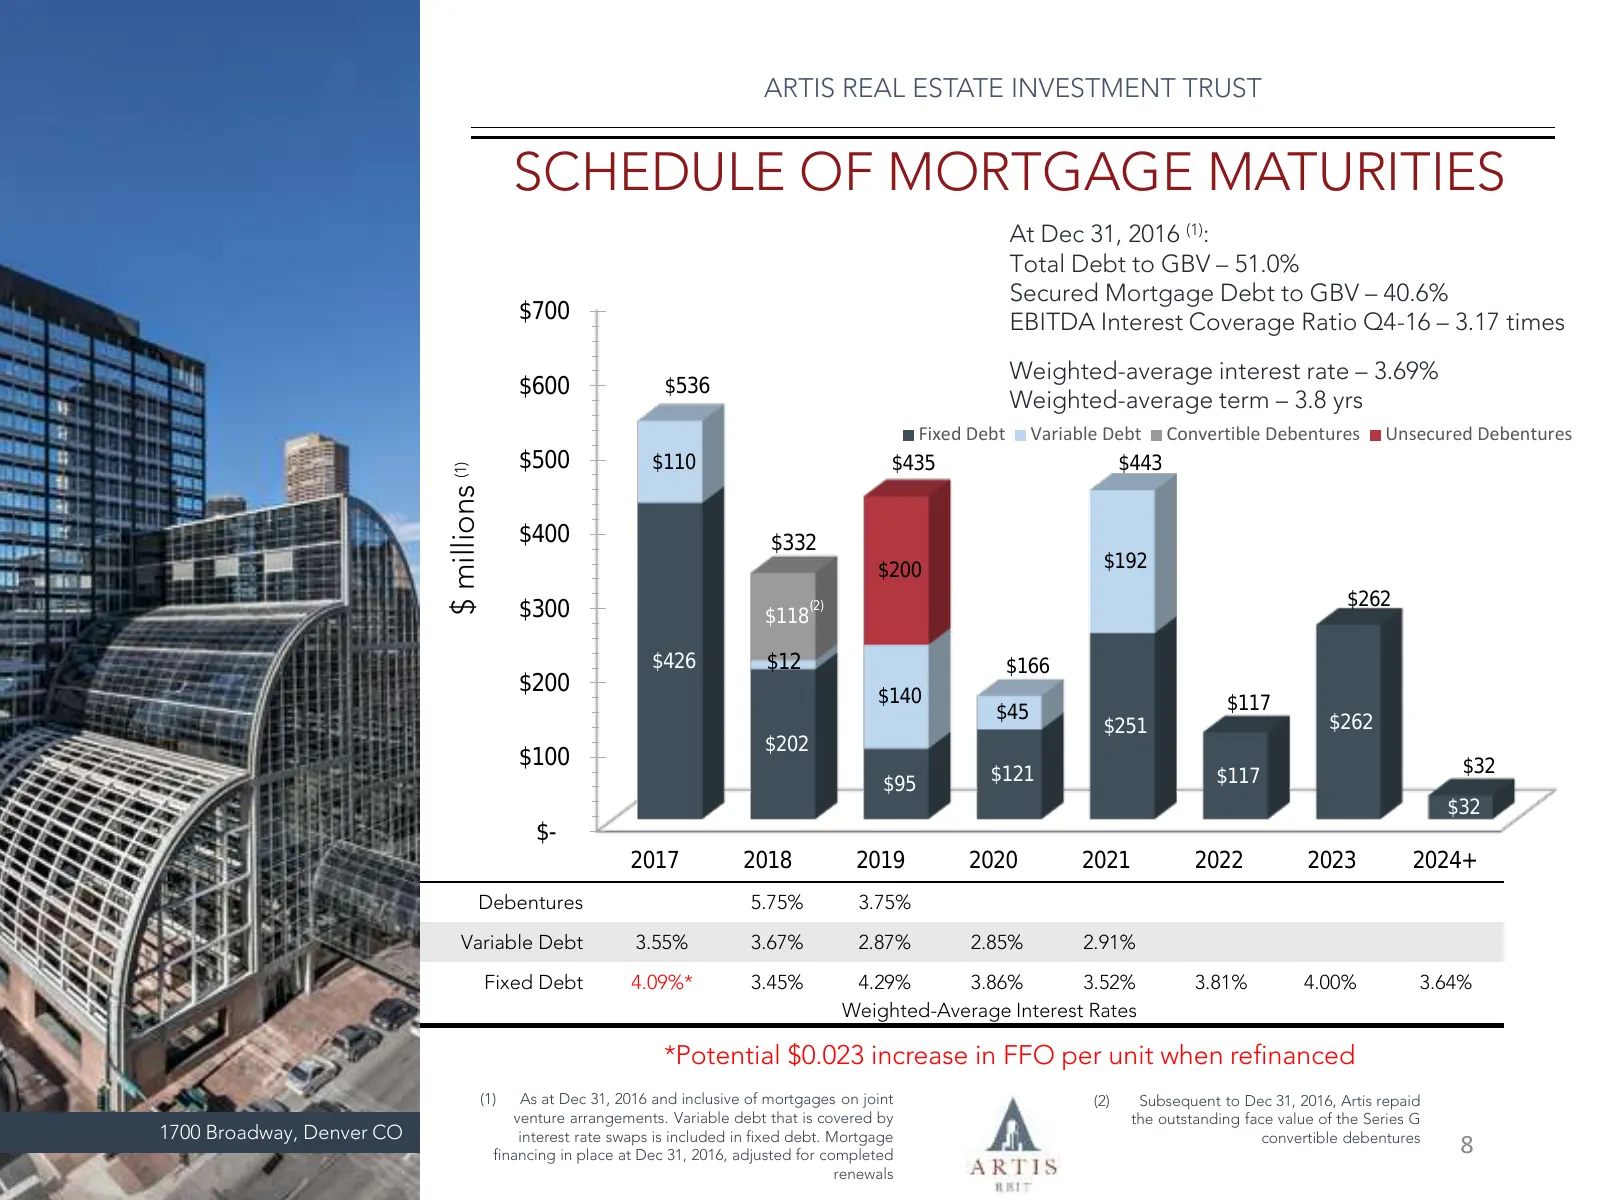
Slide 8: Schedule of Mortgage Maturities
ARTIS REAL ESTATE INVESTMENT TRUST SCHEDULE OF MORTGAGE MATURITIES At Dec 31, 2016 (1): Total Debt to GBV – 51.0% Secured Mortgage Debt to GBV – 40.6% $700 EBITDA Interest Coverage Ratio Q4-16 – 3.17 times Weighted-average interest rate – 3.69% $600 $536 Weighted-average term – 3.8 yrs Fixed Debt Va
Slide 9: Leverage Profile
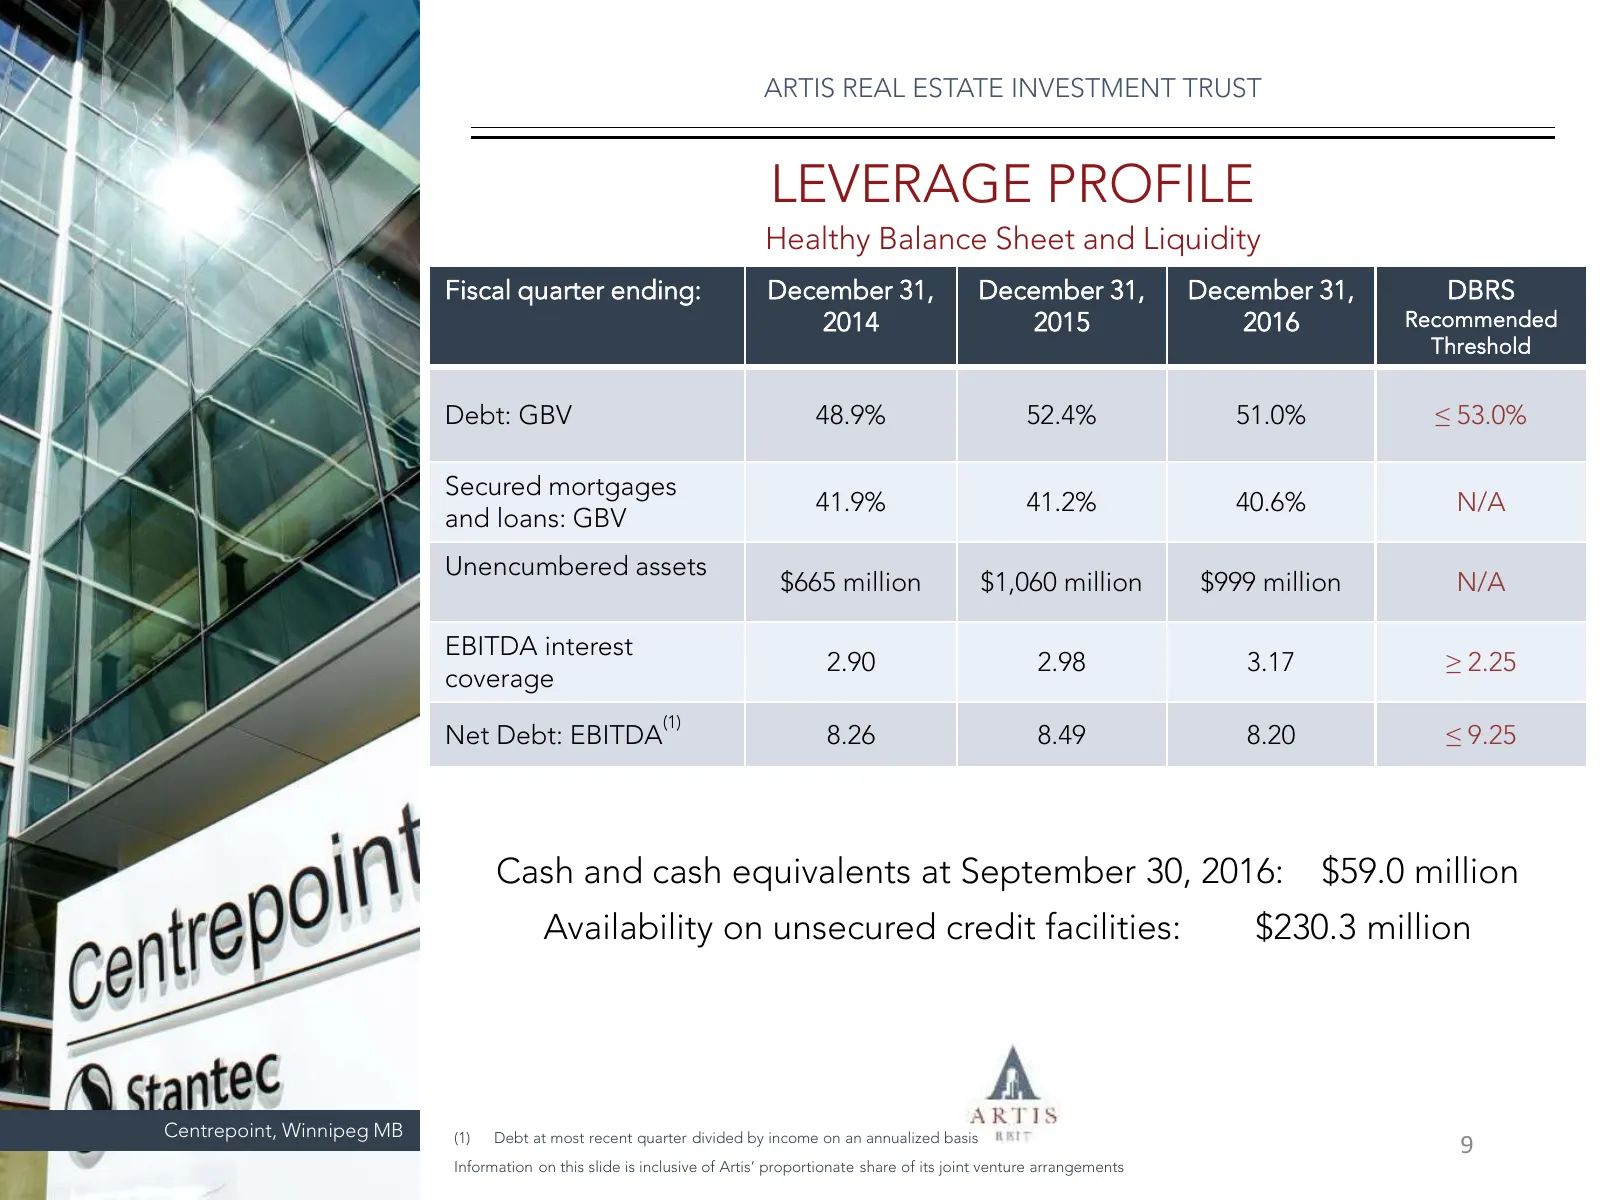
ARTIS REAL ESTATE INVESTMENT TRUST LEVERAGE PROFILE Healthy Balance Sheet and Liquidity Fiscal quarter ending: December 31, December 31, December 31, DBRS 2014 2015 2016 Recommended Threshold Debt: GBV 48.9% 52.4% 51.0% ≤ 53.0% Secured mortgages 41.9% 41.2% 40.6% N/A and loans: GBV Unencumbered asse
Slide 10: Capital Structure
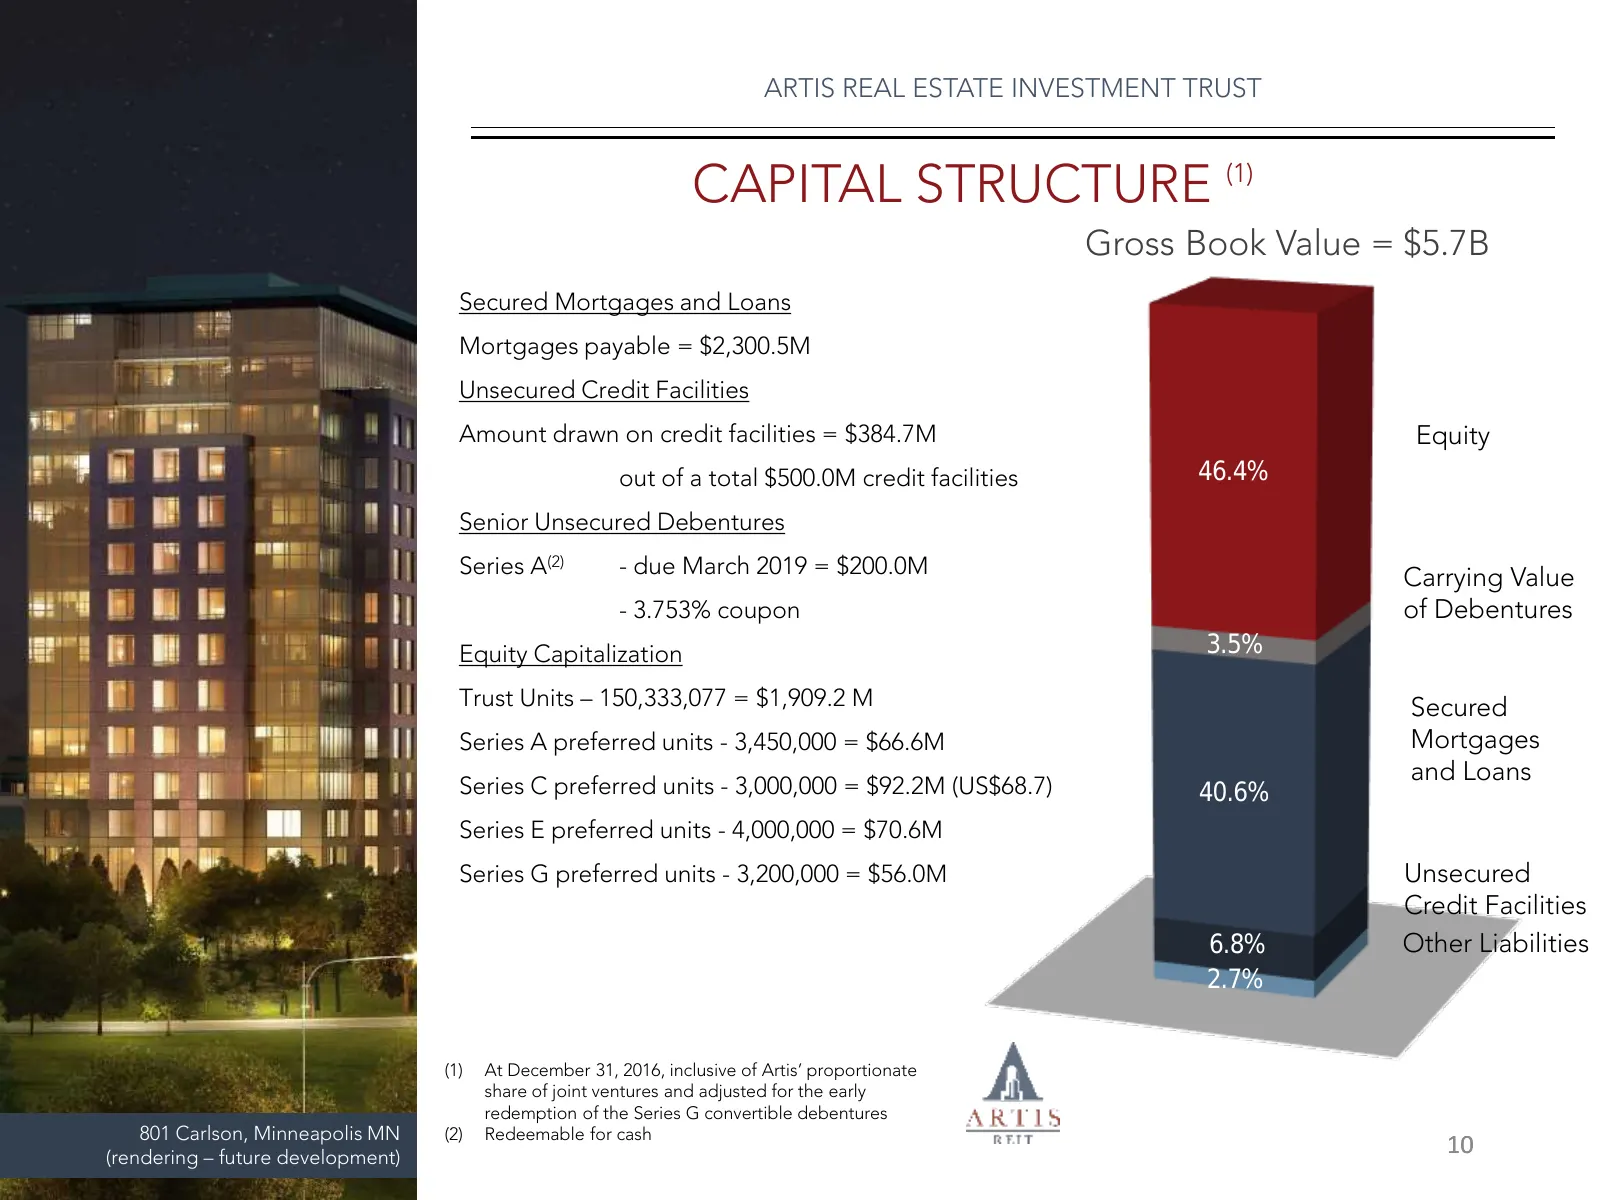
ARTIS REAL ESTATE INVESTMENT TRUST CAPITAL STRUCTURE (1) Gross Book Value = $5.7B Secured Mortgages and Loans Mortgages payable = $2,300.5M Unsecured Credit Facilities Amount drawn on credit facilities = $384.7M Equity out of a total $500.0M credit facilities 46.4% Senior Unsecured Debentures Series
Slide 11: Select Financial Information
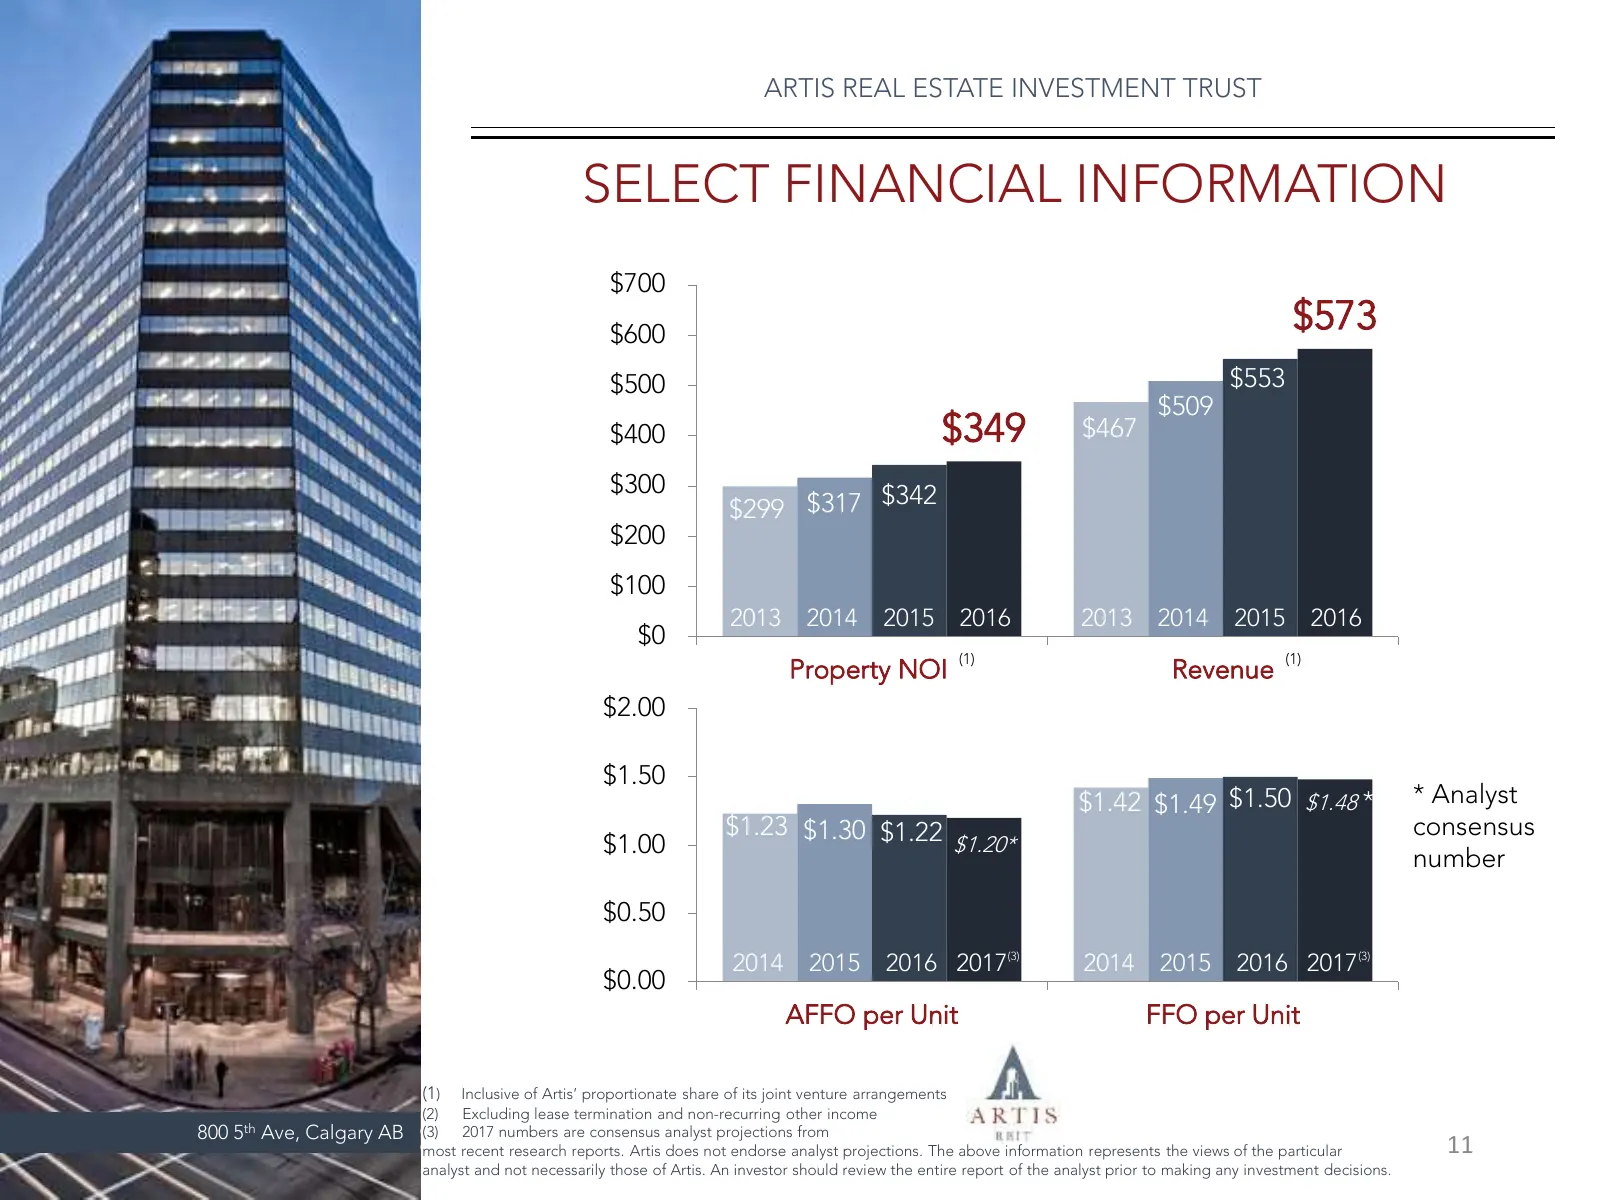
ARTIS REAL ESTATE INVESTMENT TRUST SELECT FINANCIAL INFORMATION $700 $600 $573 $500 $553 $509 $400 $349 $467 $300 $342 $299 $317 $200 $100 2013 2014 2015 2016 2013 2014 2015 2016 $0 (1) (1) Property NOI Revenue $2.00 $1.50 $1.42 $1.49 $1.50 $1.48 * * Analyst $1.23 $1.30 $1.22 consensus $1.00 $1.20*
Slide 12: Recently Completed Development Projects
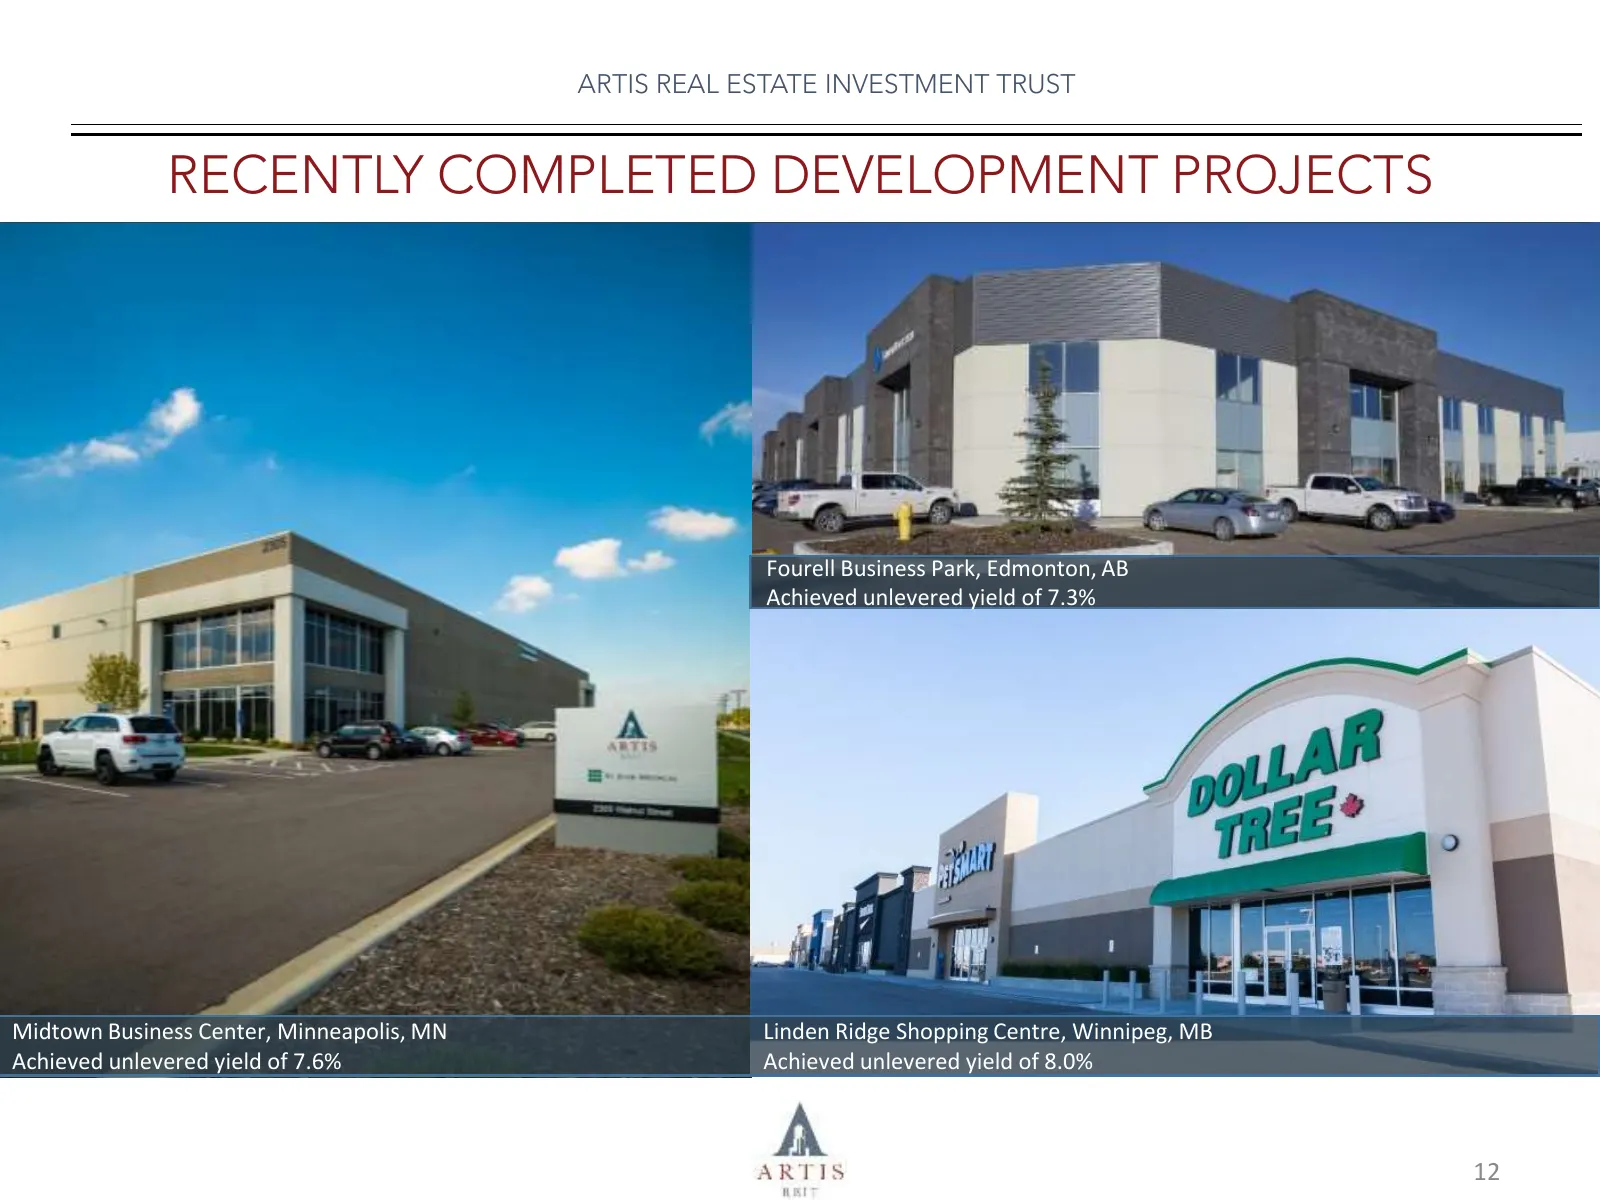
ARTIS REAL ESTATE INVESTMENT TRUST RECENTLY COMPLETED DEVELOPMENT PROJECTS Fourell Business Park, Edmonton, AB Achieved unlevered yield of 7.3% Midtown Business Center, Minneapolis, MN Linden Ridge Shopping Centre, Winnipeg, MB Achieved unlevered yield of 7.6% Achieved unlevered yield of 8.0% 12
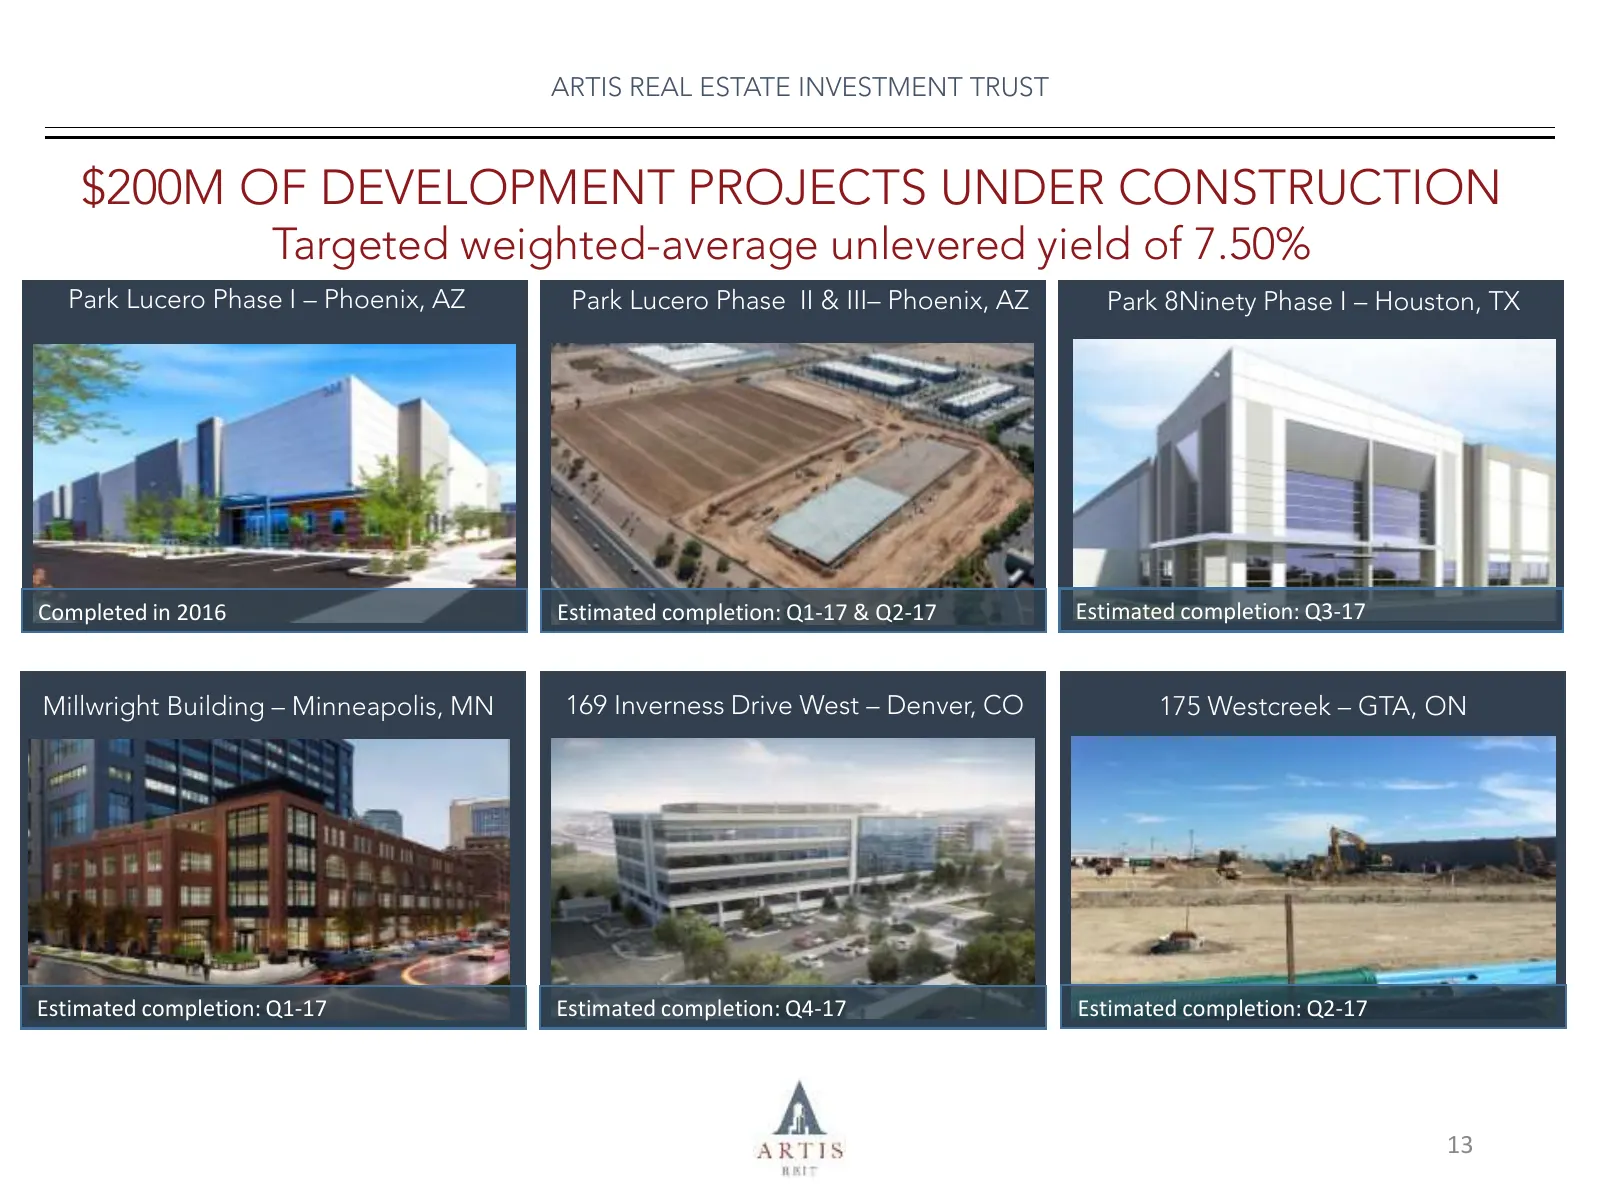
Slide 13: $200M of Development Projects Under Construction
ARTIS REAL ESTATE INVESTMENT TRUST $200M OF DEVELOPMENT PROJECTS UNDER CONSTRUCTION Targeted weighted-average unlevered yield of 7.50% Park Lucero Phase I – Phoenix, AZ Park Lucero Phase II & III– Phoenix, AZ Park 8Ninety Phase I – Houston, TX Completed in 2016 Estimated completion: Q1-17 & Q2-17 Es
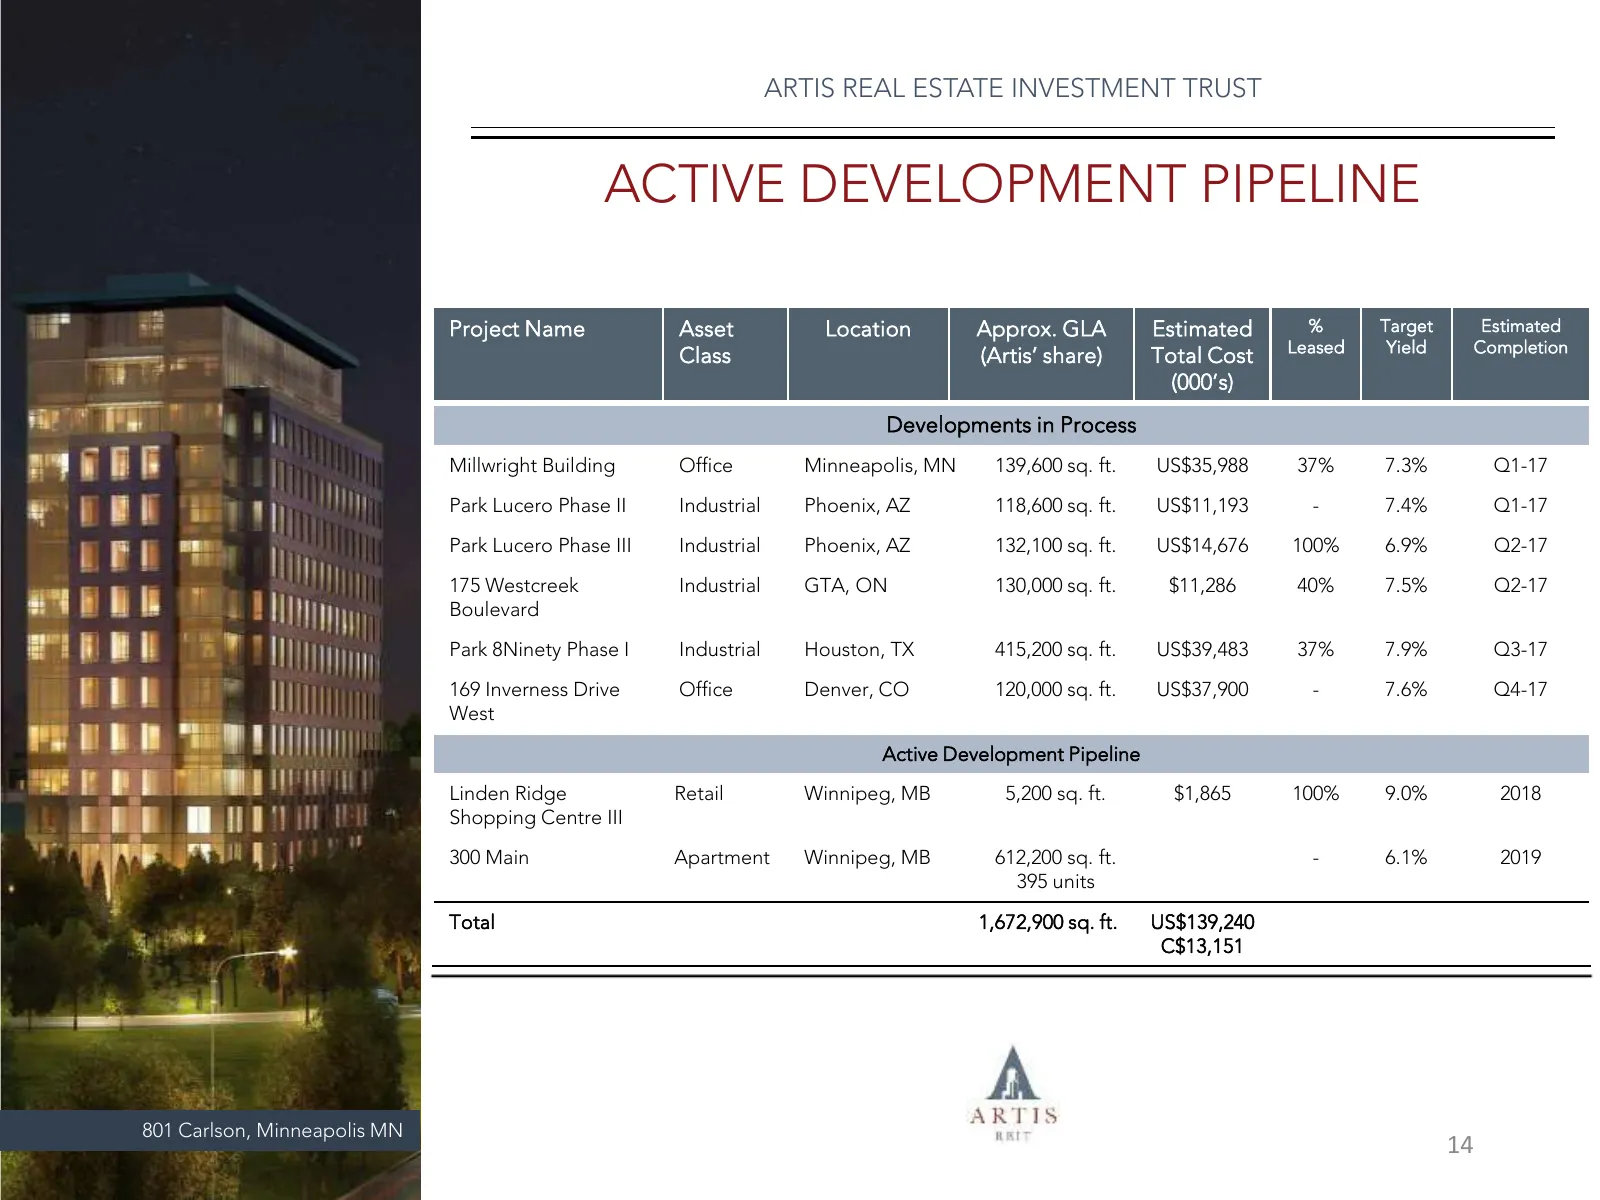
Slide 14: Active Development Pipeline
ARTIS REAL ESTATE INVESTMENT TRUST ACTIVE DEVELOPMENT PIPELINE Project Name Asset Location Approx. GLA Estimated % Target Estimated Leased Yield Completion Class (Artis’ share) Total Cost (000’s) Developments in Process Millwright Building Office Minneapolis, MN 139,600 sq. ft. US$35,988 37% 7.3% Q1
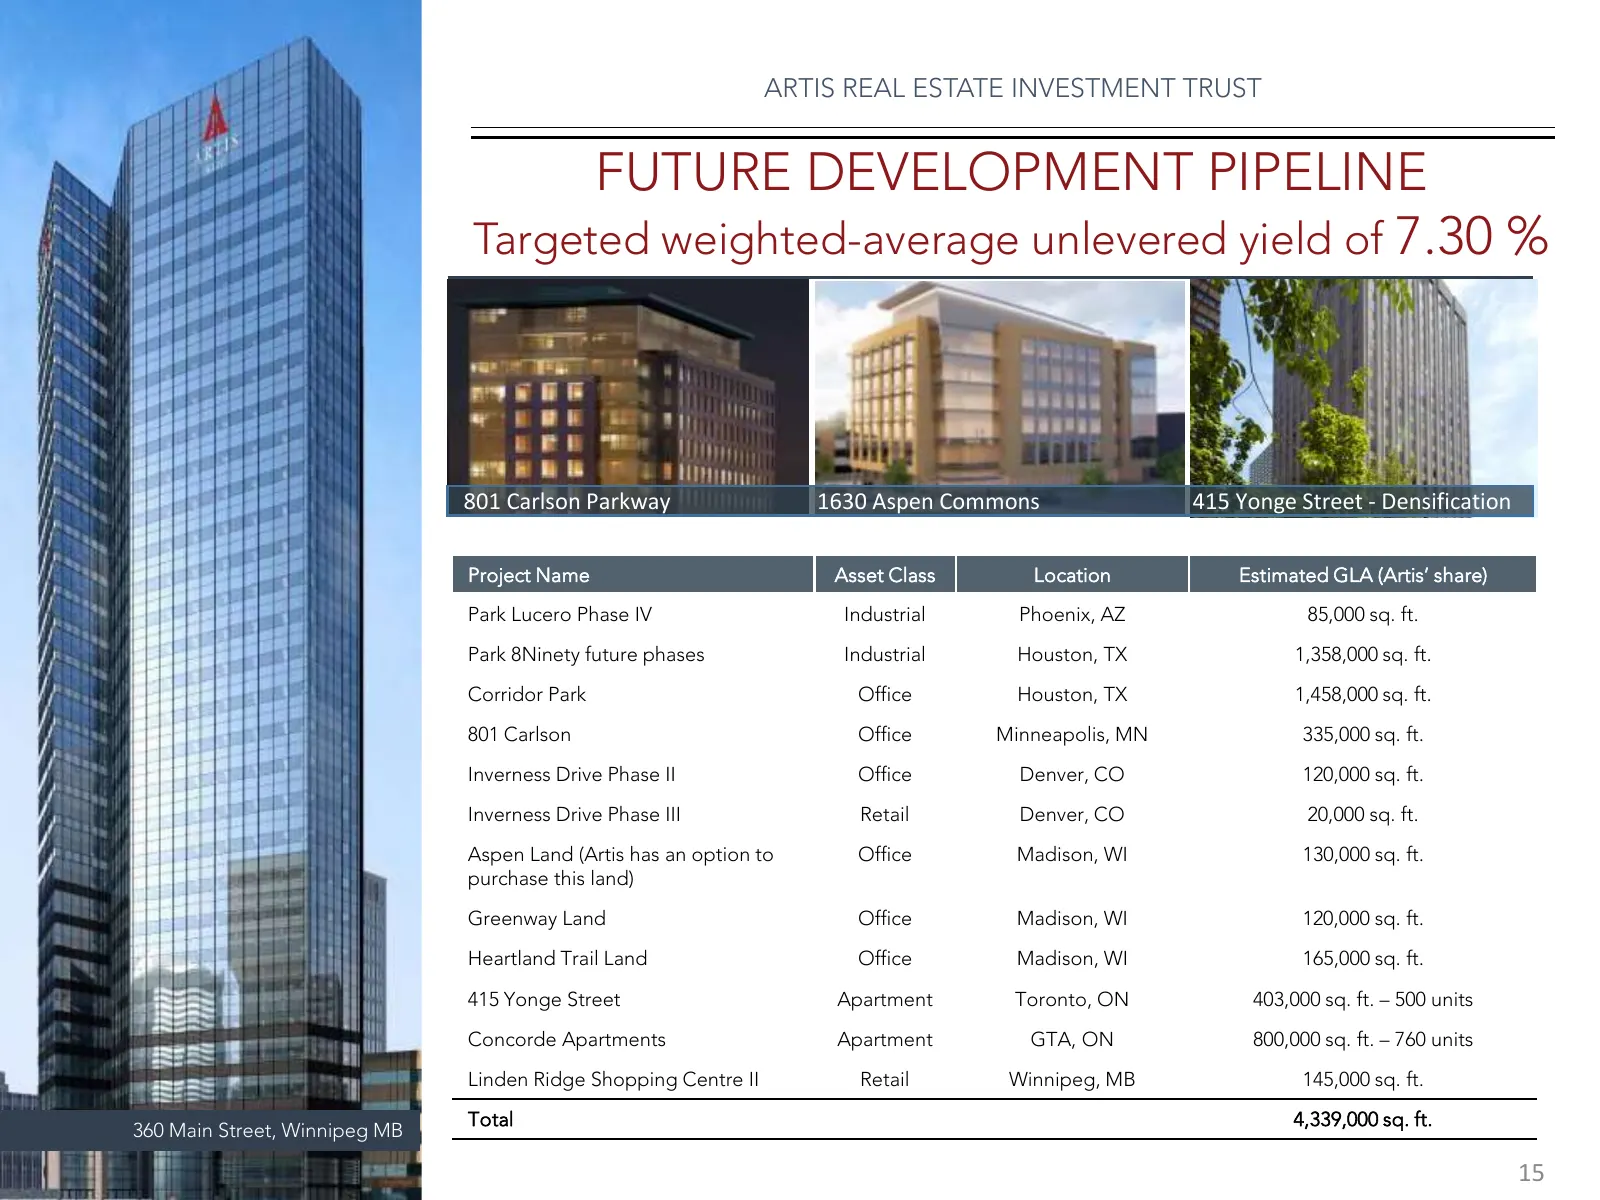
Slide 15: Future Development Pipeline
ARTIS REAL ESTATE INVESTMENT TRUST FUTURE DEVELOPMENT PIPELINE Targeted weighted-average unlevered yield of 7.30 % 801 Carlson Parkway 1630 Aspen Commons 415 Yonge Street - Densification Project Name Asset Class Location Estimated GLA (Artis’ share) Park Lucero Phase IV Industrial Phoenix, AZ 85,000
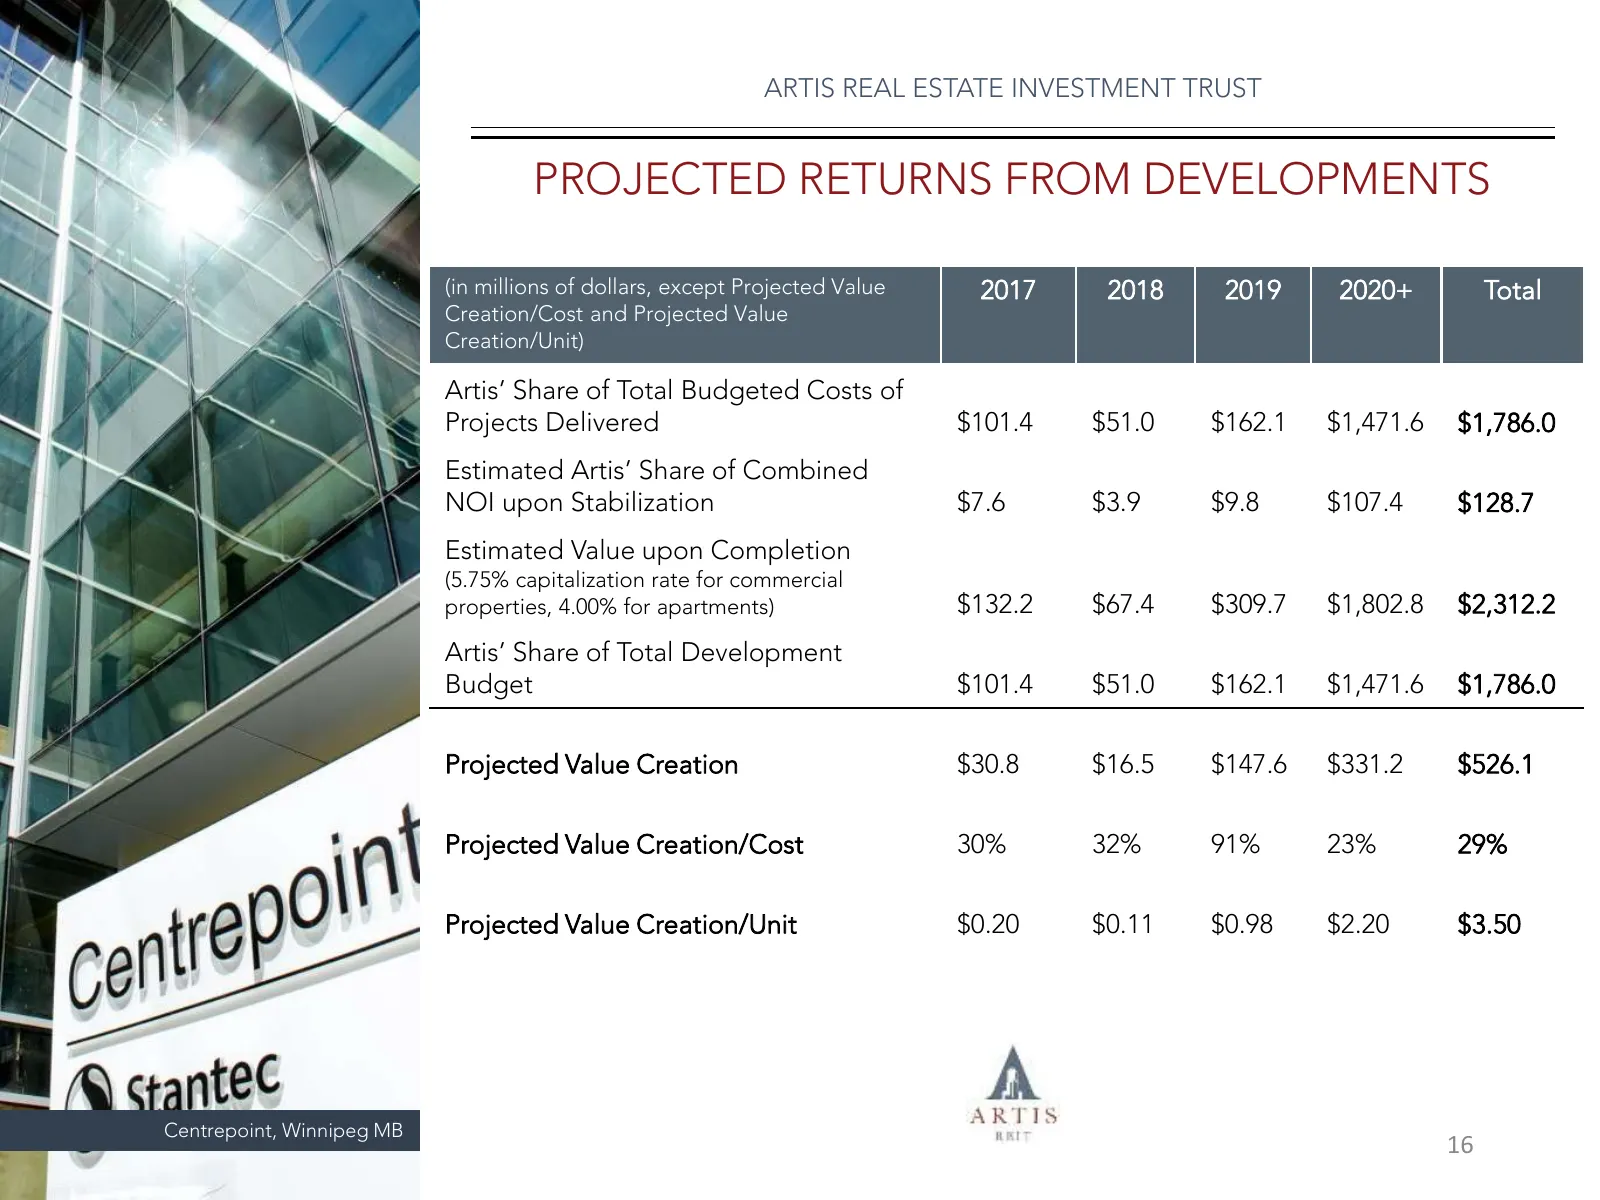
Slide 16: Projected Returns from Developments
ARTIS REAL ESTATE INVESTMENT TRUST PROJECTED RETURNS FROM DEVELOPMENTS (in millions of dollars, except Projected Value 2017 2018 2019 2020+ Total Creation/Cost and Projected Value Creation/Unit) Artis’ Share of Total Budgeted Costs of Projects Delivered $101.4 $51.0 $162.1 $1,471.6 $1,786.0 Estimate
Slide 17: Artis' Investment in Alberta
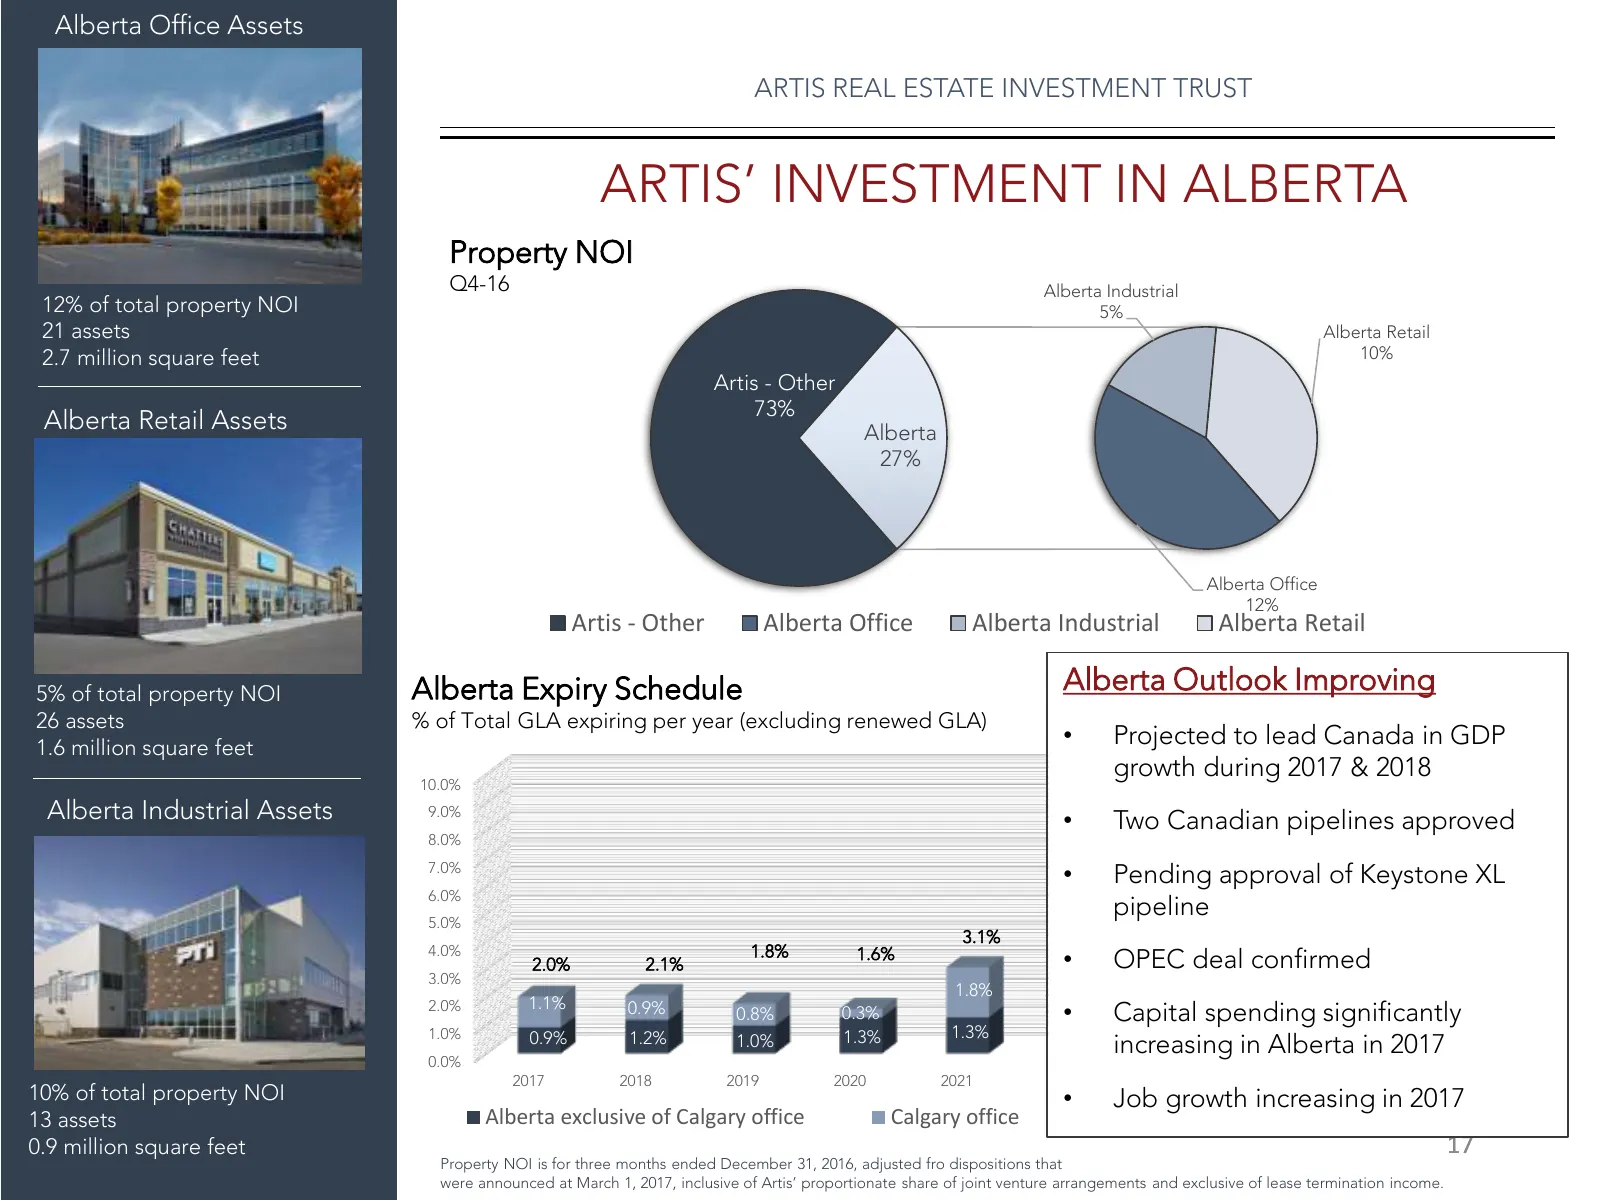
Alberta Office Assets ARTIS REAL ESTATE INVESTMENT TRUST ARTIS’ INVESTMENT IN ALBERTA Property NOI Q4-16 Alberta Industrial 12% of total property NOI 5% 21 assets Alberta Retail 2.7 million square feet 10% Artis - Other 73% Alberta Retail Assets Alberta 27% Alberta Office 12% Artis - Other Alberta O
Slide 18: Alberta Dispositions in 2016 Exceeded Artis' NAV
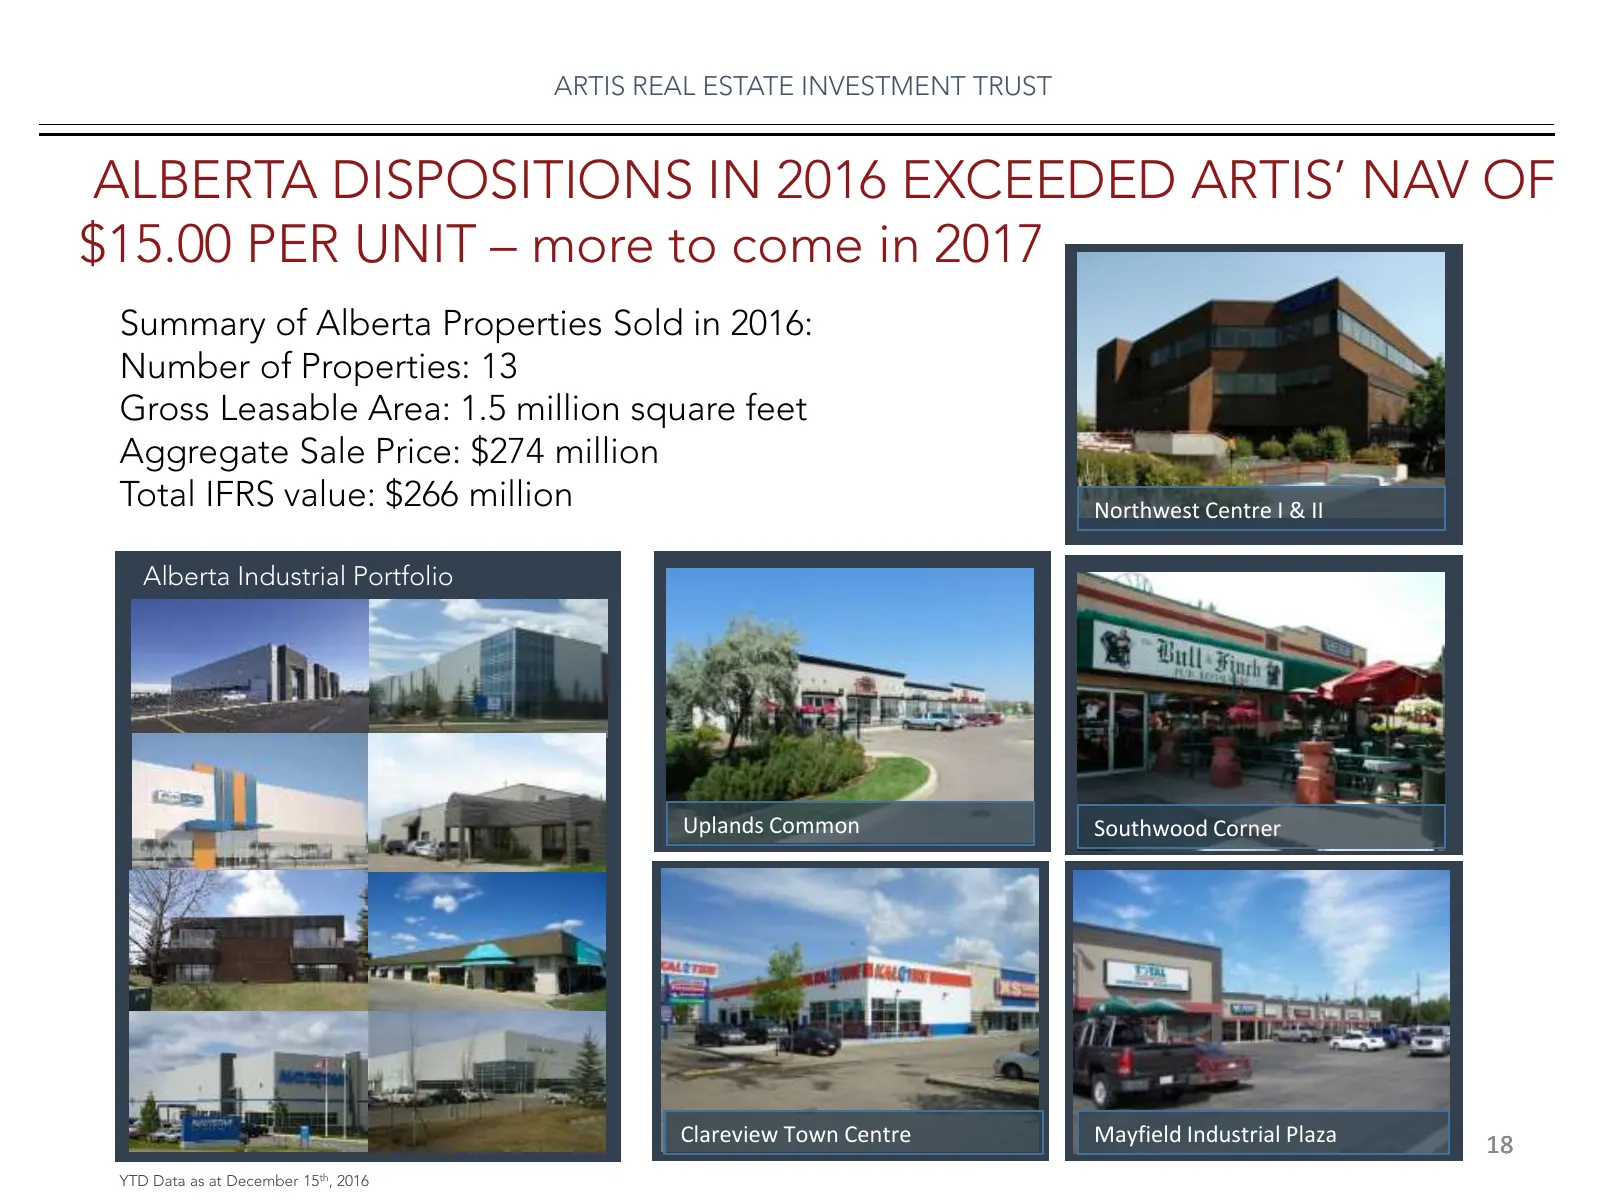
ARTIS REAL ESTATE INVESTMENT TRUST ALBERTA DISPOSITIONS IN 2016 EXCEEDED ARTIS’ NAV OF $15.00 PER UNIT – more to come in 2017 Summary of Alberta Properties Sold in 2016: Number of Properties: 13 Gross Leasable Area: 1.5 million square feet Aggregate Sale Price: $274 million Total IFRS value: $266 mi
Slide 19: Market and Analyst Information
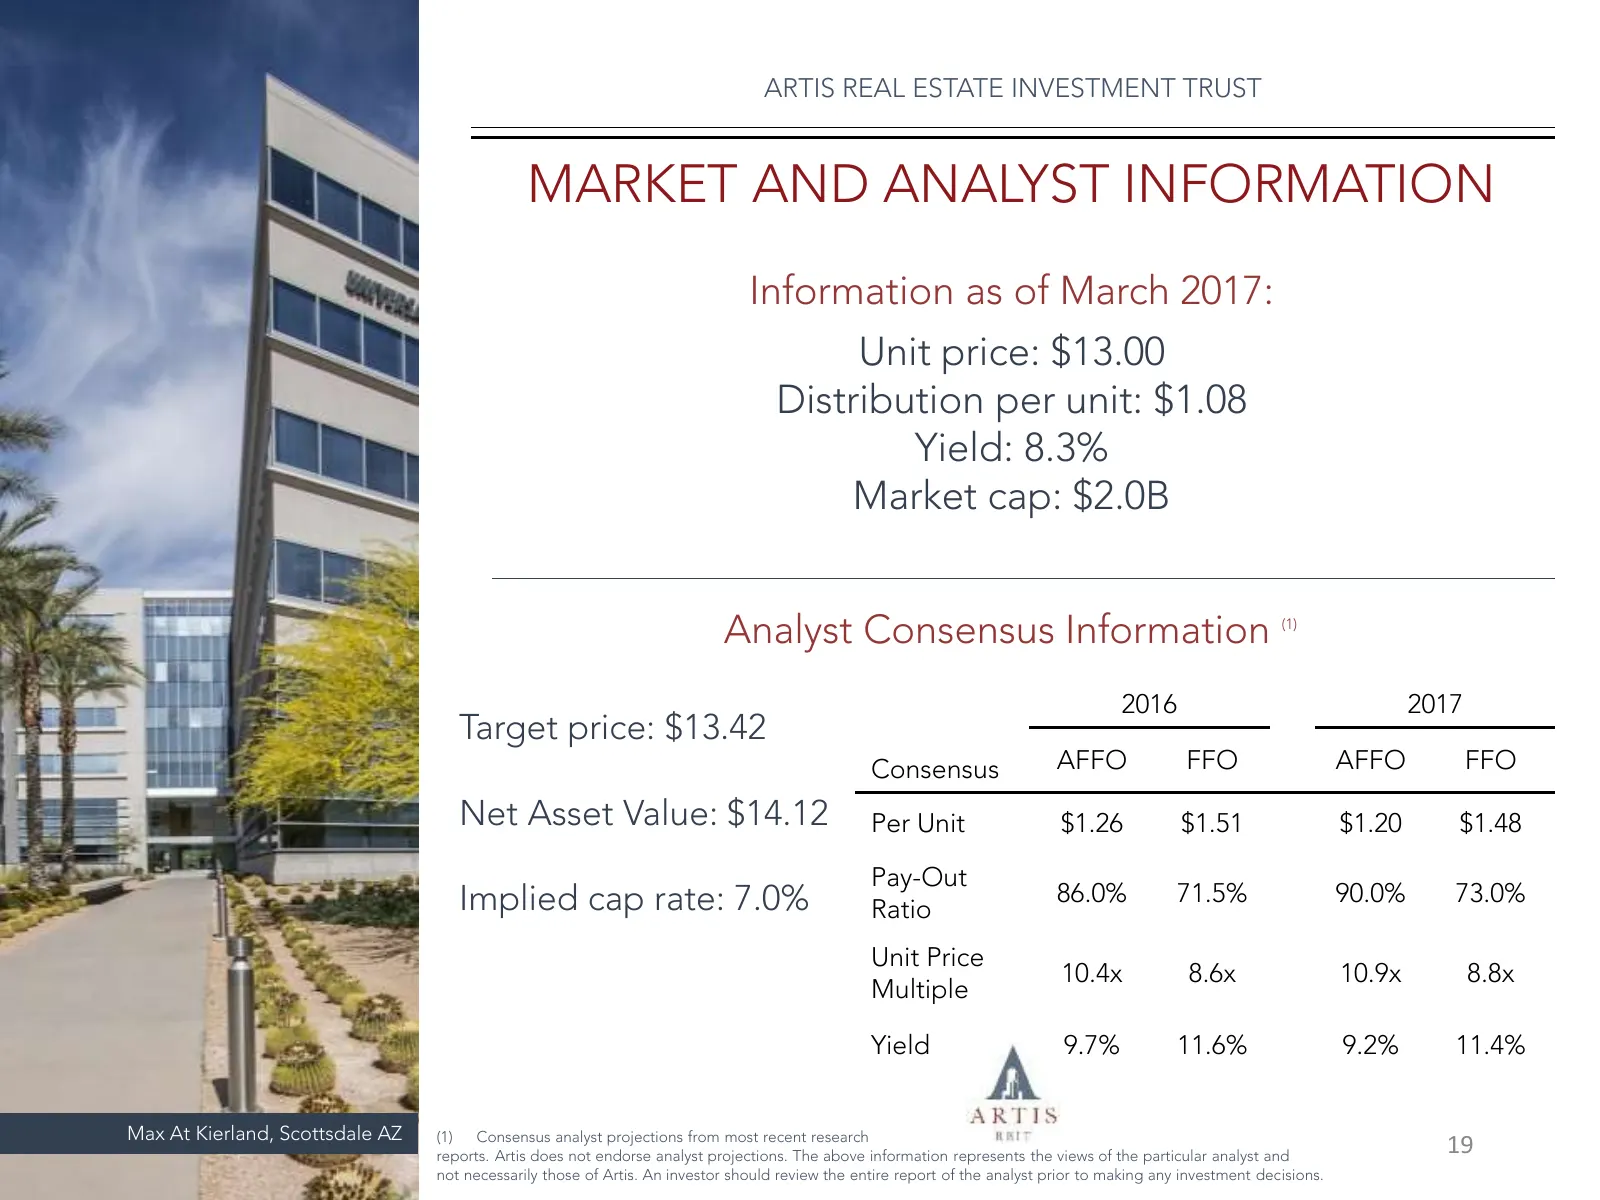
ARTIS REAL ESTATE INVESTMENT TRUST MARKET AND ANALYST INFORMATION Information as of March 2017: Unit price: $13.00 Distribution per unit: $1.08 Yield: 8.3% Market cap: $2.0B Analyst Consensus Information (1) 2016 2017 Target price: $13.42 Consensus AFFO FFO AFFO FFO Net Asset Value: $14.12 Per Unit
Slide 20: Guideposts for 2017 and Beyond
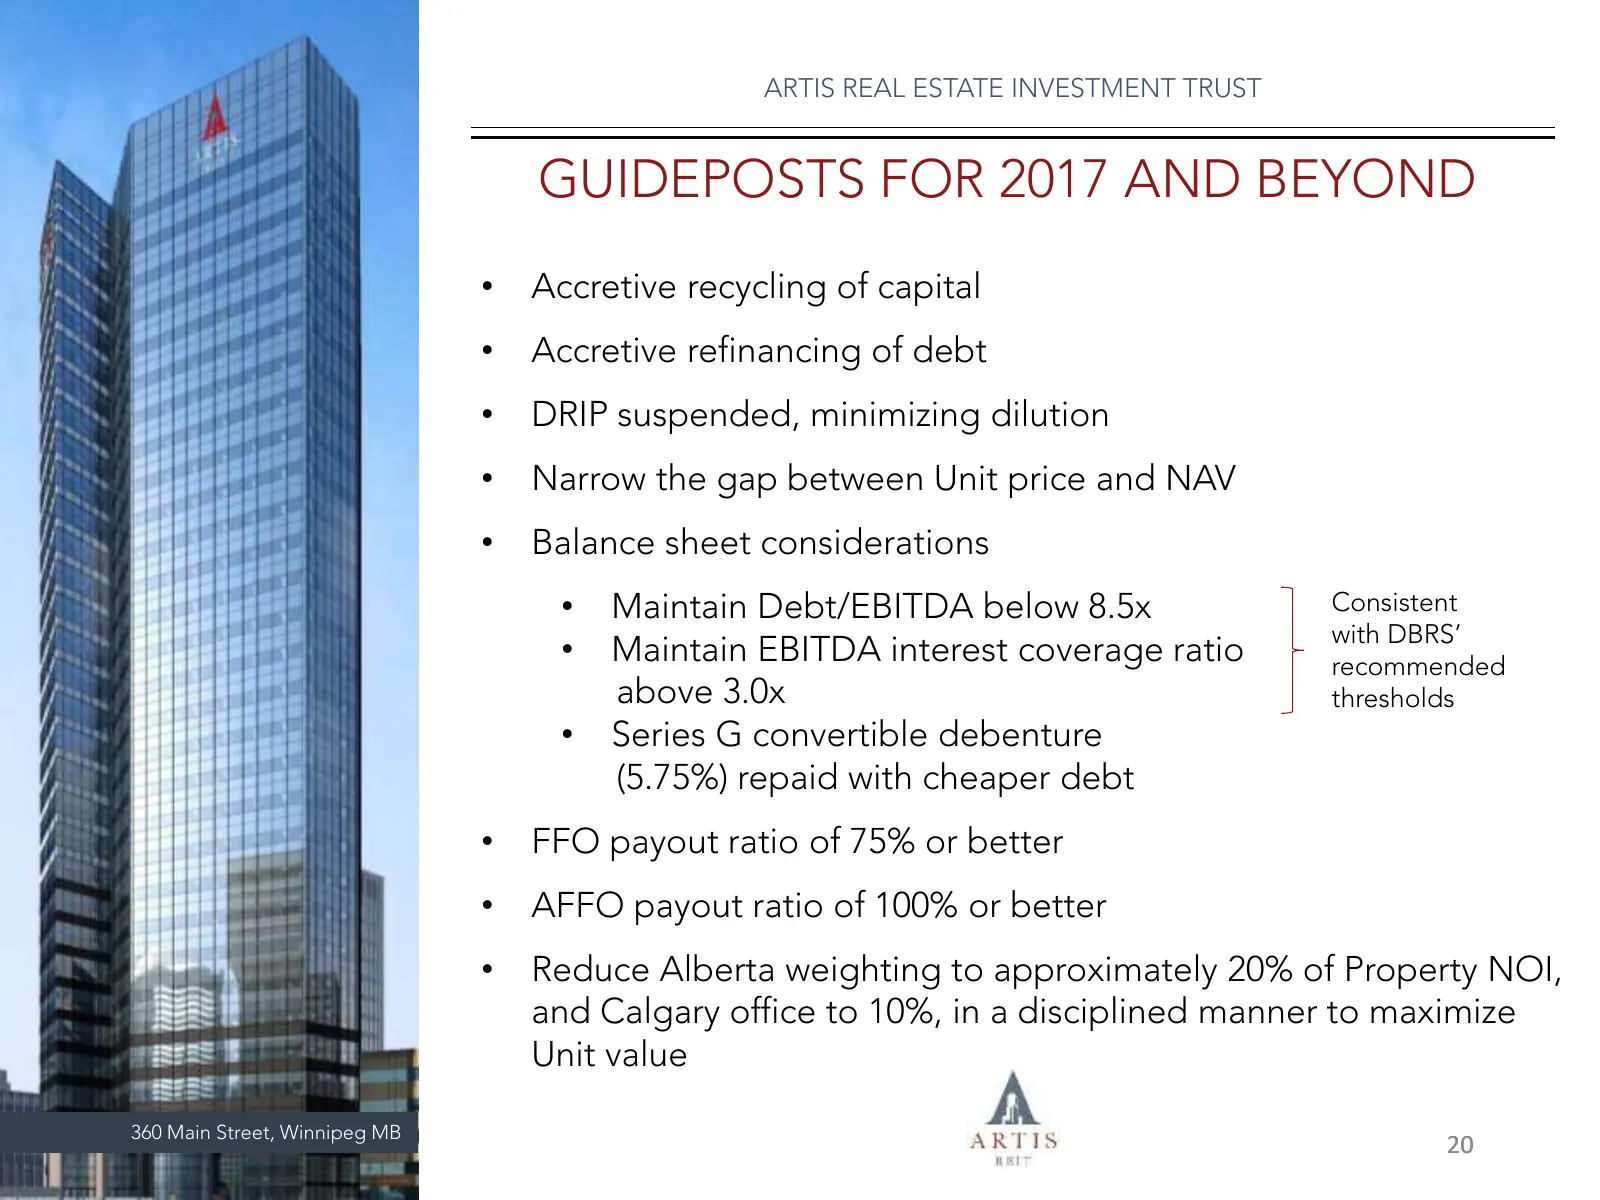
ARTIS REAL ESTATE INVESTMENT TRUST GUIDEPOSTS FOR 2017 AND BEYOND TWO MARKETPOINTE MINNEAPOLIS, MN • Accretive recycling of capital • Accretive refinancing of debt • DRIP suspended, minimizing dilution • Narrow the gap between Unit price and NAV • Balance sheet considerations • Maintain Debt/EBITDA
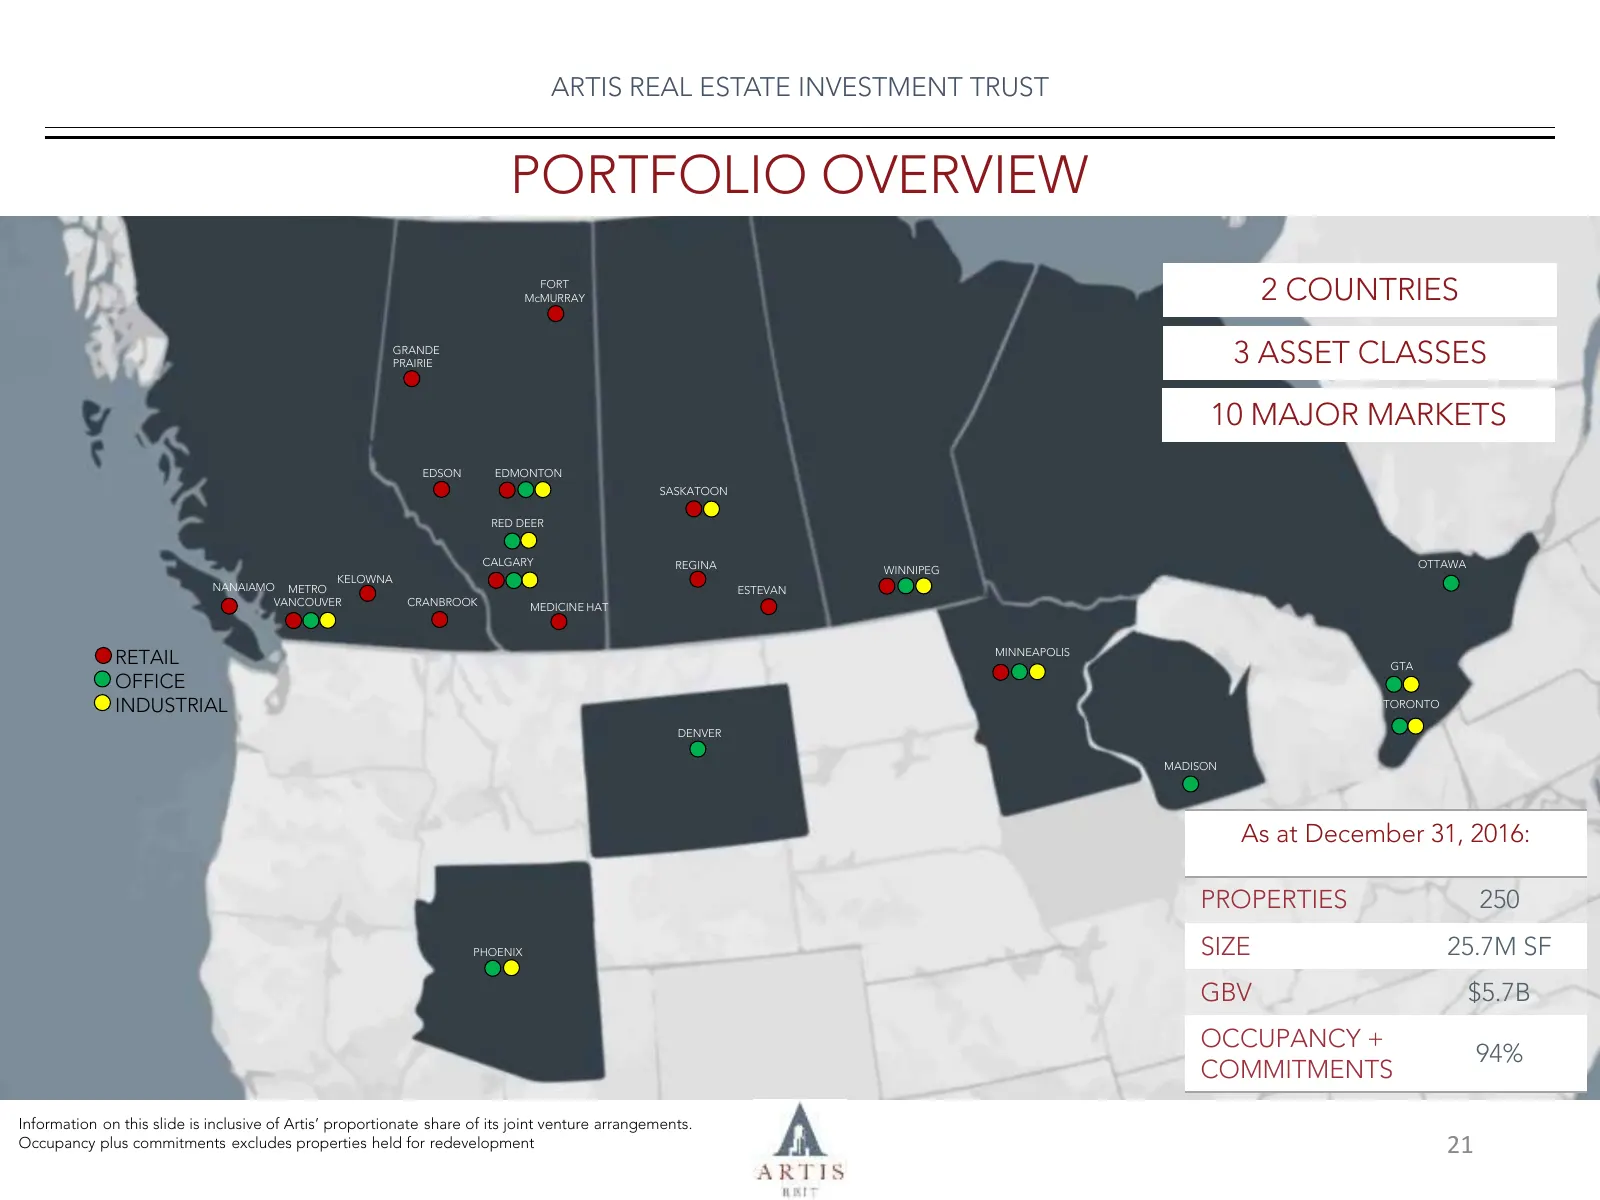
Slide 21: Portfolio Overview
ARTIS REAL ESTATE INVESTMENT TRUST PORTFOLIO OVERVIEW FORT McMURRAY 2 COUNTRIES GRANDE PRAIRIE 3 ASSET CLASSES 10 MAJOR MARKETS EDSON EDMONTON SASKATOON RED DEER CALGARY REGINA OTTAWA WINNIPEG KELOWNA NANAIAMO METRO ESTEVAN VANCOUVER CRANBROOK MEDICINE HAT RETAIL MINNEAPOLIS GTA OFFICE INDUSTRIAL TO
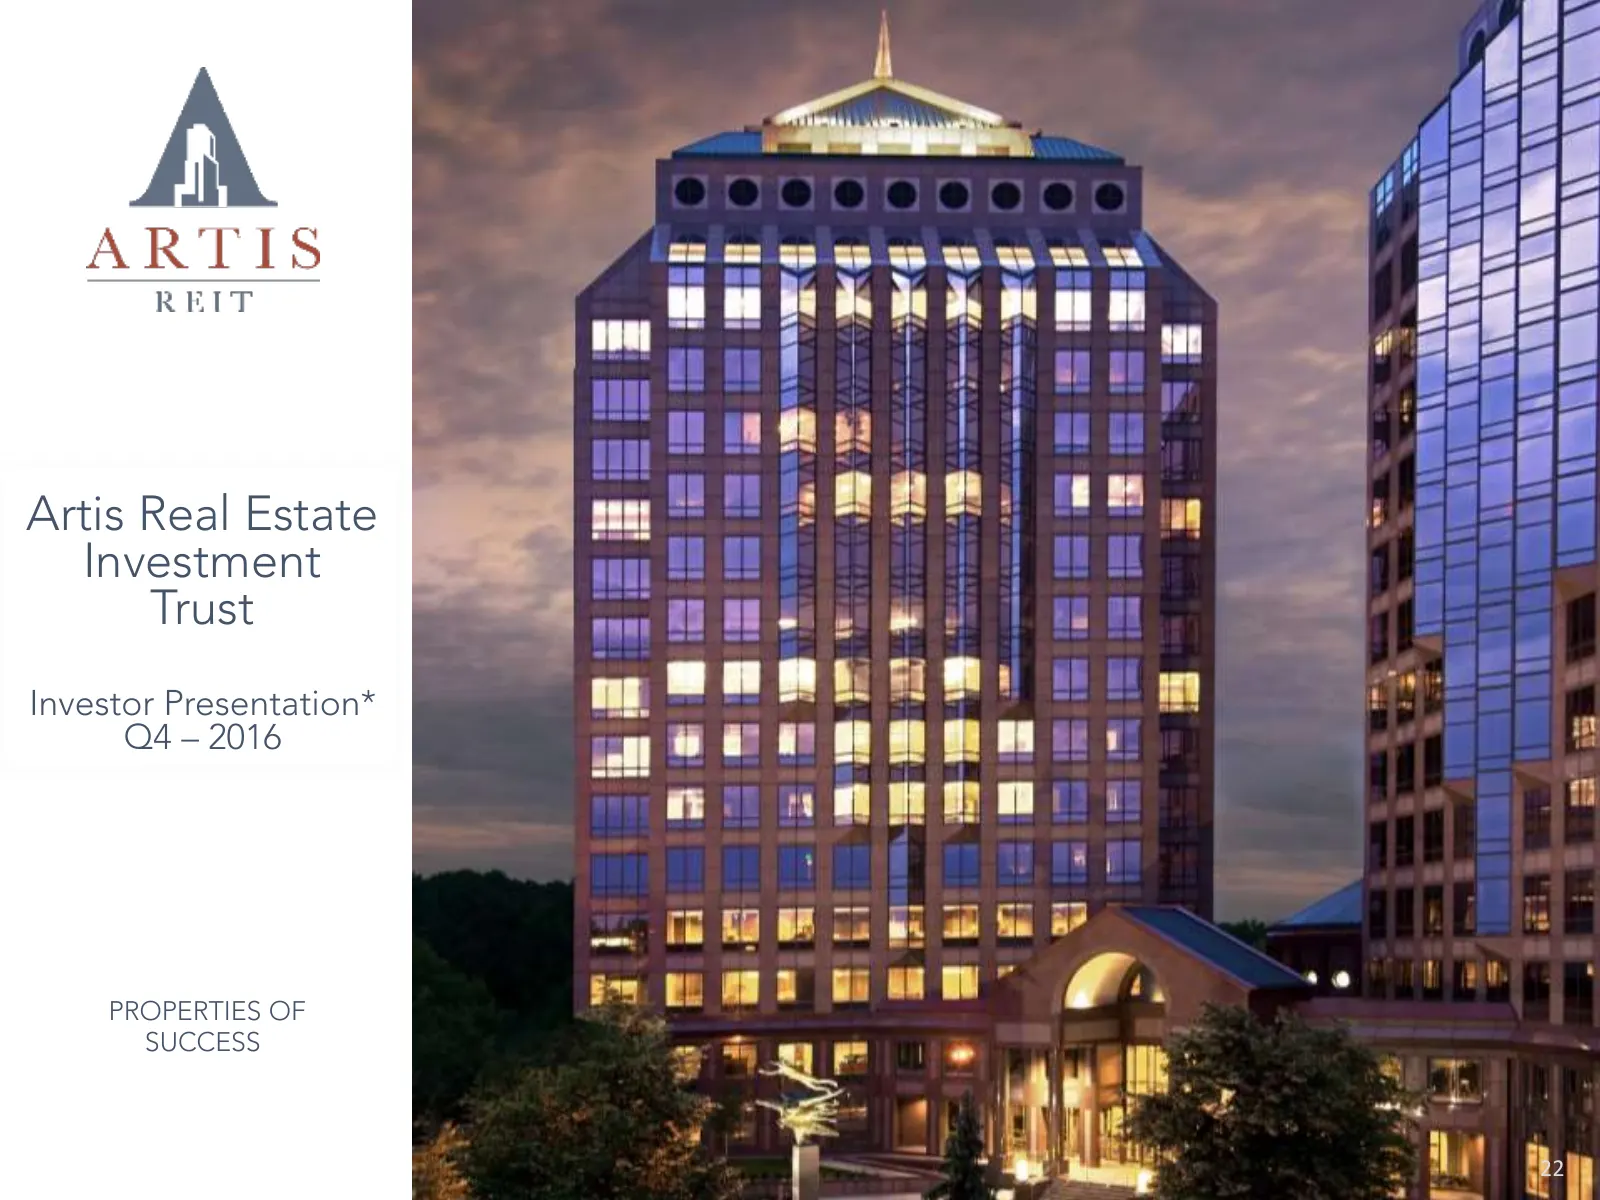
Slide 22: Artis Real Estate Investment Trust
Artis Real Estate Investment Trust Investor Presentation* Q4 – 2016 PROPERTIES OF SUCCESS 22
Source: Internet Archive copy of arwebstore.blob.core.windows.net
More decks from RFA Financial Inc.
 Q3 2026 Earnings Presentation19 slides · Nov 11, 2026
 Q2 2026 Earnings Presentation21 slides · Aug 14, 2026
 Q1 2026 Earnings Presentation28 slides · May 13, 2026
 Merger or Acquisition (September 2025)18 slides · Sep 15, 2025
 Artis Real Estate Investment Trust — Q2 2025 Earnings Presentation22 slides · Aug 7, 2025
 Artis Real Estate Investment Trust — Q1 2025 Earnings Presentation22 slides · May 8, 2025