McBride plc · LSE:MCB
McBride — FY2005 Earnings Presentation
30 slides from McBride's earnings presentation, Sep 8, 2005

Slide 1: McBride plc 2004-05: Preliminary Results
McBride plc 2004-05: Preliminary Results 8 September 2005 © McBride plc 2005
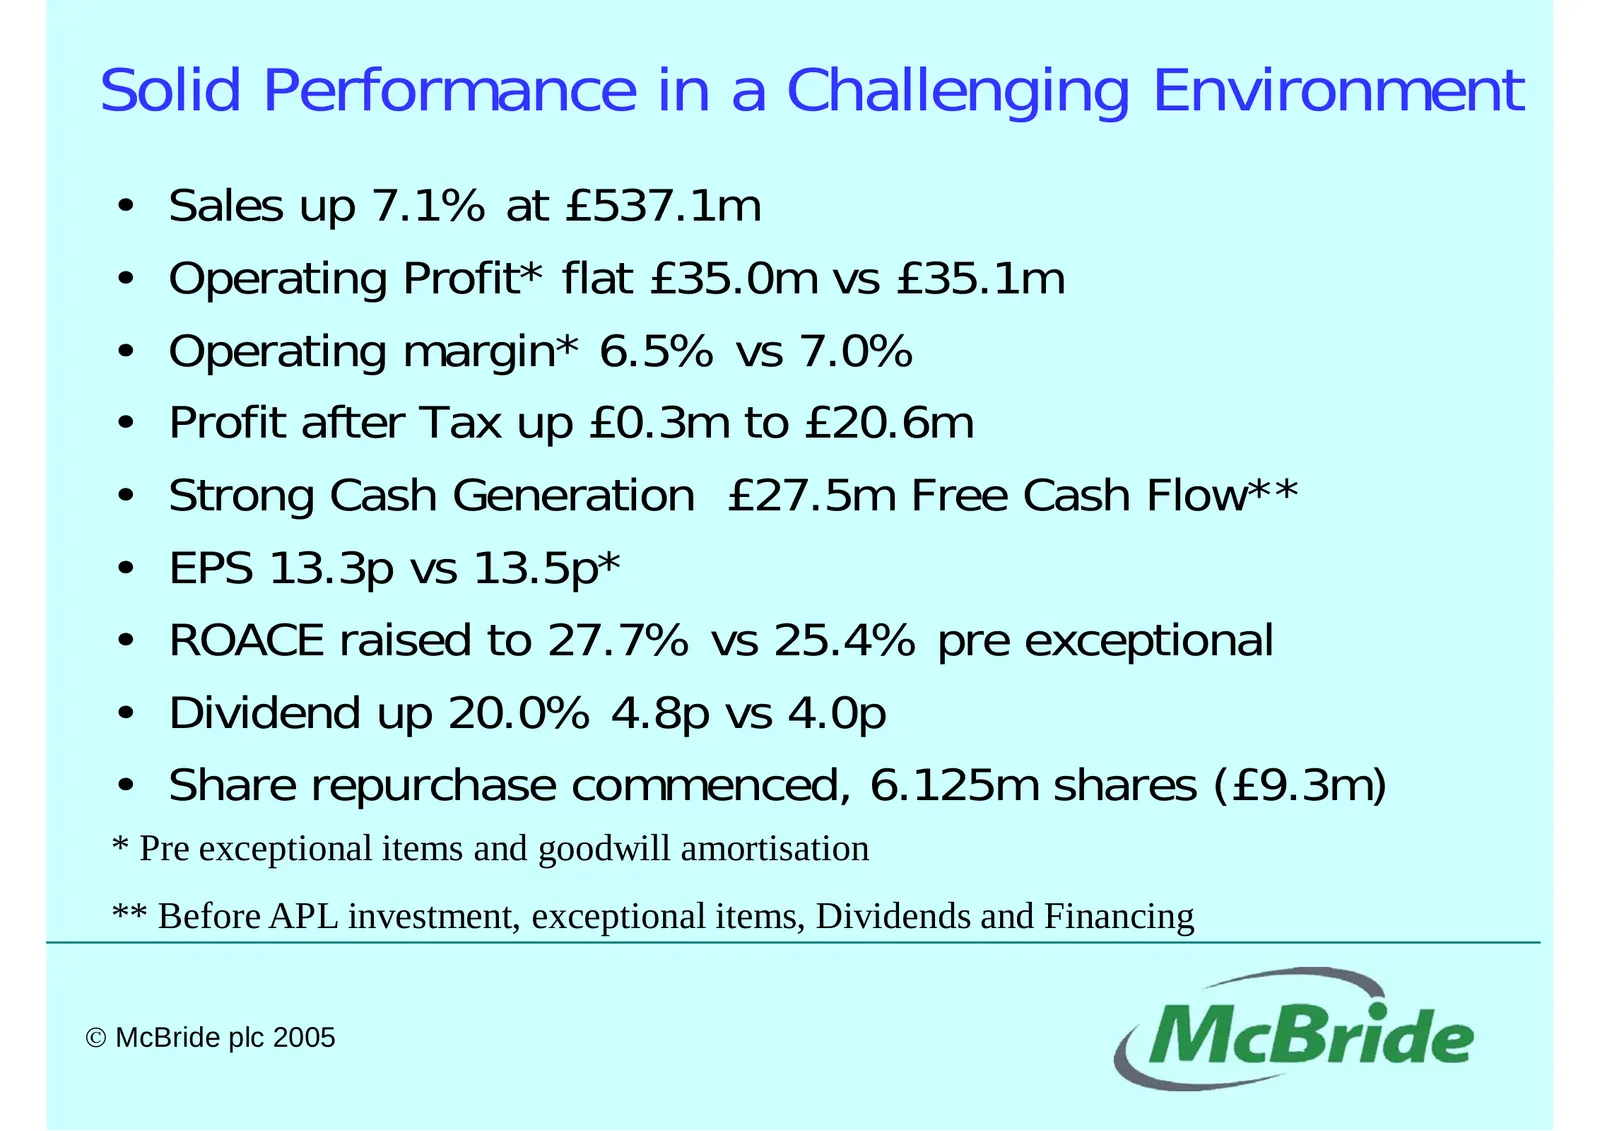
Slide 2: Solid Performance in a Challenging Environment
Solid Performance in a Challenging Environment • Sales up 7.1% at £537.1m • Operating Profit* flat £35.0m vs £35.1m • Operating margin* 6.5% vs 7.0% • Profit after Tax up £0.3m to £20.6m • Strong Cash Generation £27.5m Free Cash Flow** • EPS 13.3p vs 13.5p* • ROACE raised to 27.7% vs 25.4% pre excep
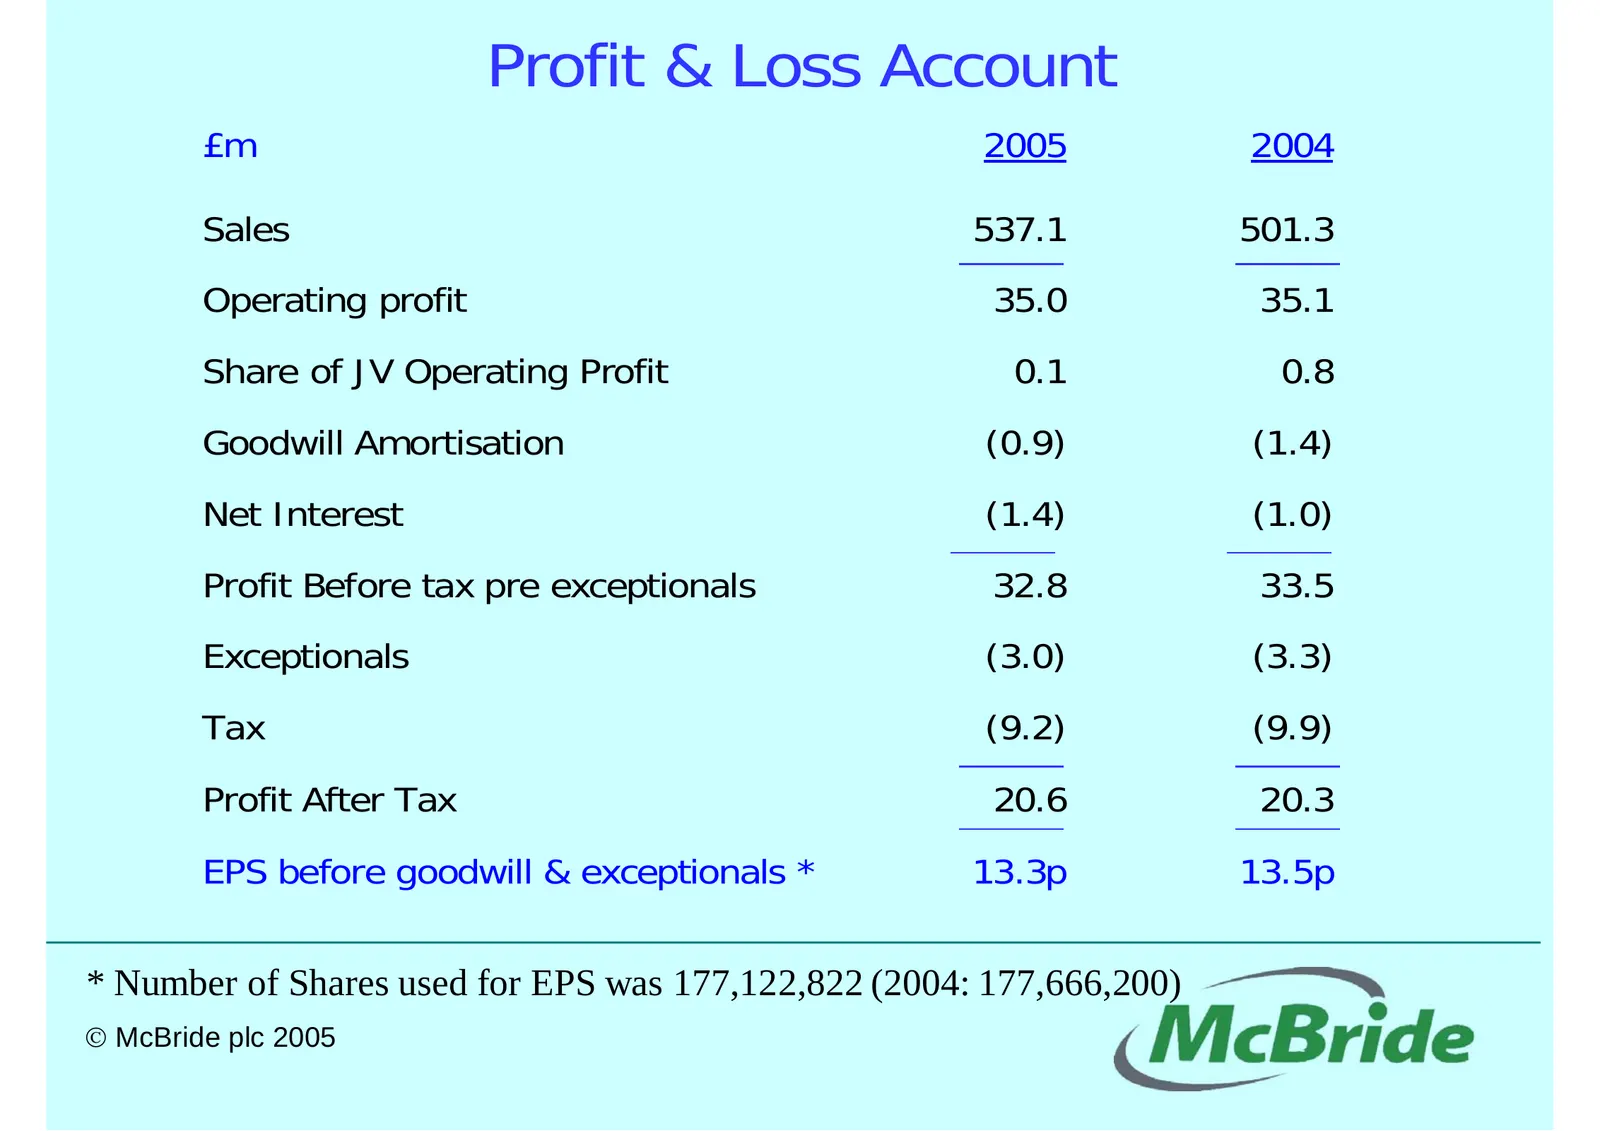
Slide 3: Profit & Loss Account
Profit & Loss Account £m 2005 2004 Sales 537.1 501.3 Operating profit 35.0 35.1 Share of JV Operating Profit 0.1 0.8 Goodwill Amortisation (0.9) (1.4) Net Interest (1.4) (1.0) Profit Before tax pre exceptionals 32.8 33.5 Exceptionals (3.0) (3.3) Tax (9.2) (9.9) Profit After Tax 20.6 20.3 EPS before
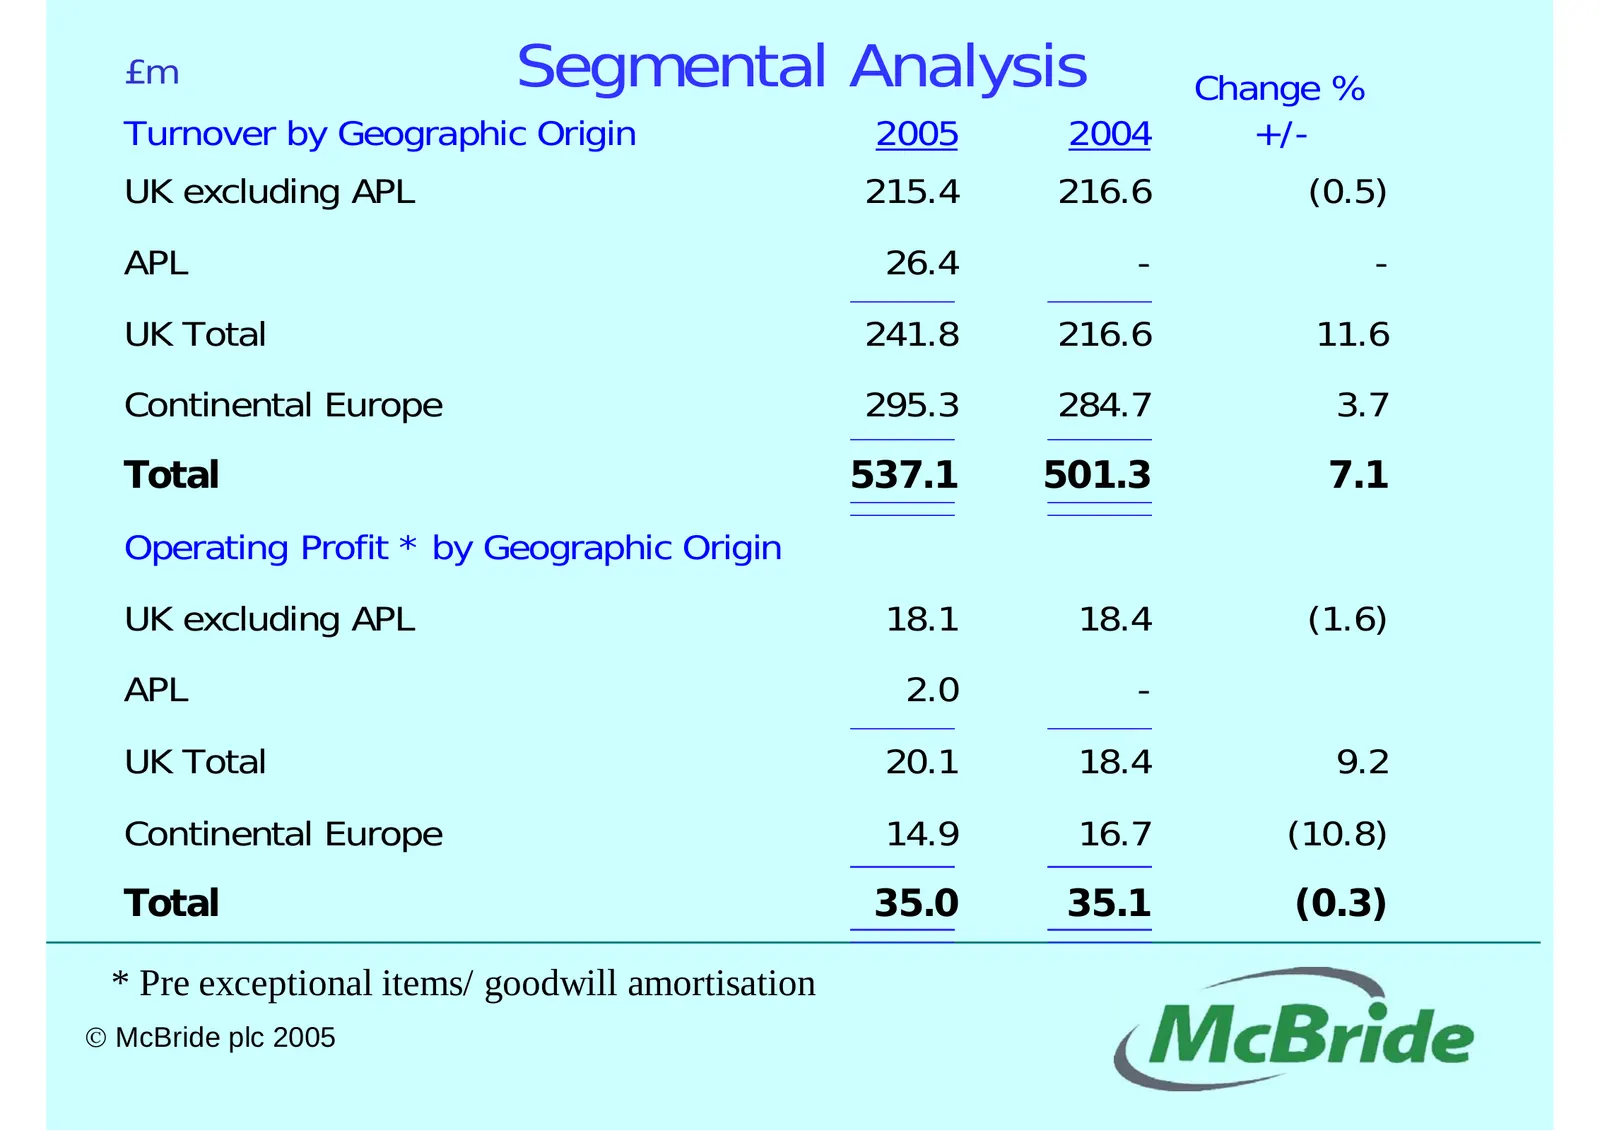
Slide 4: Segmental Analysis
£m Segmental Analysis Change % Turnover by Geographic Origin 2005 2004 +/- UK excluding APL 215.4 216.6 (0.5) APL 26.4 - - UK Total 241.8 216.6 11.6 Continental Europe 295.3 284.7 3.7 Total 537.1 501.3 7.1 Operating Profit * by Geographic Origin UK excluding APL 18.1 18.4 (1.6) APL 2.0 - UK Total 20
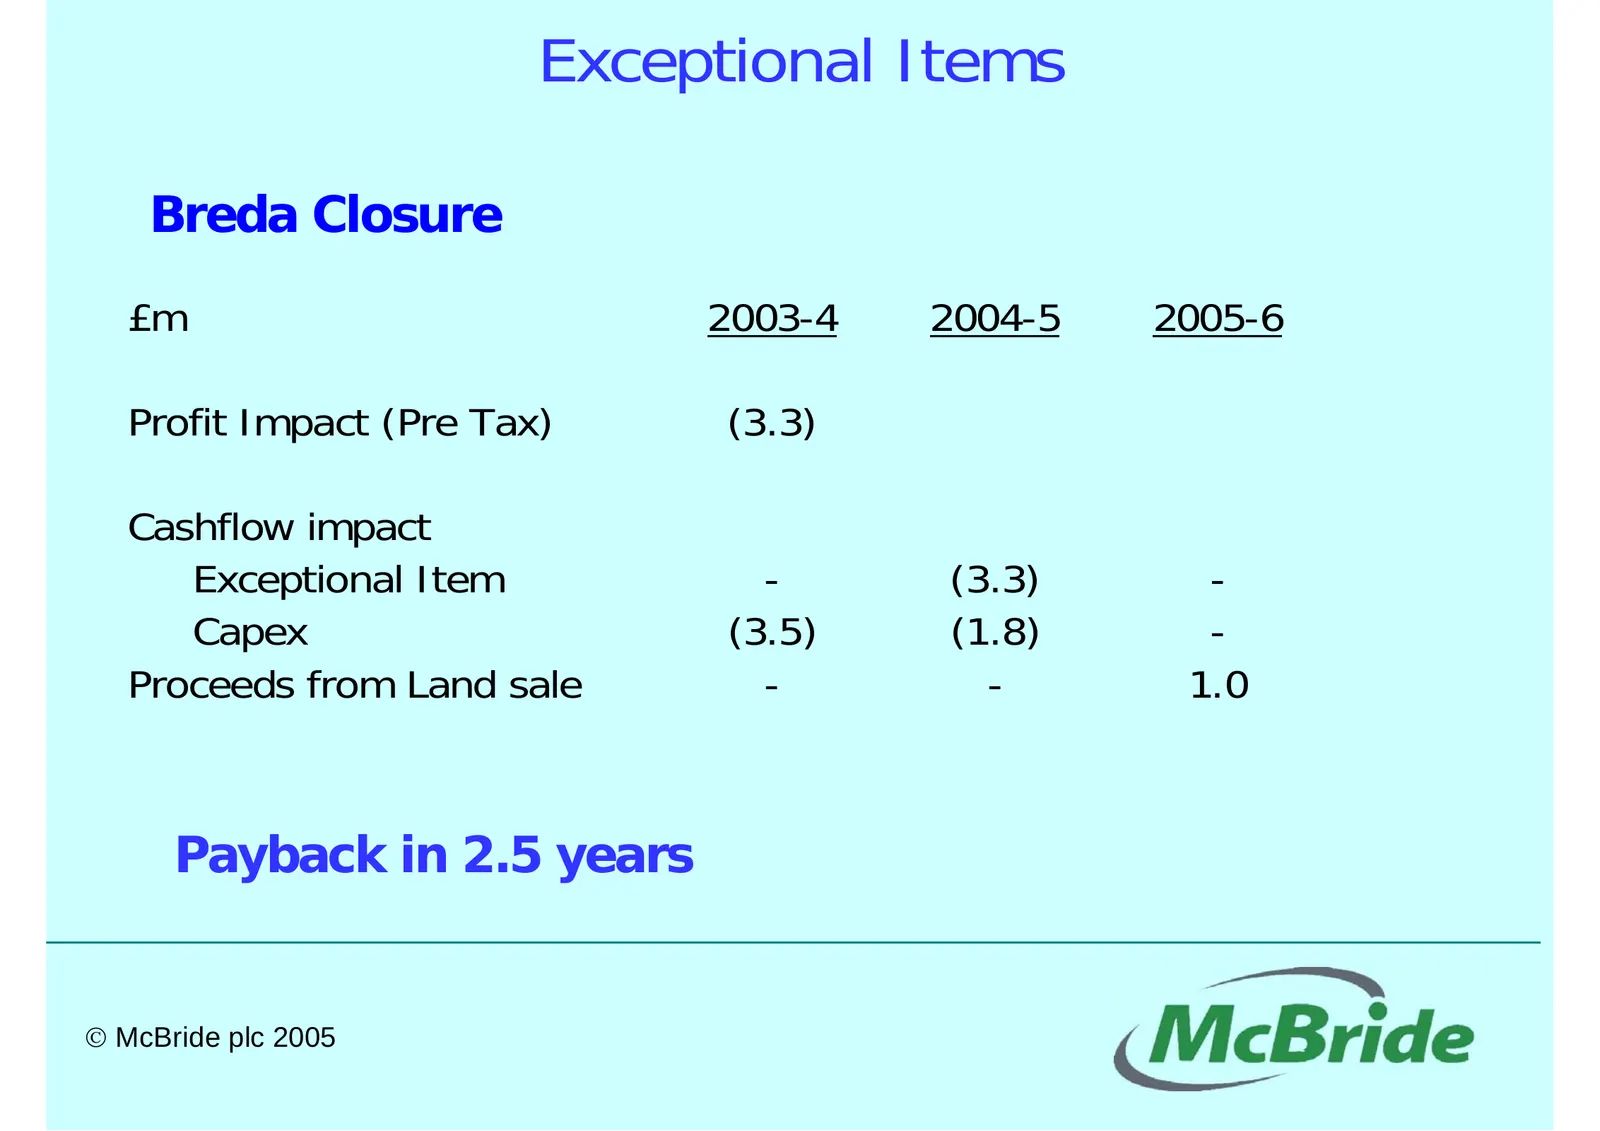
Slide 5: Exceptional Items
Exceptional Items Breda Closure £m 2003-4 2004-5 2005-6 Profit Impact (Pre Tax) (3.3) Cashflow impact Exceptional Item - (3.3) - Capex (3.5) (1.8) - Proceeds from Land sale - - 1.0 Payback in 2.5 years © McBride plc 2005
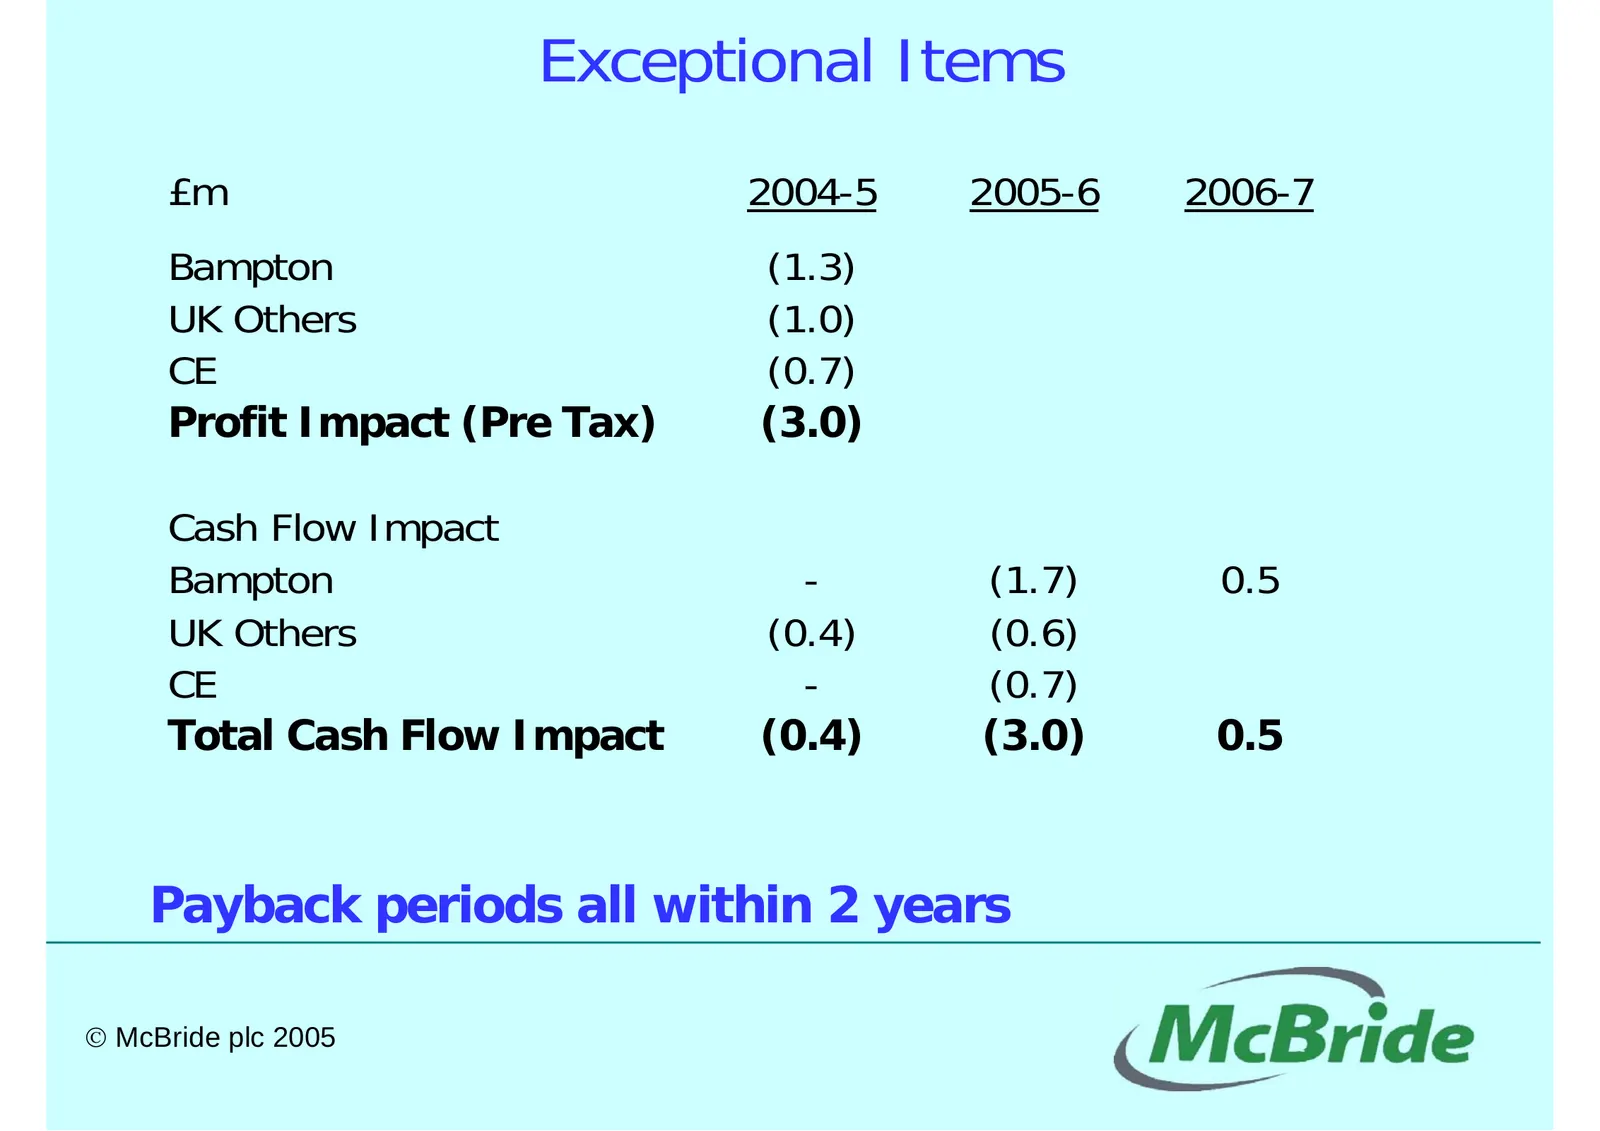
Slide 6: Exceptional Items
Exceptional Items £m 2004-5 2005-6 2006-7 Bampton (1.3) UK Others (1.0) CE (0.7) Profit Impact (Pre Tax) (3.0) Cash Flow Impact Bampton - (1.7) 0.5 UK Others (0.4) (0.6) CE - (0.7) Total Cash Flow Impact (0.4) (3.0) 0.5 Payback periods all within 2 years © McBride plc 2005
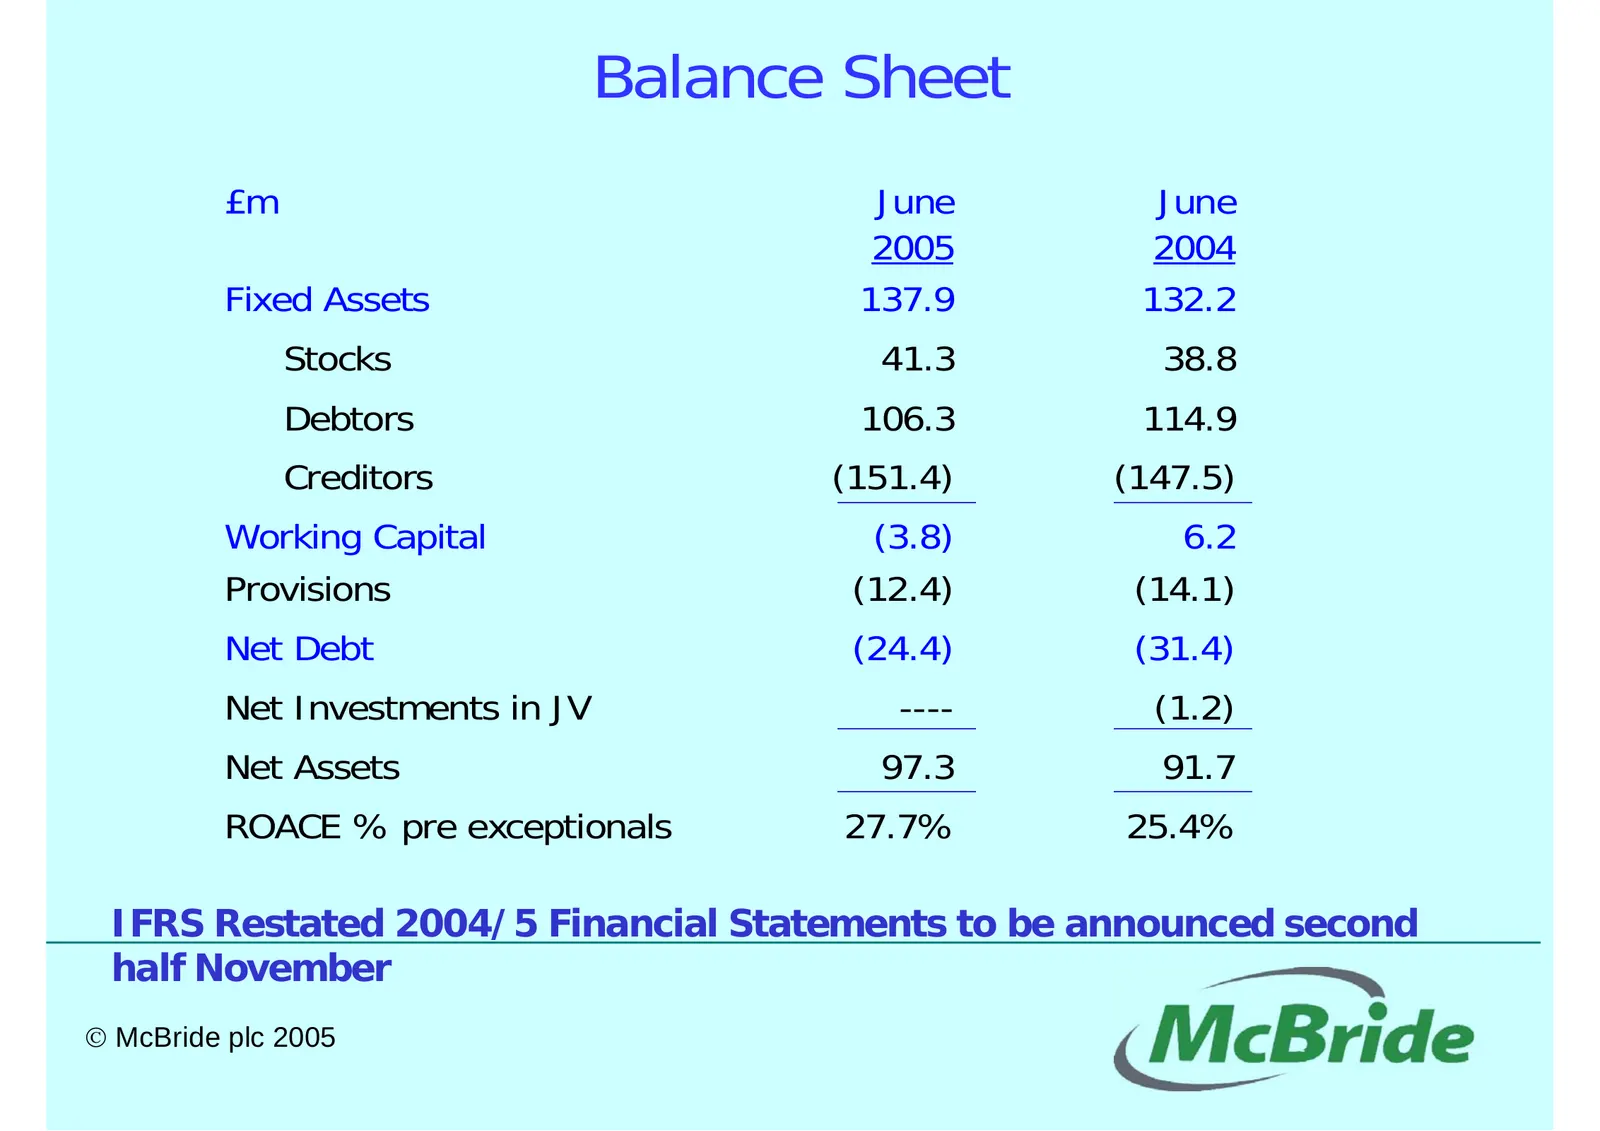
Slide 7: Balance Sheet
Balance Sheet £m June June 2005 2004 Fixed Assets 137.9 132.2 Stocks 41.3 38.8 Debtors 106.3 114.9 Creditors (151.4) (147.5) Working Capital (3.8) 6.2 Provisions (12.4) (14.1) Net Debt (24.4) (31.4) Net Investments in JV ---- (1.2) Net Assets 97.3 91.7 ROACE % pre exceptionals 27.7% 25.4% IFRS Resta
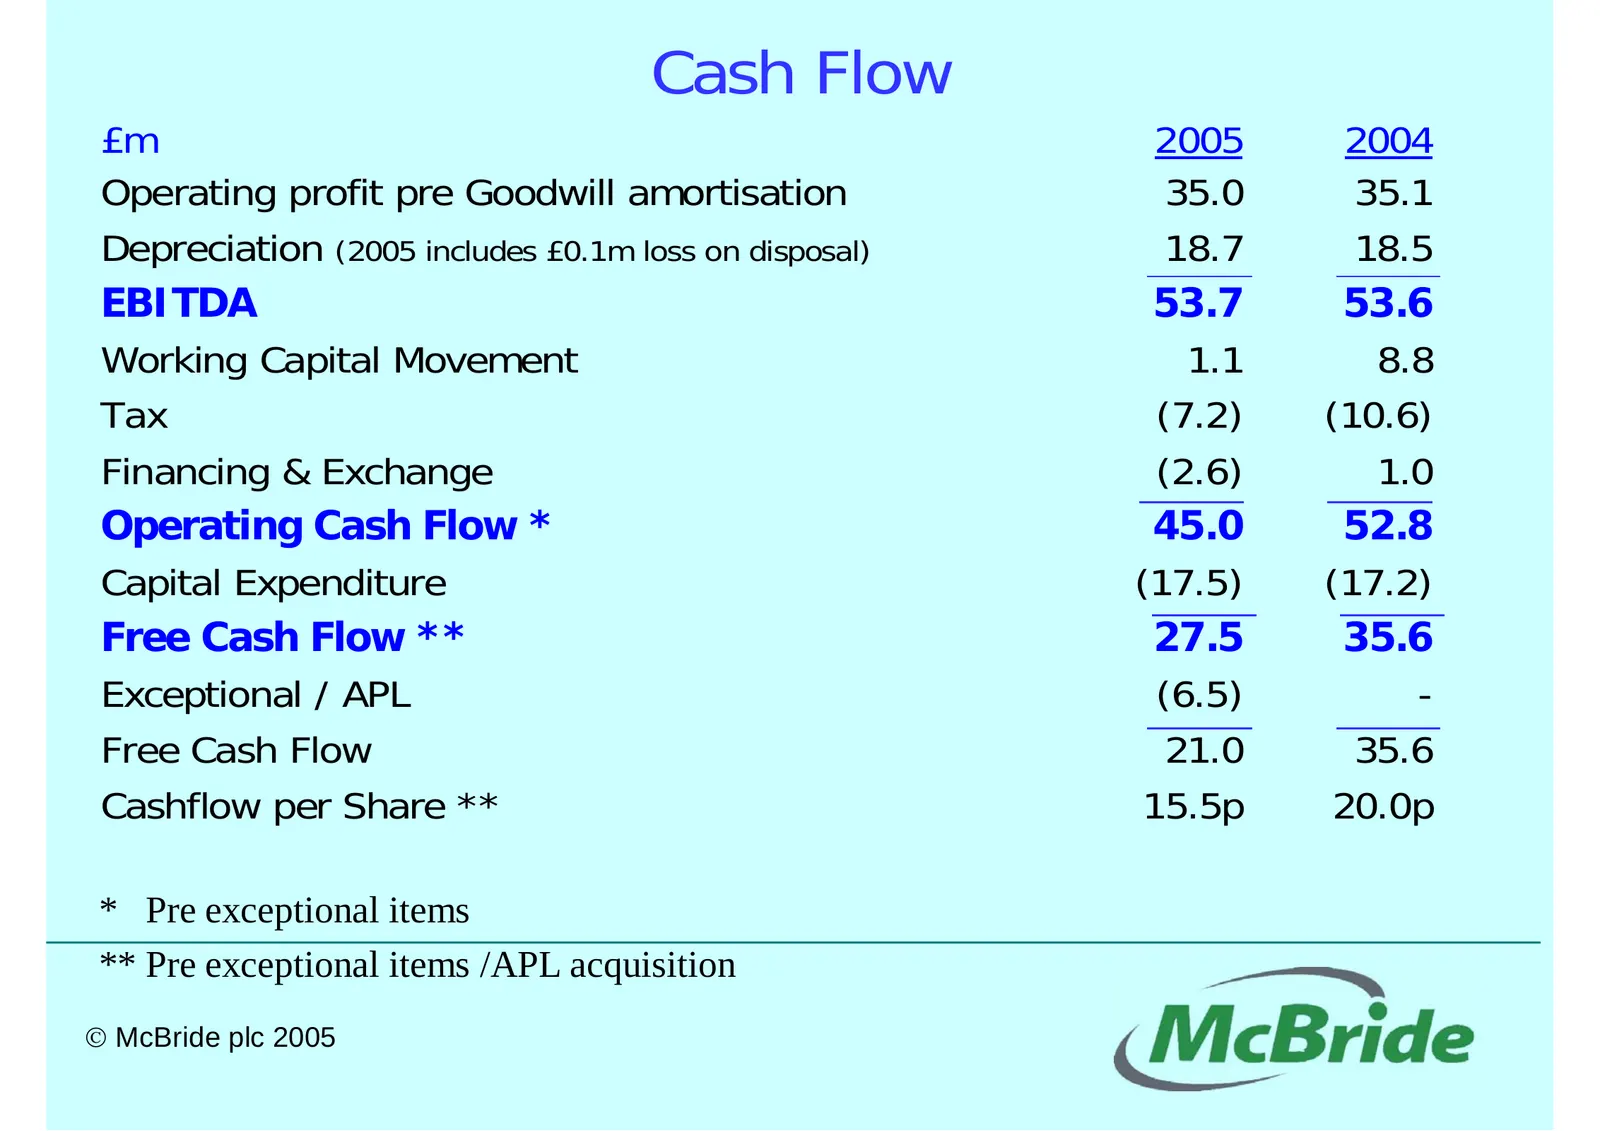
Slide 8: Cash Flow
Cash Flow £m 2005 2004 Operating profit pre Goodwill amortisation 35.0 35.1 Depreciation (2005 includes £0.1m loss on disposal) 18.7 18.5 EBITDA 53.7 53.6 Working Capital Movement 1.1 8.8 Tax (7.2) (10.6) Financing & Exchange (2.6) 1.0 Operating Cash Flow * 45.0 52.8 Capital Expenditure (17.5) (17.2
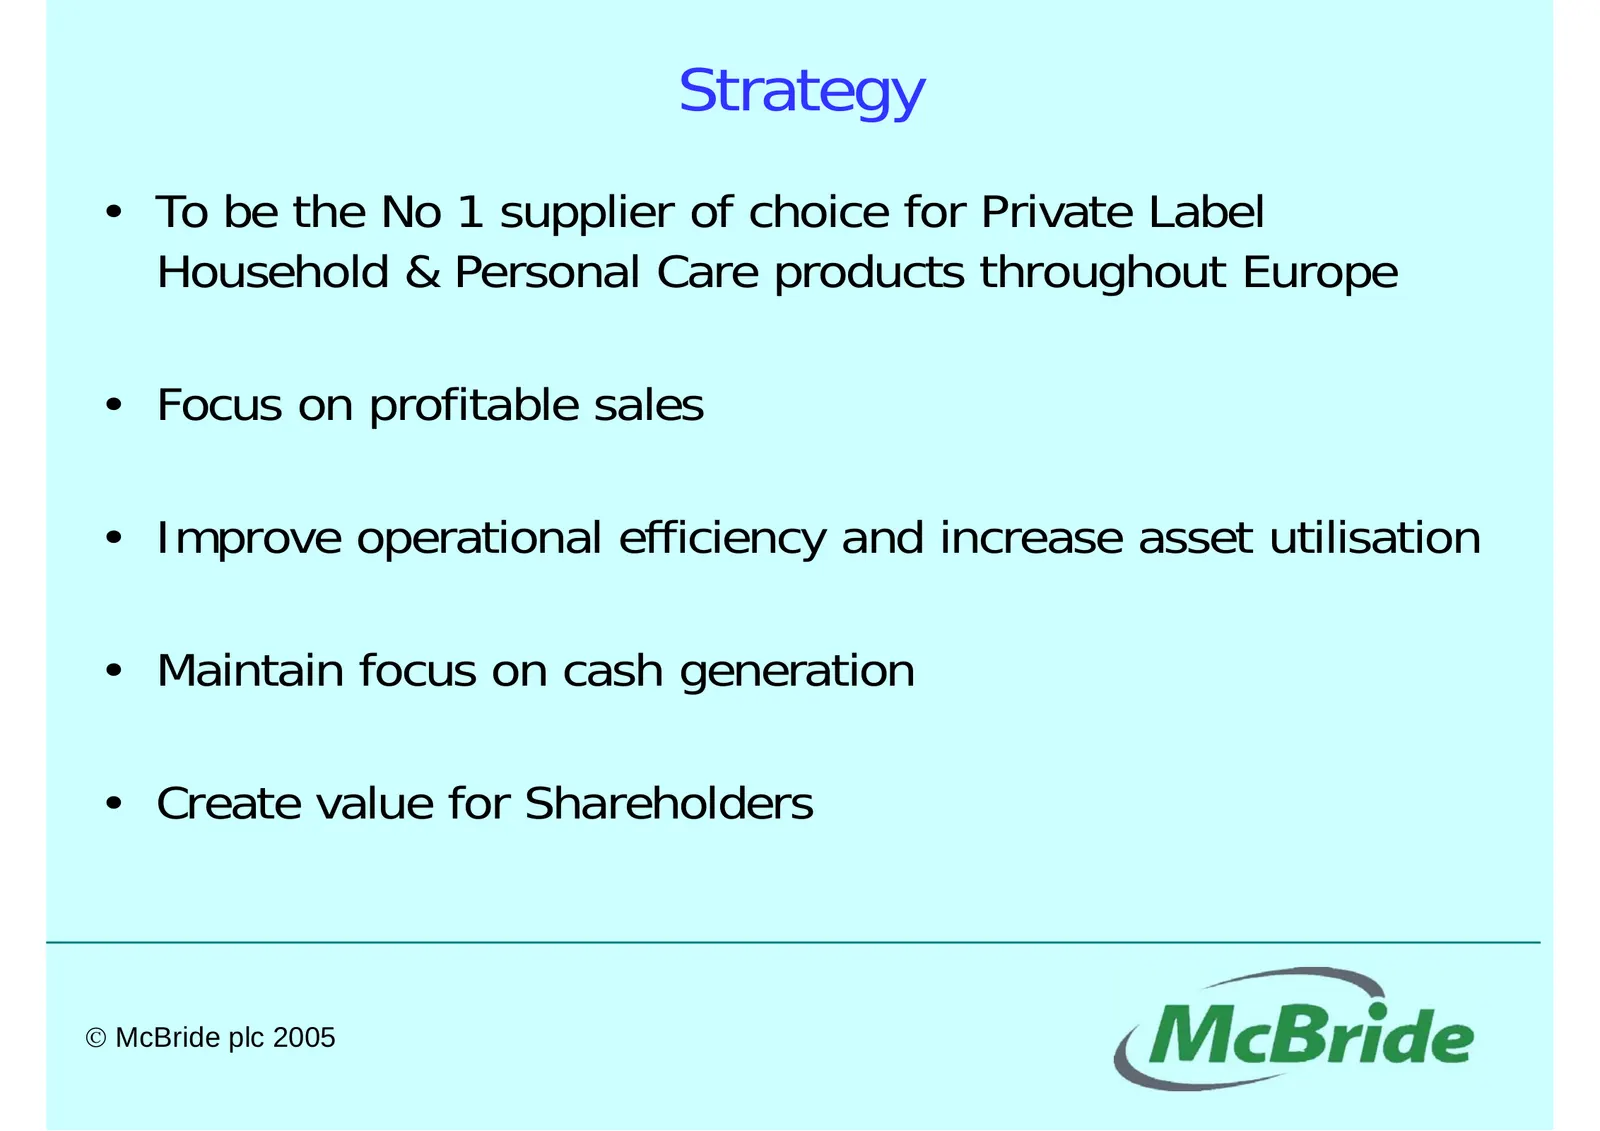
Slide 9: Strategy
Strategy • To be the No 1 supplier of choice for Private Label Household & Personal Care products throughout Europe • Focus on profitable sales • Improve operational efficiency and increase asset utilisation • Maintain focus on cash generation • Create value for Shareholders © McBride plc 2005
Slide 10: Sales Performance
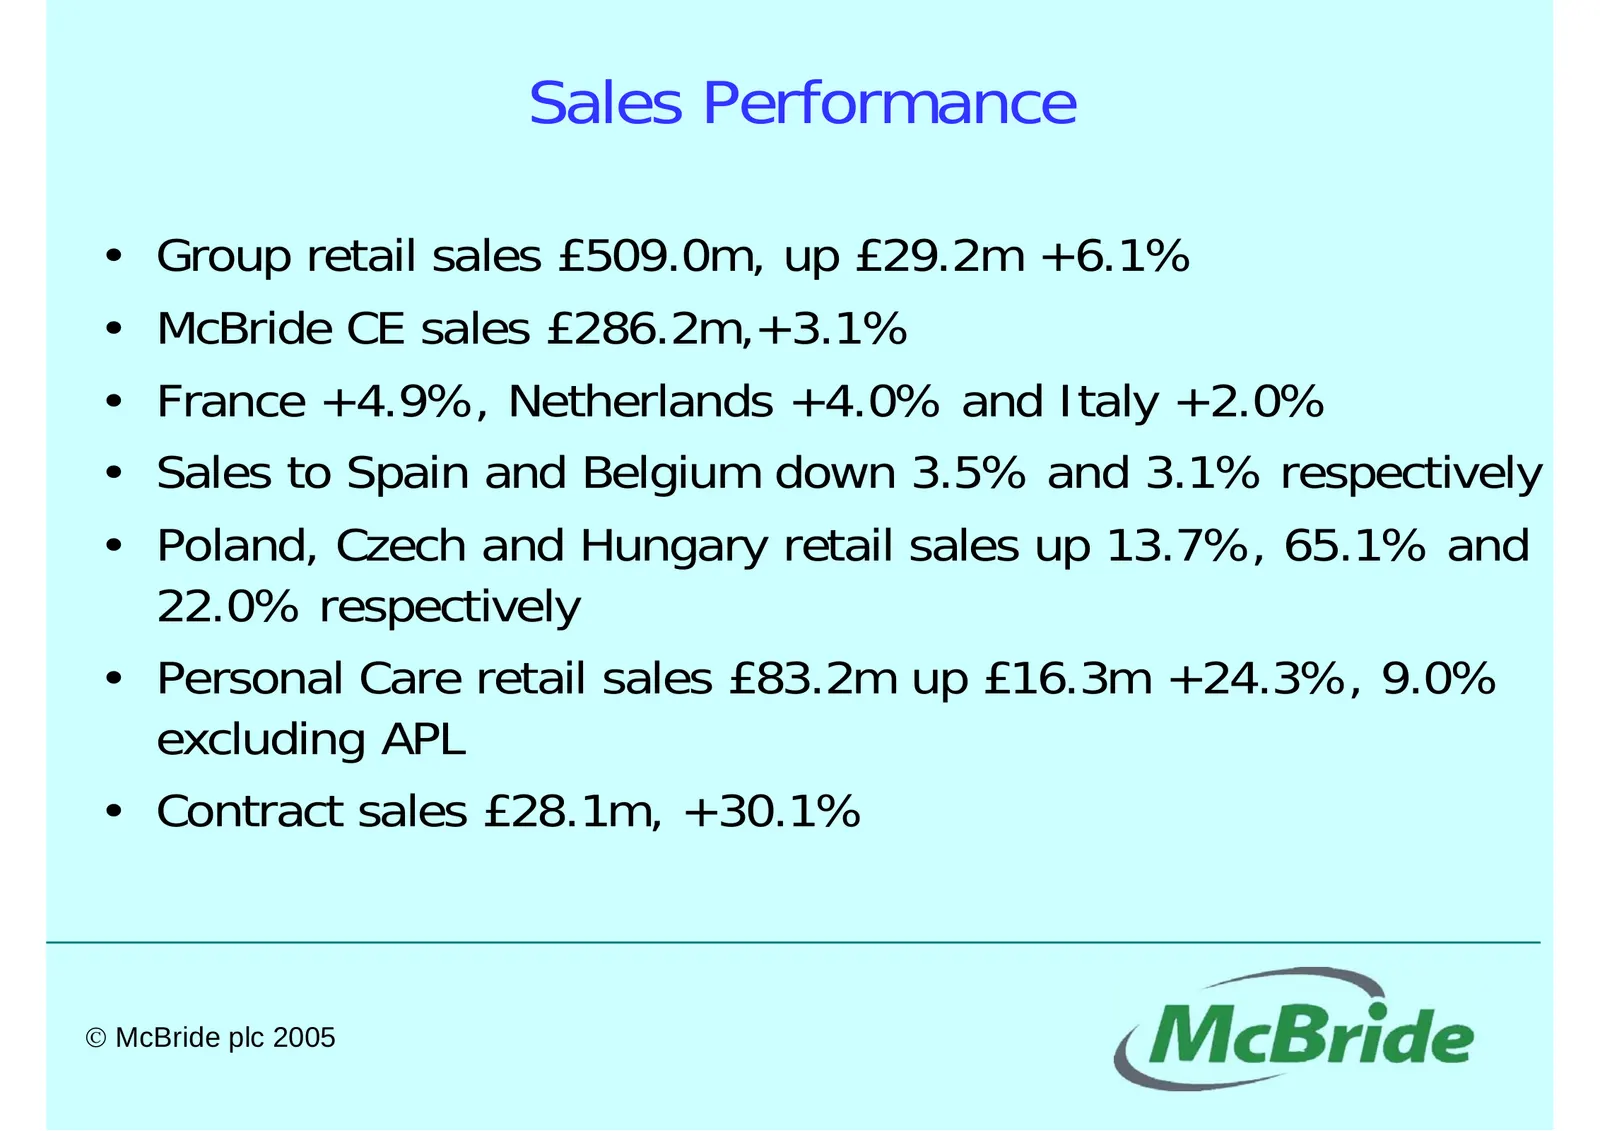
Sales Performance • Group retail sales £509.0m, up £29.2m +6.1% • McBride CE sales £286.2m,+3.1% • France +4.9%, Netherlands +4.0% and Italy +2.0% • Sales to Spain and Belgium down 3.5% and 3.1% respectively • Poland, Czech and Hungary retail sales up 13.7%, 65.1% and 22.0% respectively • Personal C
Slide 11: Cost Pressures
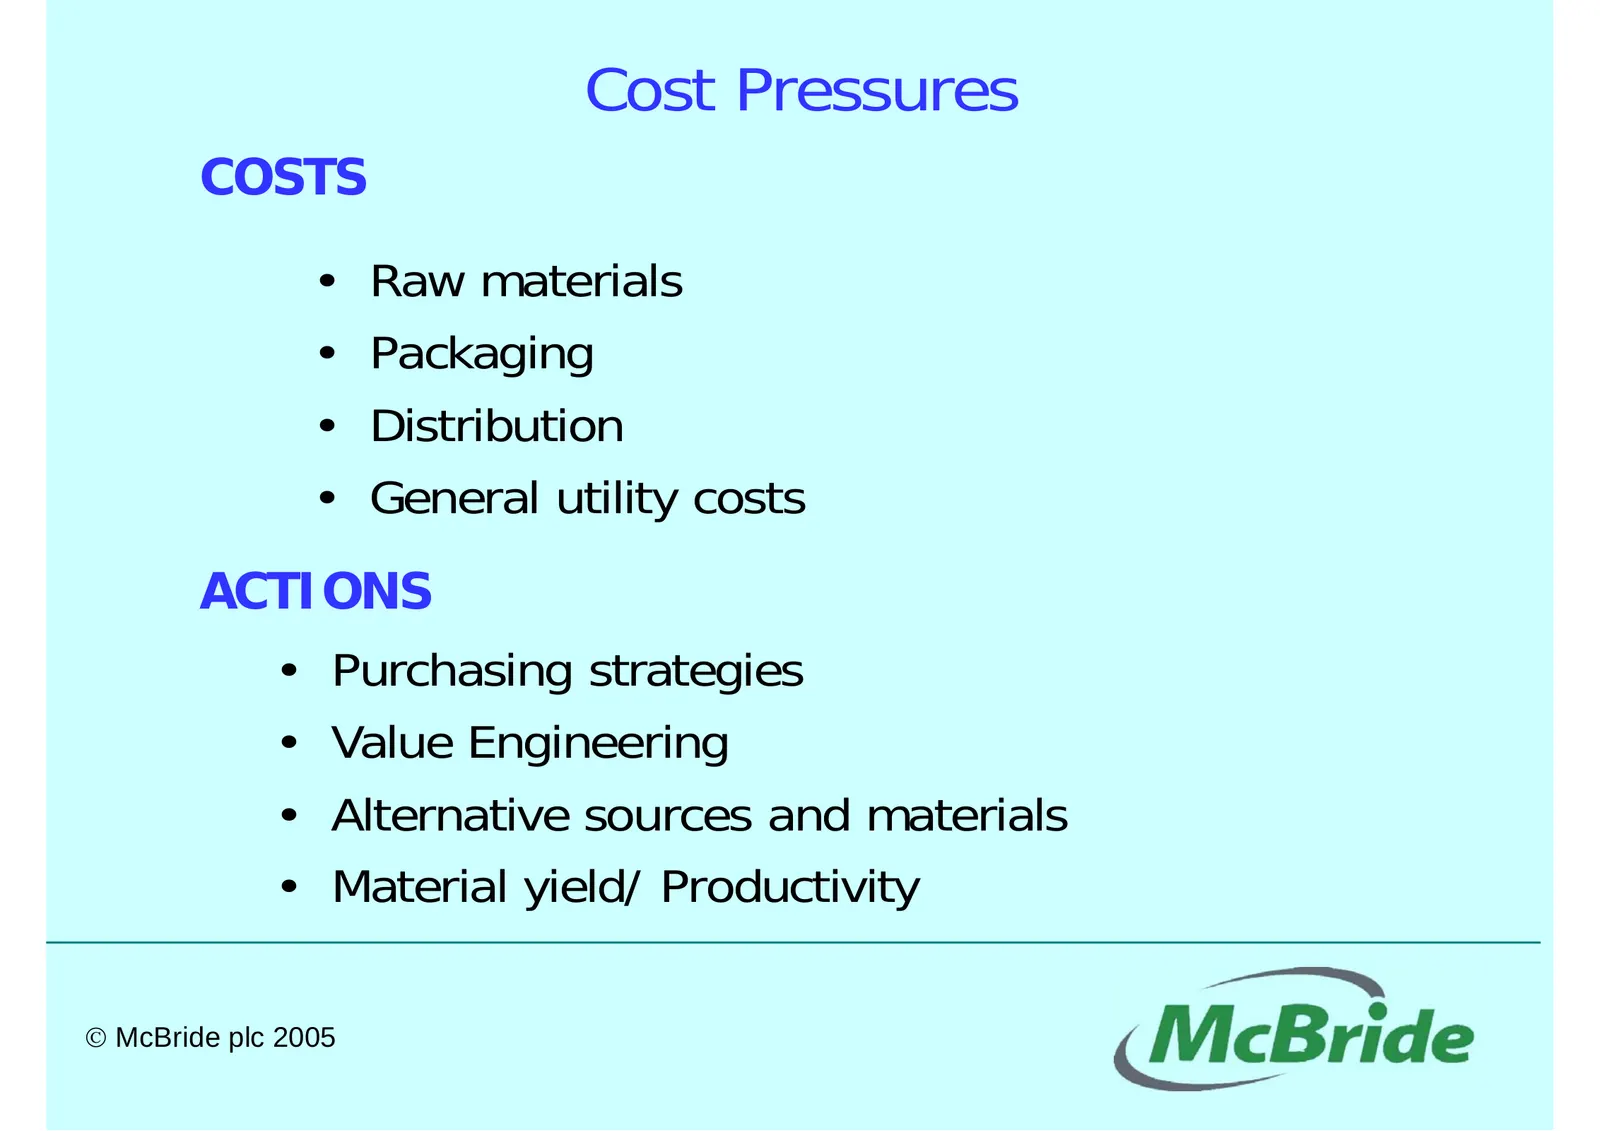
Cost Pressures COSTS • Raw materials • Packaging • Distribution • General utility costs ACTIONS • Purchasing strategies • Value Engineering • Alternative sources and materials • Material yield/ Productivity © McBride plc 2005
Slide 12: Cost Management
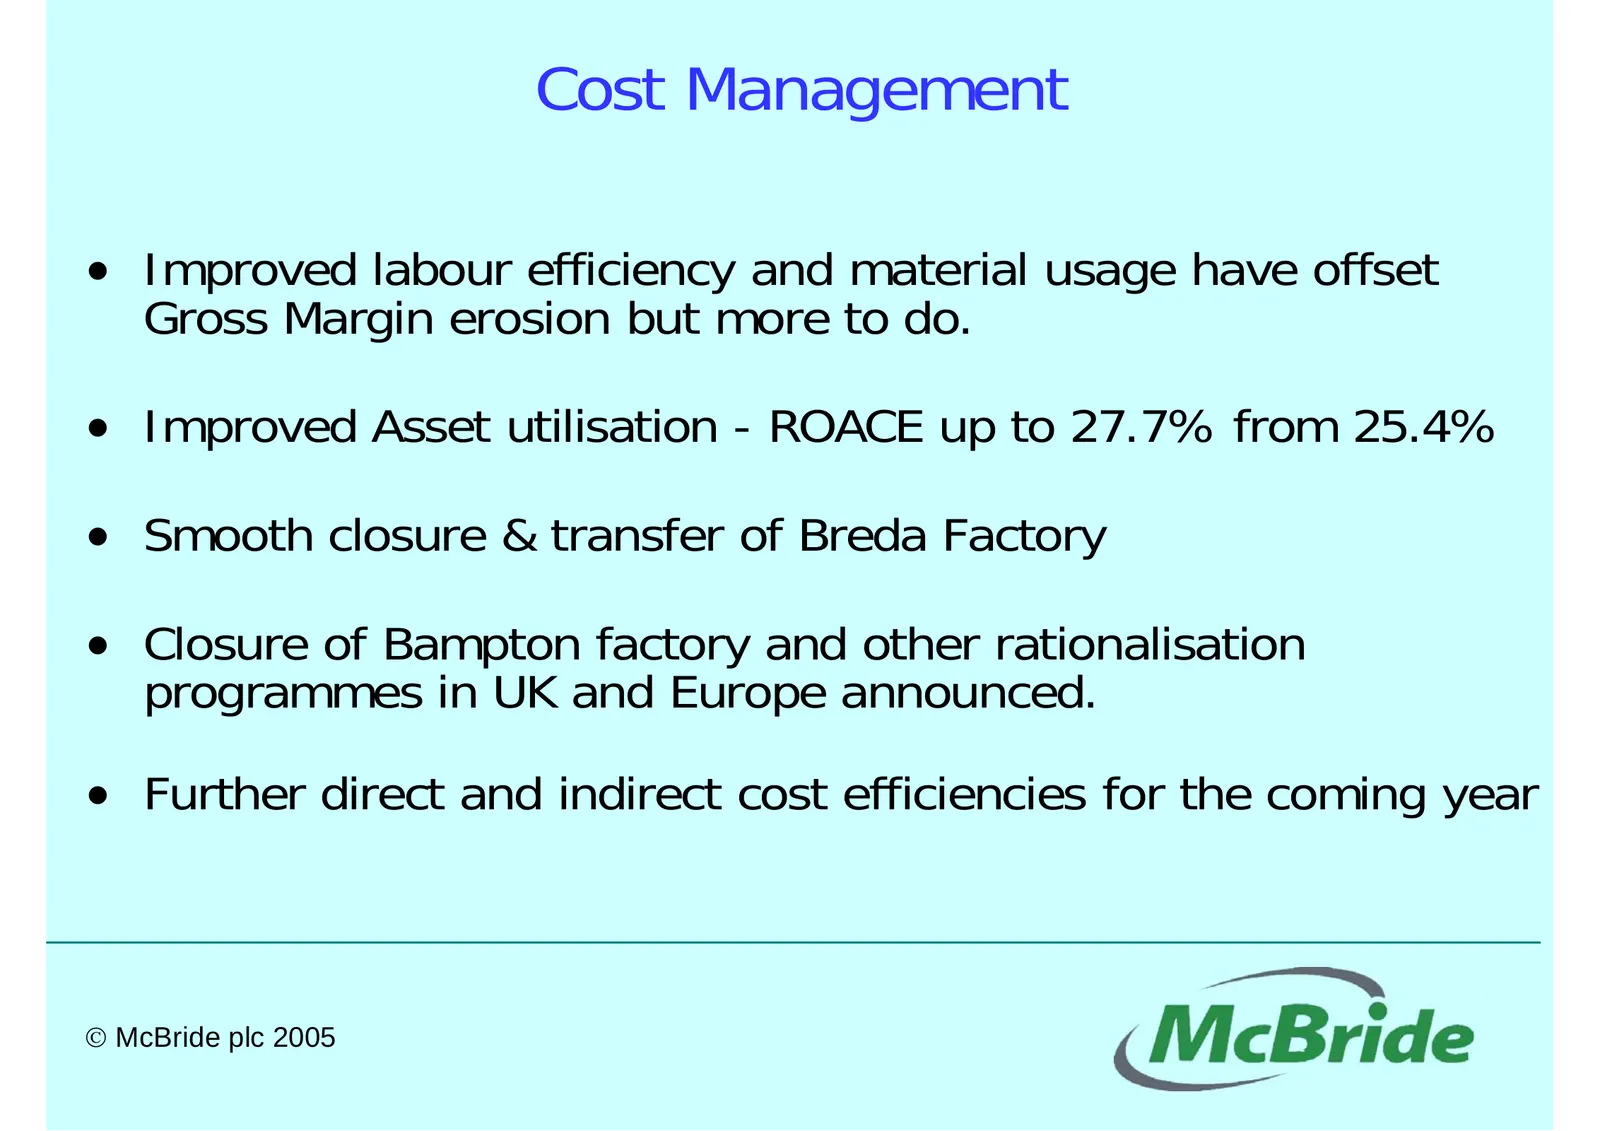
Cost Management • Improved labour efficiency and material usage have offset Gross Margin erosion but more to do. • Improved Asset utilisation - ROACE up to 27.7% from 25.4% • Smooth closure & transfer of Breda Factory • Closure of Bampton factory and other rationalisation programmes in UK and Europe
Slide 13: Returns to Shareholders
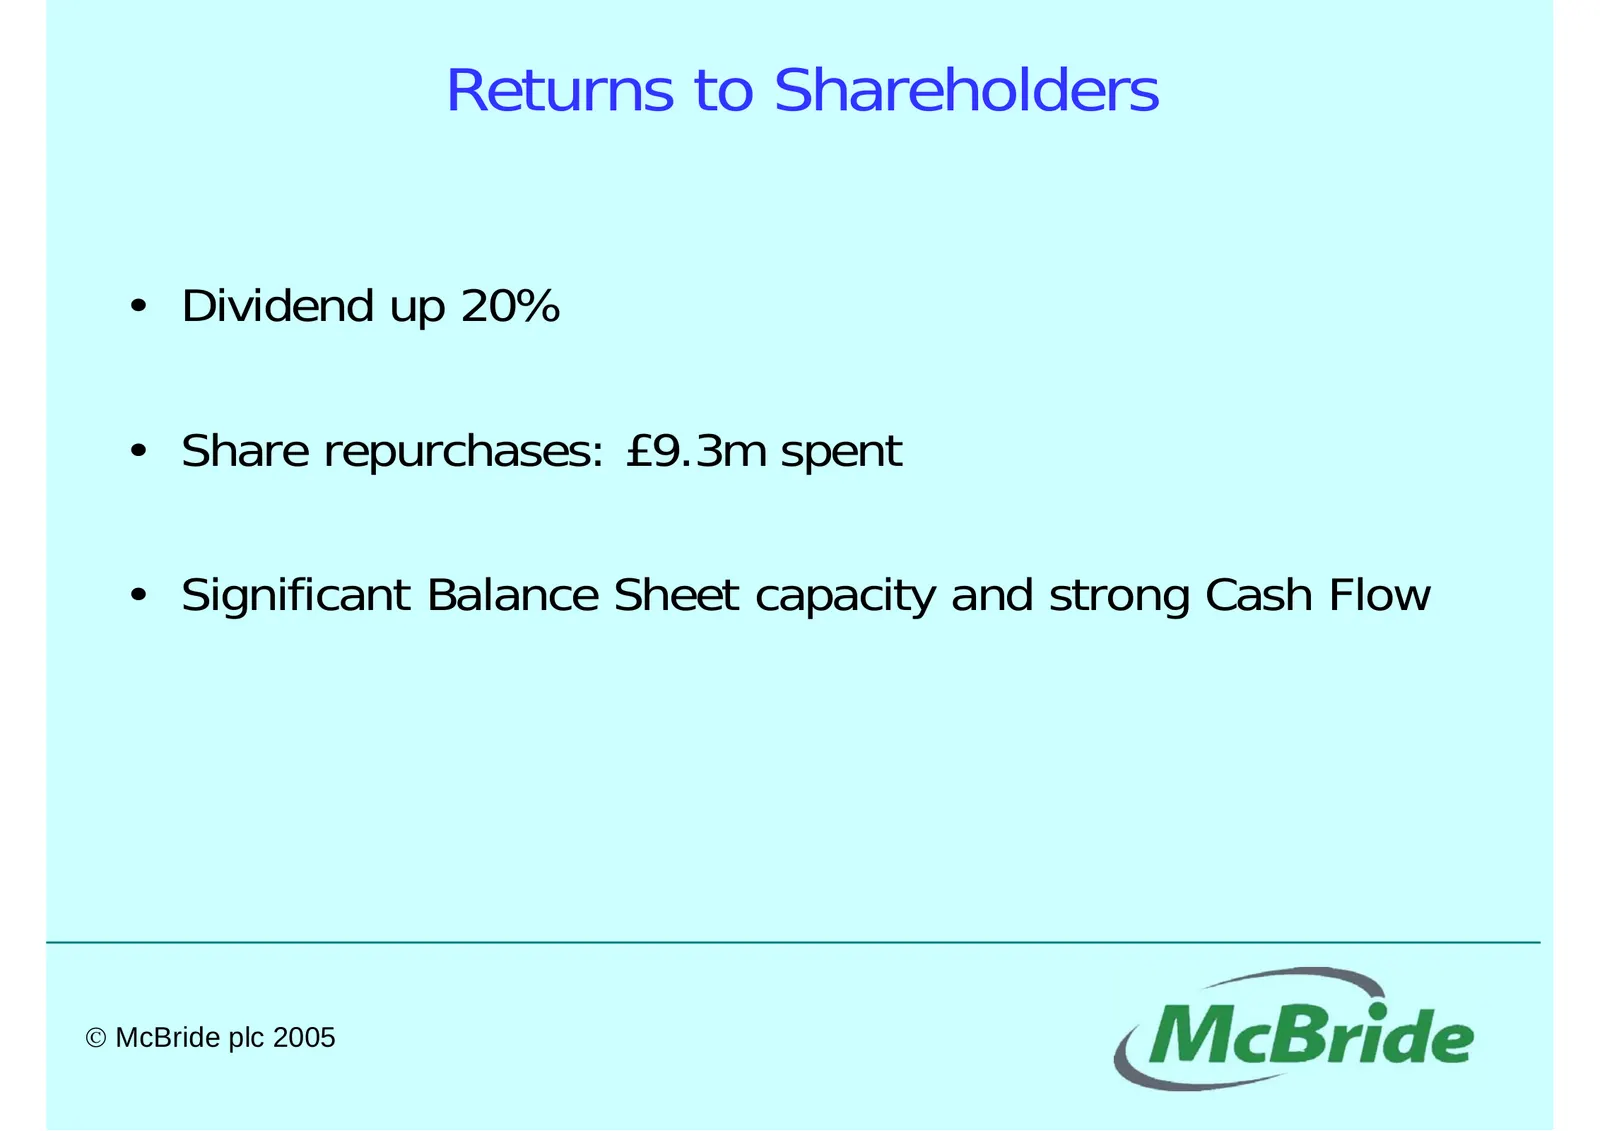
Returns to Shareholders • Dividend up 20% • Share repurchases: £9.3m spent • Significant Balance Sheet capacity and strong Cash Flow © McBride plc 2005
Slide 14: Current Trading & Outlook
Current Trading & Outlook These results have been achieved in challenging market conditions and demonstrate the underlying strength of our business. Initiatives continue to be launched to further improve our competitiveness and more are planned. Since the year end trading has been in line with our e
Slide 15: Summary
Summary • Solid performance in a challenging environment • Continued Cash Generation • Focus on cost base, service and product innovation especially in Continental Europe • Continued improvement in ROACE • Improving returns to shareholders • Many opportunities to lever the potential of the Business

Slide 16: Appendices
Appendices © McBride plc 2005
Slide 17: Geographical Sales Split
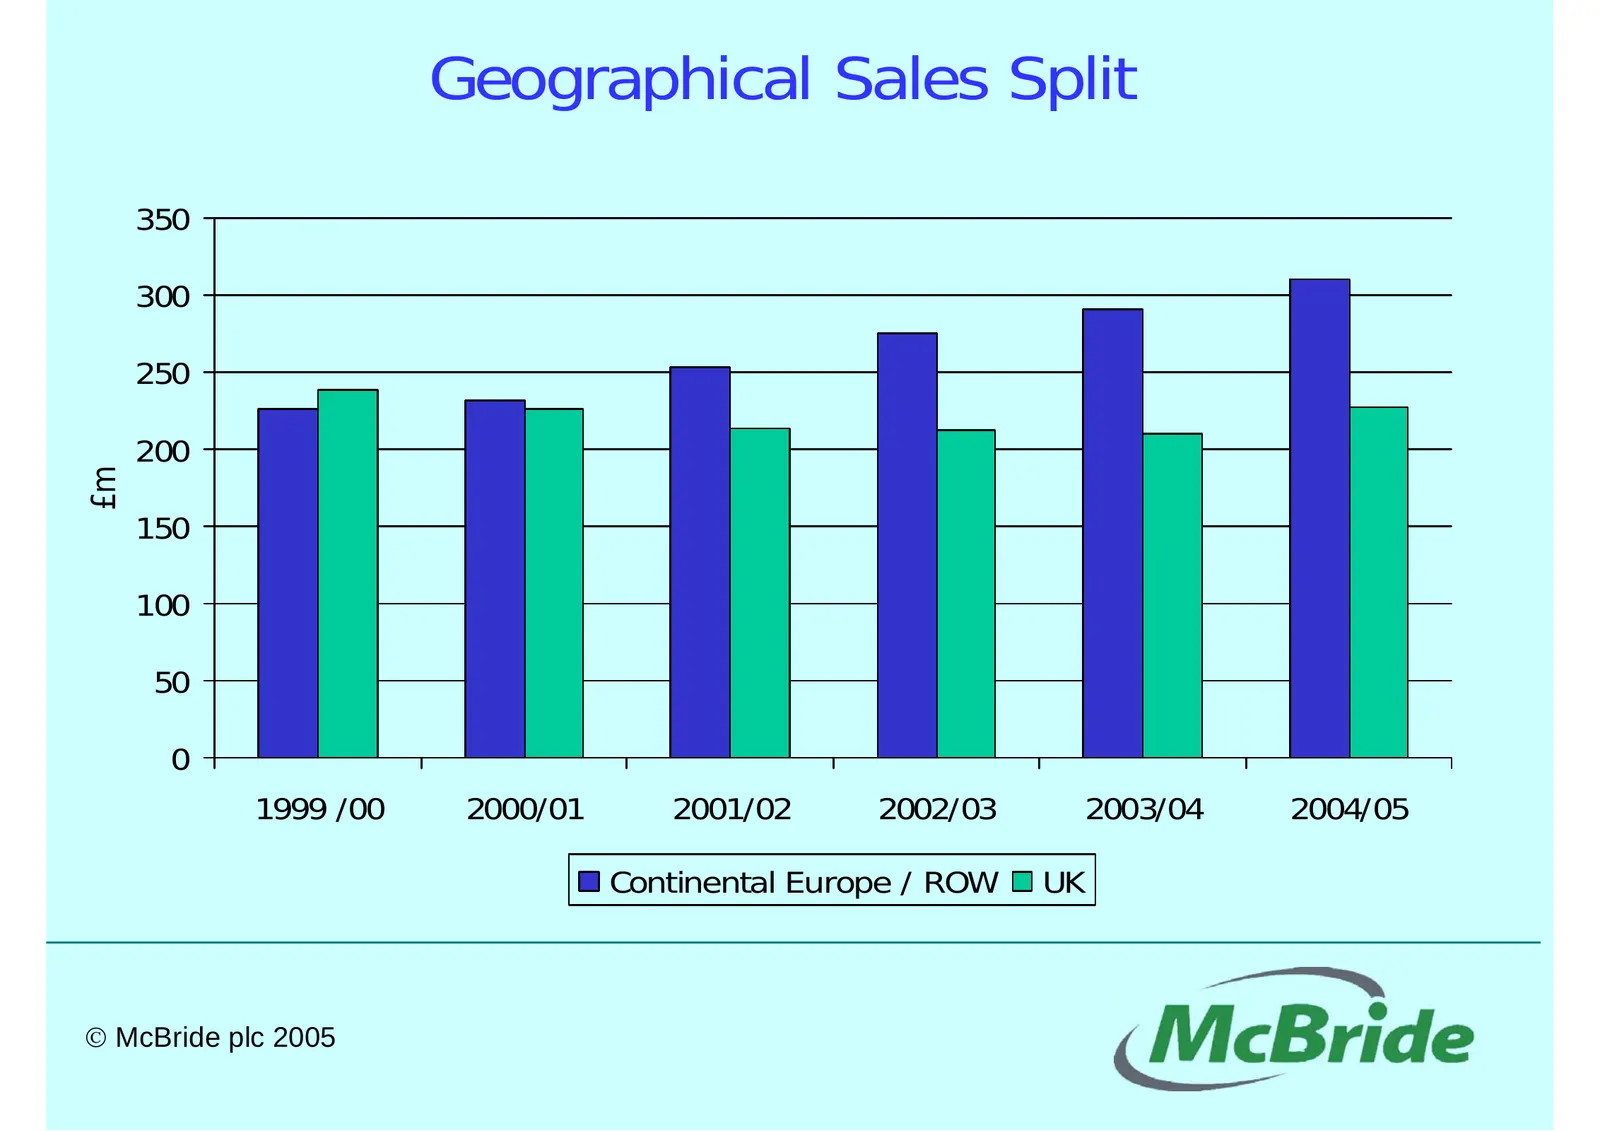
Geographical Sales Split 350 300 250 200 £m 150 100 50 0 1999 /00 2000/01 2001/02 2002/03 2003/04 2004/05 Continental Europe / ROW UK © McBride plc 2005
Slide 18: UK PL Household Volume Share gains offset by Selling Price Deflation
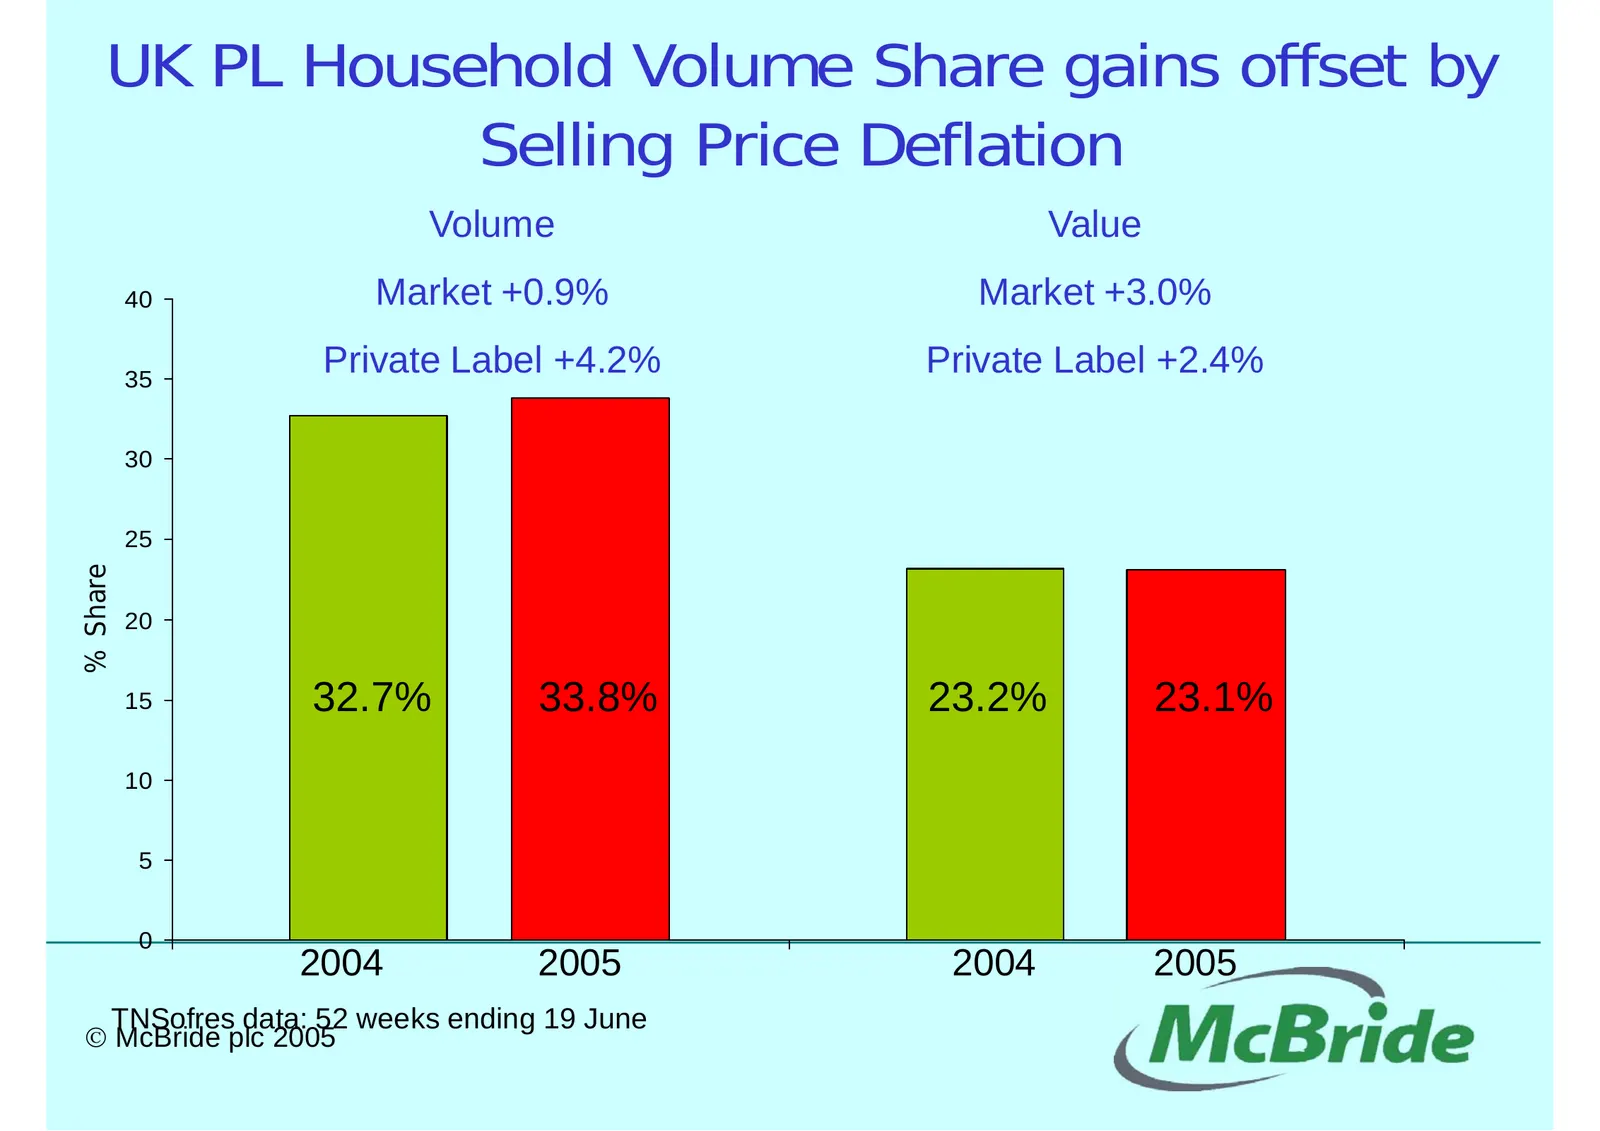
UK PL Household Volume Share gains offset by Selling Price Deflation Volume Value 40 Market +0.9% Market +3.0% 35 Private Label +4.2% Private Label +2.4% 30 25 % Share 20 15 32.7% 33.8% 23.2% 23.1% 10 5 0 2004 2005 2004 2005 TNSofres data: 52 weeks ending 19 June © McBride plc 2005
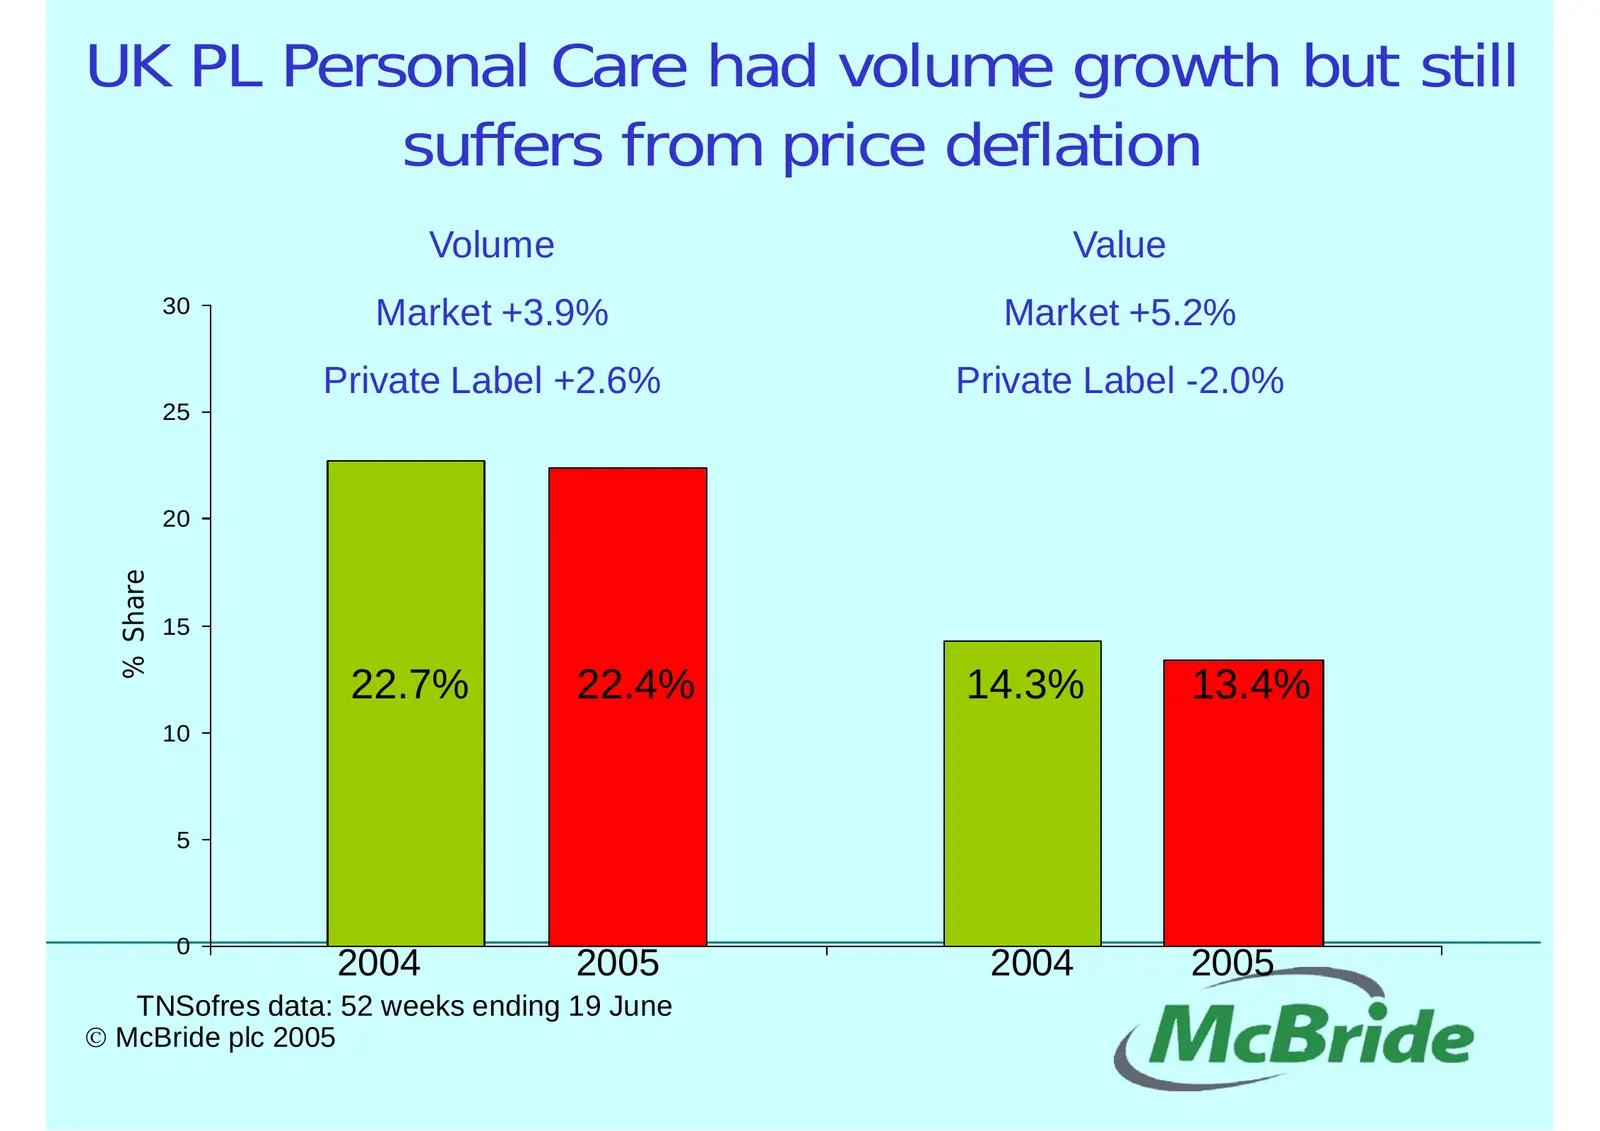
Slide 19: UK PL Personal Care had volume growth but still suffers from price deflation
UK PL Personal Care had volume growth but still suffers from price deflation Volume Value 30 Market +3.9% Market +5.2% Private Label +2.6% Private Label -2.0% 25 20 % Share 15 22.7% 22.4% 14.3% 13.4% 10 5 0 2004 2005 2004 2005 TNSofres data: 52 weeks ending 19 June © McBride plc 2005
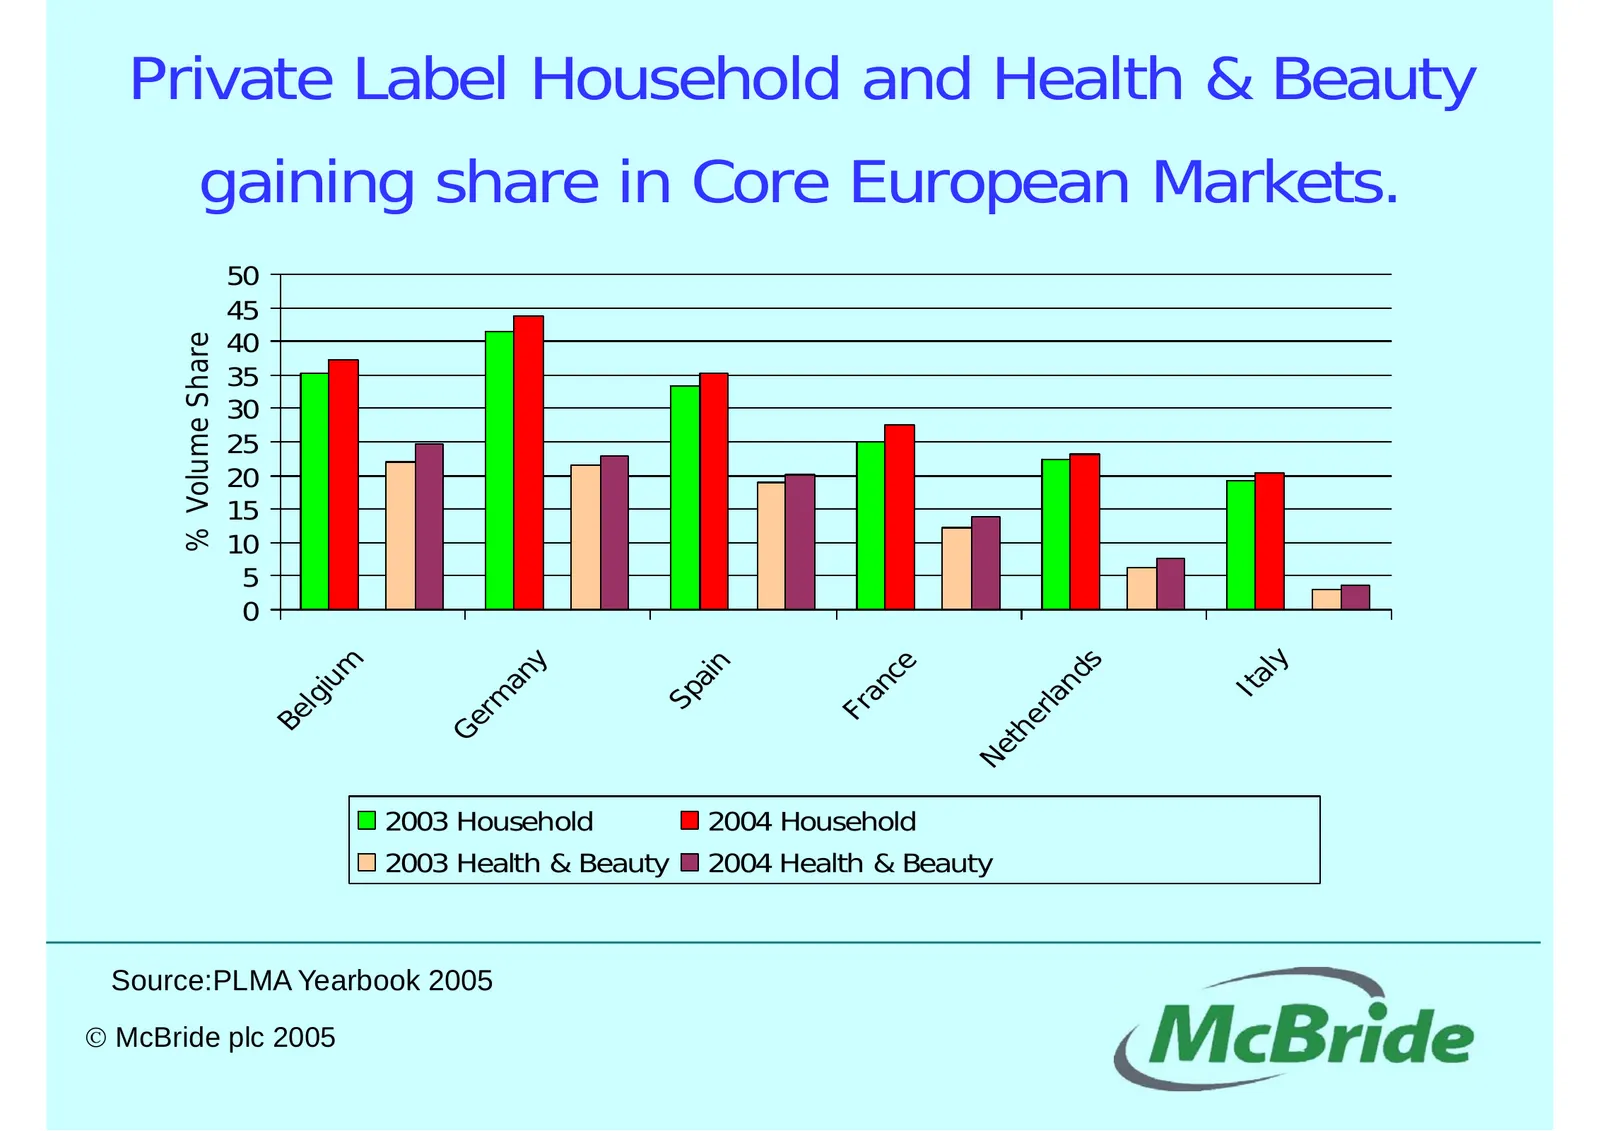
Slide 20: Private Label Household and Health & Beauty gaining share in Core European Markets
Private Label Household and Health & Beauty gaining share in Core European Markets. 50 45 40 % Volume Share 35 30 25 20 15 10 5 0 ly m y s ce n nd an ai Ita iu an Sp rm rla lg Fr Be e Ge th Ne 2003 Household 2004 Household 2003 Health & Beauty 2004 Health & Beauty Source:PLMA Yearbook 2005 © McBride
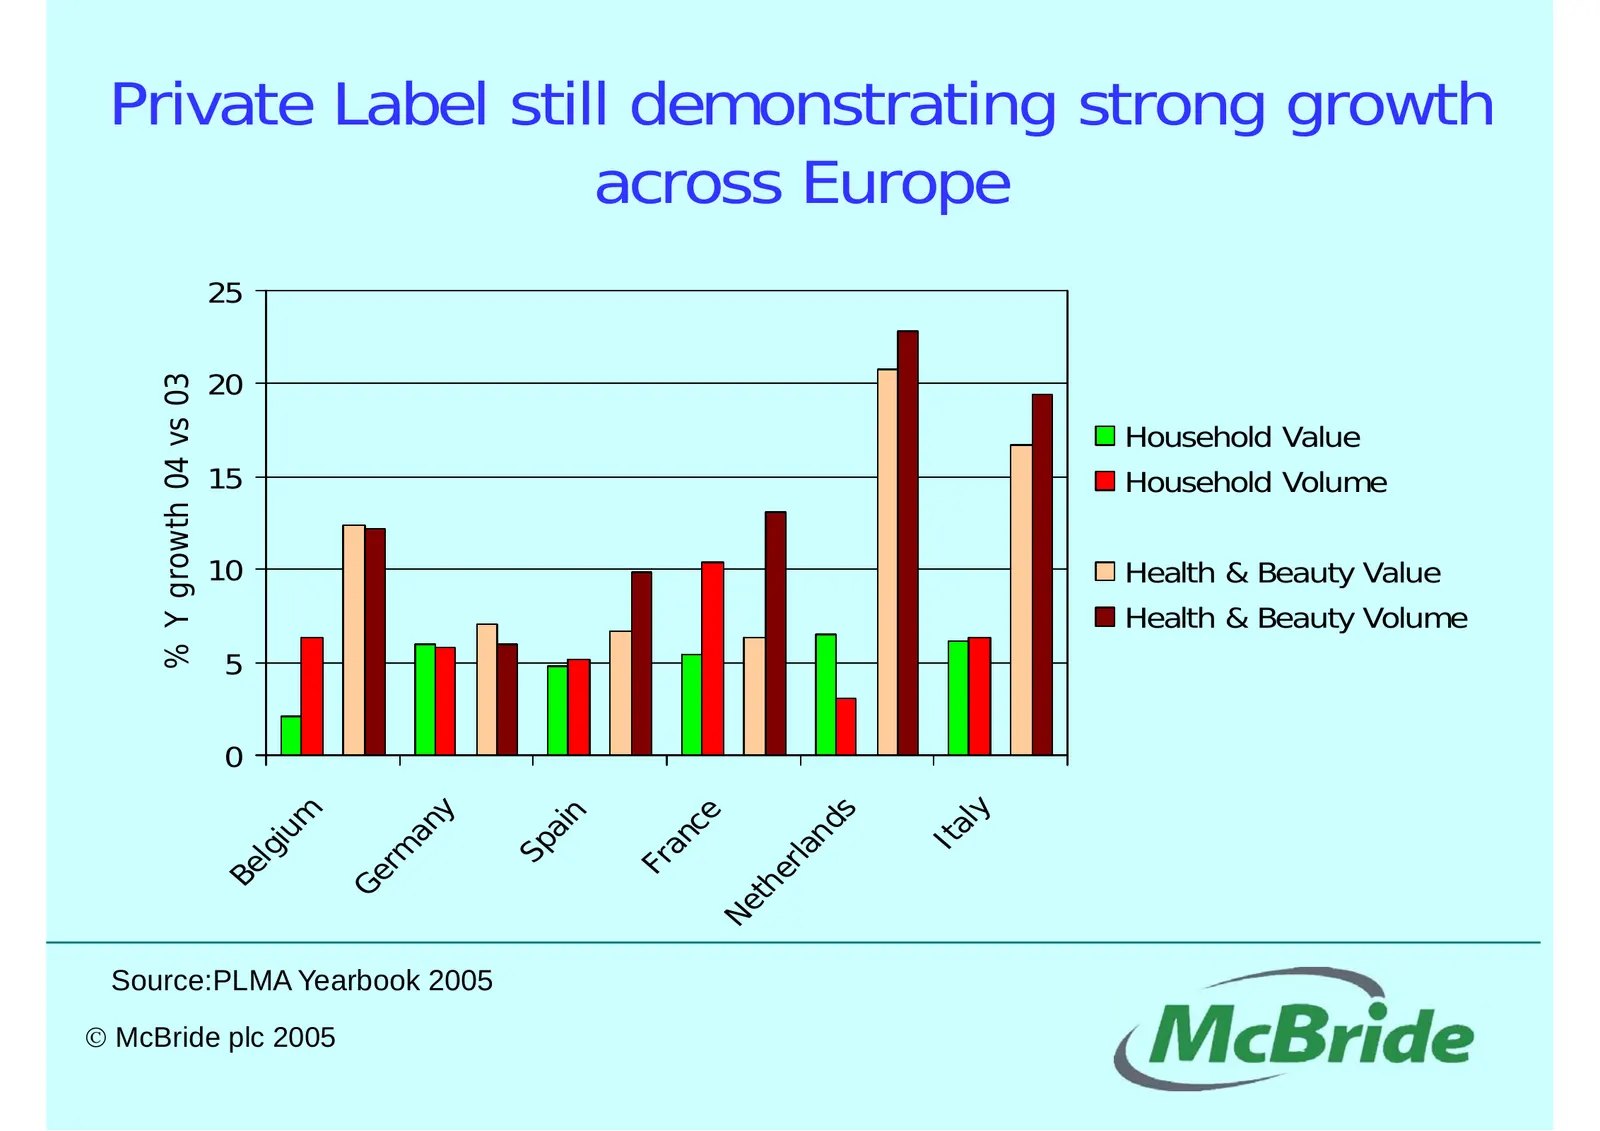
Slide 21: Private Label still demonstrating strong growth across Europe
Private Label still demonstrating strong growth across Europe 25 20 % Y growth 04 vs 03 Household Value 15 Household Volume 10 Health & Beauty Value Health & Beauty Volume 5 0 ly y m s ce n nd an ai Ita iu an Sp rm la lg Fr er Be Ge th Ne Source:PLMA Yearbook 2005 © McBride plc 2005
Slide 22: Key Drivers of Private Label Growth
Key Drivers of Private Label Growth are: • Retail Concentration • Multinational Retailers presence in market • Discount Sector Growth • Consumer Propensity to Buy © McBride plc 2005
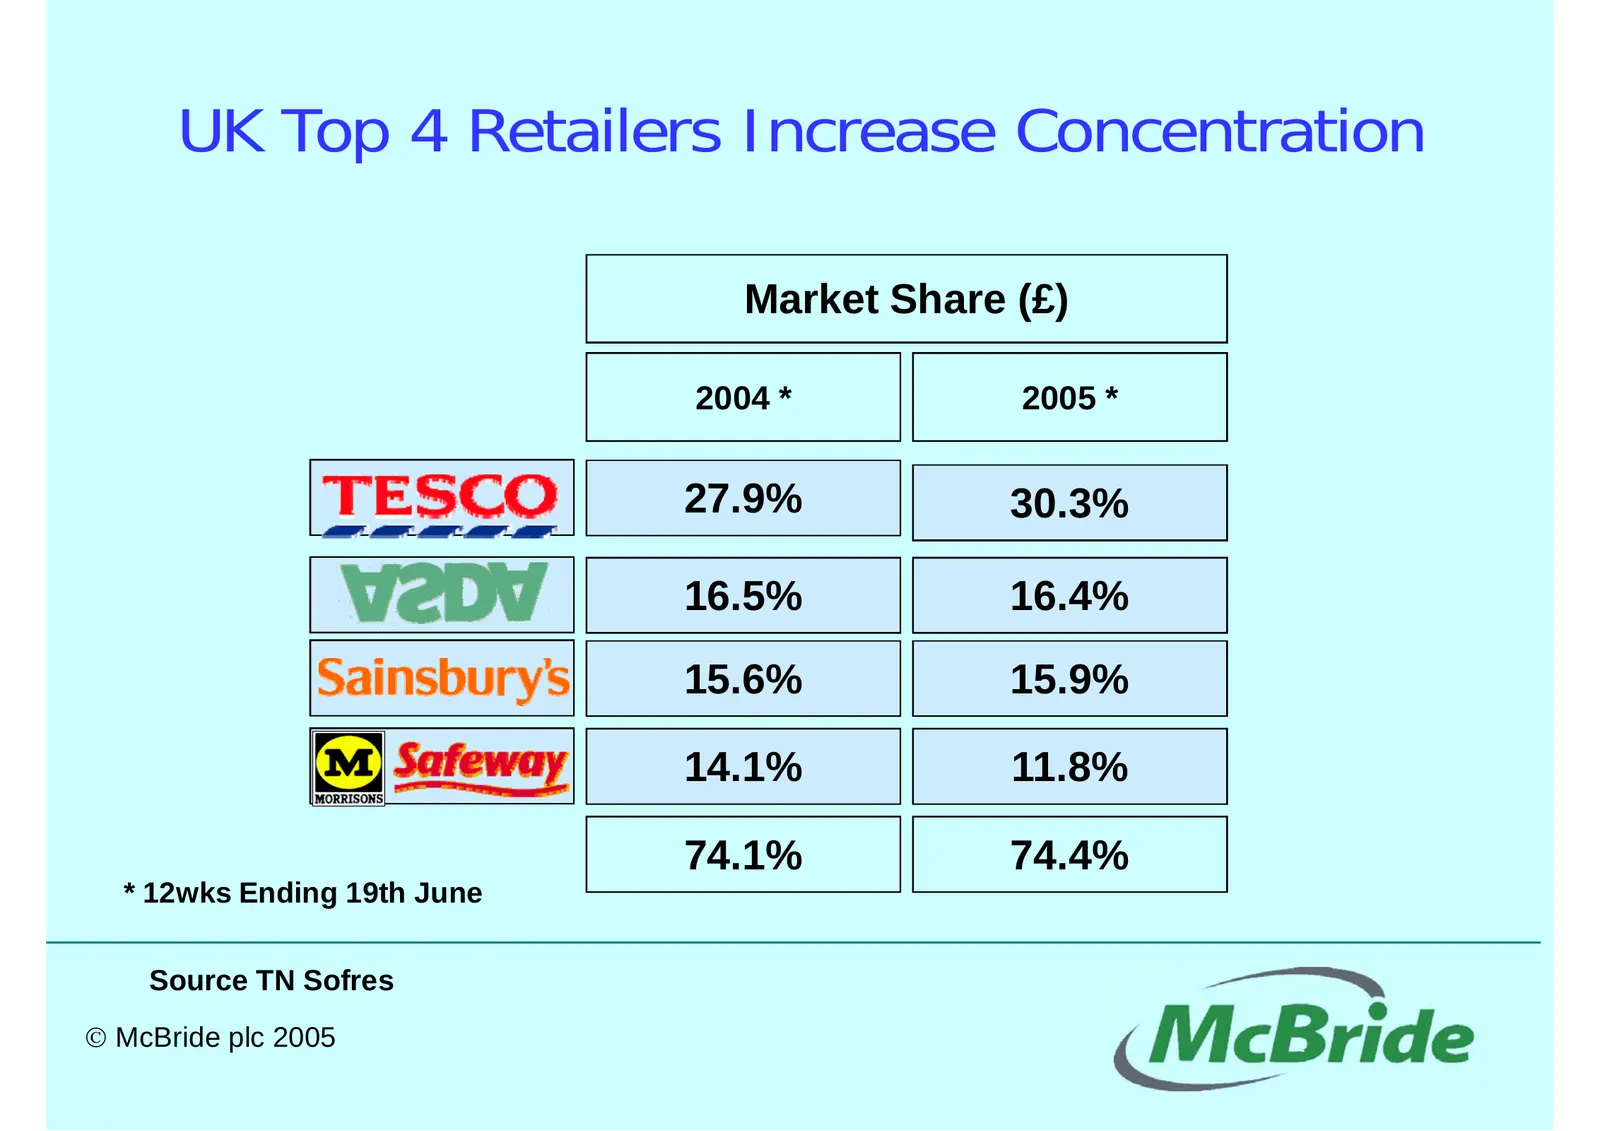
Slide 23: UK Top Retailers Increase Concentration
UK Top 4 Retailers Increase Concentration Market Share (£) 2004 * 2005 * 27.9% 30.3% 16.5% 16.4% 15.6% 15.9% 14.1% 11.8% 74.1% 74.4% * 12wks Ending 19th June Source TN Sofres © McBride plc 2005
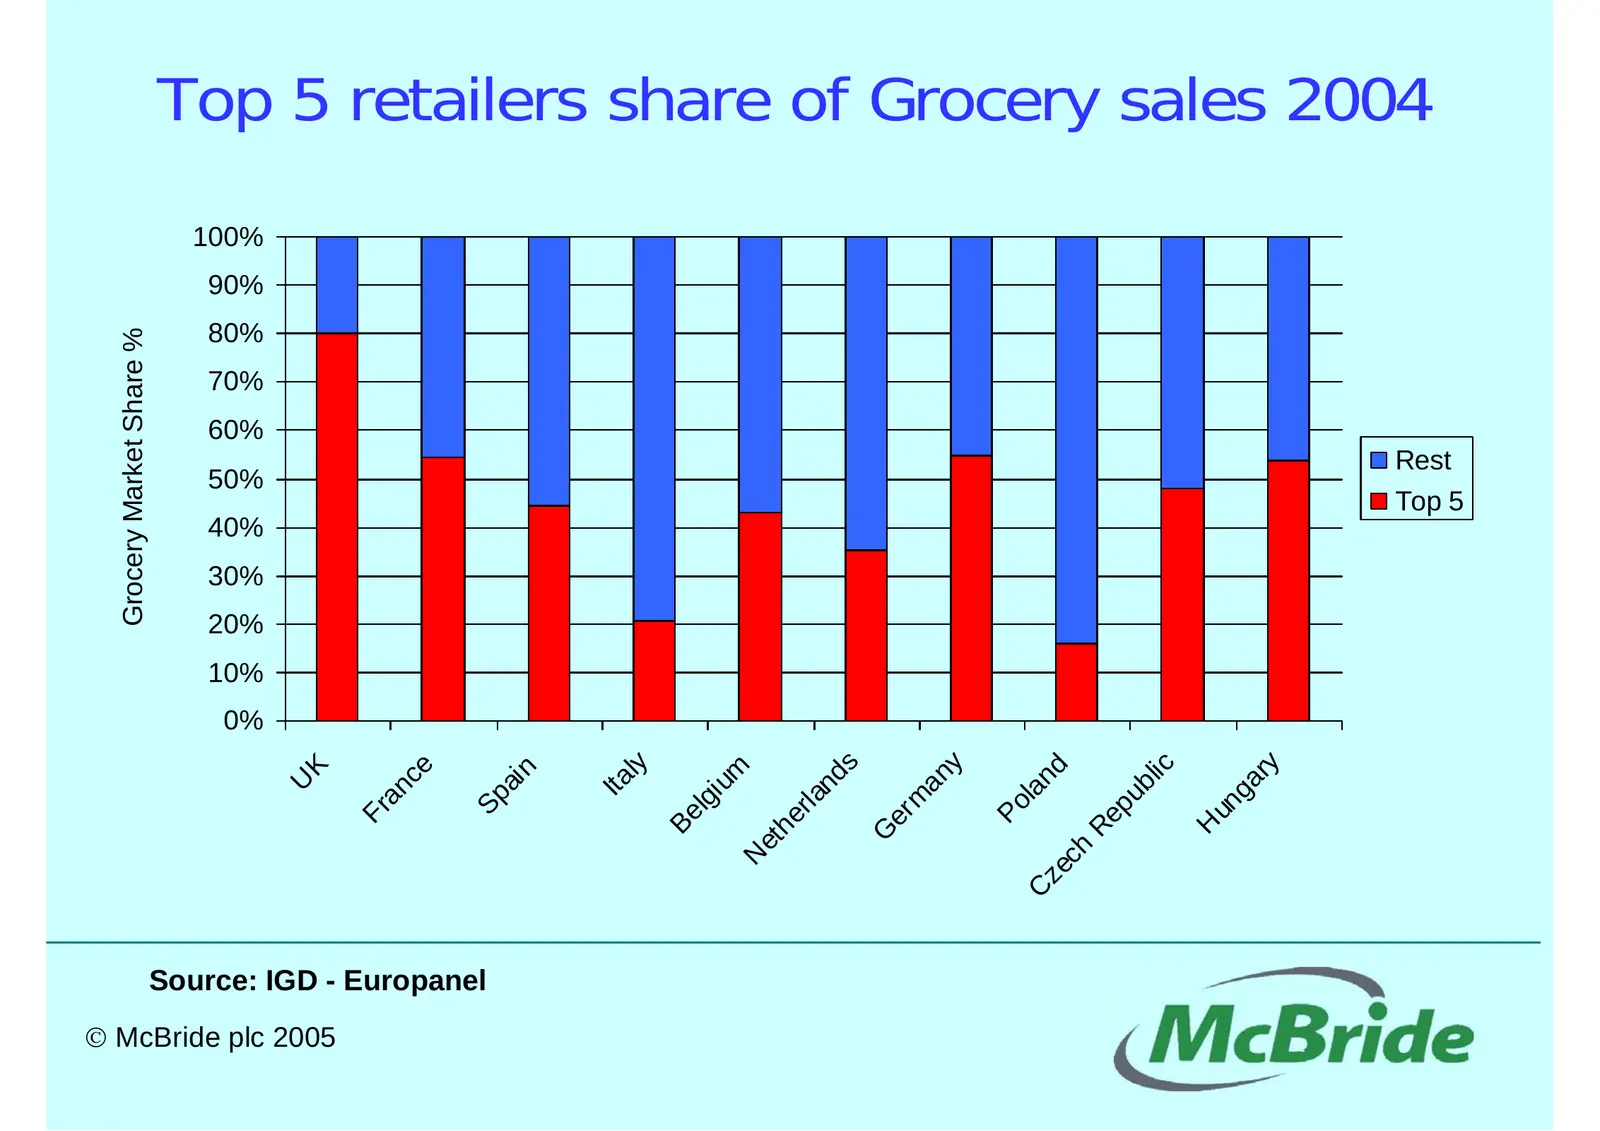
Slide 24: Grocery Market Share %
Top 5 retailers share of Grocery sales 2004 100% 90% 80% Grocery Market Share % 70% 60% Rest 50% Top 5 40% 30% 20% 10% 0% s y ly y lic ce d K um n ar nd an n Ita ai U ub an la g i Sp la m lg un Po p Fr er er Be Re H h G et ch N ze C Source: IGD - Europanel © McBride plc 2005
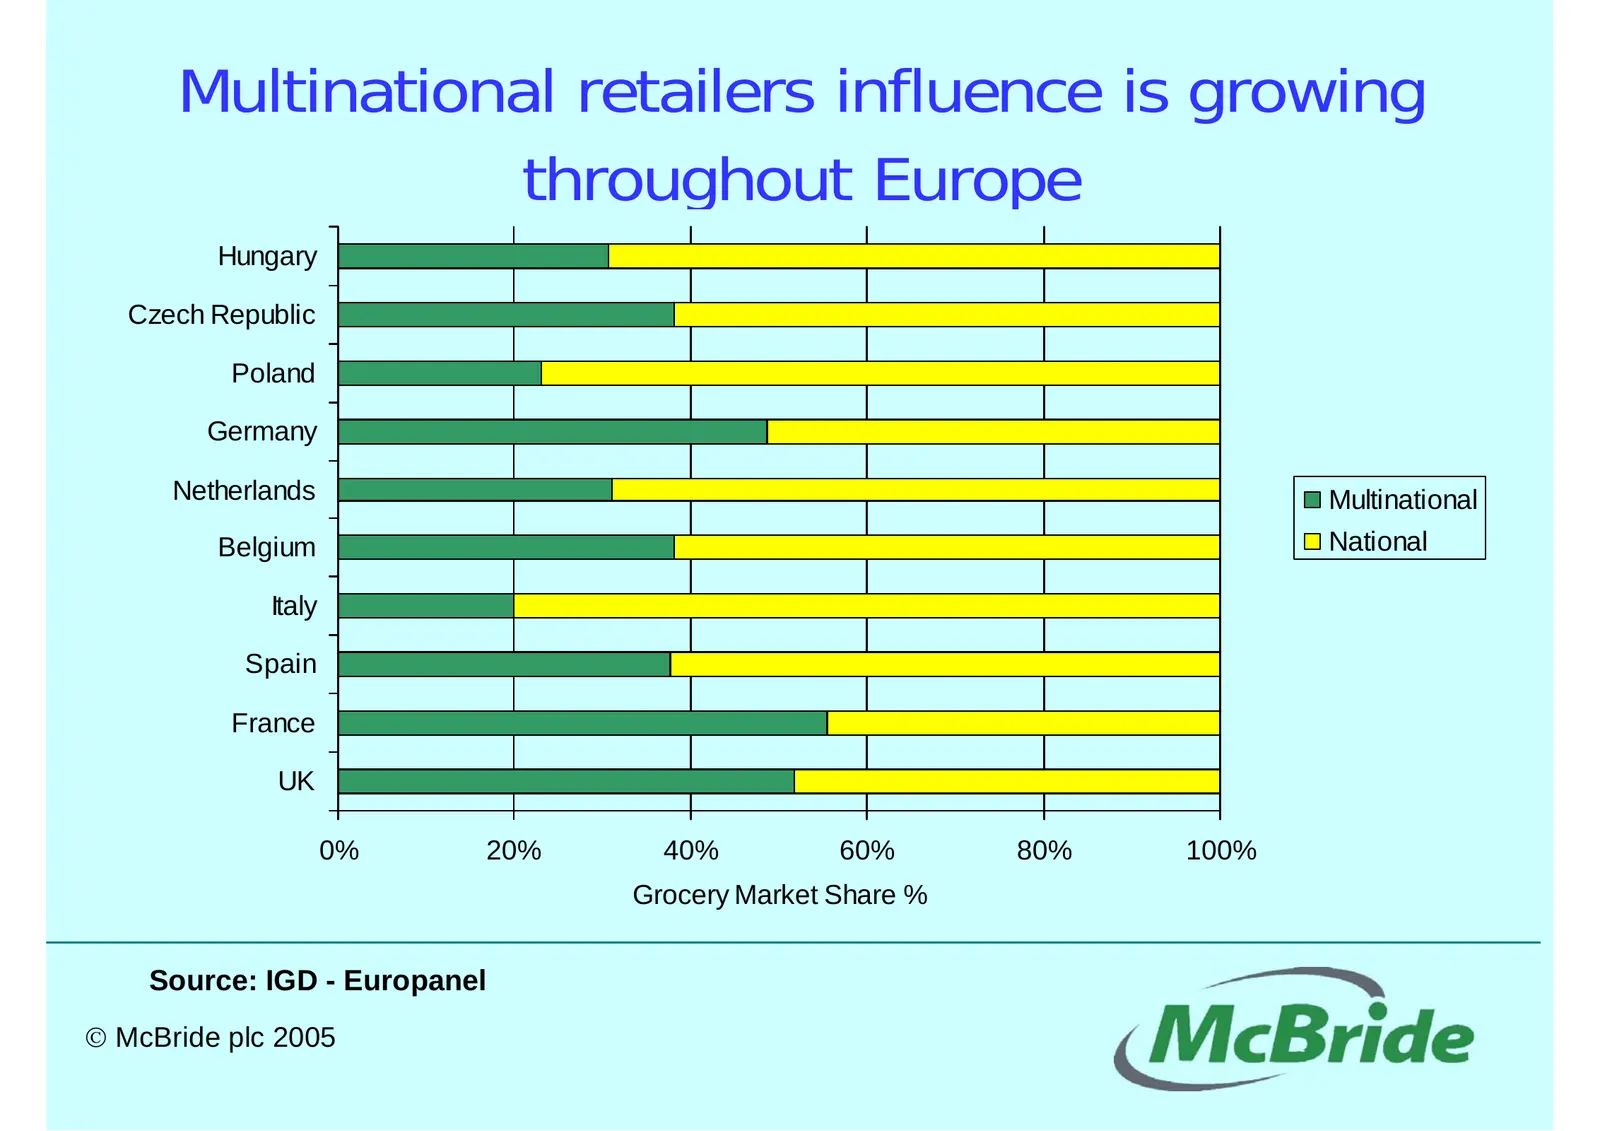
Slide 25: Multinational retailers influence is growing throughout Europe
Multinational retailers influence is growing throughout Europe Hungary Czech Republic Poland Germany Netherlands Multinational Belgium National Italy Spain France UK 0% 20% 40% 60% 80% 100% Grocery Market Share % Source: IGD - Europanel © McBride plc 2005
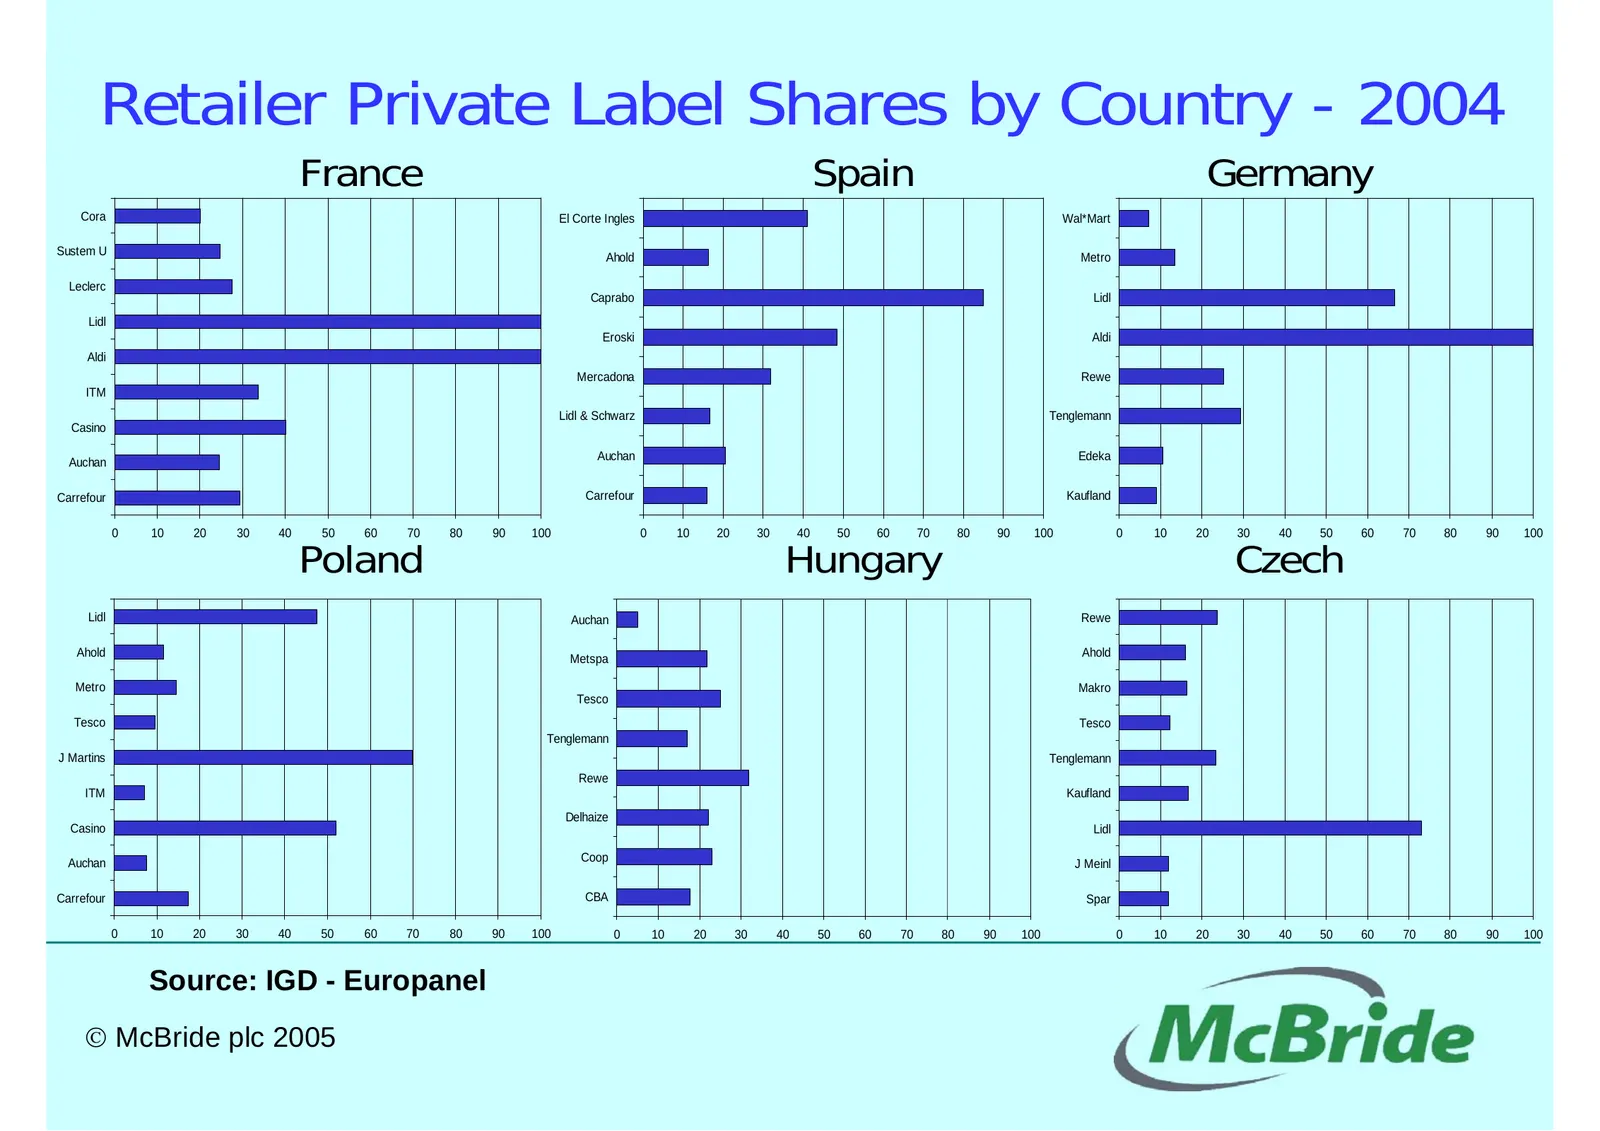
Slide 26: Retailer Private Label Shares by Country - 2004
Retailer Private Label Shares by Country - 2004 France Spain Germany Cora El Corte Ingles Wal*Mart Sustem U Ahold Metro Leclerc Caprabo Lidl Lidl Eroski Aldi Aldi Mercadona Rewe ITM Lidl & Schwarz Tenglemann Casino Auchan Edeka Auchan Carrefour Carrefour Kaufland 0 10 20 30 40 50 60 70 80 90 100 0 1
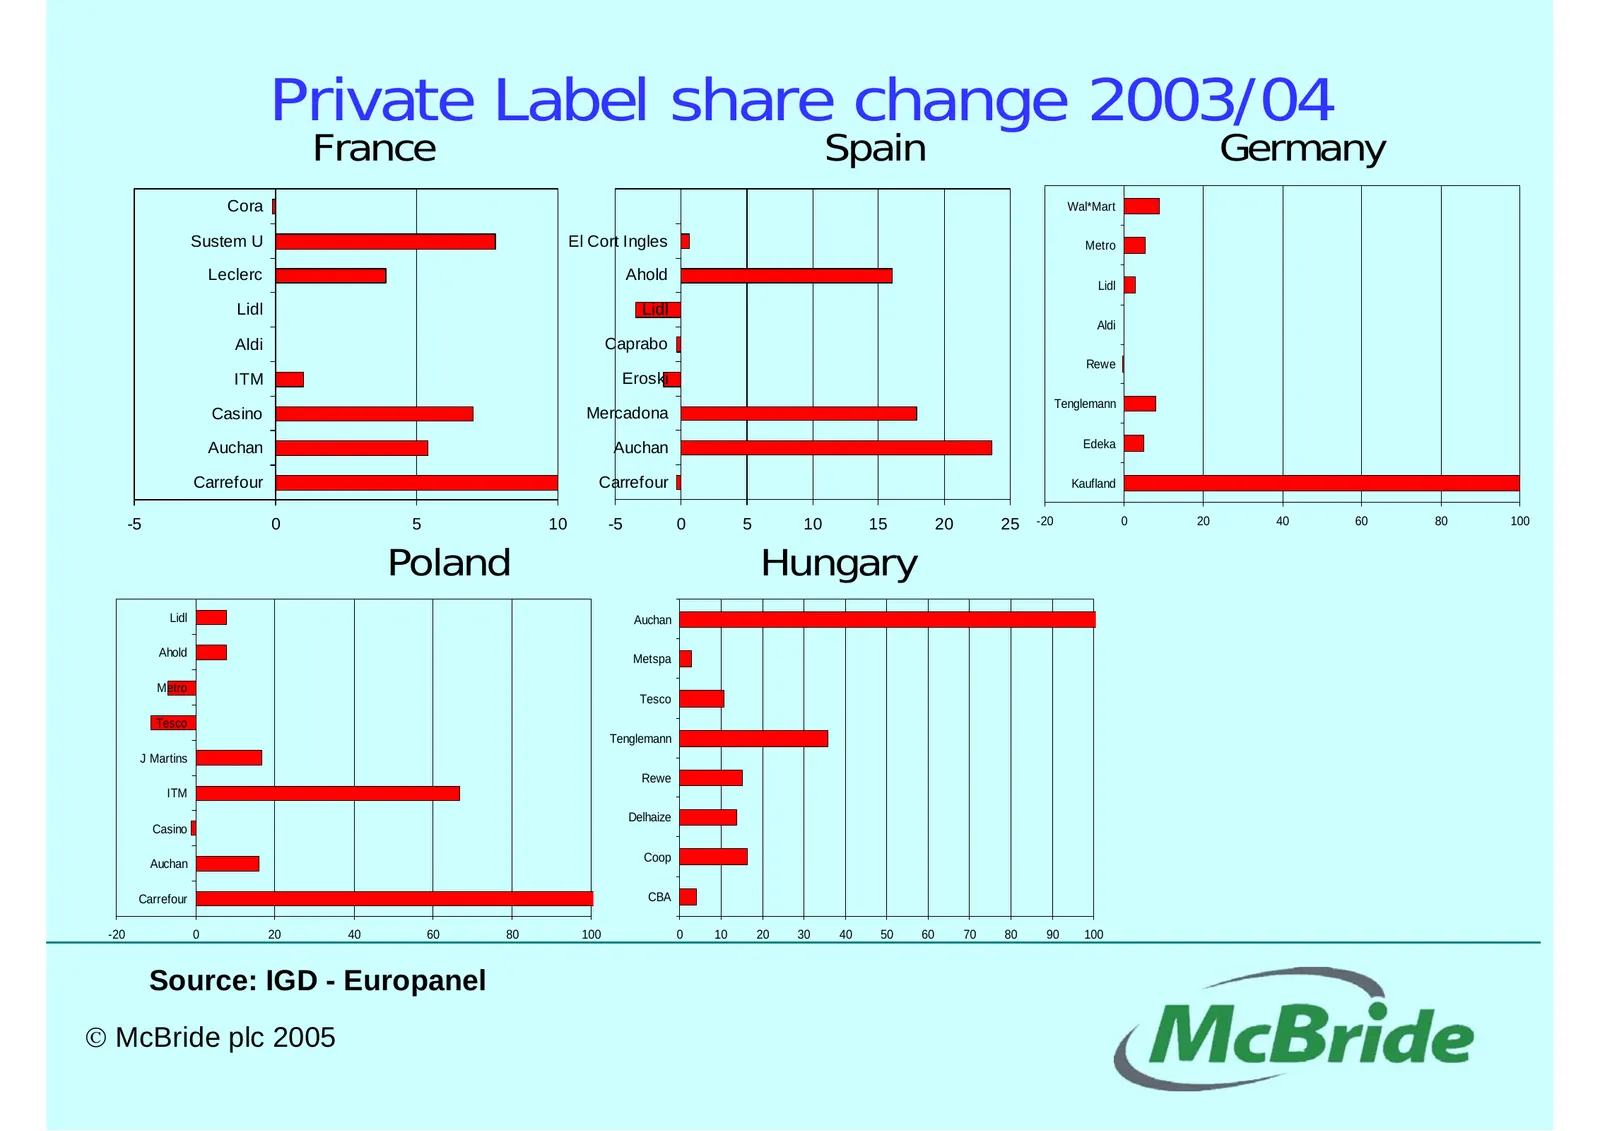
Slide 27: Private Label share change 2003/04
Private Label share change 2003/04 France Spain Germany Cora Wal*Mart Sustem U El Cort Ingles Metro Leclerc Ahold Lidl Lidl Lidl Aldi Aldi Caprabo Rewe ITM Eroski Tenglemann Casino Mercadona Auchan Auchan Edeka Carrefour Carrefour Kaufland -5 0 5 10 -5 0 5 10 15 20 25 -20 0 20 40 60 80 100 Poland Hu
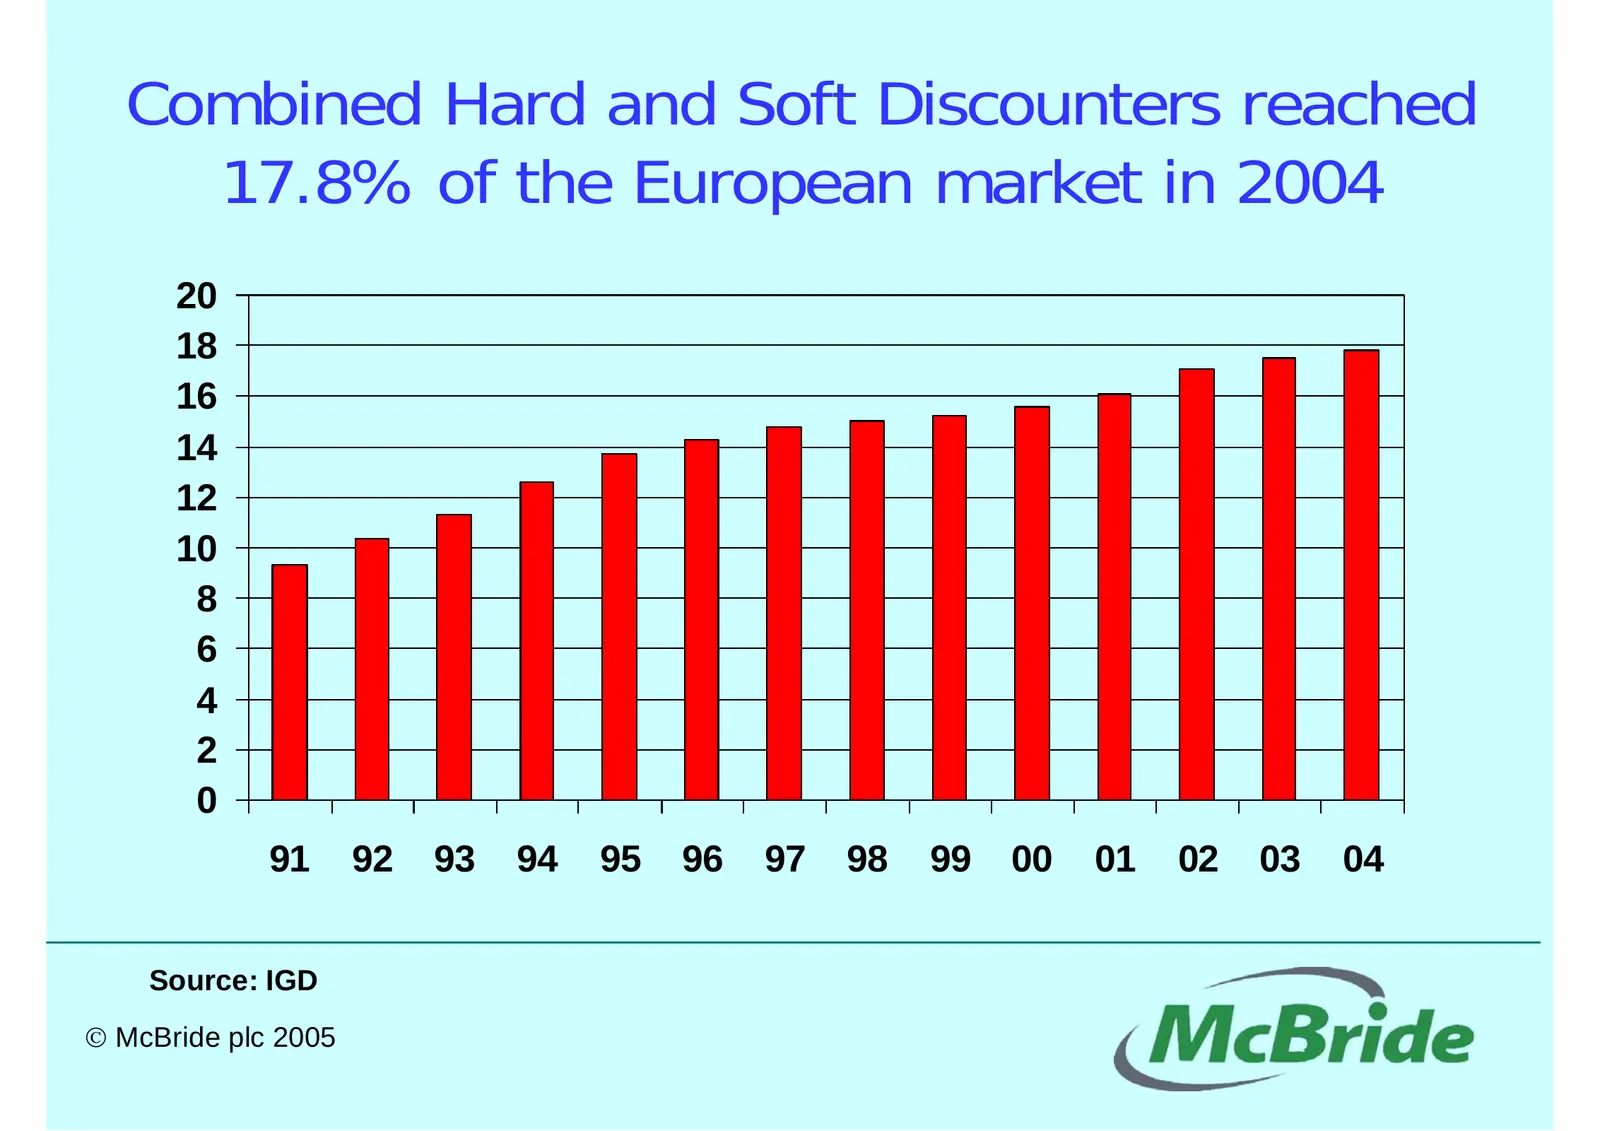
Slide 28: Combined Hard and Soft Discounters reached 17.8% of the European market in 2004
Combined Hard and Soft Discounters reached 17.8% of the European market in 2004 20 18 16 14 12 10 8 6 4 2 0 91 92 93 94 95 96 97 98 99 00 01 02 03 04 Source: IGD © McBride plc 2005
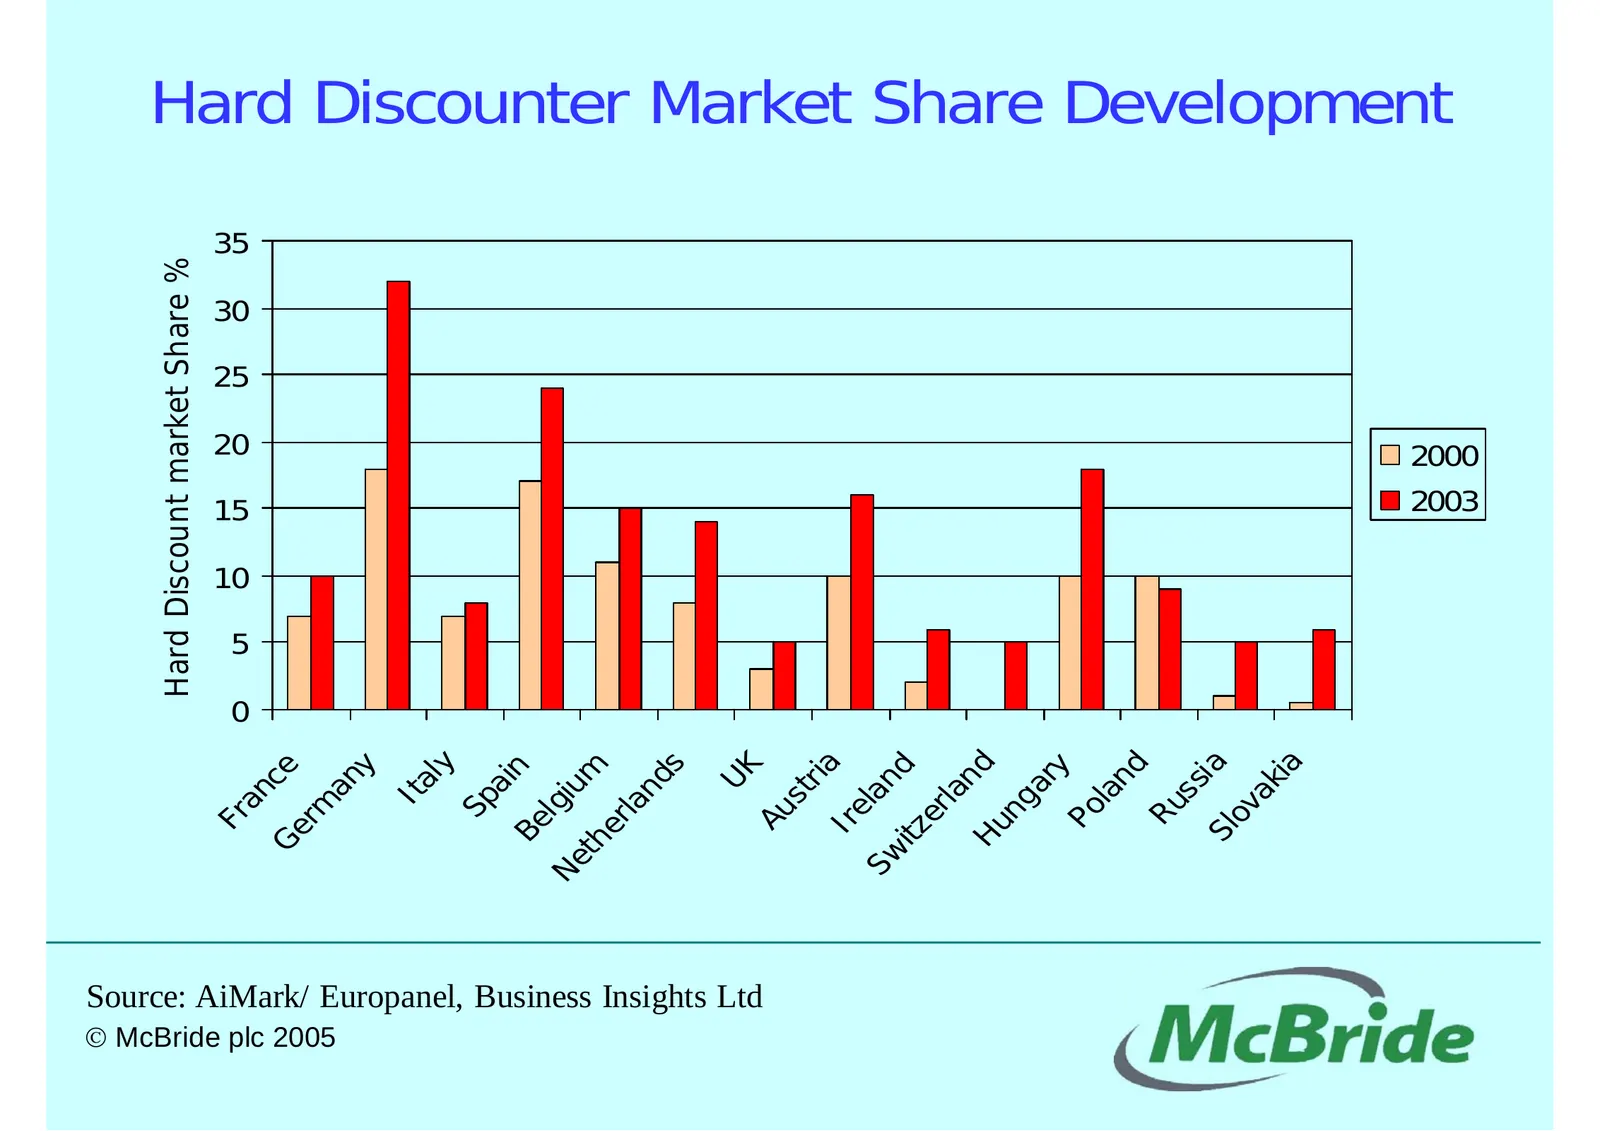
Slide 29: Hard Discount market Share %
Hard Discount market Share % 0 5 10 15 20 25 30 35 Fr an Ge c e rm © McBride plc 2005 an y Ita ly Sp ai Be n Ne lgiu th m er la nd s UK Source: AiMark/ Europanel, Business Insights Ltd Au s tri Ir a e Sw lan itz d er la n Hu d ng ar y Po la nd Ru ss Sl i a ov ak ia Hard Discounter Market Share Devel
Slide 30: Influences on Consumer Choice
Influences on Consumer Choice • Advertising Activity of Major Brands • Perceived Brand Value • Association with the category - Trust • New Product Development Activity • Packaging difference • Quality Gap © McBride plc 2005
Source: Internet Archive copy of mcbride.co.uk
More decks from McBride plc
 FY2026 Earnings Presentation28 slides · Sep 15, 2026
 H1 FY26 Earnings Presentation22 slides · Feb 26, 2026
 FY2025 Earnings Presentation23 slides · Sep 18, 2025
 H1 FY2025 Earnings Presentation30 slides · Feb 25, 2025
 FY2024 Earnings Presentation30 slides · Sep 17, 2024
 Investor Day (March 2024)65 slides · Mar 13, 2024