AMERICAN EAGLE ENERGY — Investor Presentation (March 2014)
30 slides from AMERICAN EAGLE ENERGY's investor presentation, Mar 5, 2014
Slide 1: American Eagle Energy Corp Investor Presentation March 2014
American Eagle Energy Corp (AMZG) Investor Presentation March 2014 Williston Basin (Bakken / Three Forks) Oil Focused Operator PROVEN: EXPERTISE PROVEN: RESULTS
Slide 2: Forward Looking Information
F ORWARD L OOKING I NFORMATION 2 This presentation includes forward - looking statements within the meaning of Section 27 A of the Securities Act of 1933 , as amended (the “Securities Act”), and Section 21 E of the Securities Exchange Act of 1934 , as amended (the “Exchange Act”) . All statements ot
Slide 3: Company Overview: American Eagle Summary
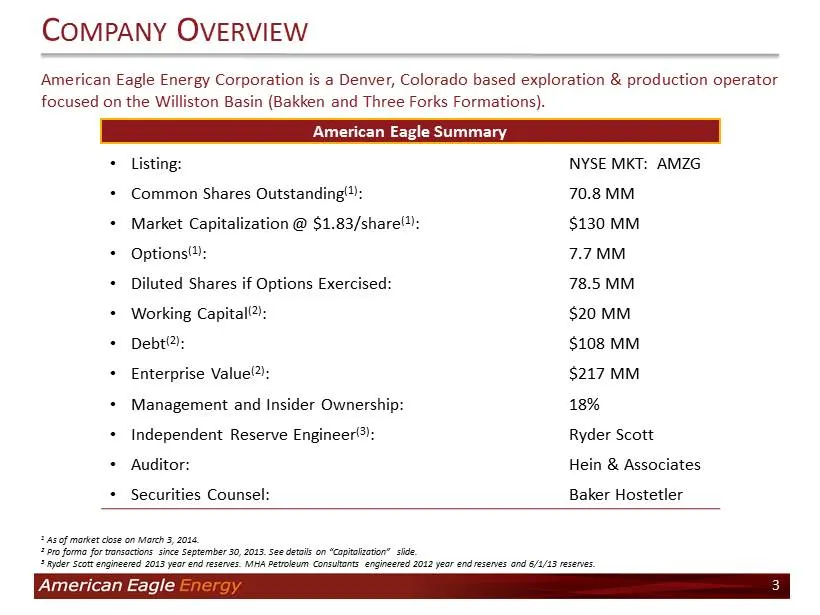
American Eagle Energy Corporation is a Denver, Colorado based exploration & production operator focused on the Williston Basin (Bakken and Three Forks Formations) . C OMPANY O VERVIEW • Listing: NYSE MKT: AMZG • Common Shares Outstanding (1) : 70.8 MM • Market Capitalization @ $1.83/share (1) : $130
Slide 4: Management team
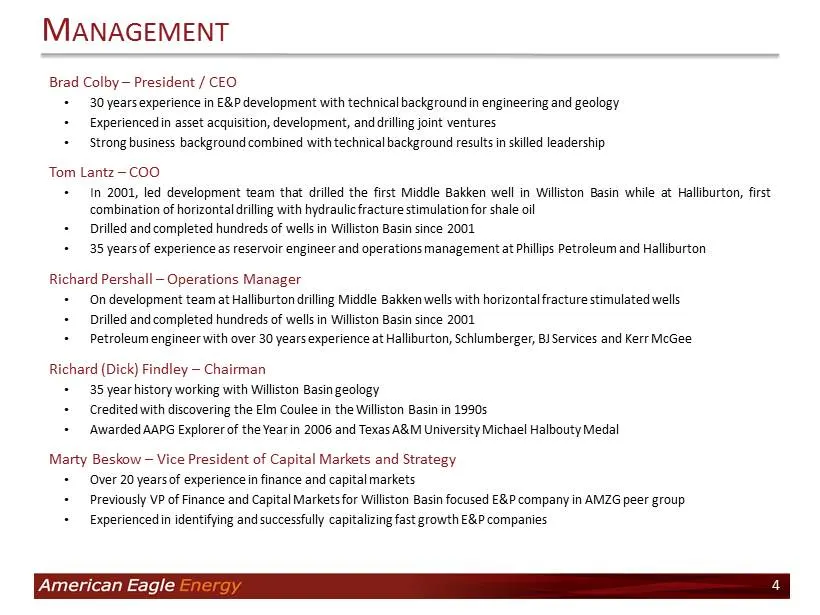
Brad Colby – President / CEO • 30 years experience in E&P development with technical background in engineering and geology • Experienced in asset acquisition, development, and drilling joint ventures • Strong business background combined with technical background results in skilled leadership Tom La
Slide 5: Investment highlights
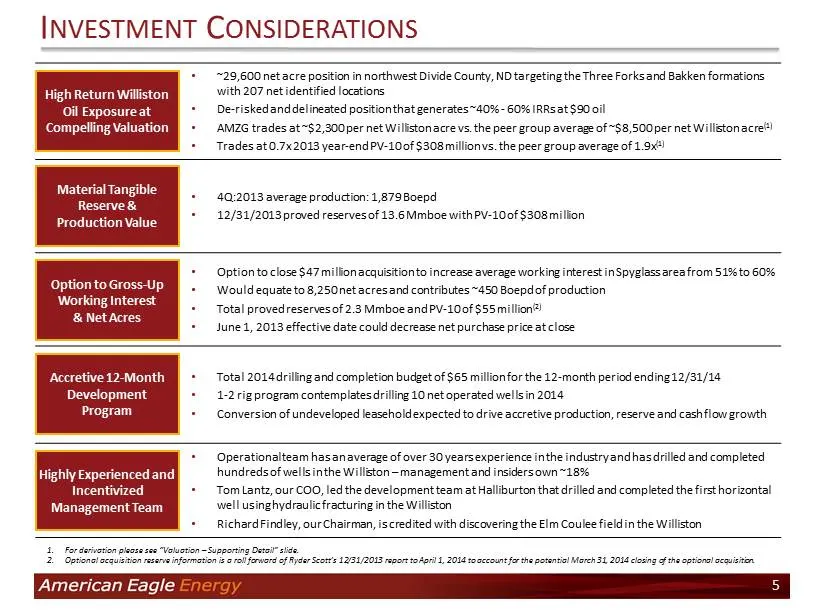
• ~29,600 net acre position in northwest Divide County, ND targeting the Three Forks and Bakken formations with 207 net identified locations • De - risked and delineated position that generates ~40% - 60% IRRs at $90 oil • AMZG trades at ~$2,300 per net Williston acre vs. the peer group average of ~
Slide 6: Company Overview
COMPANY OVERVIEW American Eagle 6
Slide 7: Reserve Growth
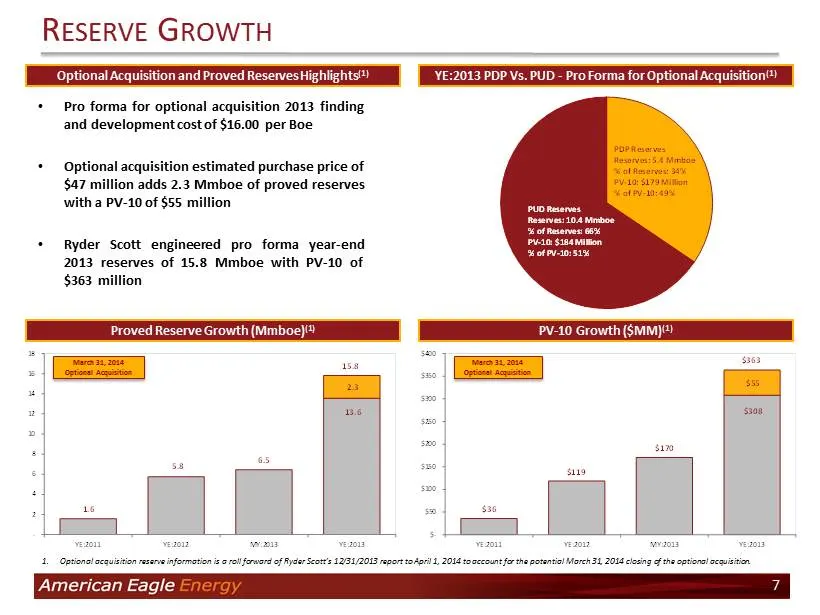
PUD Reserves Reserves: 10.4 Mmboe % of Reserves: 66% PV - 10: $184 Million % of PV - 10: 51% PDP Reserves Reserves: 5.4 Mmboe % of Reserves : 34% PV - 10: $179 Million % of PV - 10: 49% $36 $119 $170 $308 $55 $- $50 $100 $150 $200 $250 $300 $350 $400 YE:2011 YE:2012 MY:2013 YE:2013 $363 1.6 5.8 6.5
Slide 8: Spyglass Drilling Inventory
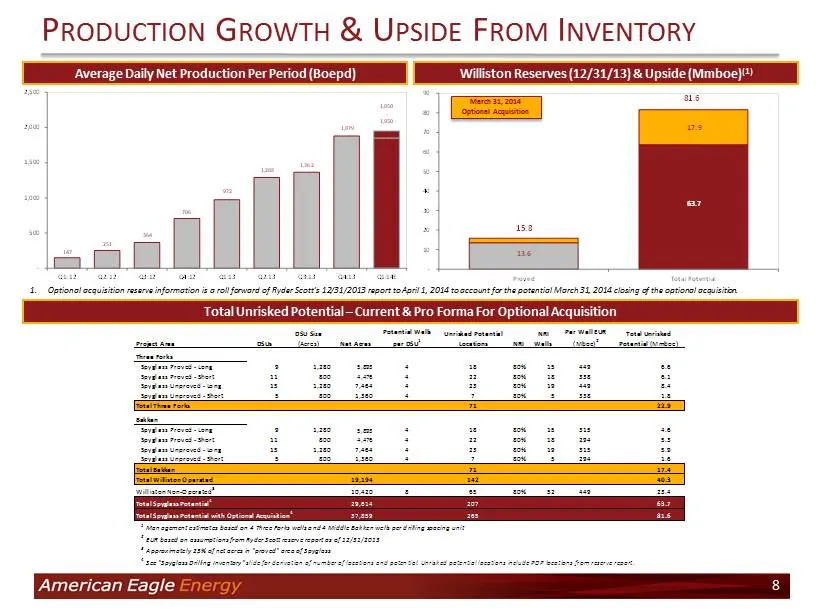
Project Area DSUs DSU Size (Acres) Net Acres Potential Wells per DSU 1 Unrisked Potential Locations NRI NRI Wells Per Well EUR (Mboe) 2 Total Unrisked Potential (Mmboe) Three Forks Spyglass Proved - Long 9 1,280 5,893 4 18 80% 15 449 6.6 Spyglass Proved - Short 11 800 4,476 4 22 80% 18 338 6.1 Spygl
Slide 9: Spyglass Project Area Overview
S PYGLASS P ROJECT A REA O VERVIEW 9
Slide 10: Williston Basin – Spyglass Operating Area vs. Core
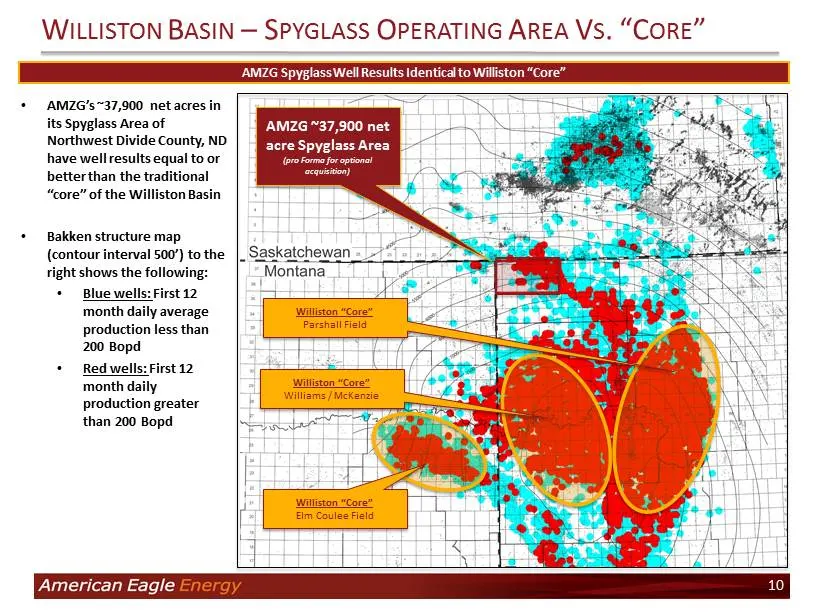
W ILLISTON B ASIN – S PYGLASS O PERATING A REA V S . “C ORE ” AMZG ~37,900 net acre Spyglass Area (pro Forma for optional acquisition) 10 AMZG Spyglass Well Results Identical to Williston “Core” Williston “Core” Elm Coulee Field Williston “Core” Williams / McKenzie Williston “Core” Parshall Field •
Slide 11: Williston Basin – Stratigraphy
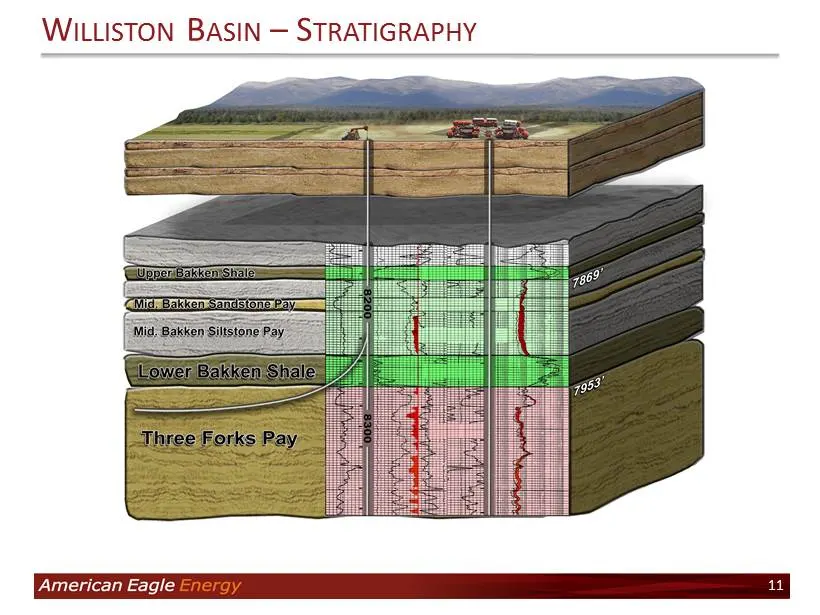
W ILLISTON B ASIN – S TRATIGRAPHY 11
Slide 12: Spyglass Three Forks Long Lateral Economics
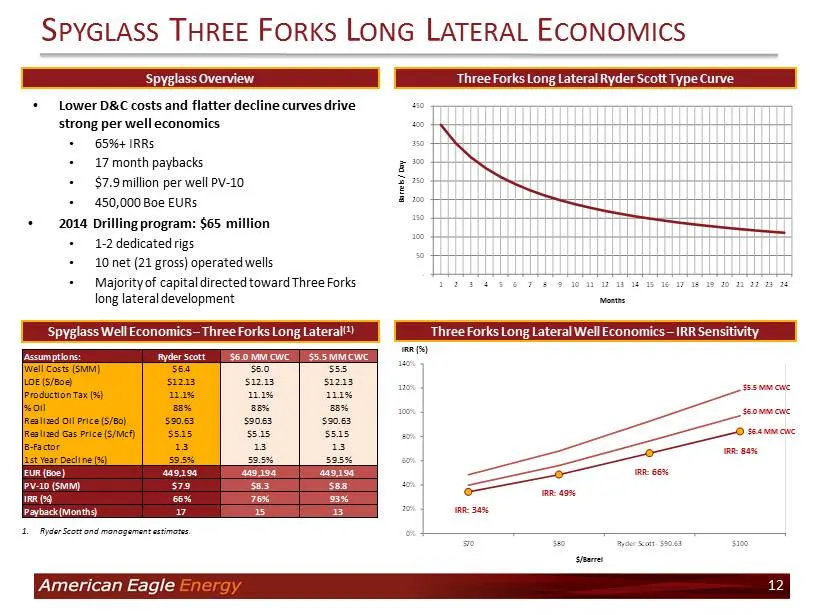
0% 20% 40% 60% 80% 100% 120% 140% $70 $80 Ryder Scott - $90.63 $100 S PYGLASS T HREE F ORKS L ONG L ATERAL E CONOMICS Spyglass Well Economics – Three Forks Long Lateral (1) Three Forks Long Lateral Well Economics – IRR Sensitivity • Lower D&C costs and flatter decline curves drive strong per well ec
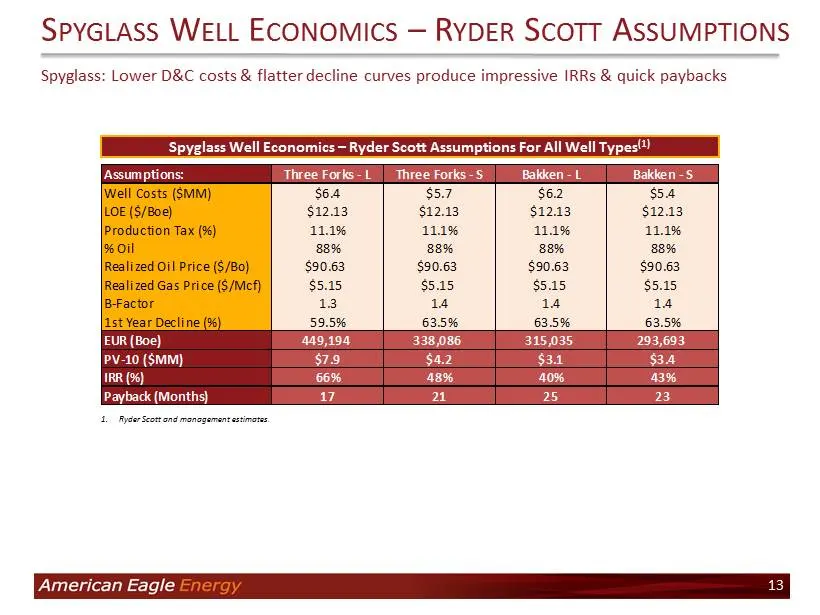
Slide 13: Spyglass Well Economics – Ryder Scott Assumptions
Spyglass: Lower D&C costs & flatter decline curves produce impressive IRRs & quick paybacks S PYGLASS W ELL E CONOMICS – R YDER S COTT A SSUMPTIONS Spyglass Well Economics – Ryder Scott Assumptions For All Well Types (1) 1. Ryder Scott and management estimates . 13 Assumptions: Three Forks - L Three
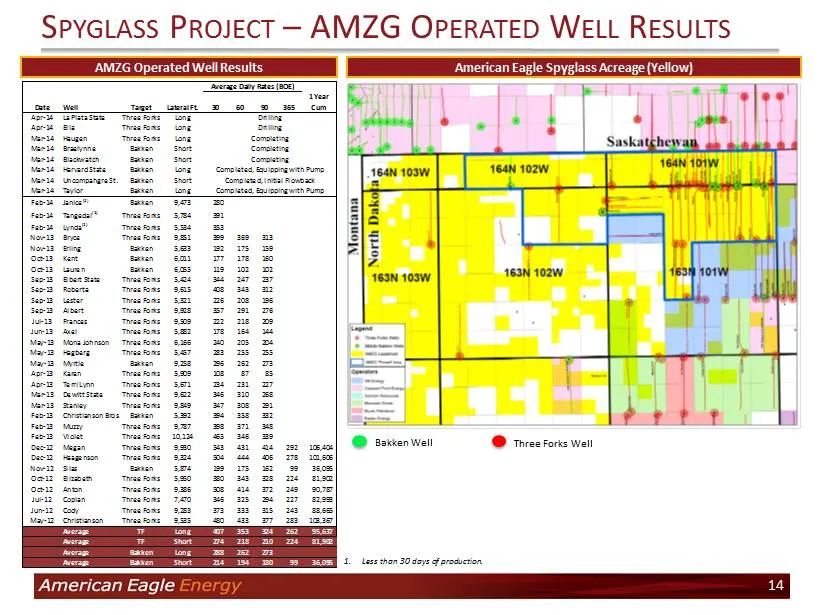
Slide 14: Spyglass Project – AMZG Operated Well Results
S PYGLASS P ROJECT – AMZG O PERATED W ELL R ESULTS Bakken Well Three Forks Well American Eagle Spyglass Acreage (Yellow) AMZG Operated Well Results 14 1. Less than 30 days of production. Date Well Target Lateral Ft. 30 60 90 365 1 Year Cum Apr-14 La Plata State Three Forks Long Apr-14 Ella Three For
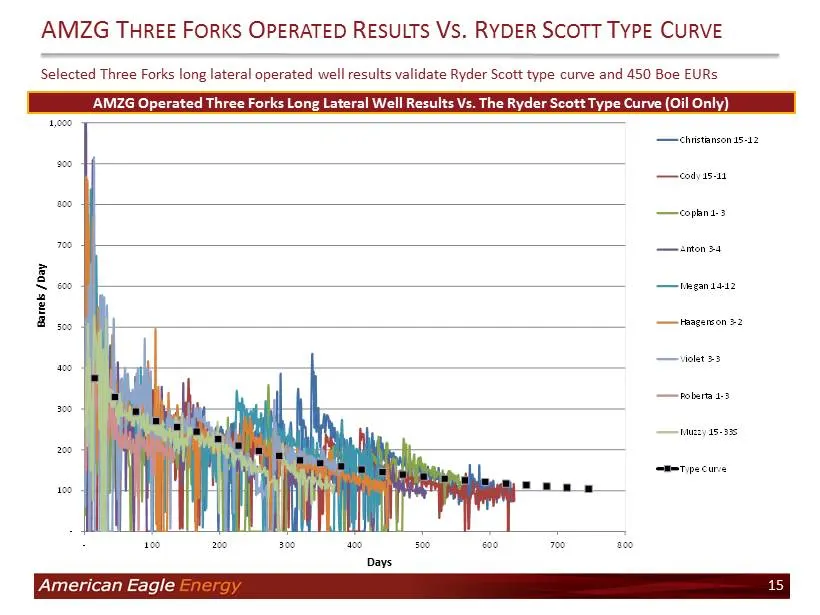
Slide 15: AMZG Three Forks Operated Results vs. Ryder Scott Type Curve
Selected Three Forks long lateral operated well results validate Ryder Scott type curve and 450 Boe EURs AMZG T HREE F ORKS O PERATED R ESULTS V S . R YDER S COTT T YPE C URVE AMZG Operated Three Forks Long Lateral Well Results Vs. The Ryder Scott Type Curve (Oil Only) 15 - 100 200 300 400 500 600 7
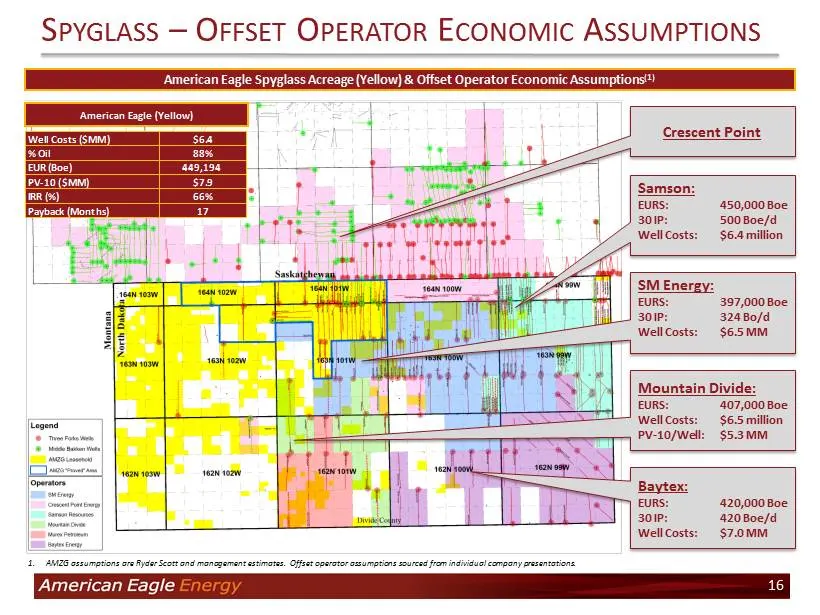
Slide 16: Spyglass – Offset Operator Economic Assumptions
S PYGLASS – O FFSET O PERATOR E CONOMIC A SSUMPTIONS American Eagle Spyglass Acreage (Yellow) & Offset Operator Economic Assumptions (1) Crescent Point SM Energy: EURS: 397,000 Boe 30 IP: 324 Bo/d Well Costs: $6.5 MM Mountain Divide: EURS: 407,000 Boe Well Costs: $6.5 million PV - 10/Well: $5.3 MM B
Slide 17: Derisked Inventory and Undeveloped Upside
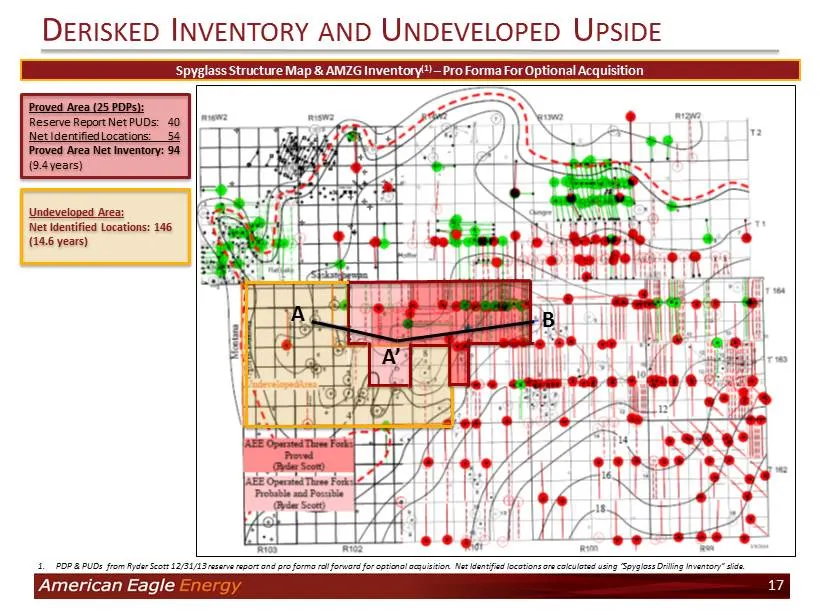
D ERISKED I NVENTORY AND U NDEVELOPED U PSIDE Spyglass Structure Map & AMZG Inventory (1) – Pro Forma For Optional Acquisition Proved Area (25 PDPs): Reserve Report Net PUDs: 40 Net Identified Locations: 54 Proved Area Net Inventory: 94 (9.4 years) Undeveloped Area: Net Identified Locations: 146 (14
Slide 18: Spyglass Cross Section – Consistent Geology
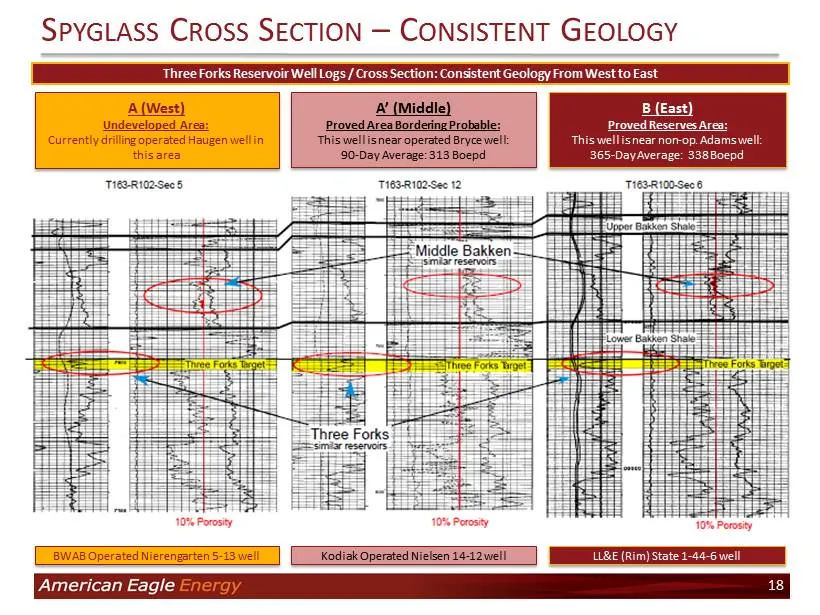
S PYGLASS C ROSS S ECTION – C ONSISTENT G EOLOGY Three Forks Reservoir Well Logs / Cross Section: Consistent Geology From West to East 18 A (West) Undeveloped Area: Currently drilling operated Haugen well in this area A’ (Middle) Proved Area Bordering Probable: This well is near operated Bryce well:
Slide 19: Financial Overview
FINANCIAL OVERVIEW American Eagle 19
Slide 20: Capitalization
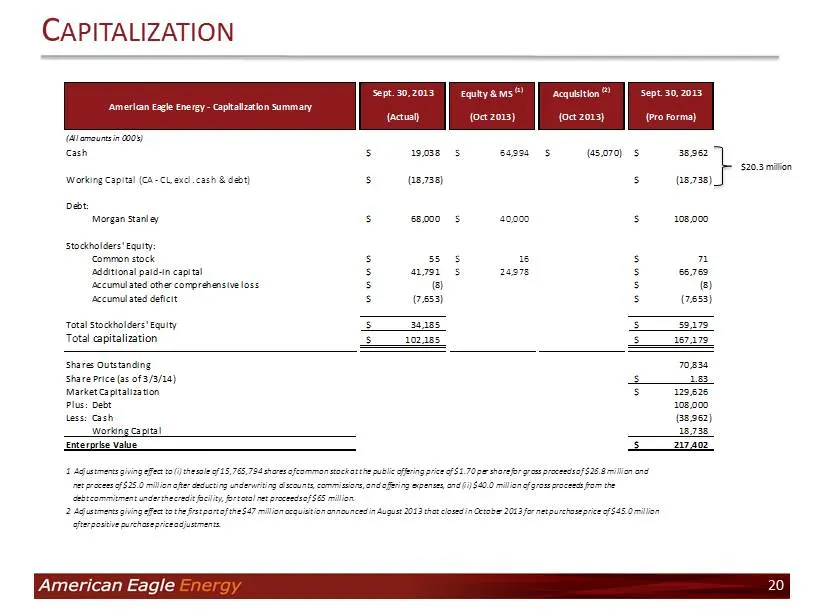
C APITALIZATION $20.3 million 20 Sept. 30, 2013 Equity & MS (1) Acquisition (2) Sept. 30, 2013 (Actual) (Oct 2013) (Oct 2013) (Pro Forma) (All amounts in 000's) Cash 19,038$ 64,994$ (45,070)$ 38,962$ Working Capital (CA - CL, excl. cash & debt) (18,738)$ (18,738)$ Debt: Morgan Stanley 68,000$ 40,000
Slide 21: Guidance – CapEx and Production
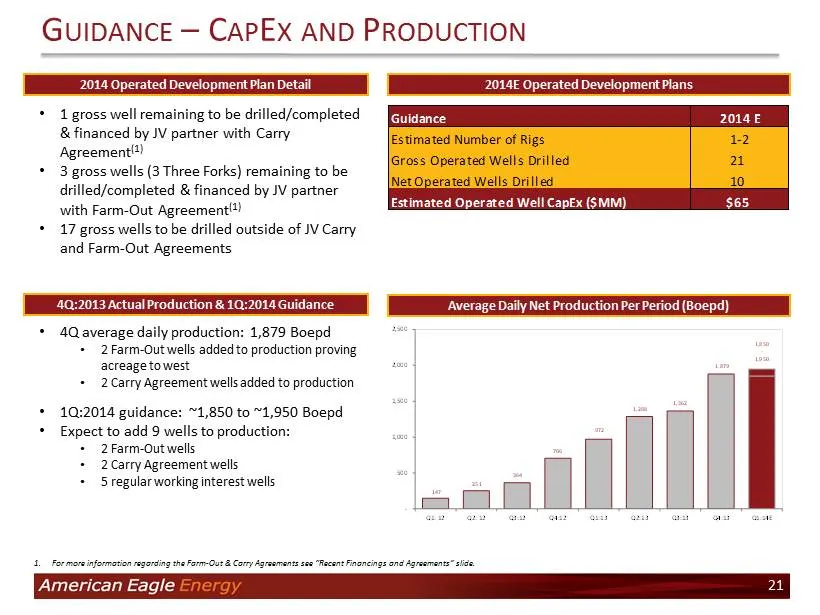
147 251 364 706 972 1,288 1,362 1,879 1,850 - 1,950 - 500 1,000 1,500 2,000 2,500 Q1: 12 Q2: 12 Q3:12 Q4:12 Q1:13 Q2:13 Q3:13 Q4:13 Q1:14E • 1 gross well remaining to be drilled/completed & financed by JV partner with Carry Agreement (1) • 3 gross wells (3 Three Forks) remaining to be drilled/comple
Slide 22: Valuation vs. Bakken Operating Comps
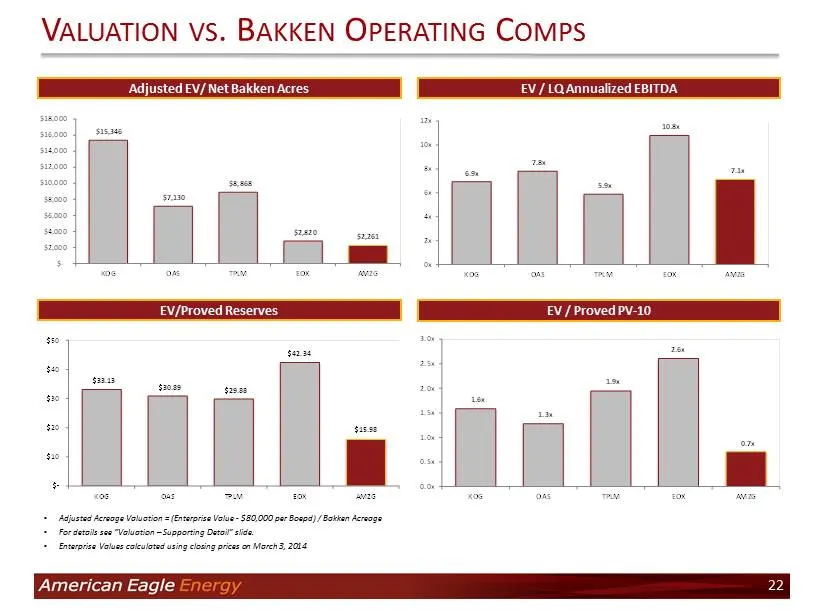
V ALUATION VS . B AKKEN O PERATING C OMPS • Adjusted Acreage Valuation = (Enterprise Value - $80,000 per Boepd ) / Bakken Acreage • For details see “Valuation – Supporting Detail” slide. • Enterprise Values calculated using closing prices on March 3, 2014 Adjusted EV/ Net Bakken Acres EV/Proved Rese
Slide 23: Investment highlights summary
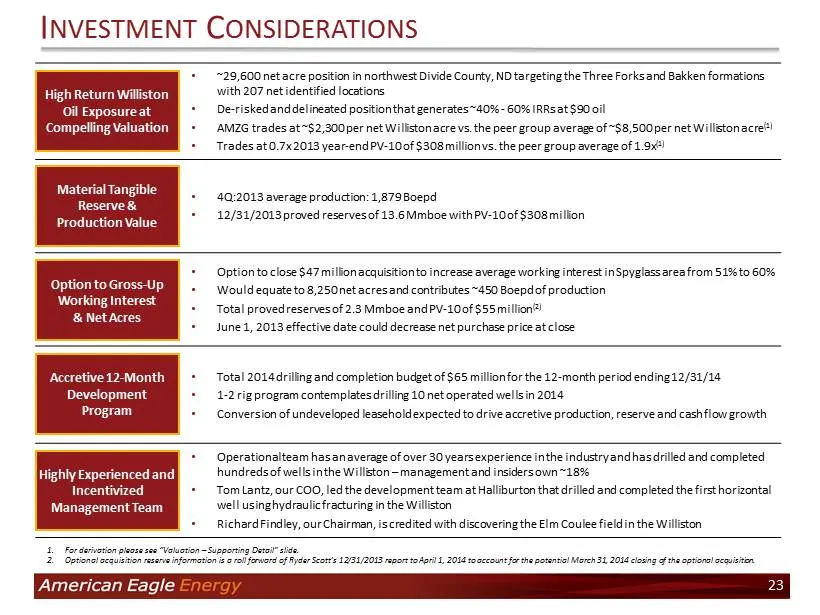
• ~29,600 net acre position in northwest Divide County, ND targeting the Three Forks and Bakken formations with 207 net identified locations • De - risked and delineated position that generates ~40% - 60% IRRs at $90 oil • AMZG trades at ~$2,300 per net Williston acre vs. the peer group average of ~
Slide 24: Contact Information
Marty Beskow, CFA Vice President of Capital Markets & Strategy American Eagle Energy Corporation 2549 West Main Street, Suite 202 Littleton, CO 80120 720 - 330 - 8378 martybeskow@amzgcorp.com C ONTACT I NFORMATION 24
Slide 25: Appendix
APPENDIX American Eagle 25
Slide 26: Hedging Summary & Philosophy
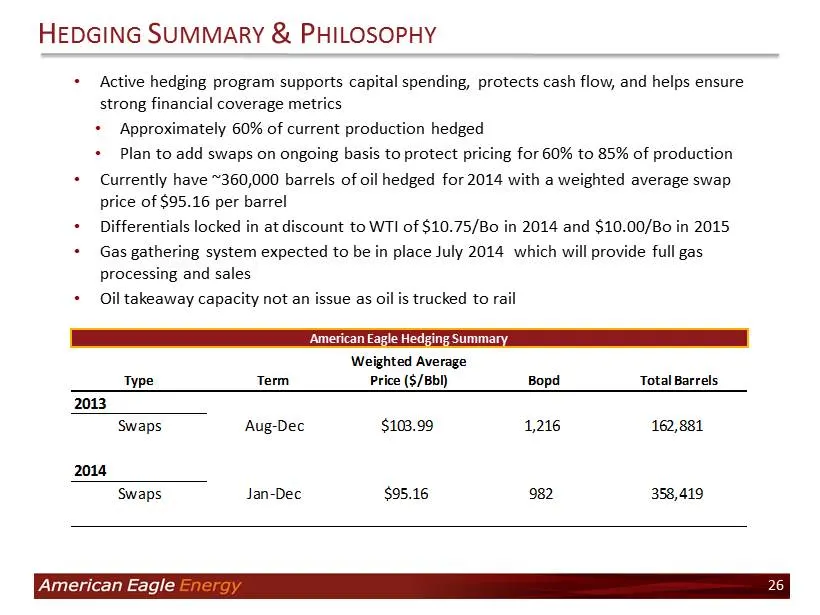
H EDGING S UMMARY & P HILOSOPHY • Active hedging program supports capital spending, protects cash flow, and helps ensure strong financial coverage metrics • Approximately 60% of current production hedged • Plan to add swaps on ongoing basis to protect pricing for 60% to 85% of production • Currently
Slide 27: Spyglass Drilling Inventory
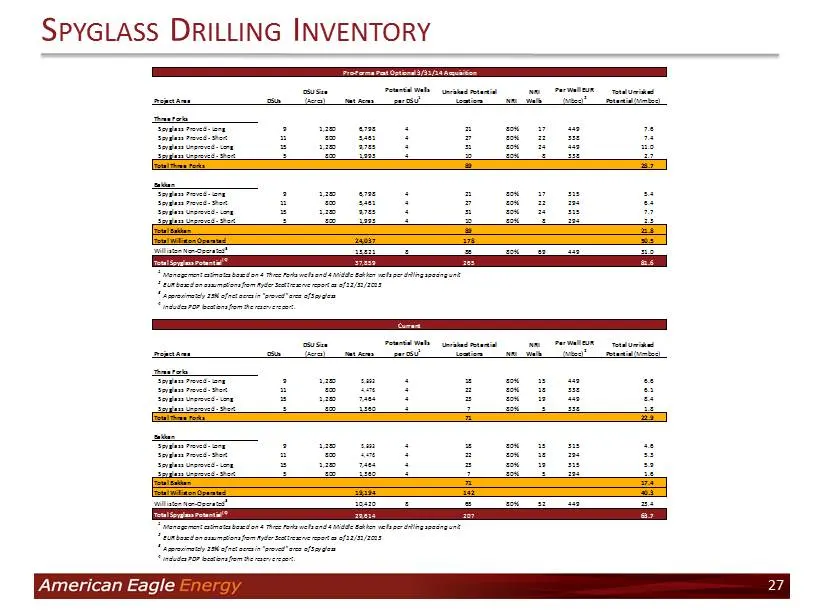
S PYGLASS D RILLING I NVENTORY 27 Project Area DSUs DSU Size (Acres) Net Acres Potential Wells per DSU 1 Unrisked Potential Locations NRI NRI Wells Per Well EUR (Mboe) 2 Total Unrisked Potential (Mmboe) Three Forks Spyglass Proved - Long 9 1,280 6,798 4 21 80% 17 449 7.6 Spyglass Proved - Short 11 8
Slide 28: Williston Basin – Acreage
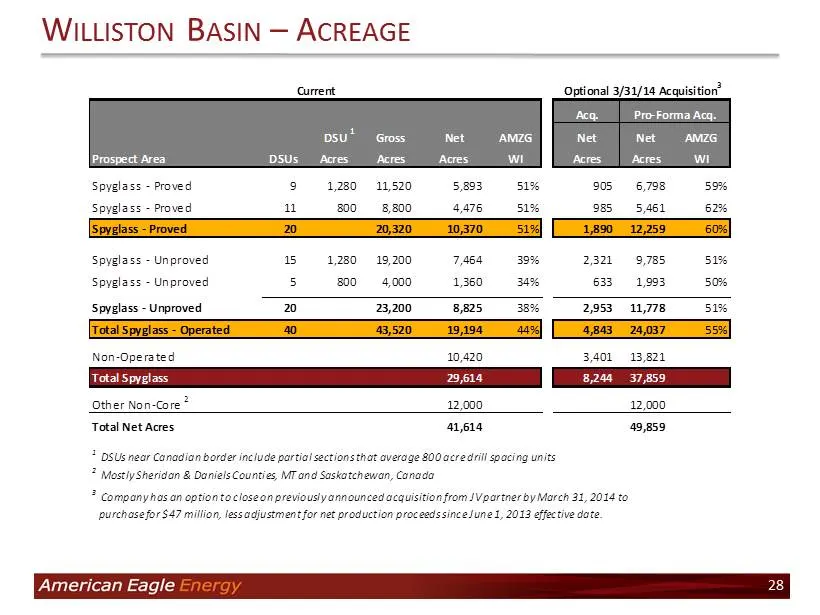
W ILLISTON B ASIN – A CREAGE 28 Acq. DSU 1 Gross Net AMZG Net Net AMZG Prospect Area DSUs Acres Acres Acres WI Acres Acres WI Spyglass - Proved 9 1,280 11,520 5,893 51% 905 6,798 59% Spyglass - Proved 11 800 8,800 4,476 51% 985 5,461 62% Spyglass - Proved 20 20,320 10,370 51% 1,890 12,259 60% Spygla
Slide 29: Valuation – Supporting Detail
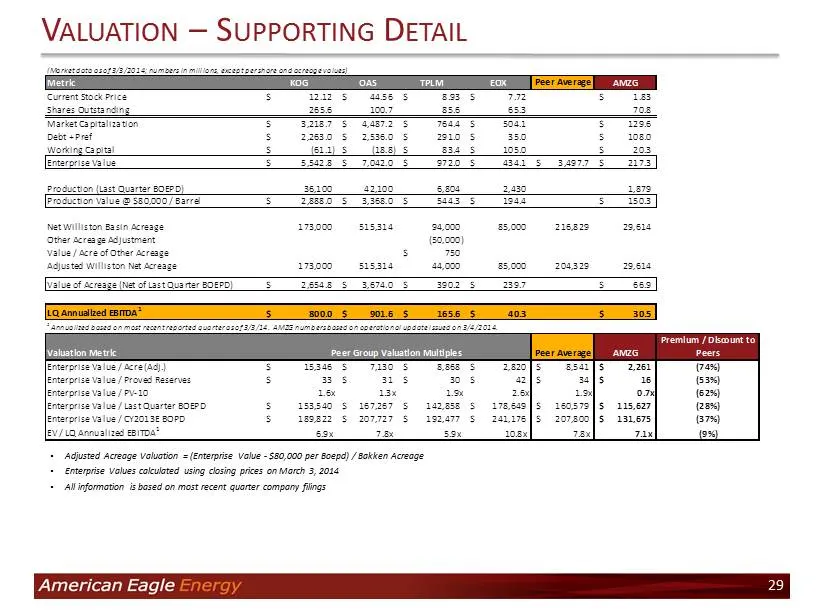
V ALUATION – S UPPORTING D ETAIL • Adjusted Acreage Valuation = (Enterprise Value - $80,000 per Boepd ) / Bakken Acreage • Enterprise Values calculated using closing prices on March 3, 2014 • All information is based on most recent quarter company filings 29 (Market data as of 3/3/2014; numbers in m
Slide 30: Recent financings and JV agreements
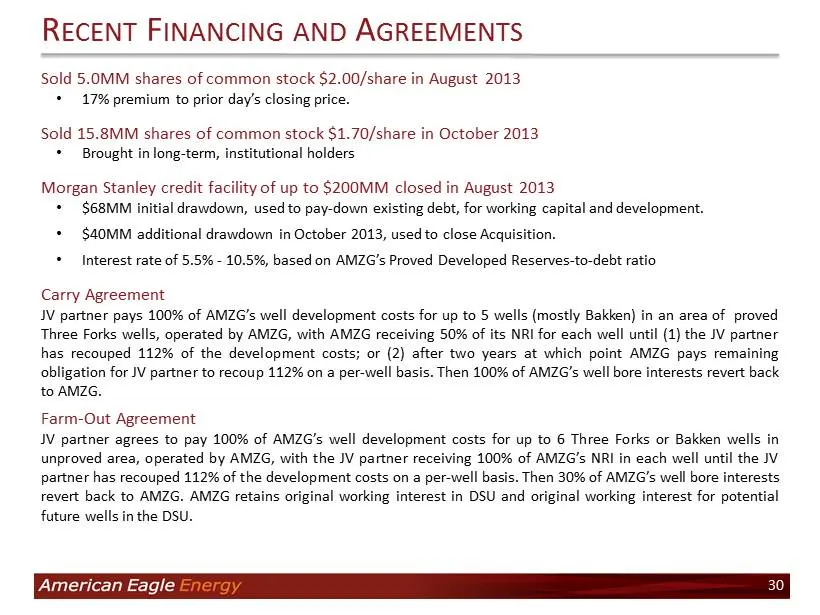
Sold 5 . 0 MM shares of common stock $ 2 . 00 /share in August 2013 • 17 % premium to prior day’s closing price . Sold 15 . 8 MM shares of common stock $ 1 . 70 /share in October 2013 • Brought in long - term, institutional holders Morgan Stanley credit facility of up to $ 200 MM closed in August 20
Source: SEC EDGAR · 8-K filed Mar 5, 2014