AMERICAN EAGLE ENERGY — Investor Presentation (October 2013)
22 slides from AMERICAN EAGLE ENERGY's investor presentation, Oct 16, 2013
Slide 1: American Eagle Energy Corp Investor Presentation October 2013
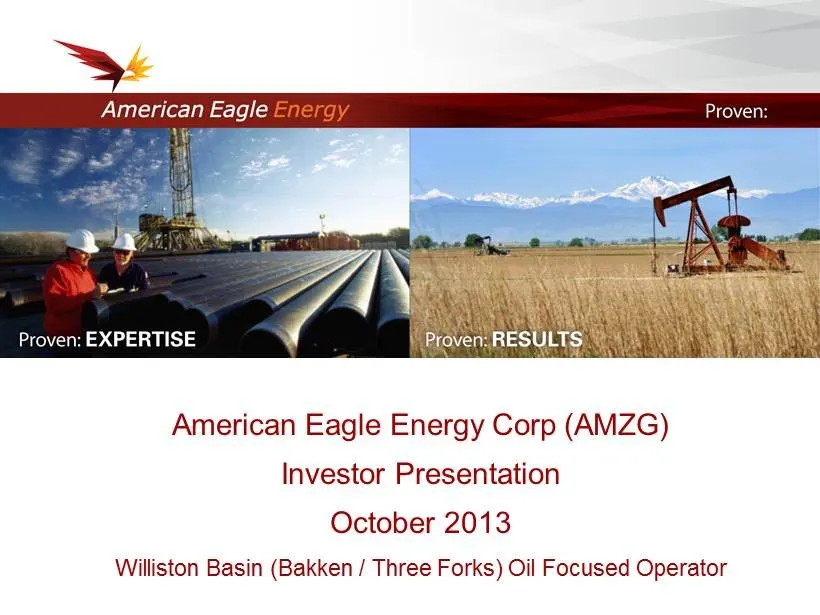
American Eagle Energy Corp (AMZG) Investor Presentation October 2013 Williston Basin (Bakken / Three Forks) Oil Focused Operator
Slide 2: Forward Looking Information
F ORWARD L OOKING I NFORMATION 2 This presentation includes forward - looking statements within the meaning of Section 27 A of the Securities Act of 1933 , as amended (the “Securities Act”), and Section 21 E of the Securities Exchange Act of 1934 , as amended (the “Exchange Act”) . All statements ot
Slide 3: American Eagle Energy Corporation: Proven expertise, results and growth
A MERICAN E AGLE E NERGY C ORPORATION Proven expertise • Operating & technical team drilled the first Middle Bakken well in the Williston Basin in 2001 and has since drilled hundreds of wells in the Basin • Management was on the Halliburton team that originally developed horizontal drilling combined
Slide 4: Company Overview
American Eagle Energy Corporation is an exploration & production operator focused on the Williston Basin (Bakken and Three Forks Formations), based in Denver, Colorado . 4 C OMPANY O VERVIEW • Listing: OTCQX : AMZG • Common Shares Outstanding 1 : 70.8 MM • Market Capitalization @ $2.11/share 1 : $14
Slide 5: Management team
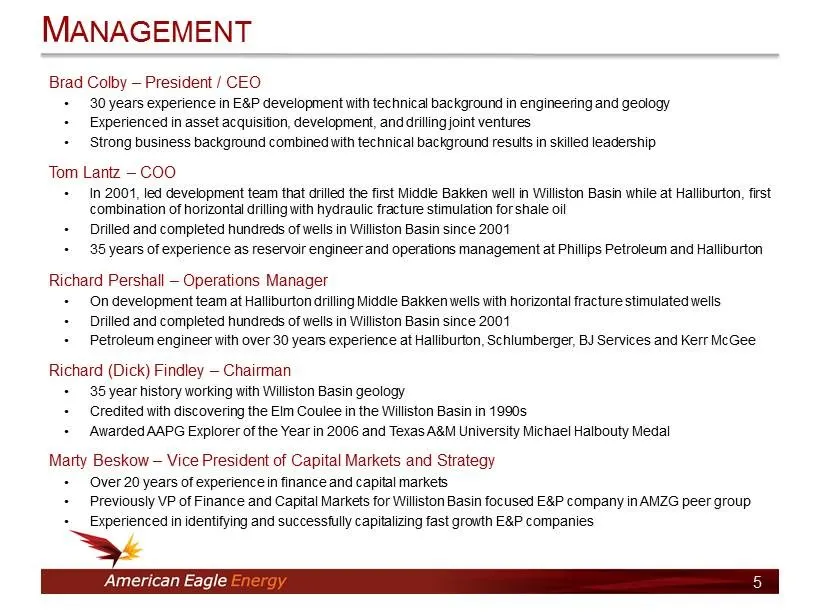
Brad Colby – President / CEO • 30 years experience in E&P development with technical background in engineering and geology • Experienced in asset acquisition, development, and drilling joint ventures • Strong business background combined with technical background results in skilled leadership Tom La
Slide 6: Williston Basin – Spyglass Operating Area
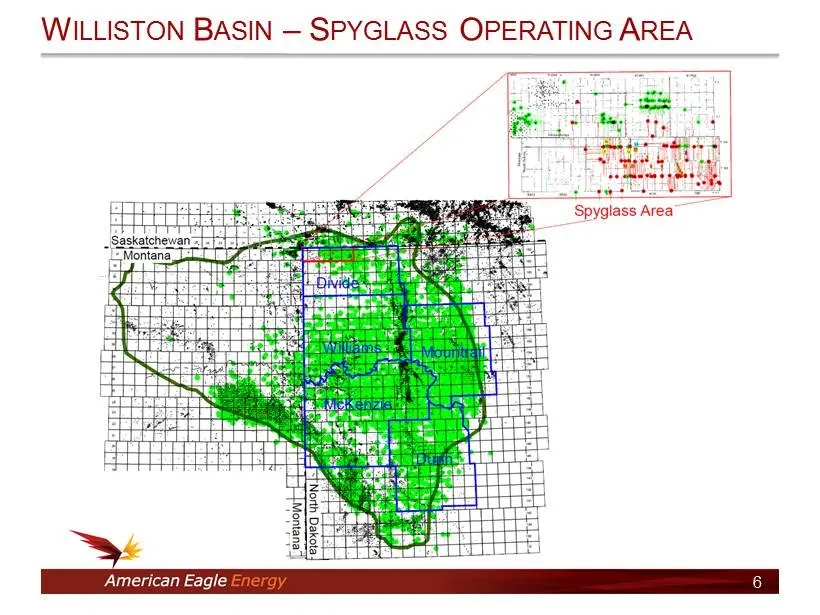
W ILLISTON B ASIN – S PYGLASS O PERATING A REA 6
Slide 7: Production & Reserves
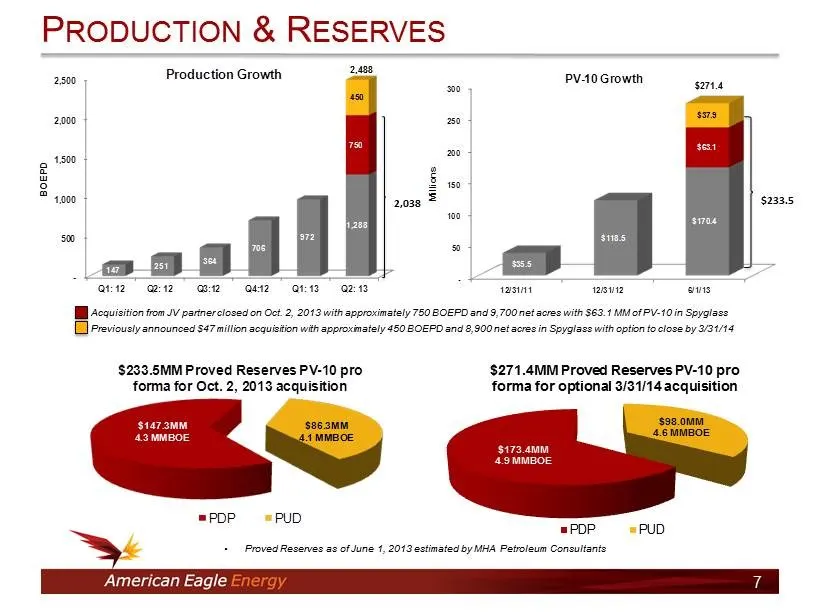
P RODUCTION & R ESERVES 7 Acquisition from JV partner closed on Oct. 2, 2013 with approximately 750 BOEPD and 9,700 net acres with $63.1 MM of PV - 10 in Sp yglass Previously announced $47 million acquisition with approximately 450 BOEPD and 8,900 net acres in Spyglass with option to clos e b y 3/31
Slide 8: Williston Basin – Stratigraphy
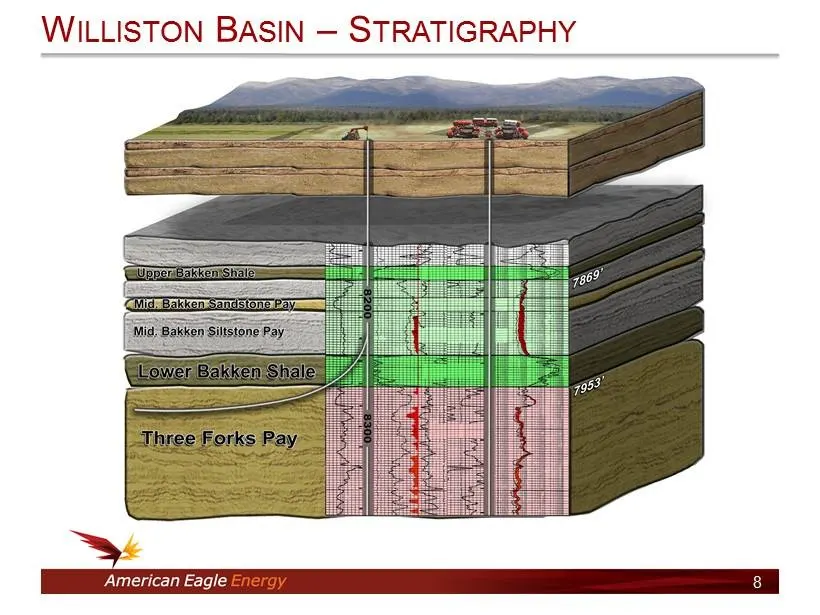
8 W ILLISTON B ASIN – S TRATIGRAPHY
Slide 9: Well Economics – Spyglass vs Typical Williston Basin
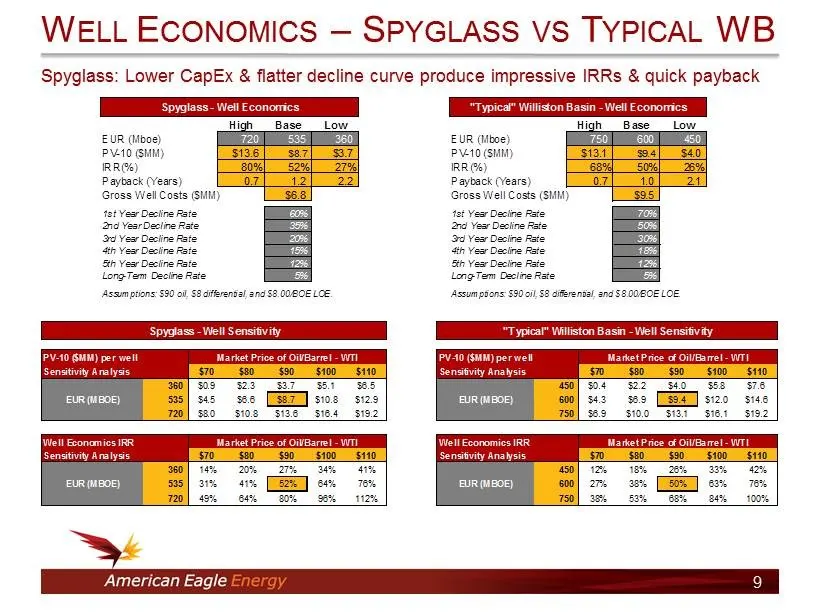
Spyglass: Lower CapEx & flatter decline curve produce impressive IRRs & quick payback W ELL E CONOMICS – S PYGLASS VS T YPICAL WB 9 High Base Low EUR (Mboe) 720 535 360 PV-10 ($MM) $13.6 $8.7 $3.7 IRR(%) 80% 52% 27% Payback (Years) 0.7 1.2 2.2 Gross Well Costs ($MM) $6.8 1st Year Decline Rate 60% 2n
Slide 10: Spyglass – 1st Three Forks Well
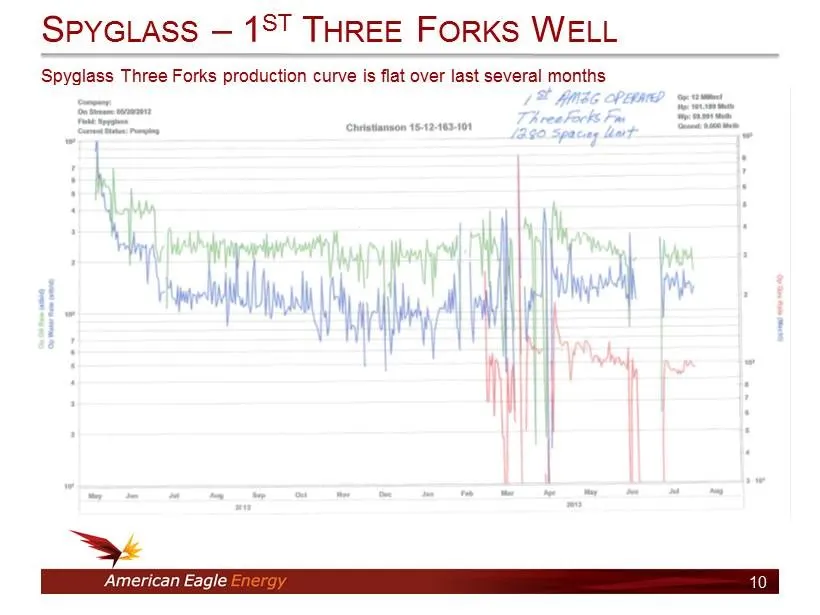
Spyglass Three Forks production curve is flat over last several months S PYGLASS – 1 ST T HREE F ORKS W ELL 10
Slide 11: Spyglass – Middle Bakken Well
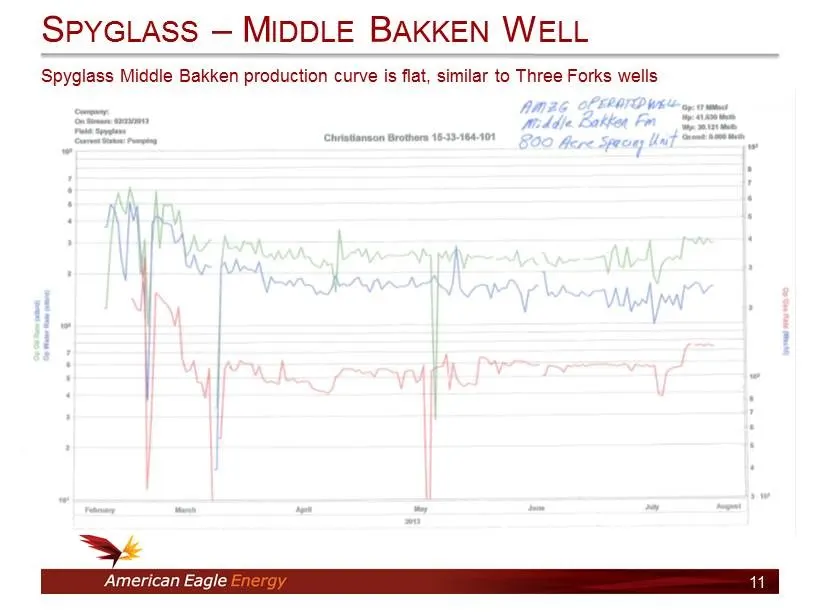
Spyglass Middle Bakken production curve is flat, similar to Three Forks wells S PYGLASS – M IDDLE B AKKEN W ELL 11
Slide 12: Williston Basin – Acreage
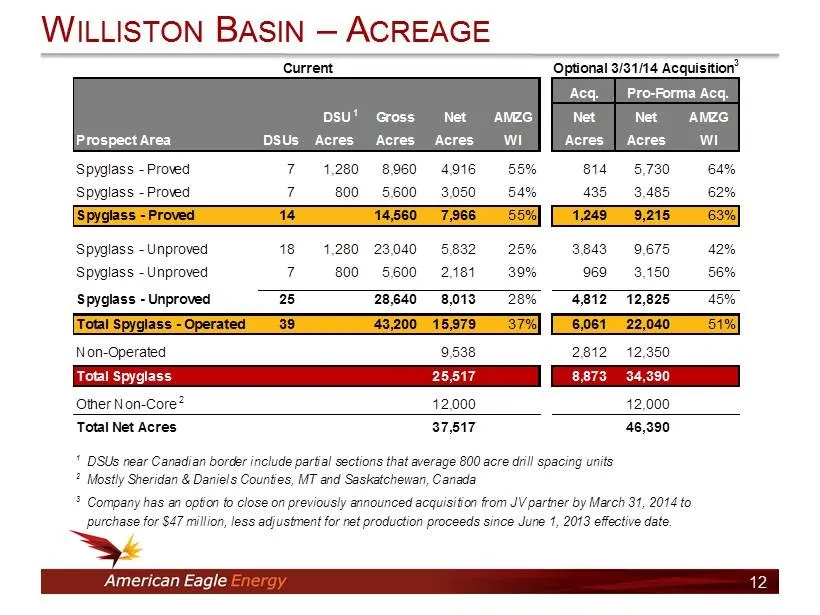
W ILLISTON B ASIN – A CREAGE 12 Acq. DSU 1 Gross Net AMZG Net Net AMZG Prospect Area DSUs Acres Acres Acres WI Acres Acres WI Spyglass - Proved 7 1,280 8,960 4,916 55% 814 5,730 64% Spyglass - Proved 7 800 5,600 3,050 54% 435 3,485 62% Spyglass - Proved 14 14,560 7,966 55% 1,249 9,215 63% Spyglass -
Slide 13: Spyglass Project – Producing Wells
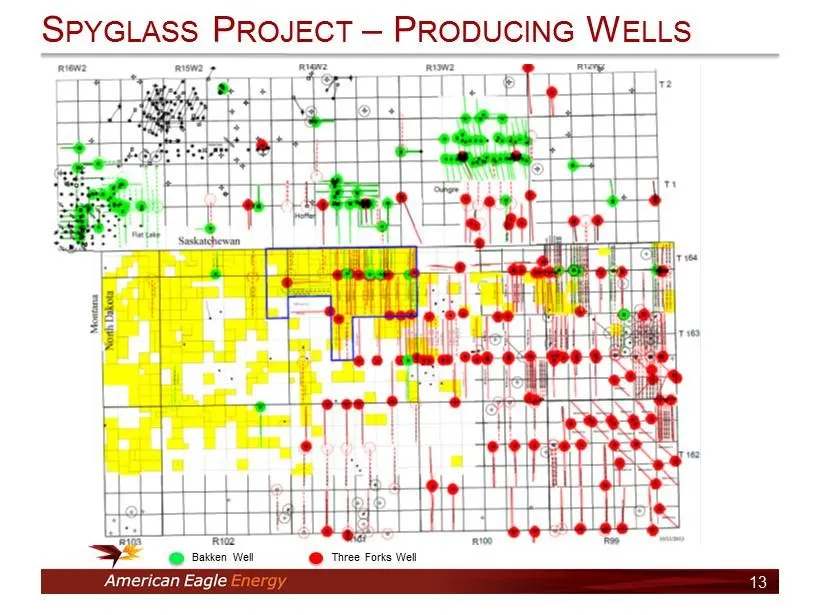
S PYGLASS P ROJECT – P RODUCING W ELLS 13 Bakken Well Three Forks Well
Slide 14: Spyglass Drilling Inventory
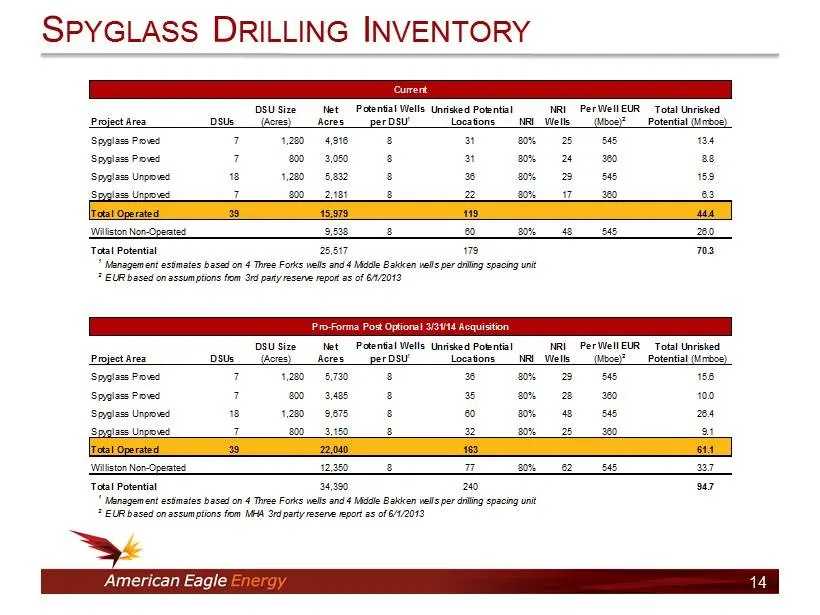
S PYGLASS D RILLING I NVENTORY 14 Project Area DSUs DSU Size (Acres) Net Acres Potential Wells per DSU 1 Unrisked Potential Locations NRI NRI Wells Per Well EUR (Mboe) 2 Total Unrisked Potential (Mmboe) Spyglass Proved 7 1,280 4,916 8 31 80% 25 545 13.4 Spyglass Proved 7 800 3,050 8 31 80% 24 360 8.
Slide 15: Guidance – CapEx and Production
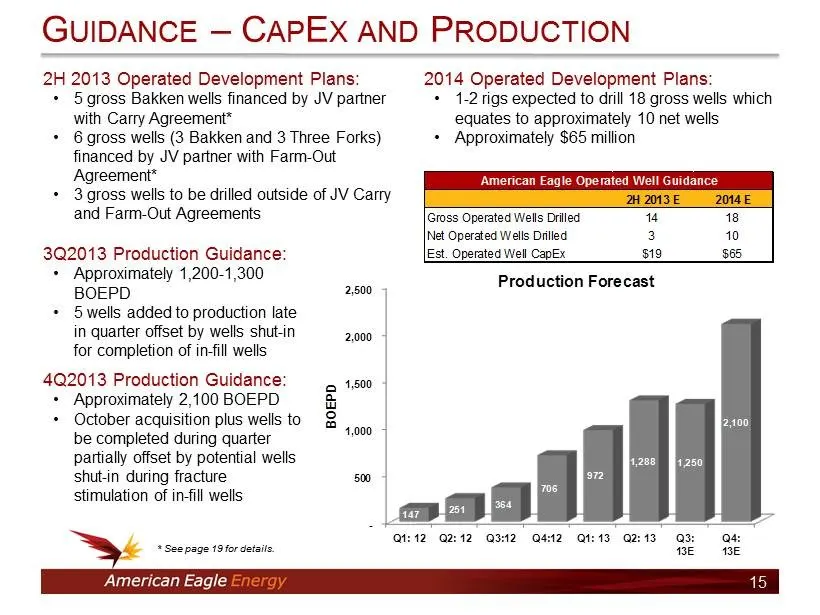
2H 2013 Operated Development Plans: • 5 gross Bakken wells financed by JV partner with Carry Agreement* • 6 gross wells (3 Bakken and 3 Three Forks) financed by JV partner with Farm - Out Agreement* • 3 gross wells to be drilled outside of JV Carry and Farm - Out Agreements G UIDANCE – C AP E X AND
Slide 16: Capitalization
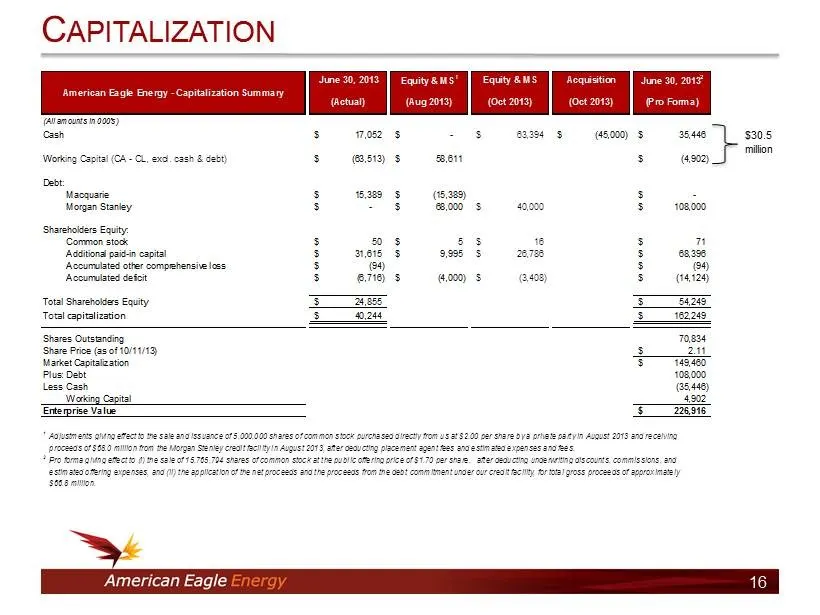
C APITALIZATION 16 $30.5 million June 30, 2013 Equity & MS 1 Equity & MS Acquisition June 30, 2013 2 (Actual) (Aug 2013) (Oct 2013) (Oct 2013) (Pro Forma) (All amounts in 000's) Cash 17,052$ -$ 63,394$ (45,000)$ 35,446$ Working Capital (CA - CL, excl. cash & debt) (63,513)$ 58,611$ (4,902)$ Debt: Ma
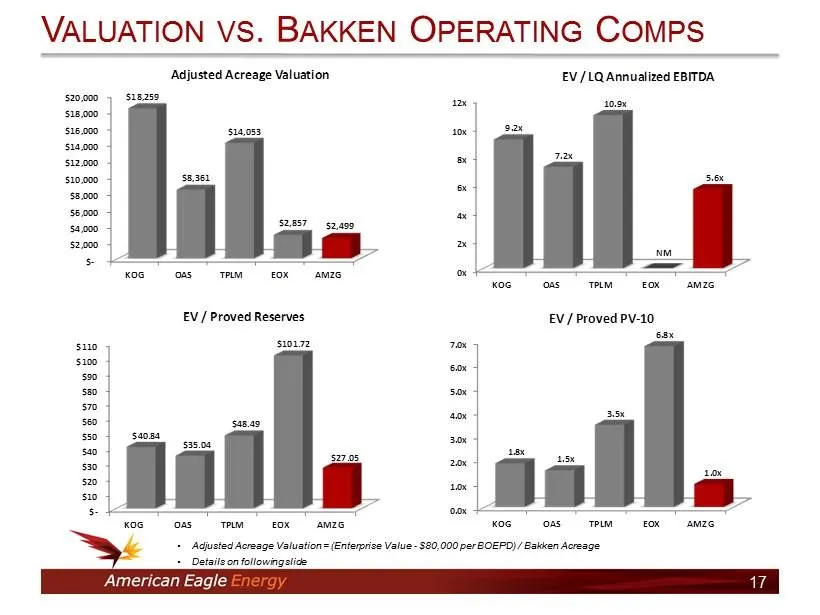
Slide 17: Valuation vs. Bakken Operating Comps
V ALUATION VS . B AKKEN O PERATING C OMPS 17 • Adjusted Acreage Valuation = (Enterprise Value - $80,000 per BOEPD) / Bakken Acreage • Details on following slide $ - $2,000 $4,000 $6,000 $8,000 $10,000 $12,000 $14,000 $16,000 $18,000 $20,000 KOG OAS TPLM EOX AMZG $18,259 $8,361 $14,053 $2,857 $2,499
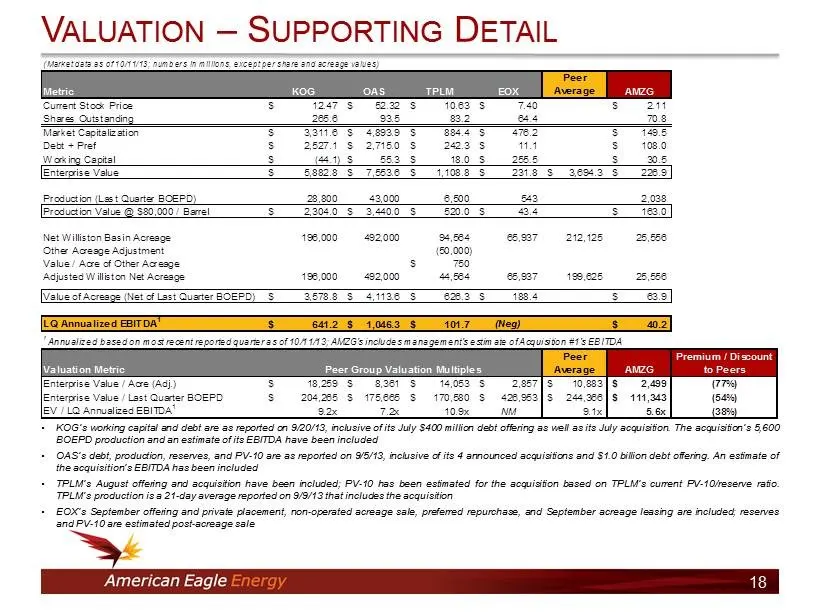
Slide 18: Valuation – Supporting Detail
V ALUATION – S UPPORTING D ETAIL • KOG’s working capital and debt are as reported on 9 / 20 / 13 , inclusive of its July $ 400 million debt offering as well as its July acquisition . The acquisition’s 5 , 600 BOEPD production and an estimate of its EBITDA have been included • OAS’s debt, production,
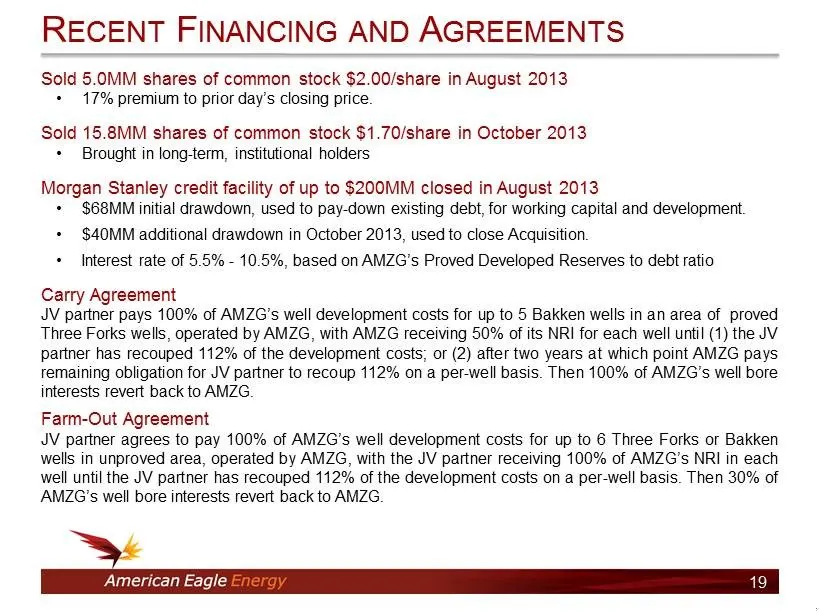
Slide 19: Financing and JV agreements
Sold 5 . 0 MM shares of common stock $ 2 . 00 /share in August 2013 • 17 % premium to prior day’s closing price . Sold 15 . 8 MM shares of common stock $ 1 . 70 /share in October 2013 • Brought in long - term, institutional holders Morgan Stanley credit facility of up to $ 200 MM closed in August 20
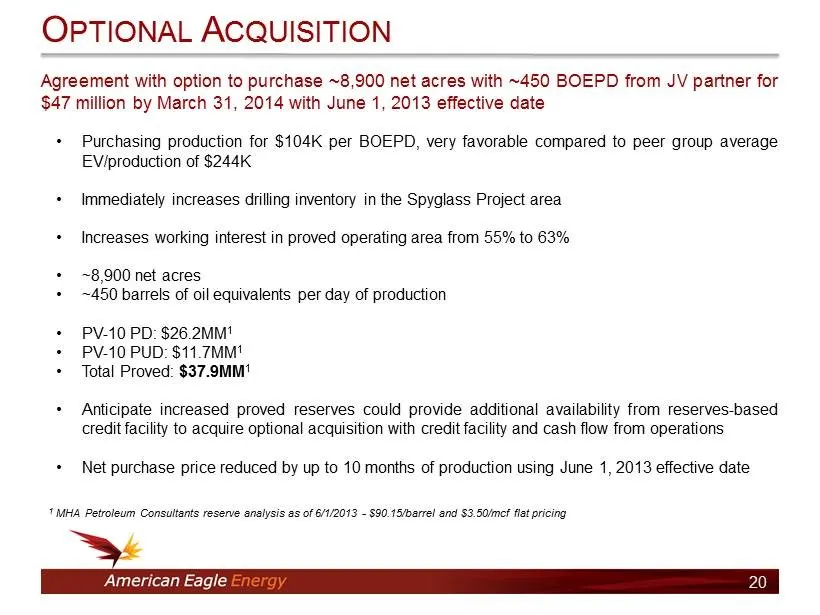
Slide 20: Optional Acquisition
Agreement with option to purchase ~ 8 , 900 net acres with ~ 450 BOEPD from JV partner for $ 47 million by March 31 , 2014 with June 1 , 2013 effective date • Purchasing production for $ 104 K per BOEPD, very favorable compared to peer group average EV/production of $ 244 K • Immediately increases d
Slide 21: Key Investment Highlights
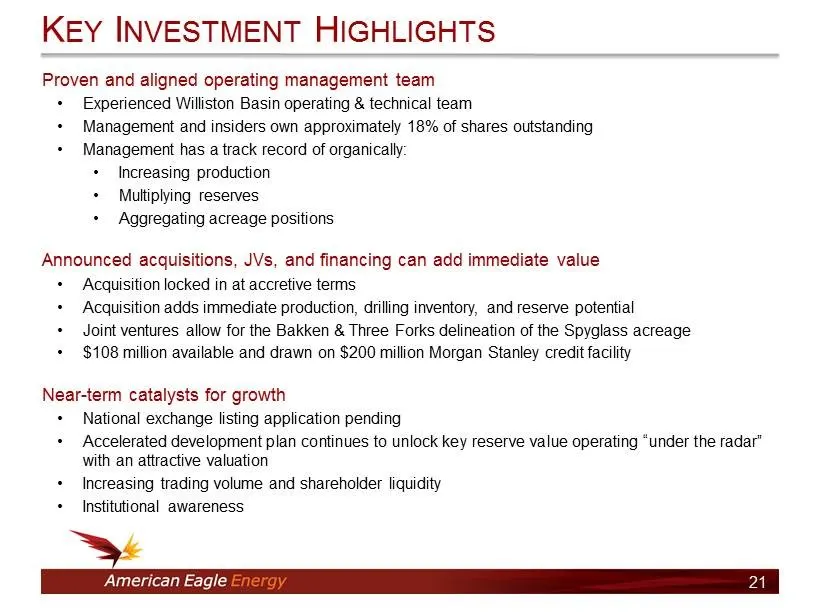
K EY I NVESTMENT H IGHLIGHTS Proven and aligned operating management team • Experienced Williston Basin operating & technical team • Management and insiders own approximately 18 % of shares outstanding • Management has a track record of organically : • Increasing production • Multiplying reserves •
Slide 22: Contact Information
Marty Beskow, CFA Vice President of Capital Markets & Strategy American Eagle Energy Corporation 2549 West Main Street, Suite 202 Littleton, CO 80120 303 - 798 - 5235 ir@amzgcorp.com C ONTACT I NFORMATION 22
Source: SEC EDGAR · 8-K filed Oct 16, 2013