Coventry Health Care — Q3 2005 Earnings Presentation
21 slides from Coventry Health Care's earnings presentation, Nov 7, 2005
Slide 1: Investor Presentation: November 2005
COVENTRY Health Care Investor Presentation: November 2005
Slide 2: Forward-looking statements
Certain statements in this presentation will be forward-looking statements. Certain risks and uncertainties, including those in the Company's filings with the SEC, including its annual reports on Form 10-K, may materially impact those statements and could cause actual future results to differ materi
Slide 3: Review of Third Quarter Results and Fourth Quarter Outlook
@coventRy Health Care Review of Third Quarter Results and Fourth Quarter Outlook
Slide 4: Q3 2005 - Solid Financial Results
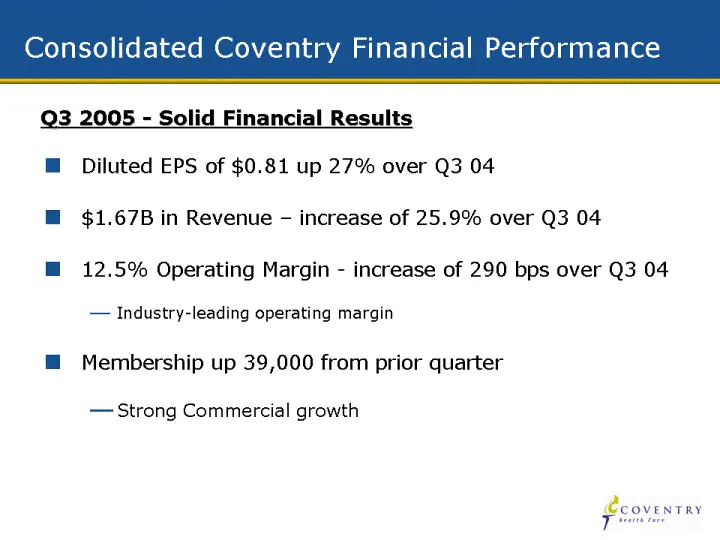
Q3 2005 - Solid Financial Results • Diluted EPS of $0.81 up 27% over Q3 04 • $1.67B in Revenue – increase of 25.9% over Q3 04 • 12.5% Operating Margin - increase of 290 bps over Q3 04 • Industry-leading operating margin • Membership up 39,000 from prior quarter • Strong Commercial growth
Slide 5: Q3 2005 - Strong quality of earnings
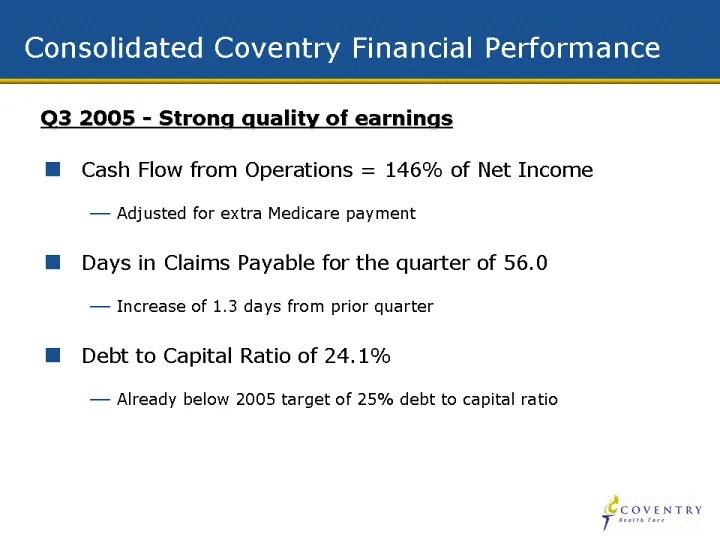
Q3 2005 - Strong quality of earnings • Cash Flow from Operations = 146% of Net Income • Adjusted for extra Medicare payment • Days in Claims Payable for the quarter of 56.0 • Increase of 1.3 days from prior quarter • Debt to Capital Ratio of 24.1% • Already below 2005 target of 25% debt to capital r
Slide 6: Solid Capital Structure
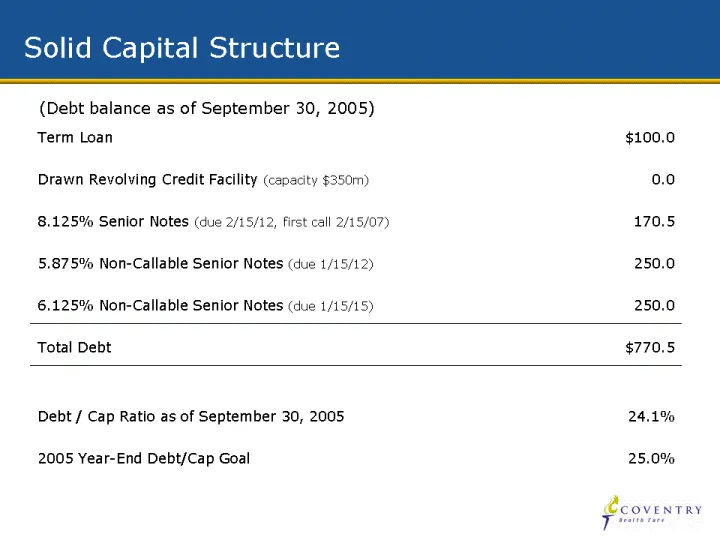
Solid Capital Structure (Debt balance as of September 30, 2005) Term Loan $100.0 Drawn Revolving Credit Facility (capacity $350) 0.0 8.125% Senior Notes (due 2/15/12, first call 2/15/07) 170.5 5.875% Non-Callable Senior Notes (due 1/15/12) 250.0 6.125% Non-Callable Senior Notes (due 1/15/15) 250.0 T
Slide 7: Health Plan Financial Performance: Strong and Stable
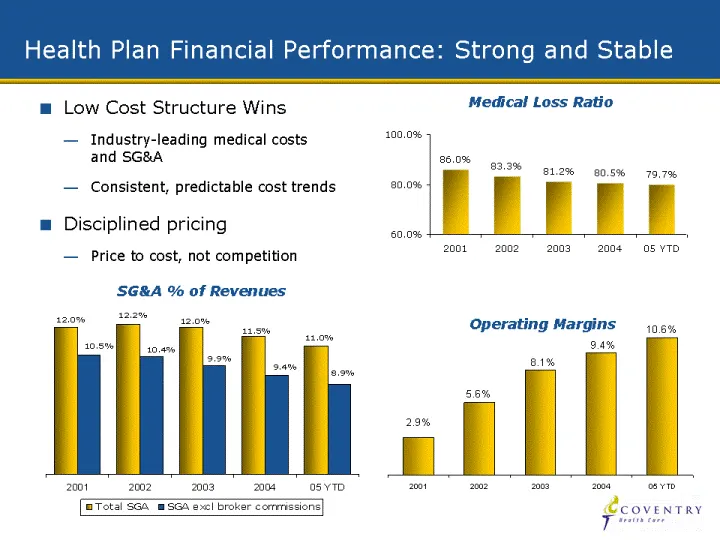
Health Plan Financial Performance: Strong and Stable = Low Cost Structure Wins ss hteahiieaaaalicaiad — Industry-leading medical costs 100.0% and SG&A 26.0% gy 5 we 22% 1.25 90.5% 79.796 — Consistent, predictable cost trends 20.09% F EF ne @ Disciplined pricing zoot 20022003 200s OS YTD — Price to c
Slide 8: First Health contribution
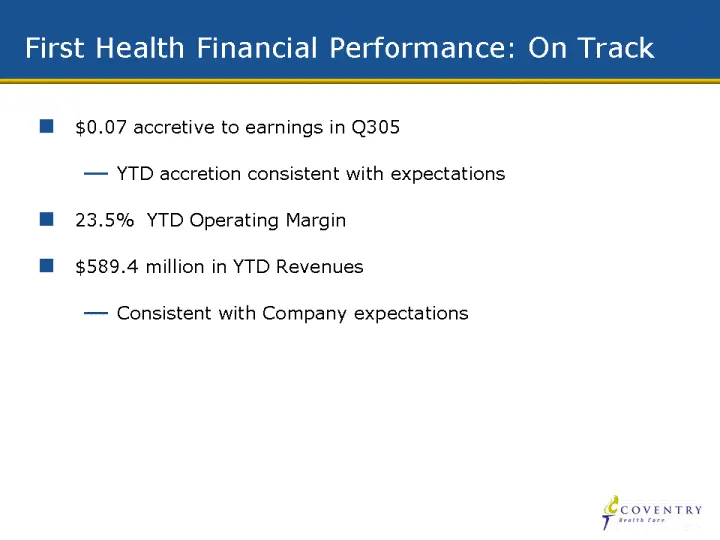
• $0.07 accretive to earnings in Q305 • YTD accretion consistent with expectations • 23.5% YTD Operating Margin • $589.4 million in YTD Revenues • Consistent with Company expectations
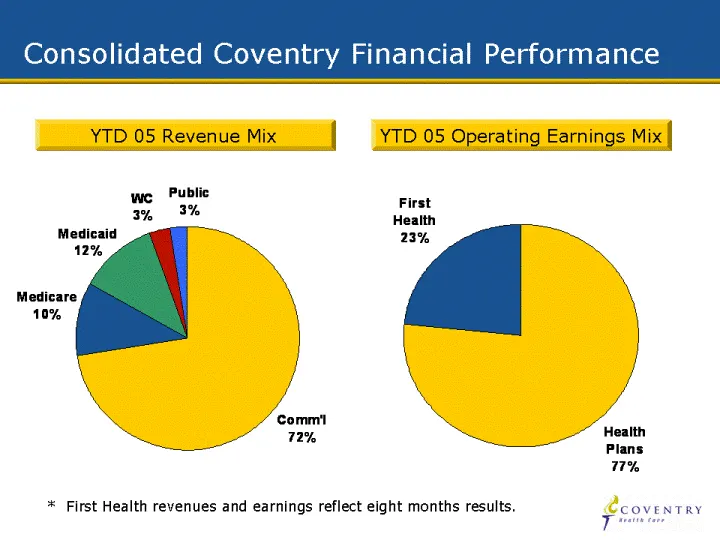
Slide 9: Consolidated Coventry Financial Performance
Consolidated Coventry Financial Performance we Public am 3% Medicaid 12% * First Health revenues and earnings reflect eight months results.
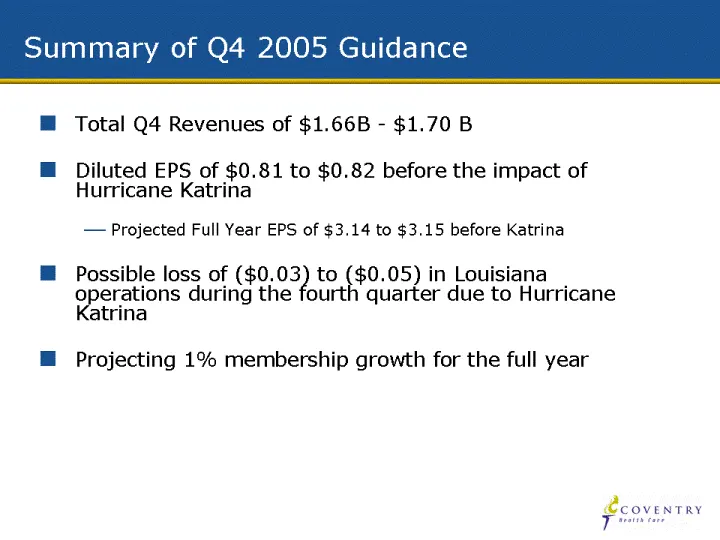
Slide 10: Q4 2005 Outlook
• Total Q4 Revenues of $1.66B - $1.70 B • Diluted EPS of $0.81 to $0.82 before the impact of Hurricane Katrina • Projected Full Year EPS of $3.14 to $3.15 before Katrina • Possible loss of ($0.03) to ($0.05) in Louisiana operations during the fourth quarter due to Hurricane Katrina • Projecting 1% m

Slide 11: 2006 Outlook
COVENTRY ) Health Care 2006 Outlook
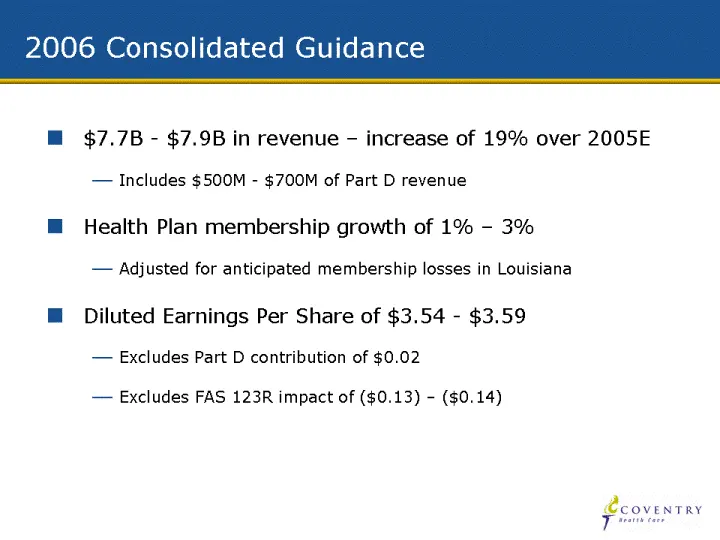
Slide 12: 2006 Guidance
• $7.7B - $7.9B in revenue – increase of 19% over 2005E • Includes $500M - $700M of Part D revenue • Health Plan membership growth of 1% – 3% • Adjusted for anticipated membership losses in Louisiana • Diluted Earnings Per Share of $3.54 - $3.59 • Excludes Part D contribution of $0.02 • Excludes FAS
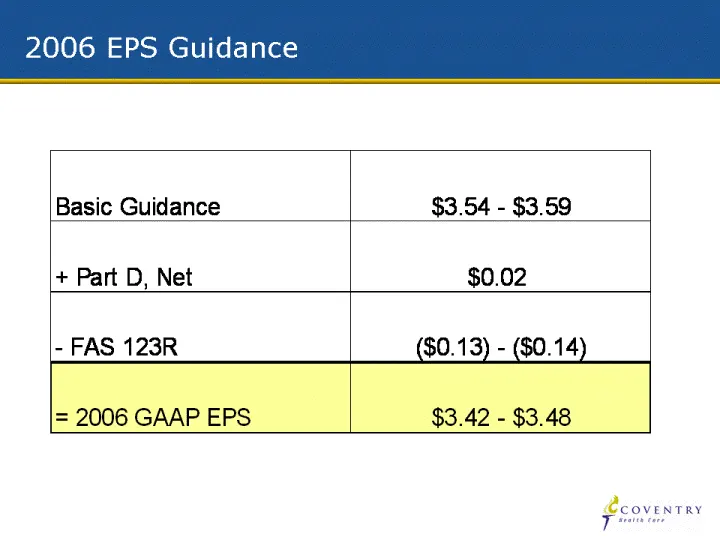
Slide 13: 2006 EPS Guidance
2006 EPS Guidance Basic Guidance $3.54 - $3.59 + Part D, Net $0.02 - FAS 123R ($0.13) - ($0.14) = 2006 GAAP EPS $3.42 - $3.48 CcoventRY
Slide 14: Stable Operating Margin
• Stable Operating Margin - in aggregate • If margins remain stable, earnings will grow as revenue grows • Important to understand how the underlying components (Commercial, Medicare, Medicaid) are moving
Slide 15: 2006 MLR by business line
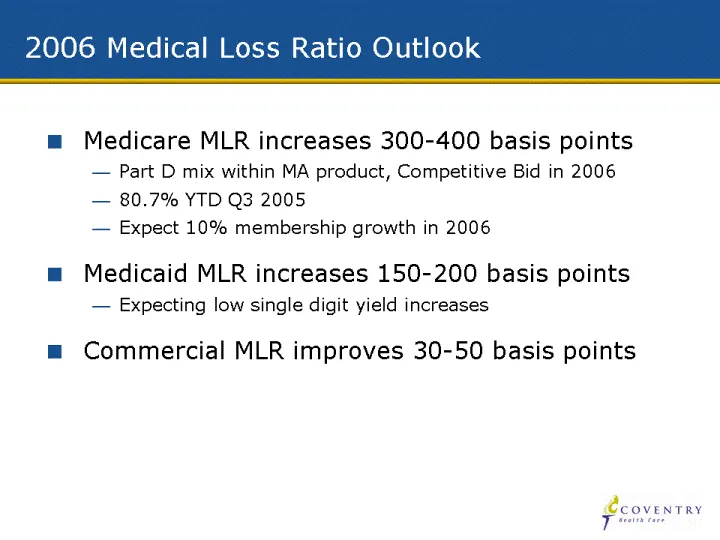
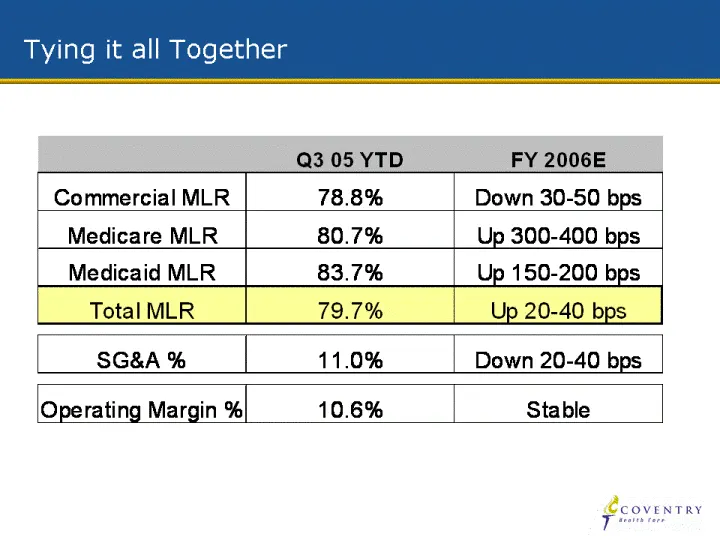
• Medicare MLR increases 300-400 basis points • Part D mix within MA product, Competitive Bid in 2006 • 80.7% YTD Q3 2005 • Expect 10% membership growth in 2006 • Medicaid MLR increases 150-200 basis points • Expecting low single digit yield increases • Commercial MLR improves 30-50 basis points
Slide 16: Pricing philosophy
• No change in our pricing philosophy • Prospective unit cost view • Conservative view on utilization and other factors • Add margin for error • Conservatism in 2006 pricing same as in 2005
Slide 17: Commercial trend year to date
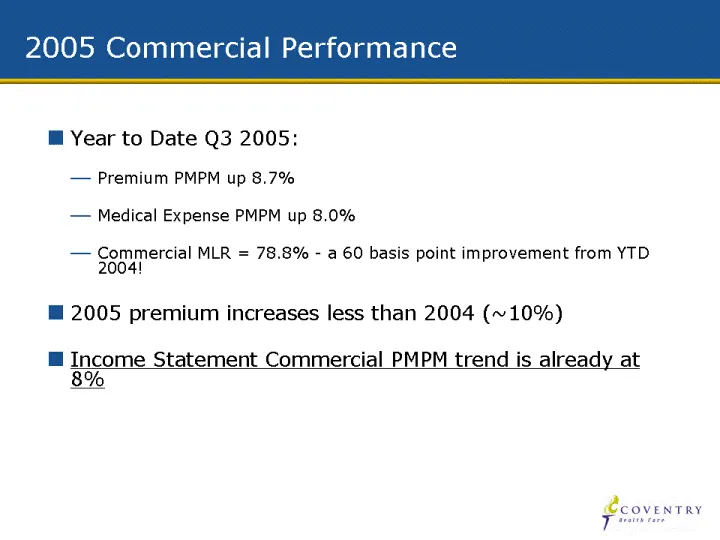
• Year to Date Q3 2005: • Premium PMPM up 8.7% • Medical Expense PMPM up 8.0% • Commercial MLR = 78.8% - a 60 basis point improvement from YTD 2004! • 2005 premium increases less than 2004 (~10%) • Income Statement Commercial PMPM trend is already at 8%
Slide 18: 2006 conservatism
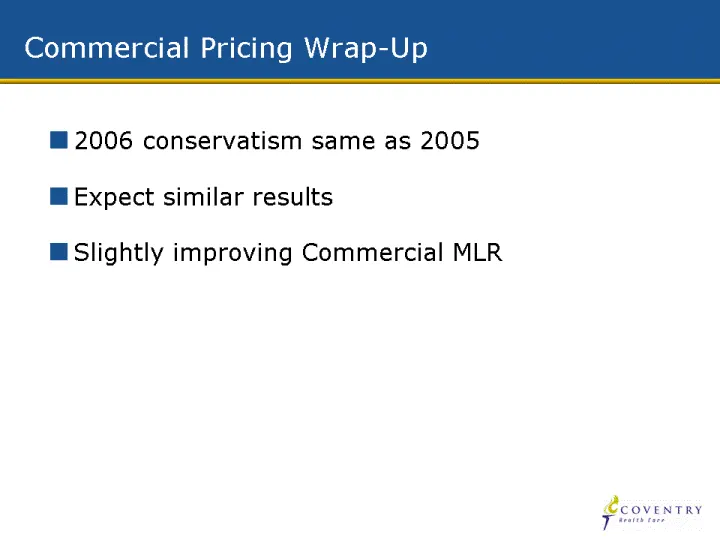
• 2006 conservatism same as 2005 • Expect similar results • Slightly improving Commercial MLR
Slide 19: Tying it all Together
Tying it all Together Q3.05 YTD FY 2006E Commercial MLR 78.8% Down 30-50 bps Medicare MLR 80.7% Up 300-400 bps Medicaid MLR 83.7% Up 150-200 bps Total MLR 79.7% Up 20-40 bps SG&A % 11.0% Down 20-40 bps Operating Margin % 10.6% Stable COVENTRY
Slide 20: Outlook - First Health
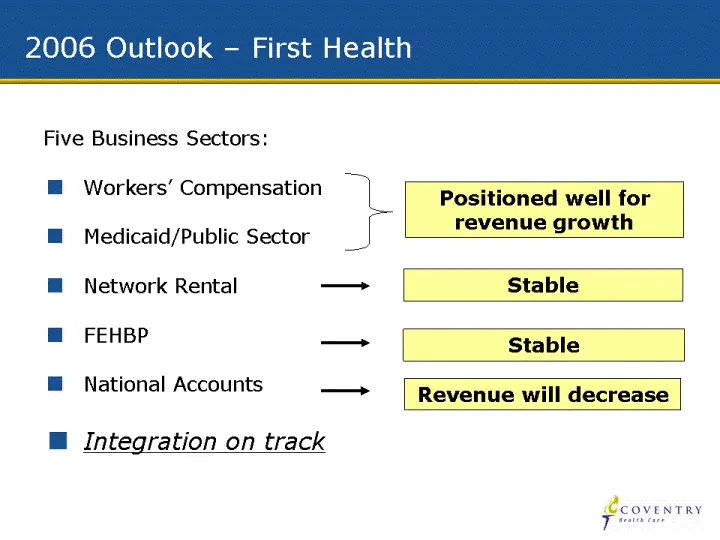
06 Outlook - First Hea Five Business Sectors: @ Workers’ Compensation +} Ron OnGHwelinon revenue growth @ Medicaid/Public Sector @ Network Rental _ Stable m@ FEHBP _— Stable ®@ National Accounts. — Revenue will decrease Integration on track
Slide 21: 2006 GAAP EPS and summary
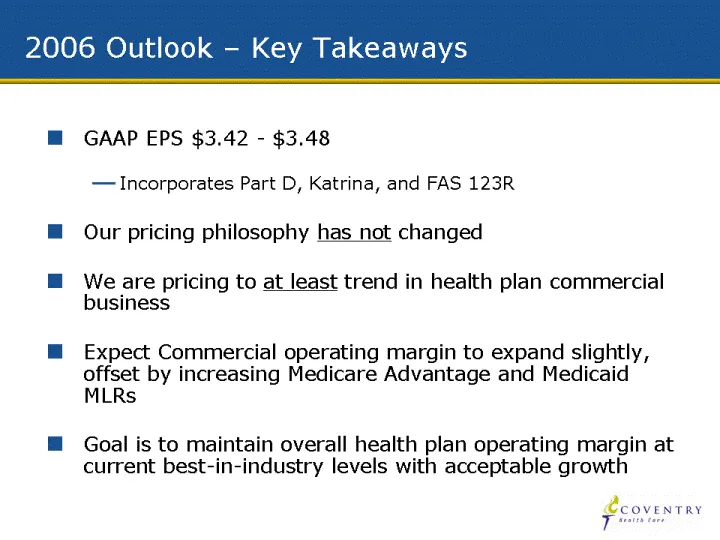
• GAAP EPS $3.42 - $3.48 • Incorporates Part D, Katrina, and FAS 123R • Our pricing philosophy has not changed • We are pricing to at least trend in health plan commercial business • Expect Commercial operating margin to expand slightly, offset by increasing Medicare Advantage and Medicaid MLRs • Go
Source: SEC EDGAR · 8-K filed Nov 7, 2005
More decks from Coventry Health Care Inc
 Credit Suisse 2012 Healthcare Conference16 slides · Nov 14, 2012
 Merger or Acquisition (August 2012)12 slides · Aug 20, 2012
 Merger or Acquisition (August 2012)29 slides · Aug 20, 2012
 Investor Presentation (March 2008)16 slides · Mar 17, 2008
 Shareholder Meeting (May 2005)18 slides · May 19, 2005
 First Health Group — Merger or Acquisition (October 2004)18 slides · Oct 14, 2004