AFLAC Incorporated · NYSE:AFL
AFLAC — Tokyo Insurance Day hosted by Morgan Stanley 2025
30 slides from AFLAC's conference presentation, Mar 26, 2025

Slide 1: Tokyo Insurance Day
Tokyo Insurance Day hosted by Morgan Stanley March 26, 2025
Slide 2: Forward-Looking Statements and Non-GAAP Financial Measures
Forward-Looking Statements and Non-GAAP Financial Measures The Private Securities Litigation Reform Act of 1995 provides a “safe harbor” to encourage companies to provide prospective information, so long as those informational statements are identified as forward-looking and are accompanied by meani
Slide 3: Aflac Incorporated Highlights
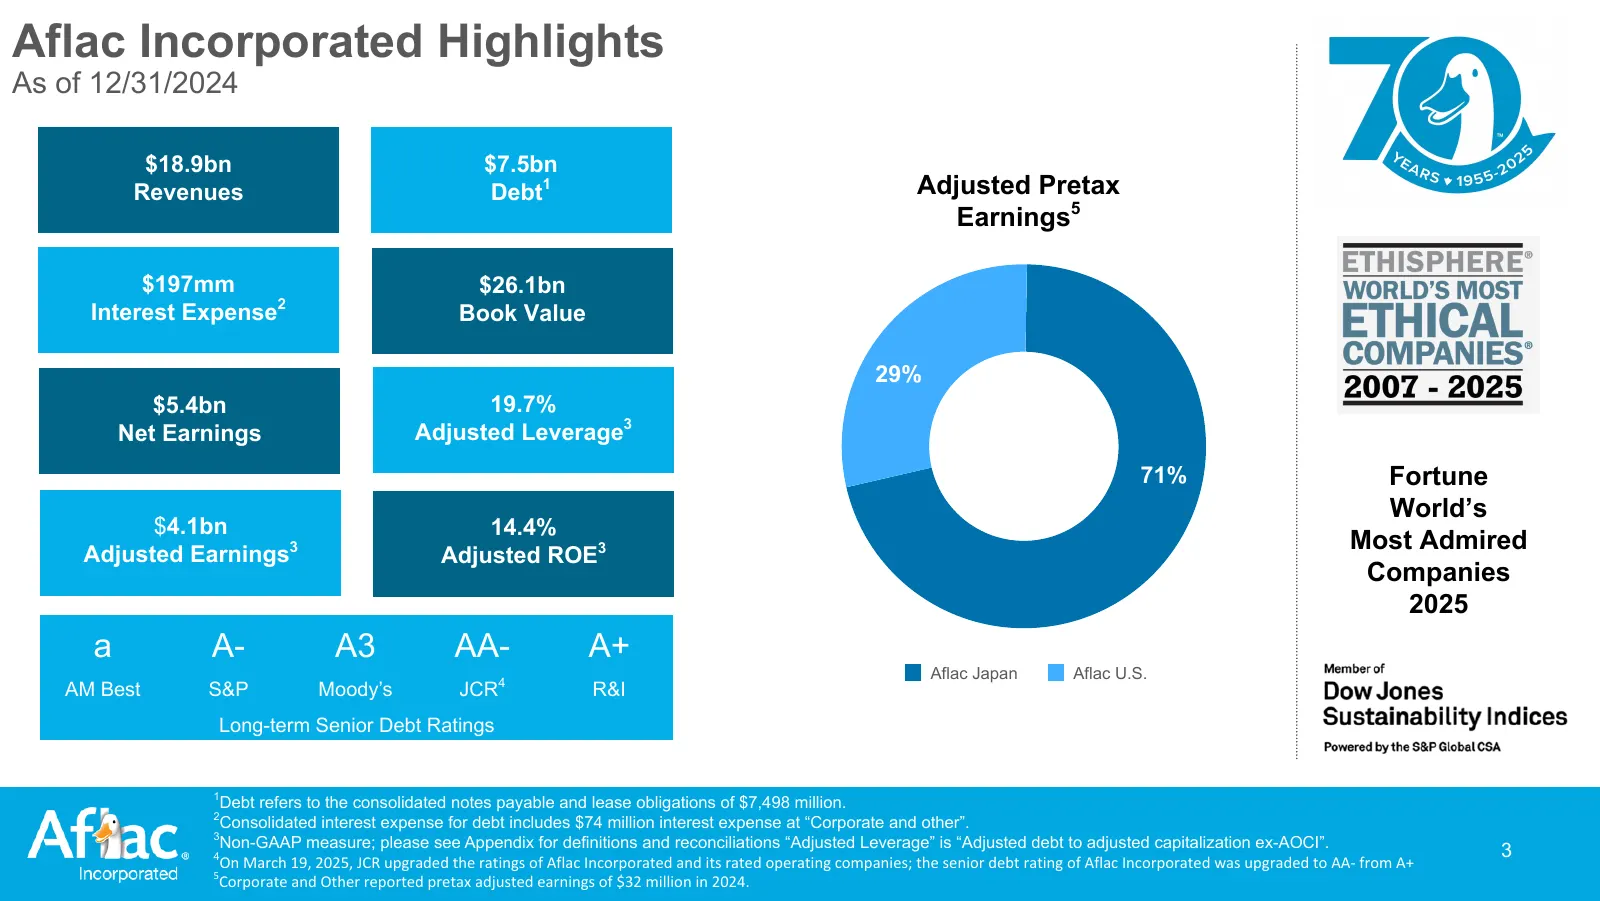
Aflac Incorporated Highlights As of 12/31/2024 $18.9bn $7.5bn Revenues Debt1 Adjusted Pretax Earnings5 $197mm $26.1bn Interest Expense2 Book Value 29% $5.4bn 19.7% Net Earnings Adjusted Leverage3 71% Fortune World’s $4.1bn 14.4% Adjusted Earnings3 Most Admired Adjusted ROE3 Companies 2025 a A- A3 AA
Slide 4: Aflac Incorporated Financial Performance
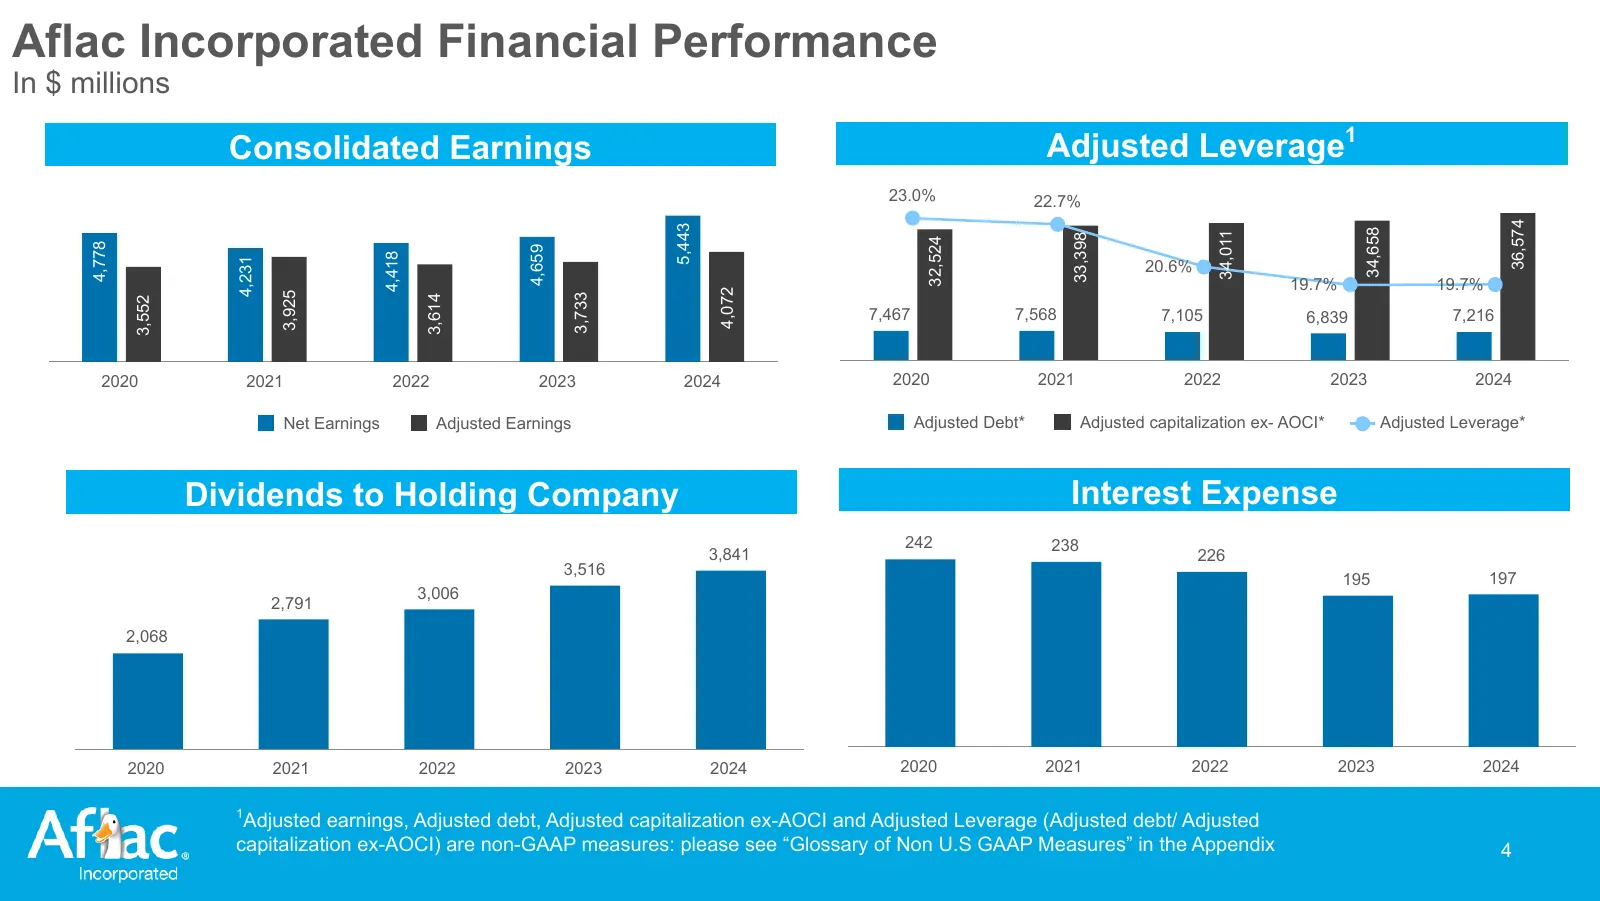
Aflac Incorporated Financial Performance In $ millions Consolidated Earnings Adjusted Leverage1 23.0% 22.7% 36,574 5,443 34,658 34,011 33,398 32,524 4,778 4,659 4,418 4,231 20.6% 19.7% 19.7% 4,072 3,925 3,733 3,614 3,552 7,467 7,568 7,105 6,839 7,216 2020 2021 2022 2023 2024 2020 2021 2022 2023 2024

Slide 5: Aflac Japan
Afiac. Incorporated Aflac Japan
Slide 6: Aflac Japan: The Leader in Cancer and Medical Insurance in Japan
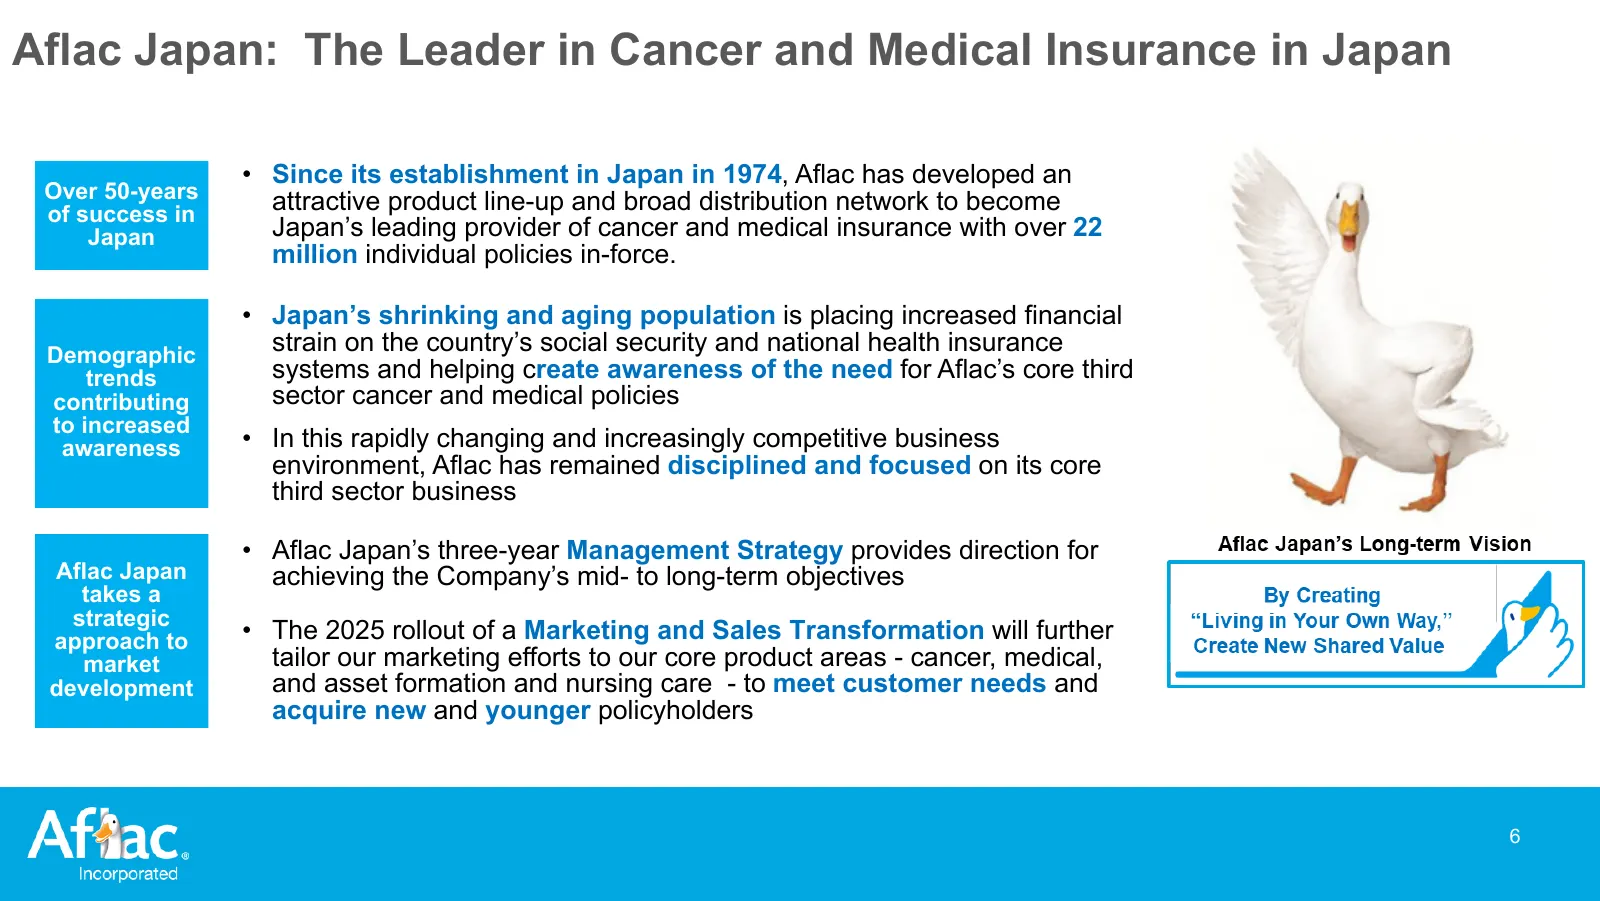
Aflac Japan: The Leader in Cancer and Medical Insurance in Japan • Since its establishment in Japan in 1974, Aflac has developed an Over 50-years attractive product line-up and broad distribution network to become of success in Japan Japan’s leading provider of cancer and medical insurance with over
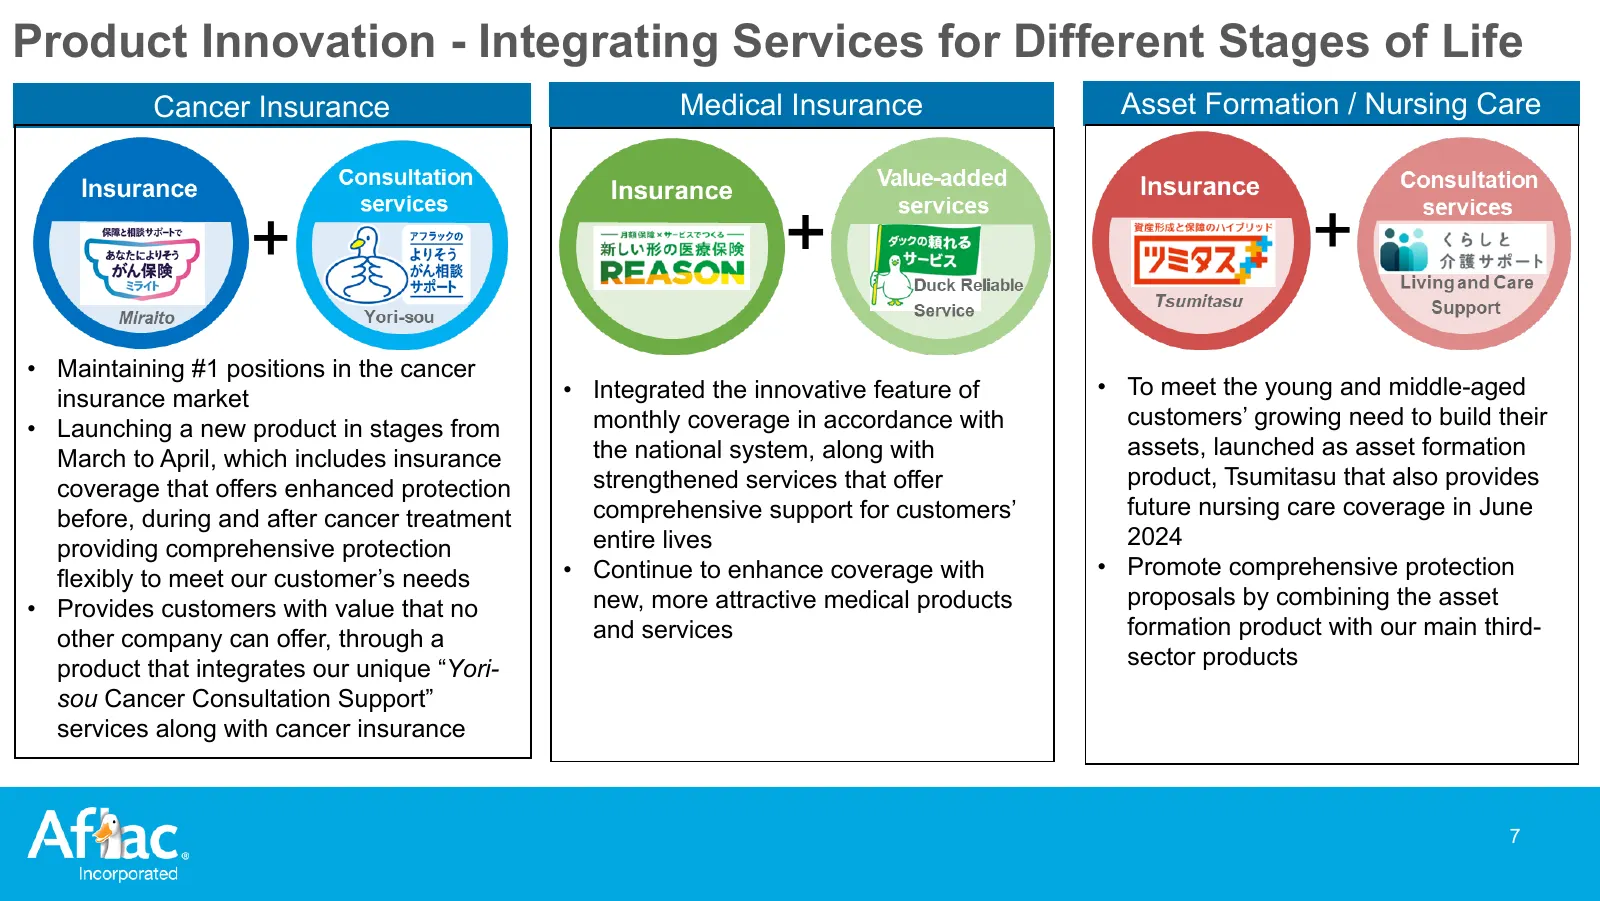
Slide 7: Product Innovation - Integrating Services for Different Stages of Life
Product Innovation - Integrating Services for Different Stages of Life Cancer Insurance Medical Insurance Asset Formation / Nursing Care • Maintaining #1 positions in the cancer insurance market • Integrated the innovative feature of • To meet the young and middle-aged • Launching a new product in s
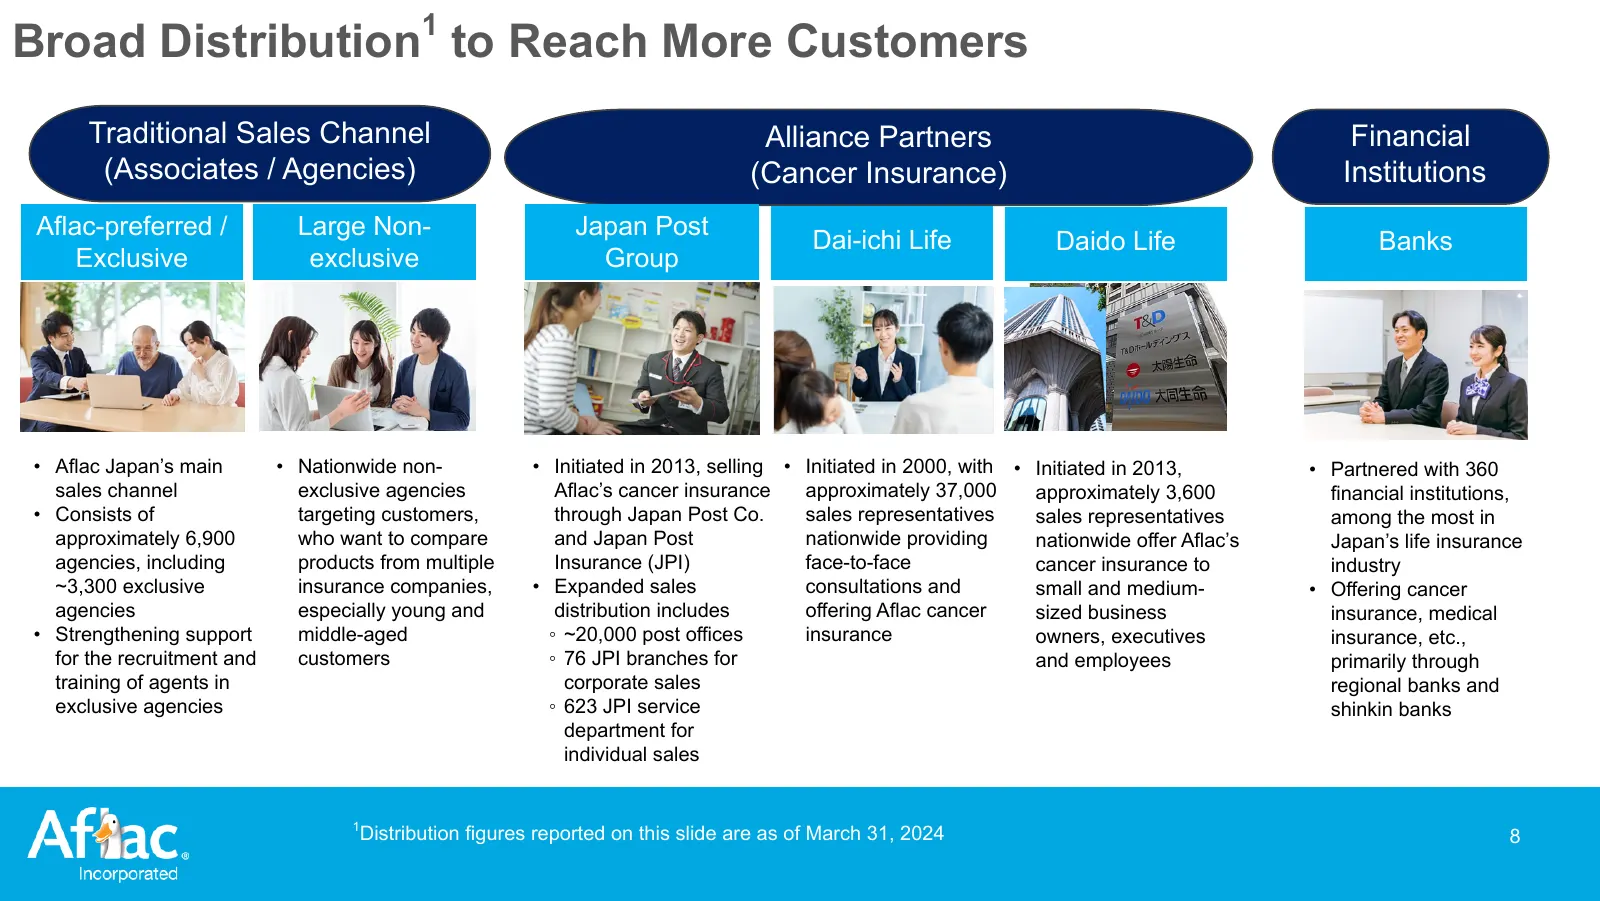
Slide 8: Broad Distribution to Reach More Customers
Broad Distribution1 to Reach More Customers Traditional Sales Channel Alliance Partners Financial (Associates / Agencies) (Cancer Insurance) Institutions Aflac-preferred / Large Non- Japan Post Dai-ichi Life Daido Life Banks Exclusive exclusive Group • Aflac Japan’s main • Nationwide non- • Initiate
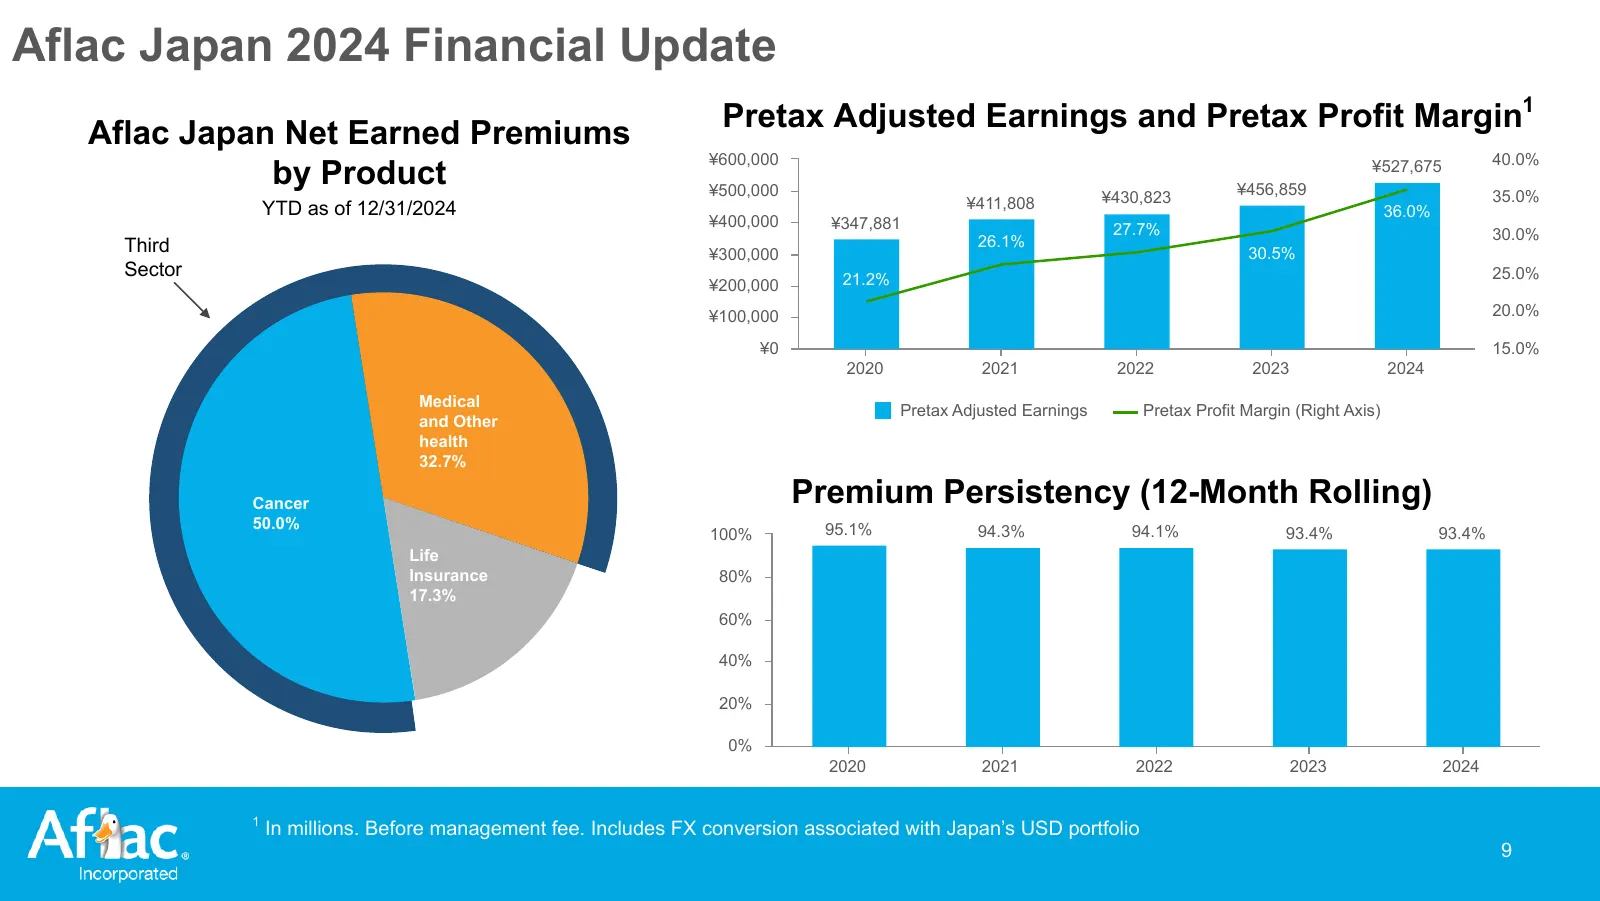
Slide 9: Aflac Japan 2024 Financial Update
Aflac Japan 2024 Financial Update Pretax Adjusted Earnings and Pretax Profit Margin1 Aflac Japan Net Earned Premiums ¥600,000 40.0% by Product ¥500,000 ¥456,859 ¥527,675 ¥411,808 ¥430,823 35.0% YTD as of 12/31/2024 36.0% ¥400,000 ¥347,881 27.7% 26.1% 30.0% Third ¥300,000 30.5% Sector 21.2% 25.0% ¥20

Slide 10: Aflac U.S. Segment
Afiac. Incorporated Aflac U.S. Segment
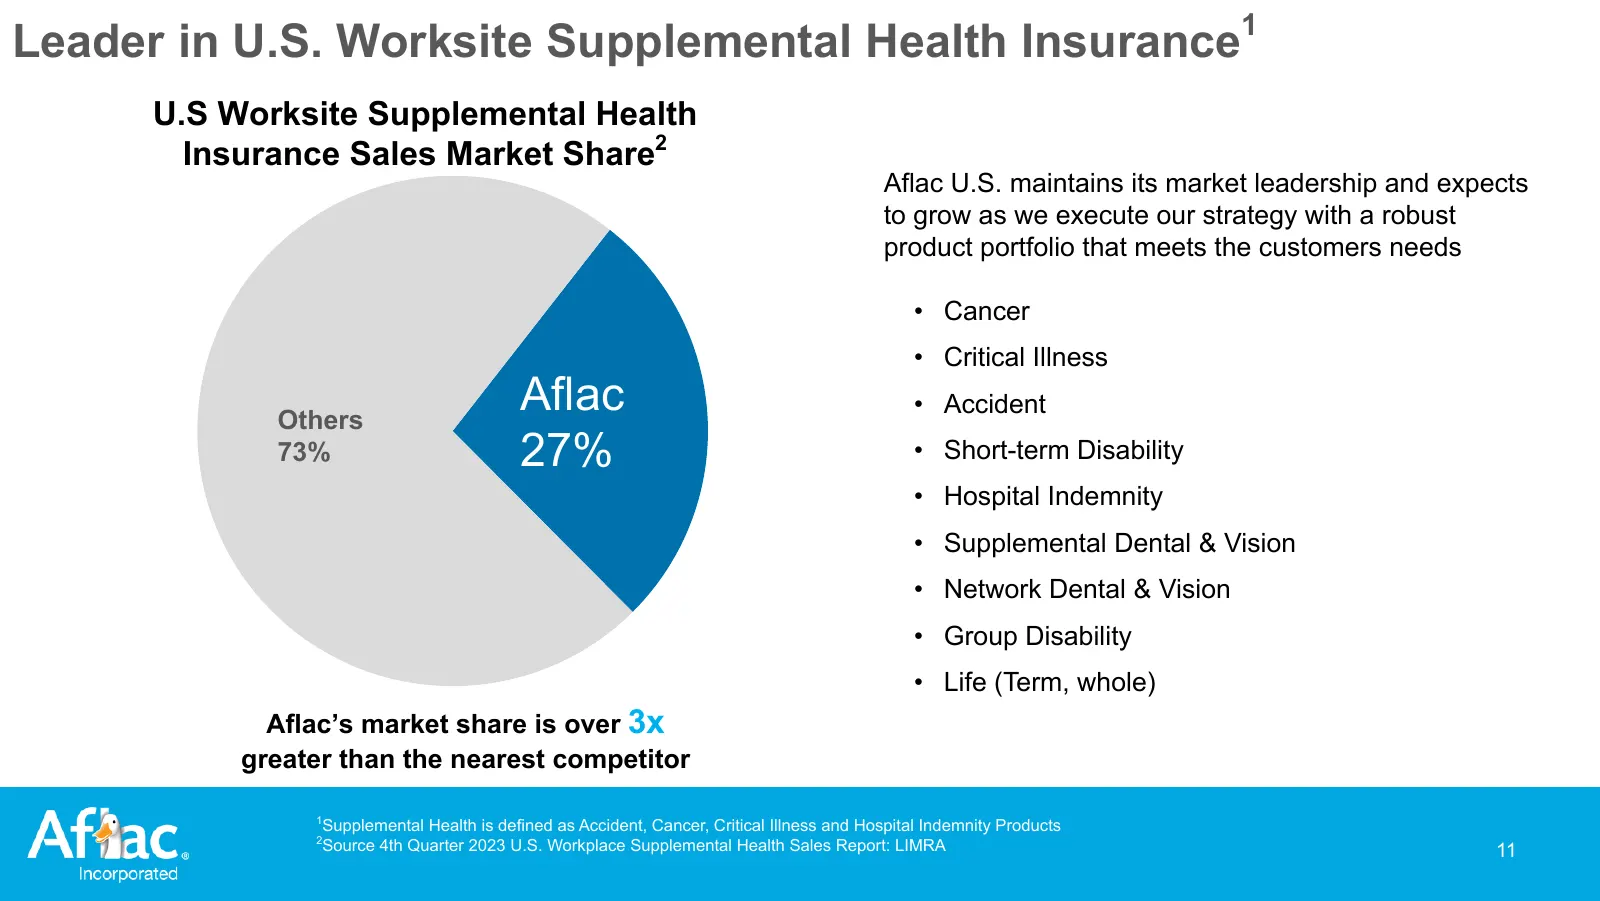
Slide 11: Leader in U.S. Worksite Supplemental Health Insurance
Leader in U.S. Worksite Supplemental Health Insurance1 U.S Worksite Supplemental Health Insurance Sales Market Share2 Aflac U.S. maintains its market leadership and expects to grow as we execute our strategy with a robust product portfolio that meets the customers needs • Cancer • Critical Illness O
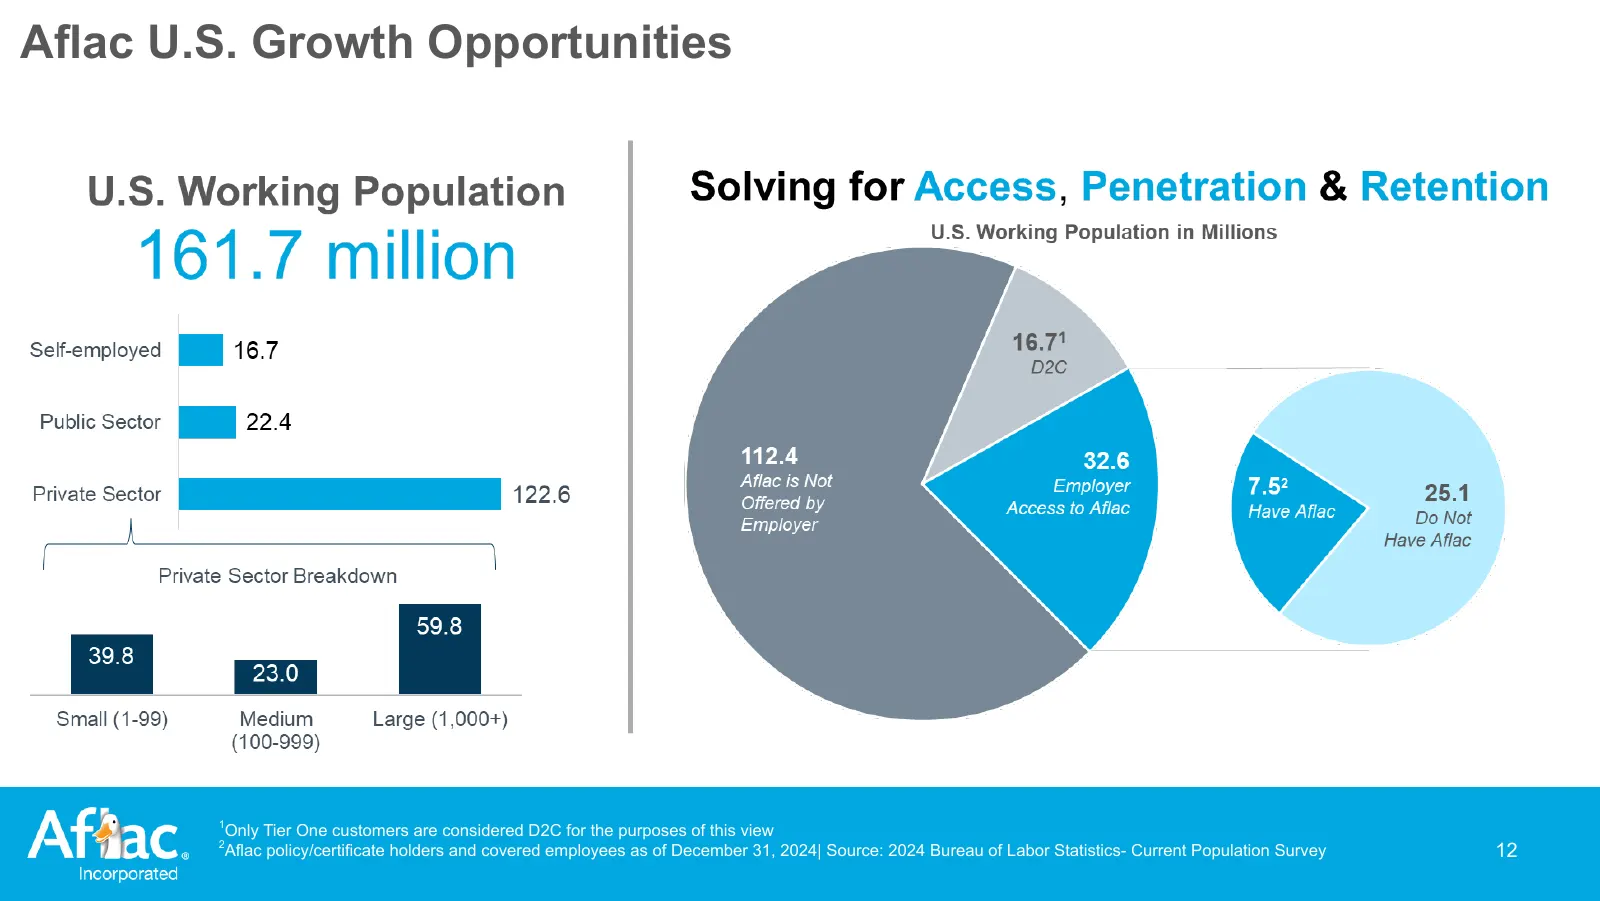
Slide 12: Aflac U.S. Growth Opportunities
Aflac U.S. Growth Opportunities 1 Only Tier One customers are considered D2C for the purposes of this view 2 Aflac policy/certificate holders and covered employees as of December 31, 2024| Source: 2024 Bureau of Labor Statistics- Current Population Survey 12
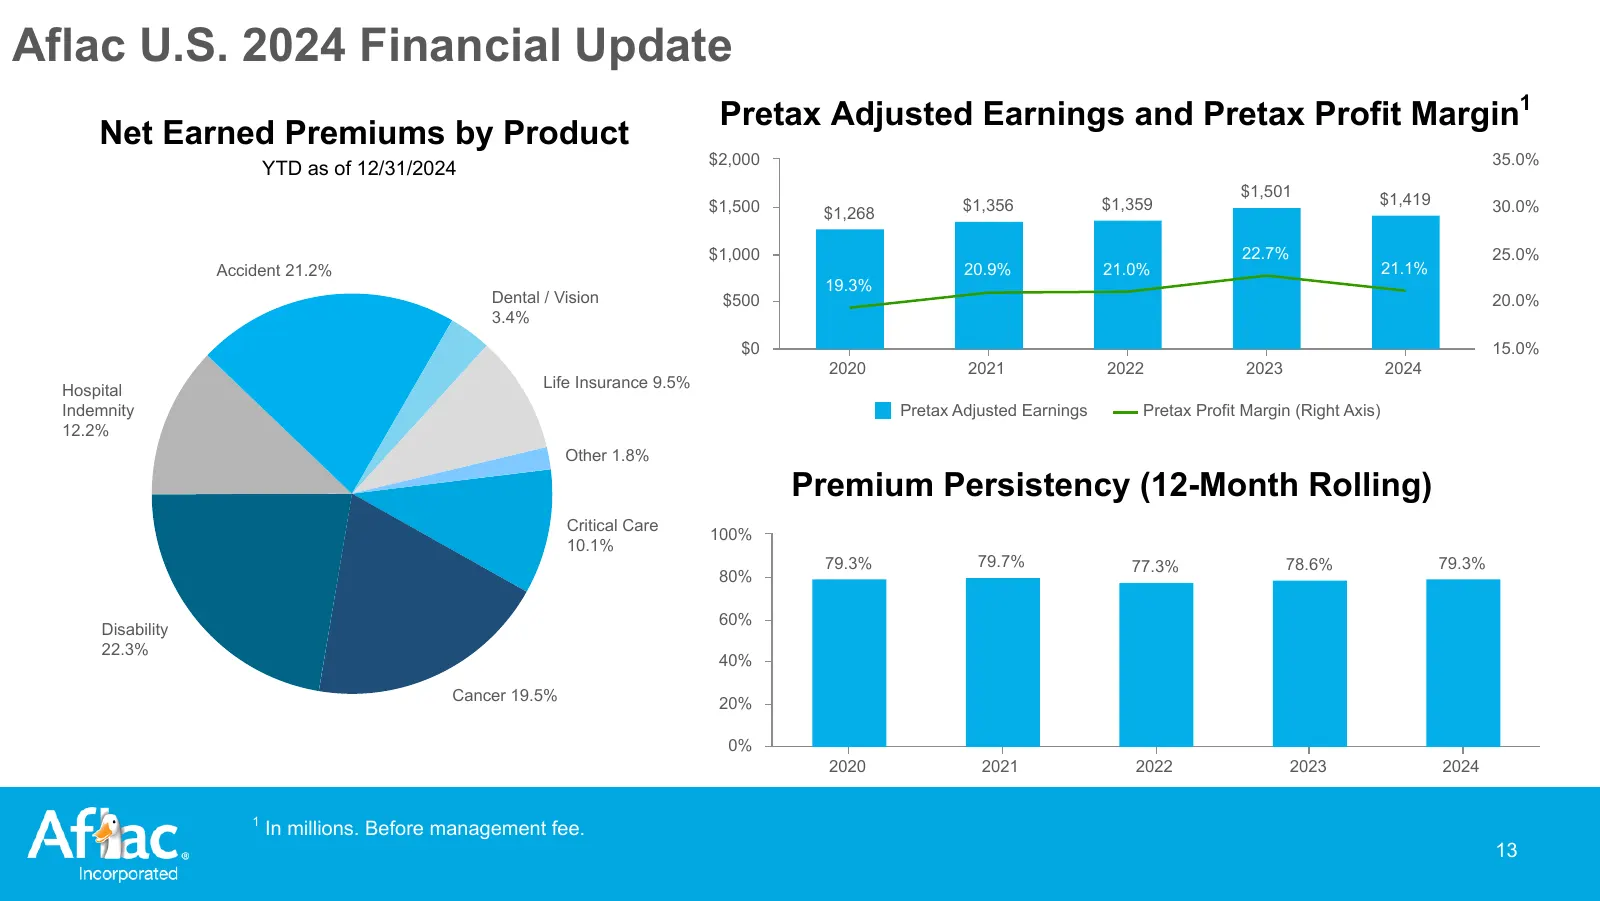
Slide 13: Aflac U.S. 2024 Financial Update
Aflac U.S. 2024 Financial Update Pretax Adjusted Earnings and Pretax Profit Margin1 Net Earned Premiums by Product $2,000 35.0% YTD as of 12/31/2024 $1,501 $1,419 $1,500 $1,356 $1,359 30.0% $1,268 $1,000 22.7% 25.0% Accident 21.2% 20.9% 21.0% 21.1% 19.3% Dental / Vision $500 20.0% 3.4% $0 15.0% 2020

Slide 14: Investment Portfolio
Afiac. Incorporated Investment Portfolio
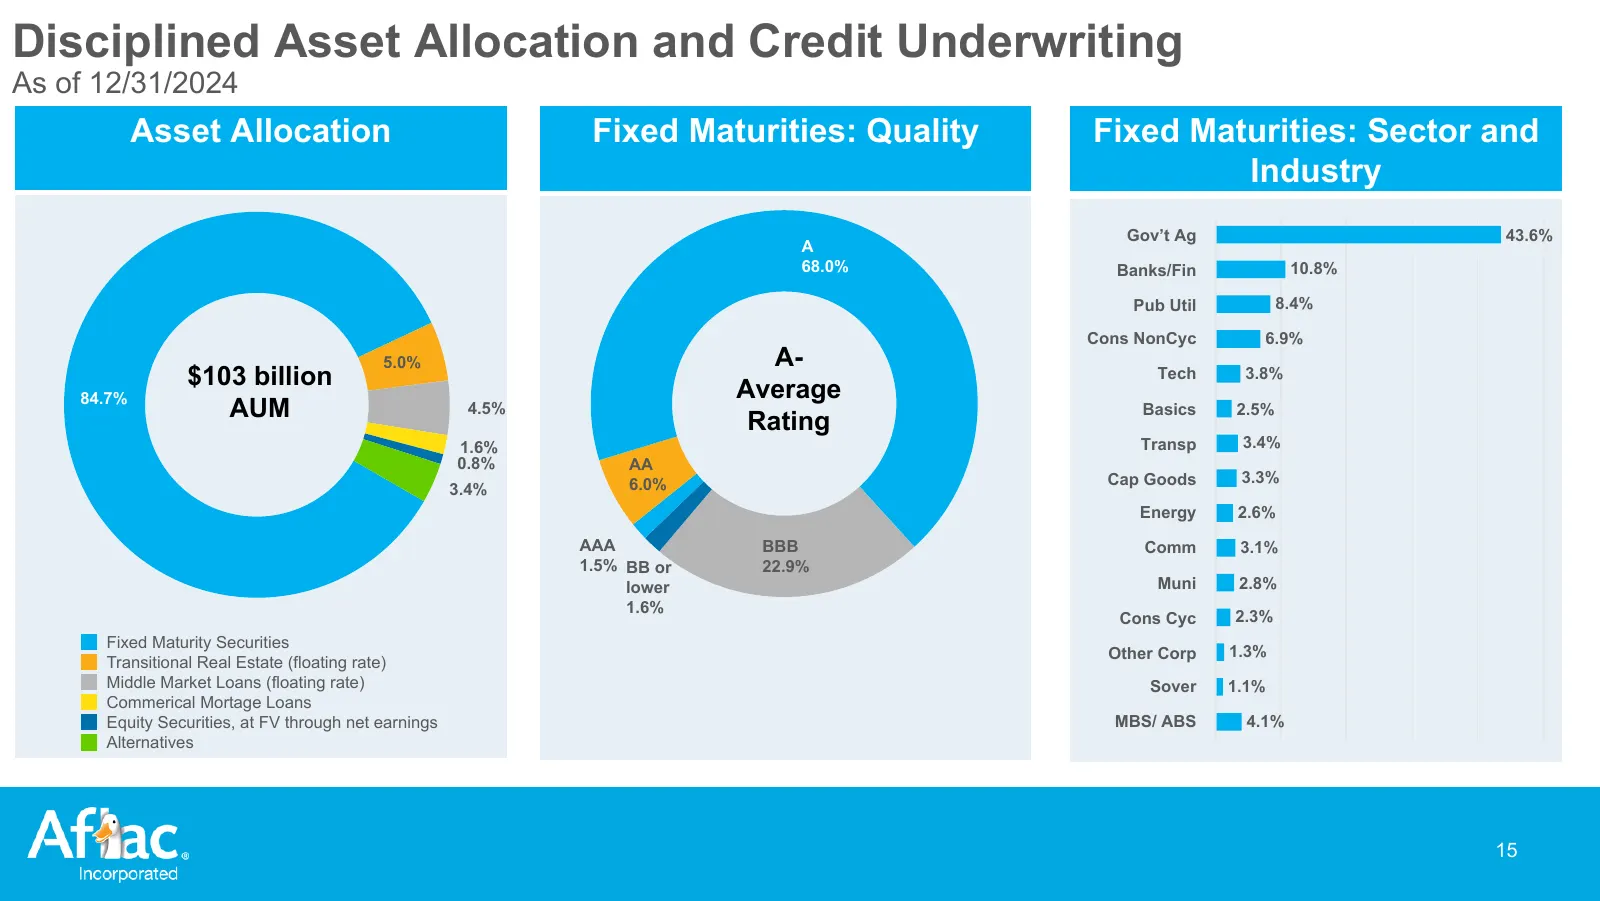
Slide 15: Disciplined Asset Allocation and Credit Underwriting
Disciplined Asset Allocation and Credit Underwriting As of 12/31/2024 Asset Allocation Fixed Maturities: Quality Fixed Maturities: Sector and Industry Gov’t Ag 43.6% A 68.0% Banks/Fin 10.8% Pub Util 8.4% Cons NonCyc 6.9% 5.0% A- $103 billion Average Tech 3.8% 84.7% AUM 4.5% Rating Basics 2.5% 1.6% T
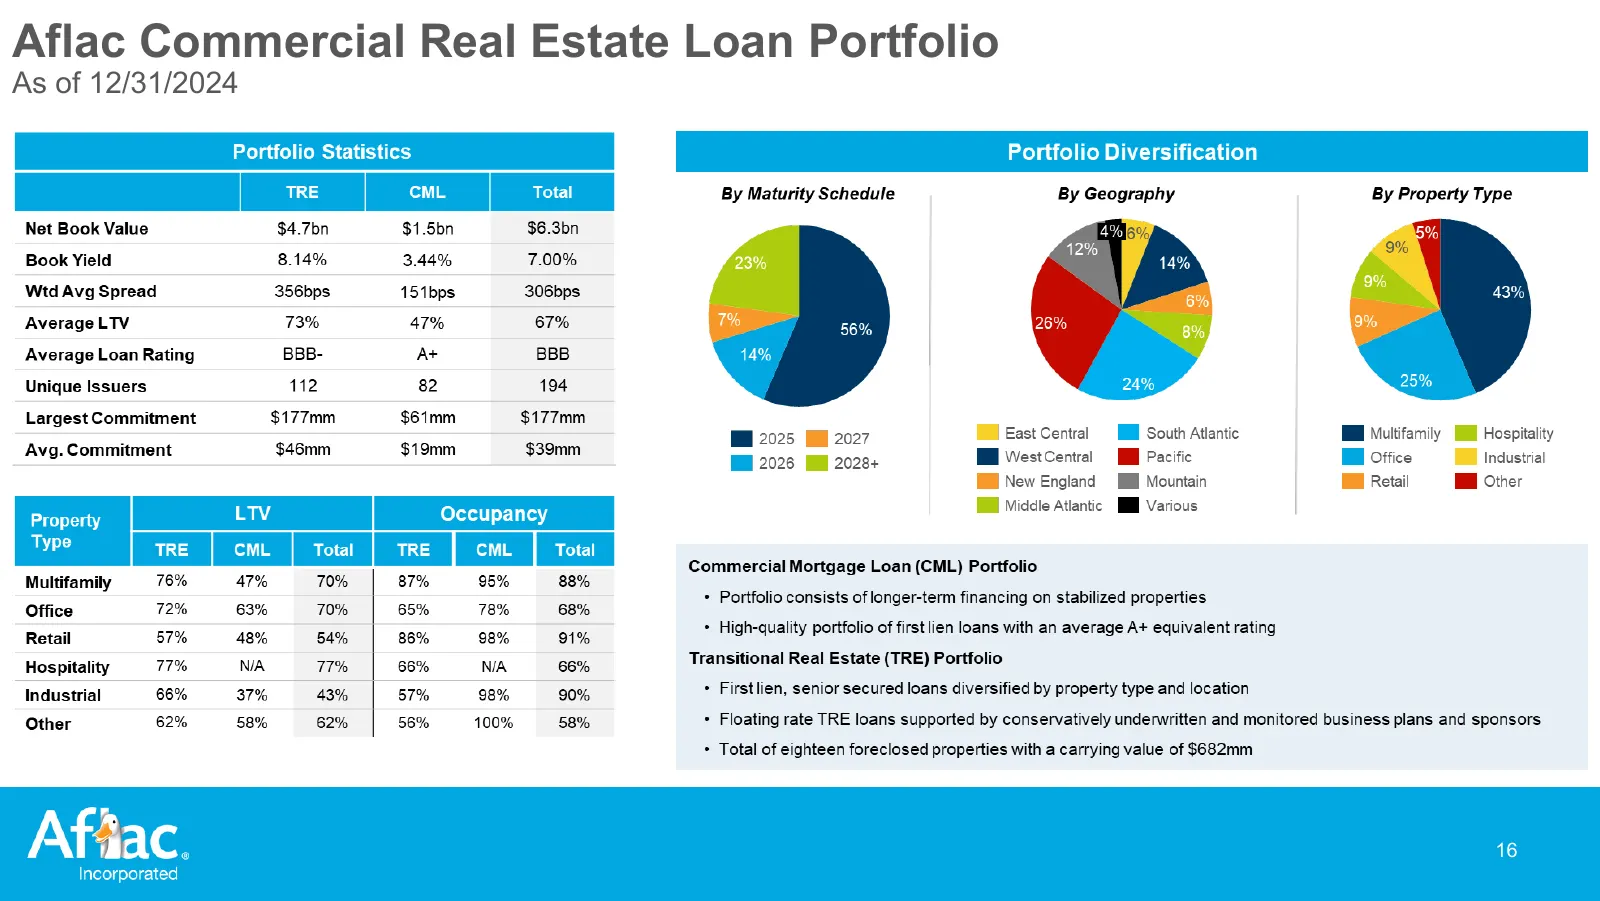
Slide 16: Aflac Commercial Real Estate Loan Portfolio
Aflac Commercial Real Estate Loan Portfolio As of 12/31/2024 16

Slide 17: Capital Management
Afiac. Incorporated Capital Management
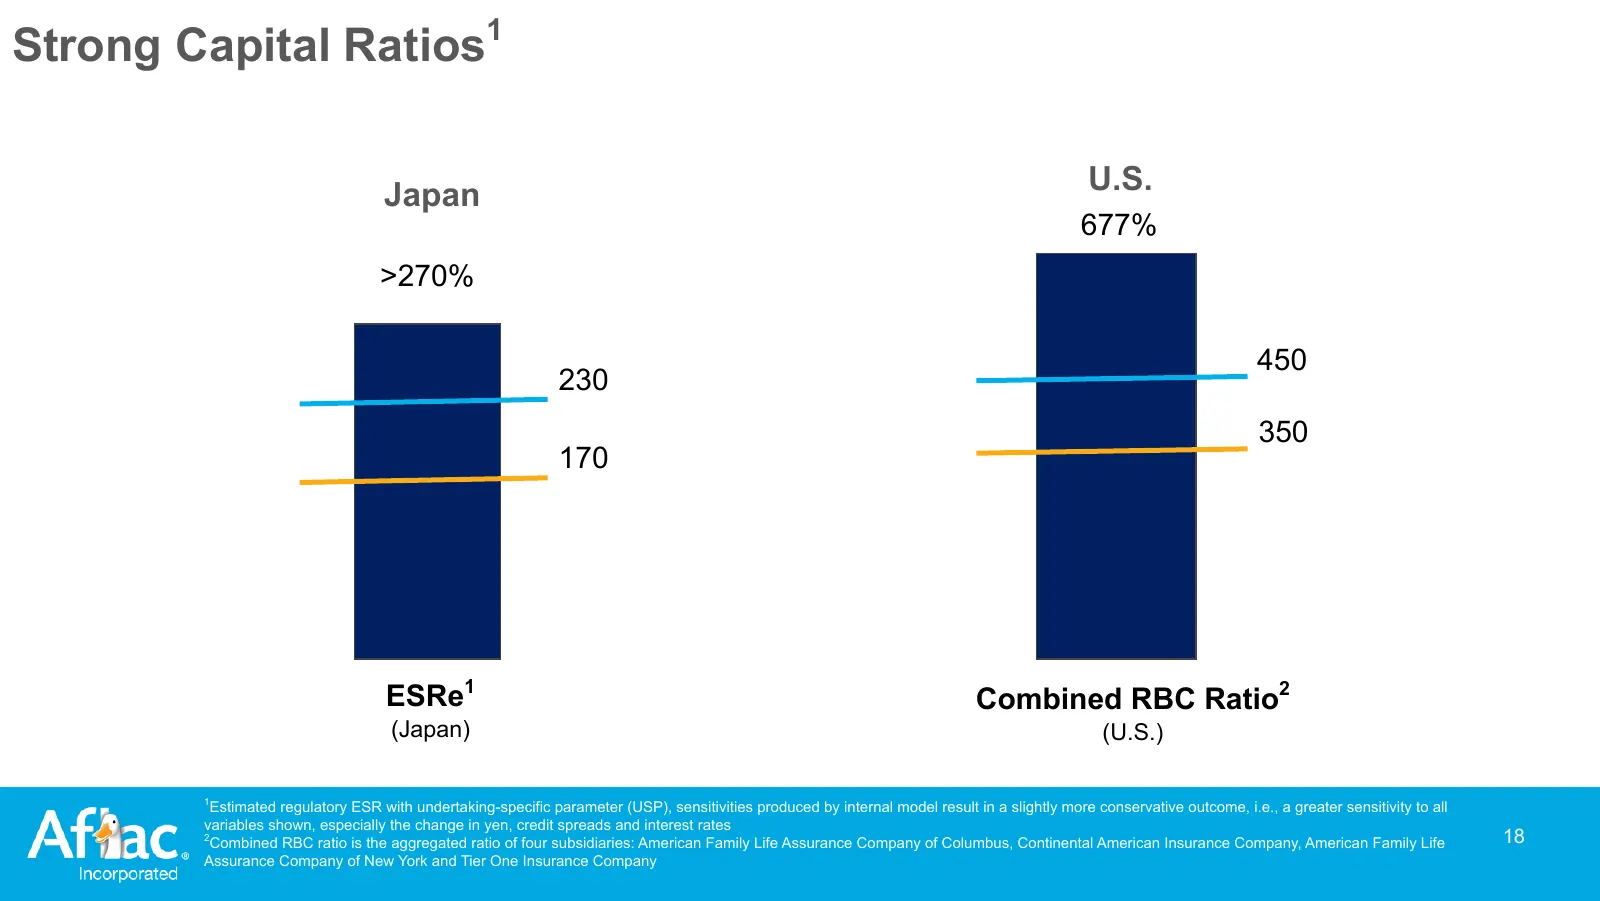
Slide 18: Strong Capital Ratios
Strong Capital Ratios1 Japan U.S. 677% >270% 450 230 350 170 ESRe1 Combined RBC Ratio2 (Japan) (U.S.) 1 Estimated regulatory ESR with undertaking-specific parameter (USP), sensitivities produced by internal model result in a slightly more conservative outcome, i.e., a greater sensitivity to all vari
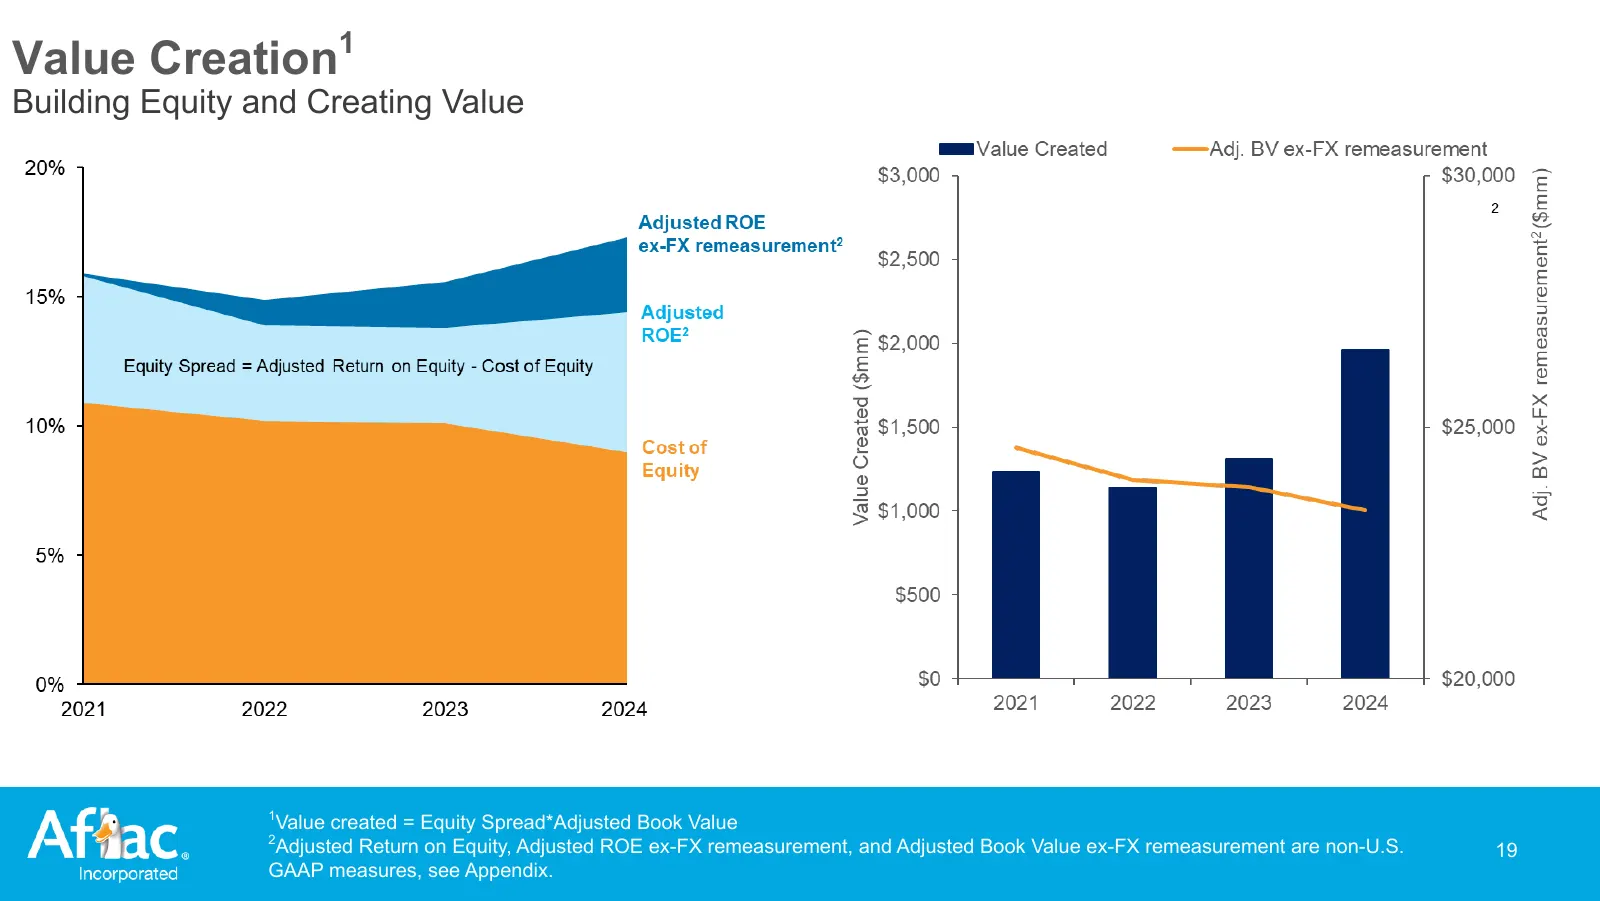
Slide 19: Value Creation
1 Value Creation Building Equity and Creating Value 1 Value created = Equity Spread*Adjusted Book Value 2 Adjusted Return on Equity, Adjusted ROE ex-FX remeasurement, and Adjusted Book Value ex-FX remeasurement are non-U.S. 19 GAAP measures, see Appendix.
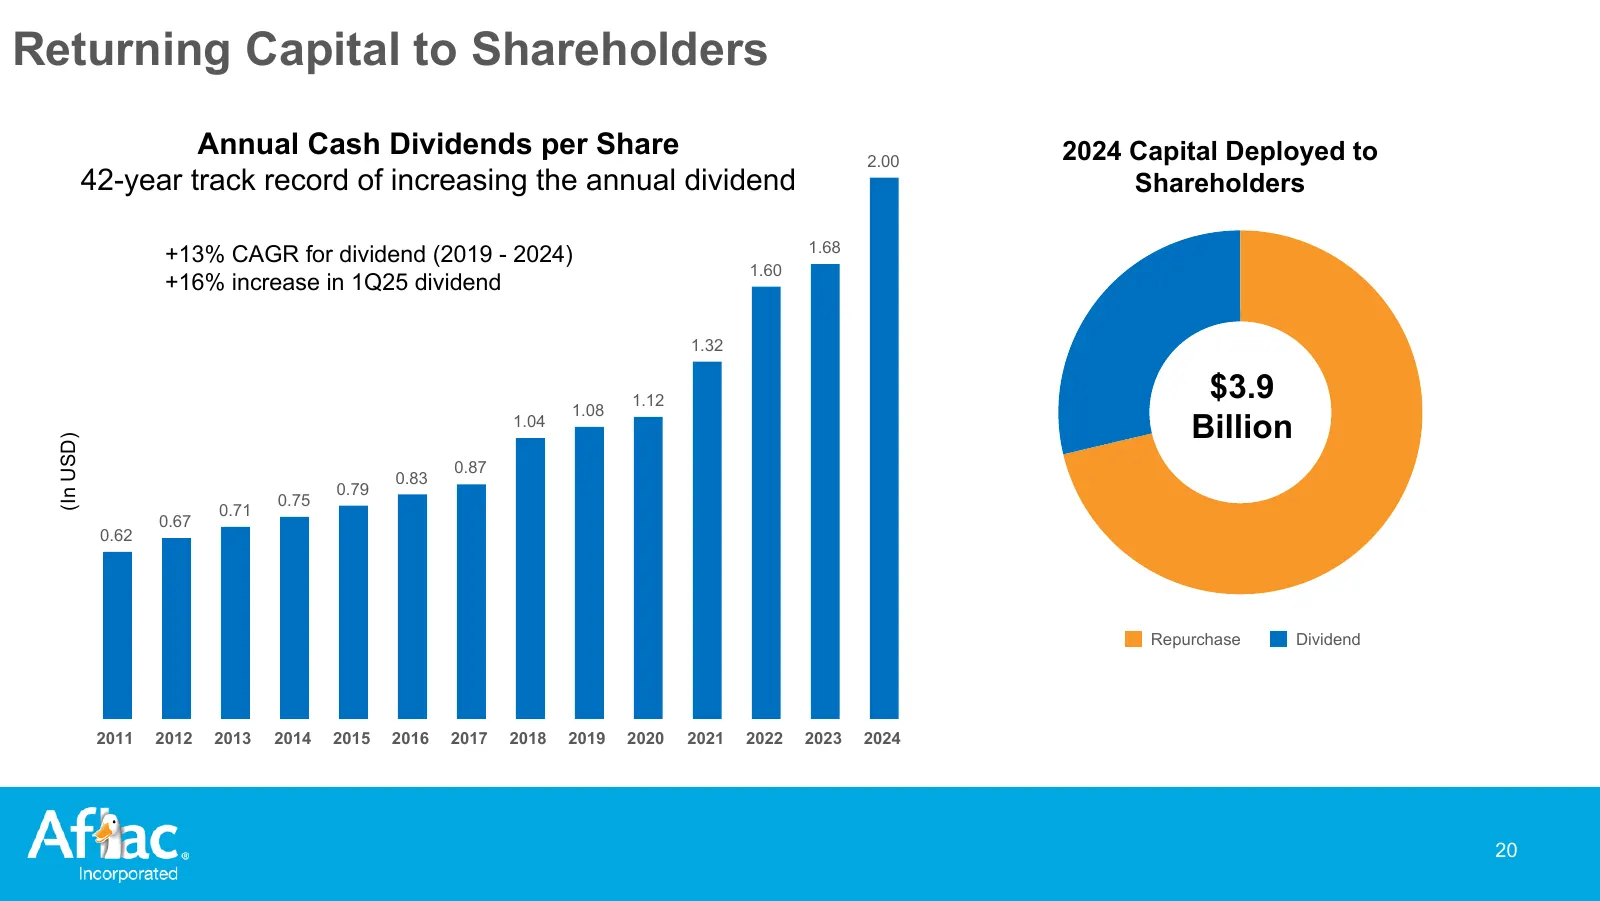
Slide 20: Returning Capital to Shareholders
Returning Capital to Shareholders Annual Cash Dividends per Share 2.00 2024 Capital Deployed to 42-year track record of increasing the annual dividend Shareholders 1.68 +13% CAGR for dividend (2019 - 2024) 1.60 +16% increase in 1Q25 dividend 1.32 1.12 $3.9 1.08 1.04 Billion (In USD) 0.87 0.83 0.79 0
Slide 21: Strategic Points of Leverage
Strategic Points of Leverage • Industry-leading market share and scale in Japan and U.S. • Well-recognized and powerful brand • Diverse and productive distribution • Product innovation and customized, high-quality service • Strong liquidity and capital position ◦ Stable earnings ◦ Strong cash flows

Slide 22: Appendix
Afiac. Incorporated Appendix
Slide 23: Aflac U.S. Insurance Products
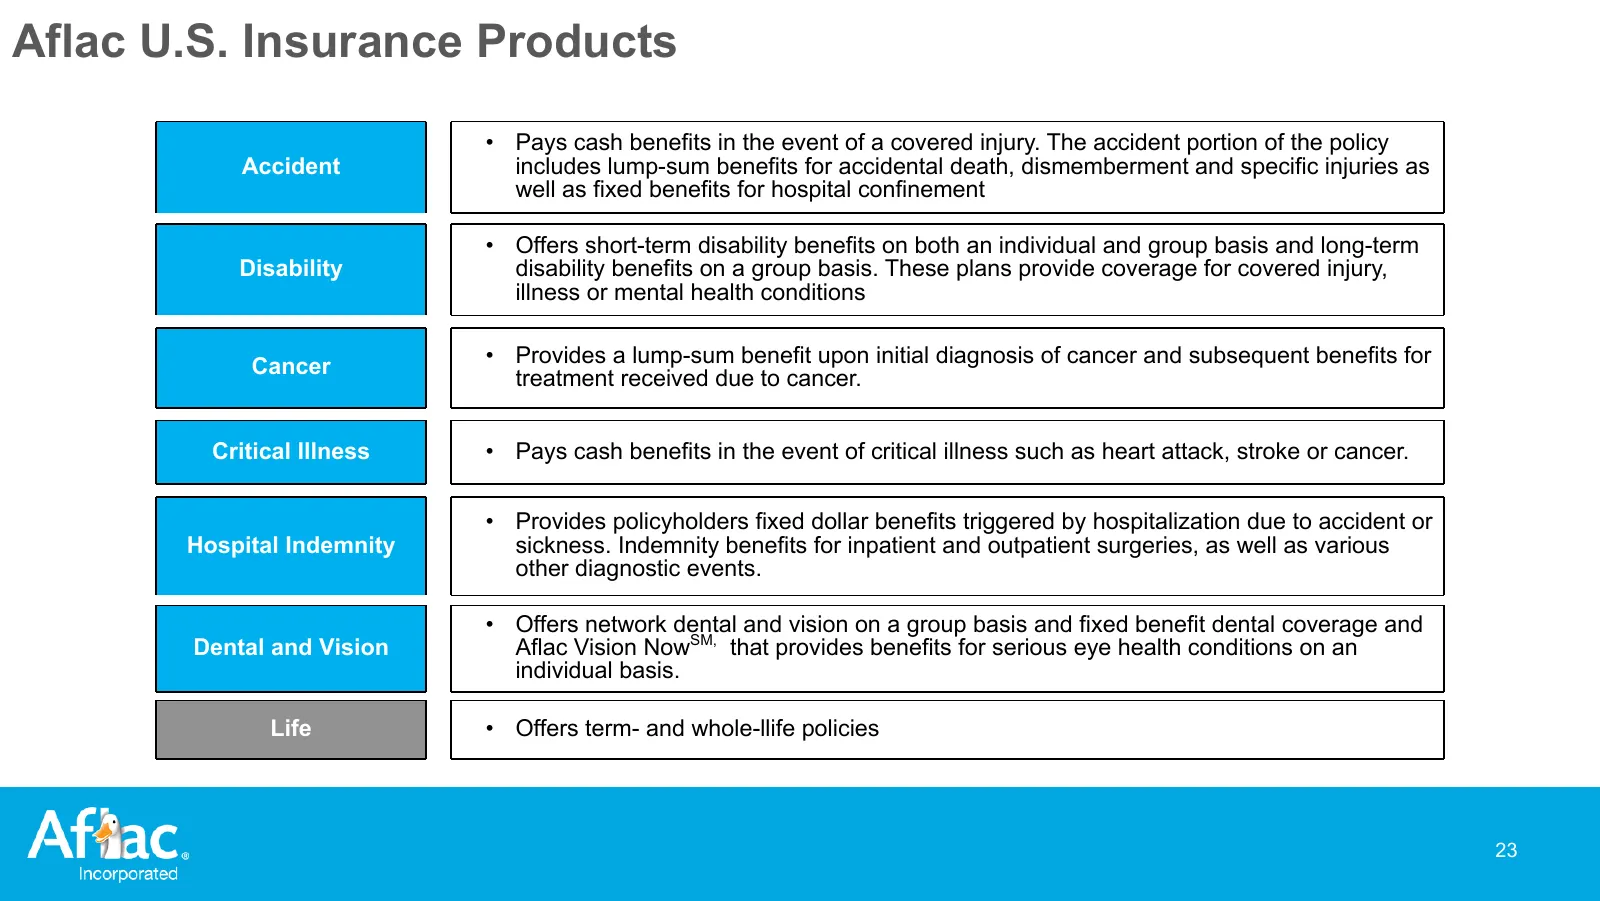
Aflac U.S. Insurance Products • Pays cash benefits in the event of a covered injury. The accident portion of the policy Accident includes lump-sum benefits for accidental death, dismemberment and specific injuries as well as fixed benefits for hospital confinement • Offers short-term disability bene
Slide 24: Aflac Middle Market Loan Portfolio
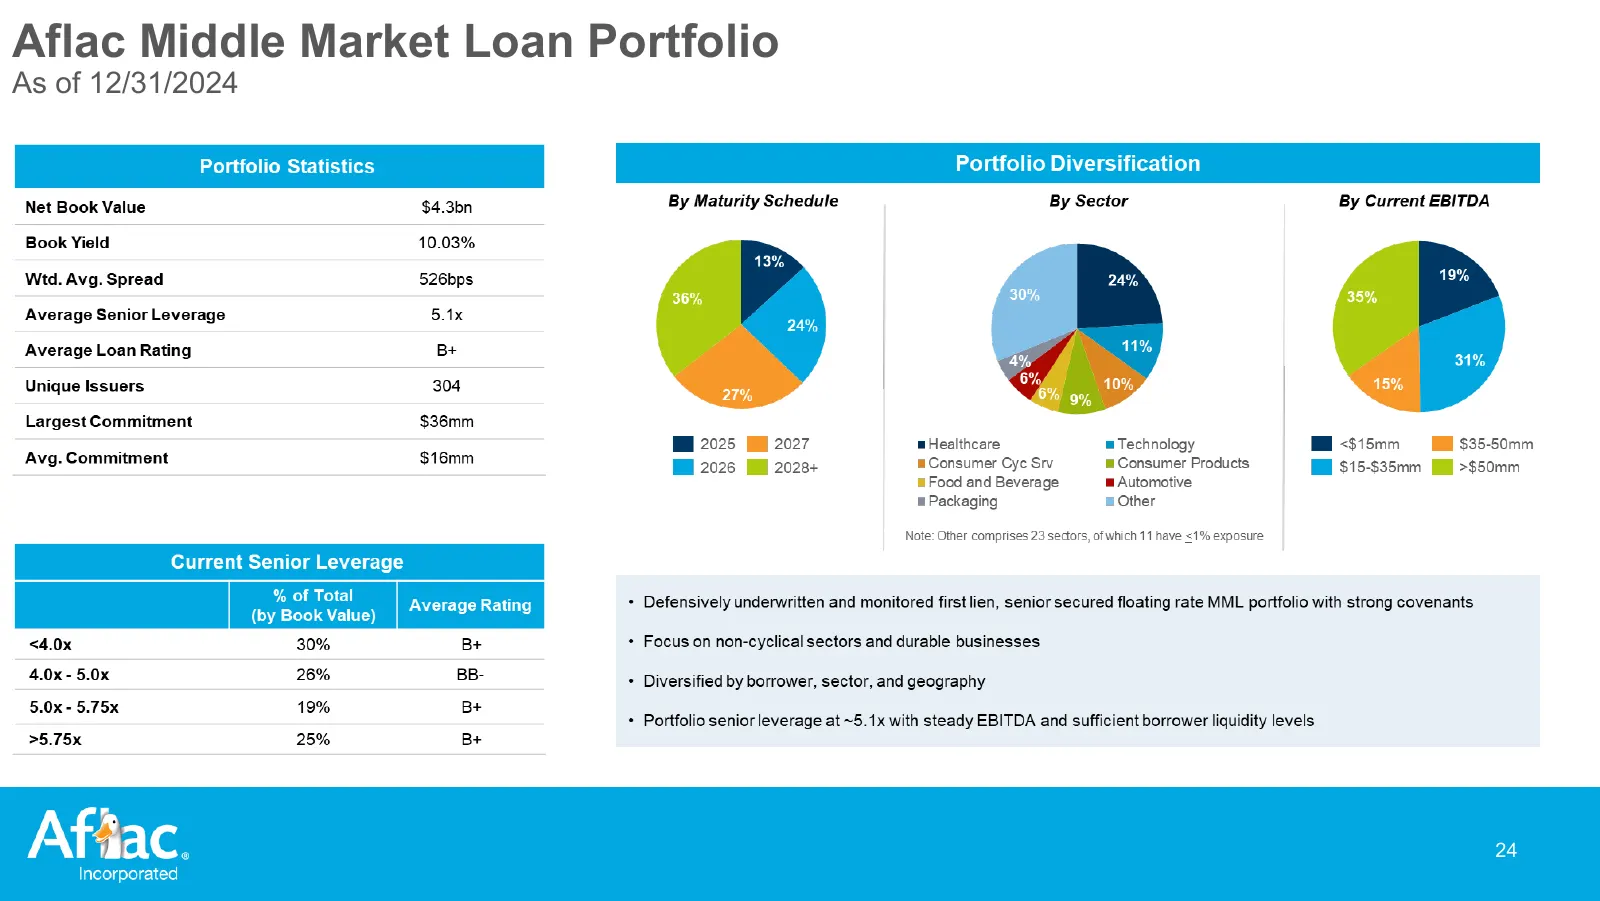
Aflac Middle Market Loan Portfolio As of 12/31/2024 24
Slide 25: Glossary of Non-U.S. GAAP Measures
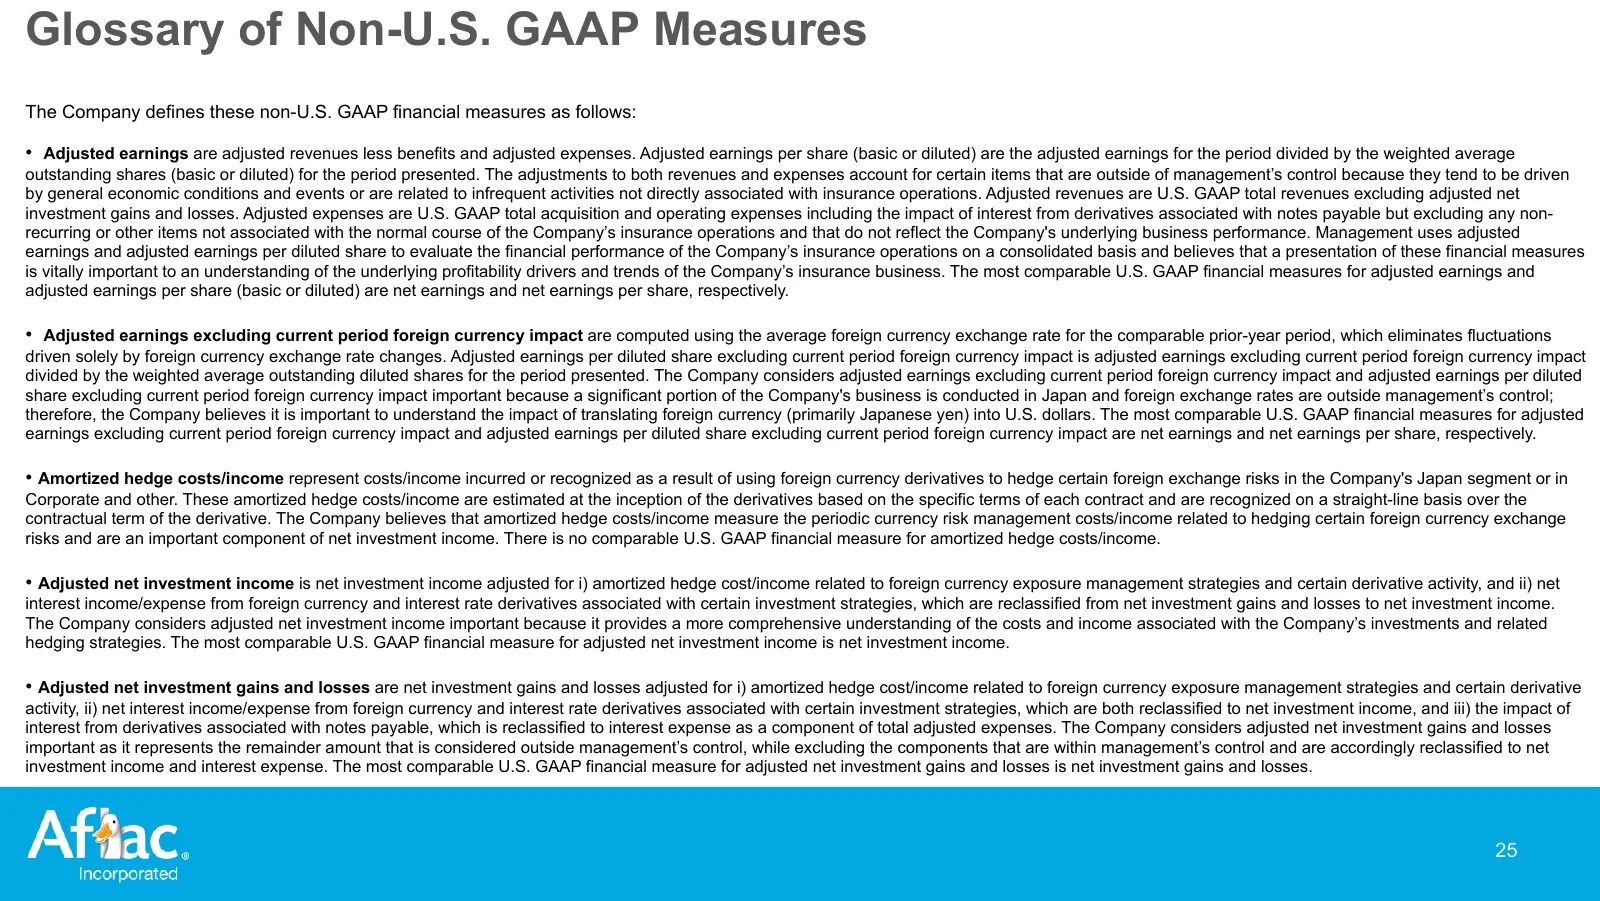
Glossary of Non-U.S. GAAP Measures The Company defines these non-U.S. GAAP financial measures as follows: • Adjusted earnings are adjusted revenues less benefits and adjusted expenses. Adjusted earnings per share (basic or diluted) are the adjusted earnings for the period divided by the weighted ave
Slide 26: Glossary of Non-U.S. GAAP Measures
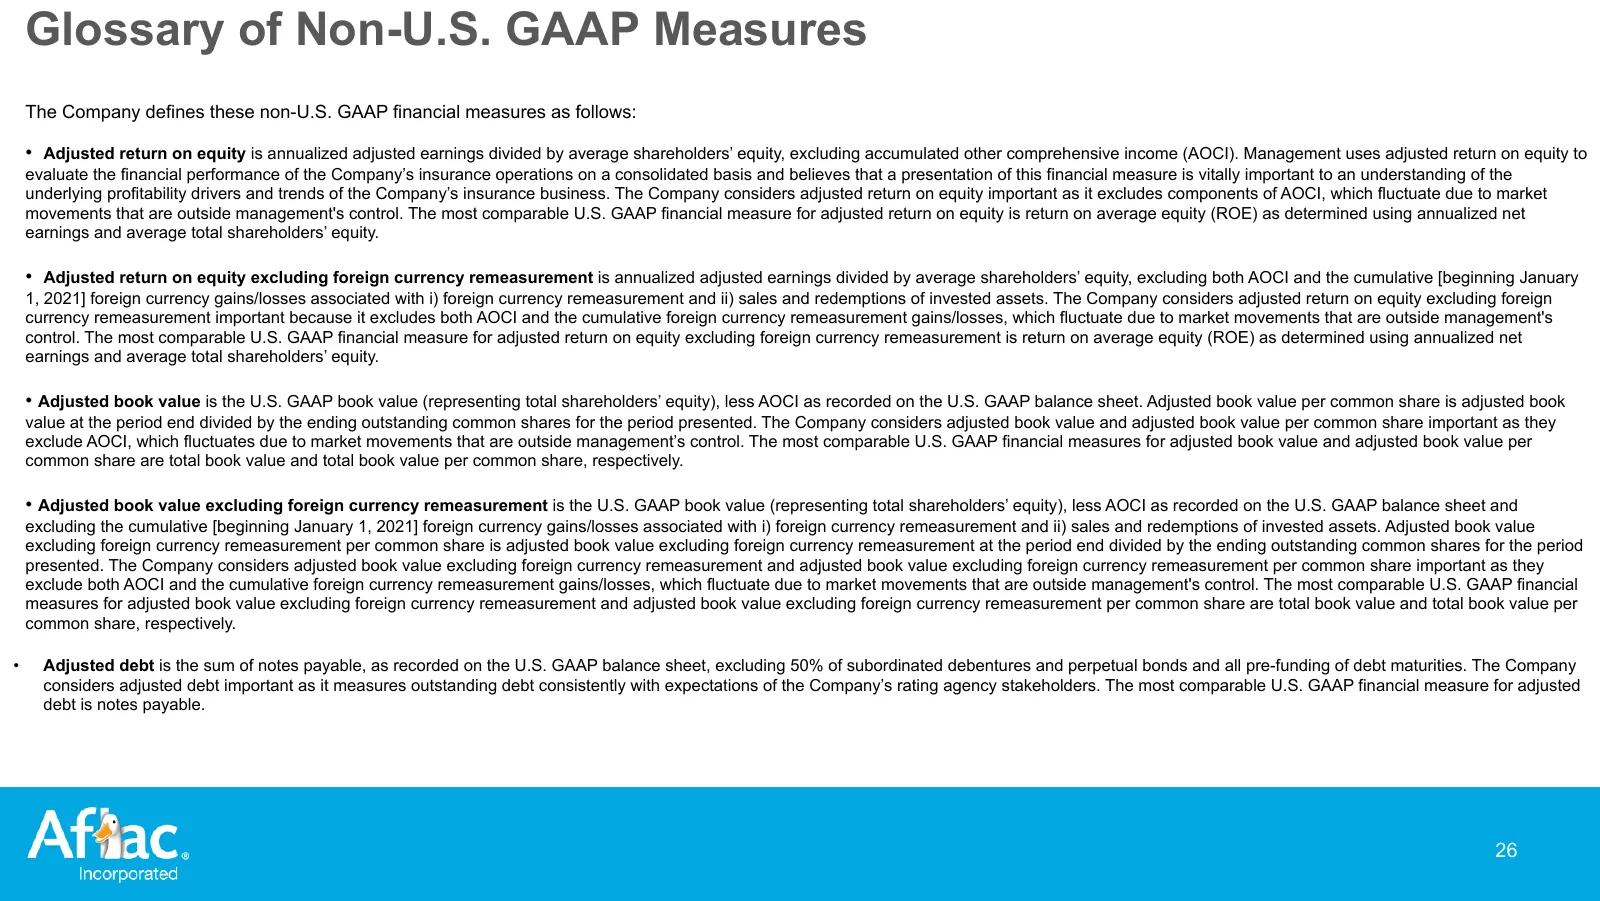
Glossary of Non-U.S. GAAP Measures The Company defines these non-U.S. GAAP financial measures as follows: • Adjusted return on equity is annualized adjusted earnings divided by average shareholders’ equity, excluding accumulated other comprehensive income (AOCI). Management uses adjusted return on e
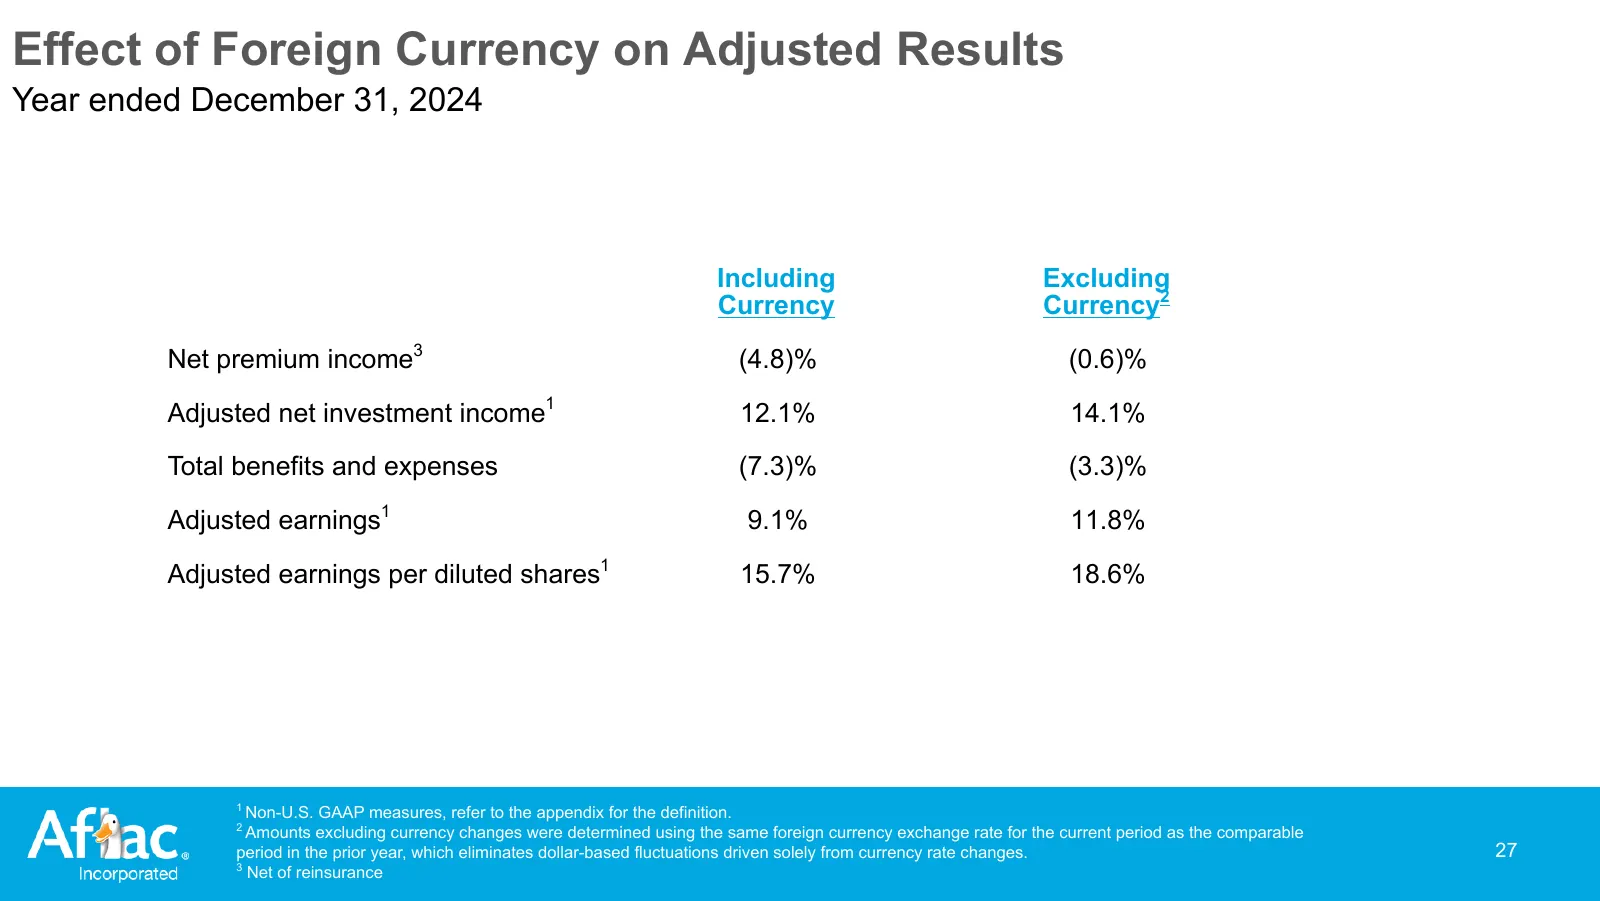
Slide 27: Effect of Foreign Currency on Adjusted Results
Effect of Foreign Currency on Adjusted Results Year ended December 31, 2024 Including Excluding Currency Currency2 Net premium income3 (4.8)% (0.6)% Adjusted net investment income1 12.1% 14.1% Total benefits and expenses (7.3)% (3.3)% Adjusted earnings1 9.1% 11.8% Adjusted earnings per diluted share
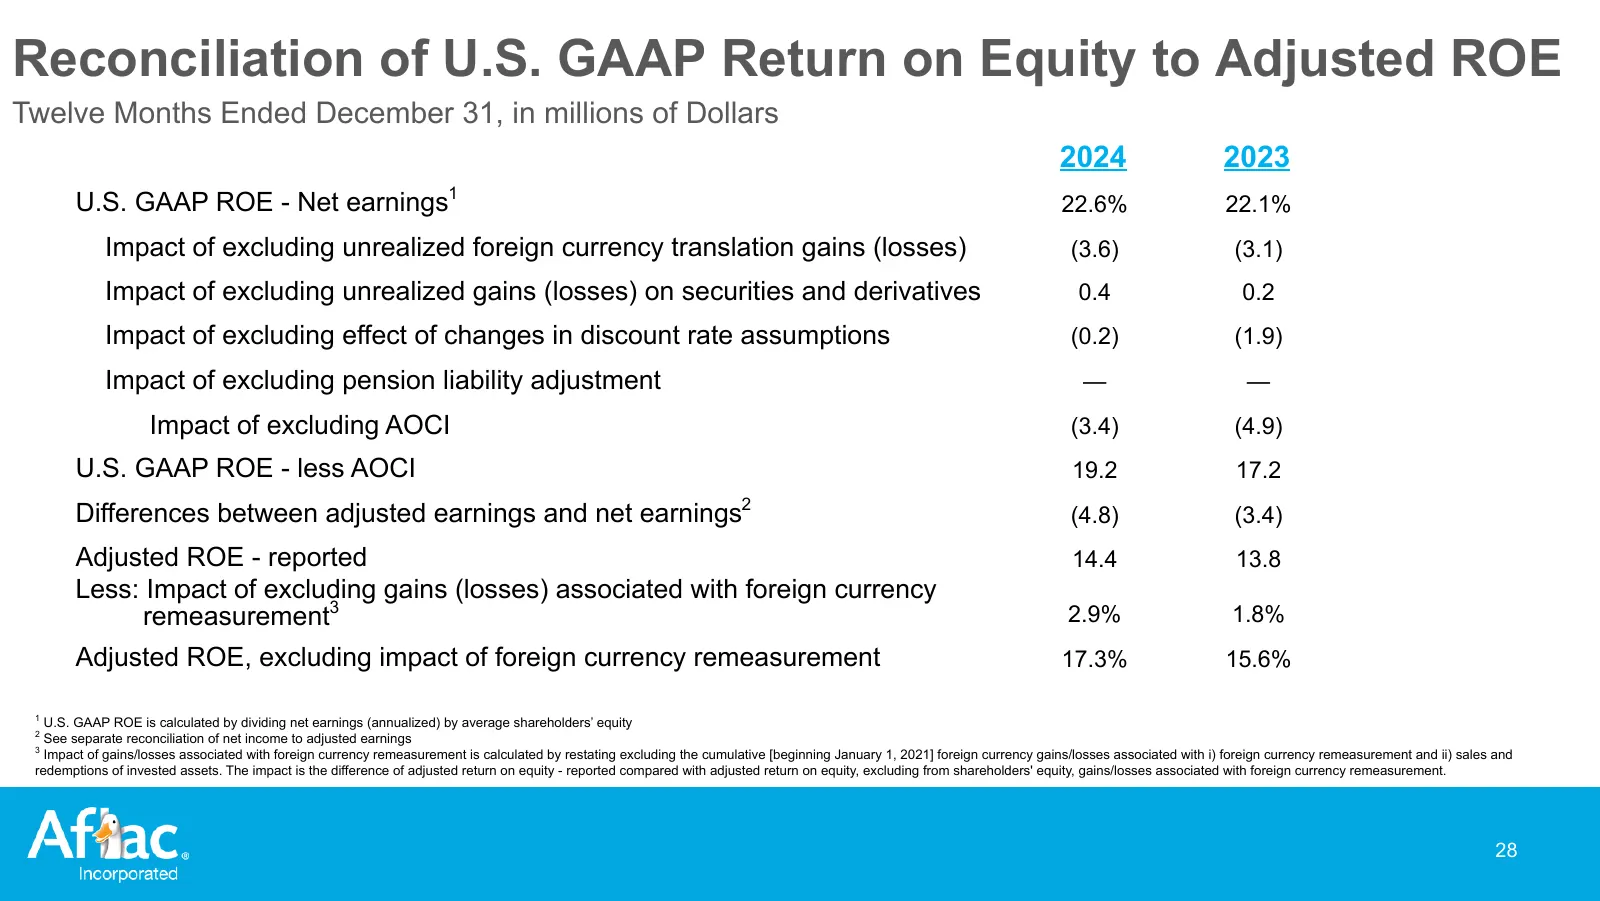
Slide 28: Reconciliation of U.S. GAAP Return on Equity to Adjusted ROE
Reconciliation of U.S. GAAP Return on Equity to Adjusted ROE Twelve Months Ended December 31, in millions of Dollars 2024 2023 U.S. GAAP ROE - Net earnings1 22.6% 22.1% Impact of excluding unrealized foreign currency translation gains (losses) (3.6) (3.1) Impact of excluding unrealized gains (losses
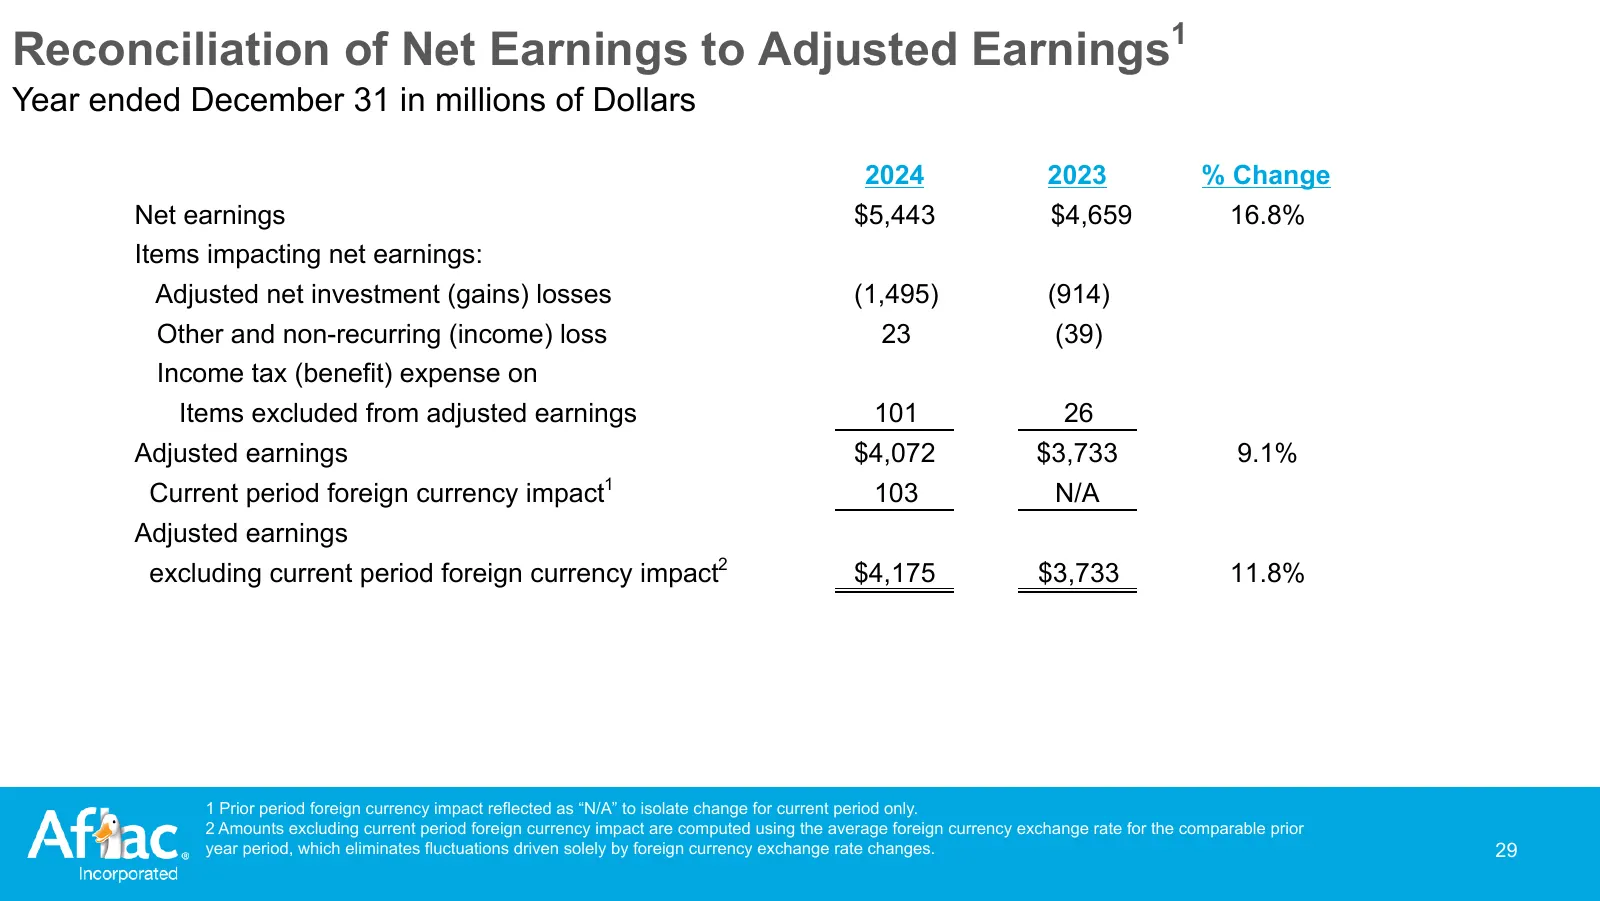
Slide 29: Reconciliation of Net Earnings to Adjusted Earnings
Reconciliation of Net Earnings to Adjusted Earnings1 Year ended December 31 in millions of Dollars 2024 2023 % Change Net earnings $5,443 $4,659 16.8% Items impacting net earnings: Adjusted net investment (gains) losses (1,495) (914) Other and non-recurring (income) loss 23 (39) Income tax (benefit)
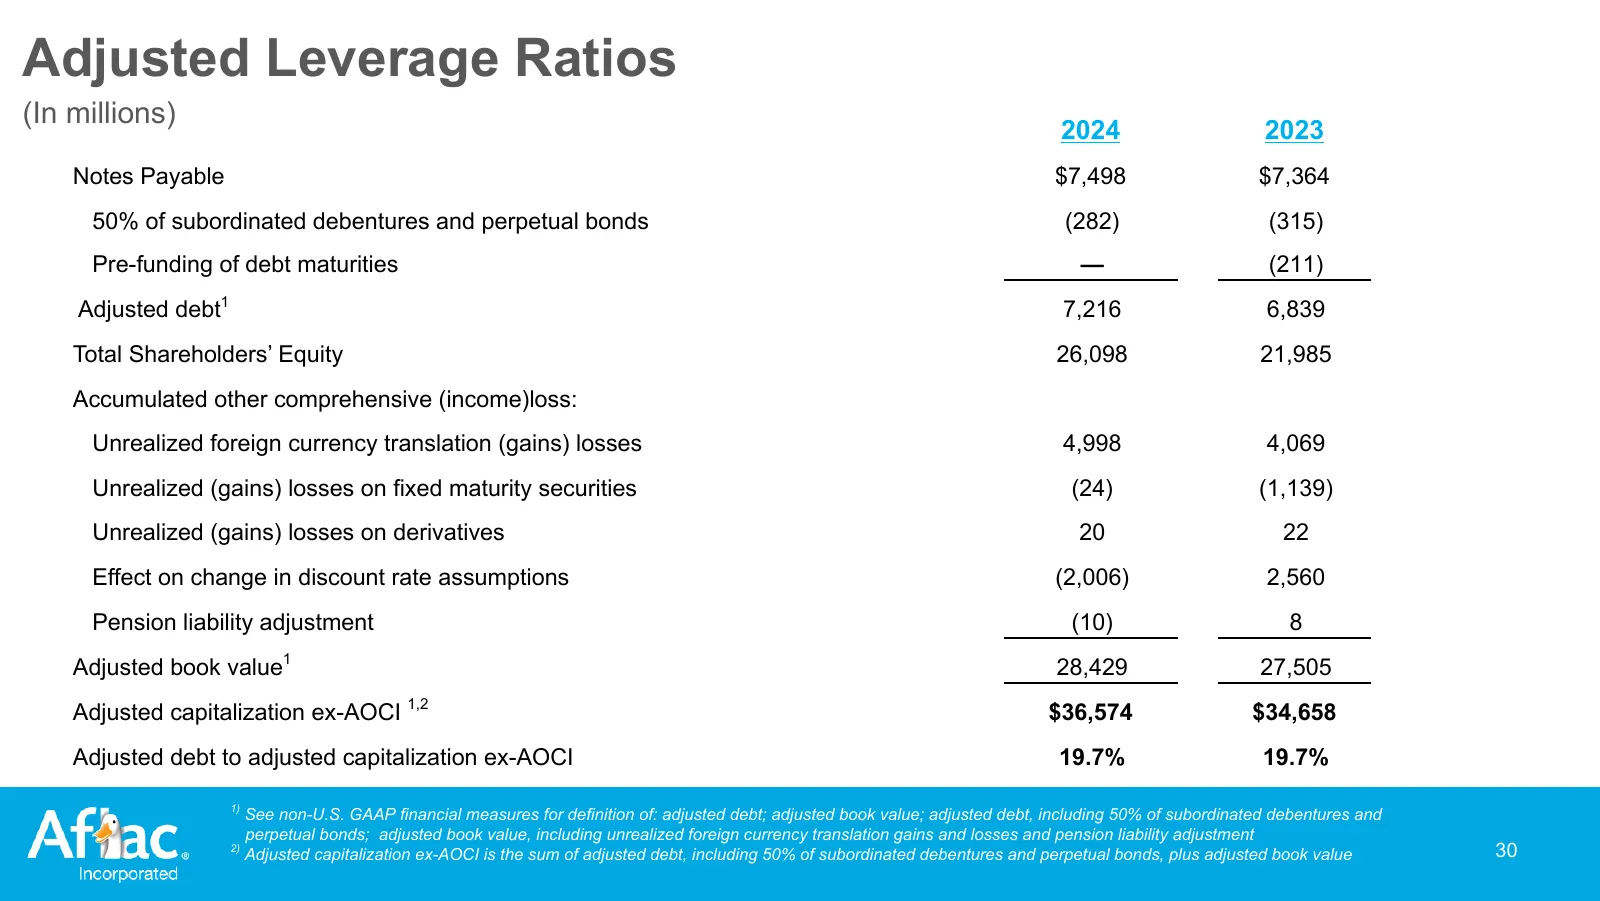
Slide 30: Adjusted Leverage Ratios
Adjusted Leverage Ratios (In millions) 2024 2023 Notes Payable $7,498 $7,364 50% of subordinated debentures and perpetual bonds (282) (315) Pre-funding of debt maturities — (211) Adjusted debt1 7,216 6,839 Total Shareholders’ Equity 26,098 21,985 Accumulated other comprehensive (income)loss: Unreali
Source: Internet Archive copy of s24.q4cdn.com
More decks from AFLAC Incorporated
 Q3 2026 Earnings Presentation20 slides · Nov 4, 2026
 Q2 2026 Earnings Presentation32 slides · Aug 7, 2026
 Q2 2026 Earnings Presentation20 slides · Aug 6, 2026
 Q1 2026 Earnings Presentation20 slides · Apr 30, 2026
 Q4 2025 Earnings Presentation23 slides · Feb 5, 2026
 Q3 2025 Earnings Presentation21 slides · Nov 5, 2025