Aberdeen Group plc · LSE:ABDN
Aberdeen — Standard Life Investments — Investor Presentation (July 2012)
26 slides from Aberdeen's investor presentation, July 2012

Slide 1: Global Absolute Return Strategies
Global Absolute Return Strategies This document is intended for investment professionals only and must not be relied upon or used by retail clients
Slide 2: Agenda
Agenda • Standard Life Investments • The Global Absolute Return Strategies Fund (GARS) Objectives Process Structure Risk Management Opportunity and outlook • Q&A 2 Global Absolute Return Strategies | July 2012
Slide 3: Standard Life Investments Worldwide
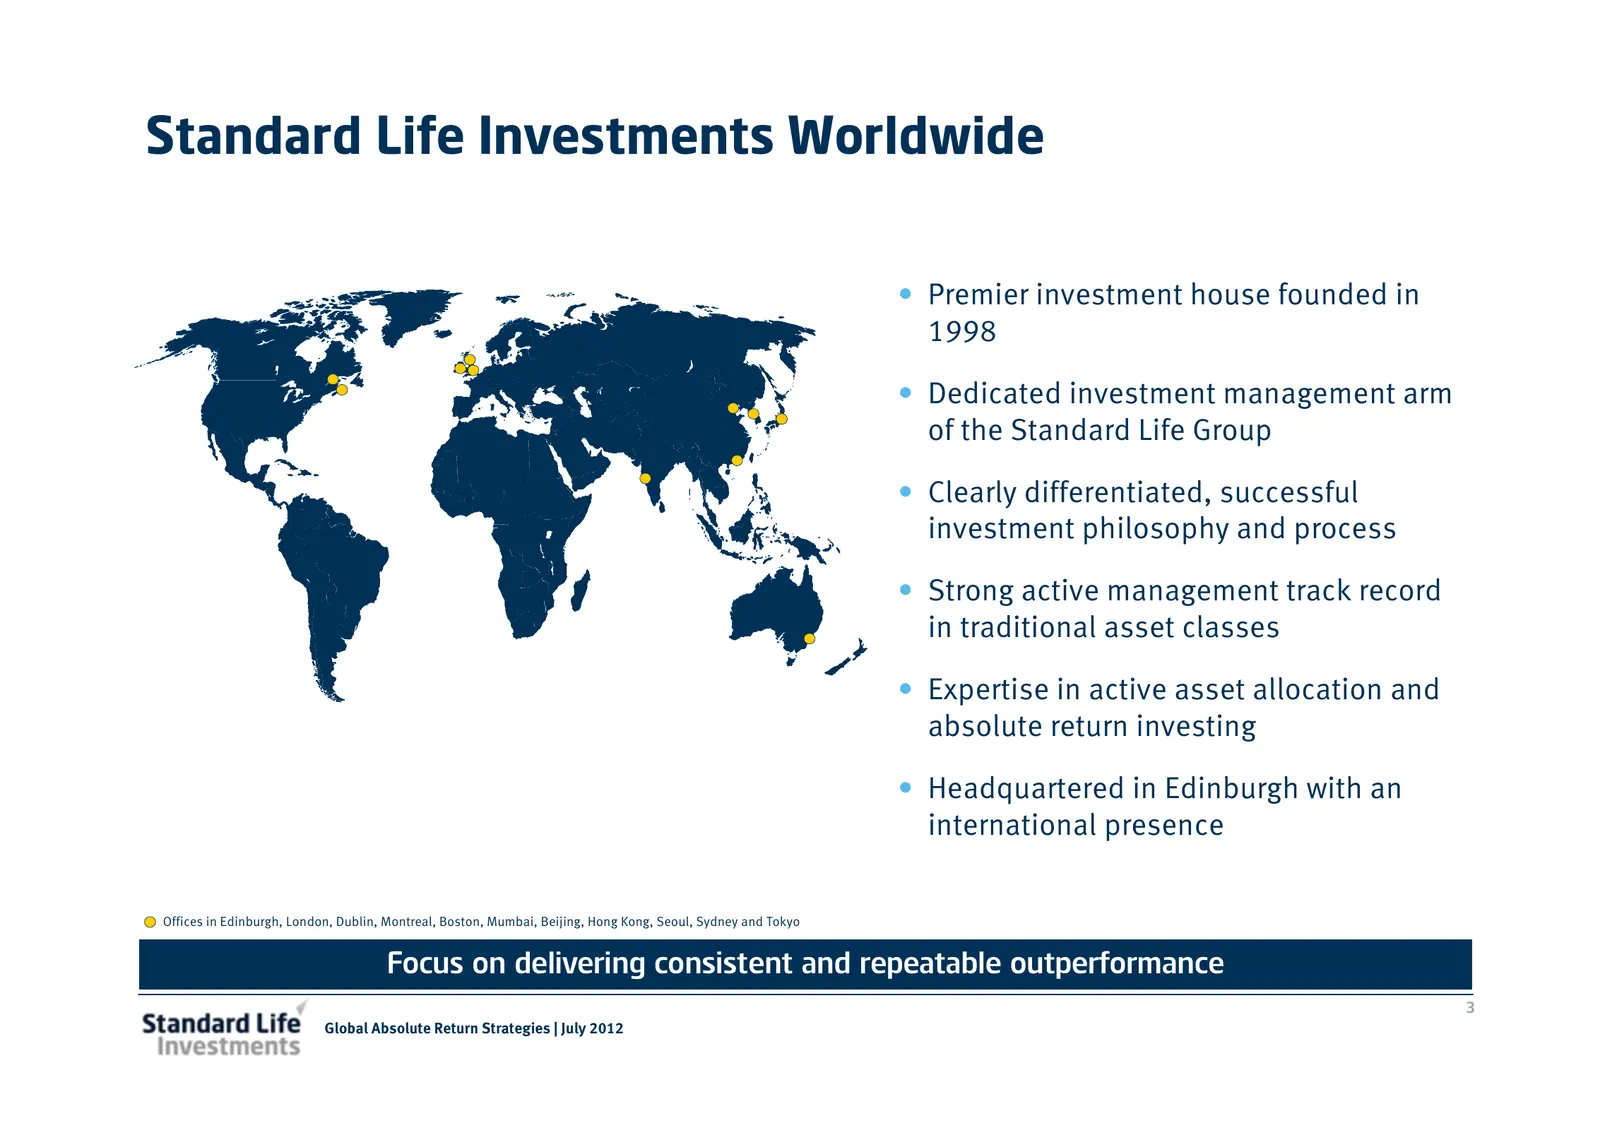
Standard Life Investments Worldwide • Premier investment house founded in 1998 • Dedicated investment management arm of the Standard Life Group • Clearly differentiated, successful investment philosophy and process • Strong active management track record in traditional asset classes • Expertise in a
Slide 4: Standard Life Investments AUM
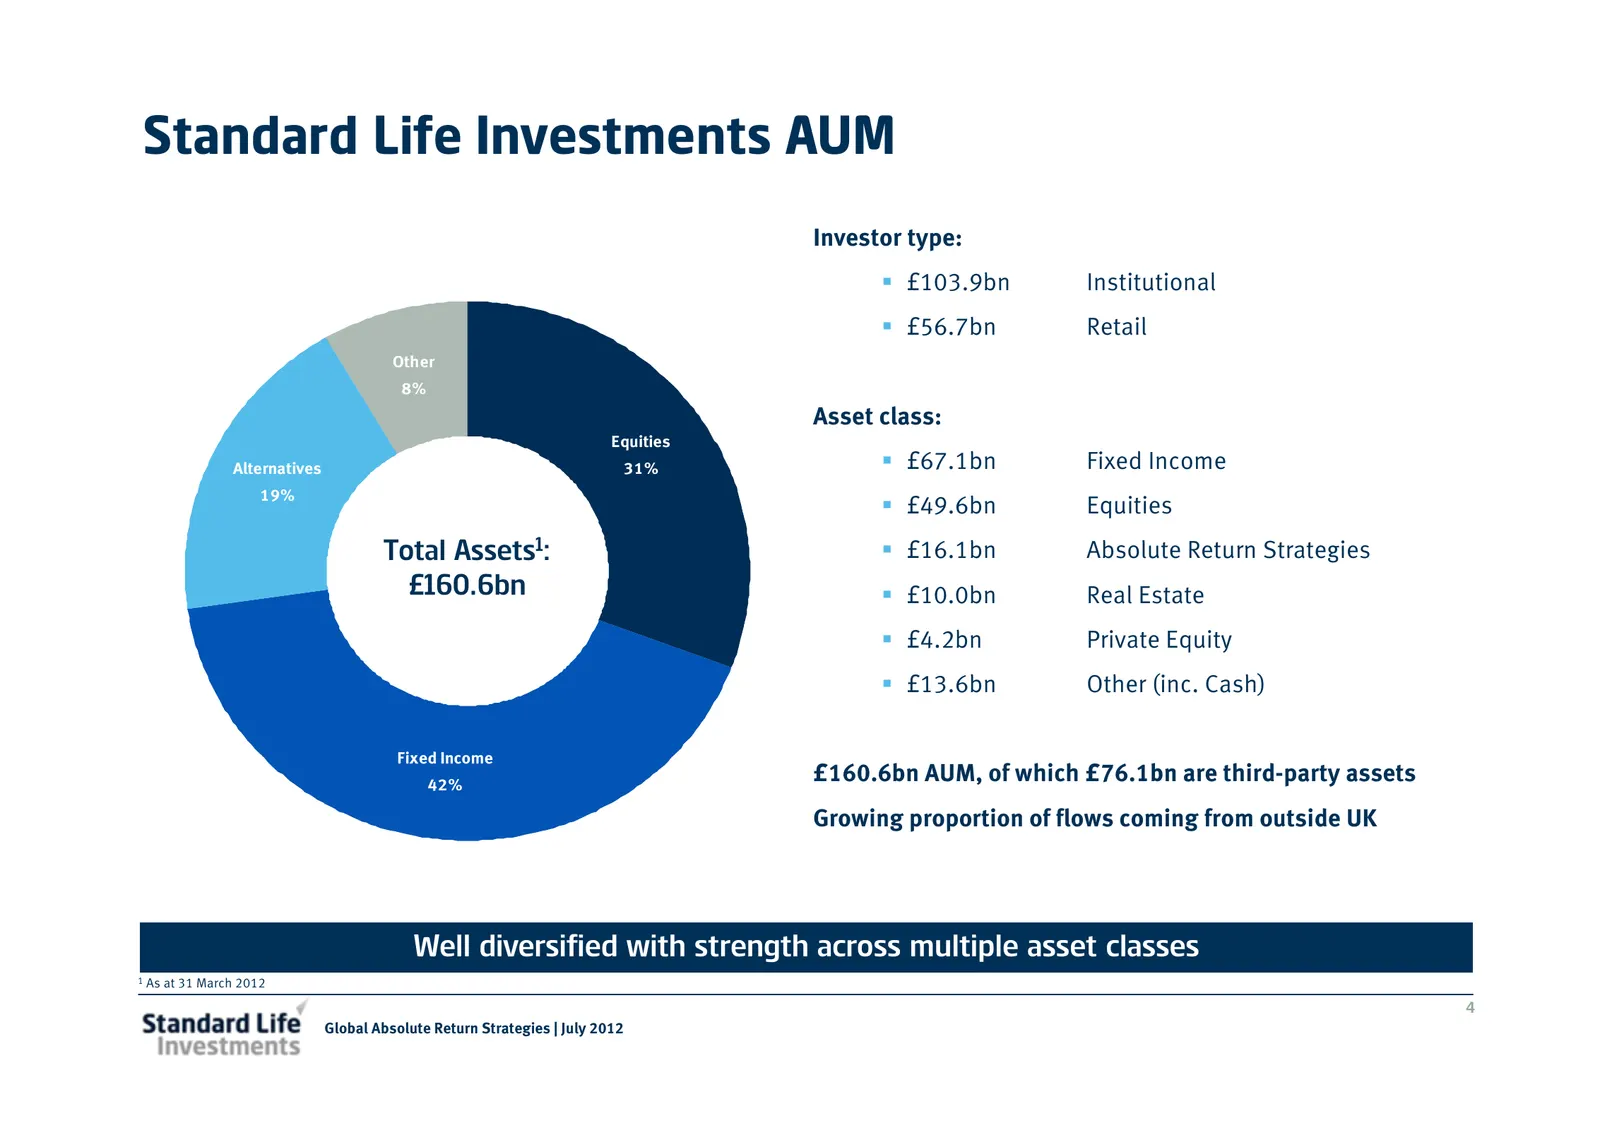
Standard Life Investments AUM Investor type: £103.9bn Institutional £56.7bn Retail Other 8% Asset class: Equities Alternatives 31% £67.1bn Fixed Income 19% £49.6bn Equities Total Assets1: £16.1bn Absolute Return Strategies £160.6bn £10.0bn Real Estate £4.2bn Private Equity £13.6bn Other (inc. Cash)
Slide 5: The Genesis of GARS
The Genesis of GARS • GARS aims to deliver a positive return regardless of market conditions with low risk – ‘you can’t eat relative returns’ In adverse market conditions, clients were disappointed with benchmark outperformance as the overall value of investment fell • In 2005 the £1bn Standard Life
Slide 6: The GARS framework
The GARS framework Objective: • Cash1 +5% per year (gross) performance target over rolling 3 year periods • Expected annualised volatility range of between 4% - 8% Key Investment Themes: • Time Frame: 3 year investment outlook • Captures return more consistently from demonstrable market inefficienci
Slide 7: Drawing on expertise from across the business
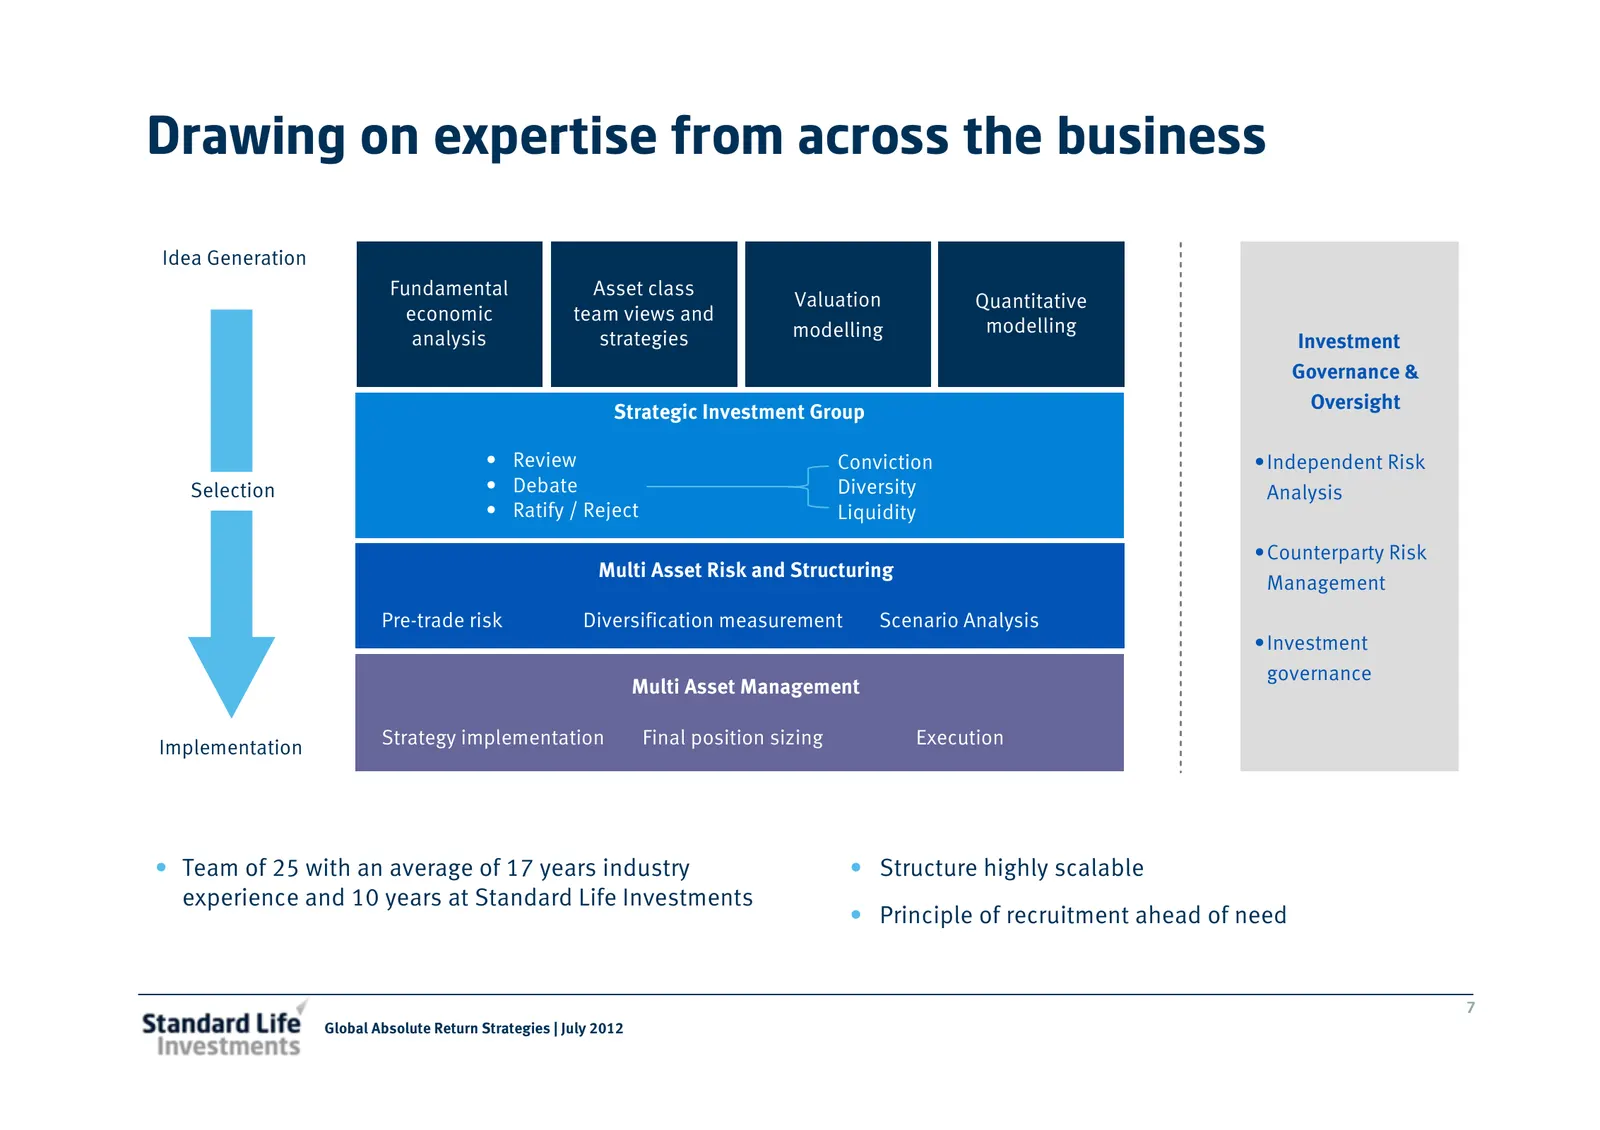
Drawing on expertise from across the business Idea Generation Fundamental Asset class Valuation Quantitative economic team views and modelling modelling analysis strategies Investment Governance & Strategic Investment Group Oversight • Review Conviction •Independent Risk Selection • Debate Diversity
Slide 8: Broad diversified investment approach
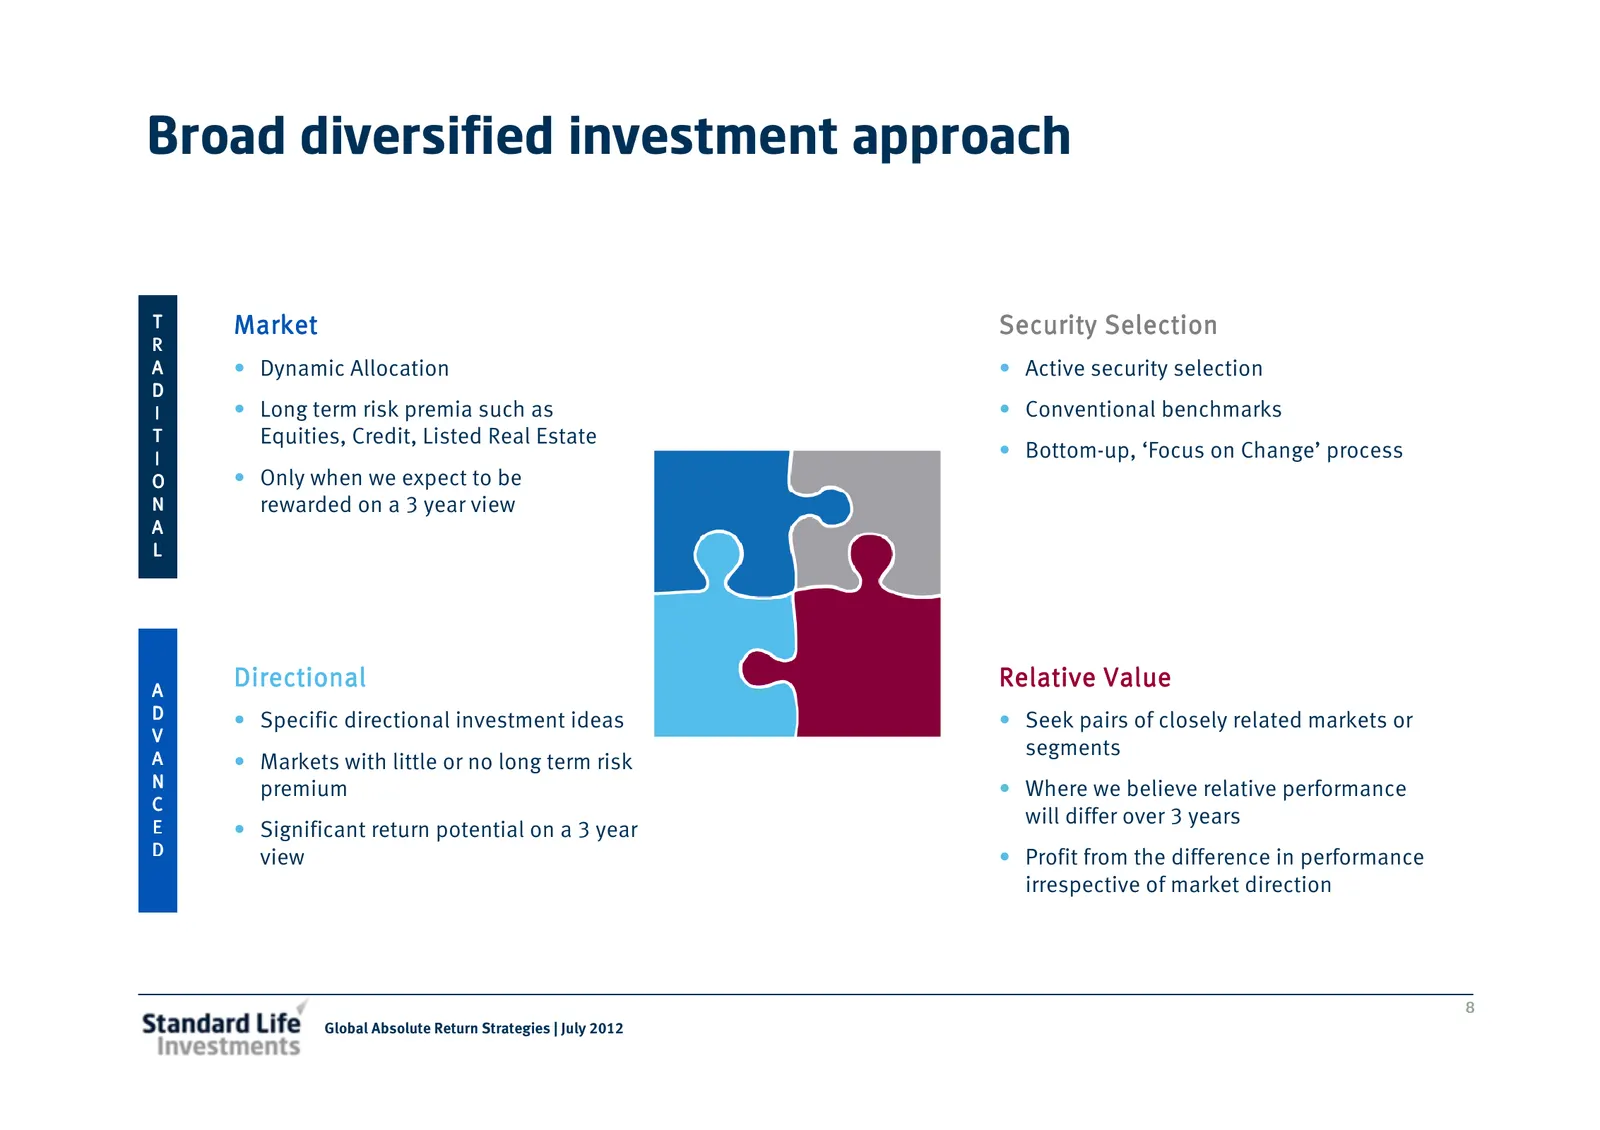
Broad diversified investment approach T Market Security Selection R A • Dynamic Allocation • Active security selection D I • Long term risk premia such as • Conventional benchmarks T Equities, Credit, Listed Real Estate I • Bottom-up, ‘Focus on Change’ process O • Only when we expect to be N rewarde
Slide 9: High returns with low volatility
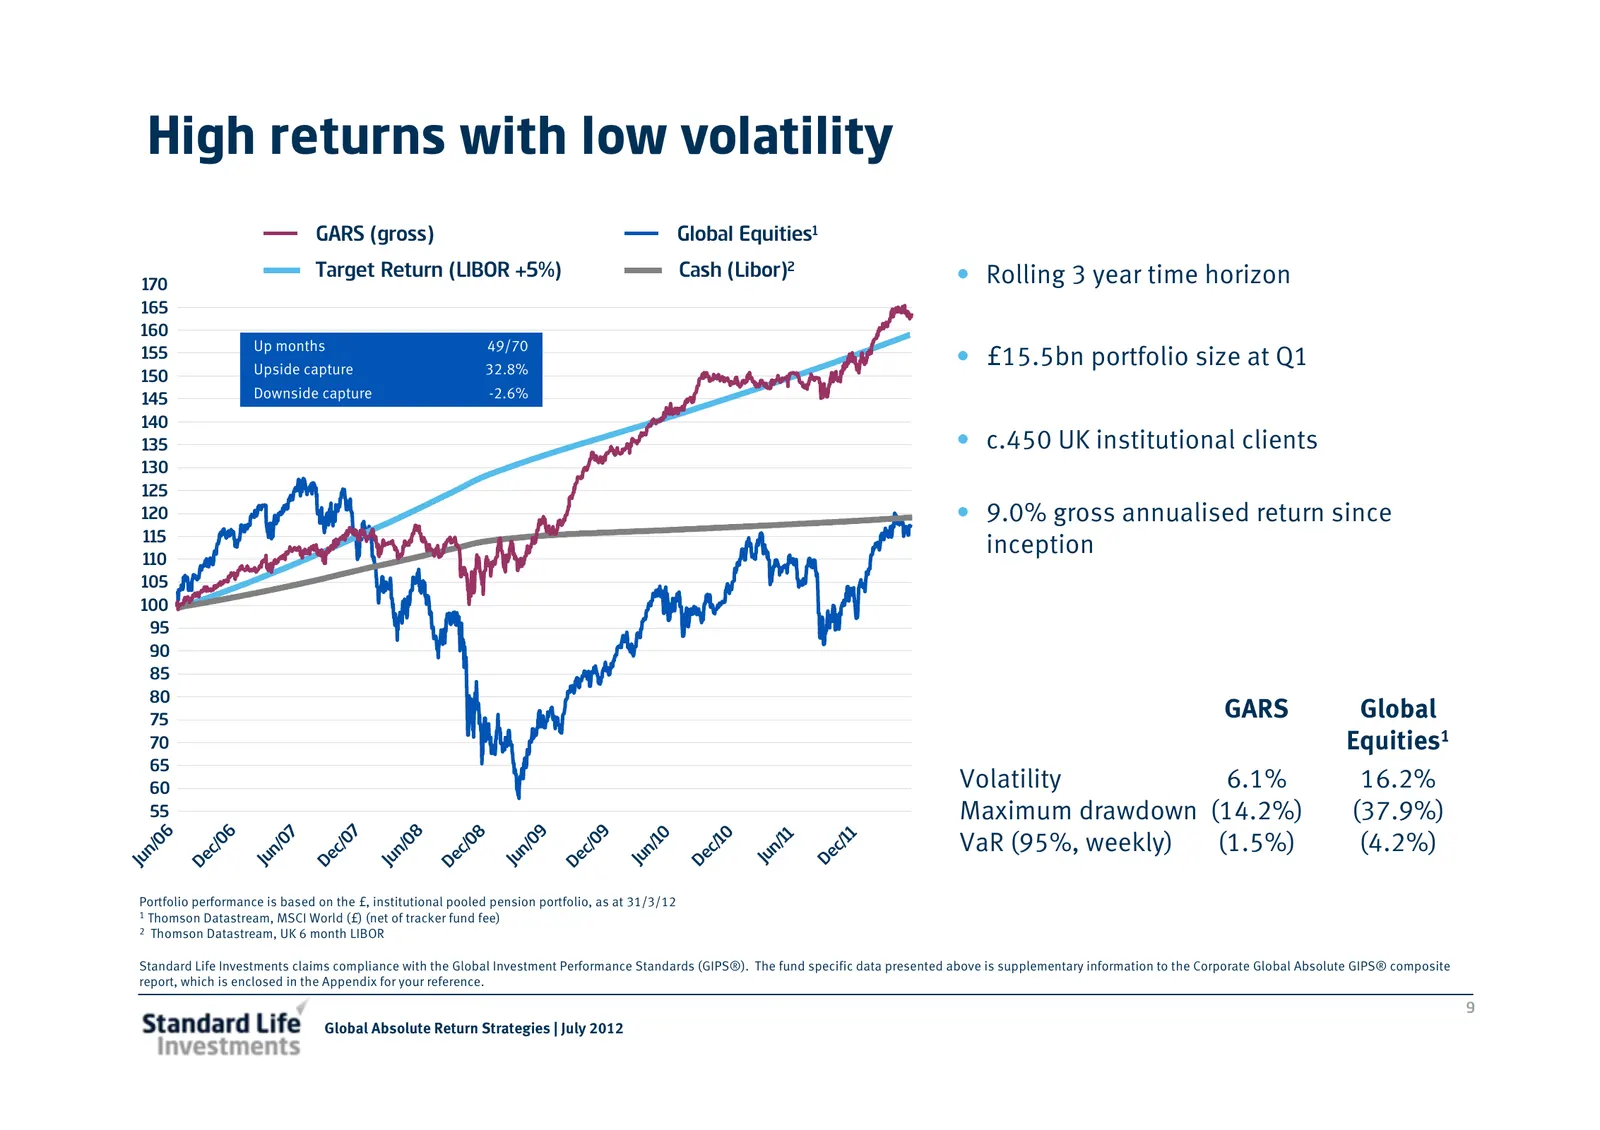
High returns with low volatility GARS (gross) Global Equities1 Target Return (LIBOR +5%) Cash (Libor)2 • Rolling 3 year time horizon 170 165 160 Up months 49/70 155 Upside capture 32.8% • £15.5bn portfolio size at Q1 150 145 Downside capture -2.6% 140 135 • c.450 UK institutional clients 130 125 120
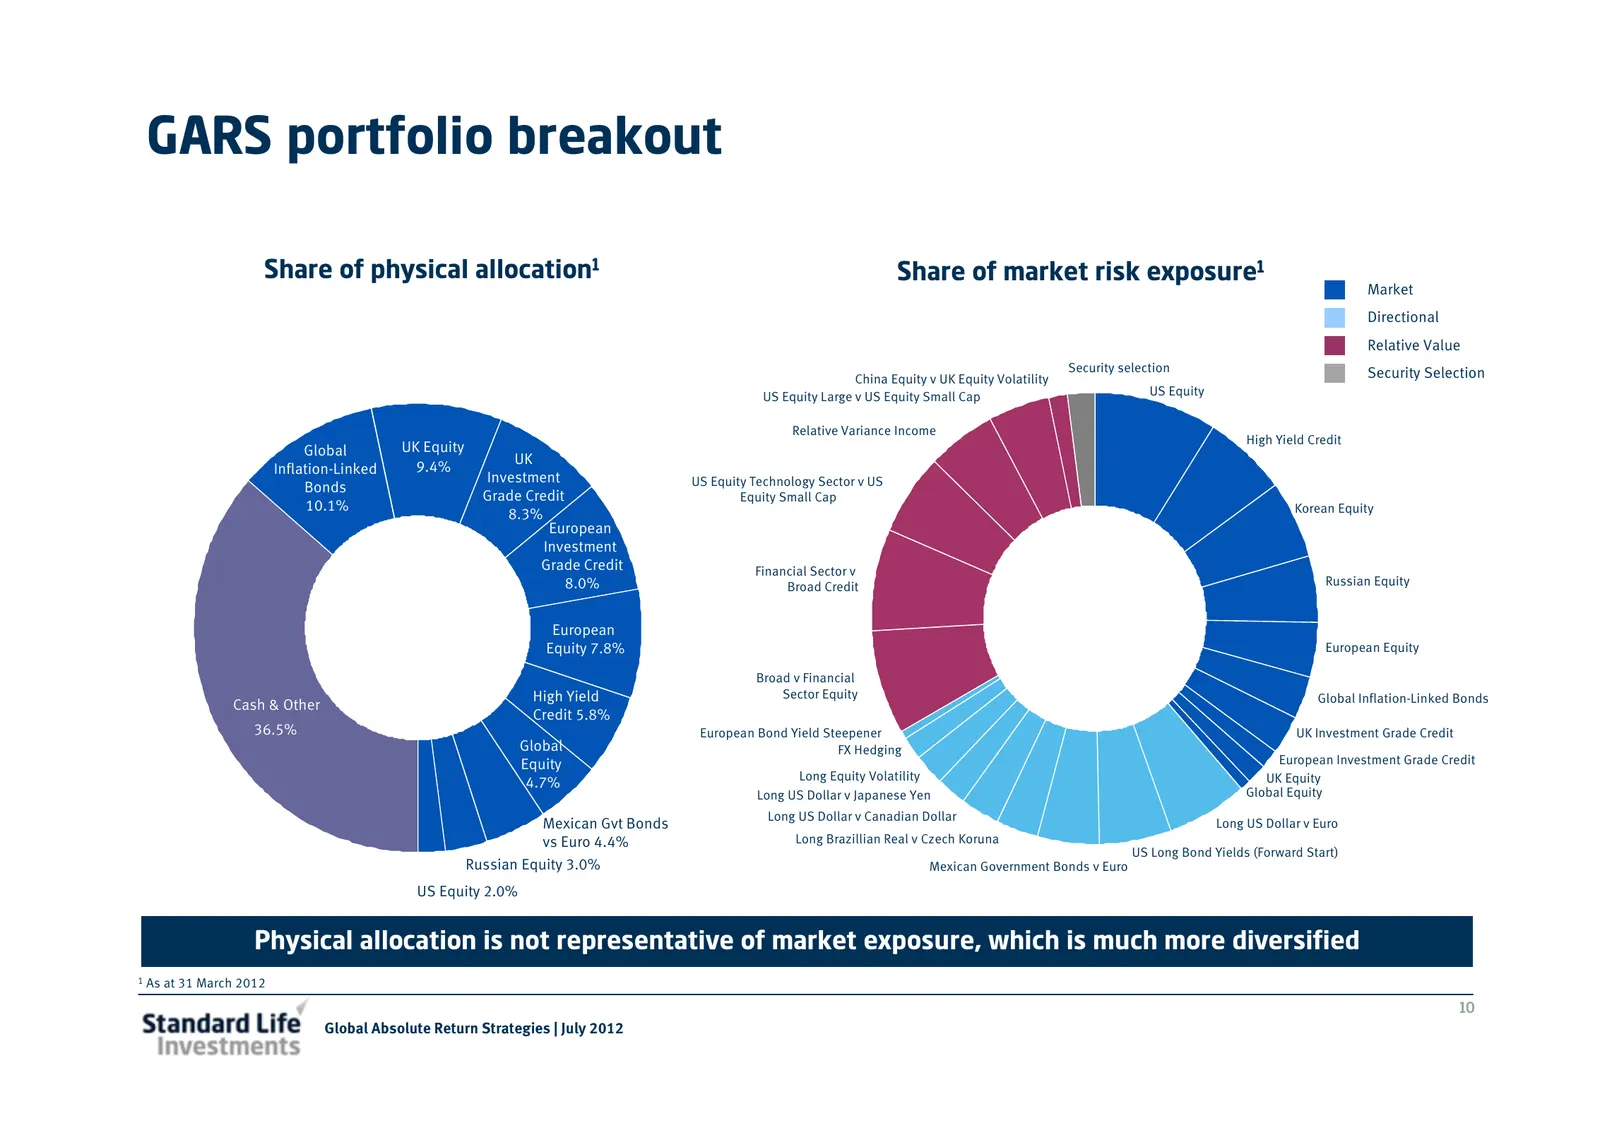
Slide 10: GARS portfolio breakout
GARS portfolio breakout Share of physical allocation1 Share of market risk exposure1 Market Directional Relative Value Security selection Security Selection China Equity v UK Equity Volatility US Equity Large v US Equity Small Cap US Equity Relative Variance Income High Yield Credit Global UK Equity
Slide 11: Risk management
Risk management 1. Independent risk modelling (ex-ante risk) • Daily risk reporting • Pre-trade risk analysis 2. Scenario analysis • Historical extreme events • Future extreme events modelled internally 3. Realised volatility based on performance (ex-post risk) • Tracking realised against modelled v
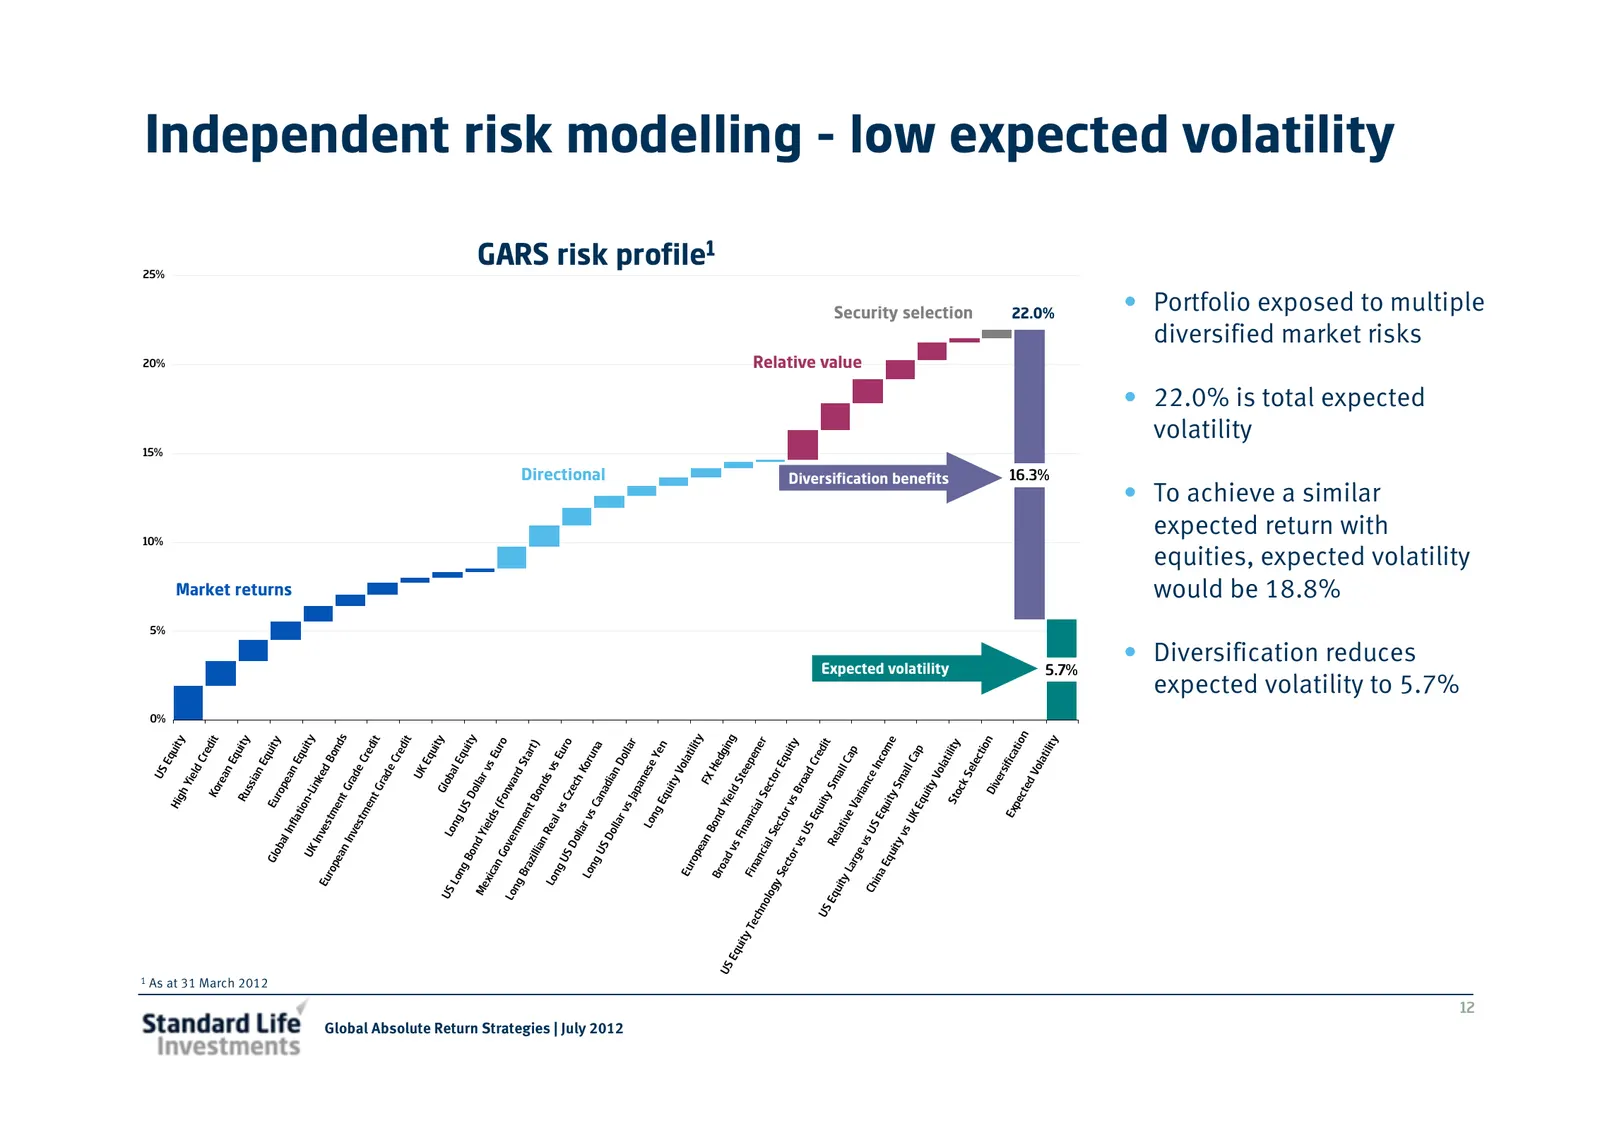
Slide 12: Independent risk modelling - low expected volatility
15% 10% 25% 20% 5% 0% US Eq Hig uit h y Yie l dC red Ko it re an E qu Ru ity ssi an E 1 As at 31 March 2012 qu G lo Eu ity ba rop Market returns l In ea fla n t ion Eq uit UK ink -L y Inv ed Eu es rop tm Bo ea en nd nI tG s nv rad es eC tm red en tG it rad eC red it UK Eq uit G lo y US Lo ba Lo ng l
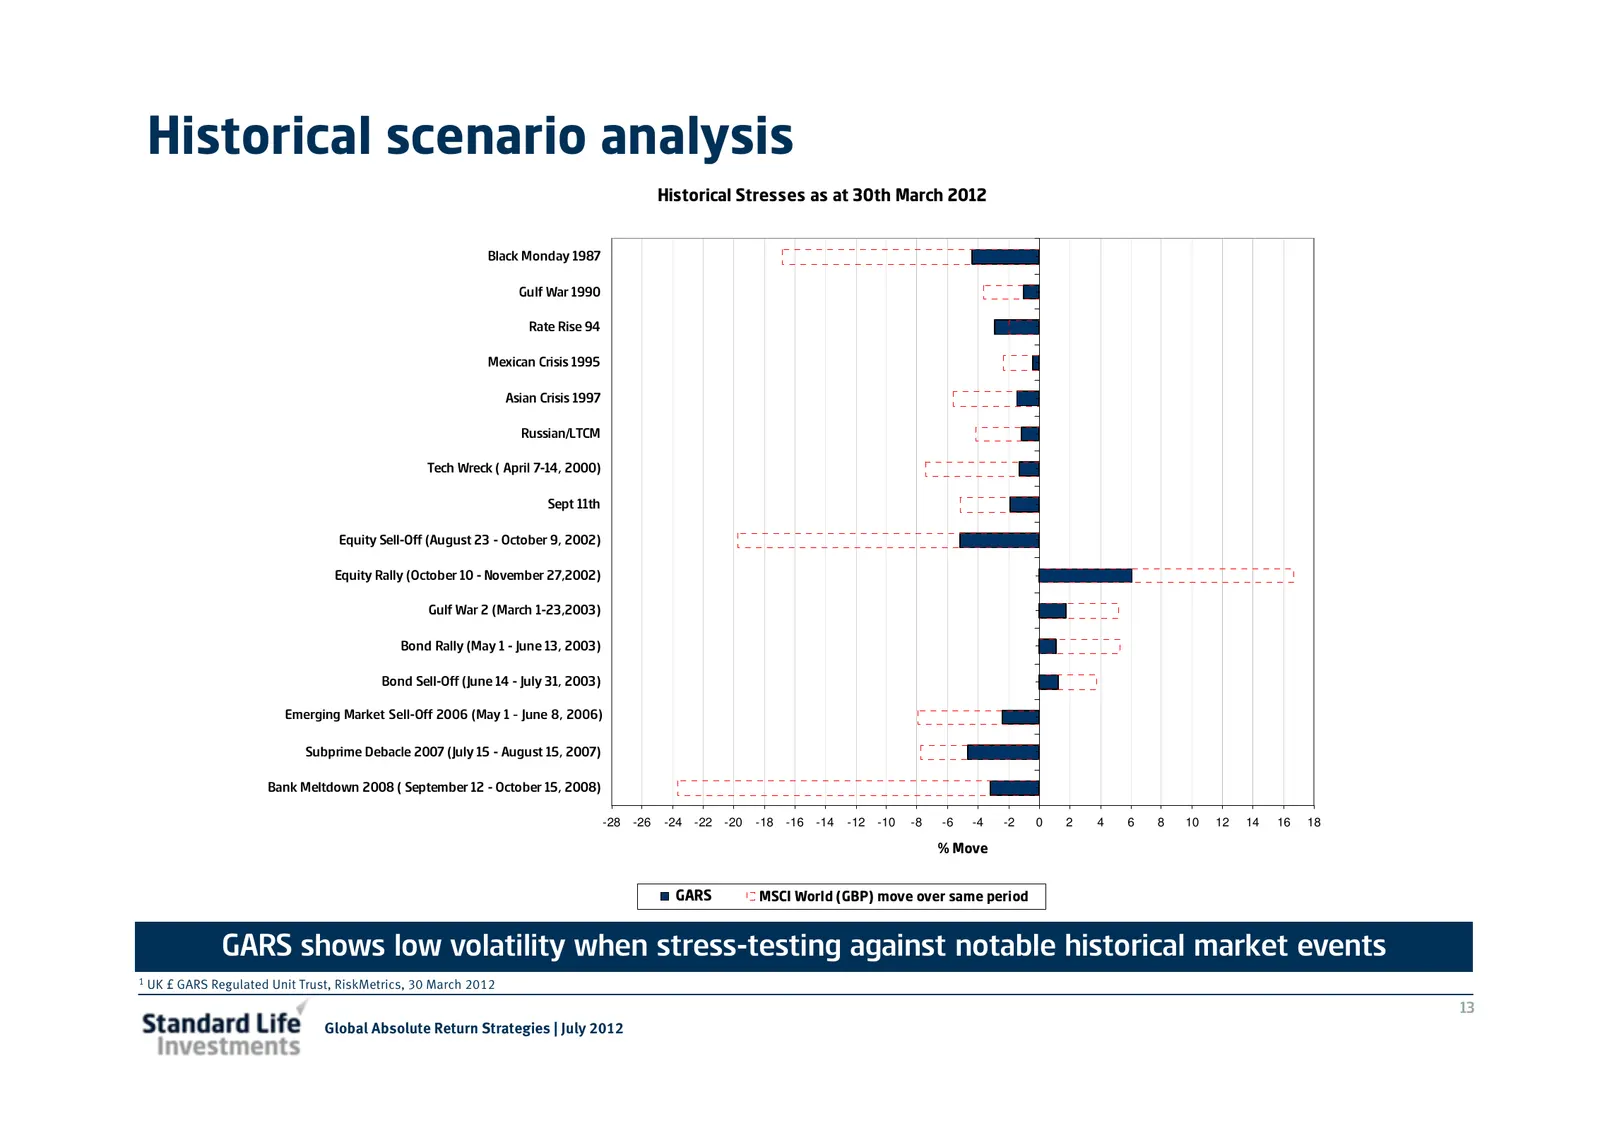
Slide 13: Historical scenario analysis
Historical scenario analysis U222 - Historical Stresses as at 30th March 2012 Black Monday 1987 Gulf War 1990 Rate Rise 94 Mexican Crisis 1995 Asian Crisis 1997 Russian/LTCM Tech Wreck ( April 7-14, 2000) Sept 11th Equity Sell-Off (August 23 - October 9, 2002) Equity Rally (October 10 - November 27,
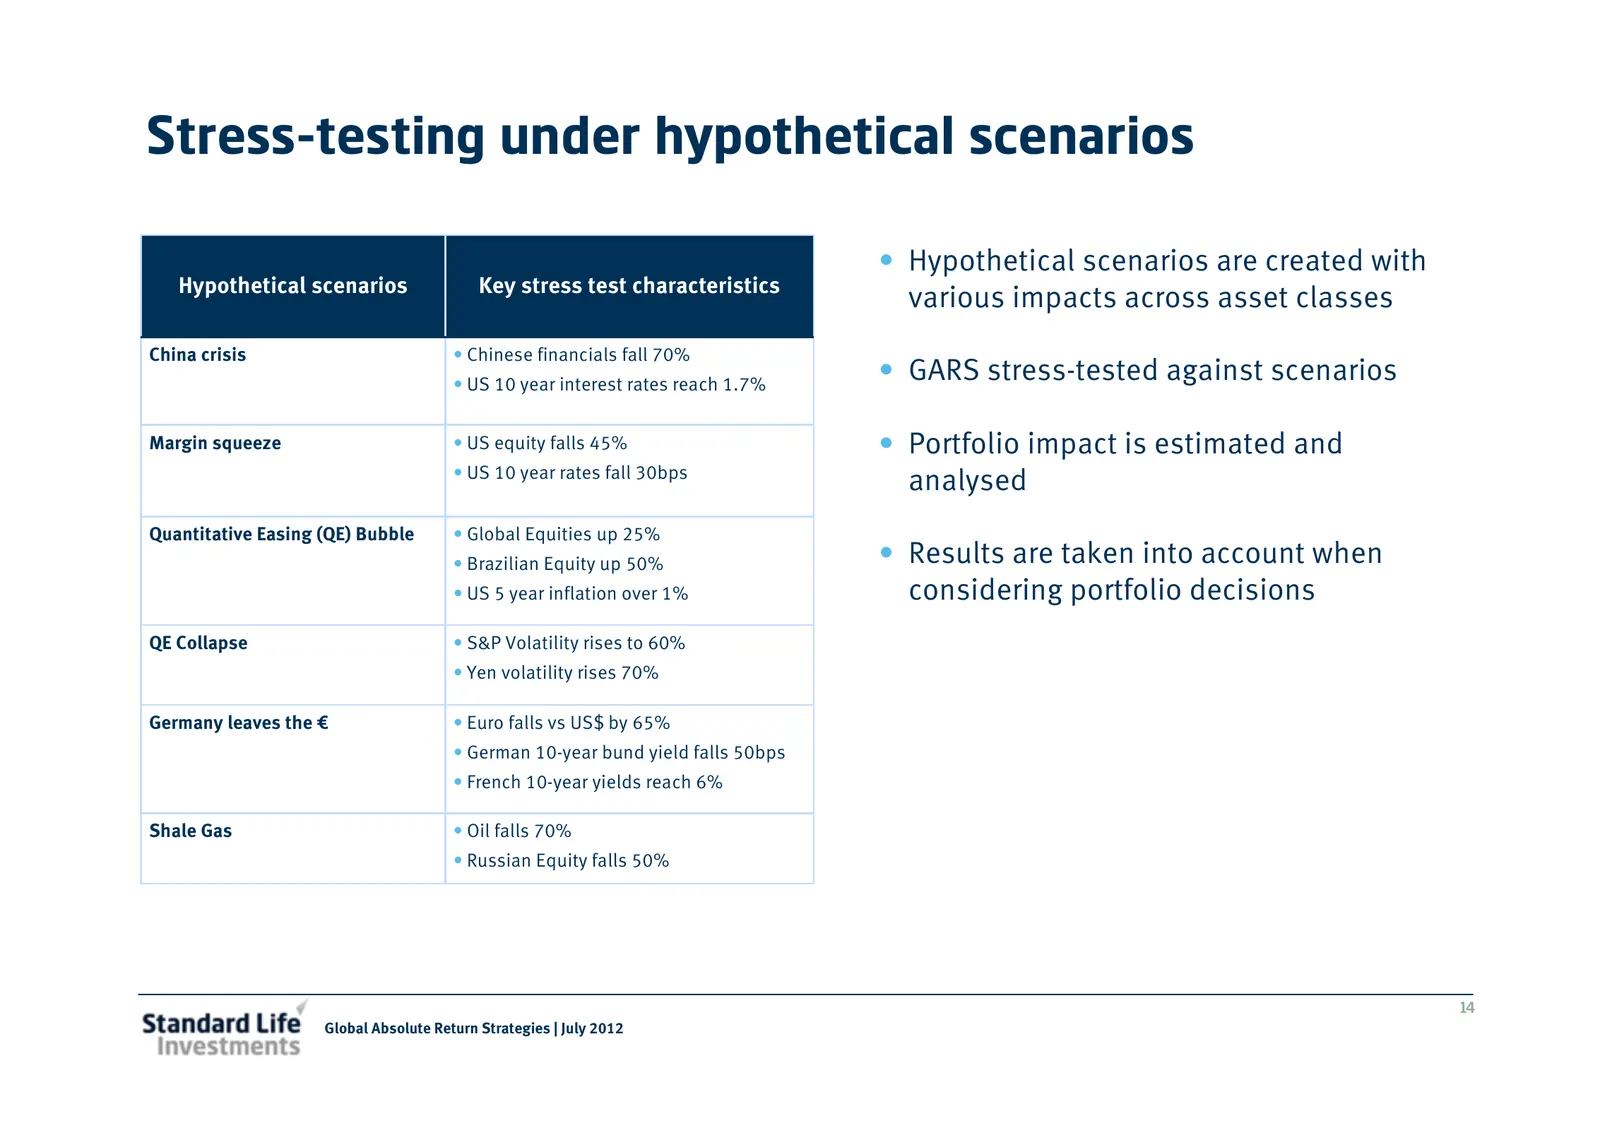
Slide 14: Stress-testing under hypothetical scenarios
Stress-testing under hypothetical scenarios • Hypothetical scenarios are created with Hypothetical scenarios Key stress test characteristics various impacts across asset classes China crisis • Chinese financials fall 70% • US 10 year interest rates reach 1.7% • GARS stress-tested against scenarios M
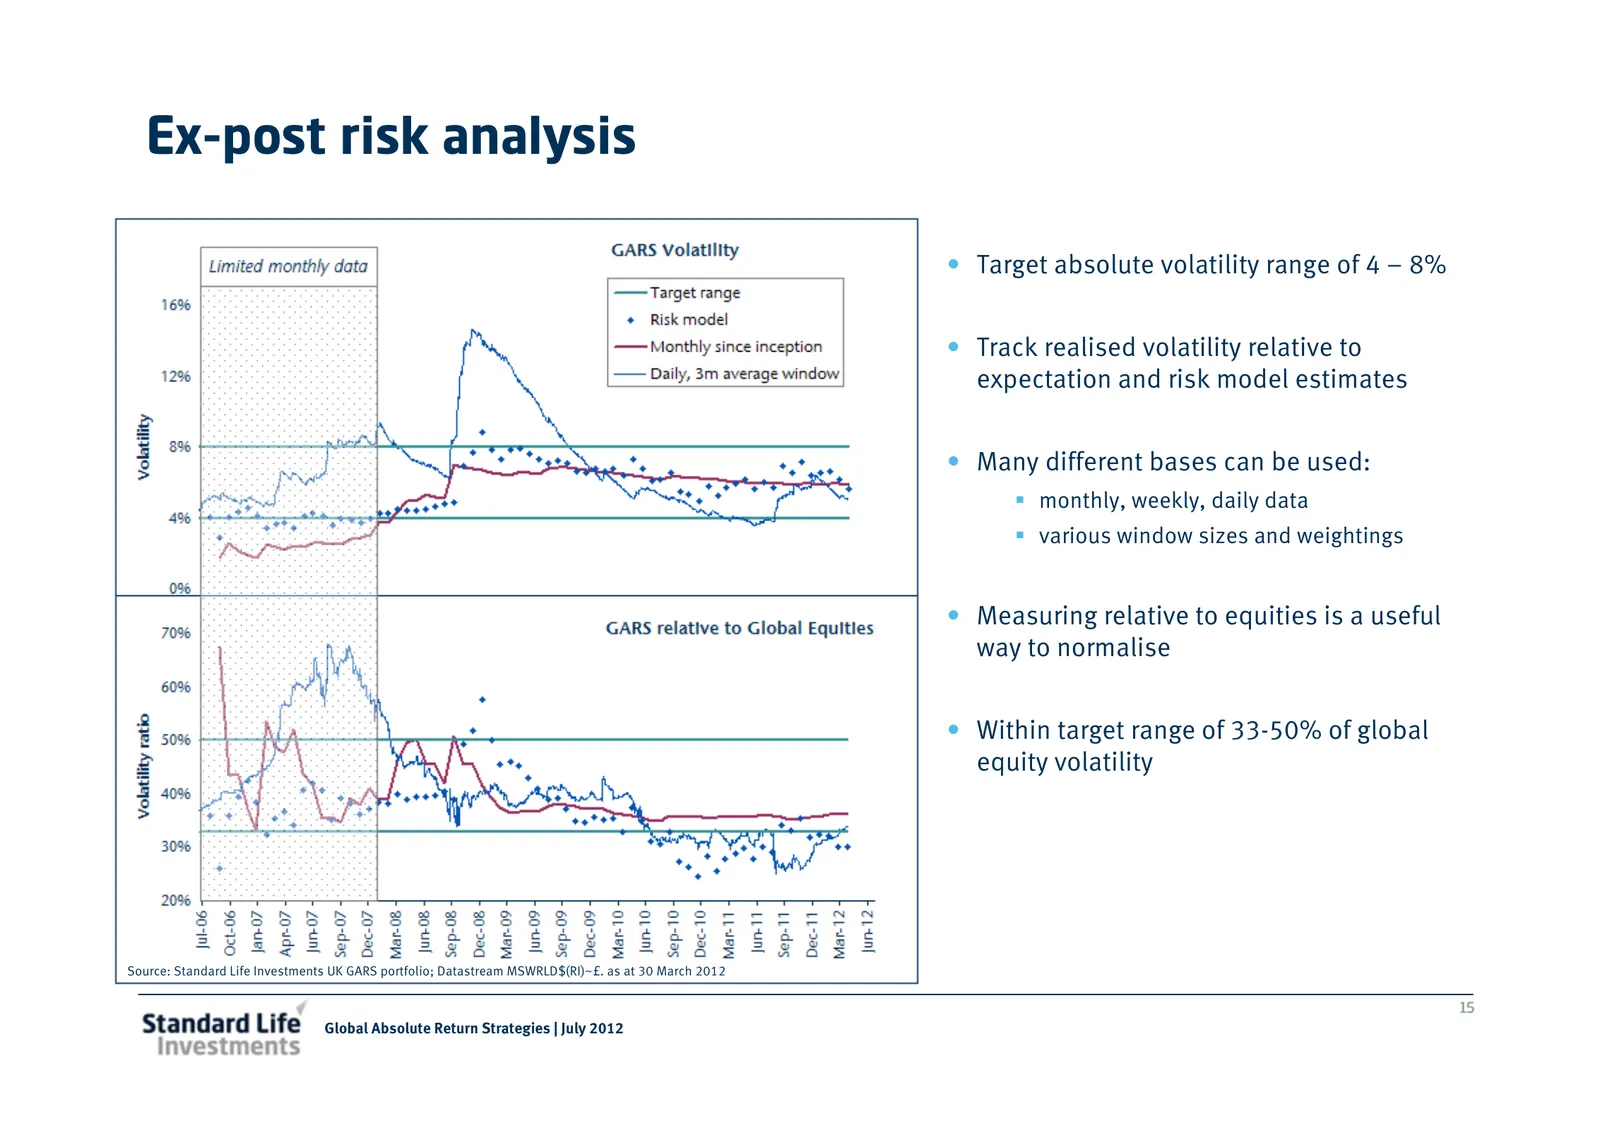
Slide 15: Ex-post risk analysis
Ex-post risk analysis • Target absolute volatility range of 4 – 8% • Track realised volatility relative to expectation and risk model estimates • Many different bases can be used: monthly, weekly, daily data various window sizes and weightings • Measuring relative to equities is a useful way to norm
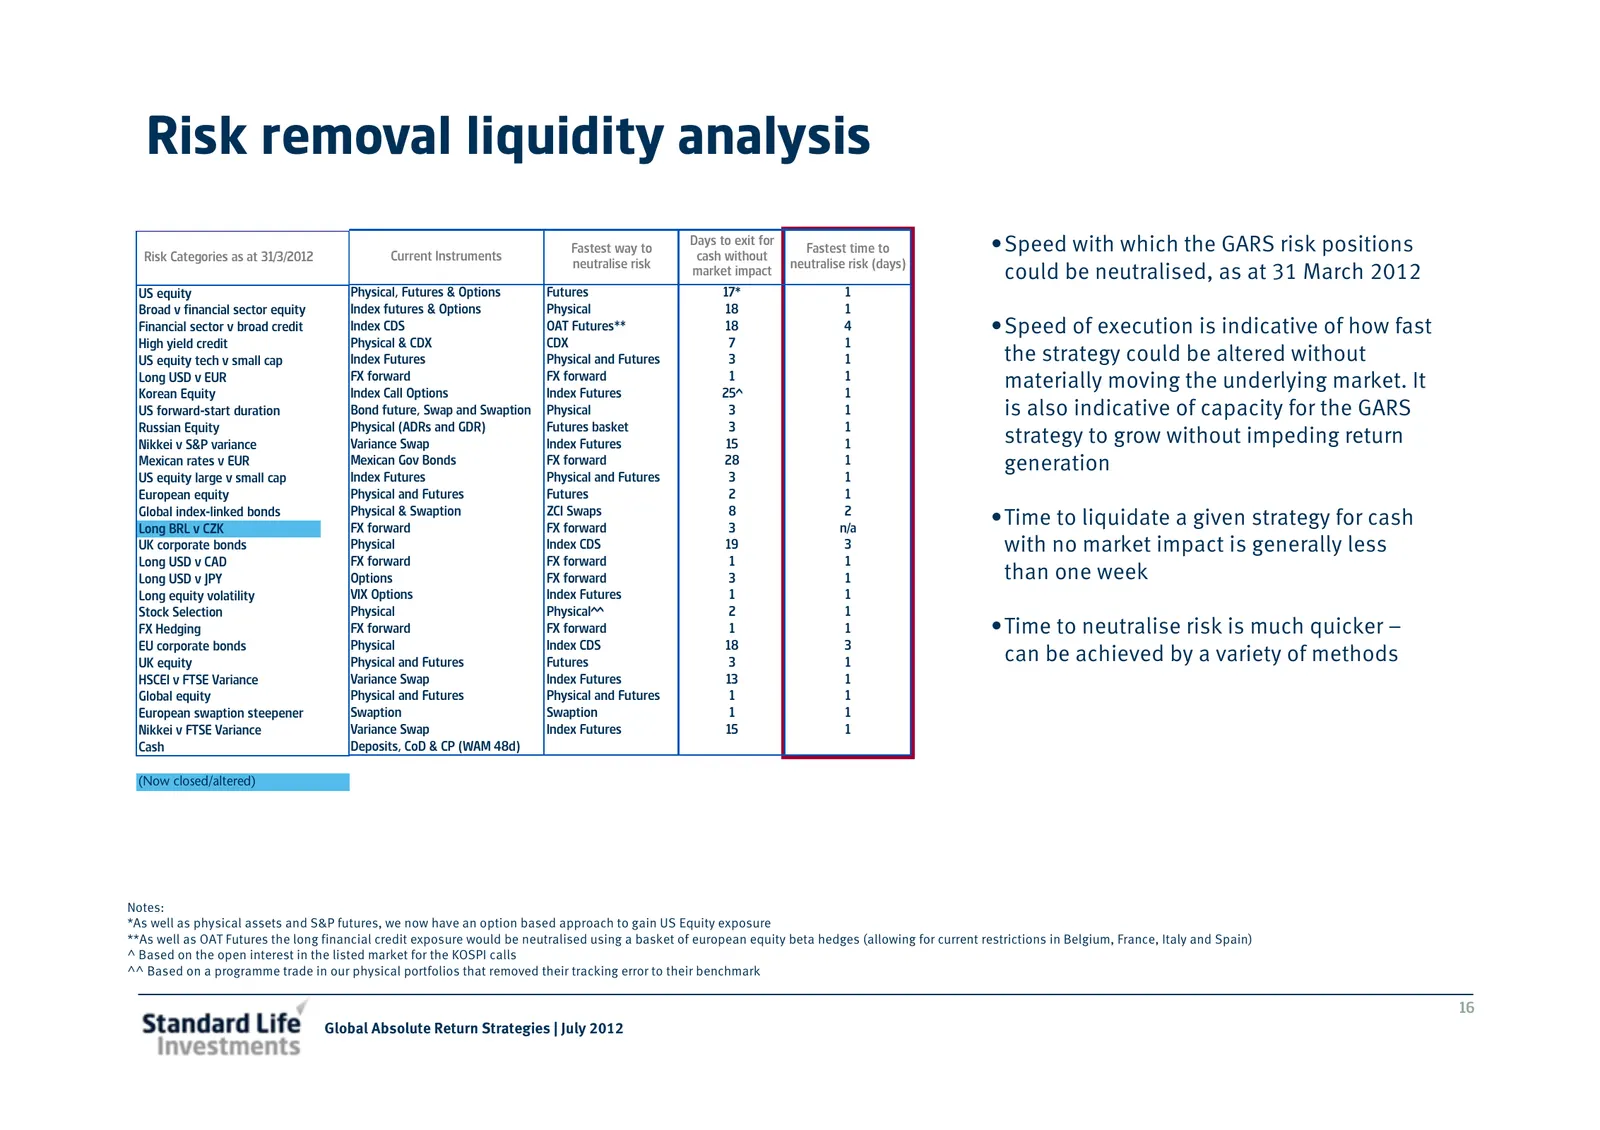
Slide 16: Risk removal liquidity analysis
Risk removal liquidity analysis Risk Categories as at 31/3/2012 Current Instruments Fastest way to Days to exit for cash without Fastest time to •Speed with which the GARS risk positions neutralise risk neutralise risk (days) market impact could be neutralised, as at 31 March 2012 US equity Physical
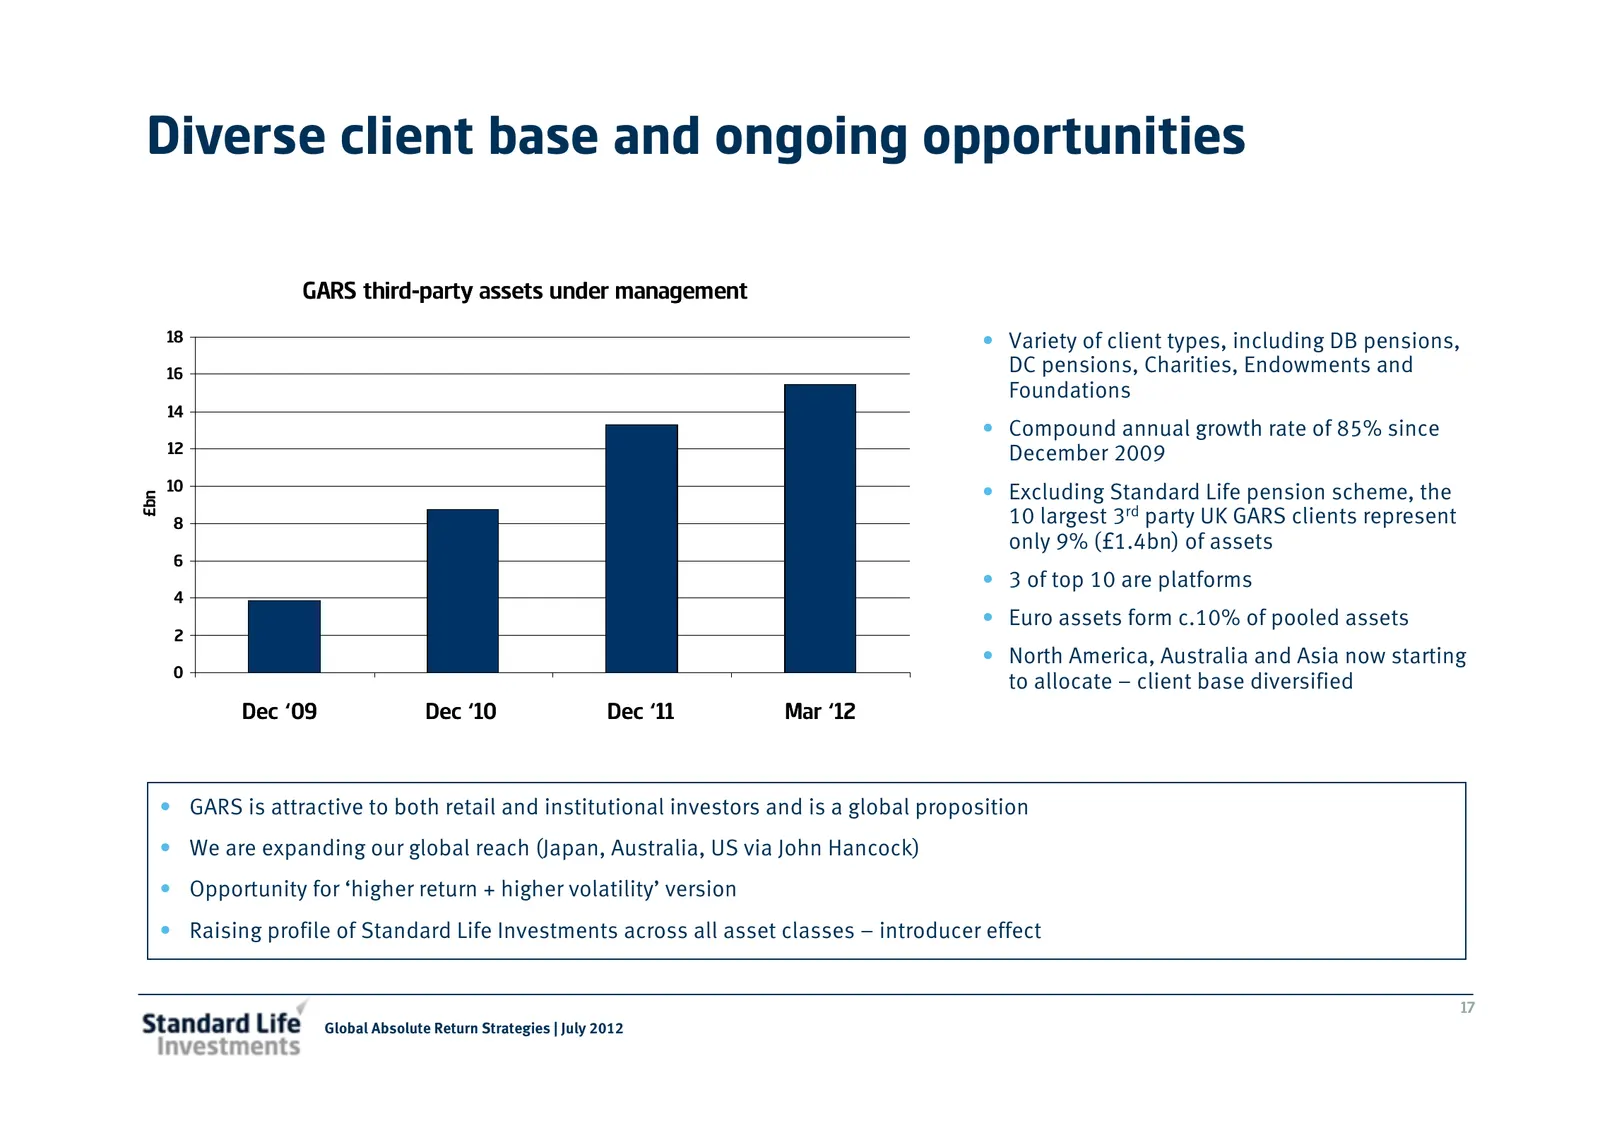
Slide 17: Diverse client base and ongoing opportunities
Diverse client base and ongoing opportunities GARS third-party assets under management 18 • Variety of client types, including DB pensions, 16 DC pensions, Charities, Endowments and Foundations 14 • Compound annual growth rate of 85% since 12 December 2009 10 • Excluding Standard Life pension scheme
Slide 18: GARS summary
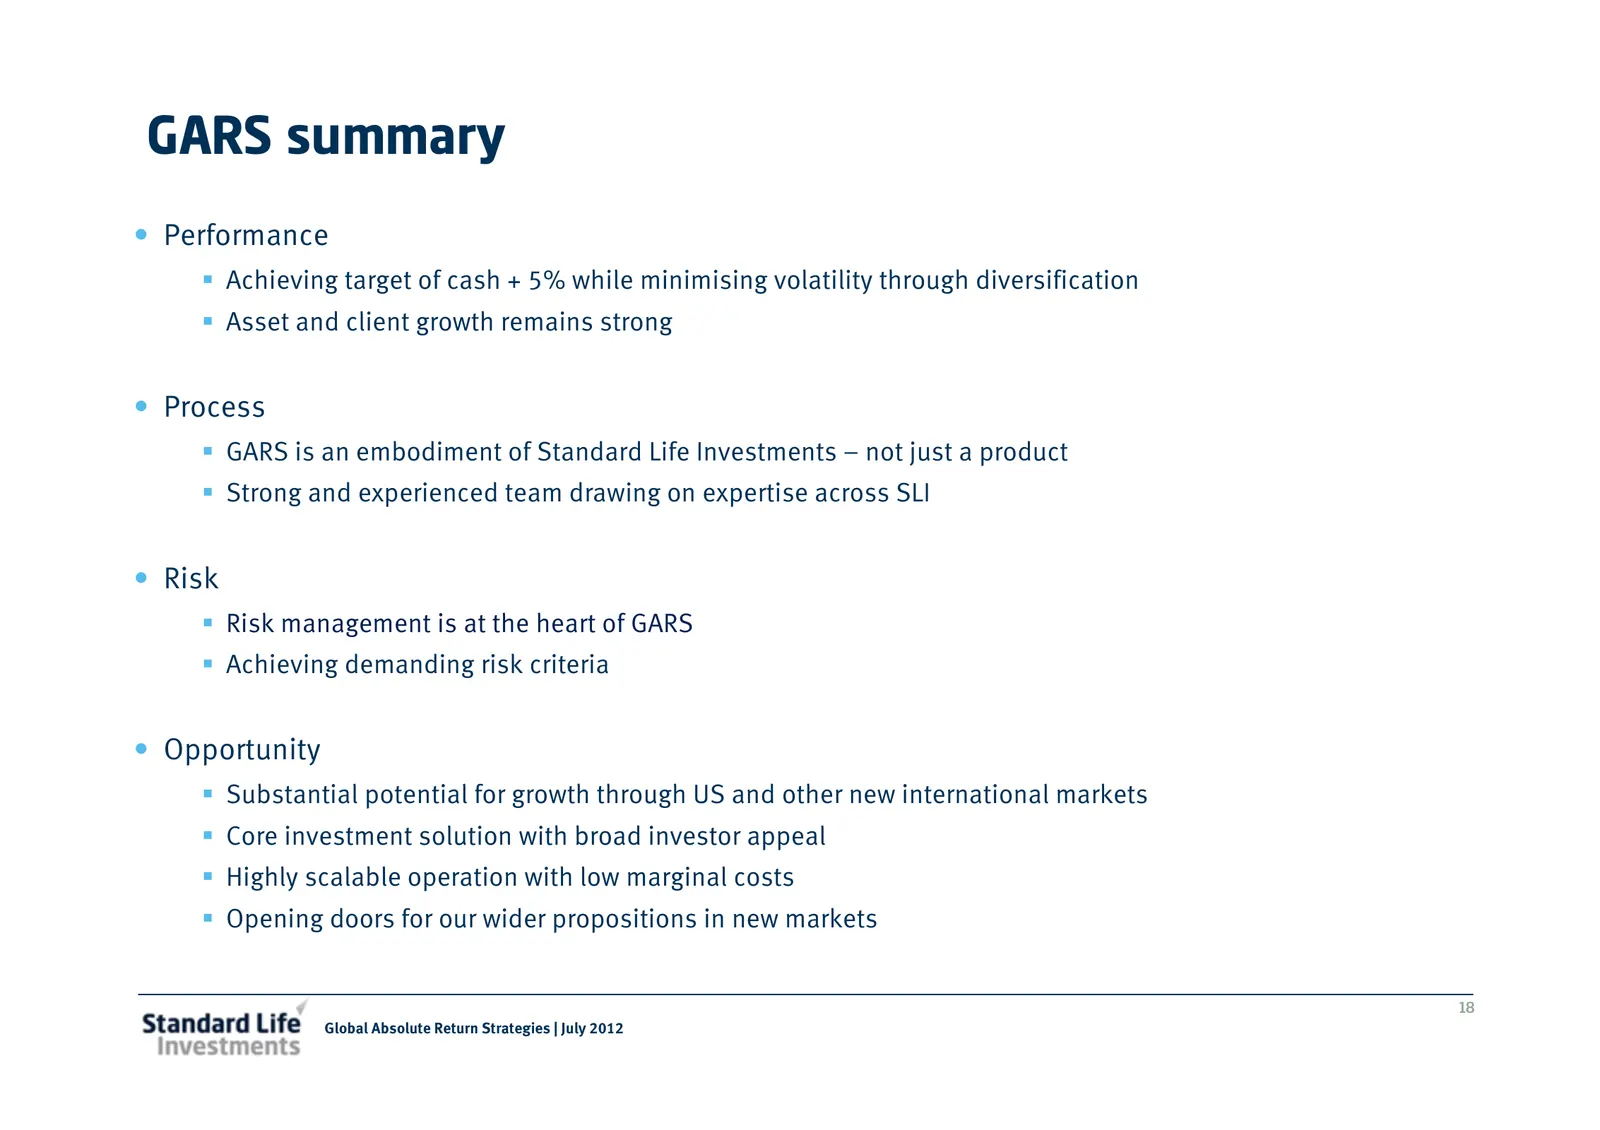
GARS summary • Performance Achieving target of cash + 5% while minimising volatility through diversification Asset and client growth remains strong • Process GARS is an embodiment of Standard Life Investments – not just a product Strong and experienced team drawing on expertise across SLI • Risk Ris

Slide 19: Appendices
Appendices This document is intended for investment professionals only and must not be relied upon or used by retail clients
Slide 20: Global Absolute Return Strategies performance
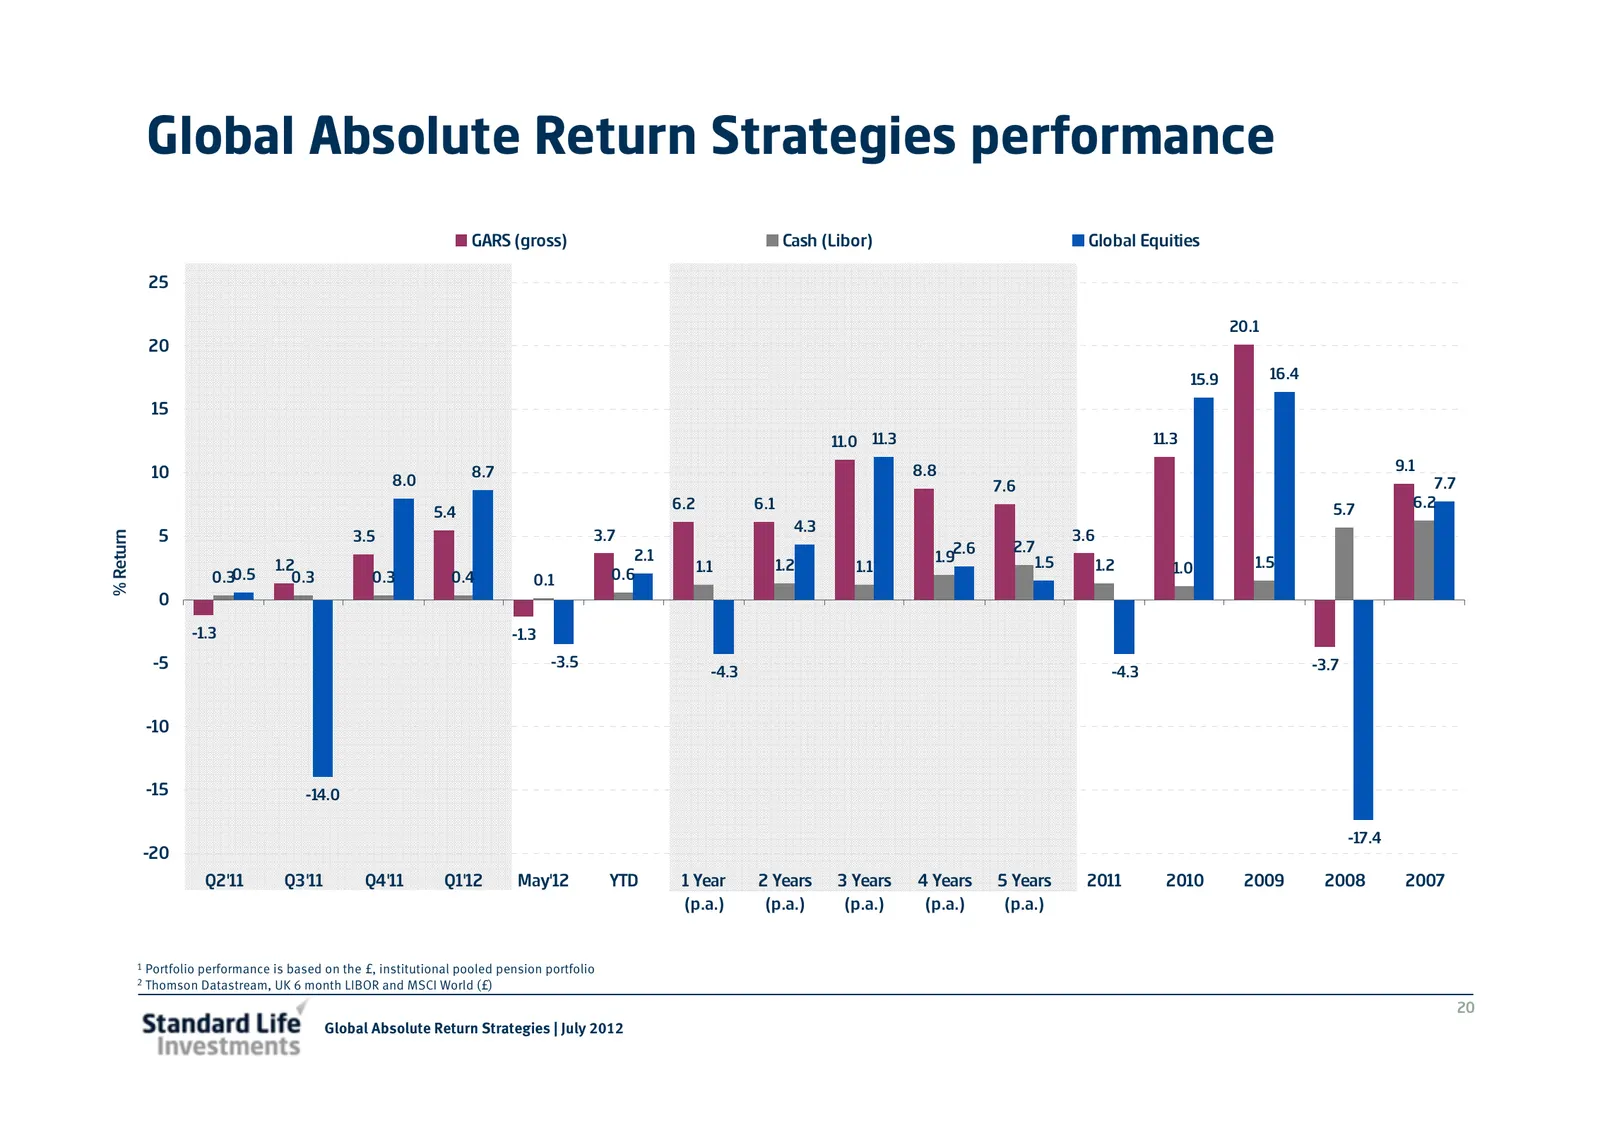
Global Absolute Return Strategies performance GARS (gross) Cash (Libor) Global Equities 25 20.1 20 15.9 16.4 15 11.0 11.3 11.3 10 8.7 8.8 9.1 8.0 7.6 7.7 6.2 6.1 5.7 6.2 5.4 4.3 % Return 5 3.5 3.7 3.6 2.6 2.7 2.1 1.9 1.5 1.5 1.2 1.1 1.2 1.1 1.2 1.0 0.30.5 0.3 0.3 0.4 0.1 0.6 0 -1.3 -1.3 -5 -3.5 -3.7
Slide 21: Strategy activity in recent quarters
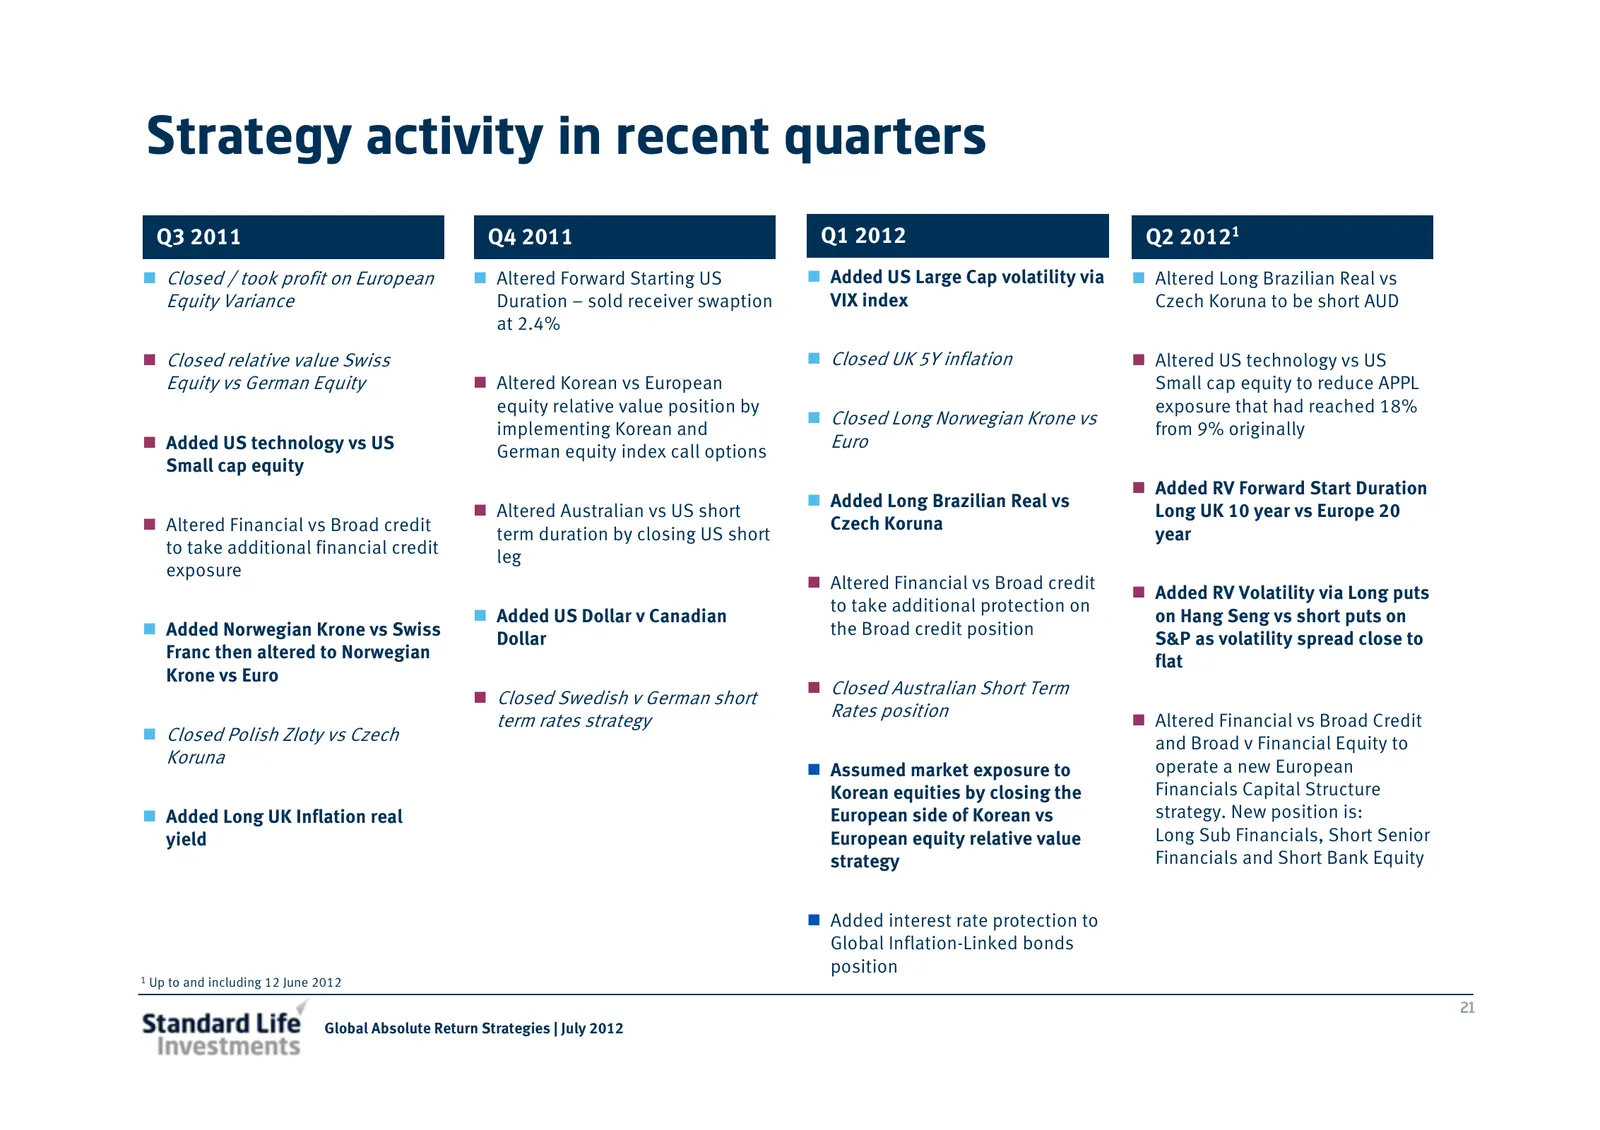
Strategy activity in recent quarters Q3 2011 Q4 2011 Q1 2012 Q2 20121 Closed / took profit on European Altered Forward Starting US Added US Large Cap volatility via Altered Long Brazilian Real vs Equity Variance Duration – sold receiver swaption VIX index Czech Koruna to be short AUD at 2.4% Closed
Slide 22: Directional strategy - example
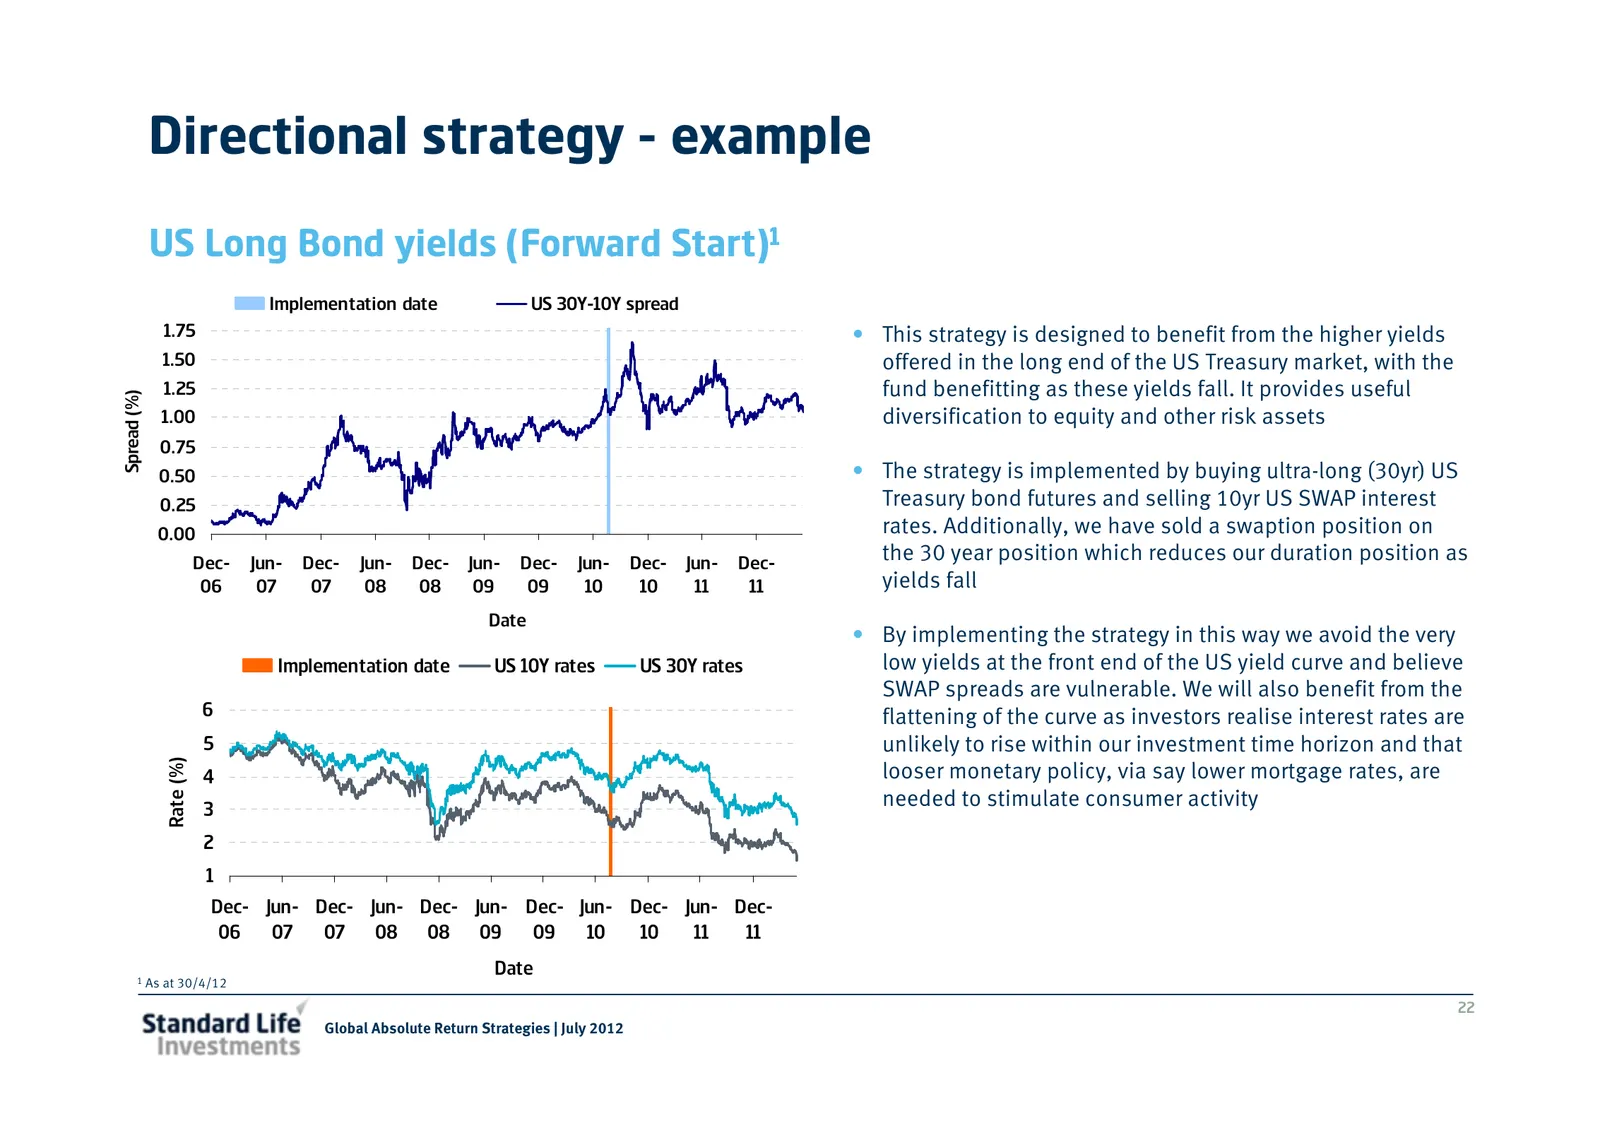
Directional strategy - example US Long Bond yields (Forward Start)1 Implementation date US 30Y-10Y spread 1.75 • This strategy is designed to benefit from the higher yields 1.50 offered in the long end of the US Treasury market, with the 1.25 fund benefitting as these yields fall. It provides useful
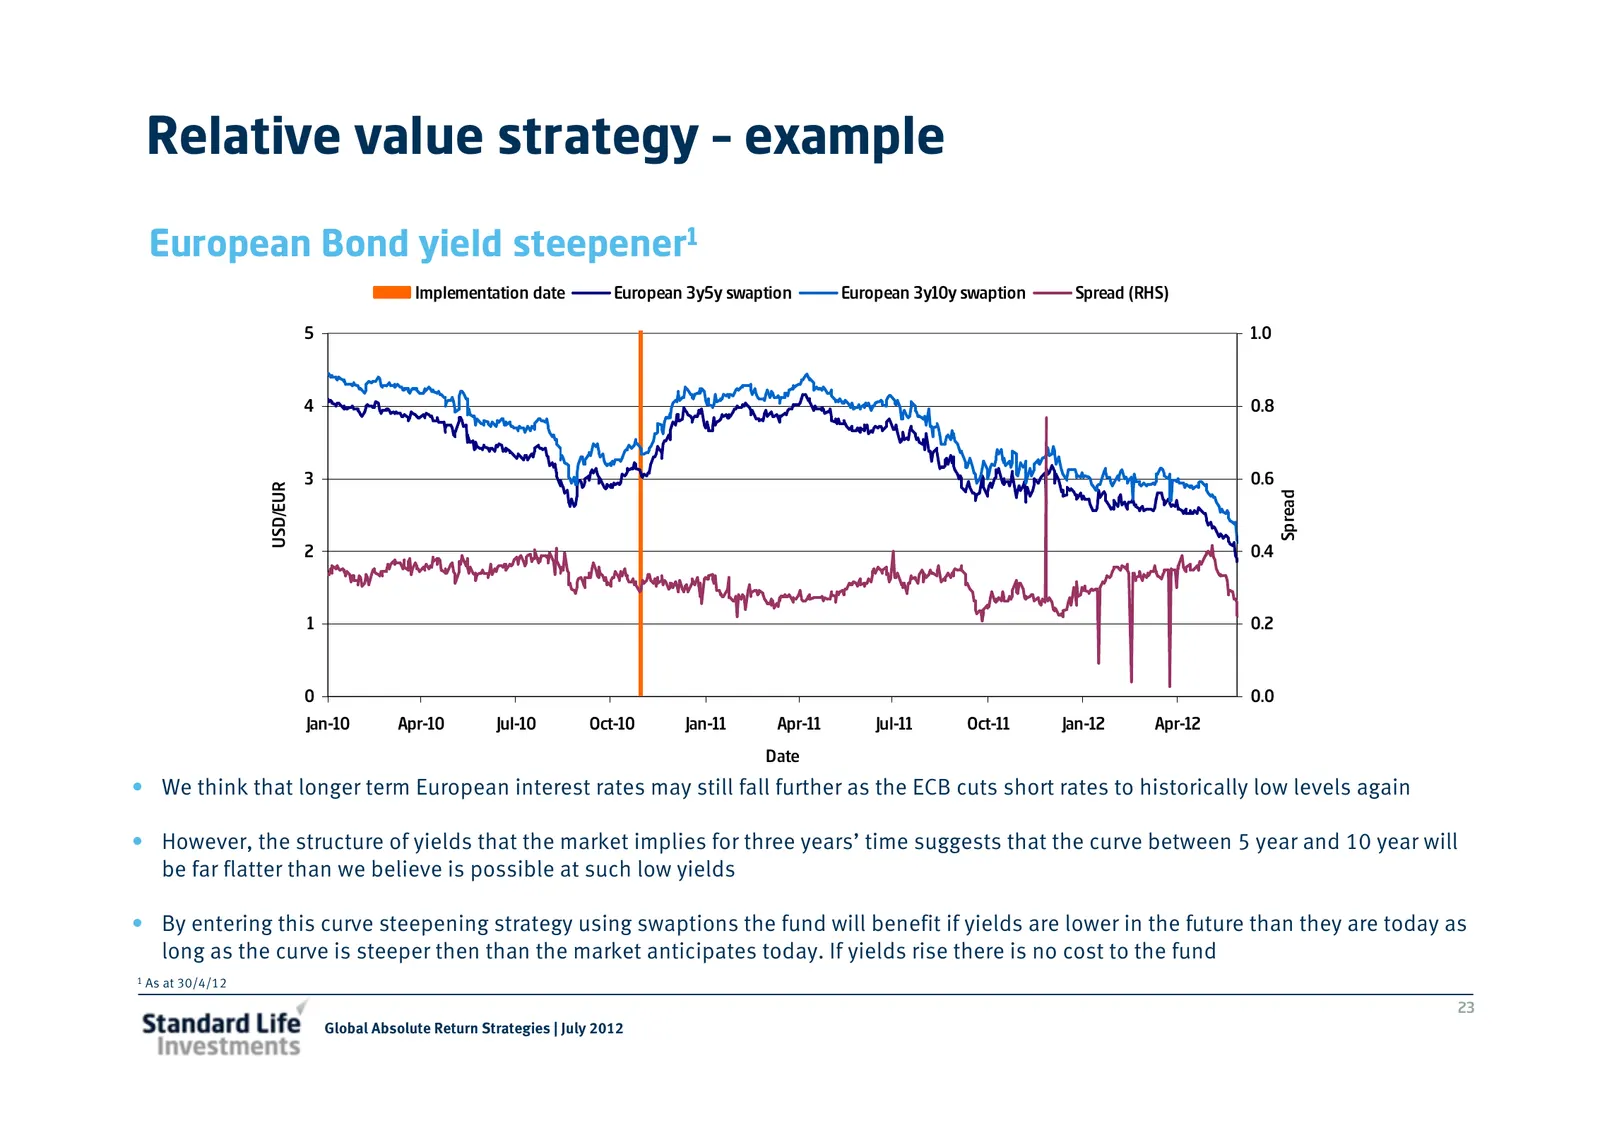
Slide 23: Relative value strategy - example
Relative value strategy – example European Bond yield steepener1 Implementation date European 3y5y swaption European 3y10y swaption Spread (RHS) 5 1.0 4 0.8 3 0.6 USD/EUR Spread 2 0.4 1 0.2 0 0.0 Jan-10 Apr-10 Jul-10 Oct-10 Jan-11 Apr-11 Jul-11 Oct-11 Jan-12 Apr-12 Date • We think that longer term E
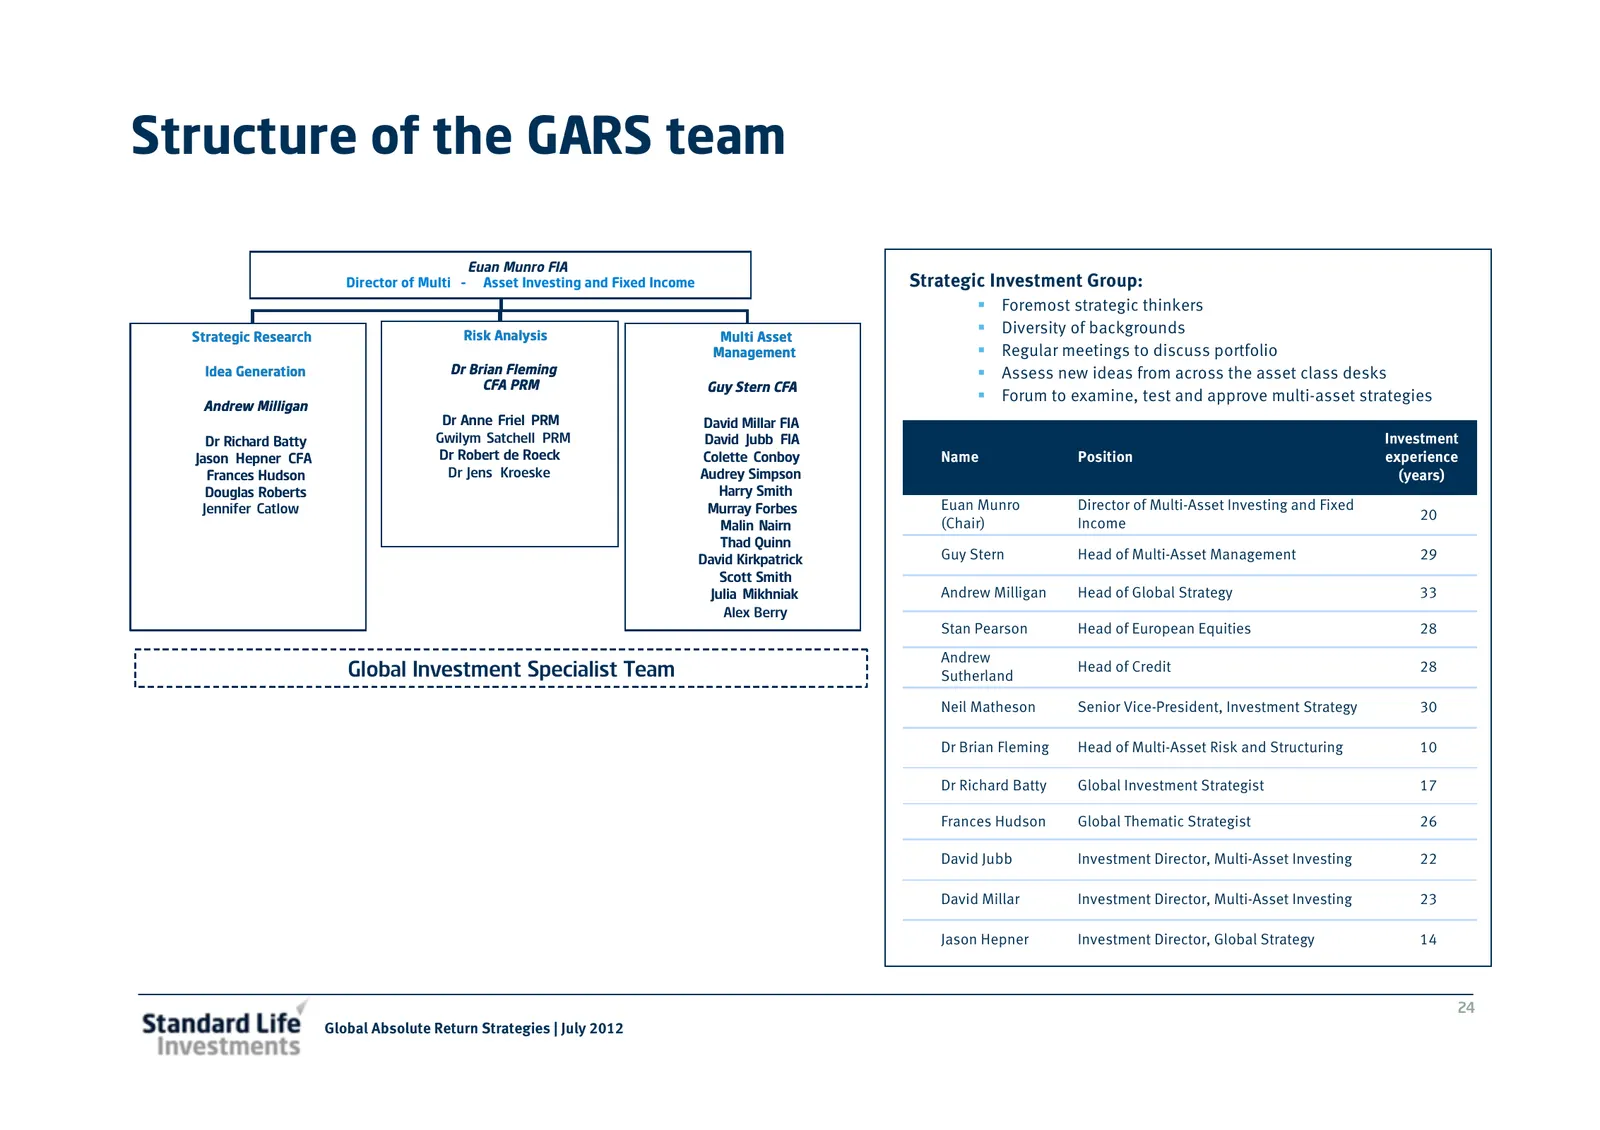
Slide 24: Structure of the GARS team
Structure of the GARS team Euan Munro FIA Director of Multi - Asset Investing and Fixed Income Strategic Investment Group: Foremost strategic thinkers Strategic Research Risk Analysis Multi Asset Diversity of backgrounds Management Regular meetings to discuss portfolio Idea Generation Dr Brian Flemi
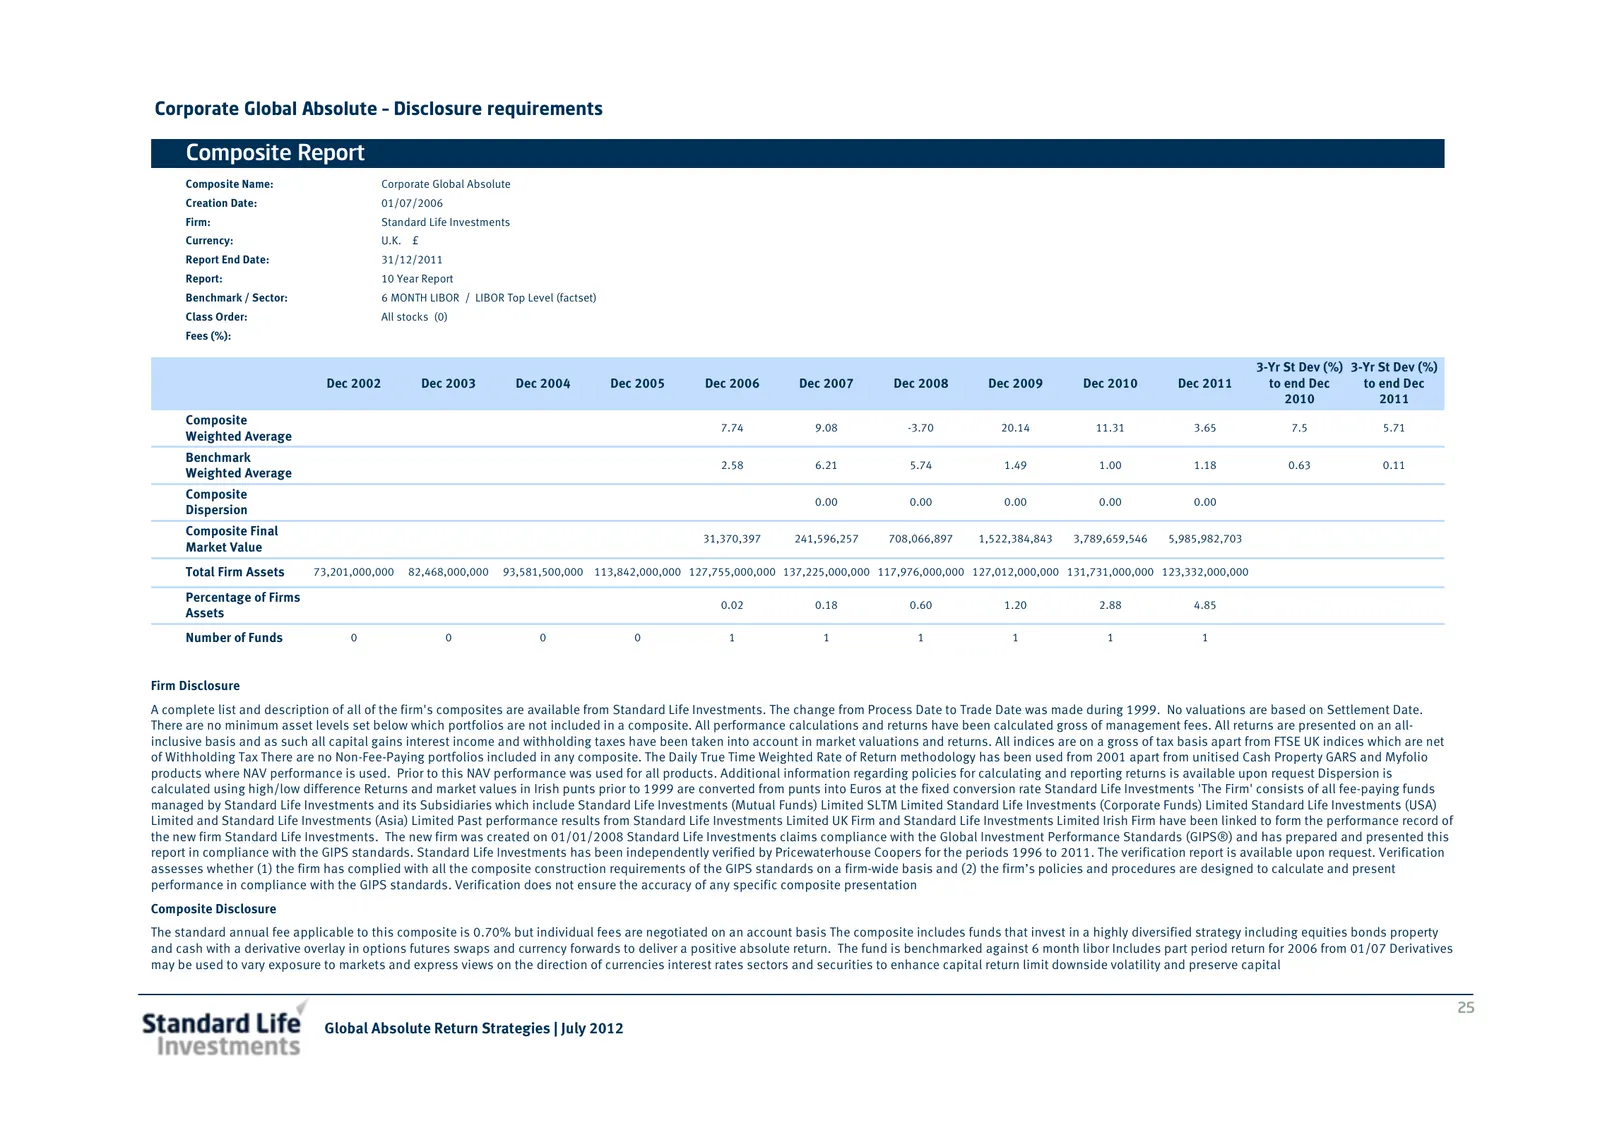
Slide 25: Composite Report
Corporate Global Absolute – Disclosure requirements Composite Report Composite Name: Corporate Global Absolute Creation Date: 01/07/2006 Firm: Standard Life Investments Currency: U.K. £ Report End Date: 31/12/2011 Report: 10 Year Report Benchmark / Sector: 6 MONTH LIBOR / LIBOR Top Level (factset) C
Slide 26: The information shown relates to the past. Past performance is not a guide
The information shown relates to the past. Past performance is not a guide to the future. The value of investment can go down as well as up. Any data contained herein which is attributed to a third party ("Third Party Data") is the property of (a) third party supplier(s) (the “Owner”) and is license
Source: Internet Archive copy of standardlife.com
More decks from Aberdeen Group plc
 H1 2026 Earnings Presentation25 slides · Jul 29, 2026
 Investor Day (June 2026)25 slides · Jun 25, 2026
 FY2025 Earnings Presentation33 slides · Mar 3, 2026
 H1 2025 Earnings Presentation27 slides · Jul 30, 2025
 FY2024 Earnings Presentation41 slides · Mar 4, 2025
 H1 2024 Earnings Presentation28 slides · Aug 6, 2024