Plains Exploration & Production Company
Plains Exploration & Production — Howard Weil Energy Conference 2004
24 slides from Plains Exploration & Production's conference presentation, Mar 31, 2004
Slide 1: Howard Weil Energy Conference March 31, 2004
P L A I N S E X P L O R A T I O N & P R O D U C T I O N C O M P A N Y Howard Weil Energy Conference March 31, 2004 N Y S E : P X P w w w . p l a i n s x p . c o m
Slide 2: Forward Looking Statements
Forward Looking Statements Except for the historical information contained herein, the matters discussed in this presentation are forward-looking statements that involve certain assumptions and known and unknown risks, uncertainties and other factors that could cause our actual results to differ mat
Slide 3: Forward Looking Statements
Forward Looking Statements PXP and Nuevo have filed a joint proxy statement/prospectus and other documents with the SEC. Investors and security holders are urged to carefully read the joint proxy statement/prospectus because it contains important information regarding PXP, Nuevo and the acquisition.
Slide 4: PXP Overview Pro Forma for NEV
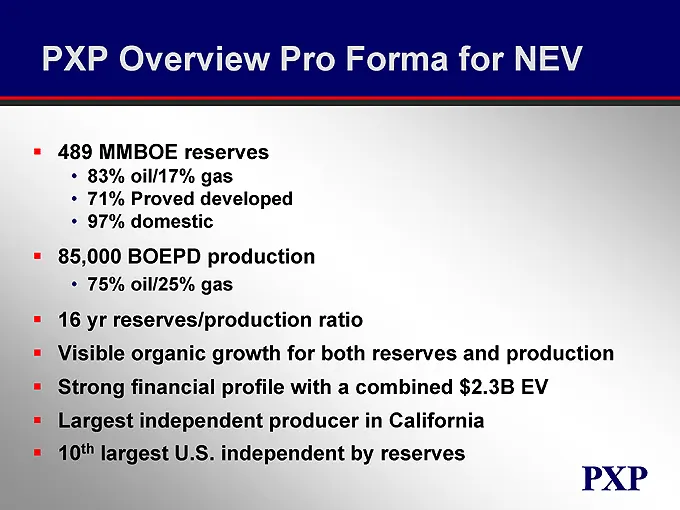
PXP Overview Pro Forma for NEV 489 MMBOE reserves • 83% oil/17% gas • 71% Proved developed • 97% domestic 85,000 BOEPD production • 75% oil/25% gas 16 yr reserves/production ratio Visible organic growth for both reserves and production Strong financial profile with a combined $2.3B EV Largest indepe
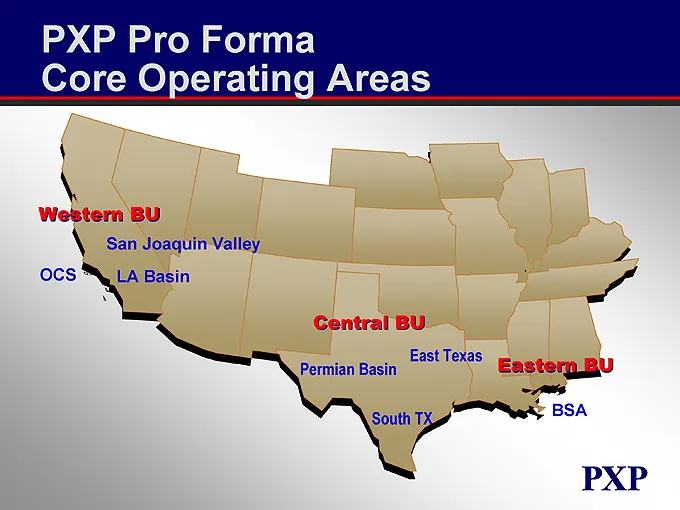
Slide 5: PXP Pro Forma Core Operating Areas
PXP Pro Forma Core Operating Areas Western BU San Joaquin Valley OCS LA Basin Central BU East Texas Permian Basin Eastern BU South TX BSA
Slide 6: PXP Value Creation Strategy
PXP Value Creation Strategy Develop large, durable U.S. reserve base to maintain production Drill high impact exploitation inventory to grow production and reserves Utilize financial flexibility to react opportunistically to create shareholder value
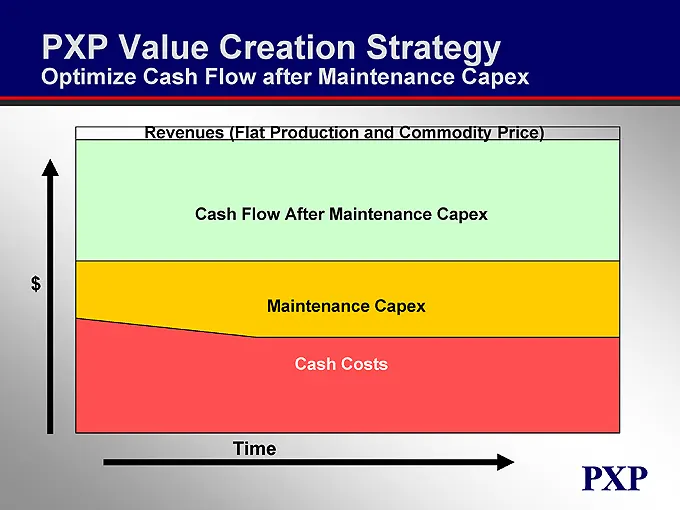
Slide 7: PXP Value Creation Strategy: Optimize Cash Flow after Maintenance Capex
PXP Value Creation Strategy Optimize Cash Flow after Maintenance Capex Revenues (Flat Production and Commodity Price) Cash Flow After Maintenance Capex Maintenance Capex Cash Costs Time
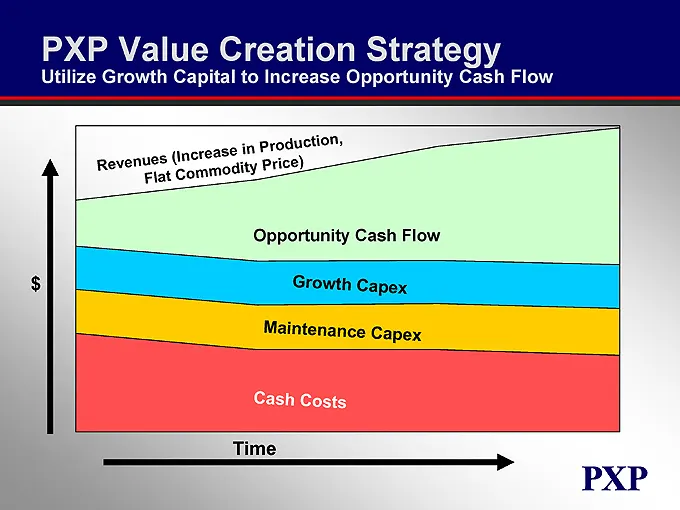
Slide 8: PXP Value Creation Strategy: Utilize Growth Capital
PXP Value Creation Strategy Utilize Growth Capital to Increase Opportunity Cash Flow
Slide 9: PXP Operational Value Drivers
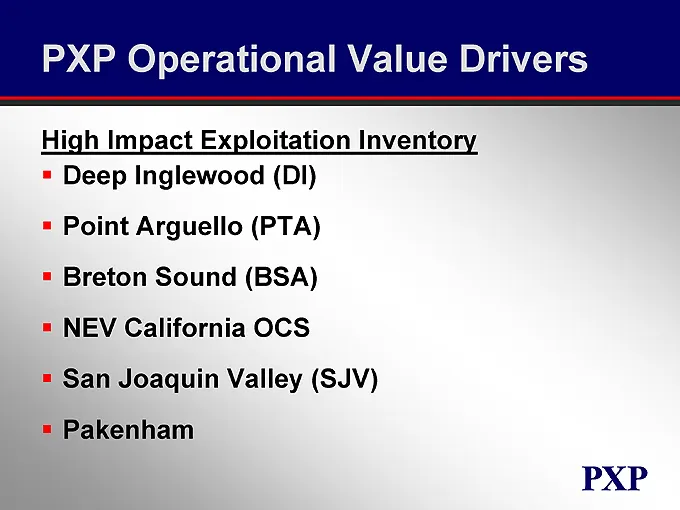
PXP Operational Value Drivers High Impact Exploitation Inventory Deep Inglewood (DI) Point Arguello (PTA) Breton Sound (BSA) NEV California OCS San Joaquin Valley (SJV) Pakenham
Slide 10: DI Top Sentous Structure
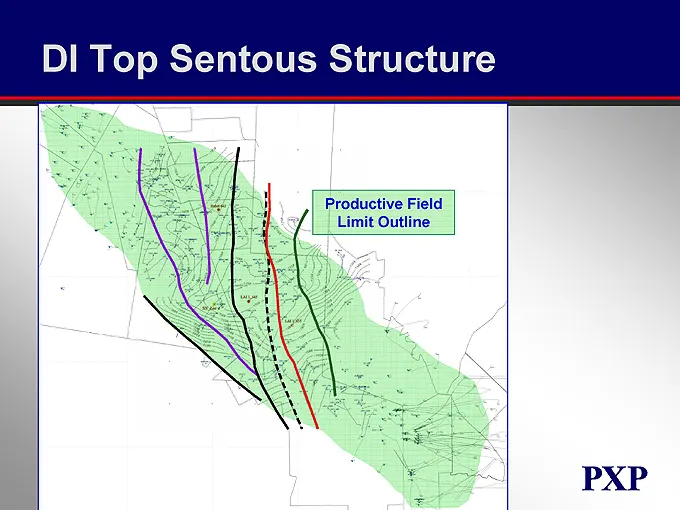
DI Top Sentous Structure Productive Field Limit Outline
Slide 11: DI 2004 Exploitation Wells
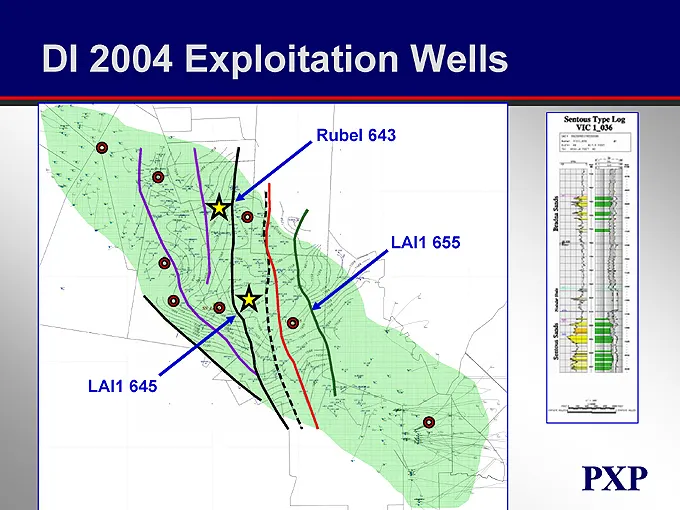
DI 2004 Exploitation Wells Rubel 643 LAI1 655 LAI1 645
Slide 12: DI Exploitation/Development Wells
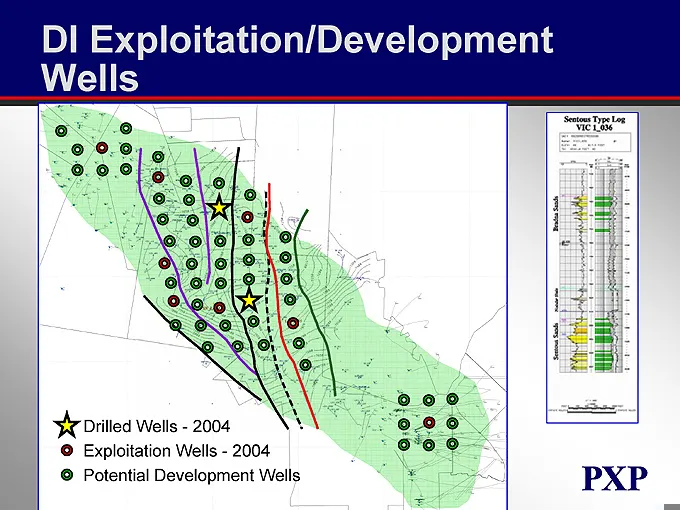
DI Exploitation/Development Wells
Slide 13: DI Indicative Returns
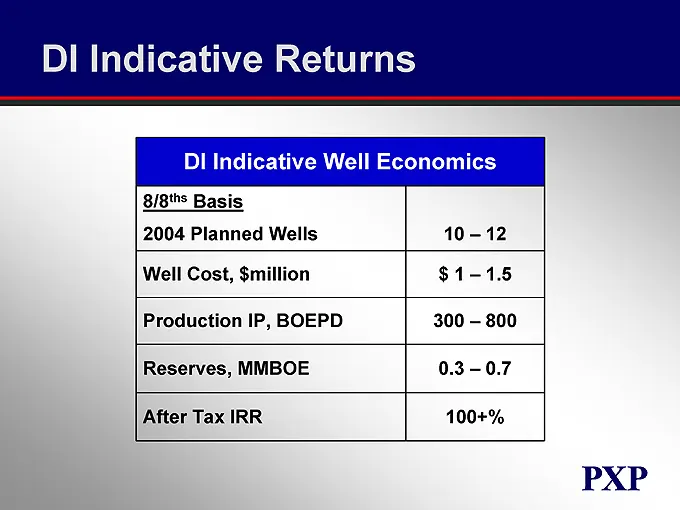
DI Indicative Returns DI Indicative Well Economics 8/8ths Basis 2004 Planned Wells 10 – 12 Well Cost, $million $ 1 – 1.5 Production IP, BOEPD 300 – 800 Reserves, MMBOE 0.3 – 0.7 After Tax IRR 100+%
Slide 14: Breton Sound (BSA)
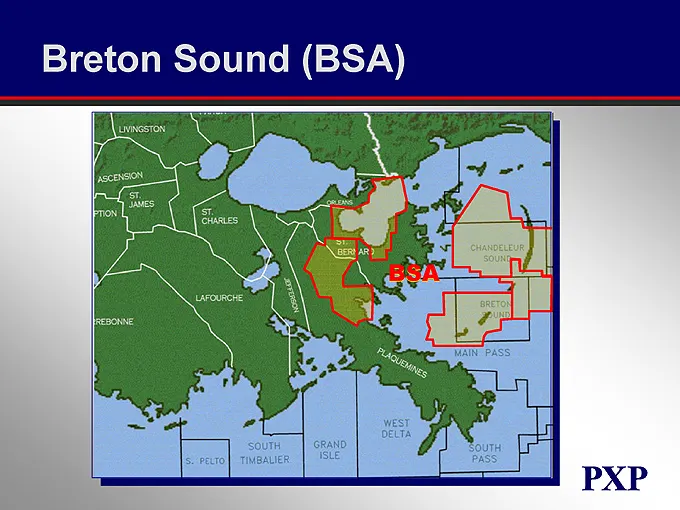
Breton Sound (BSA) y 1 PE RA PXP
Slide 15: BSA Miocene Prospects Depositional Model
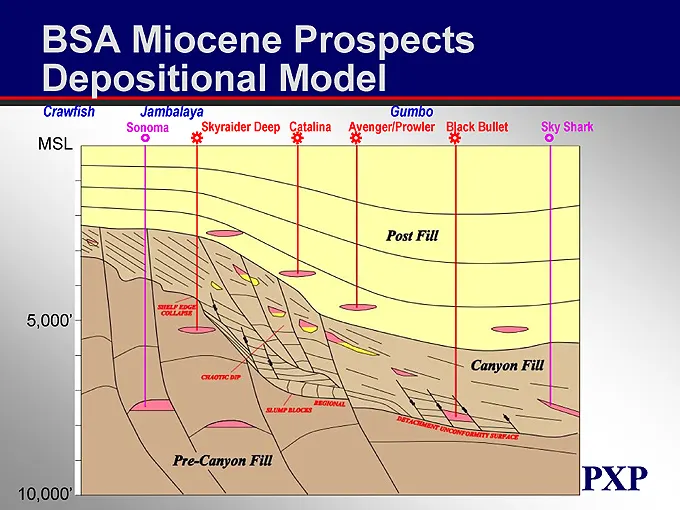
BSA Miocene Prospects Depositional Model Crawfish Jambalaya Gumbo Sonoma Skyraider Deep Catalina Avenger/Prowler Black Bullet Sky Shark
Slide 16: BSA Indicative Returns
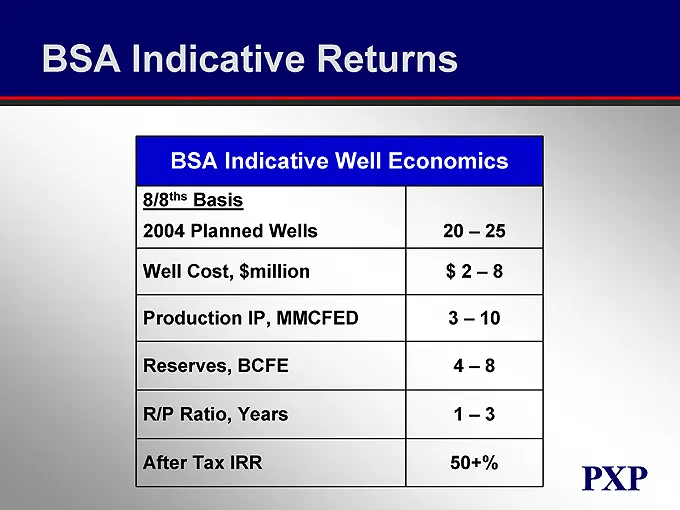
BSA Indicative Returns BSA Indicative Well Economics 8/8ths Basis 2004 Planned Wells 20 – 25 Well Cost, $million $ 2 – 8 Production IP, MMCFED 3 – 10 Reserves, BCFE 4 – 8 R/P Ratio, Years 1 – 3 After Tax IRR 50+%
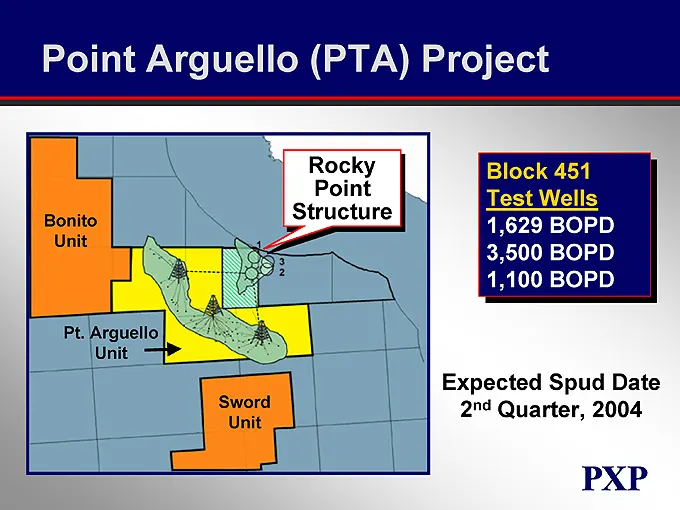
Slide 17: Point Arguello (PTA) Project
Point Arguello (PTA) Project Rocky Point Structure Bonito Unit Pt. Arguello Unit Sword Unit Block 451 Test Wells 1,629 BOPD 3,500 BOPD 1,100 BOPD Expected Spud Date 2nd Quarter, 2004
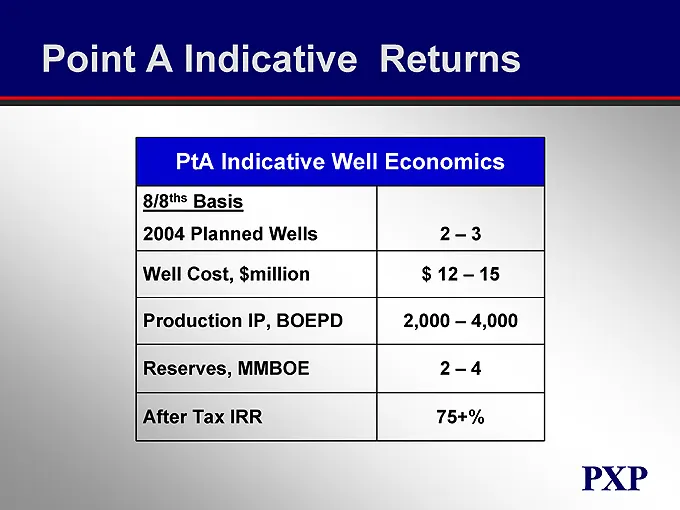
Slide 18: PtA Indicative Returns
Point A Indicative Returns PtA Indicative Well Economics 8/8ths Basis 2004 Planned Wells 2 – 3 Well Cost, $million $ 12 – 15 Production IP, BOEPD 2,000 – 4,000 Reserves, MMBOE 2 – 4 After Tax IRR 75+%
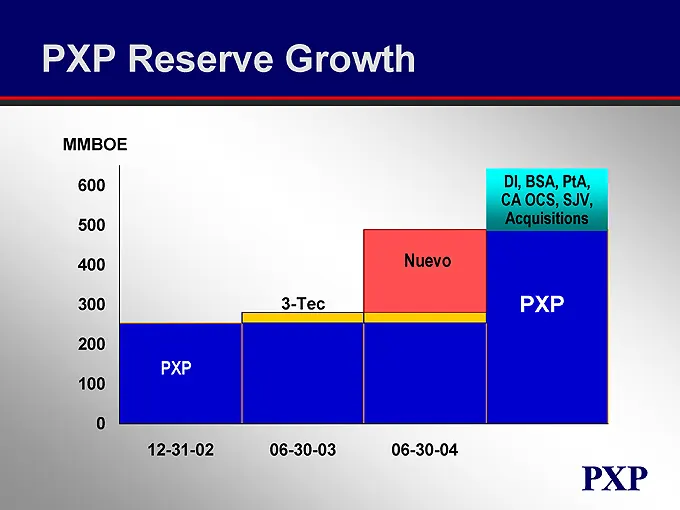
Slide 19: PXP Reserve Growth
PXP Reserve Growth PXP 12-31-02 3-Tec 06-30-03 Nuevo 06-30-04 DI, BSA, PtA, CA OCS, SJV, Acquisitions PXP
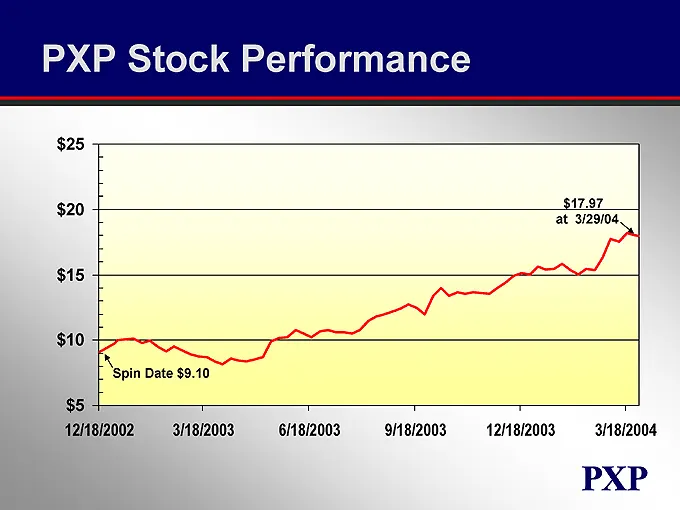
Slide 20: PXP Stock Performance
PXP Stock Performance $25 $17.97 $20 ‘at 3/29/04. $15 $10 [ ‘Spin Date $9.10 $5 + = 42iii2002 3/48/2003 ©~««6it8i2003 ©» 98i2003 © «taitei2003. «3148/2004 “ PXP
Slide 21: Financial Strategy
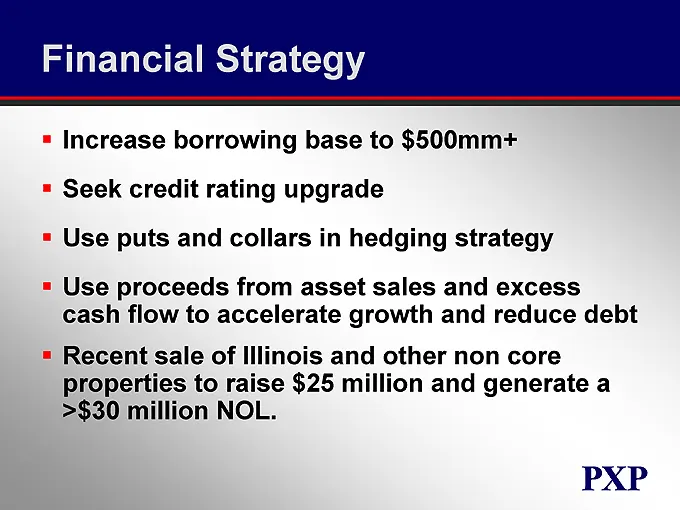
Financial Strategy Increase borrowing base to $500mm+ Seek credit rating upgrade Use puts and collars in hedging strategy Use proceeds from asset sales and excess cash flow to accelerate growth and reduce debt Recent sale of Illinois and other non core properties to raise $25 million and generate a
Slide 22: Enhanced Credit Profile
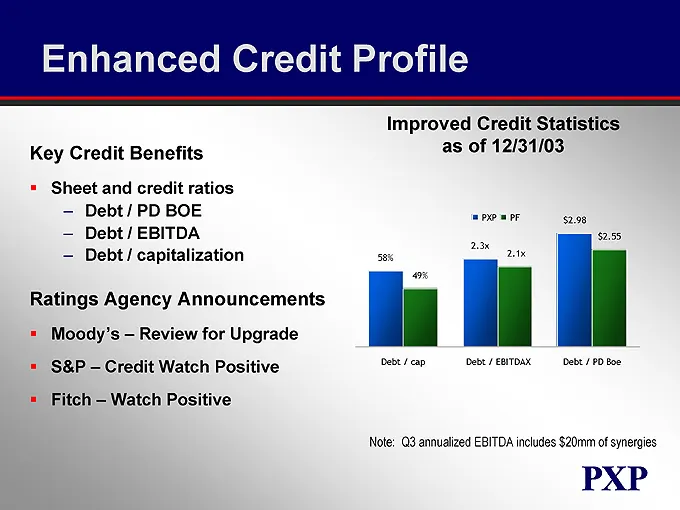
Enhanced Credit Profile Improved Credit Statistics as of 12/31/03 Key Credit Benefits Sheet and credit ratios – Debt / PD BOE – Debt / EBITDA – Debt / capitalization Ratings Agency Announcements Moody’s – Review for Upgrade S&P – Credit Watch Positive Fitch – Watch Positive 58% 49% Debt / cap 2.3x 2
Slide 23: PXP/NEV Consolidated Pro Forma Balance Sheet
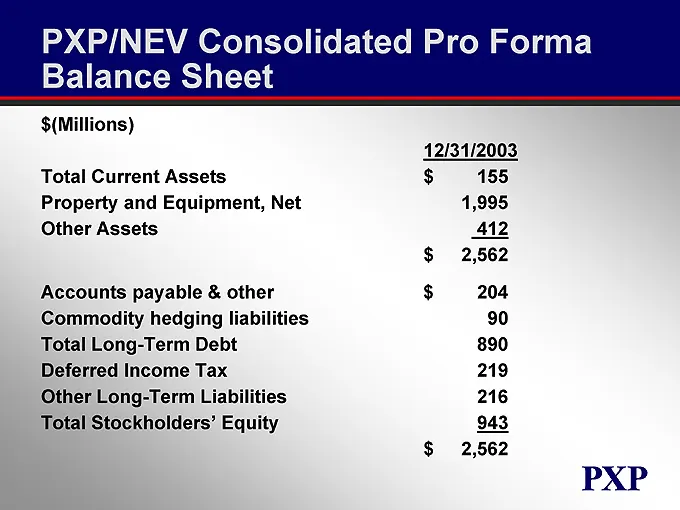
PXP/NEV Consolidated Pro Forma Balance Sheet $(Millions) 12/31/2003 Total Current Assets $155 Property and Equipment, Net 1,995 Other Assets 412 $2,562 Accounts payable & other $204 Commodity hedging liabilities 90 Total Long-Term Debt 890 Deferred Income Tax 219 Other Long-Term Liabilities 216 Tota

Slide 24: Plains Exploration & Production Company
P L A I N S E X P L O R A T I O N & P R O D U C T I O N C O M P A N Y N Y S E : P X P w w w . p l a i n s x p . c o m
Source: SEC EDGAR · 8-K filed Mar 31, 2004
More decks from Plains Exploration & Production Company
 Global Metals, Mining & Steel Conference 201333 slides · May 14, 2013
 Q1 2013 Earnings Presentation46 slides · Apr 19, 2013
 Merger or Acquisition (February 2013)35 slides · Feb 25, 2013
 2013 Credit Suisse Energy Summit10 slides · Feb 5, 2013
 Merger or Acquisition (January 2013)30 slides · Jan 17, 2013
 Credit Suisse 2012 Energy Summit32 slides · Feb 7, 2012