Claires Stores — Debt Investor Presentation (March 2018)
34 slides from Claires Stores's debt investor presentation, Mar 19, 2018
Slide 1: Business Plan Presentation
Confidential / Subject to Non-Disclosure Agreement B U S I N E S S P L A N P R E S E N T A T I O N
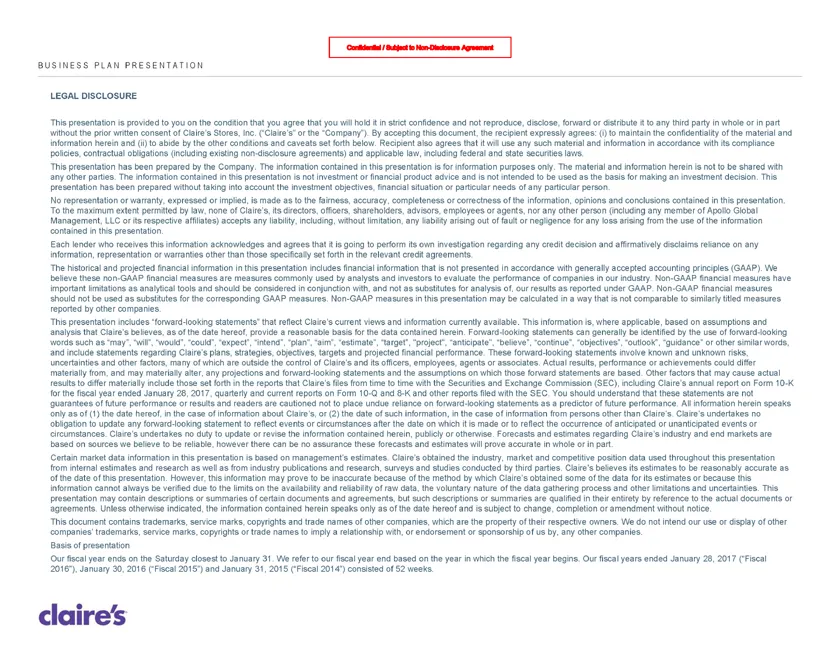
Slide 2: Legal Disclosure
B U S I N E S S P L A N P R E S E N T A T I O N LEGAL DISCLOSURE This presentation is provided to you on the condition that you agree that you will hold it in strict confidence and not reproduce, disclose, forward or distribute it to any third party in whole or in part without the prior written cons
Slide 3: Table of Contents
C O N F I D E N T I A L B U S I N E S S P L A N P R E S E N T A T I O N Table of Contents I Claire’s: What Differentiates Us II Recent Trends III Key Turnaround Initiatives IV Financial Projections Appendix
Slide 4: Claire's Representatives
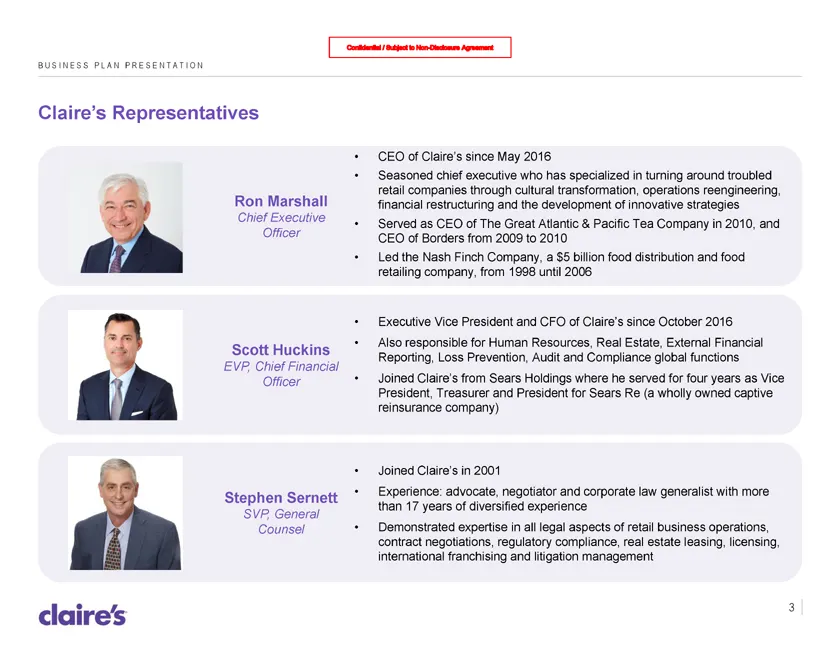
B U S I N E S S P L A N P R E S E N T A T I O N Claire’s Representatives • CEO of Claire’s since May 2016 • Seasoned chief executive who has specialized in turning around troubled retail companies through cultural transformation, operations reengineering, Ron Marshall financial restructuring and the
Slide 5: Claire's: What Differentiates Us
C O N F I D E N T I A L B U S I N E S S P L A N P R E S E N T A T I O N I Claire’s: What Differentiates Us
Slide 6: Company History
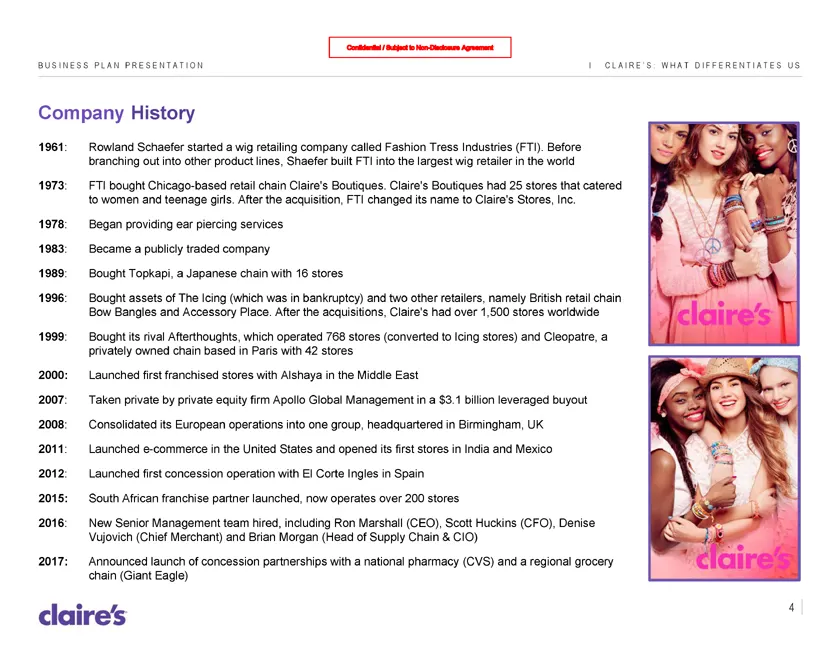
B U S I N E S S P L A N P R E S E N T A T I O N I C L A I R E ’ S : W H A T D I F F E R E N T I A T E S U S Company History 1961: Rowland Schaefer started a wig retailing company called Fashion Tress Industries (FTI). Before branching out into other product lines, Shaefer built FTI into the largest
Slide 7: Claire's Business Overview
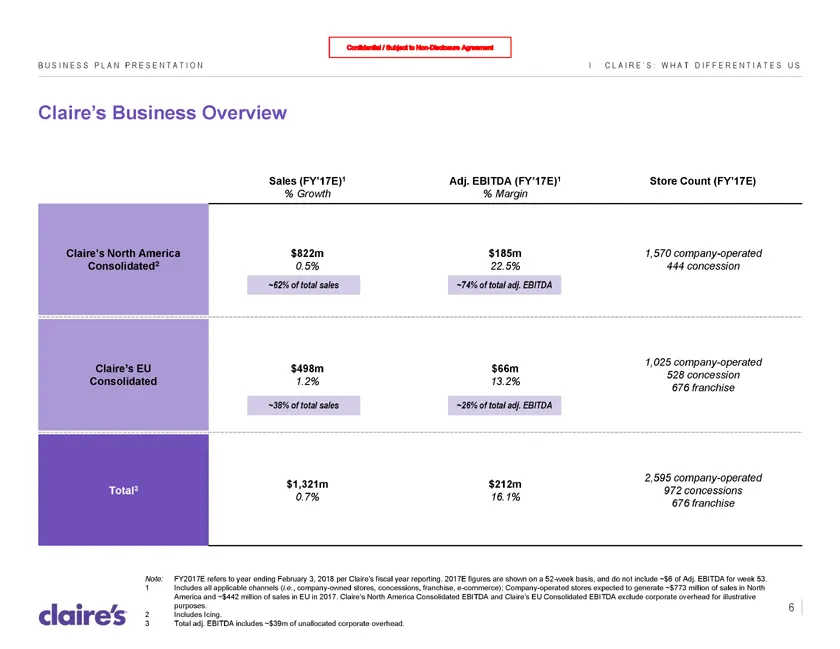
B U S I N E S S P L A N P R E S E N T A T I O N I C L A I R E ’ S : W H A T D I F F E R E N T I A T E S U S Claire’s Business Overview Sales (FY’17E)1 Adj. EBITDA (FY’17E)1 Store Count (FY’17E) % Growth % Margin Claire’s North America $822m $185m 1,570 company-operated Consolidated2 0.5% 22.5% 444 c
Slide 8: Leveraging the Value Chain
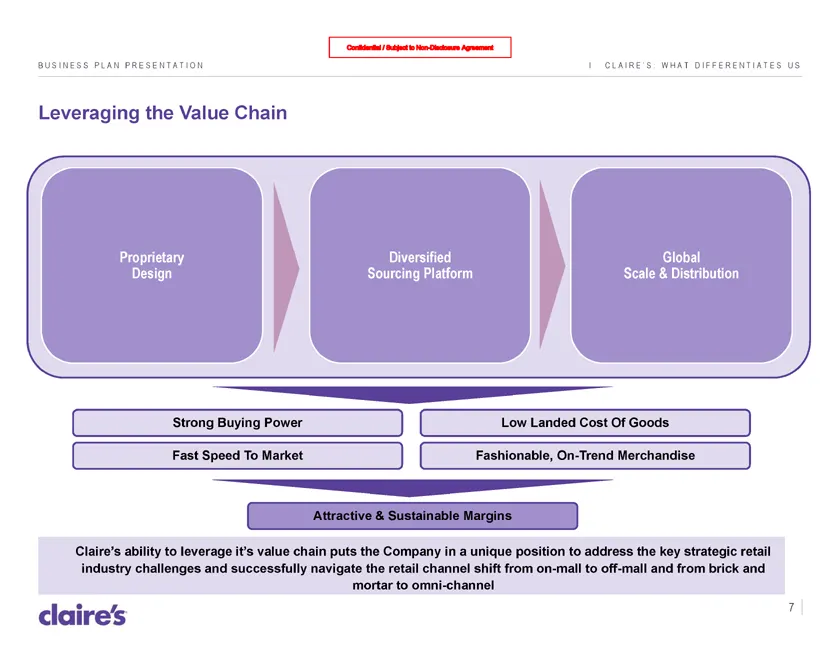
B U S I N E S S P L A N P R E S E N T A T I O N I C L A I R E ’ S : W H A T D I F F E R E N T I A T E S U S Leveraging the Value Chain Proprietary Diversified Global Design Sourcing Platform Scale & Distribution Strong Buying Power Low Landed Cost Of Goods Fast Speed To Market Fashionable, On-Trend
Slide 9: Key Strategic Assets
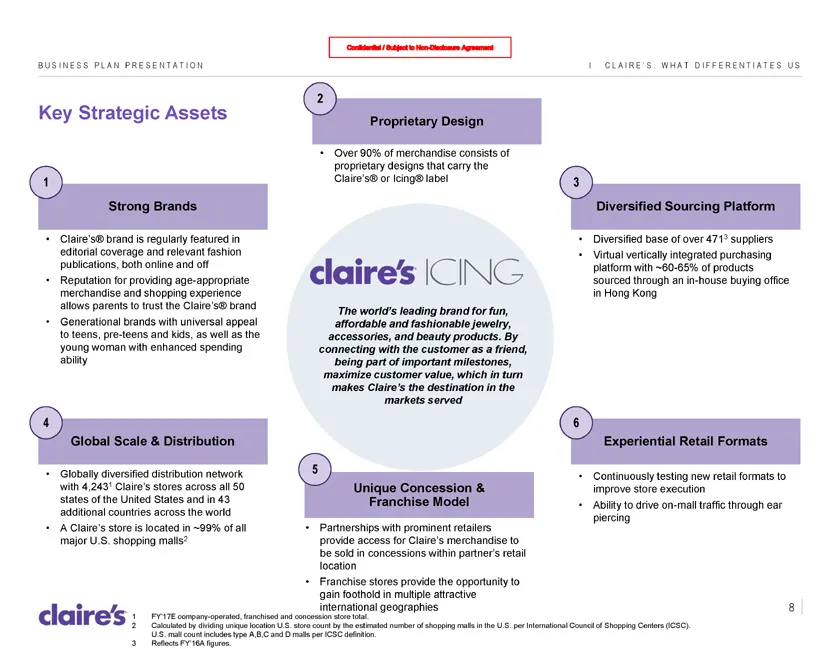
B U S I N E S S P L A N P R E S E N T A T I O N I C L A I R E ’ S : W H A T D I F F E R E N T I A T E S U S Key Strategic Assets 2 Proprietary Design • Over 90% of merchandise consists of proprietary designs that carry the 1 Claire’s® or Icing® label 3 Strong Brands Diversified Sourcing Platform • C
Slide 10: Strong Brands
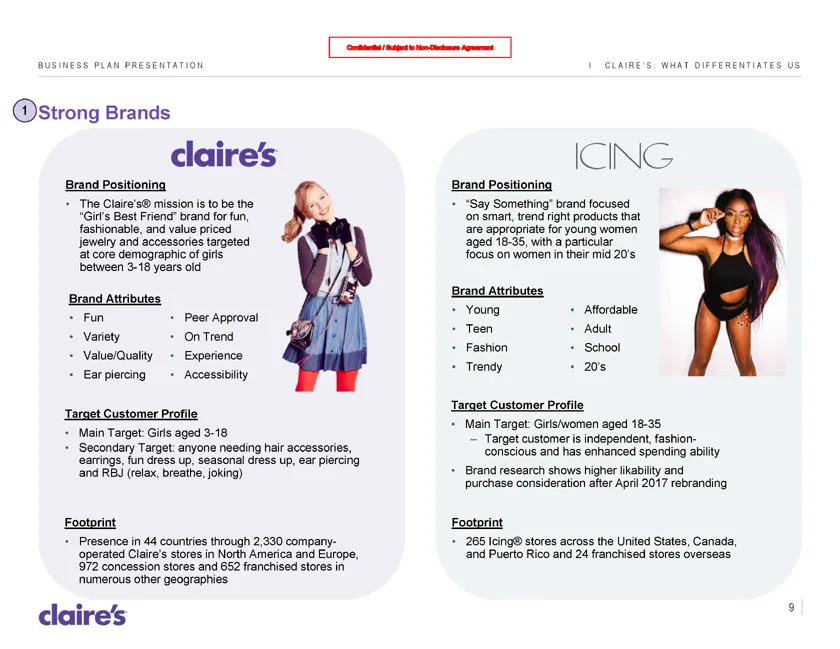
B U S I N E S S P L A N P R E S E N T A T I O N I C L A I R E ‘ S : W H A T D I F F E R E N T I A T E S U S 1 Strong Brands Brand Positioning Brand Positioning • The Claire’s® mission is to be the • “Say Something” brand focused “Girl’s Best Friend” brand for fun, on smart, trend right products that
Slide 11: Proprietary Design
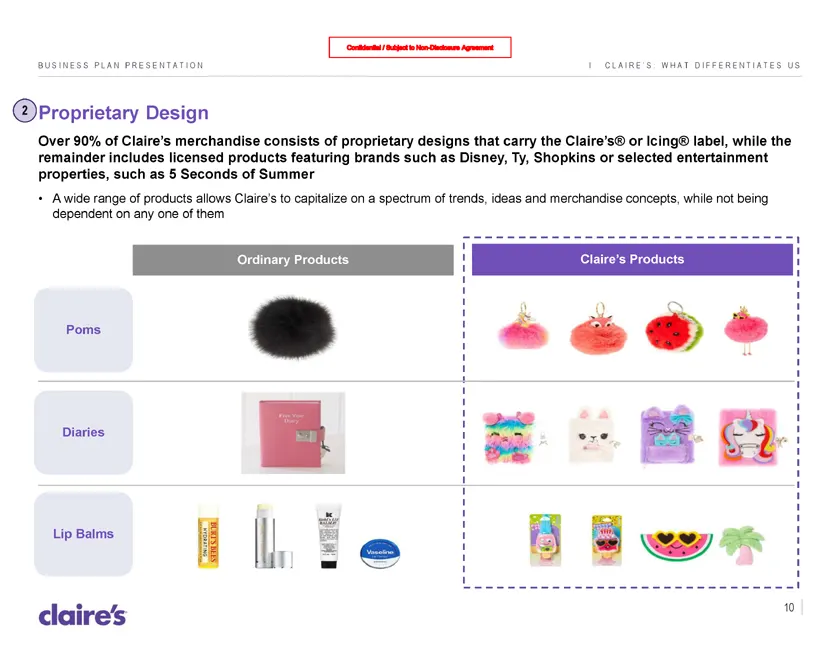
B U S I N E S S P L A N P R E S E N T A T I O N I C L A I R E ’ S : W H A T D I F F E R E N T I A T E S U S 2 Proprietary Design Over 90% of Claire’s merchandise consists of proprietary designs that carry the Claire’s® or Icing® label, while the remainder includes licensed products featuring brands
Slide 12: Diversified Sourcing Platform
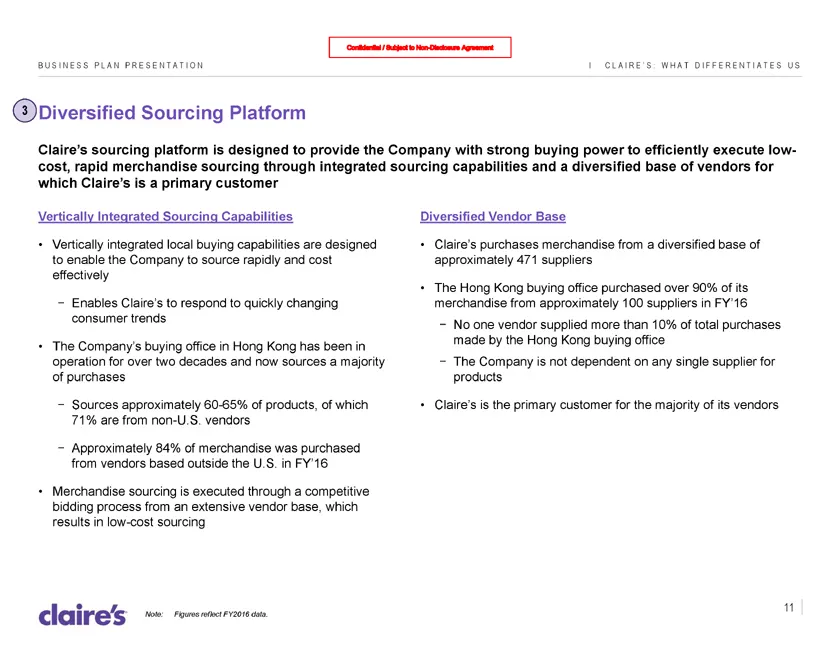
B U S I N E S S P L A N P R E S E N T A T I O N I C L A I R E ’ S : W H A T D I F F E R E N T I A T E S U S 3 Diversified Sourcing Platform Claire’s sourcing platform is designed to provide the Company with strong buying power to efficiently execute low-cost, rapid merchandise sourcing through integ
Slide 13: Global Scale & Distribution
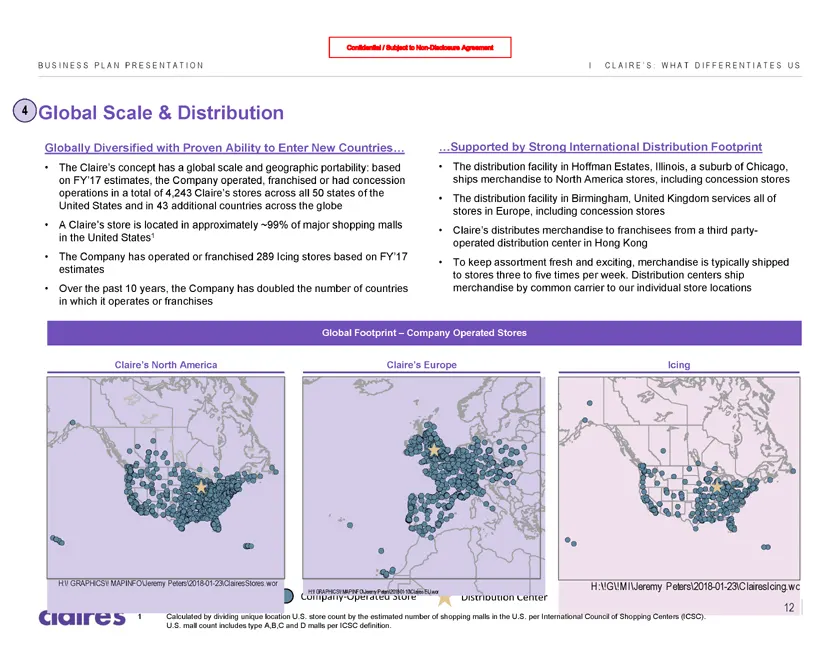
B U S I N E S S P L A N P R E S E N T A T I O N I C L A I R E ’ S : W H A T D I F F E R E N T I A T E S U S 4 Global Scale & Distribution Globally Diversified with Proven Ability to Enter New Countries… …Supported by Strong International Distribution Footprint • The Claire’s concept has a global sca
Slide 14: Concessions Business
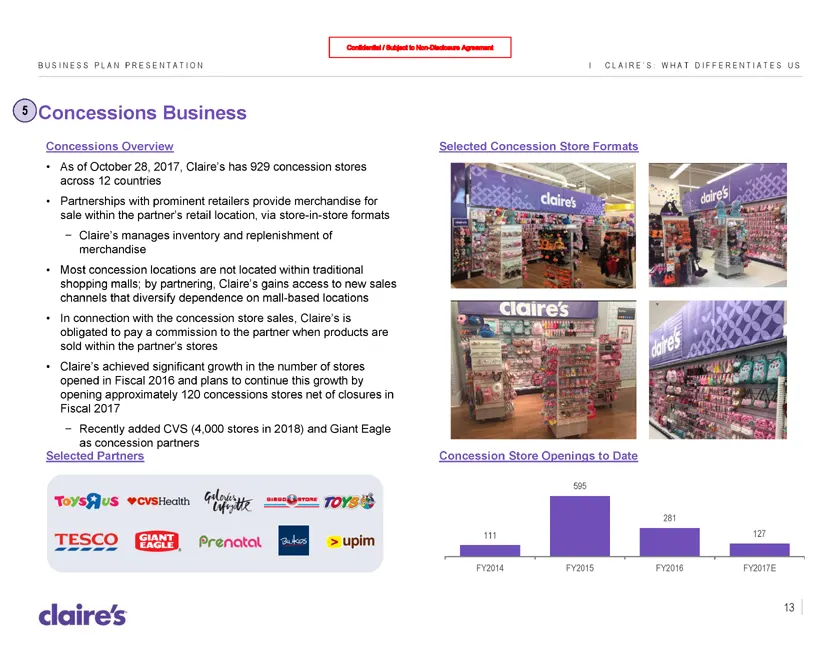
B U S I N E S S P L A N P R E S E N T A T I O N I C L A I R E ’ S : W H A T D I F F E R E N T I A T E S U S 5 Concessions Business Concessions Overview Selected Concession Store Formats • As of October 28, 2017, Claire’s has 929 concession stores across 12 countries • Partnerships with prominent ret
Slide 15: Franchised Stores
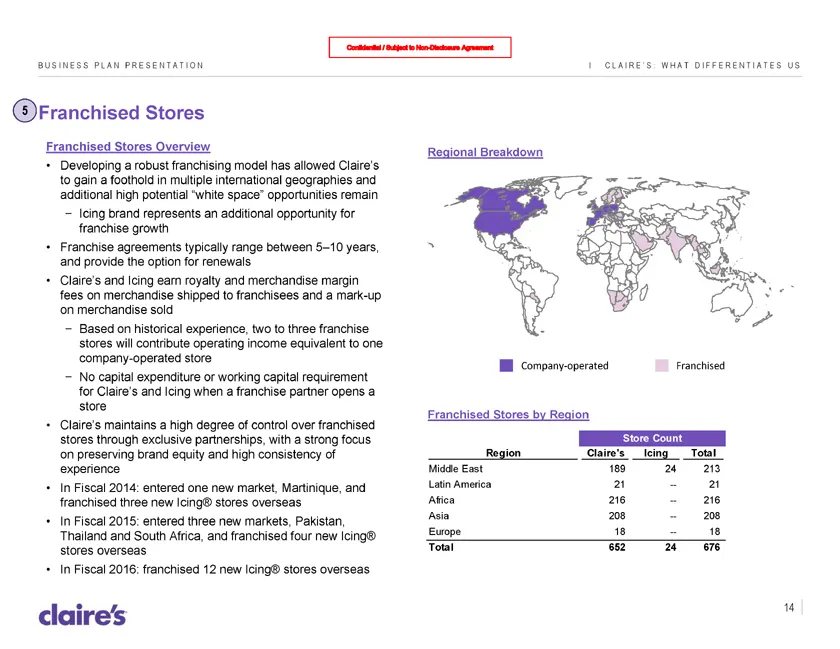
B U S I N E S S P L A N P R E S E N T A T I O N I C L A I R E ’ S : W H A T D I F F E R E N T I A T E S U S 5 Franchised Stores Franchised Stores Overview Regional Breakdown • Developing a robust franchising model has allowed Claire’s to gain a foothold in multiple international geographies and addi
Slide 16: Experiential Retail Formats
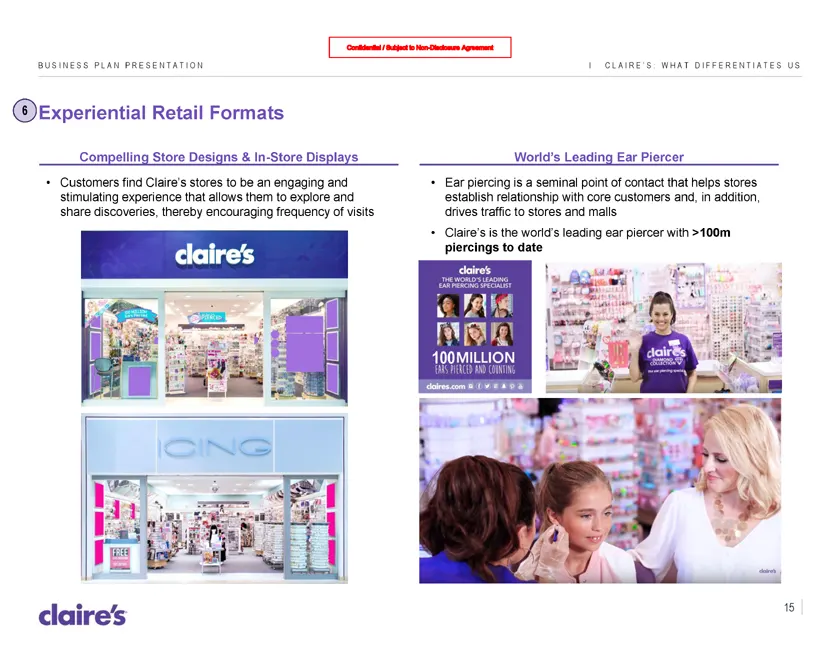
B U S I N E S S P L A N P R E S E N T A T I O N I C L A I R E ’ S : W H A T D I F F E R E N T I A T E S U S 6 Experiential Retail Formats Compelling Store Designs & In-Store Displays World’s Leading Ear Piercer • Customers find Claire’s stores to be an engaging and • Ear piercing is a seminal point
Slide 17: Recent Trends
C O N F I D E N T I A L B U S I N E S S P L A N P R E S E N T A T I O N II Recent Trends
Slide 18: SSS Momentum
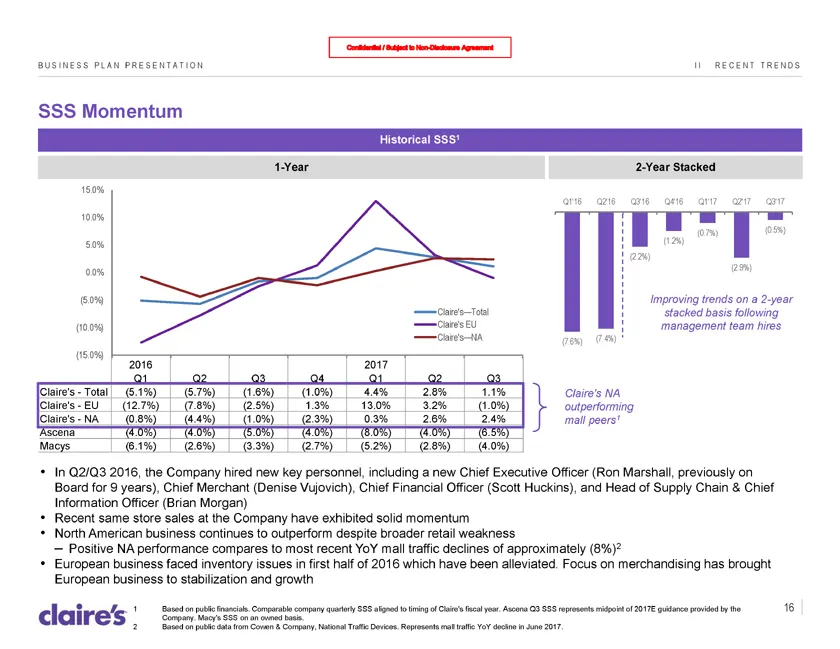
B U S I N E S S P L A N P R E S E N T A T I O N I I R E C E N T T R E N D S SSS Momentum Historical SSS1 1-Year 2-Year Stacked 15.0% Q1’16 Q2’16 Q3’16 Q4’16 Q1’17 Q2’17 Q3’17 10.0% (0.7%) (0.5%) 5.0% (1.2%) (2.2%) (2.9%) 0.0% (5.0%) Improving trends on a 2-year Claire’s—Total stacked basis following
Slide 19: Q3 2017 Actual Financial Performance
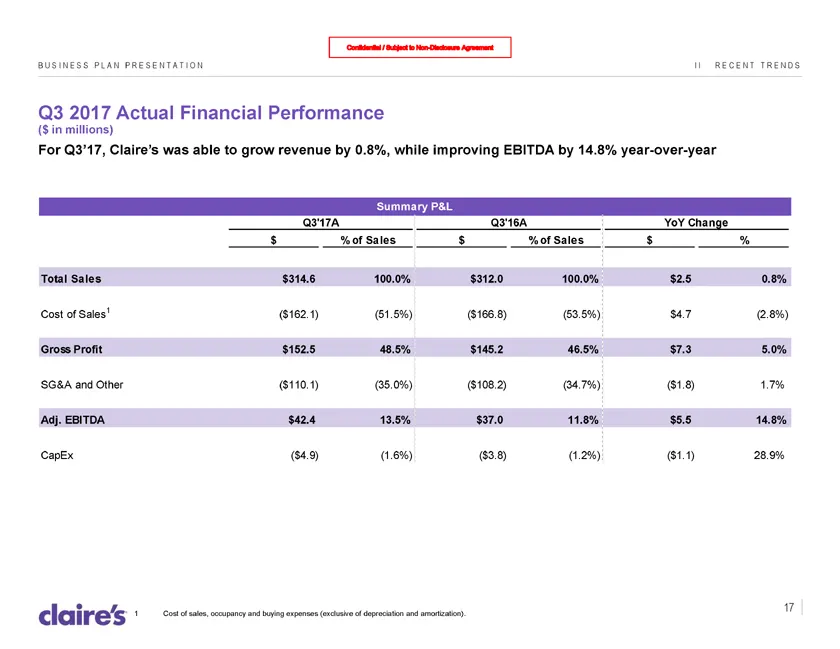
B U S I N E S S P L A N P R E S E N T A T I O N I I R E C E N T T R E N D S Q3 2017 Actual Financial Performance ($ in millions) For Q3’17, Claire’s was able to grow revenue by 0.8%, while improving EBITDA by 14.8% year-over-year Summary P&L Q3’17A Q3’16A YoY Change $ % of Sales $ % of Sales $ % Tot
Slide 20: Q4 2017 Forecast Financial Performance
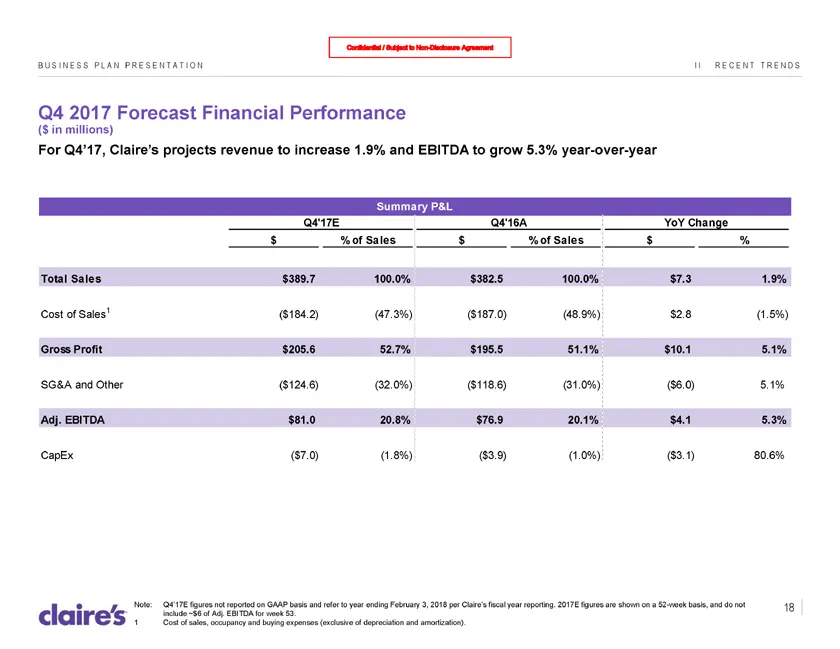
B U S I N E S S P L A N P R E S E N T A T I O N I I R E C E N T T R E N D S Q4 2017 Forecast Financial Performance ($ in millions) For Q4’17, Claire’s projects revenue to increase 1.9% and EBITDA to grow 5.3% year-over-year Summary P&L Q4’17E Q4’16A YoY Change $ % of Sales $ % of Sales $ % Total Sal
Slide 21: FY 2017 Forecast Financial Performance
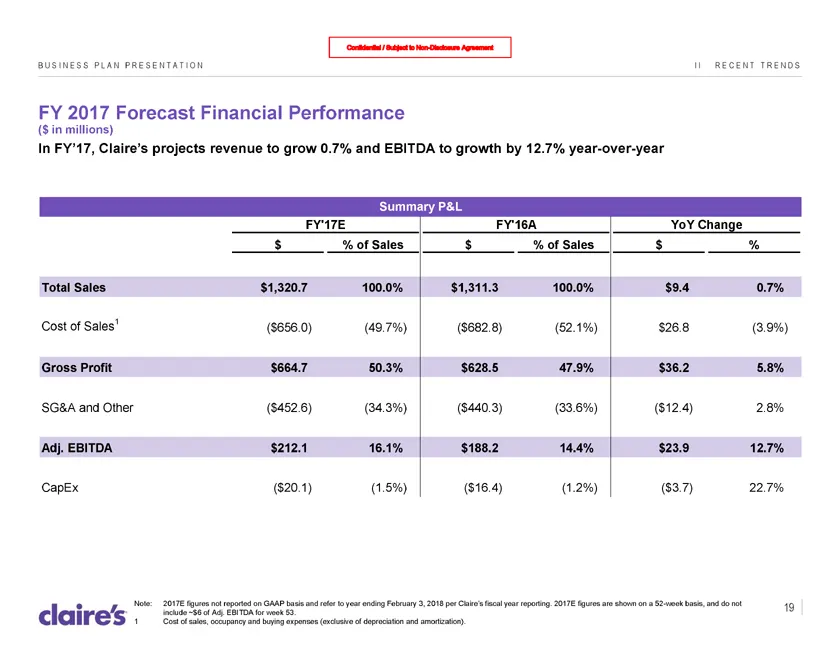
B U S I N E S S P L A N P R E S E N T A T I O N I I R E C E N T T R E N D S FY 2017 Forecast Financial Performance ($ in millions) In FY’17, Claire’s projects revenue to grow 0.7% and EBITDA to growth by 12.7% year-over-year Summary P&L FY’17E FY’16A YoY Change $ % of Sales $ % of Sales $ % Total Sa
Slide 22: Key Turnaround Initiatives
C O N F I D E N T I A L B U S I N E S S P L A N P R E S E N T A T I O N III Key Turnaround Initiatives
Slide 23: Digital Investments
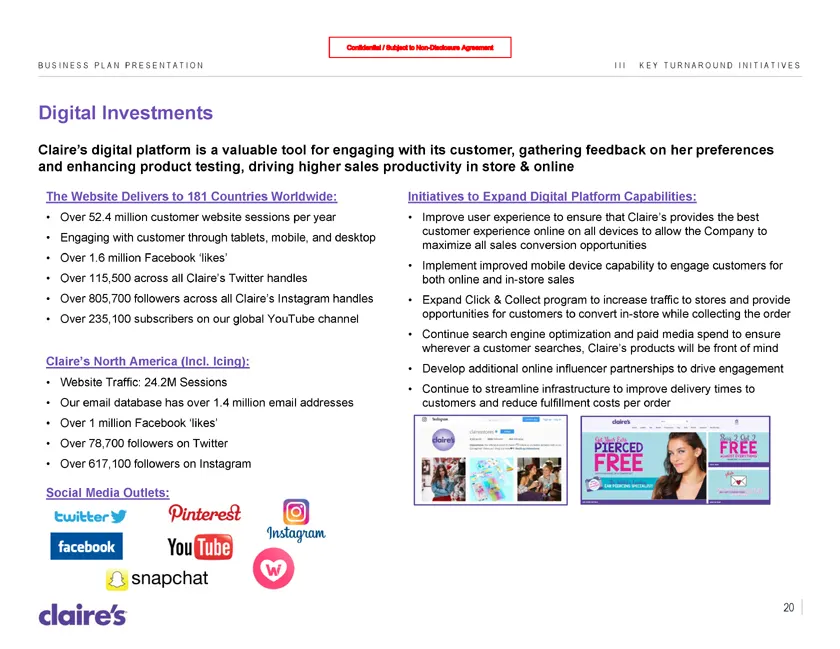
B U S I N E S S P L A N P R E S E N T A T I O N I I I K E Y T U R N A R O U N D I N I T I A T I V E S Digital Investments Claire’s digital platform is a valuable tool for engaging with its customer, gathering feedback on her preferences and enhancing product testing, driving higher sales productivit
Slide 24: Real Estate Rationalization
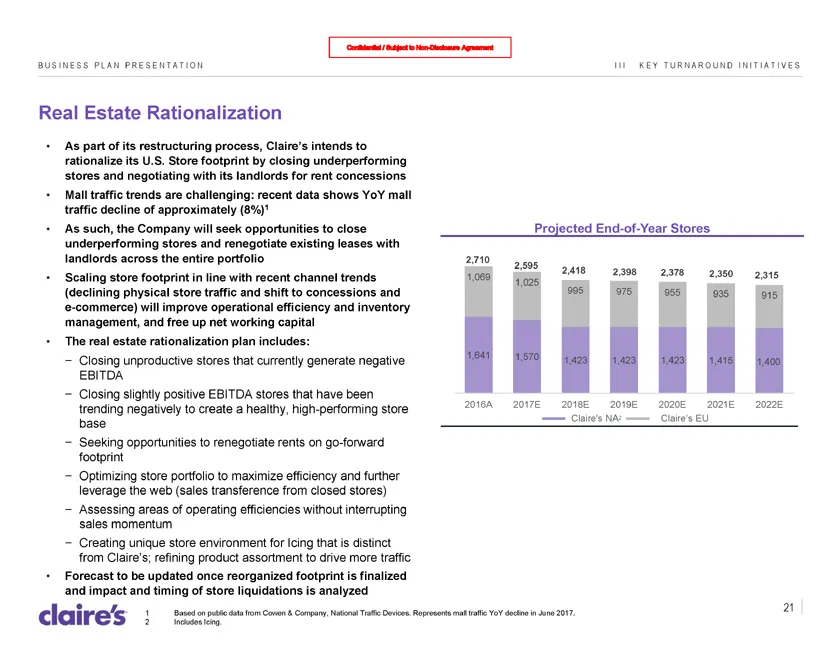
B U S I N E S S P L A N P R E S E N T A T I O N I I I K E Y T U R N A R O U N D I N I T I A T I V E S Real Estate Rationalization • As part of its restructuring process, Claire’s intends to rationalize its U.S. Store footprint by closing underperforming stores and negotiating with its landlords for
Slide 25: Icing Repositioning
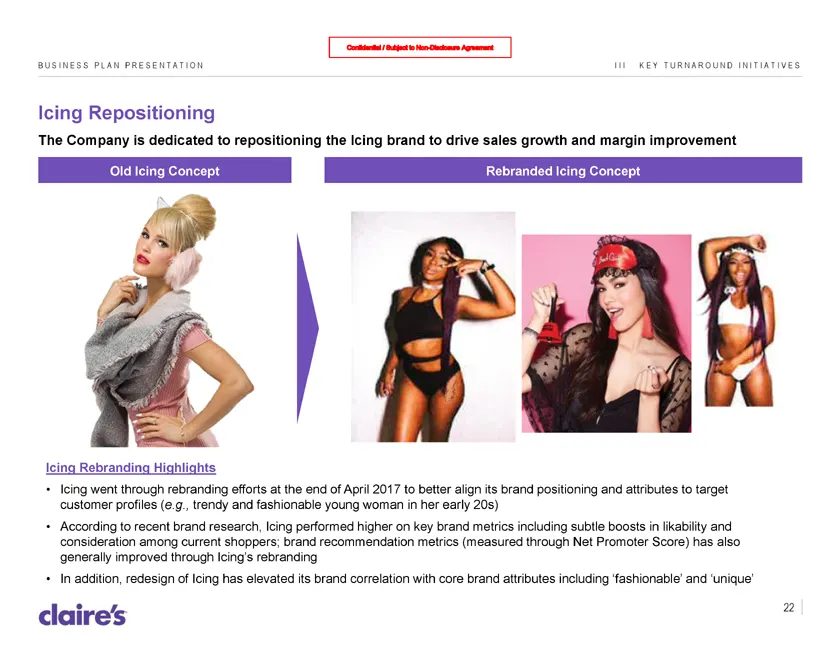
B U S I N E S S P L A N P R E S E N T A T I O N I I I K E Y T U R N A R O U N D I N I T I A T I V E S Icing Repositioning The Company is dedicated to repositioning the Icing brand to drive sales growth and margin improvement Old Icing Concept Rebranded Icing Concept Icing Rebranding Highlights • Ici
Slide 26: Focus on Experiential Elements
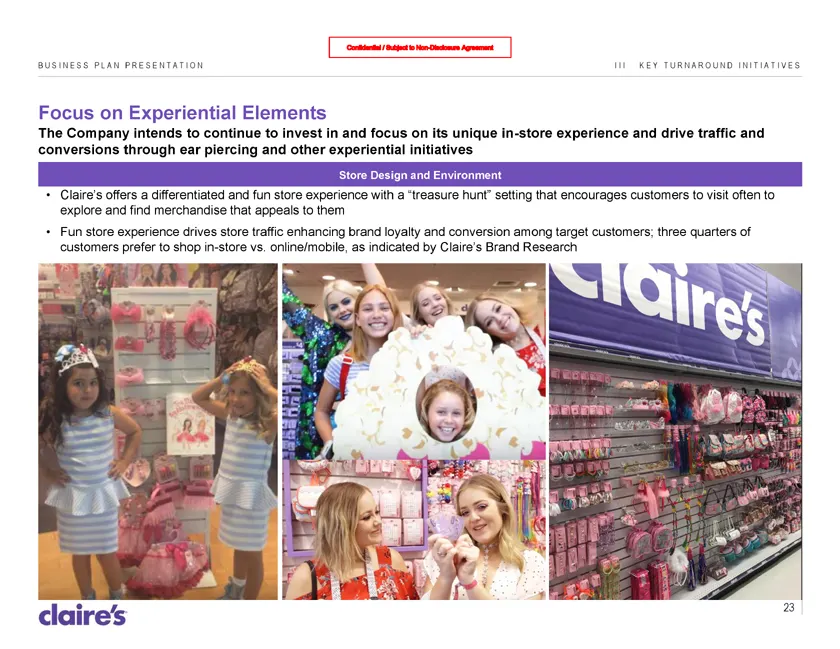
B U S I N E S S P L A N P R E S E N T A T I O N I I I K E Y T U R N A R O U N D I N I T I A T I V E S Focus on Experiential Elements The Company intends to continue to invest in and focus on its unique in-store experience and drive traffic and conversions through ear piercing and other experiential
Slide 27: Financial Projections
C O N F I D E N T I A L B U S I N E S S P L A N P R E S E N T A T I O N IV Financial Projections
Slide 28: Operating Model Driven by 5 Key Assumptions
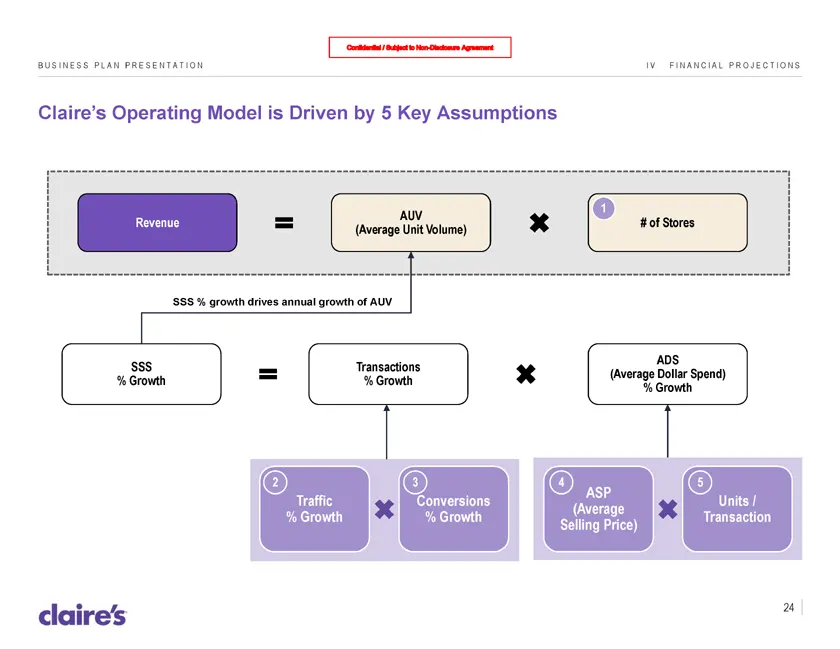
B U S I N E S S P L A N P R E S E N T A T I O N I V F I N A N C I A L P R O J E C T I O N S Claire’s Operating Model is Driven by 5 Key Assumptions 1 AUV Revenue # of Stores (Average Unit Volume) SSS % growth drives annual growth of AUV ADS SSS Transactions (Average Dollar Spend) % Growth % Growth %
Slide 29: Same Store Sales Growth Forecasts
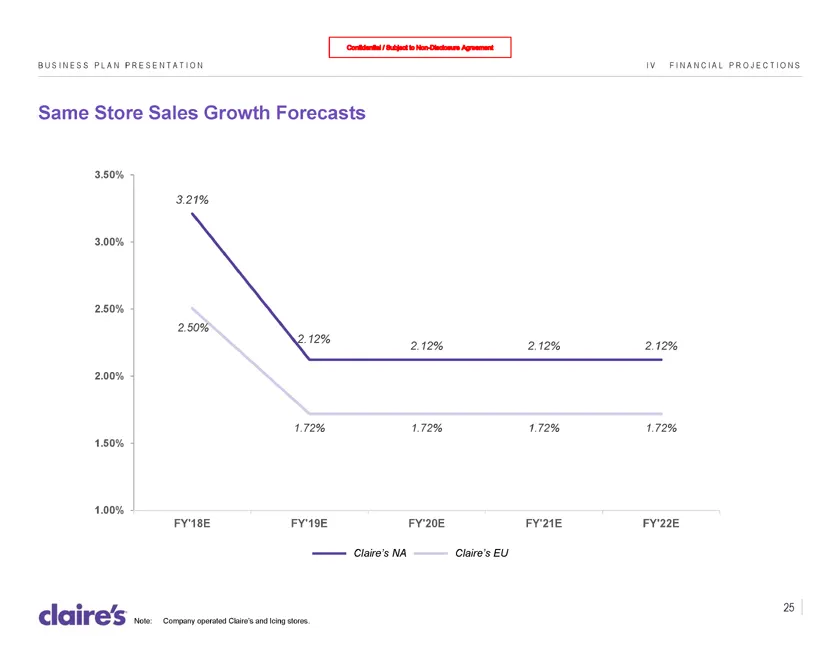
B U S I N E S S P L A N P R E S E N T A T I O N I V F I N A N C I A L P R O J E C T I O N S Same Store Sales Growth Forecasts 3.50% 3.21% 3.00% 2.50% 2.50% 2.12% 2.12% 2.12% 2.12% 2.00% 1.72% 1.72% 1.72% 1.72% 1.50% 1.00% FY’18E FY’19E FY’20E FY’21E FY’22E Claire’s NA Claire’s EU 25 Note: Company op
Slide 30: Claire's Business Plan Summary
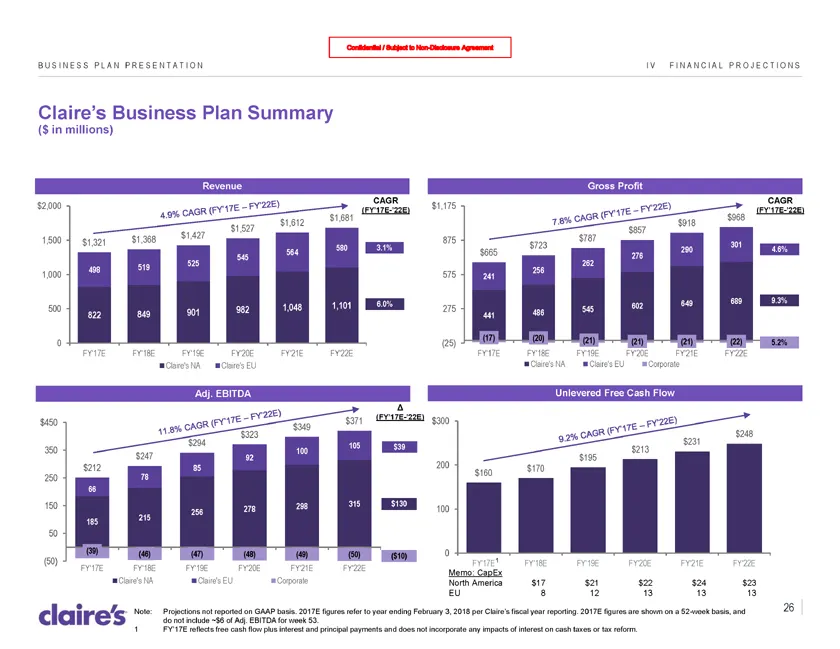
B U S I N E S S P L A N P R E S E N T A T I O N I V F I N A N C I A L P R O J E C T I O N S Claire’s Business Plan Summary ($ in millions) Revenue Gross Profit CAGR CAGR $2,000 $1,175 (FY’17E-’22E) (FY’17E-’22E) $1,681 $968 $1,612 $918 $1,527 $857 $1,368 $1,427 $787 1,500 $1,321 875 580 3.1% $723 30
Slide 31: Long-Term Projections
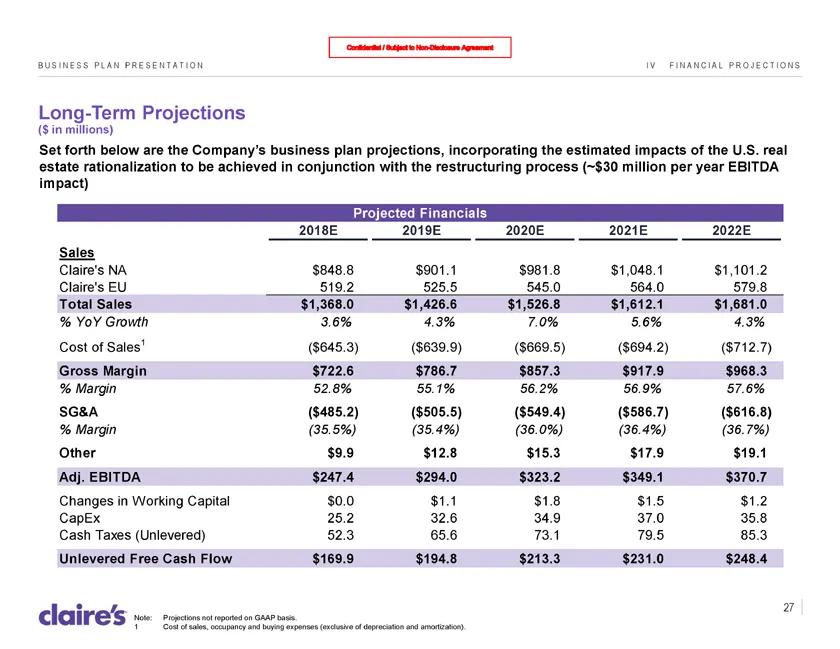
B U S I N E S S P L A N P R E S E N T A T I O N I V F I N A N C I A L P R O J E C T I O N S Long-Term Projections ($ in millions) Set forth below are the Company’s business plan projections, incorporating the estimated impacts of the U.S. real estate rationalization to be achieved in conjunction wit
Slide 32: Appendix
C O N F I D E N T I A L B U S I N E S S P L A N P R E S E N T A T I O N Appendix
Slide 33: Capitalization Summary
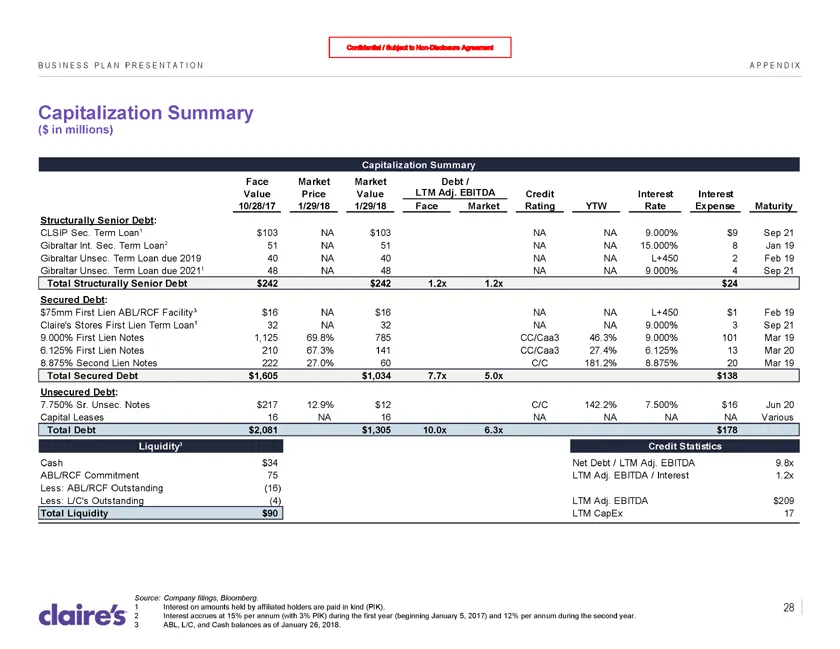
B U S I N E S S P L A N P R E S E N T A T I O N A P P E N D I X Capitalization Summary ($ in millions) Capitalization Summary Face Market Market Debt / Value Price Value LTM Adj. EBITDA Credit Interest Interest 10/28/17 1/29/18 1/29/18 Face Market Rating YTW Rate Expense Maturity Structurally Senior
Slide 34: Corporate Entity Structure
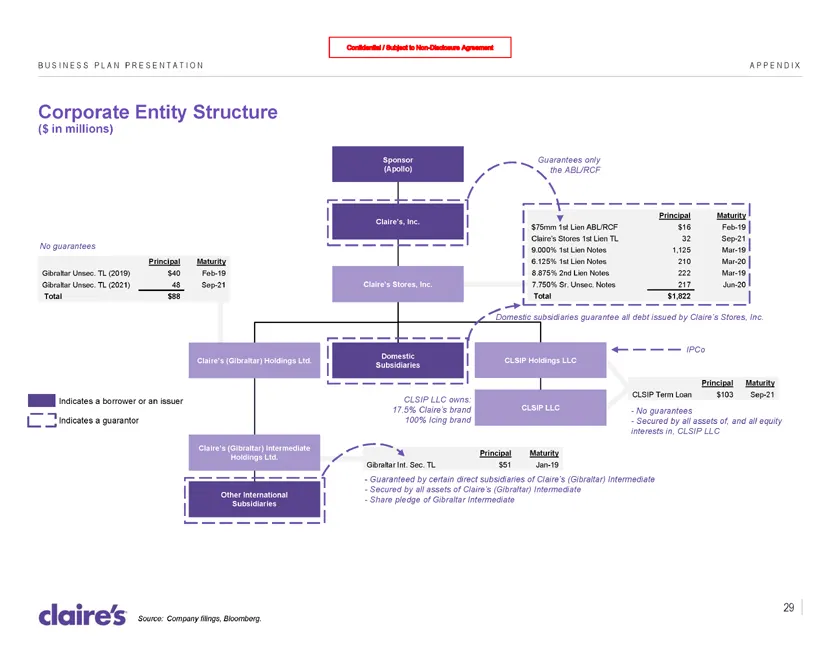
B U S I N E S S P L A N P R E S E N T A T I O N A P P E N D I X Corporate Entity Structure ($ in millions) Sponsor Guarantees only (Apollo) the ABL/RCF Claire’s, Inc. Principal Maturity $75mm 1st Lien ABL/RCF $16 Feb-19 Claire’s Stores 1st Lien TL 32 Sep-21 No guarantees 9.000% 1st Lien Notes 1,125
Source: SEC EDGAR · 8-K filed Mar 19, 2018