Claires Stores — Investor Presentation (May 2003)
13 slides from Claires Stores's investor presentation, May 13, 2003
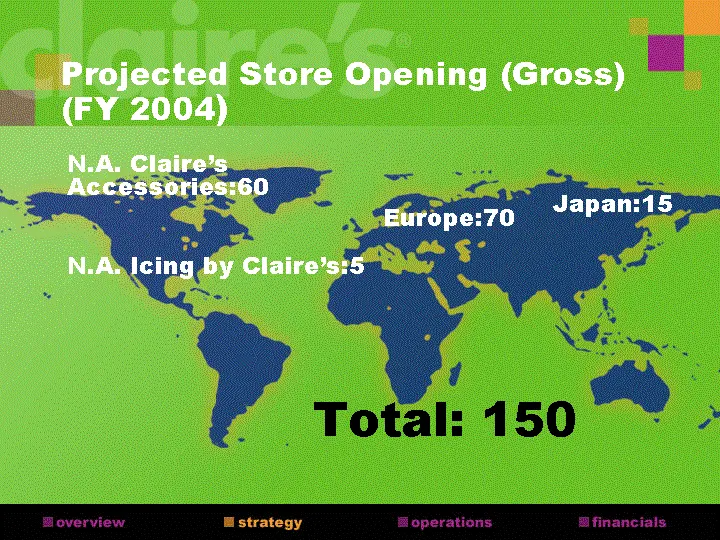
Slide 1: Projected Store Opening (Gross) (FY 2004)
Projected Store Opening (Gross) (FY 2004) Europe:70 N.A. Claire's Accessories:60 N.A. Icing by Claire's:5 Total: 150 Japan:15

Slide 2: Financial
nanc
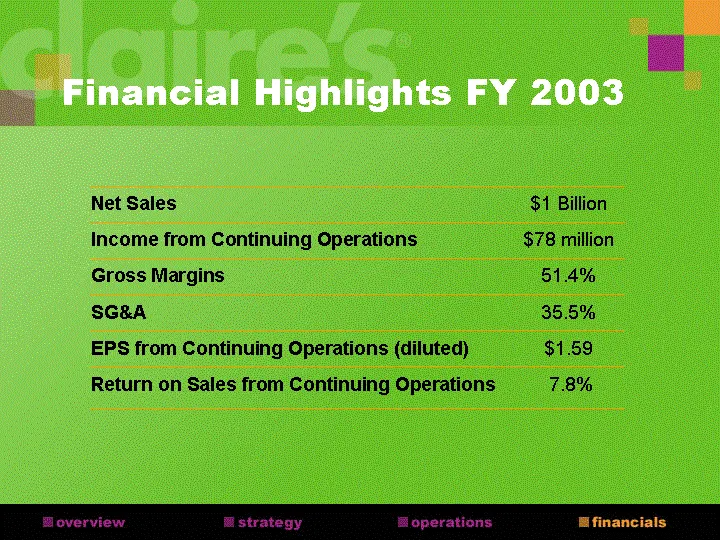
Slide 3: Financial Highlights FY 2003
Financial Highlights FY 2003 Net Sales $1 Billion Income from Continuing Operations $78 million Gross Margins 51.4% SG&A 35.5% EPS from Continuing Operations (diluted) $1.59 Return on Sales from Continuing Operations 7.8%
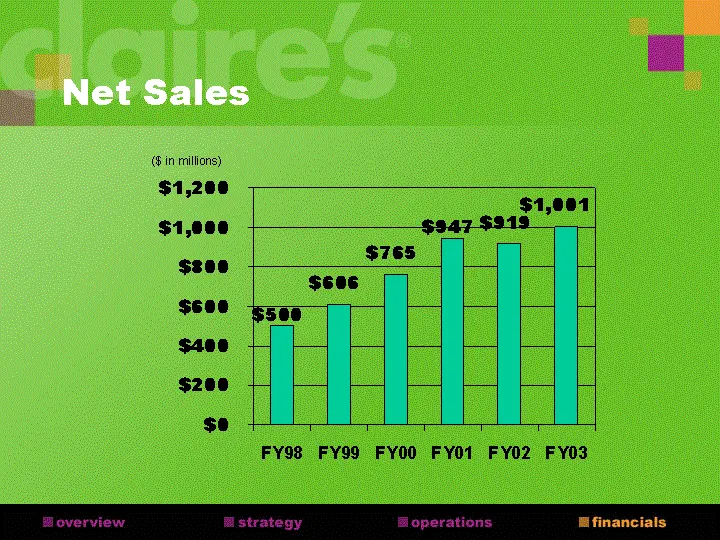
Slide 4: Net Sales
Net Sales FY98 FY99 FY00 FY01 FY02 FY03 Net Sales 500 606 765 947 919 1001 ($ in millions)
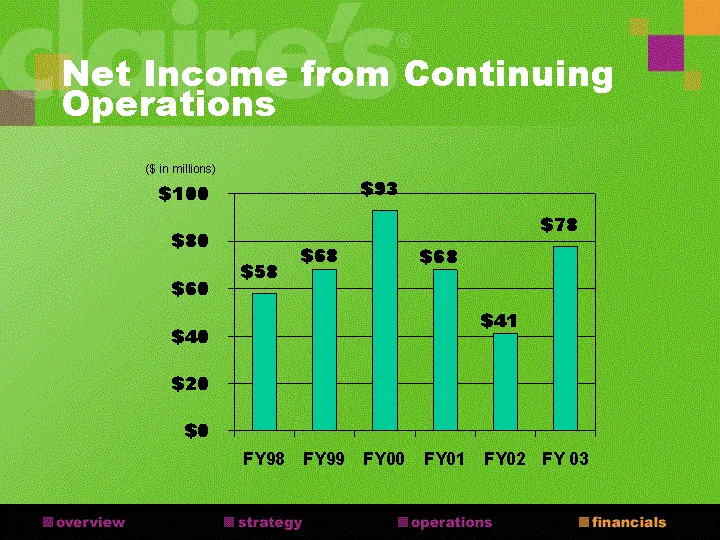
Slide 5: Net Income from Continuing Operations
Net Income from Continuing Operations FY98 FY99 FY00 FY01 FY02 FY 03 Income 58 68 93 68 41 78 ($ in millions)
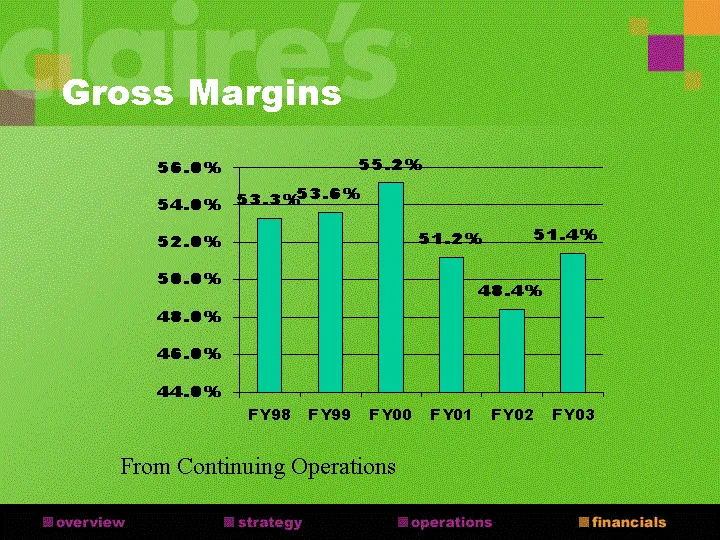
Slide 6: Gross Margins From Continuing Operations
Gross Margins From Continuing Operations FY98 FY99 FY00 FY01 FY02 Gross Margins 0.533 0.536 0.552 0.512 0.484 FY98 FY99 FY00 FY01 FY02 FY03 Gross Margins 0.533 0.536 0.552 0.512 0.484 0.514
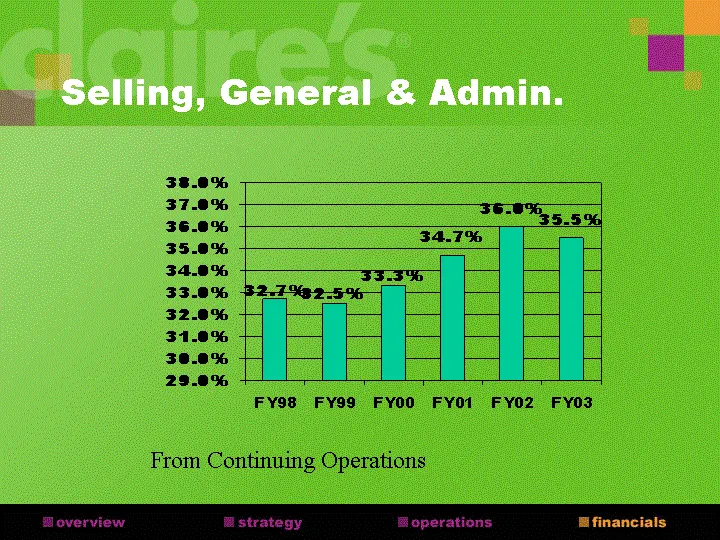
Slide 7: Selling, General & Admin.
Selling, General & Admin. FY98 FY99 FY00 FY01 FY02 FY03 SELLING,... 0.327 0.325 0.333 0.347 0.36 0.355 From Continuing Operations
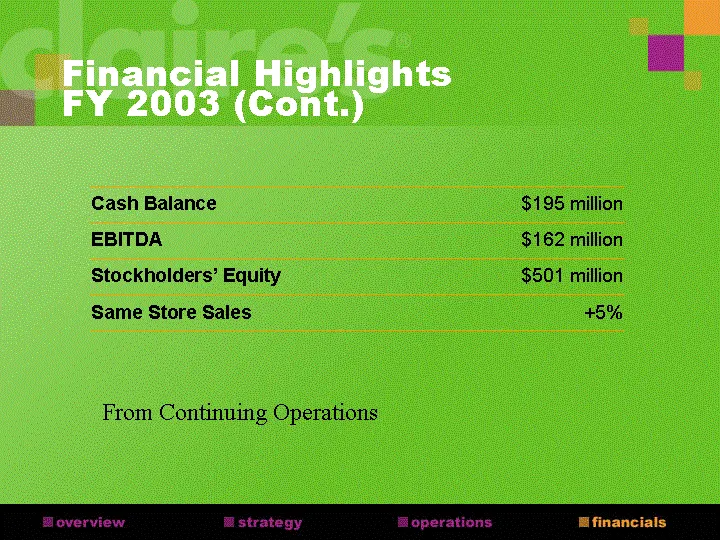
Slide 8: Financial Highlights FY 2003 (Cont.)
Financial Highlights FY 2003 (Cont.) Cash Balance $195 million EBITDA $162 million Stockholders' Equity $501 million Same Store Sales +5% From Continuing Operations
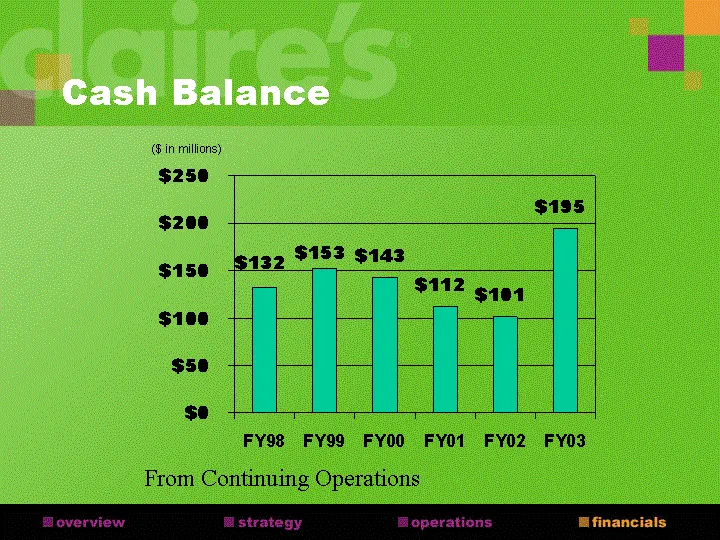
Slide 9: Cash Balance
Cash Balance FY98 FY99 FY00 FY01 FY02 FY03 Cash Balance 132 153 143 112 101 195 ($ in millions) From Continuing Operations
Slide 10: Financial Strength
Financial Strength Strong balance sheet Great cash flow even in tough economic environments Low debt to equity ratio Ability to react quickly to economic trends
Slide 11: Financial Goals for FY 2004
Financial Goals for FY 2004 Continue to control expenses Manage inventory levels to support sales Control promotional activity
Slide 12: Guidance for FY 2004
Guidance for FY 2004 Positive same store sales increases +5 percent for full year +8 percent for first quarter Gross Margins to improve by approximately 50 bps for full year
Slide 13: Guidance for FY 2004 (cont.)
Guidance for FY 2004 (cont.) EPS to increase to $1.81-$1.83 for FY 2004. 1st quarter-$0.24-$0.26 vs $0.19 Capital expenditures will approximate $45-50 million EBITDA to total approximately $178 million
Source: SEC EDGAR · 8-K filed May 13, 2003