OP Bancorp · NASDAQ:OPBK
OP Bancorp — Q4 2022 Earnings Presentation
22 slides from OP Bancorp's earnings presentation, Jan 26, 2023
Slide 1: 2022 Fourth Quarter Earnings Presentation
2022 Fourth Quarter Earnings Presentation January 26, 2023
Slide 2: Forward-Looking Statements
Certain matters set forth herein constitute “forward-looking statements” within the meaning of the Private Securities Litigation Reform Act of 1995, including forward-looking statements relating to the Company’s current business plans and expectations regarding future operating results. These forwar
Slide 3: 4Q-2022 Highlights vs 4Q-2021
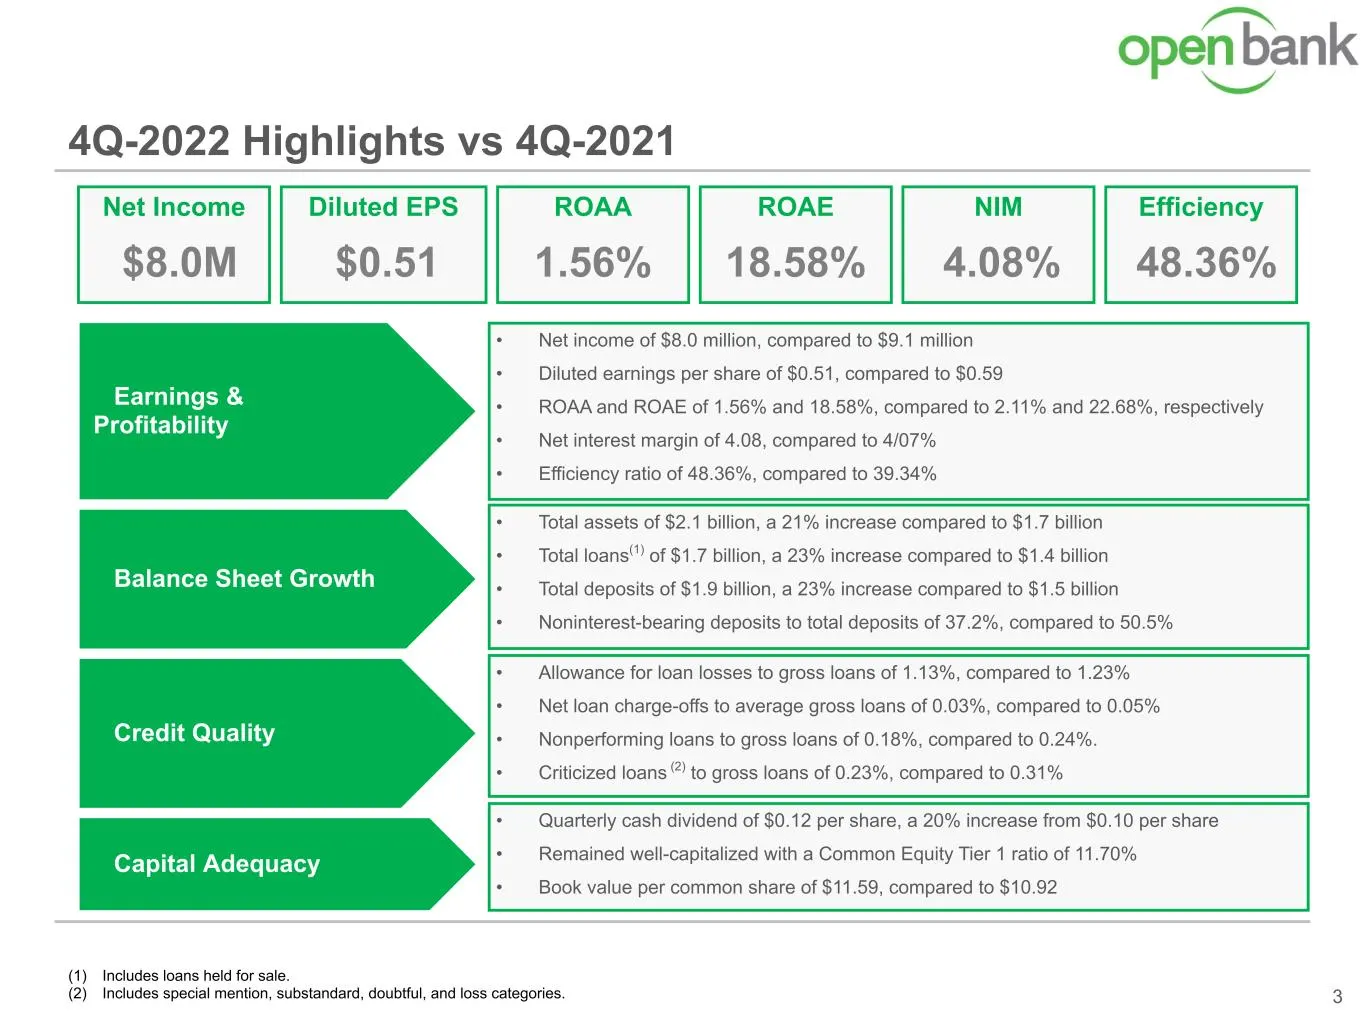
4Q-2022 Highlights vs 4Q-2021 3 (1) Includes loans held for sale. (2) Includes special mention, substandard, doubtful, and loss categories. Net Income $8.0M Earnings & Profitability Balance Sheet Growth Credit Quality Capital Adequacy • Net income of $8.0 million, compared to $9.1 million • Diluted
Slide 4: Balance Sheet Trend
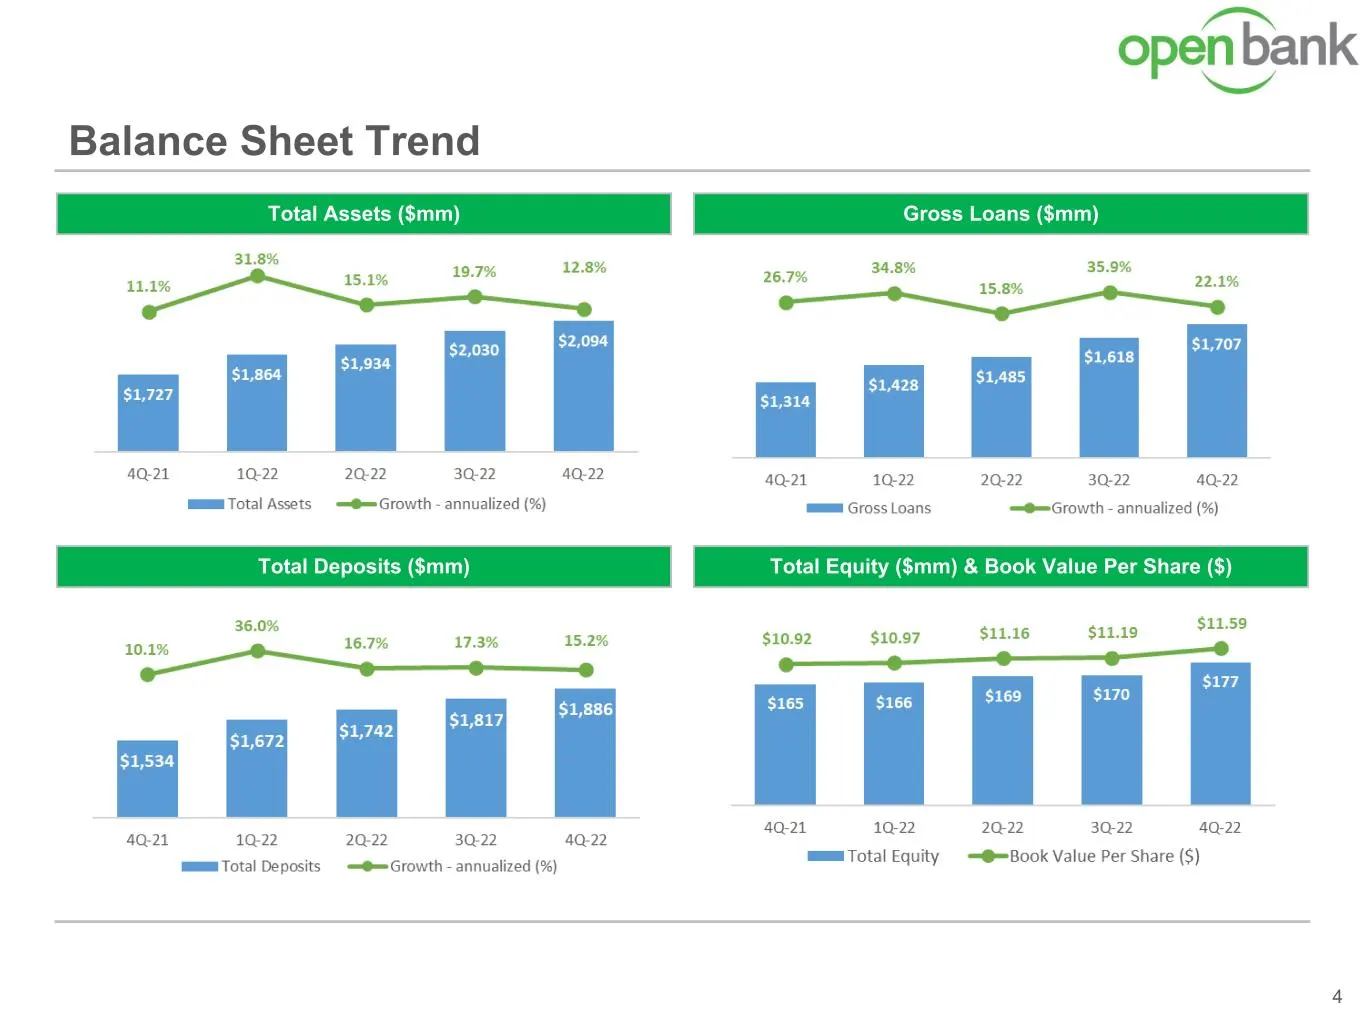
Balance Sheet Trend 4 Gross Loans ($mm)Total Assets ($mm) Total Equity ($mm) & Book Value Per Share ($)Total Deposits ($mm)
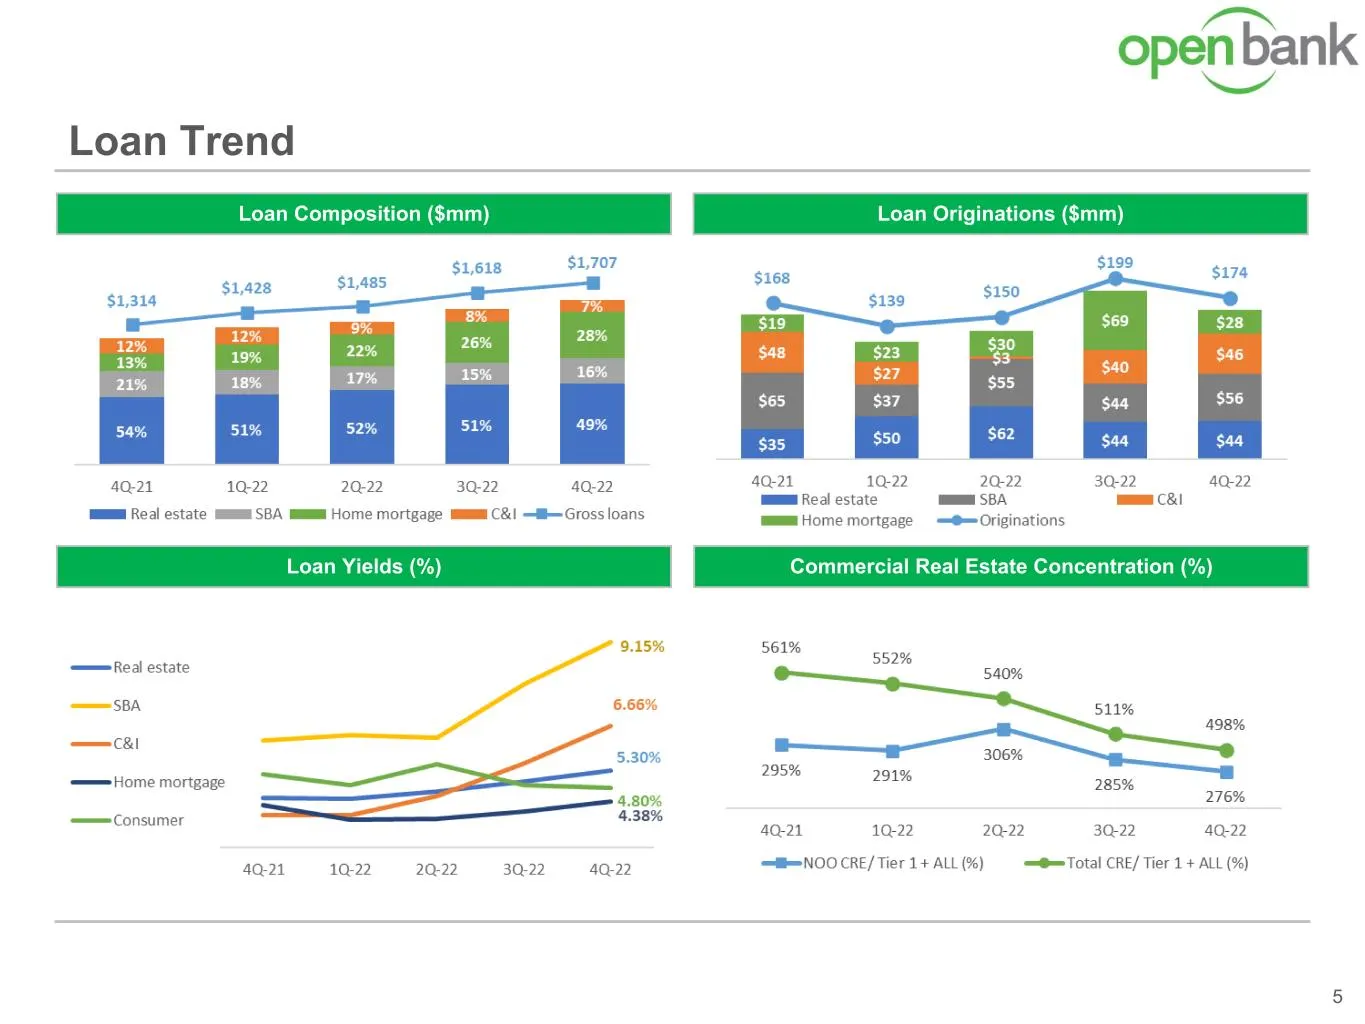
Slide 5: Loan Trend
Loan Trend 5 Loan Originations ($mm)Loan Composition ($mm) Loan Yields (%) Commercial Real Estate Concentration (%)
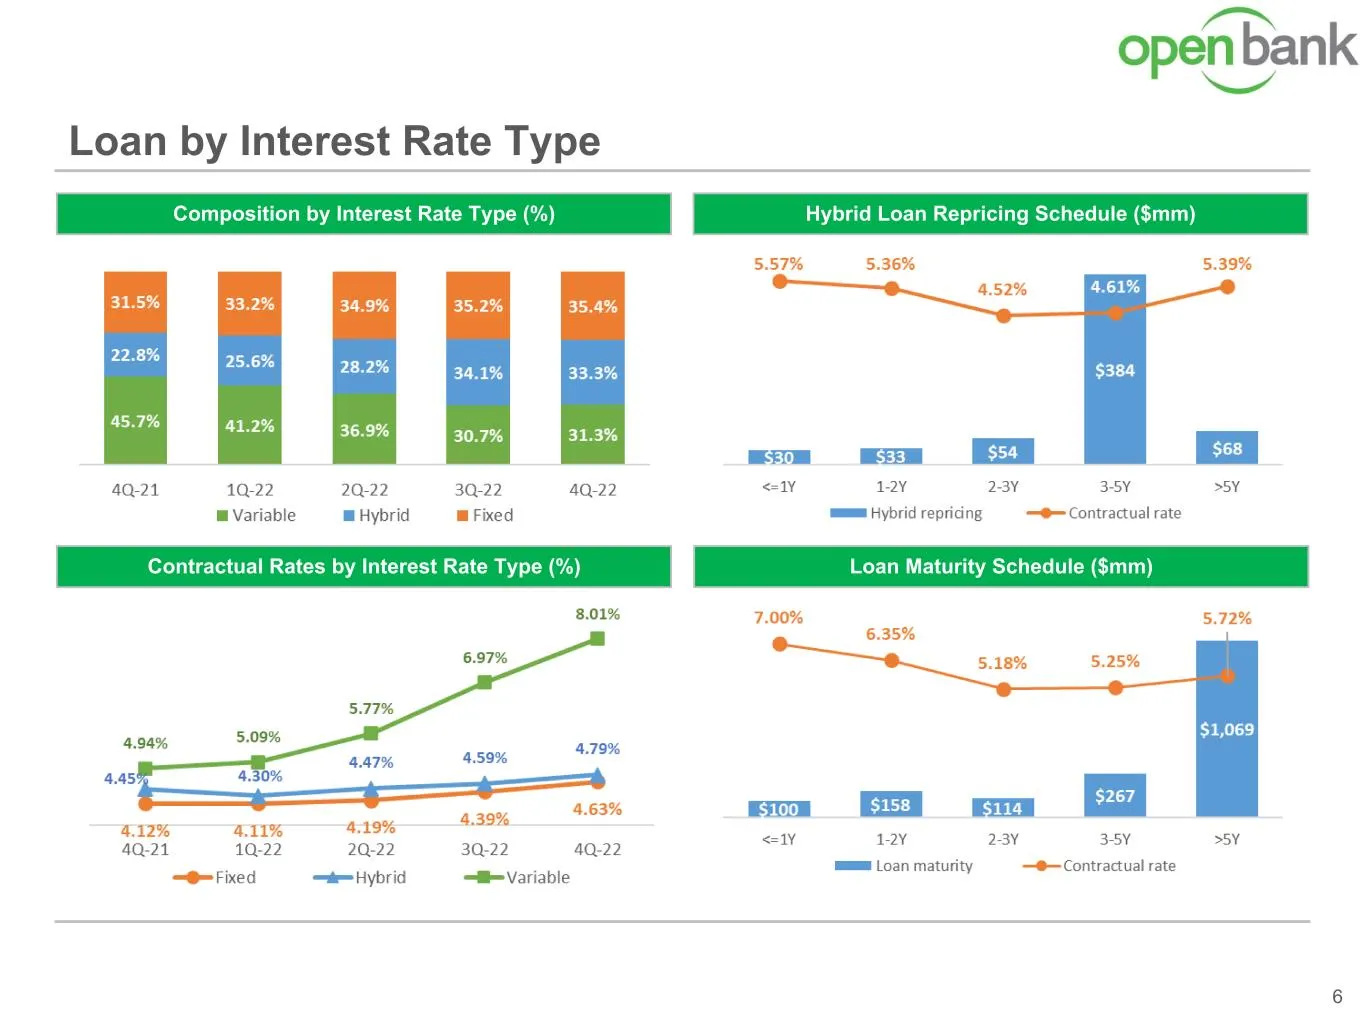
Slide 6: Loan by Interest Rate Type
Loan by Interest Rate Type 6 Hybrid Loan Repricing Schedule ($mm)Composition by Interest Rate Type (%) Contractual Rates by Interest Rate Type (%) Loan Maturity Schedule ($mm)
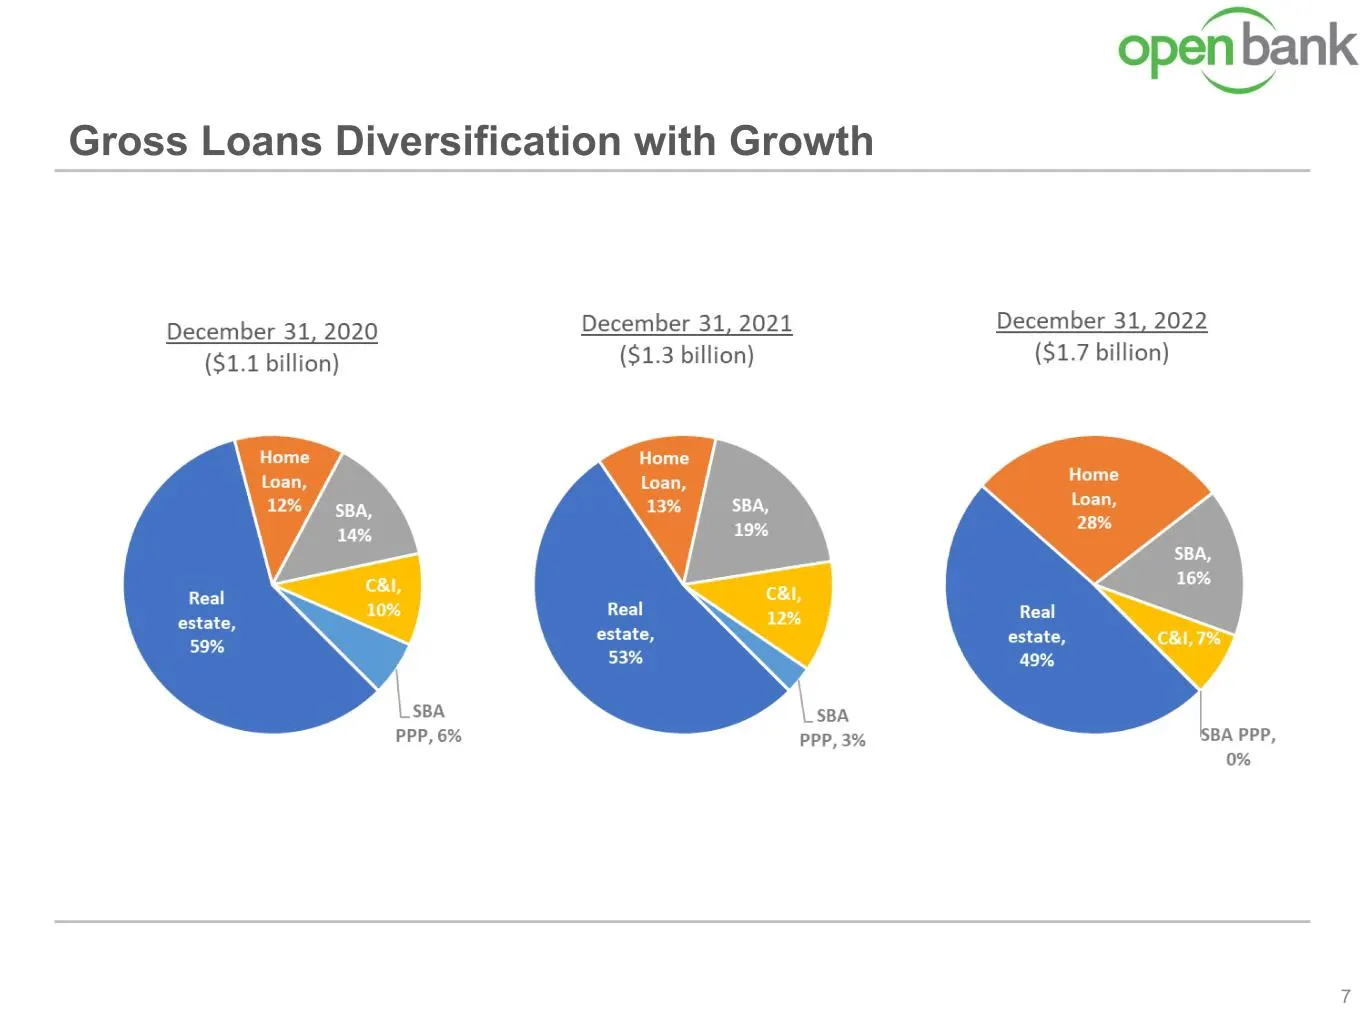
Slide 7: Gross Loans Diversification with Growth
Gross Loans Diversification with Growth 7
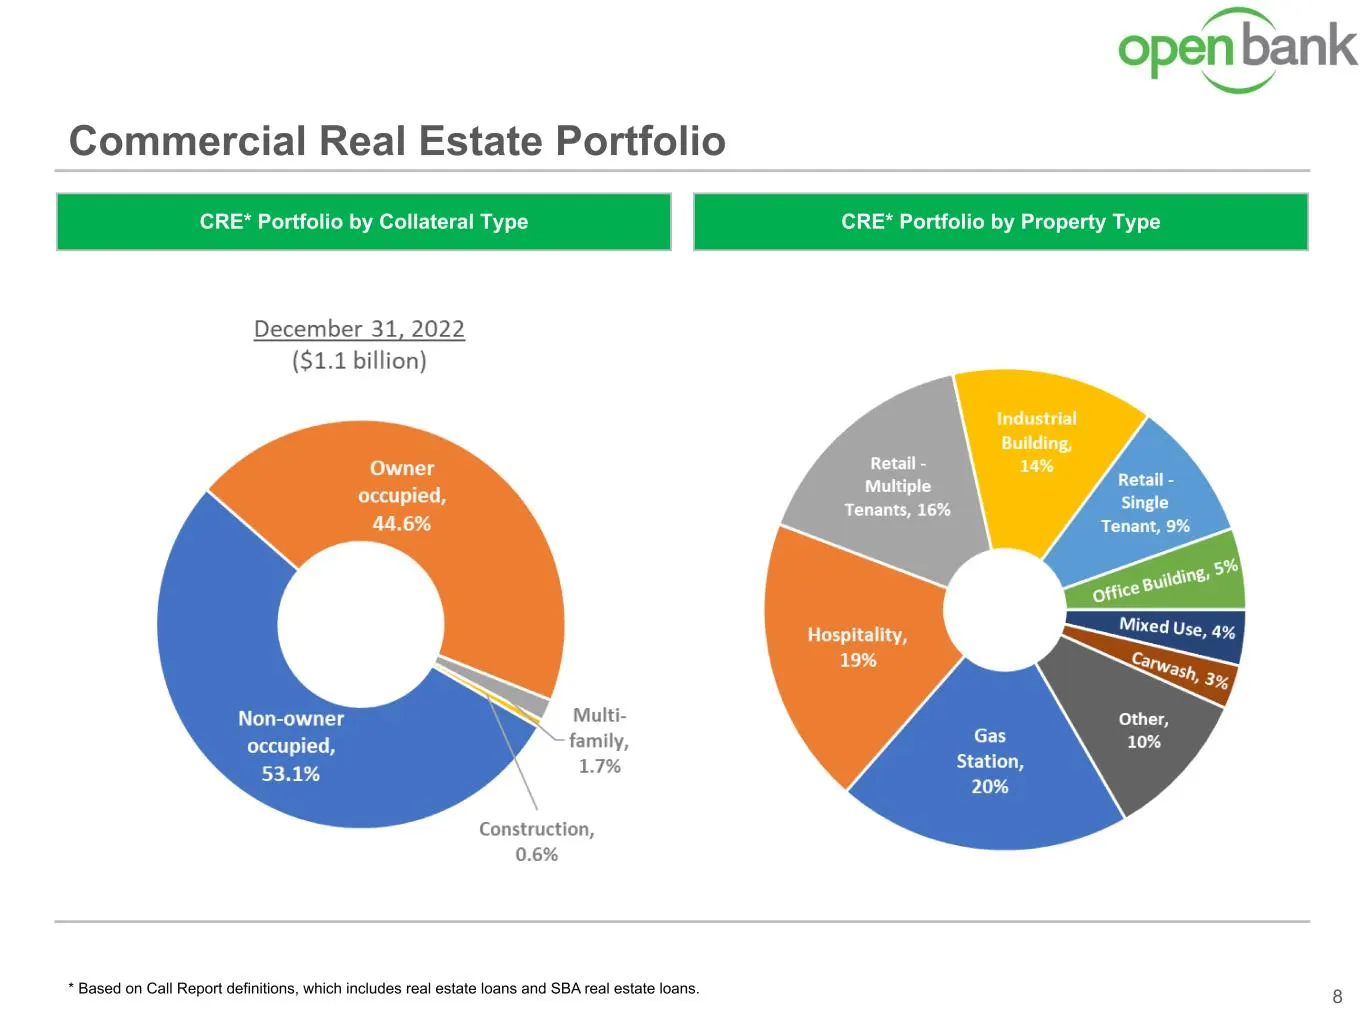
Slide 8: Commercial Real Estate Portfolio
* Based on Call Report definitions, which includes real estate loans and SBA real estate loans. Commercial Real Estate Portfolio 8 CRE* Portfolio by Property TypeCRE* Portfolio by Collateral Type
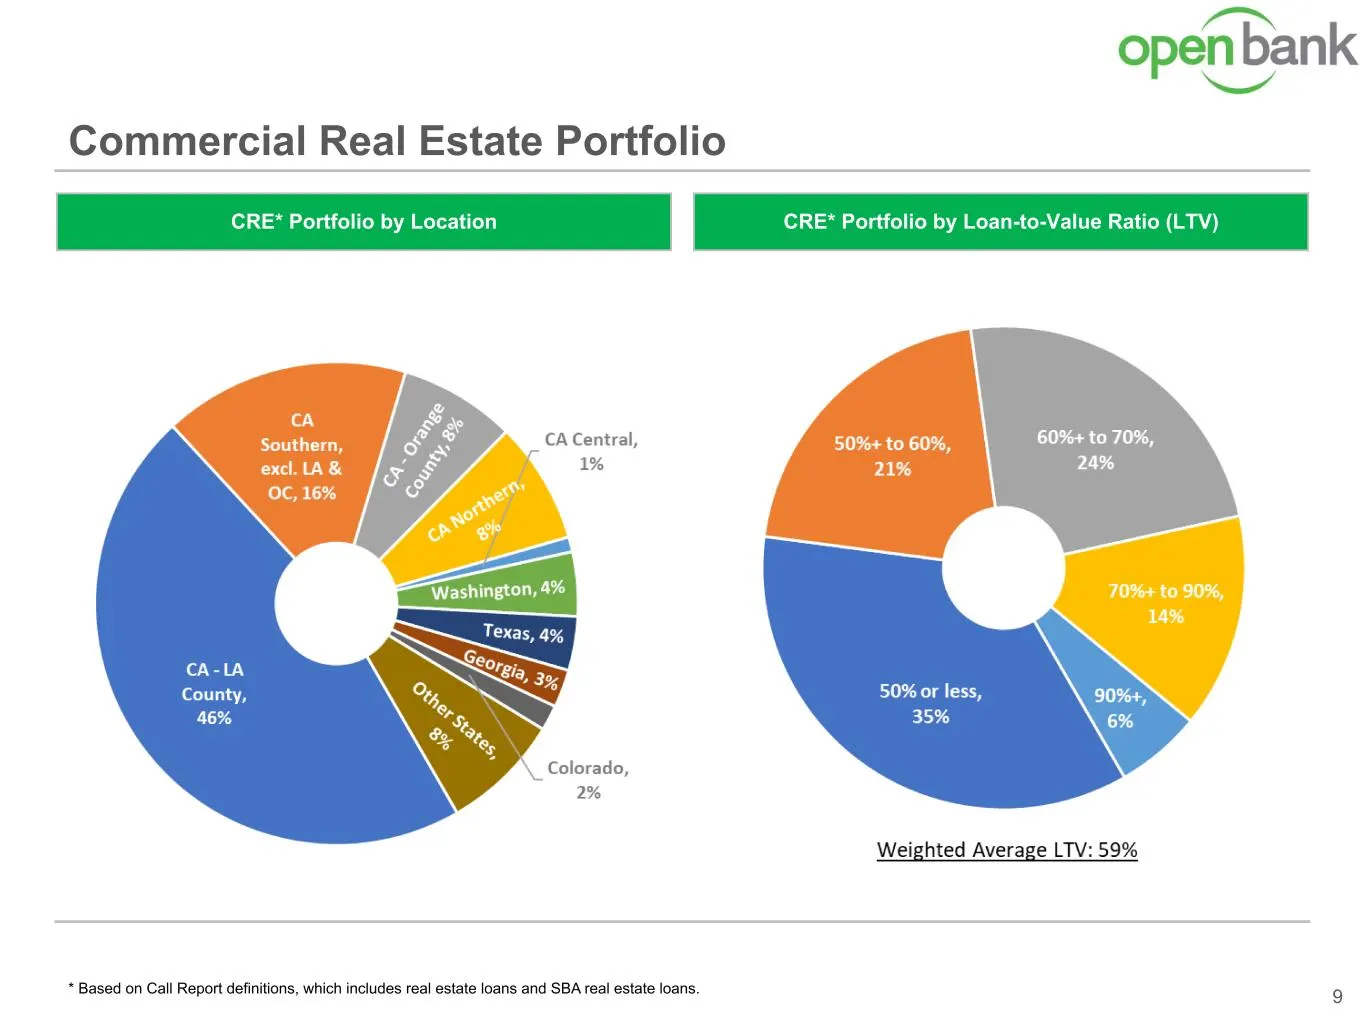
Slide 9: Commercial Real Estate Portfolio by LTV and Location
* Based on Call Report definitions, which includes real estate loans and SBA real estate loans. Commercial Real Estate Portfolio 9 CRE* Portfolio by Loan-to-Value Ratio (LTV)CRE* Portfolio by Location
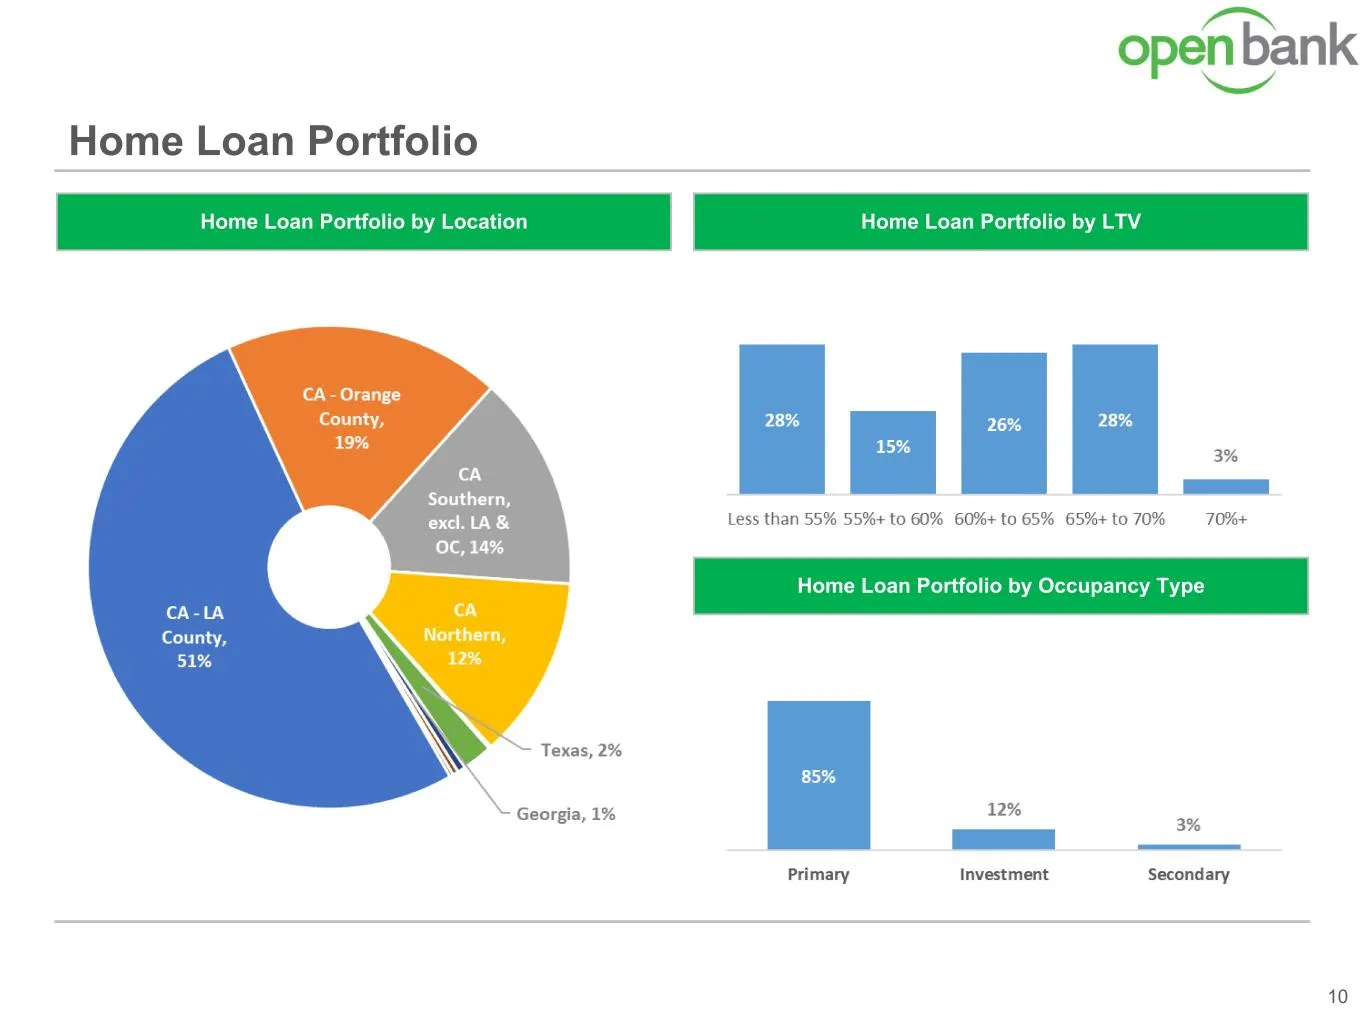
Slide 10: Home Loan Portfolio
Home Loan Portfolio 10 Home Loan Portfolio by LTVHome Loan Portfolio by Location Home Loan Portfolio by Occupancy Type
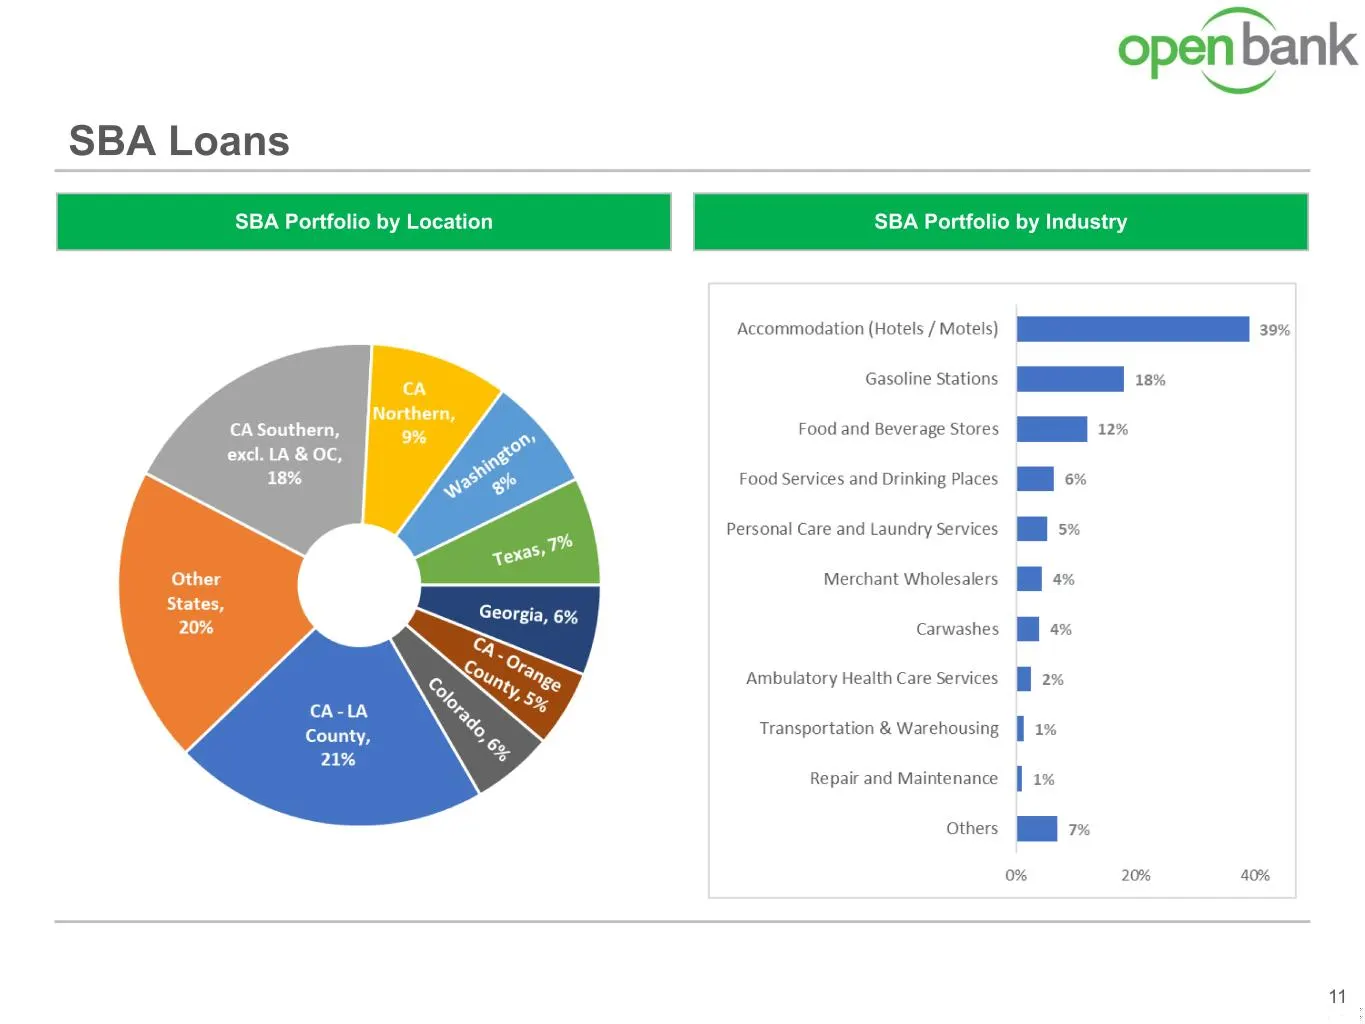
Slide 11: SBA Loans
SBA Loans 11 SBA Portfolio by IndustrySBA Portfolio by Location
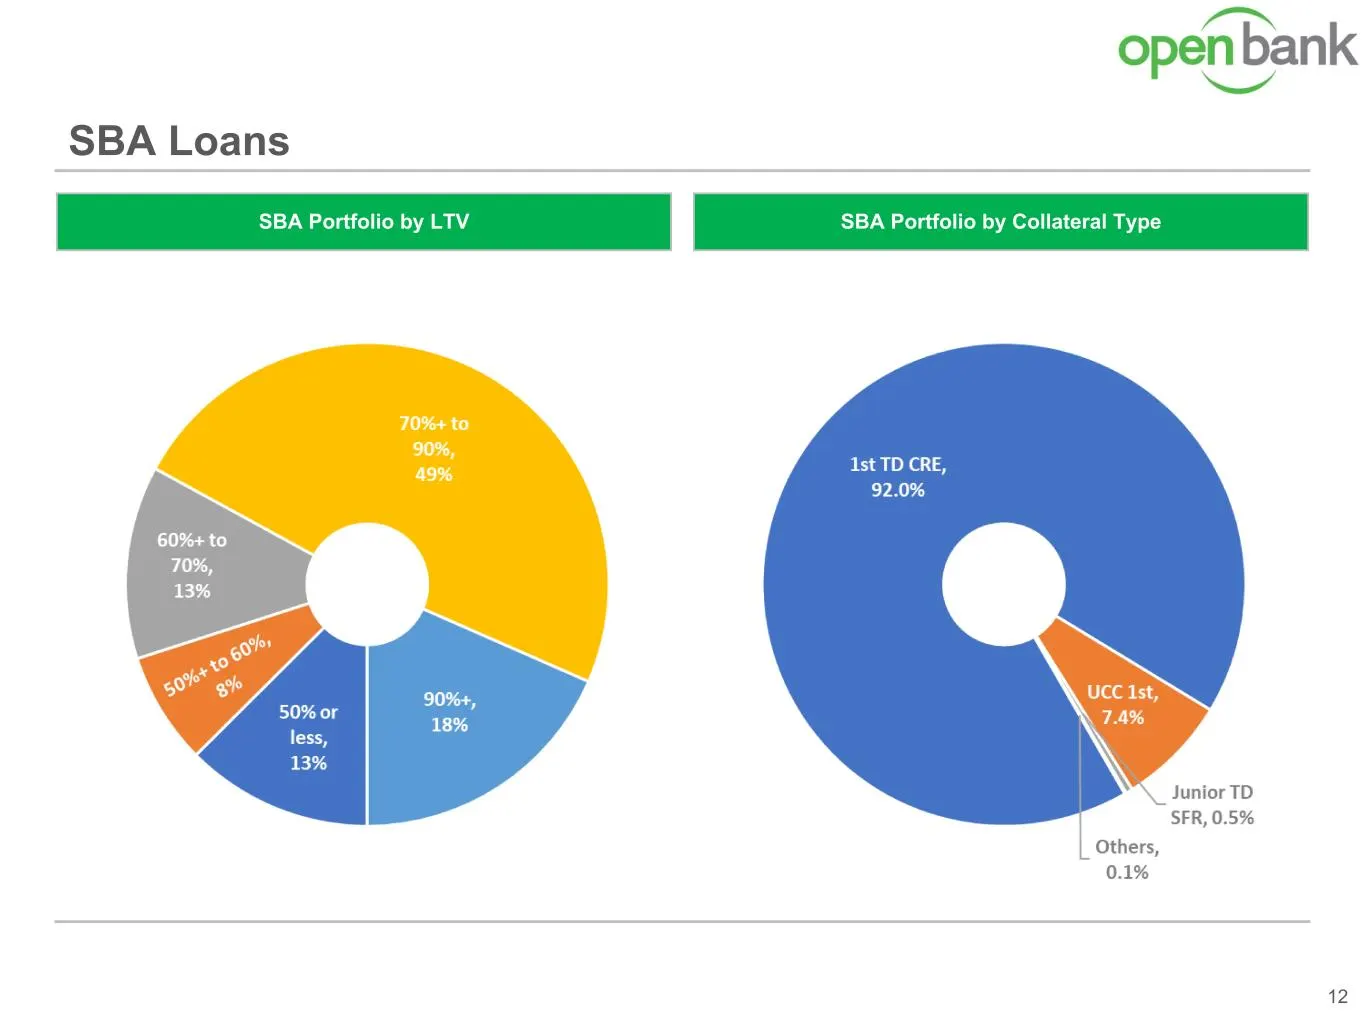
Slide 12: SBA Loans by Collateral Type and LTV
SBA Loans 12 SBA Portfolio by Collateral TypeSBA Portfolio by LTV
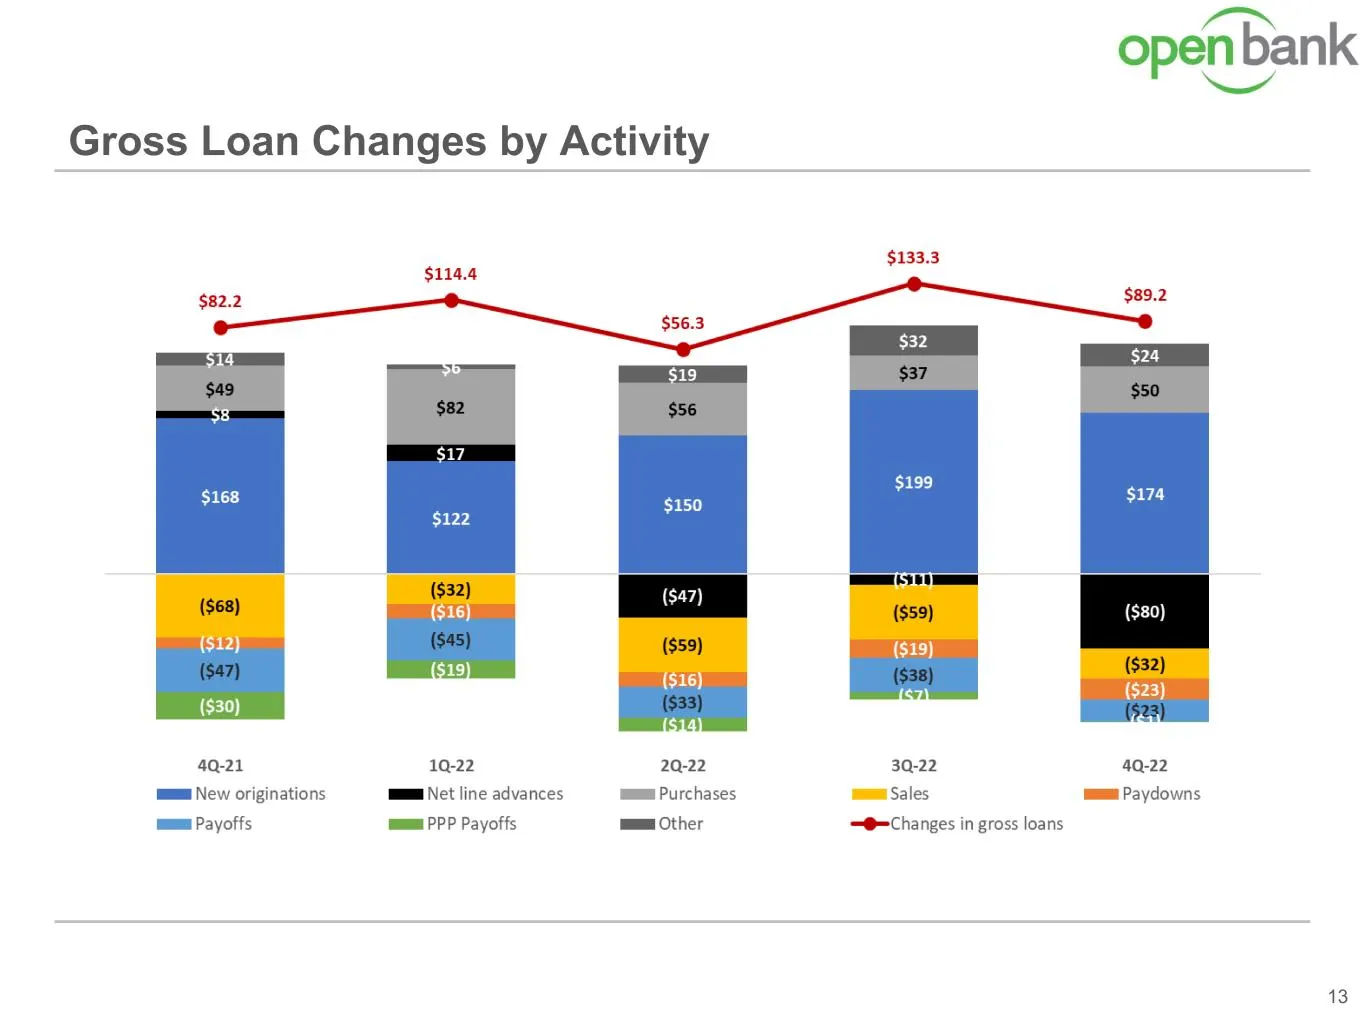
Slide 13: Gross Loan Changes by Activity
Gross Loan Changes by Activity 13
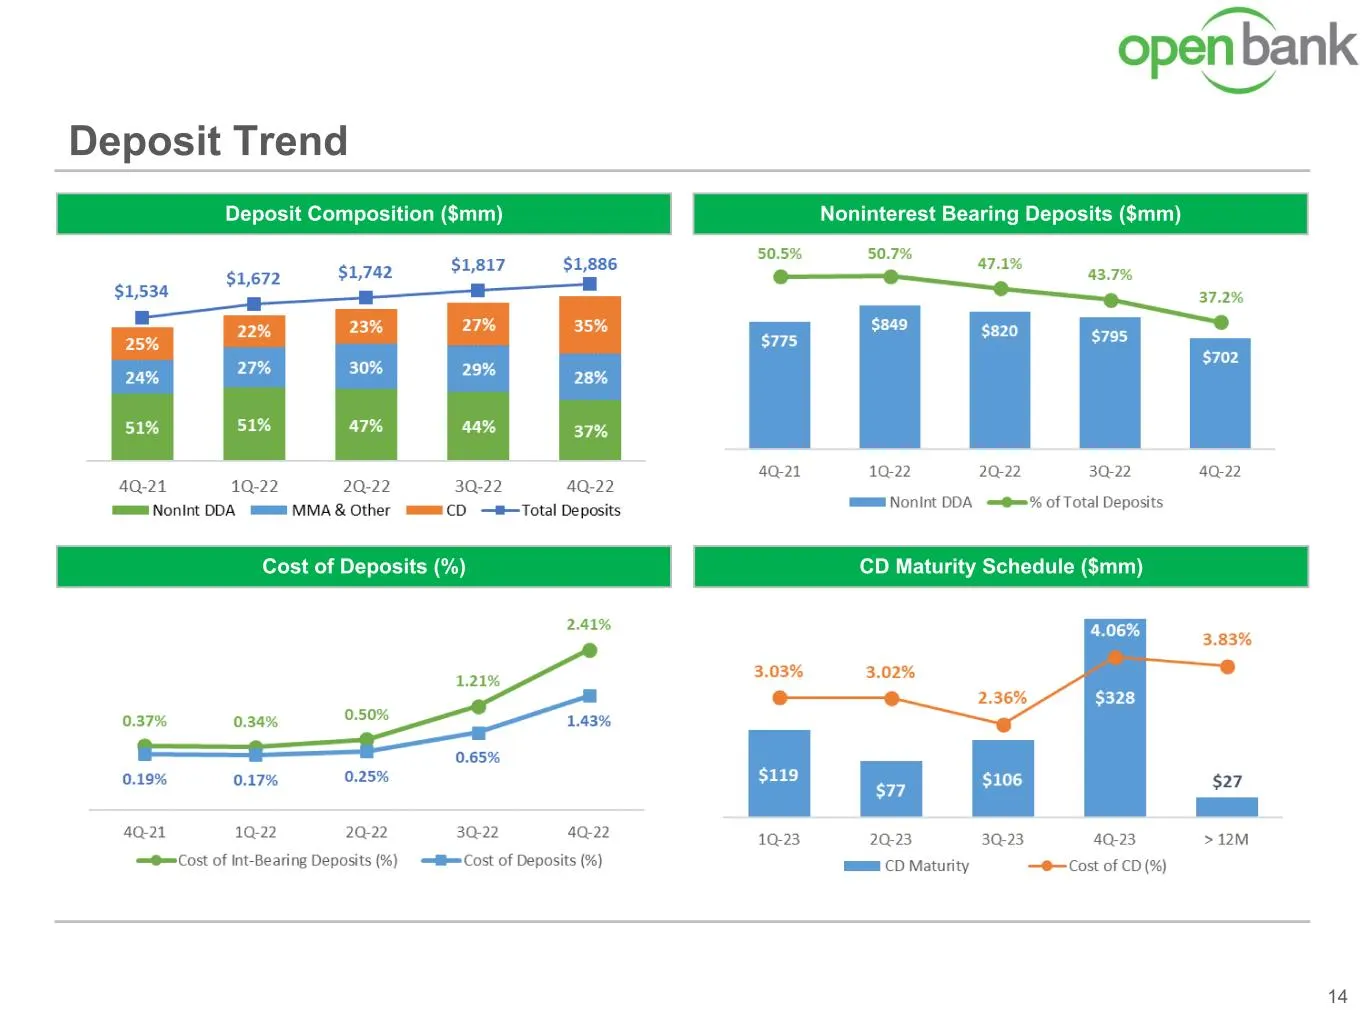
Slide 14: Deposit Trend
Deposit Trend 14 Noninterest Bearing Deposits ($mm)Deposit Composition ($mm) Cost of Deposits (%) CD Maturity Schedule ($mm)
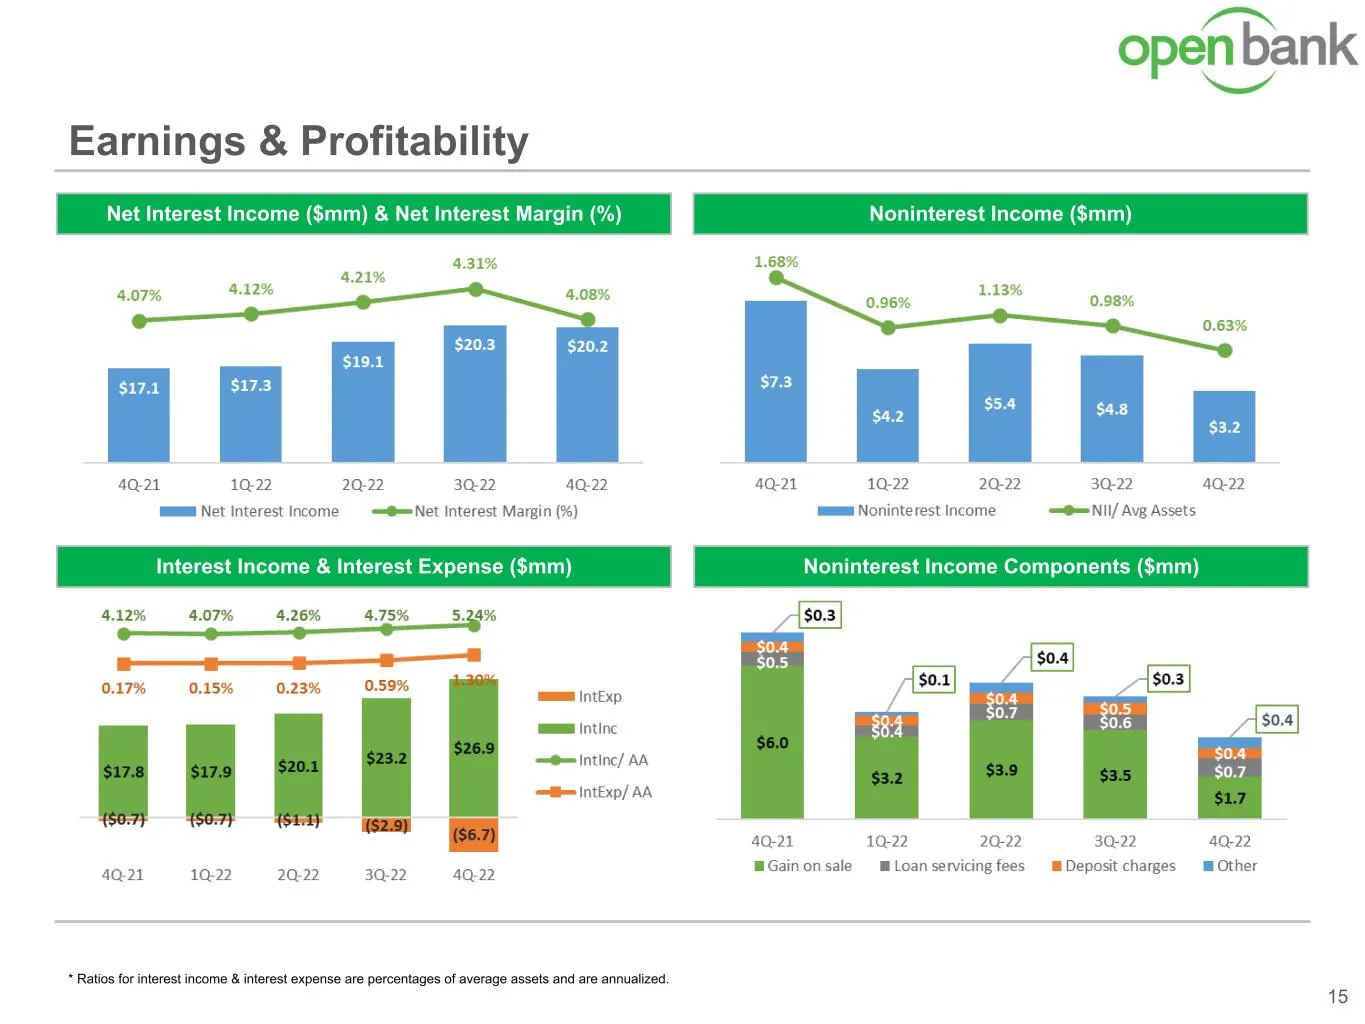
Slide 15: Earnings & Profitability: Net Interest Income and Noninterest Income
Earnings & Profitability 15 Noninterest Income ($mm)Net Interest Income ($mm) & Net Interest Margin (%) Interest Income & Interest Expense ($mm) Noninterest Income Components ($mm) * Ratios for interest income & interest expense are percentages of average assets and are annualized.
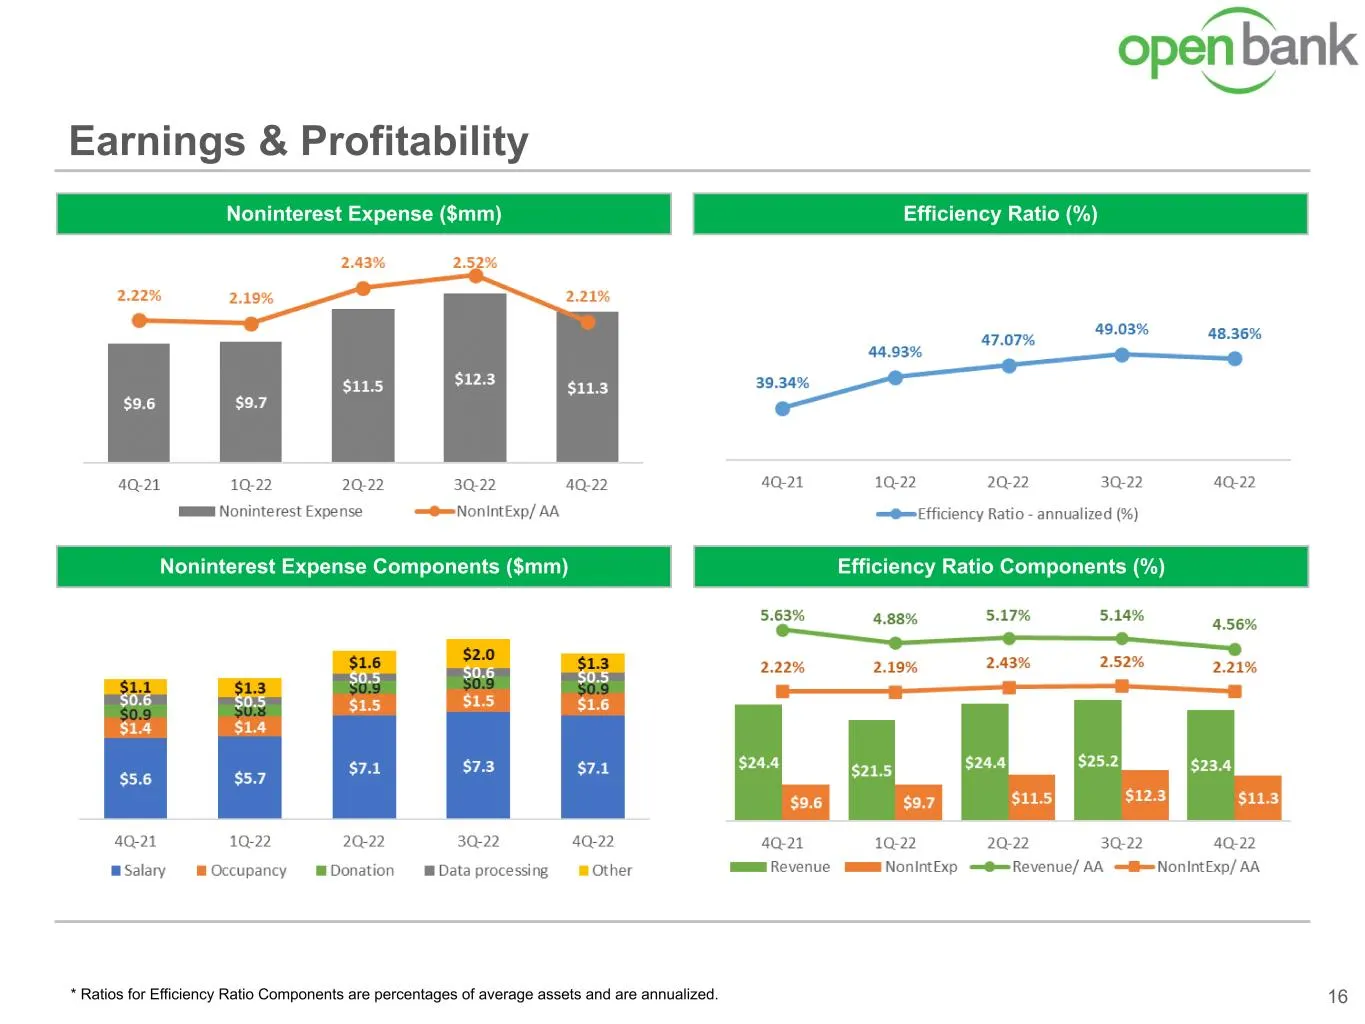
Slide 16: Earnings & Profitability: Efficiency Ratio and Noninterest Expense
Earnings & Profitability 16 Efficiency Ratio (%)Noninterest Expense ($mm) Noninterest Expense Components ($mm) Efficiency Ratio Components (%) * Ratios for Efficiency Ratio Components are percentages of average assets and are annualized.
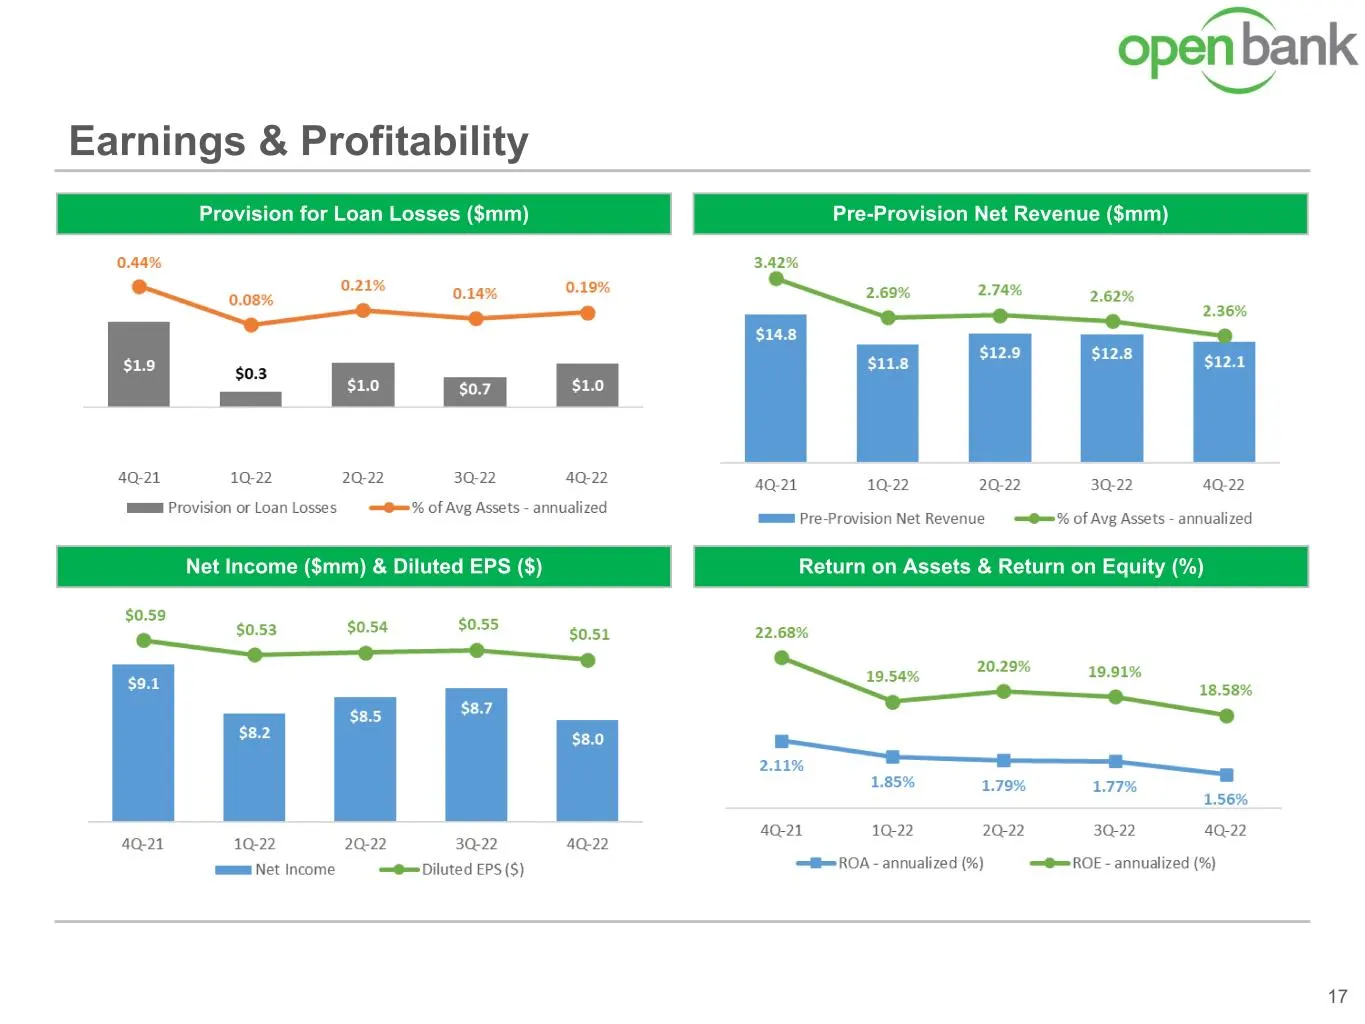
Slide 17: Earnings & Profitability: PPNR, Provision, Net Income
Earnings & Profitability 17 Pre-Provision Net Revenue ($mm)Provision for Loan Losses ($mm) Net Income ($mm) & Diluted EPS ($) Return on Assets & Return on Equity (%)
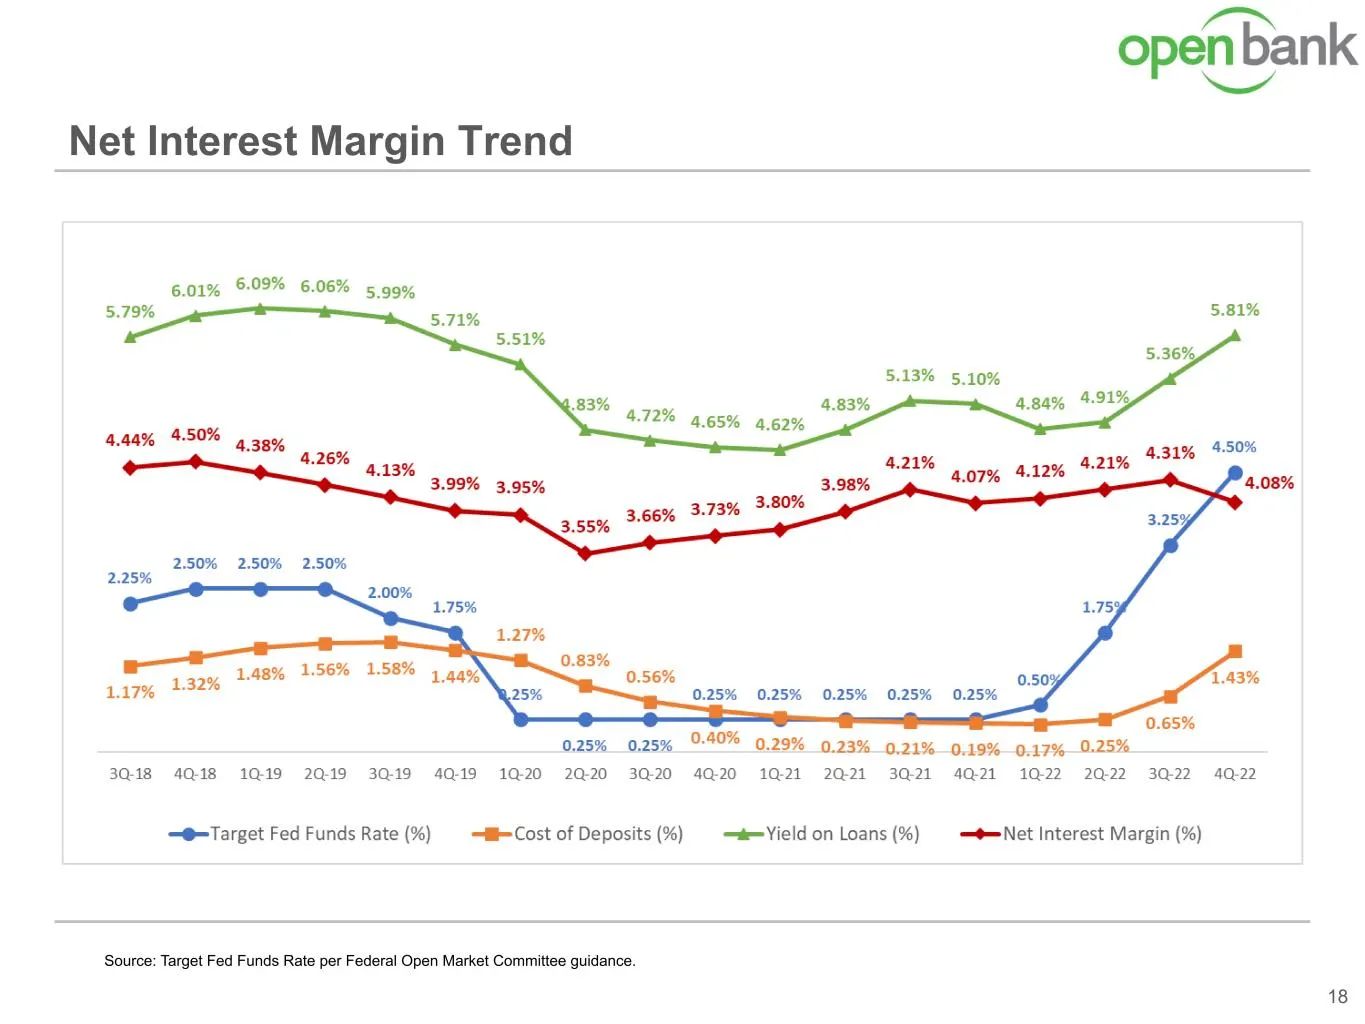
Slide 18: Net Interest Margin Trend
Source: Target Fed Funds Rate per Federal Open Market Committee guidance. Net Interest Margin Trend 18
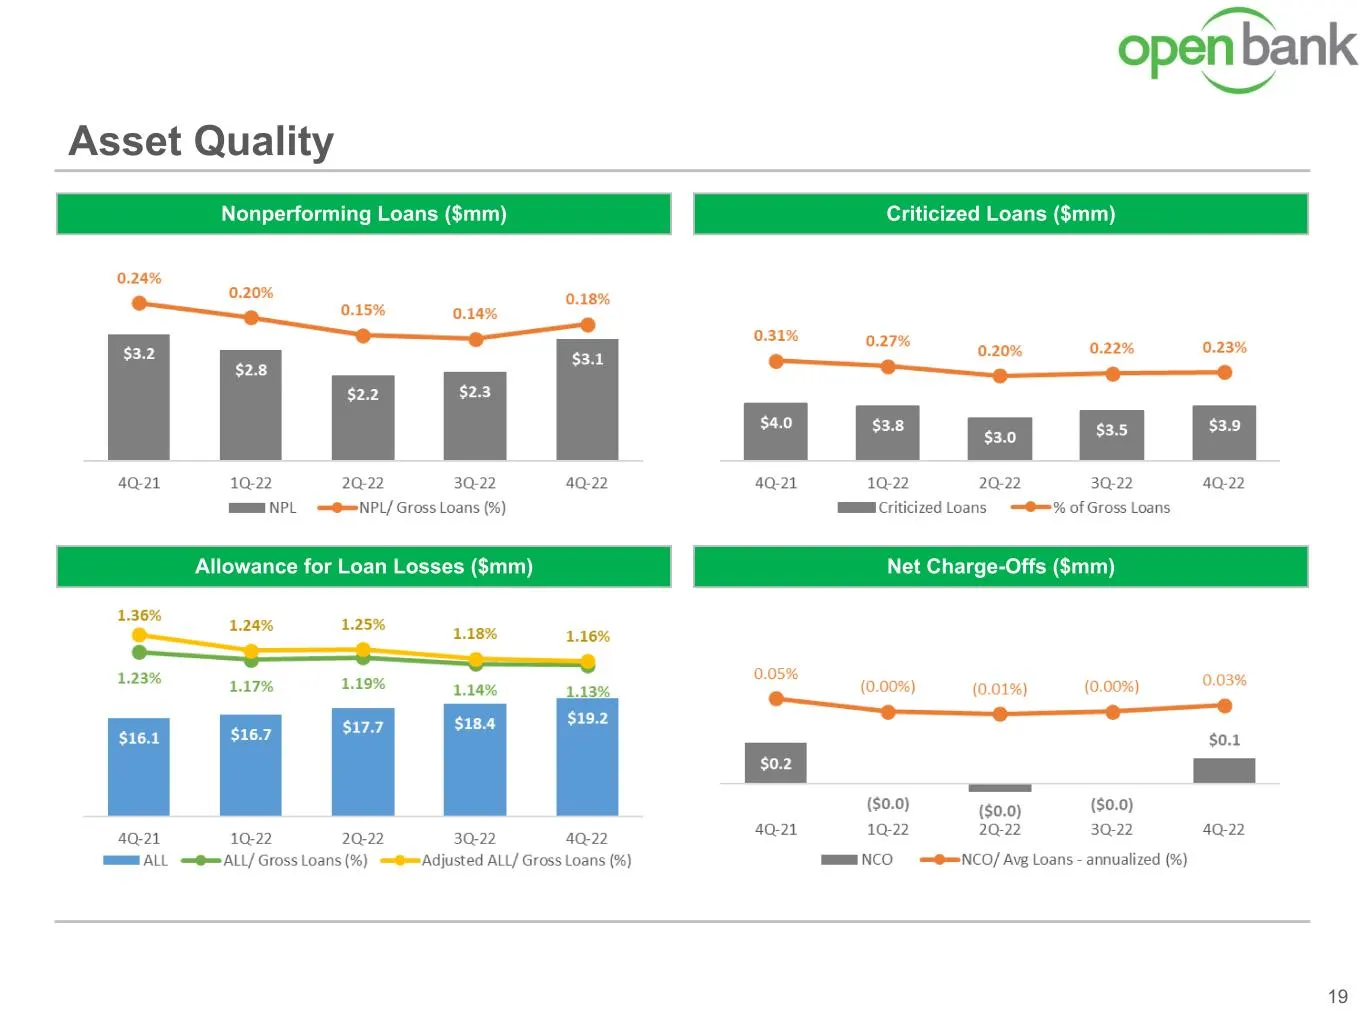
Slide 19: Asset Quality
Asset Quality 19 Criticized Loans ($mm)Nonperforming Loans ($mm) Net Charge-Offs ($mm)Allowance for Loan Losses ($mm)
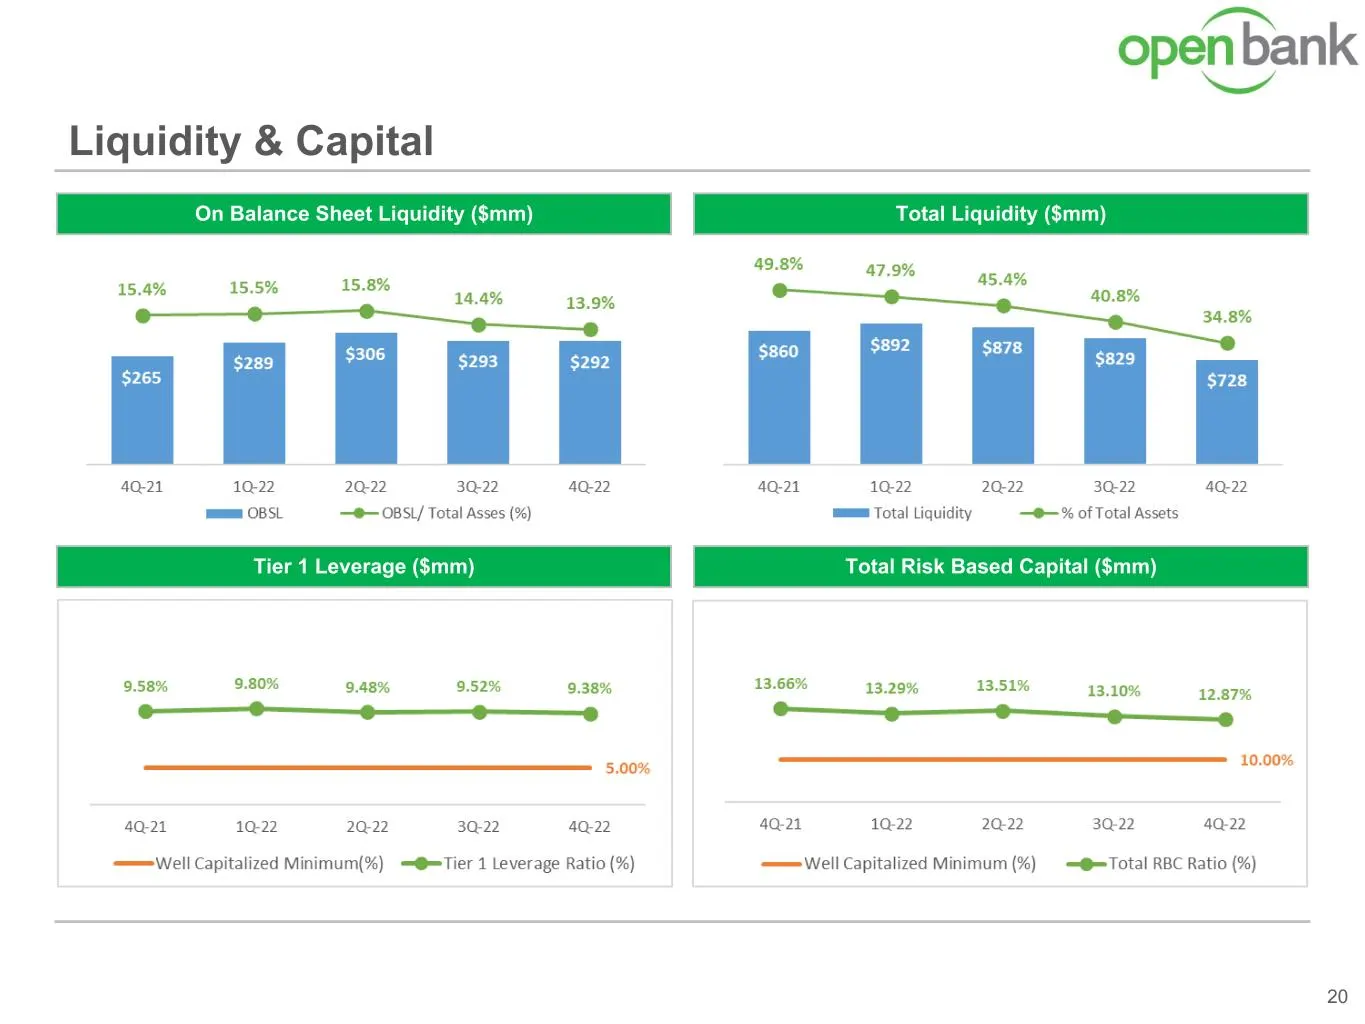
Slide 20: Liquidity & Capital
Liquidity & Capital 20 Total Liquidity ($mm)On Balance Sheet Liquidity ($mm) Tier 1 Leverage ($mm) Total Risk Based Capital ($mm)
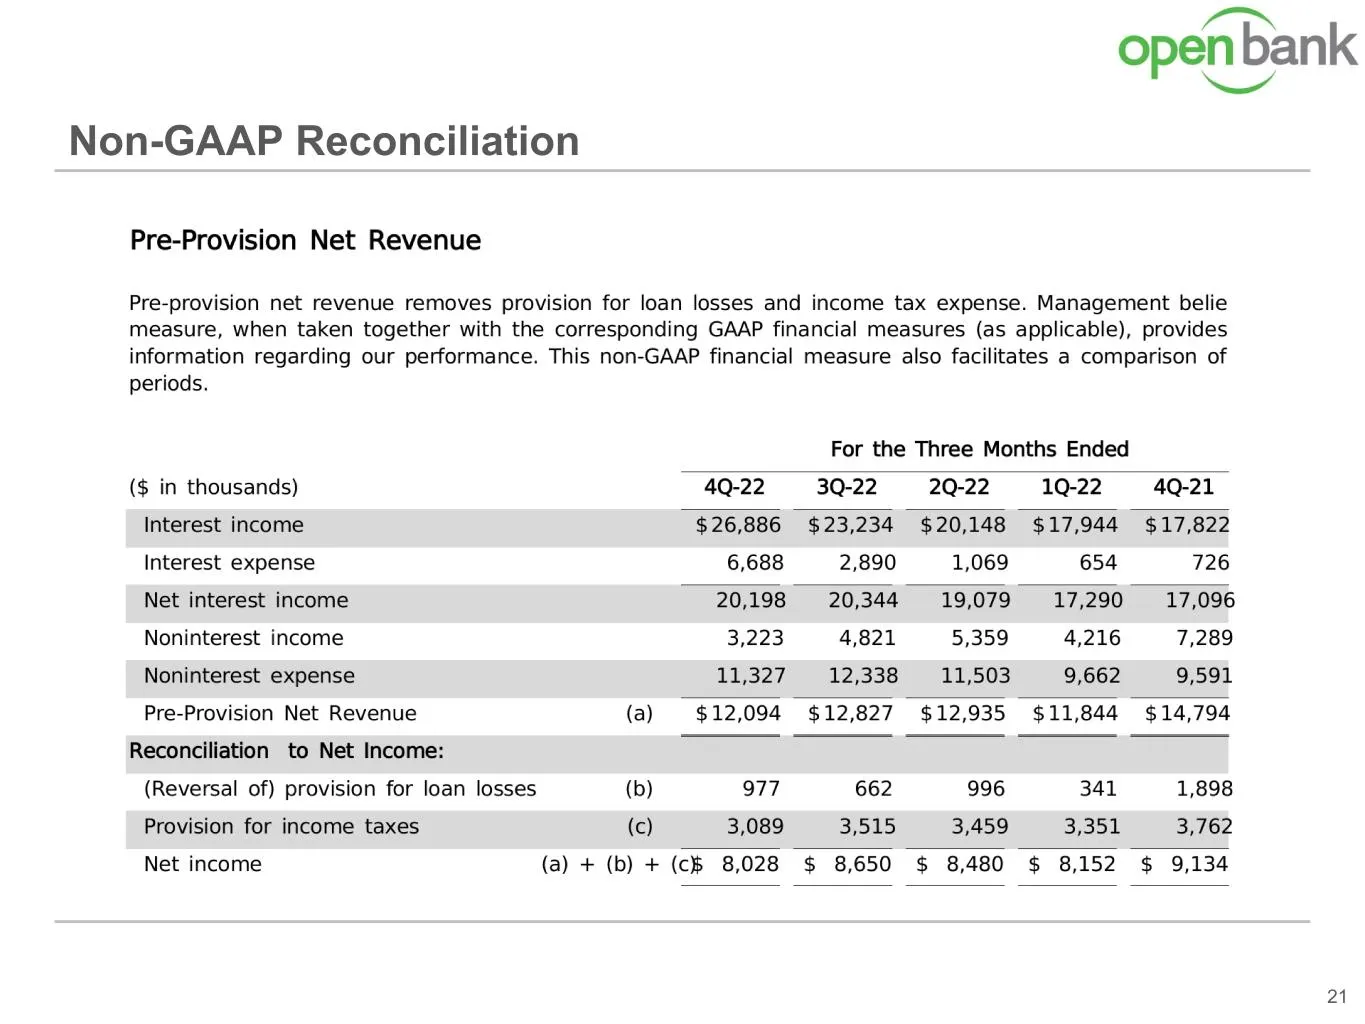
Slide 21: Non-GAAP Reconciliation: Pre-Provision Net Revenue
| Aan open bank —” Non-GAAP Reconciliation Pre-Provision Net Revenue Pre-provision net revenue removes provision for loan losses and income tax expense. Management belie measure, when taken together with the corresponding GAAP financial measures (as applicable), provides information regarding our pe
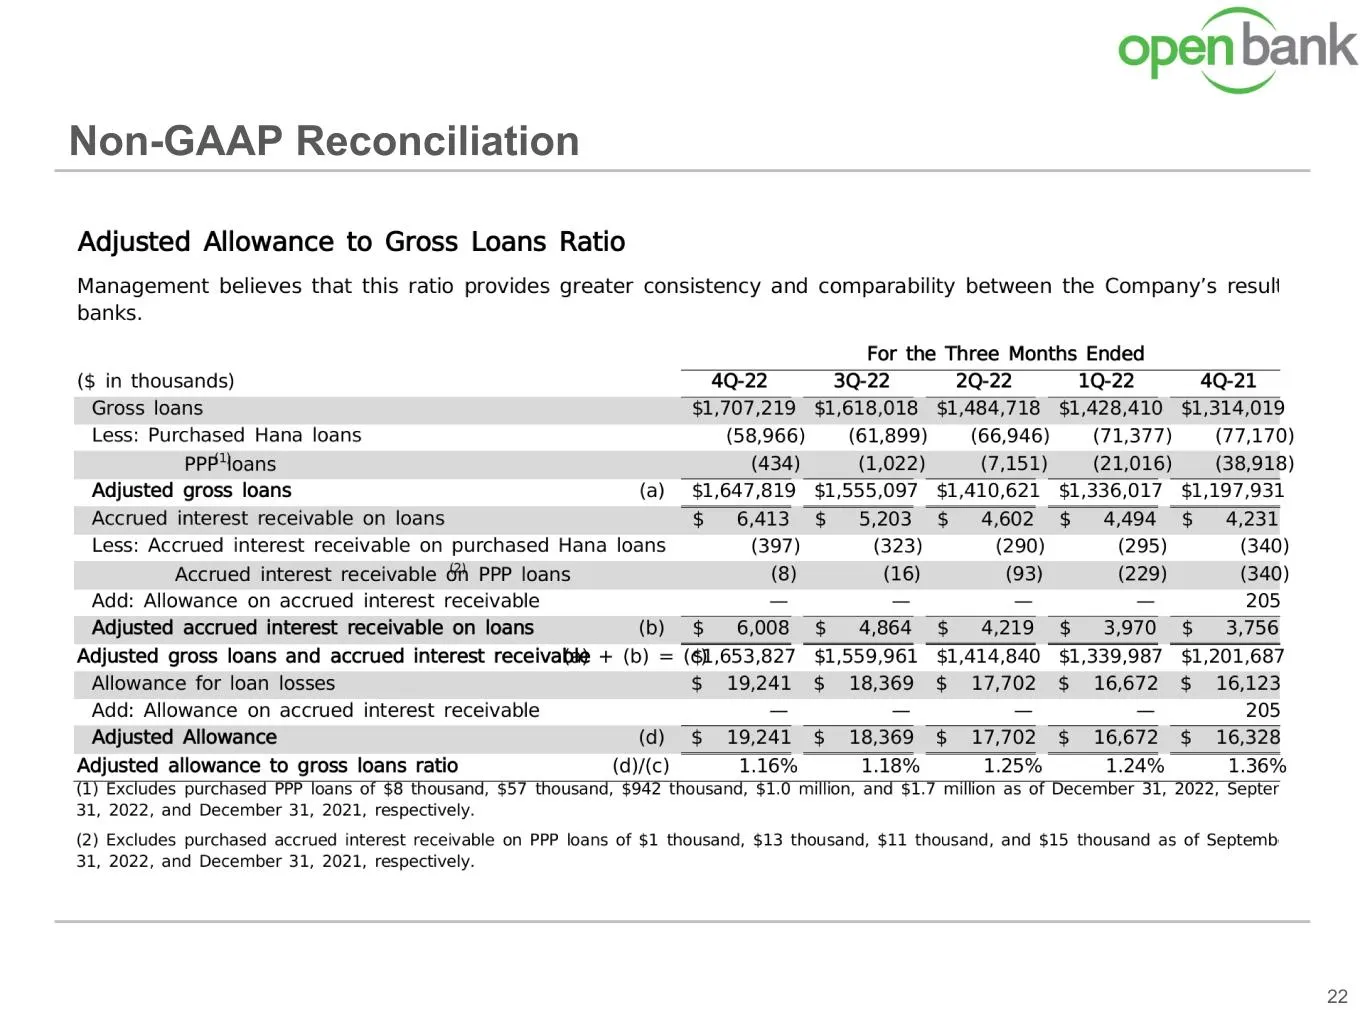
Slide 22: Non-GAAP Reconciliation: Adjusted Allowance to Gross Loans Ratio
| Aan open bank —S” Non-GAAP Reconciliation Adjusted Allowance to Gross Loans Ratio Management believes that this ratio provides greater consistency and comparability between the Company’s resull banks. For the Three Months Ended ($ in thousands) 4Q-22 3Q-22 2Q-22 1Q-22 4Q-21 Gross loans $1,707,219
Source: SEC EDGAR · 8-K filed Jan 26, 2023
More decks from OP Bancorp
 Q3 2026 Earnings Presentation23 slides · Oct 22, 2026
 Q2 2026 Earnings Presentation19 slides · Jul 23, 2026
 Q1 2026 Earnings Presentation19 slides · Apr 23, 2026
 Q4 2025 Earnings Presentation19 slides · Jan 22, 2026
 Q3 2025 Earnings Presentation19 slides · Oct 23, 2025
 Q2 2025 Earnings Presentation19 slides · Jul 24, 2025