OP Bancorp · NASDAQ:OPBK
OP Bancorp — Q3 2026 Earnings Presentation
23 slides from OP Bancorp's earnings presentation, Oct 22, 2026
Slide 1: OP Bancorp Third Quarter 2026 Earnings Presentation
NASDAQ: OPBK OP Bancorp Earnings Presentation Parent Company of Open Bank • Los Angeles, California Third Quarter 2026 October 22, 2026 Exhibit 99.2
Slide 2: Forward-Looking Statements
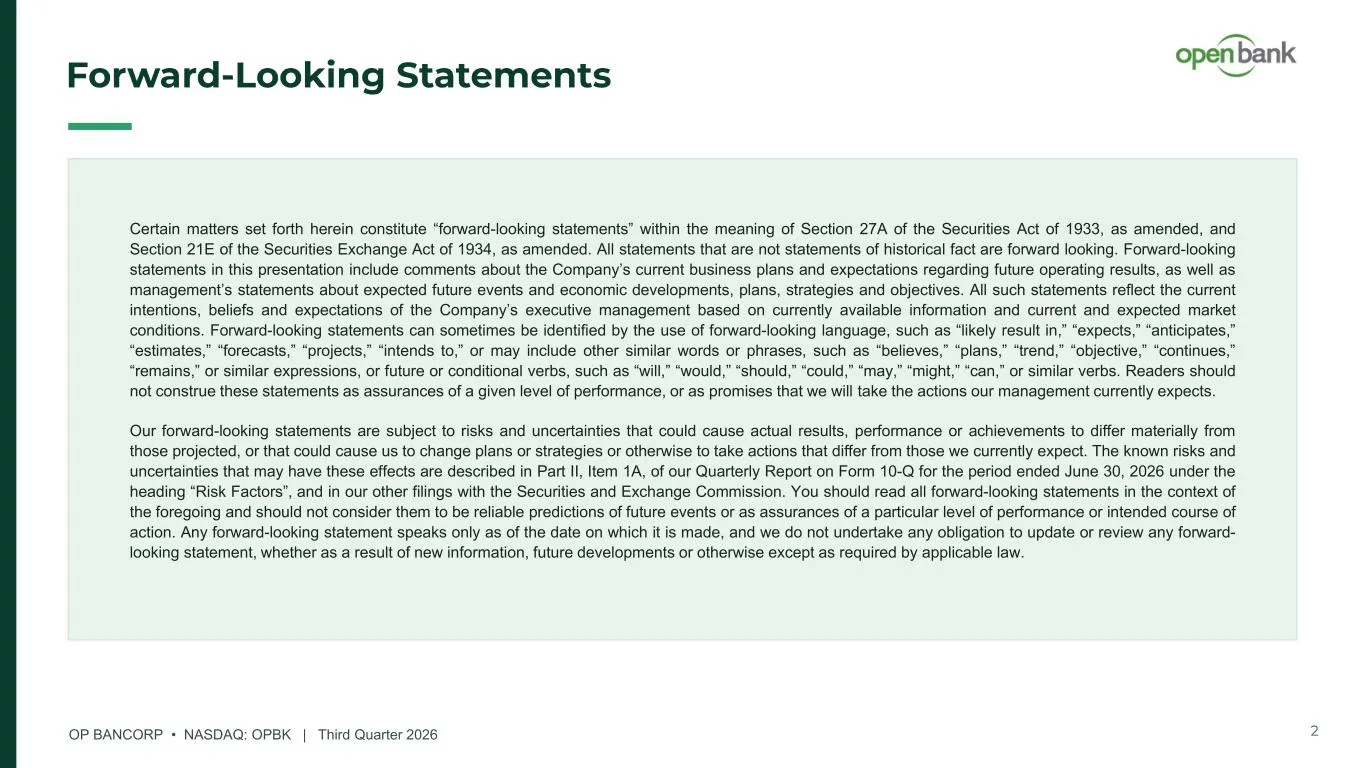
OP BANCORP • NASDAQ: OPBK | Third Quarter 2026 Forward -Looking Statements Certain matters set forth herein constitute “forward-looking statements” within the meaning of Section 27A of the Securities Act of 1933, as amended, and Section 21E of the Securities Exchange Act of 1934, as amended. All sta
Slide 3: OP Bancorp At A Glance
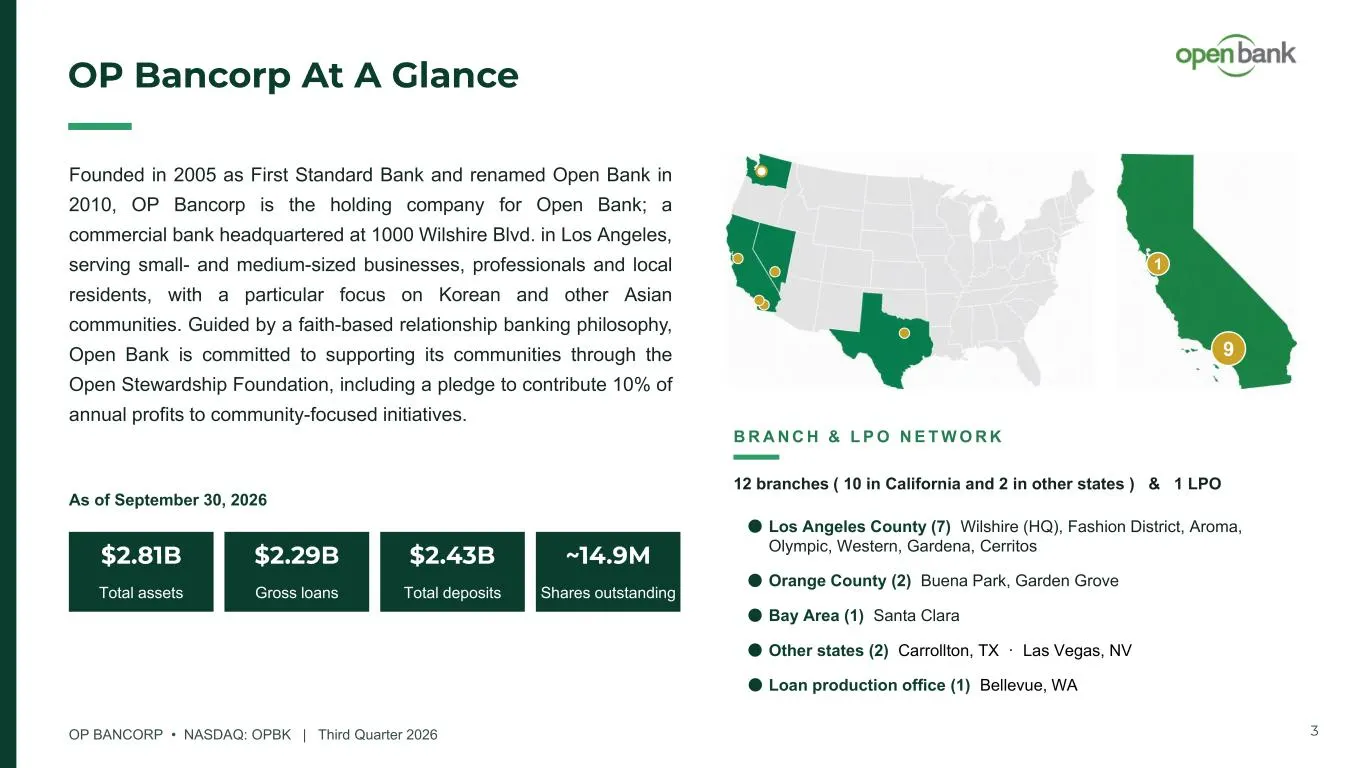
OP BANCORP • NASDAQ: OPBK | Third Quarter 2026 OP Bancorp At A Glance 9 1 12 branches ( 10 in California and 2 in other states ) & 1 LPO B R A N C H & L P O N E T W O R K Los Angeles County (7) Wilshire (HQ), Fashion District, Aroma, Olympic, Western, Gardena, Cerritos Orange County (2) Buena Park,

Slide 4: Third Quarter 2026 Financial Results
THIRD QUARTER 2026 Financial Results
Slide 5: Third Quarter 2026 Highlights
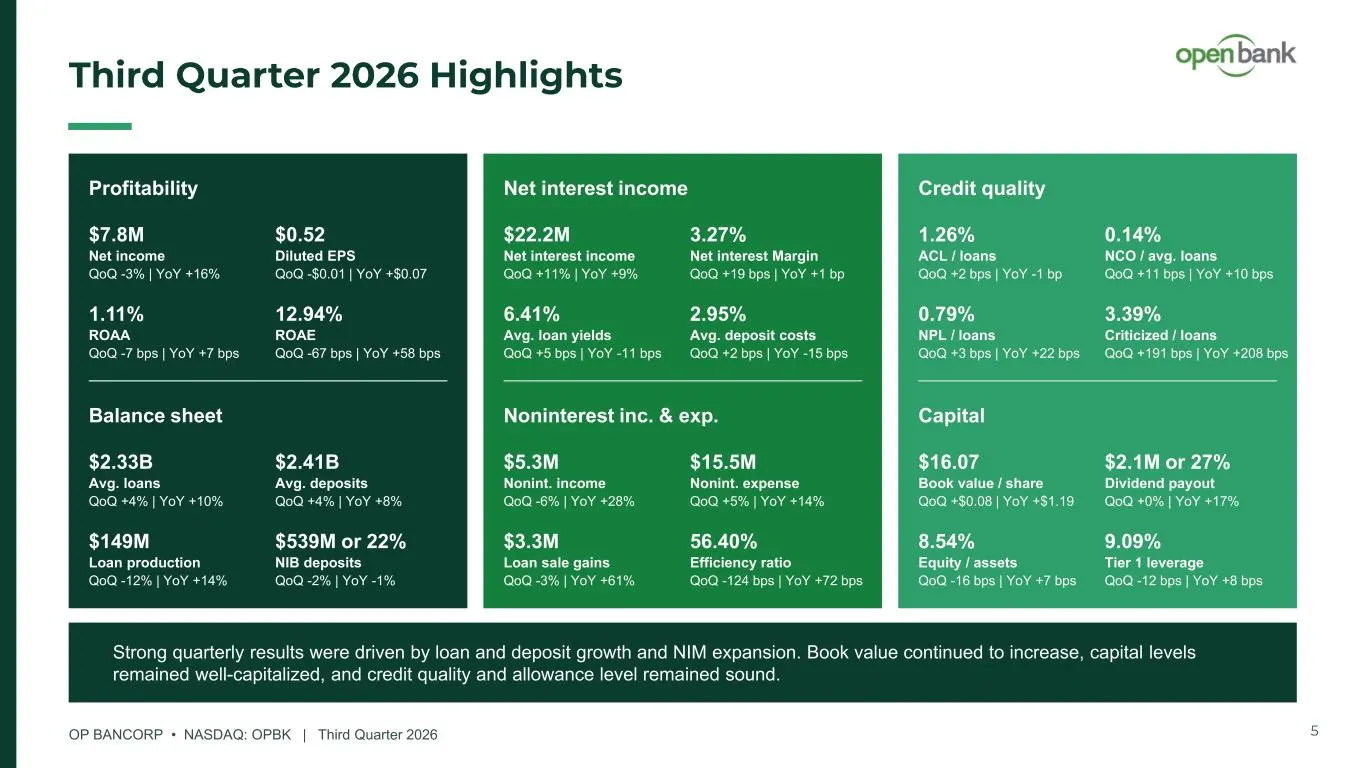
OP BANCORP • NASDAQ: OPBK | Third Quarter 2026 Third Quarter 2026 Highlights Strong quarterly results were driven by loan and deposit growth and NIM expansion. Book value continued to increase, capital levels remained well-capitalized, and credit quality and allowance level remained sound. Profitabi
Slide 6: Net Interest Income & Net Interest Margin
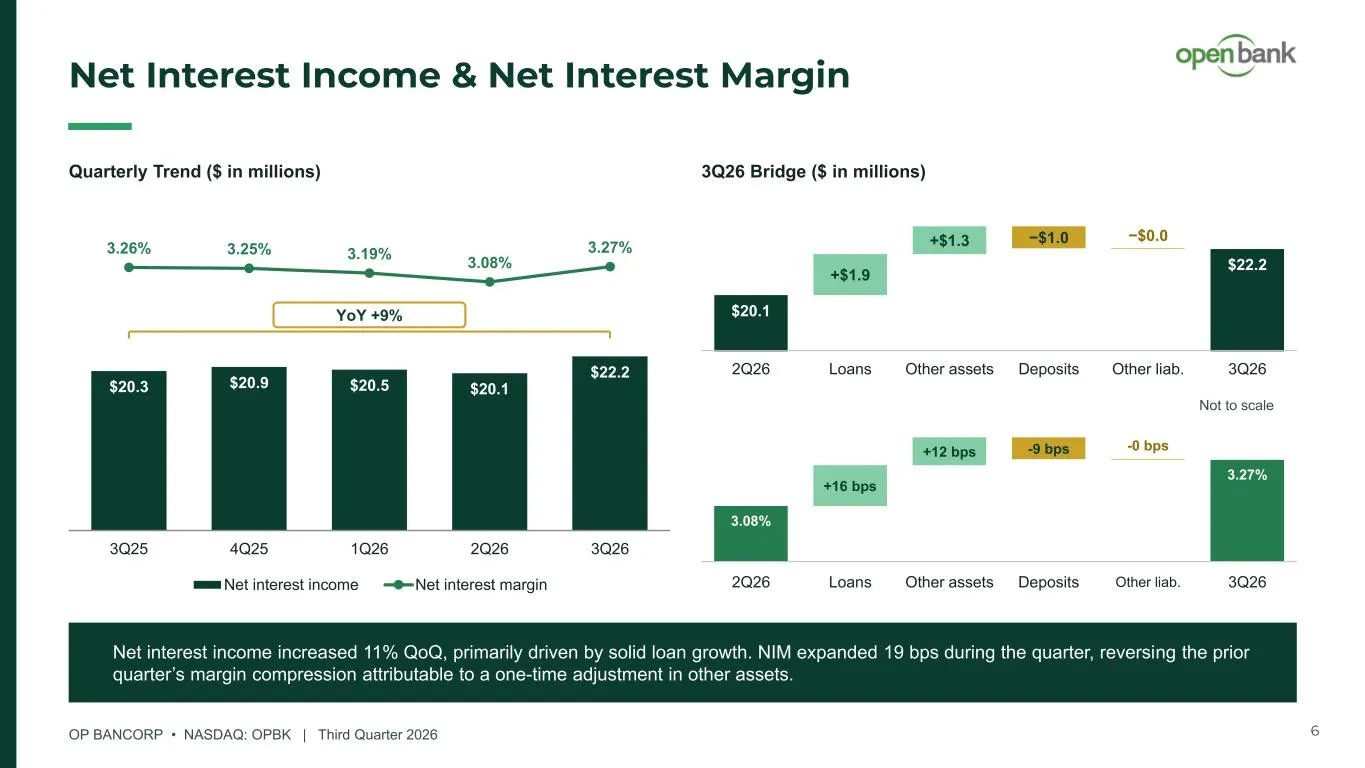
OP BANCORP • NASDAQ: OPBK | Third Quarter 2026 Net Interest Income & Net Interest Margin Quarterly Trend ($ in millions) $20.3 $20.9 $20.5 $20.1 $22.2 3.26% 3.25% 3.19% 3.08% 3.27% 3Q25 4Q25 1Q26 2Q26 3Q26 Net interest income Net interest margin 3Q26 Bridge ($ in millions) −$1.0 −$0.0 +$1.9 +$1.3 $2
Slide 7: Average Loans & Deposits
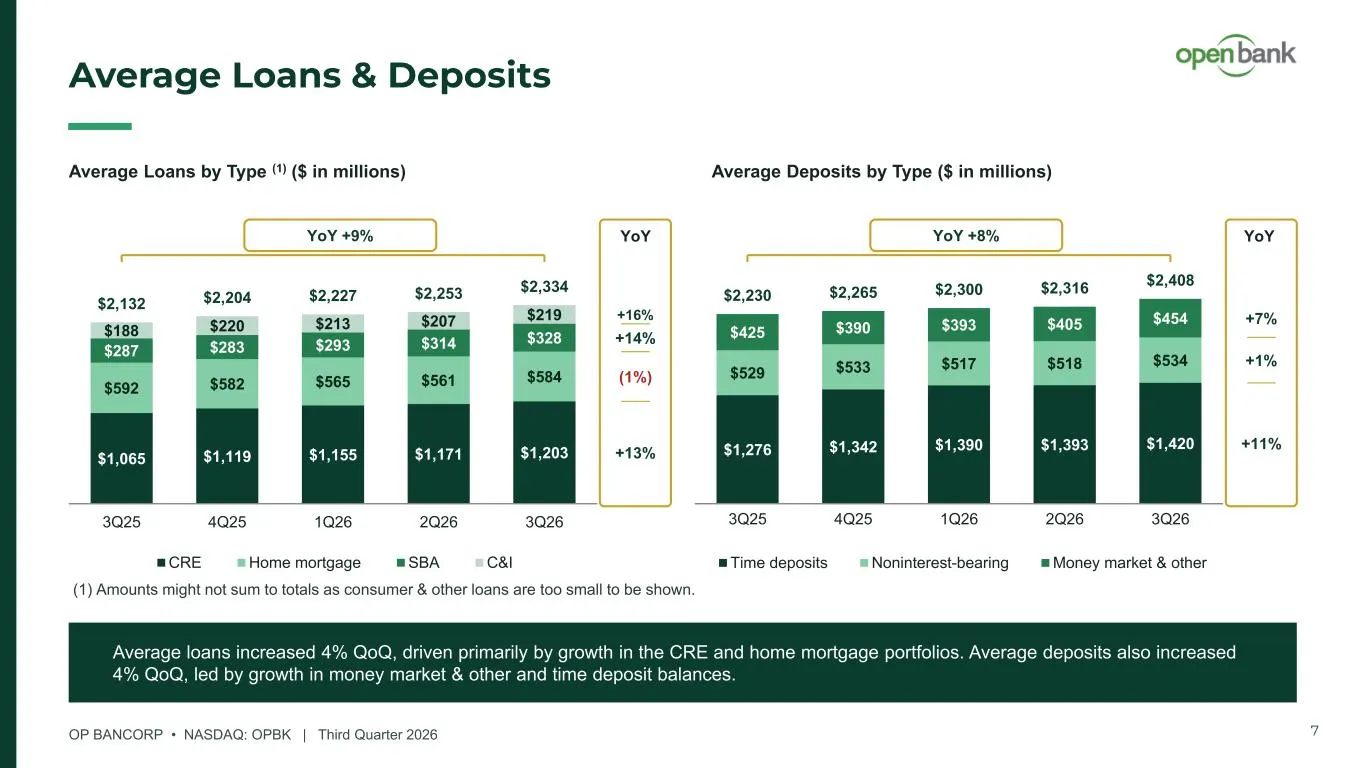
OP BANCORP • NASDAQ: OPBK | Third Quarter 2026 Average Loans & Deposits Average loans increased 4% QoQ, driven primarily by growth in the CRE and home mortgage portfolios. Average deposits also increased 4% QoQ, led by growth in money market & other and time deposit balances. Average Loans by Type (
Slide 8: Loan Production and Portfolio Pricing
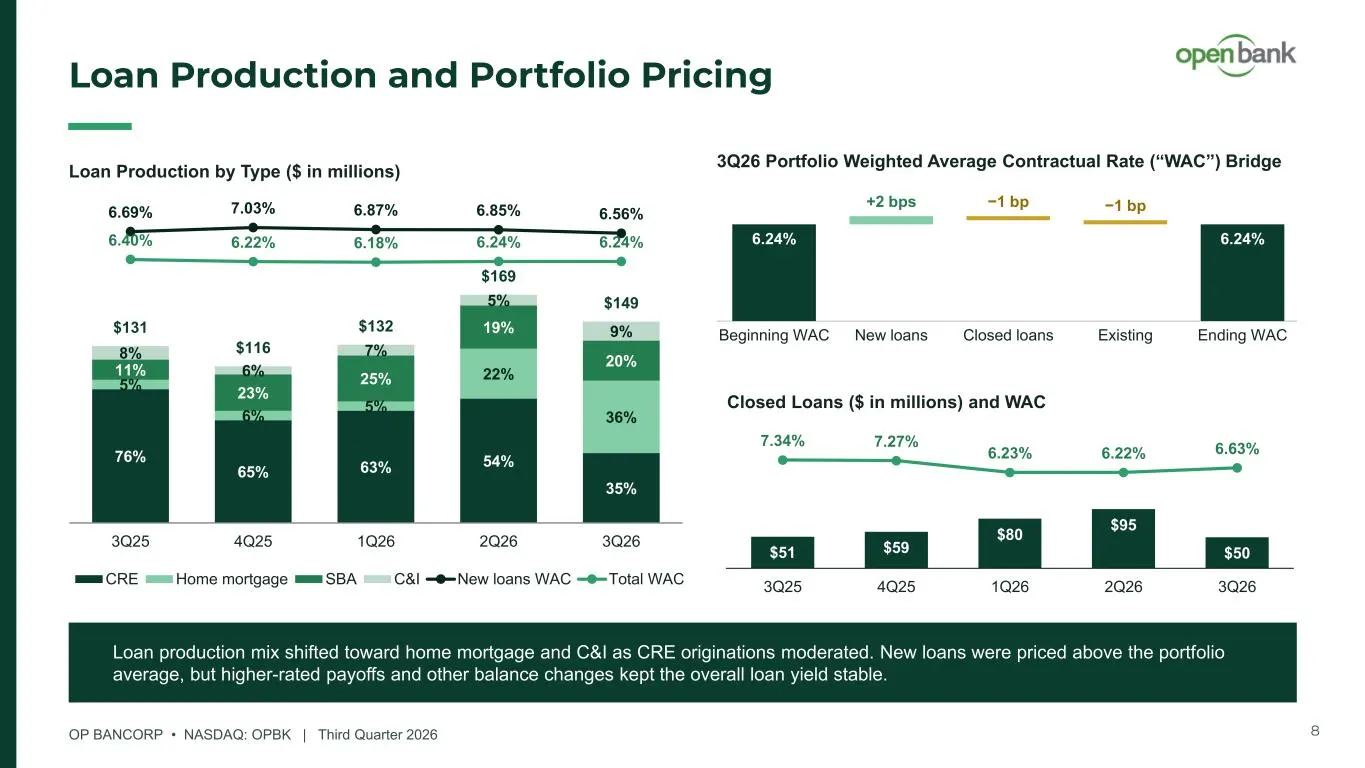
OP BANCORP • NASDAQ: OPBK | Third Quarter 2026 Loan Production and Portfolio Pricing Loan Production by Type ($ in millions) 76% 65% 63% 54% 35% 5% 6% 5% 22% 36% 11% 23% 25% 19% 20% 8% 6% 7% 5% 9% 6.69% 7.03% 6.87% 6.85% 6.56% 6.40% 6.22% 6.18% 6.24% 6.24% $131 $116 $132 $169 $149 3Q25 4Q25 1Q26 2Q2
Slide 9: Loan Repricing and Maturity
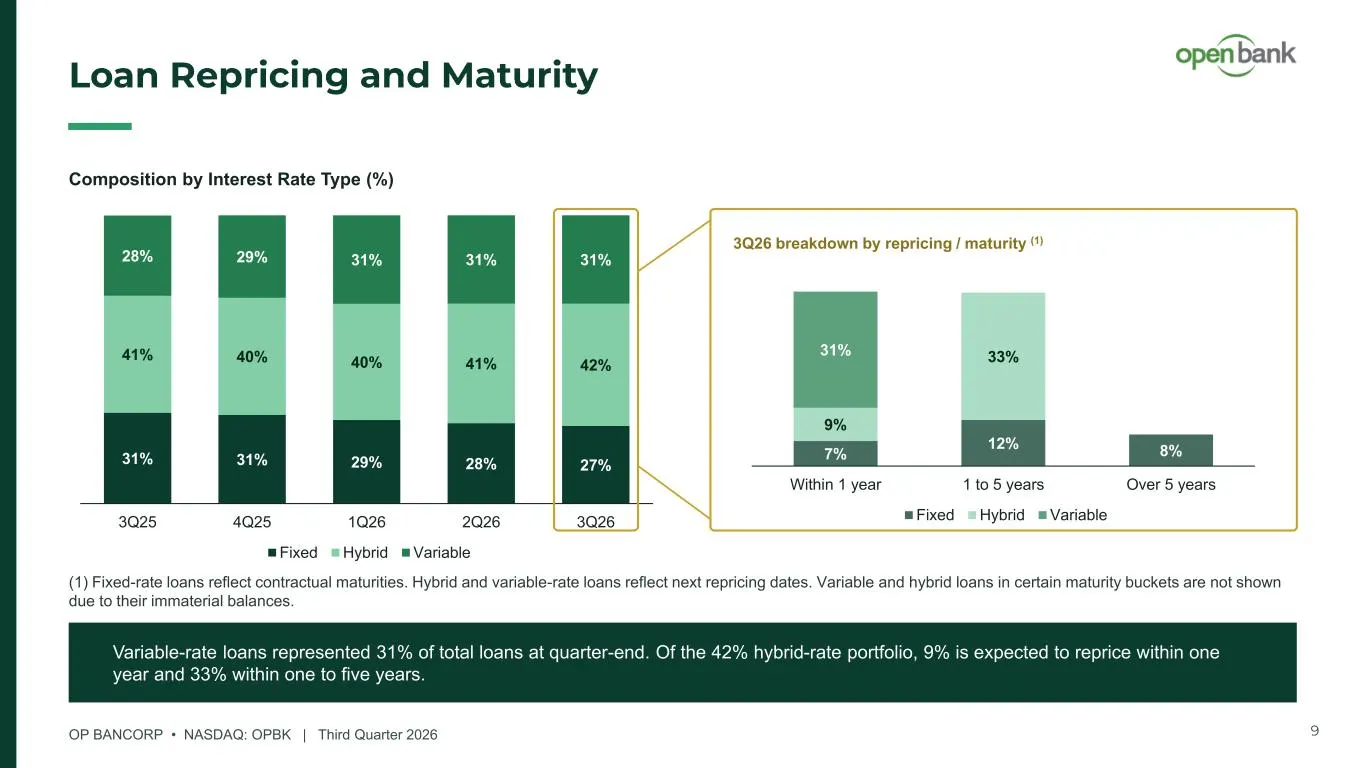
OP BANCORP • NASDAQ: OPBK | Third Quarter 2026 Loan Repricing and Maturity Variable-rate loans represented 31% of total loans at quarter-end. Of the 42% hybrid-rate portfolio, 9% is expected to reprice within one year and 33% within one to five years. 9 Composition by Interest Rate Type (%) 31% 31%
Slide 10: Deposits
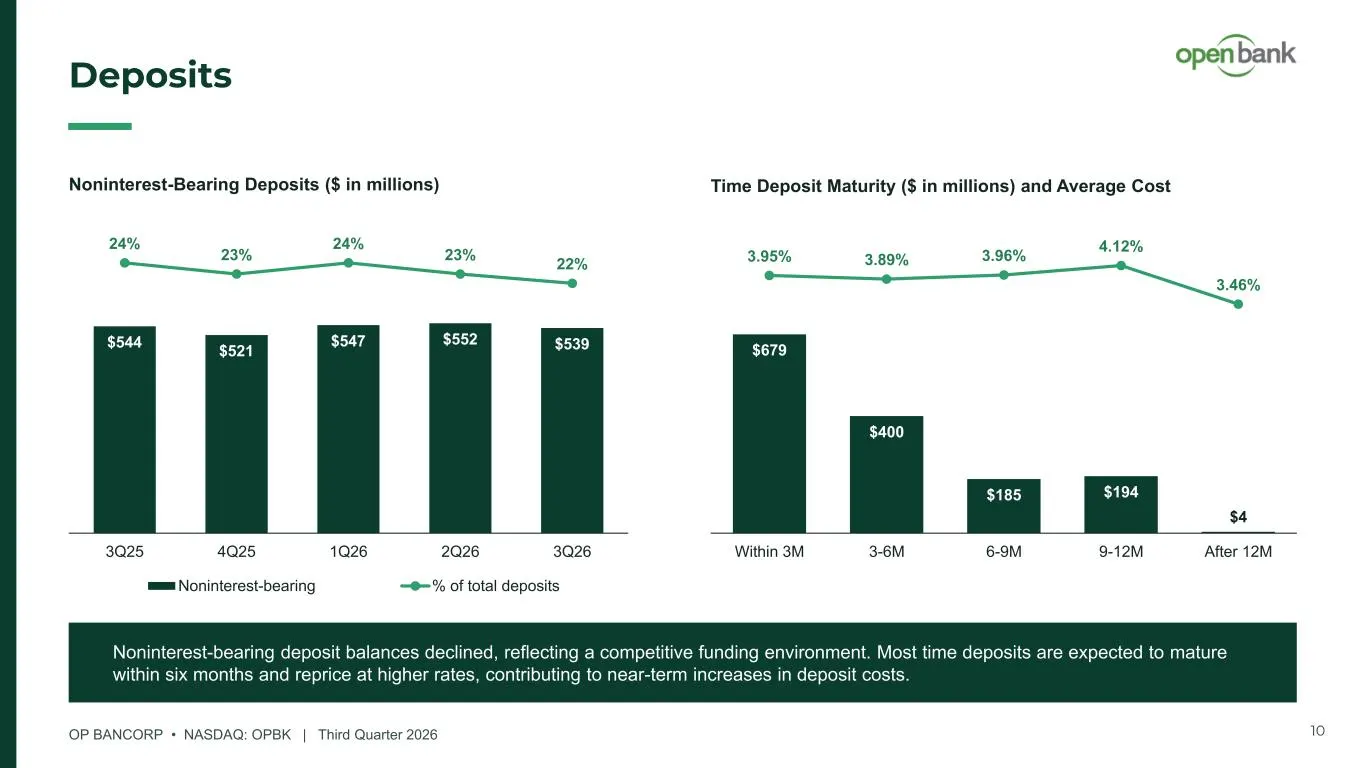
OP BANCORP • NASDAQ: OPBK | Third Quarter 2026 Deposits Noninterest-bearing deposit balances declined, reflecting a competitive funding environment. Most time deposits are expected to mature within six months and reprice at higher rates, contributing to near-term increases in deposit costs. 10 Time
Slide 11: Average Loan Yields and Deposit Costs
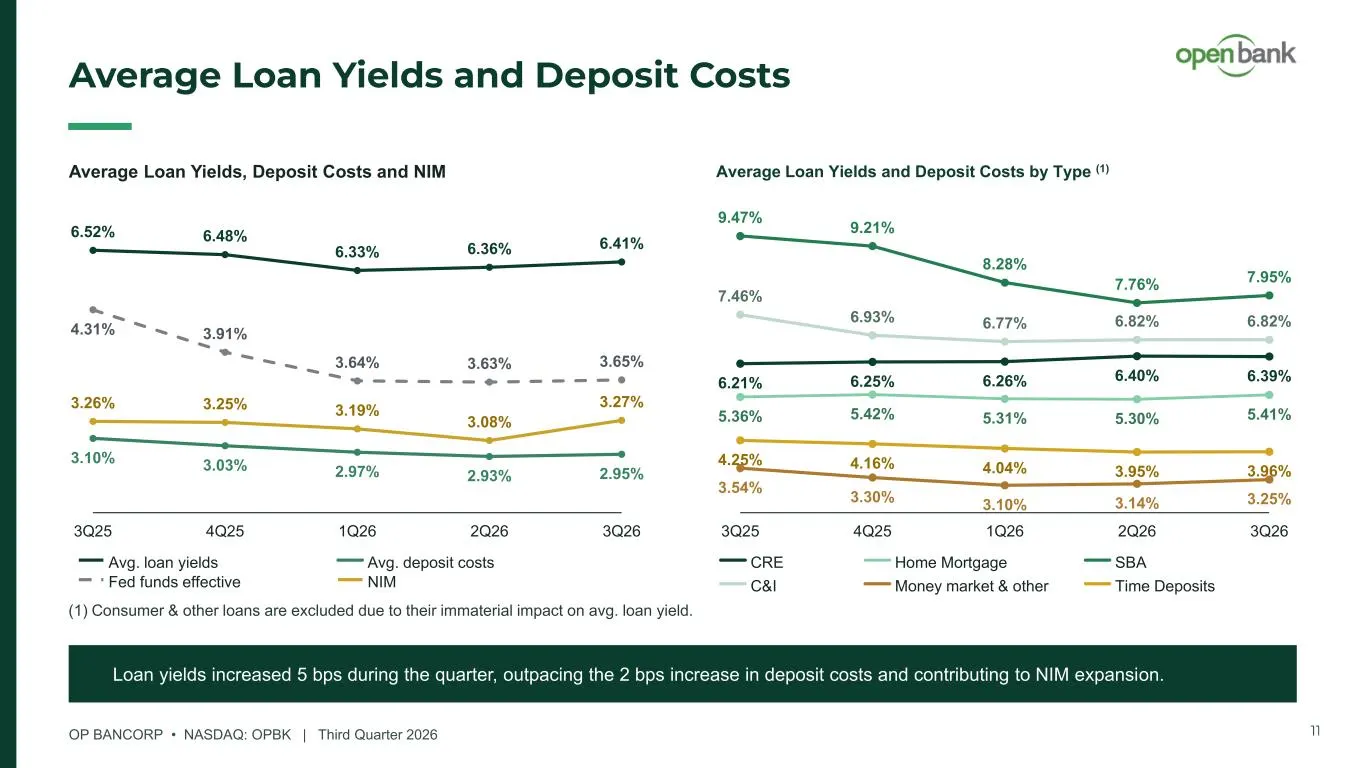
OP BANCORP • NASDAQ: OPBK | Third Quarter 2026 Average Loan Yields and Deposit Costs Loan yields increased 5 bps during the quarter, outpacing the 2 bps increase in deposit costs and contributing to NIM expansion. 11 6.21% 6.25% 6.26% 6.40% 6.39% 5.36% 5.42% 5.31% 5.30% 5.41% 9.47% 9.21% 8.28% 7.76%
Slide 12: Noninterest Income
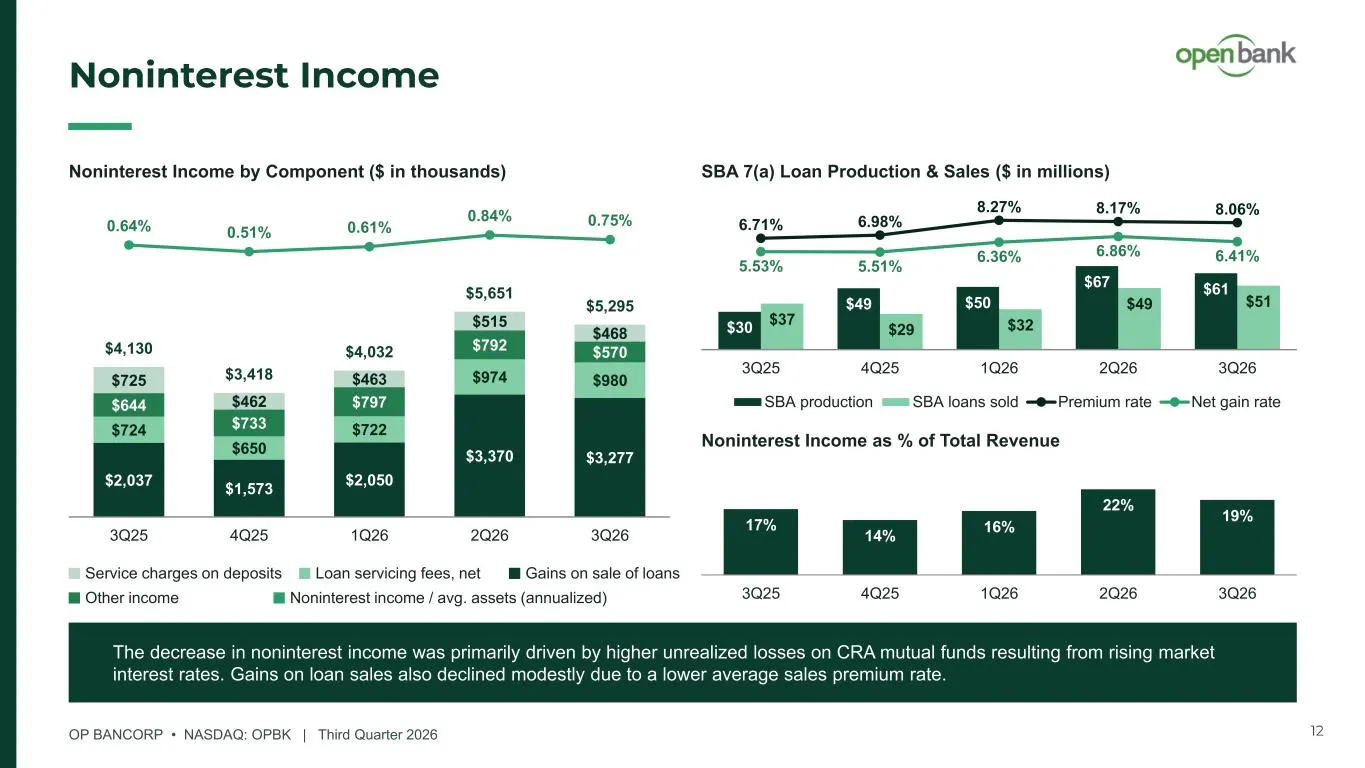
OP BANCORP • NASDAQ: OPBK | Third Quarter 2026 Noninterest Income Noninterest Income by Component ($ in thousands) $2,037 $1,573 $2,050 $3,370 $3,277 $724 $650 $722 $974 $980 $644 $733 $797 $792 $570 $725 $462 $463 $515 $468 $4,130 $3,418 $4,032 $5,651 $5,295 0.64% 0.51% 0.61% 0.84% 0.75% 3Q25 4Q25
Slide 13: Noninterest Expense
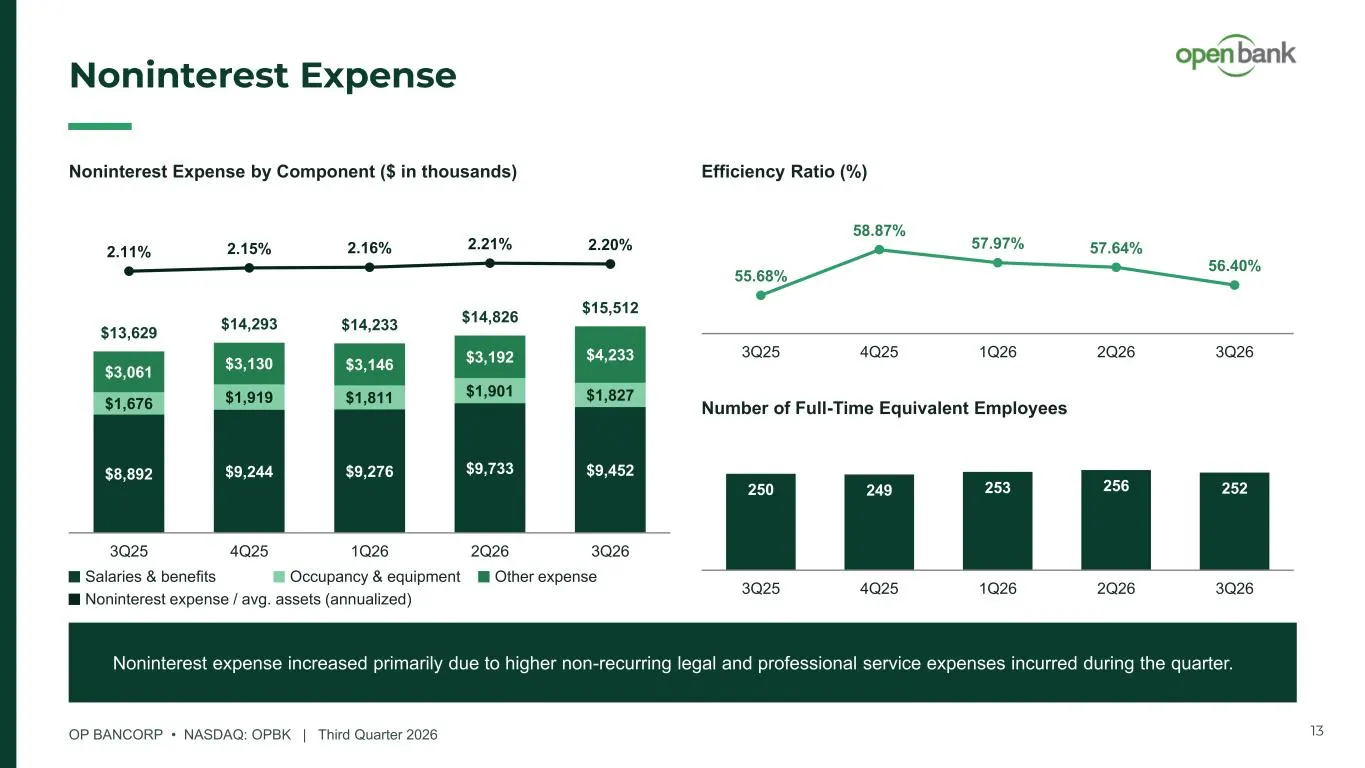
OP BANCORP • NASDAQ: OPBK | Third Quarter 2026 Noninterest Expense Noninterest Expense by Component ($ in thousands) $8,892 $9,244 $9,276 $9,733 $9,452 $1,676 $1,919 $1,811 $1,901 $1,827 $3,061 $3,130 $3,146 $3,192 $4,233 $13,629 $14,293 $14,233 $14,826 $15,512 2.11% 2.15% 2.16% 2.21% 2.20% 3Q25 4Q2
Slide 14: Credit Quality
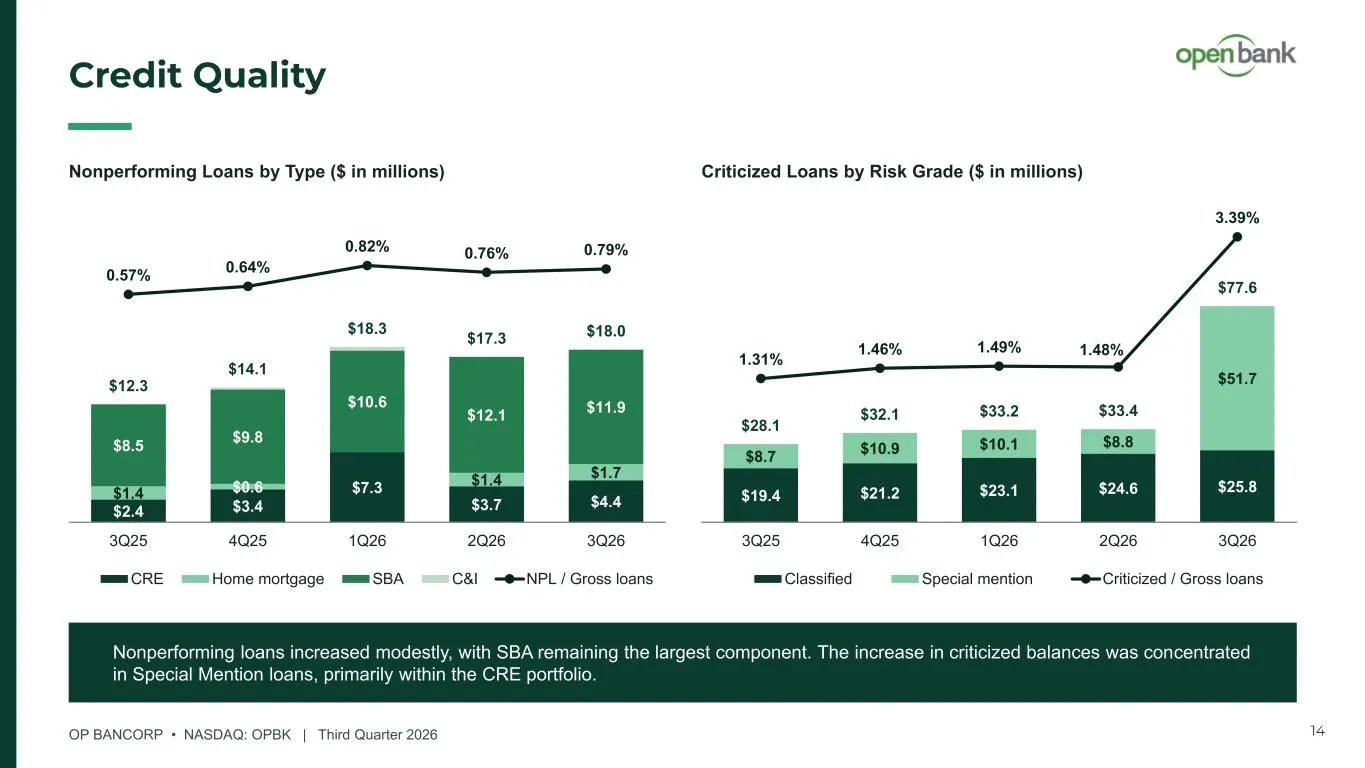
OP BANCORP • NASDAQ: OPBK | Third Quarter 2026 Credit Quality Nonperforming Loans by Type ($ in millions) $2.4 $3.4 $7.3 $3.7 $4.4 $1.4 $0.6 $1.4 $1.7 $8.5 $9.8 $10.6 $12.1 $11.9 $12.3 $14.1 $18.3 $17.3 $18.0 0.57% 0.64% 0.82% 0.76% 0.79% 3Q25 4Q25 1Q26 2Q26 3Q26 CRE Home mortgage SBA C&I NPL / Gros
Slide 15: Allowance for Credit Losses on Loans
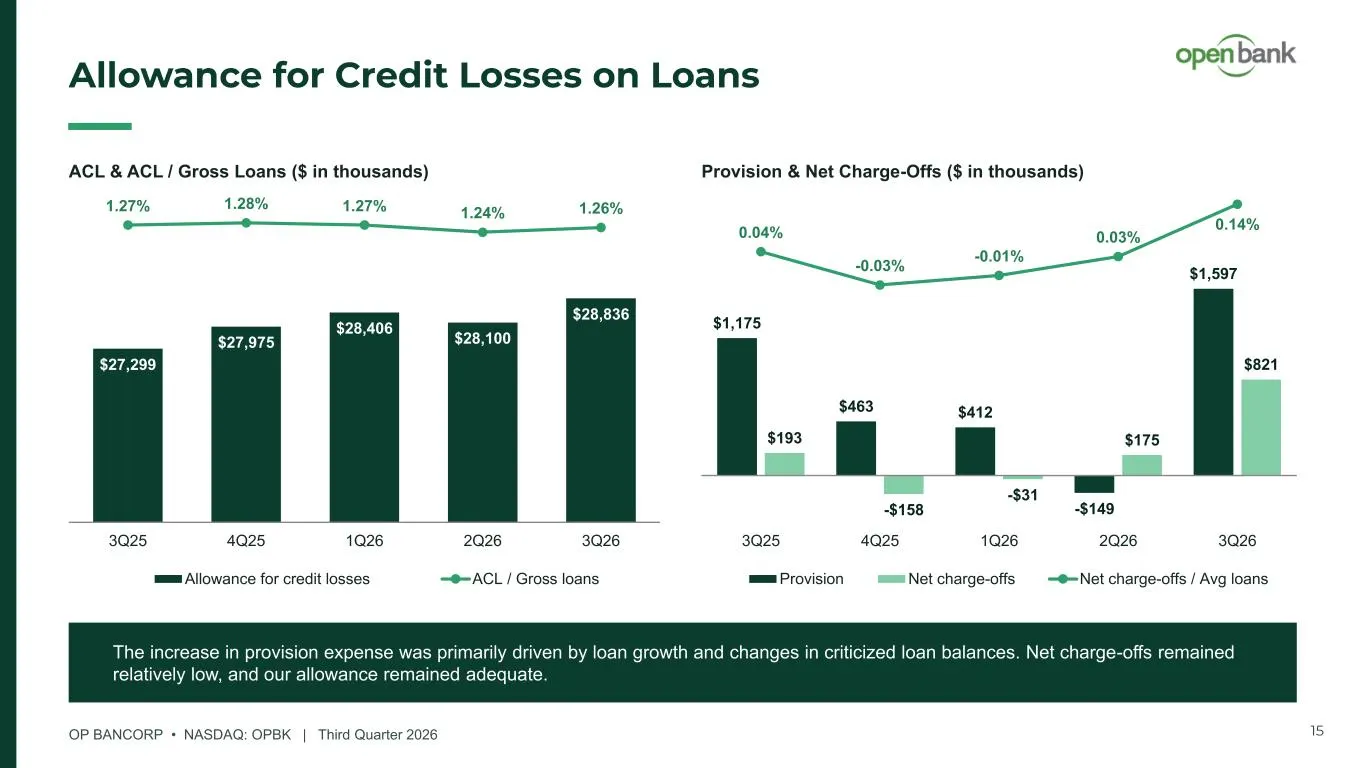
OP BANCORP • NASDAQ: OPBK | Third Quarter 2026 Allowance for Credit Losses on Loans ACL & ACL / Gross Loans ($ in thousands) $27,299 $27,975 $28,406 $28,100 $28,836 1.27% 1.28% 1.27% 1.24% 1.26% 3Q25 4Q25 1Q26 2Q26 3Q26 Allowance for credit losses ACL / Gross loans Provision & Net Charge-Offs ($ in
Slide 16: Capital
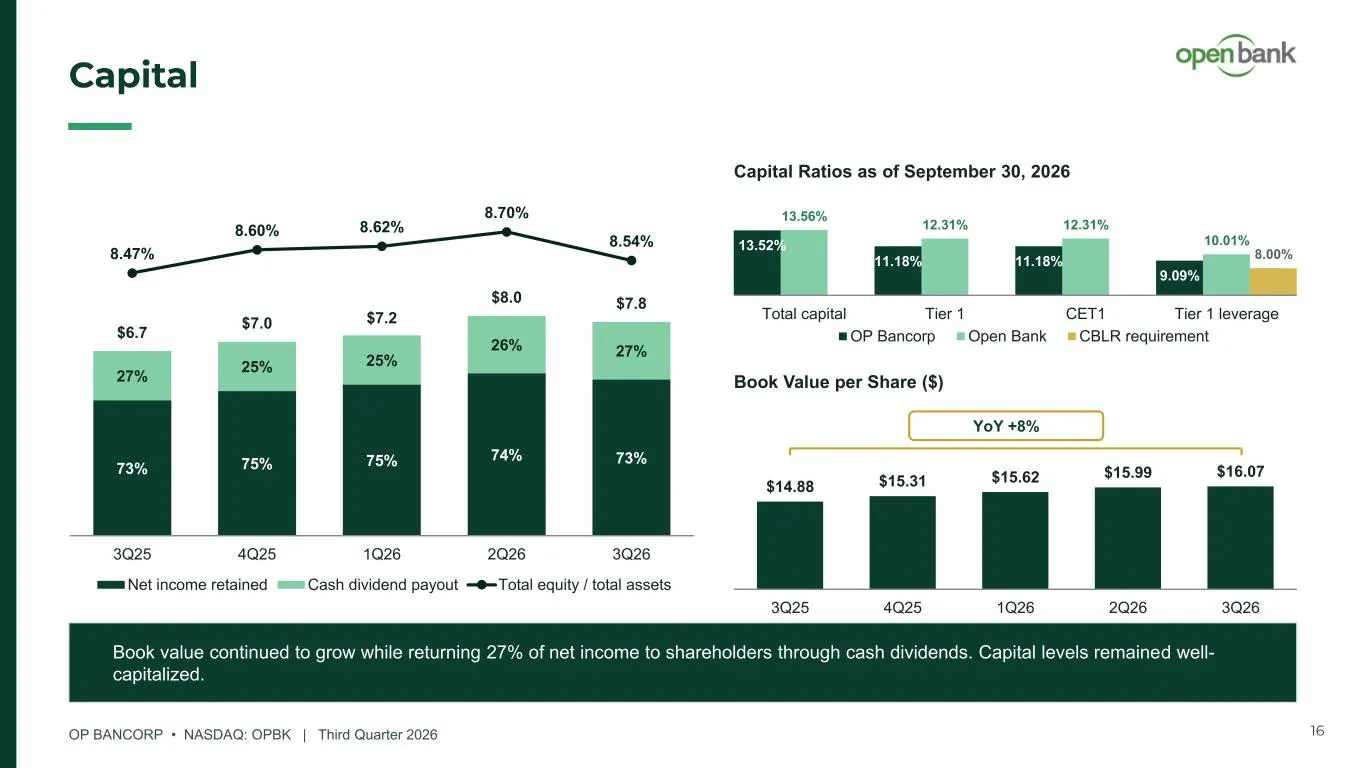
OP BANCORP • NASDAQ: OPBK | Third Quarter 2026 Capital Capital Return ($ in millions) 73% 75% 75% 74% 73% 27% 25% 25% 26% 27% $6.7 $7.0 $7.2 $8.0 $7.8 8.47% 8.60% 8.62% 8.70% 8.54% 3Q25 4Q25 1Q26 2Q26 3Q26 Net income retained Cash dividend payout Total equity / total assets 13.52% 11.18% 11.18% 9.09

Slide 17: Appendix: Supplemental Information
SUPPLEMENTAL INFORMATION Appendix
Slide 18: CRE by LTV, Geography and Property Type
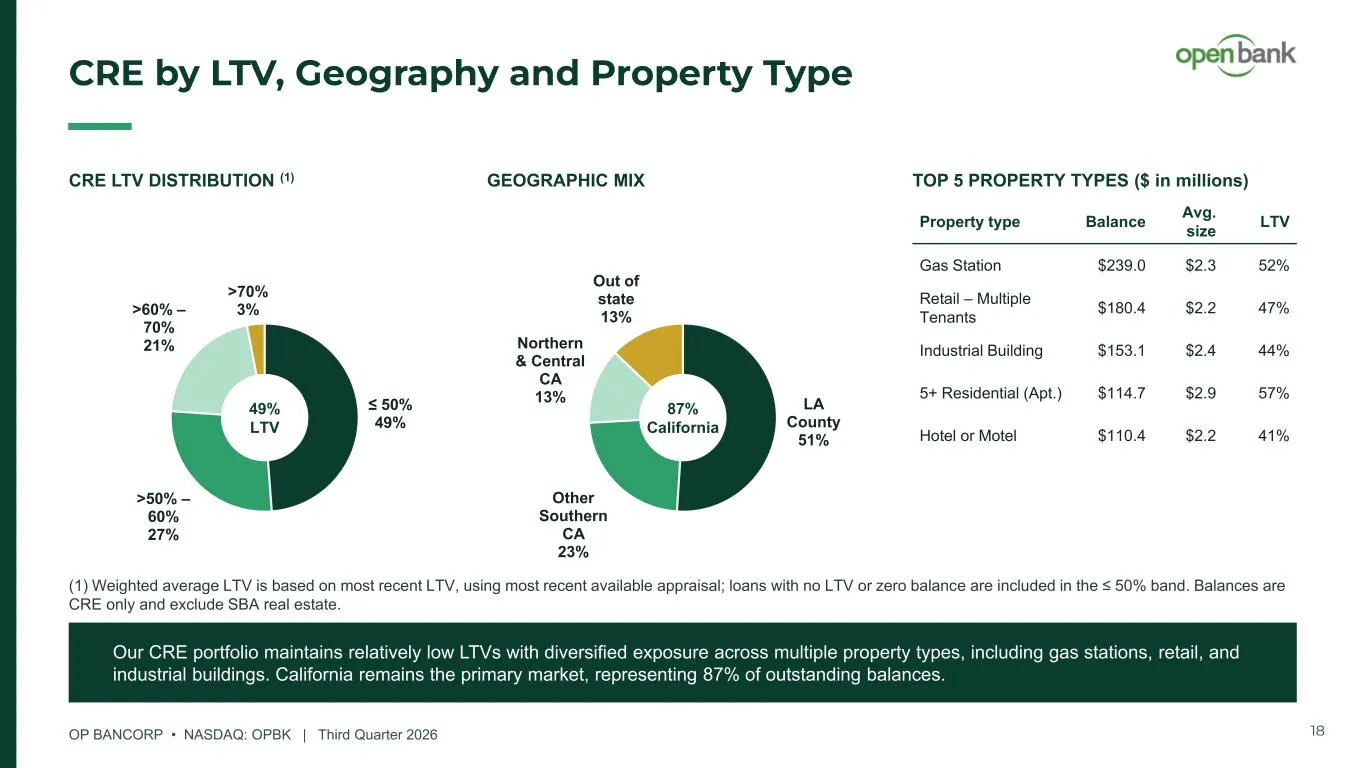
OP BANCORP • NASDAQ: OPBK | Third Quarter 2026 CRE by LTV, Geography and Property Type CRE LTV DISTRIBUTION (1) GEOGRAPHIC MIX ≤ 50% 49% >50% – 60% 27% >60% – 70% 21% >70% 3% LA County 51% Other Southern CA 23% Northern & Central CA 13% Out of state 13% Property type Balance Avg. size LTV Gas Statio
Slide 19: SBA by Geography, Property Type and LTV
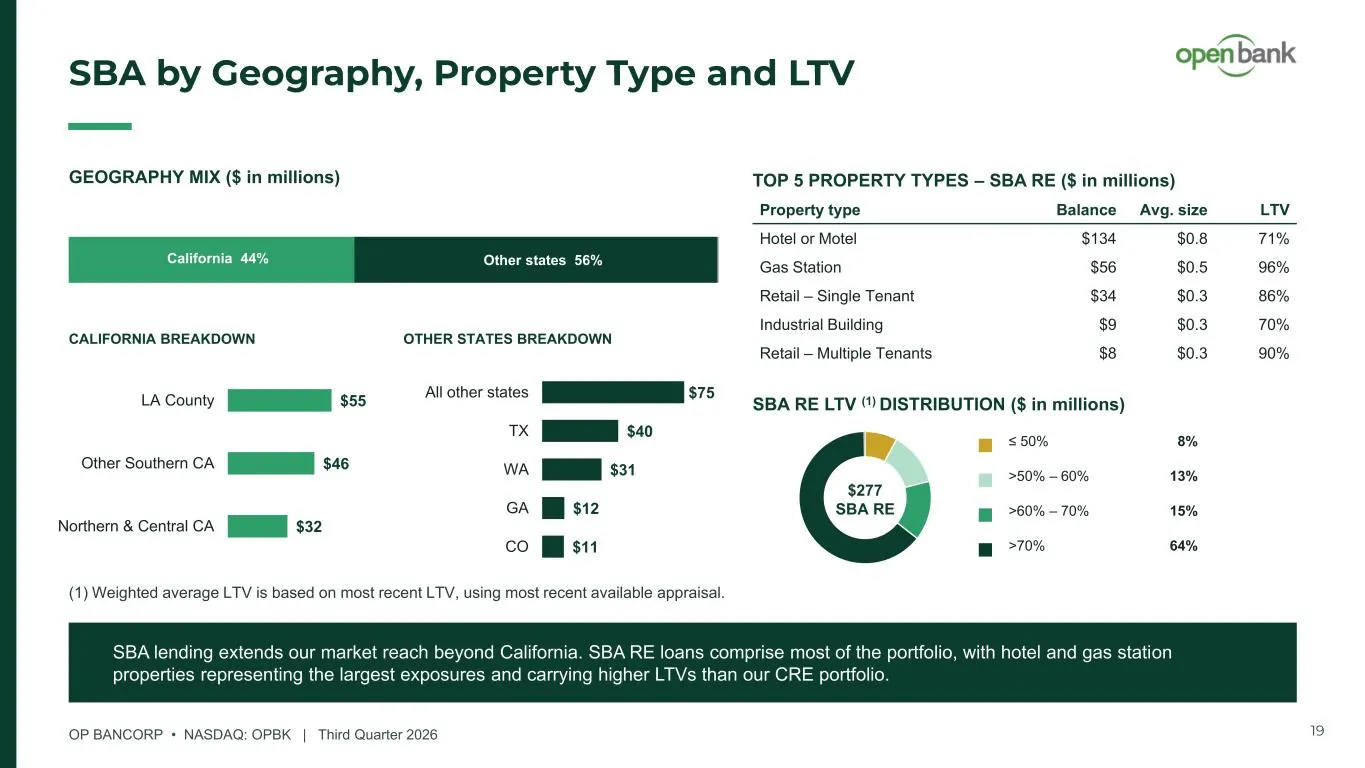
OP BANCORP • NASDAQ: OPBK | Third Quarter 2026 SBA by Geography, Property Type and LTV Property type Balance Avg. size LTV Hotel or Motel $134 $0.8 71% Gas Station $56 $0.5 96% Retail – Single Tenant $34 $0.3 86% Industrial Building $9 $0.3 70% Retail – Multiple Tenants $8 $0.3 90% TOP 5 PROPERTY TY
Slide 20: Home Mortgage by LTV and Geography
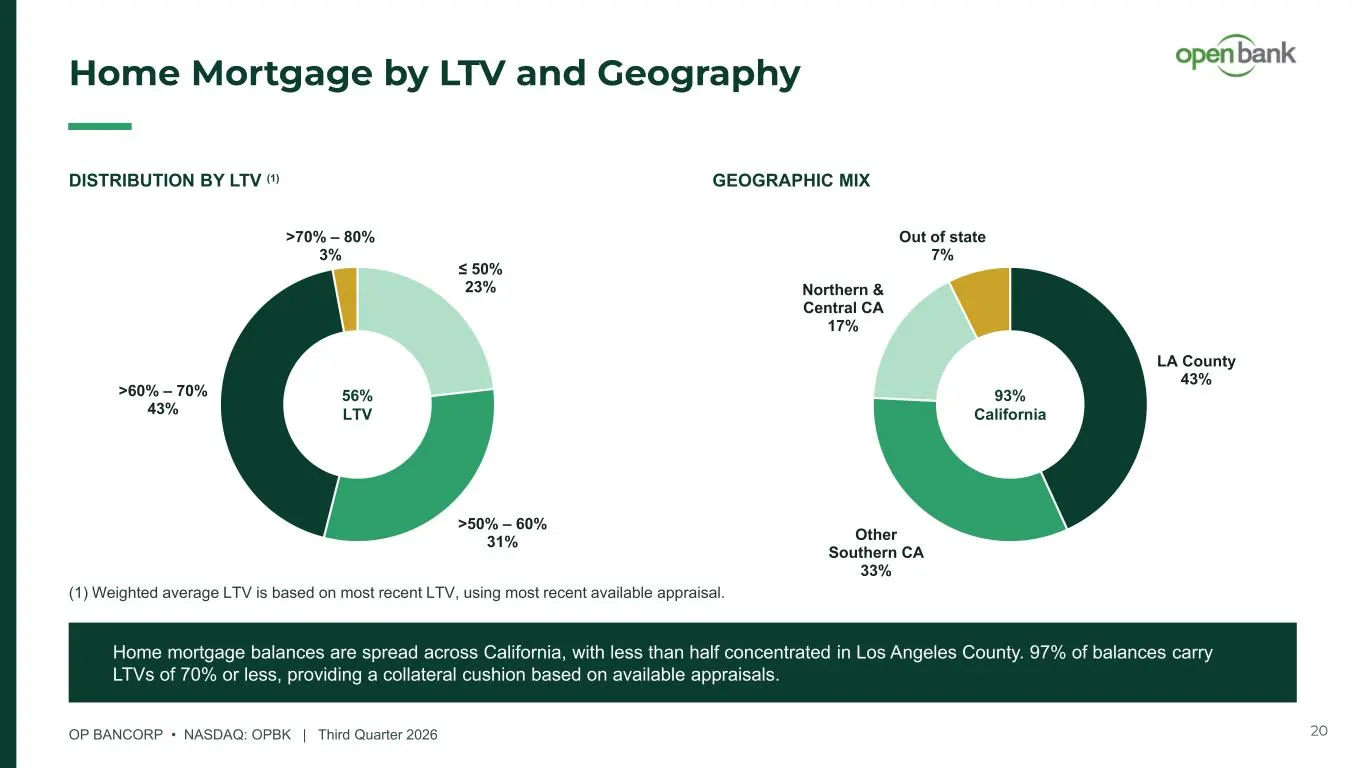
OP BANCORP • NASDAQ: OPBK | Third Quarter 2026 Home Mortgage by LTV and Geography DISTRIBUTION BY LTV (1) GEOGRAPHIC MIX ≤ 50% 23% >50% – 60% 31% >60% – 70% 43% >70% – 80% 3% LA County 43% Other Southern CA 33% Northern & Central CA 17% Out of state 7% Home mortgage balances are spread across Califo
Slide 21: ACL Composition and Coverage by Loan Type
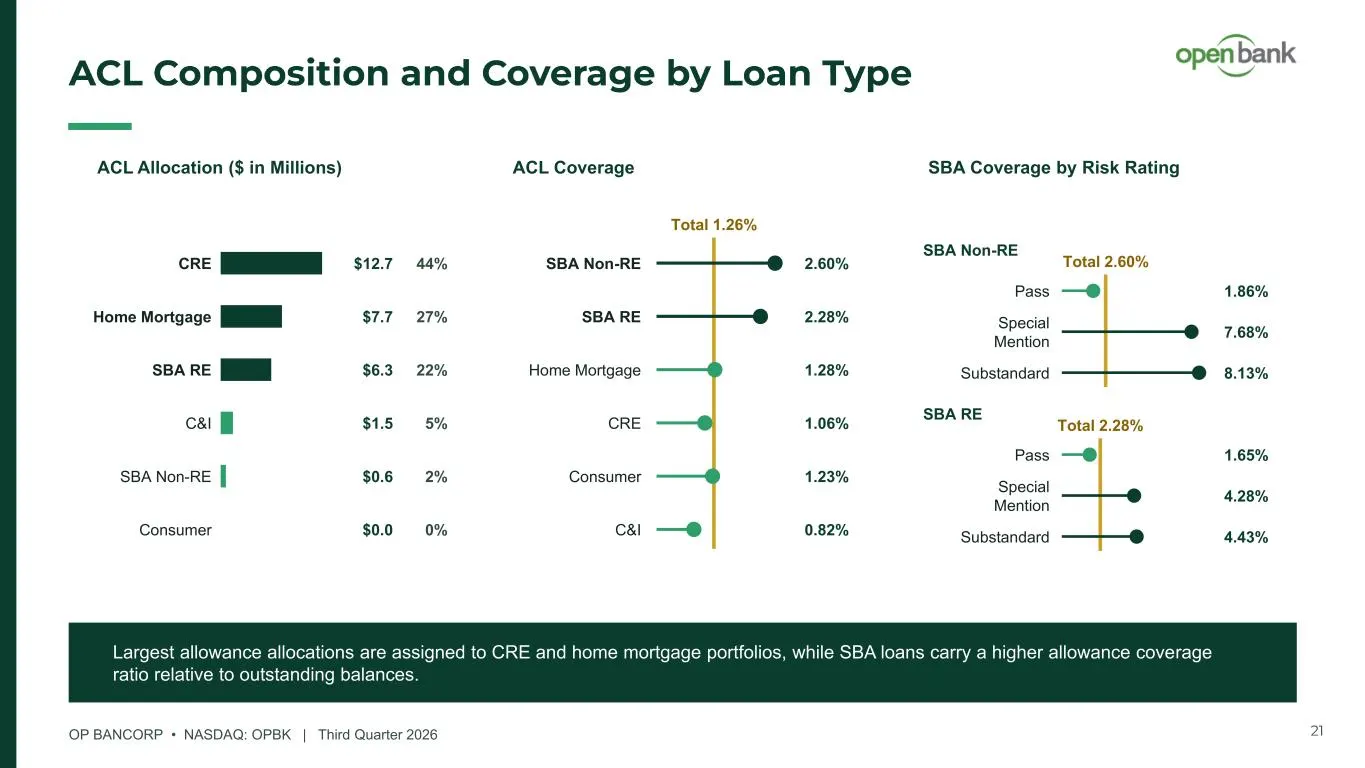
OP BANCORP • NASDAQ: OPBK | Third Quarter 2026 ACL Composition and Coverage by Loan Type ACL Allocation ($ in Millions) ACL Coverage SBA Coverage by Risk Rating CRE $12.7 44% SBA RE $6.3 22% Home Mortgage $7.7 27% C&I $1.5 5% SBA Non-RE $0.6 2% Consumer $0.0 0% Total 1.26% SBA RE 2.28% SBA Non-RE 2.
Slide 22: Liquidity
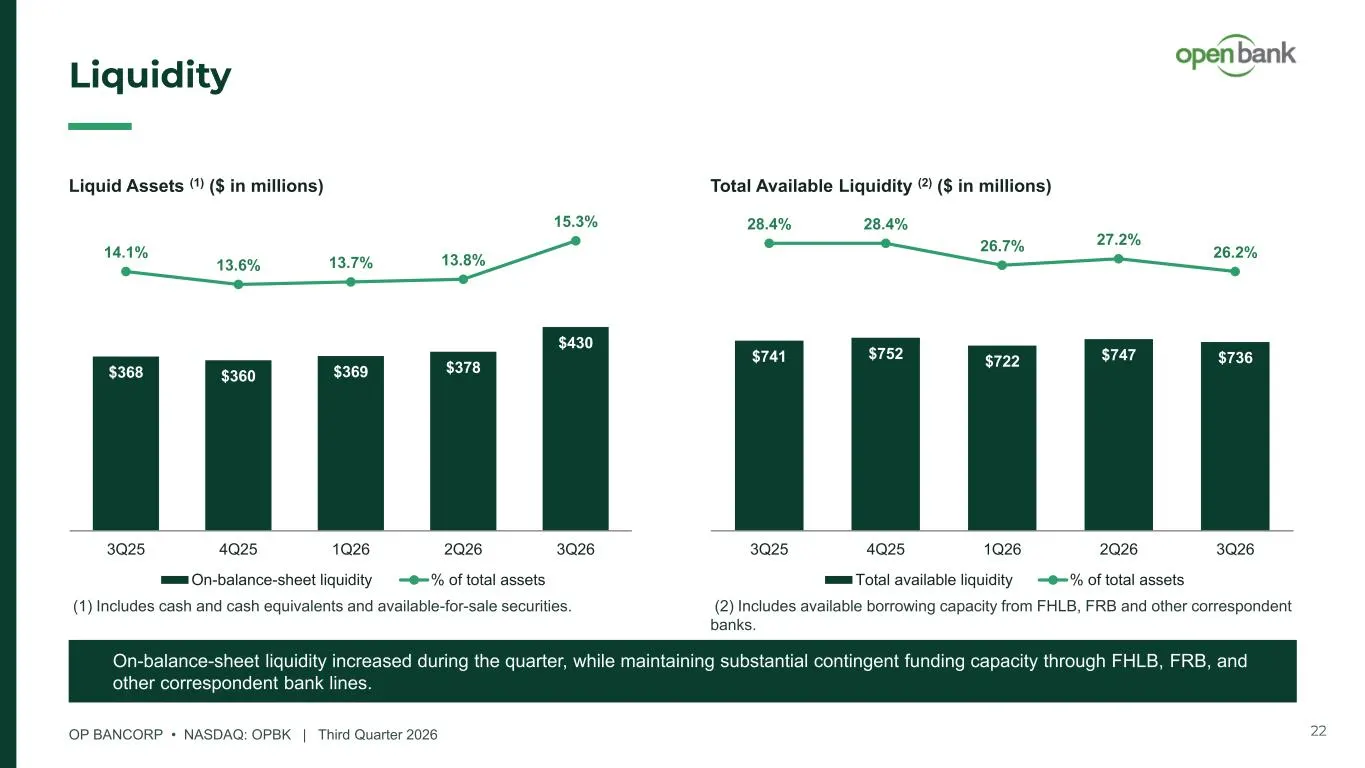
OP BANCORP • NASDAQ: OPBK | Third Quarter 2026 Liquidity Liquid Assets (1) ($ in millions) $368 $360 $369 $378 $430 14.1% 13.6% 13.7% 13.8% 15.3% 3Q25 4Q25 1Q26 2Q26 3Q26 On-balance-sheet liquidity % of total assets Total Available Liquidity (2) ($ in millions) $741 $752 $722 $747 $736 28.4% 28.4% 2

Slide 23: Thank You
OP BANCORP • NASDAQ: OPBK Thank You Investor Relations: Jaehyun Park, EVP & CFO jaehyun.park@myopenbank.com www.myopenbank.com
Source: SEC EDGAR · 8-K filed Oct 22, 2026
More decks from OP Bancorp
 Q2 2026 Earnings Presentation19 slides · Jul 23, 2026
 Q1 2026 Earnings Presentation19 slides · Apr 23, 2026
 Q4 2025 Earnings Presentation19 slides · Jan 22, 2026
 Q3 2025 Earnings Presentation19 slides · Oct 23, 2025
 Q2 2025 Earnings Presentation19 slides · Jul 24, 2025
 Q1 2025 Earnings Presentation19 slides · Apr 24, 2025