Duke Realty — Citi Global Property CEO Conference 2008
38 slides from Duke Realty's conference presentation, Mar 3, 2008

Slide 1: Citi Global Property CEO Conference March 2-5, 2008
1 Citi Global Property CEO Conference March 2-5, 2008
Slide 2: Strategic Plan Key Elements
2 Strategic Plan Key Elements Expand Geographically & Operate on a National Platform – more opportunities Focus on Development – more profitable Product Type Diversification – more opportunities and lesser effect of economic cycles Build the Capital Recycling and Joint Venture Businesses – alternate
Slide 3: Expand Geographically - Execution and Results
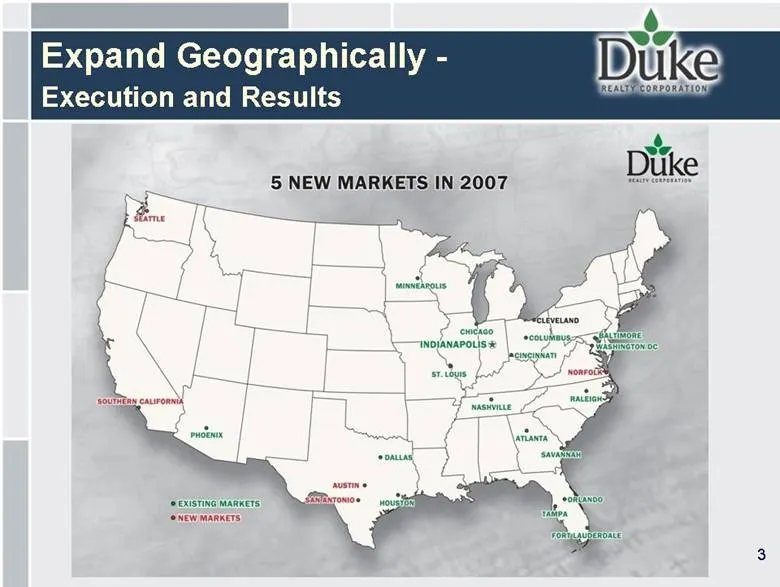
3 Expand Geographically - Execution and Results
Slide 4: Focus on Development
Focus on Development
Slide 5: Superior Development Model and Expertise
5 Superior Development Model and Expertise Over 30 year history Diversified risk – geographic and product type Design-build capability entirely in-house Build at wholesale, value at retail
Slide 6: Duke Development Model – Unique Strengths
6 Duke Development Model – Unique Strengths Full-service general contractor to meet each unique customer needs Quickly respond to build-to-suit proposals and land opportunities In-house capabilities more cost effective and flexible than out-sourcing, resulting in greater profitability Projects compl
Slide 7: Product Diversification
Product Diversification
Slide 8: Industrial Strategy
8 Industrial Strategy Control land in top U.S. industrial markets Maintain dominant market positions, occupancy and same property growth Focus on modern bulk industrial product (300,000 to over 1 million square feet, 28’ to 36’ clear height) Pursue build-to-suit opportunities nationwide Have ready i
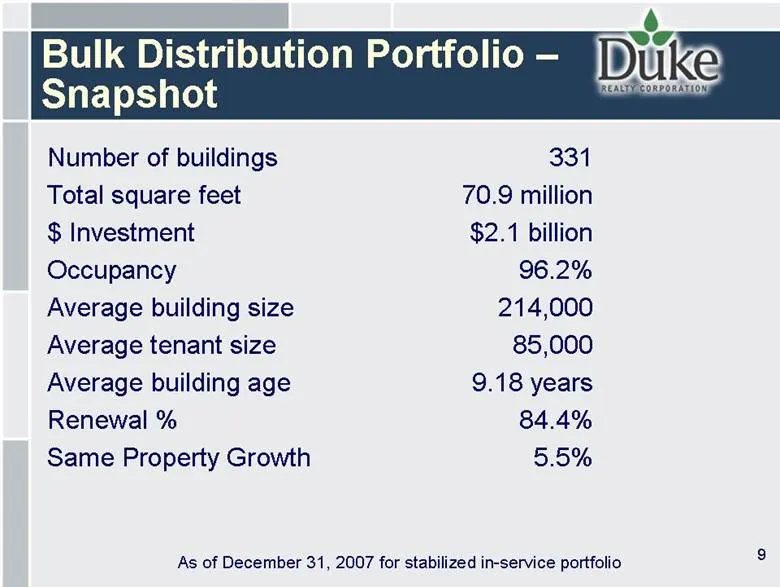
Slide 9: Bulk Distribution Portfolio – Snapshot
9 Bulk Distribution Portfolio – Snapshot Number of buildings 331 Total square feet 70.9 million $ Investment $2.1 billion Occupancy 96.2% Average building size 214,000 Average tenant size 85,000 Average building age 9.18 years Renewal % 84.4% Same Property Growth 5.5% As of December 31, 2007 for sta
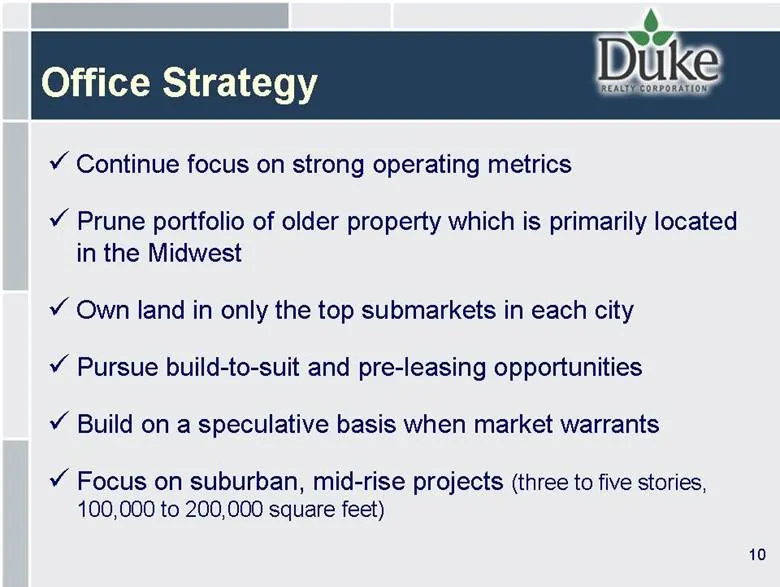
Slide 10: Office Strategy
10 Office Strategy Continue focus on strong operating metrics Prune portfolio of older property which is primarily located in the Midwest Own land in only the top submarkets in each city Pursue build-to-suit and pre-leasing opportunities Build on a speculative basis when market warrants Focus on sub
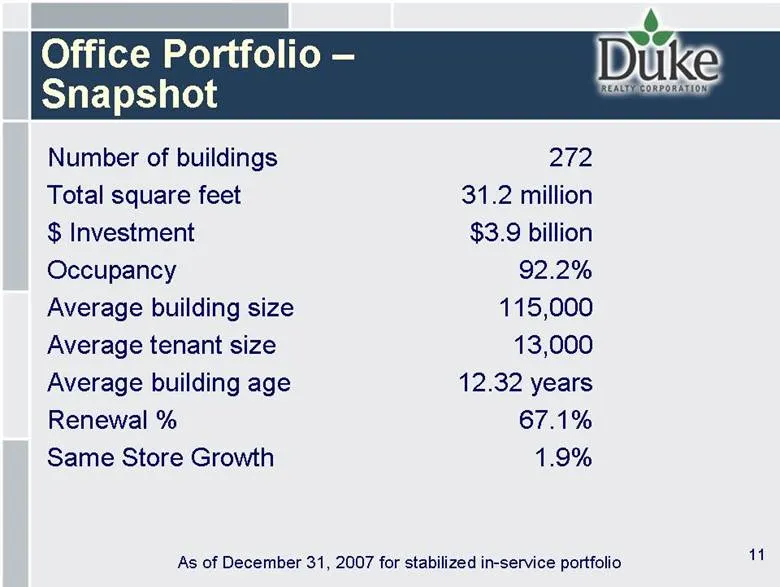
Slide 11: Office Portfolio – Snapshot
11 Office Portfolio – Snapshot Number of buildings 272 Total square feet 31.2 million $ Investment $3.9 billion Occupancy 92.2% Average building size 115,000 Average tenant size 13,000 Average building age 12.32 years Renewal % 67.1% Same Store Growth 1.9% As of December 31, 2007 for stabilized in-s
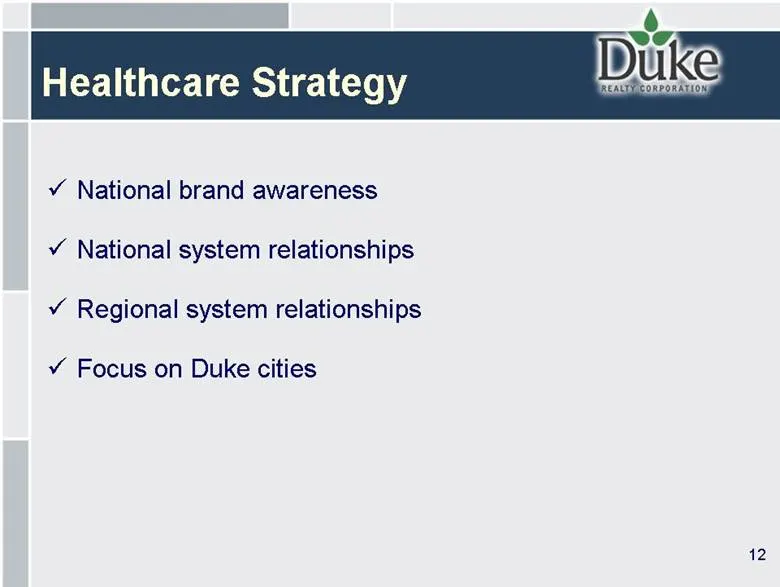
Slide 12: Healthcare Strategy
12 Healthcare Strategy National brand awareness National system relationships Regional system relationships Focus on Duke cities
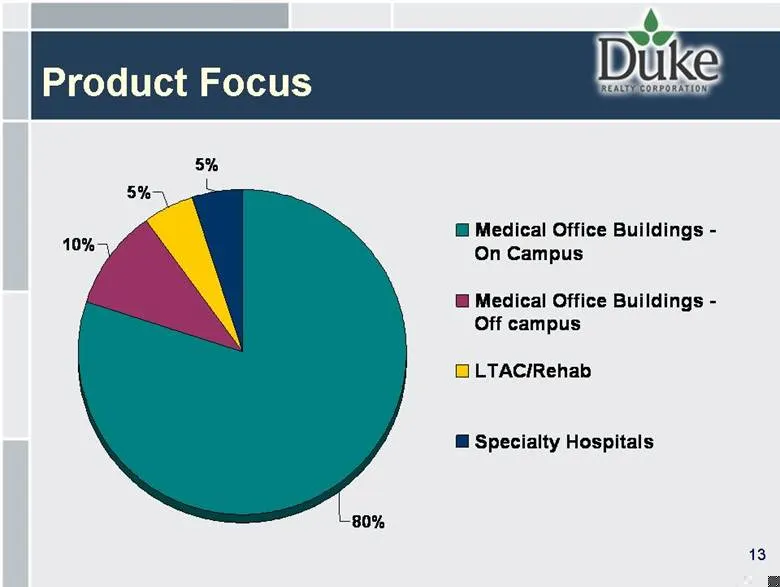
Slide 13: Product Focus
13 Product Focus 10% 5% 5% 80% Medical Office Buildings - On Campus Medical Office Buildings - Off campus LTAC/Rehab Specialty Hospitals
Slide 14: Retail Strategy
14 Retail Strategy Focus on big box and lifestyle center projects Target markets: Atlanta, Chicago, Dallas, Orlando, Phoenix and Washington, D.C. High barrier to entry, larger projects Continue operating joint venture programs on lifestyle projects Target mixed-use projects with office, healthcare,
Slide 15: Mixed-use Development Opportunities
15 Mixed-use Development Opportunities Multiple product uses on one land site Horizontal and vertical mixed-use opportunities Demand driven by alternative uses individually and also by shared synergies between uses (retail/office, hotel/retail/office, etc.) Generally near urban centers: infill, rede
Slide 16: Recent Activity - Key Transactions
Recent Activity -Key Transactions-
Slide 17: Bulk Industrial Takeout Joint Venture
Ownership: LLC owned 80% by an Institutional Partner and 20% by Duke Target Size: $600-$800M of total assets Investment Period: Three years Property Type: Single tenant bulk industrial in excess of 200,000 square feet with lease term of 7+ years Leverage: Up to 65% Promotes: Duke will receive promot
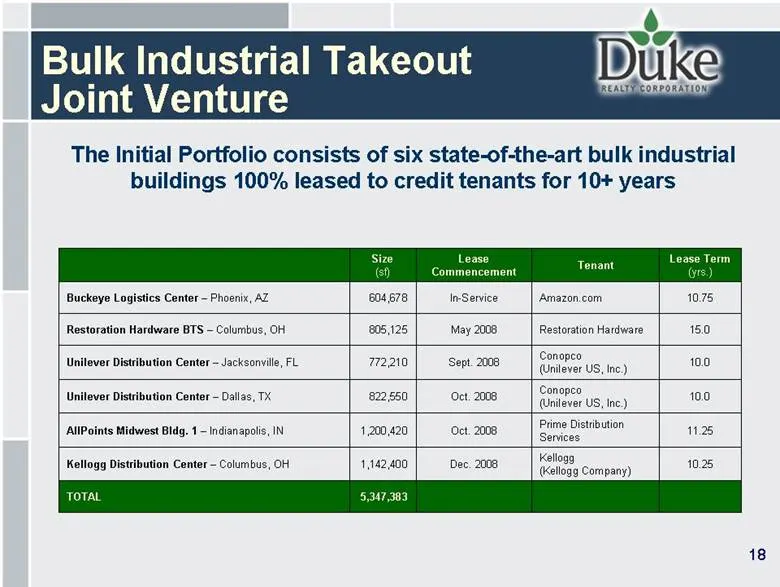
Slide 18: Bulk Industrial Takeout Joint Venture Initial Portfolio
The Initial Portfolio consists of six state-of-the-art bulk industrial buildings 100% leased to credit tenants for 10+ years Size (sf ) Lease Commencement Tenant Lease Term (yrs.) Buckeye Logistics Center – Phoenix, AZ 604,678 In-Service Amazon.com 10.75 Restoration Hardware BTS – Columbus, OH 805,1
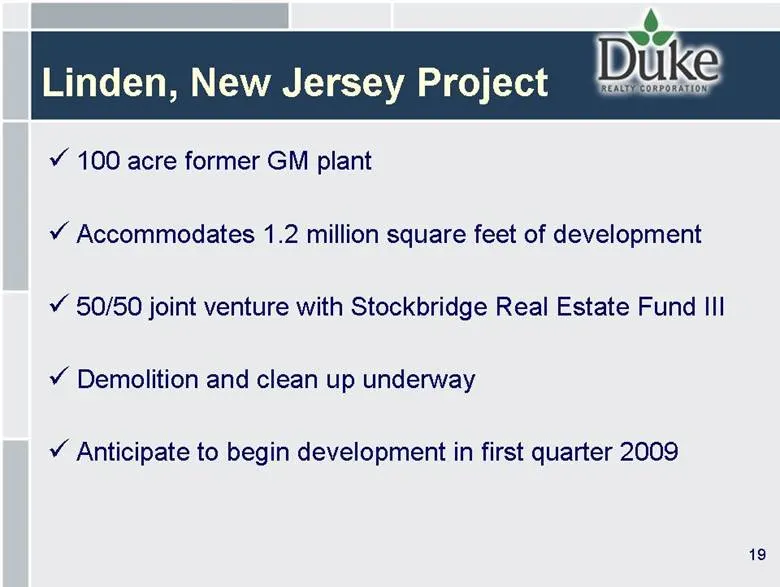
Slide 19: Linden, New Jersey Project
19 Linden, New Jersey Project 100 acre former GM plant Accommodates 1.2 million square feet of development 50/50 joint venture with Stockbridge Real Estate Fund III Demolition and clean up underway Anticipate to begin development in first quarter 2009
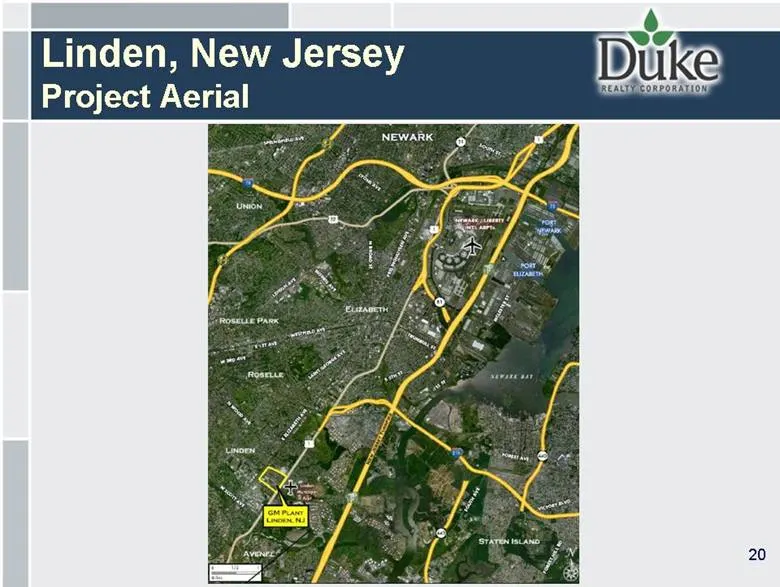
Slide 20: Linden, New Jersey Project Aerial
20 Linden, New Jersey Project Aerial
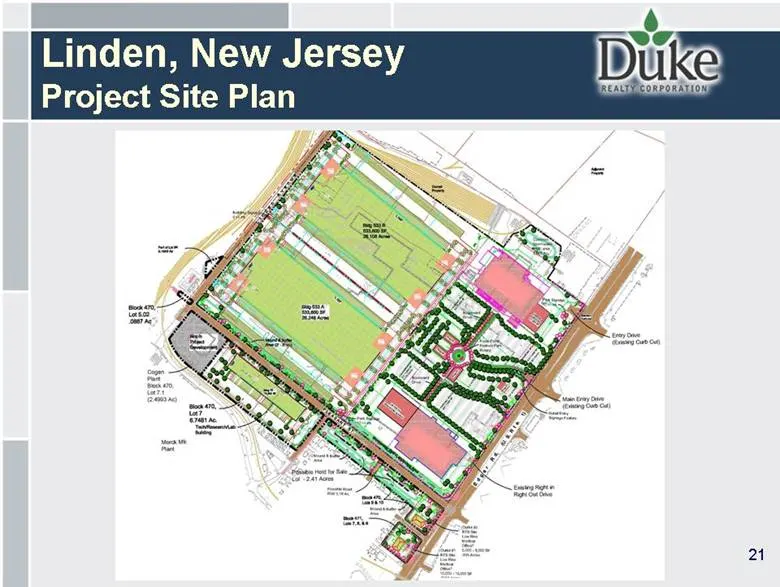
Slide 21: Linden, New Jersey Project Site Plan
21 Linden, New Jersey Project Site Plan
Slide 22: Port Strategy – Industrial Acquisition
22 Port Strategy – Industrial Acquisition Five 100% leased industrial buildings totaling 758,000 square feet Three buildings: 466,000 square feet in Norfolk, Virginia One building: 120,000 square feet in Sumner, Washington One building: 172,000 square feet in Houston, Texas Acquired 161 acres near t
Slide 23: Development Activity
Development Activity
Slide 24: Development Pipeline (as of 12/31/07)
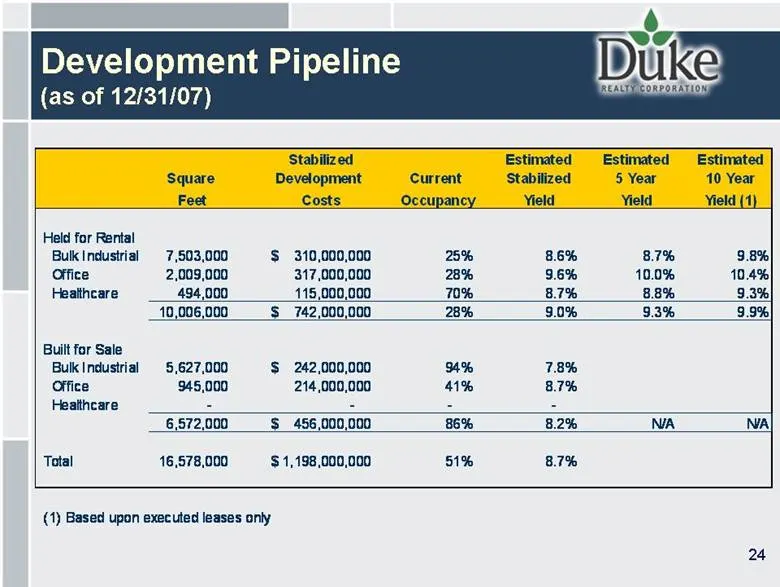
24 Development Pipeline (as of 12/31/07) Stabilized Estimated Estimated Estimated Square Development Current Stabilized 5 Year 10 Year Feet Costs Occupancy Yield Yield Yield (1) Held for Rental Bulk Industrial 7,503,000 310,000,000 $ 25% 8.6% 8.7% 9.8% Office 2,009,000 317,000,000 28% 9.6% 10.0% 10.
Slide 25: AllPoints Midwest I
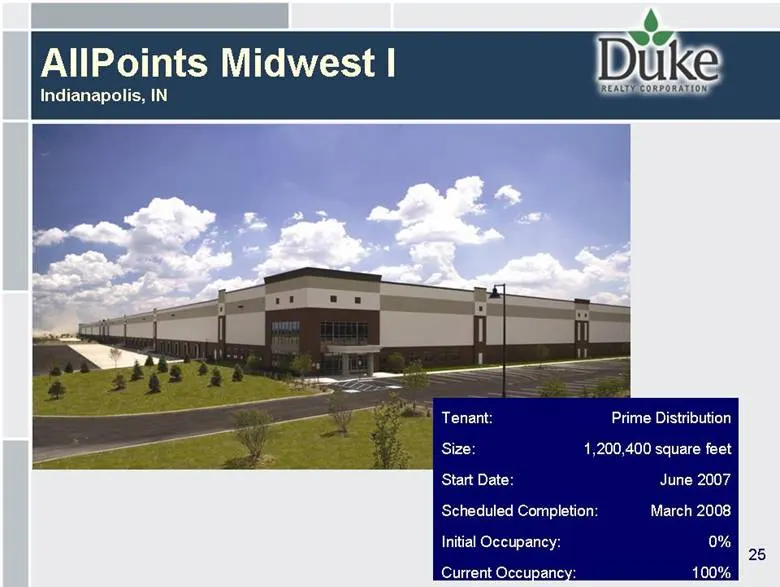
25 AllPoints Midwest I Indianapolis, IN Tenant: Prime Distribution Size: 1,200,400 square feet Start Date: June 2007 Scheduled Completion: March 2008 Initial Occupancy: 0% Current Occupancy: 100%
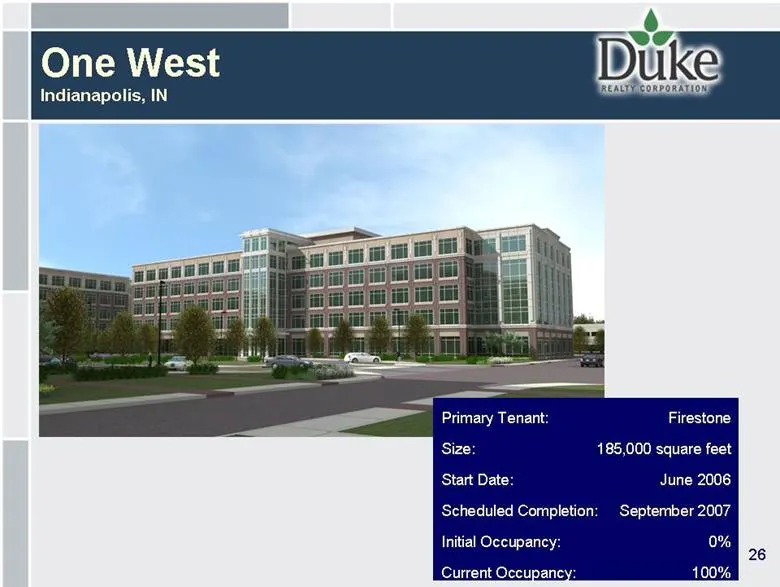
Slide 26: One West
26 One West Indianapolis, IN Primary Tenant: Firestone Size: 185,000 square feet Start Date: June 2006 Scheduled Completion: September 2007 Initial Occupancy: 0% Current Occupancy: 100%
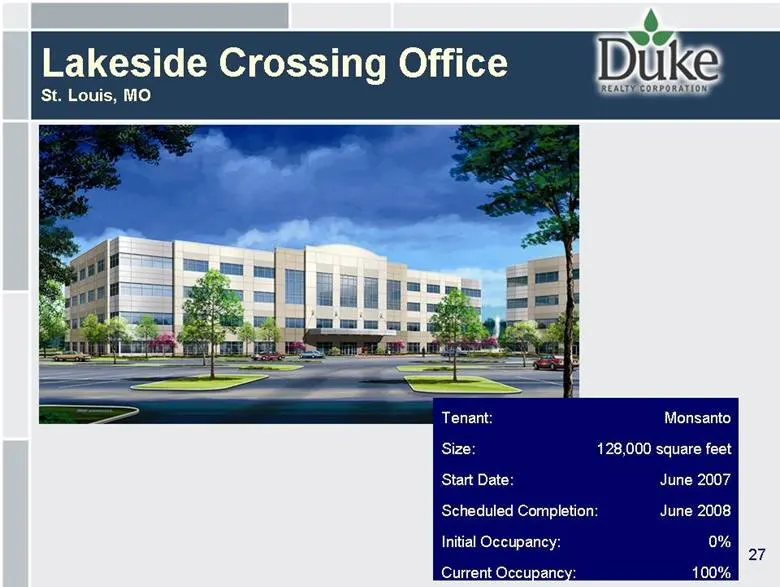
Slide 27: Lakeside Crossing Office
27 Lakeside Crossing Office St. Louis, MO Tenant: Monsanto Size: 128,000 square feet Start Date: June 2007 Scheduled Completion: June 2008 Initial Occupancy: 0% Current Occupancy: 100%
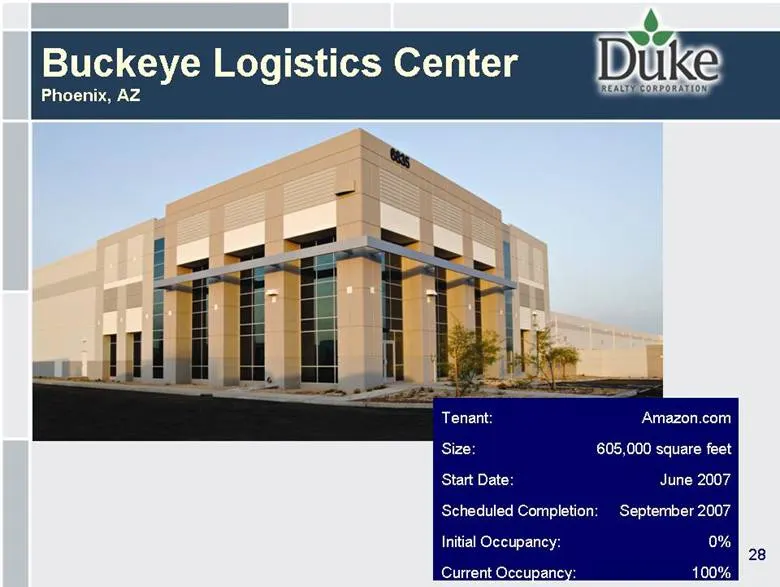
Slide 28: Buckeye Logistics Center
28 Buckeye Logistics Center Phoenix, AZ Tenant: Amazon.com Size: 605,000 square feet Start Date: June 2007 Scheduled Completion: September 2007 Initial Occupancy: 0% Current Occupancy: 100%
Slide 29: Capital Structure Strategy and Funding
Capital Structure Strategy and Funding
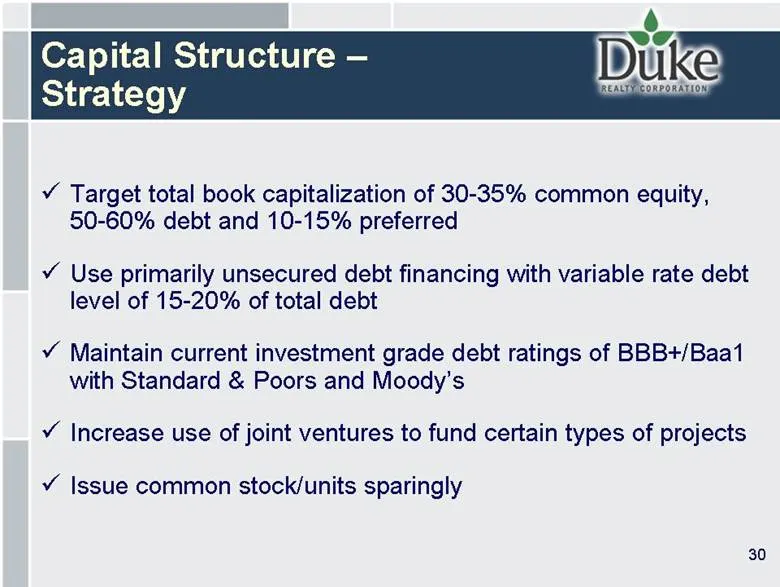
Slide 30: Capital Structure – Strategy
30 Capital Structure – Strategy Target total book capitalization of 30-35% common equity, 50-60% debt and 10-15% preferred Use primarily unsecured debt financing with variable rate debt level of 15-20% of total debt Maintain current investment grade debt ratings of BBB+/Baa1 with Standard & Poors an
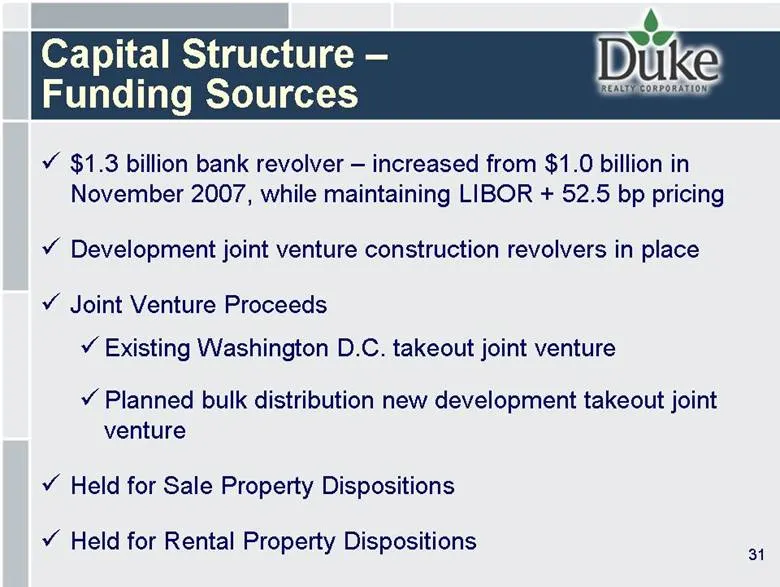
Slide 31: Capital Structure – Funding Sources
31 $1.3 billion bank revolver – increased from $1.0 billion in November 2007, while maintaining LIBOR + 52.5 bp pricing Development joint venture construction revolvers in place Joint Venture Proceeds Existing Washington D.C. takeout joint venture Planned bulk distribution new development takeout jo
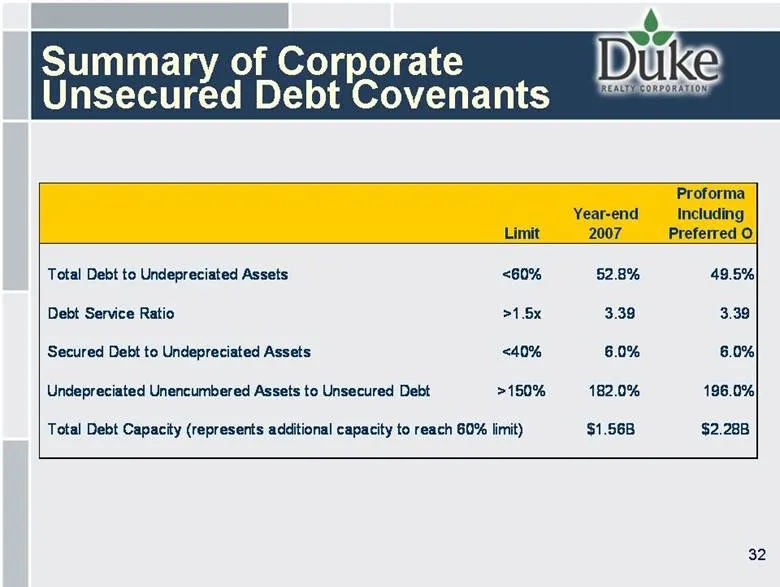
Slide 32: Summary of Corporate Unsecured Debt Covenants
Summary of Corporate Unsecured Debt Covenants 32 Proforma Year-end Including Limit 2007 Preferred O Total Debt to Undepreciated Assets <60% 52.8% 49.5% Debt Service Ratio >1.5x 3.39 3.39 Secured Debt to Undepreciated Assets <40% 6.0% 6.0% Undepreciated Unencumbered Assets to Unsecured Debt >150% 182
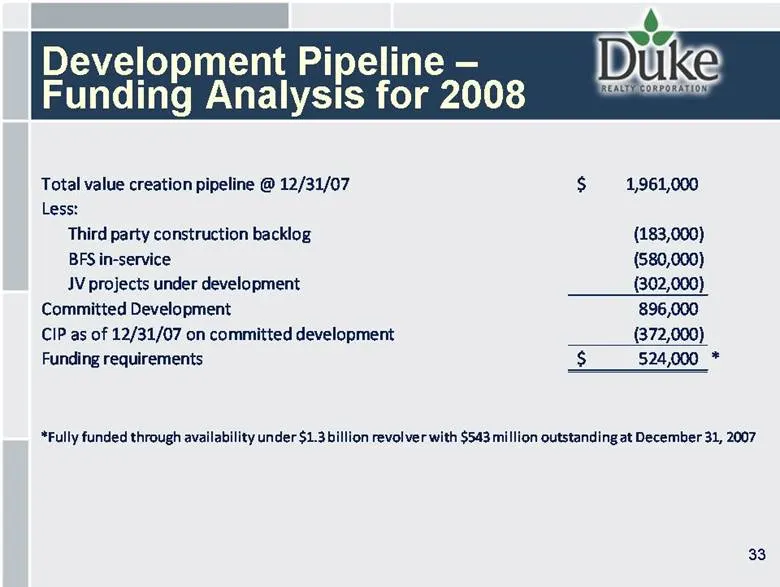
Slide 33: Development Pipeline – Funding Analysis for 2008
Development Pipeline – Funding Analysis for 2008 33 Total value creation pipeline @ 12/31/07 1,961,000 $ Less: Third party construction backlog (183,000) BFS in-service (580,000) JV projects under development (302,000) Committed Development 896,000 CIP as of 12/31/07 on committed development (372,00
Slide 34: Strategic Plan 2008-2010
Strategic Plan 2008-2010
Slide 35: Strategic Plan 2008 through 2010
35 Strategic Plan 2008 through 2010 Profitability manage our quality core portfolio to maximize same property growth and increase funds available for distribution Build teams and increase opportunities in the new markets we have entered Increase opportunity in Healthcare nationally Form joint ventur
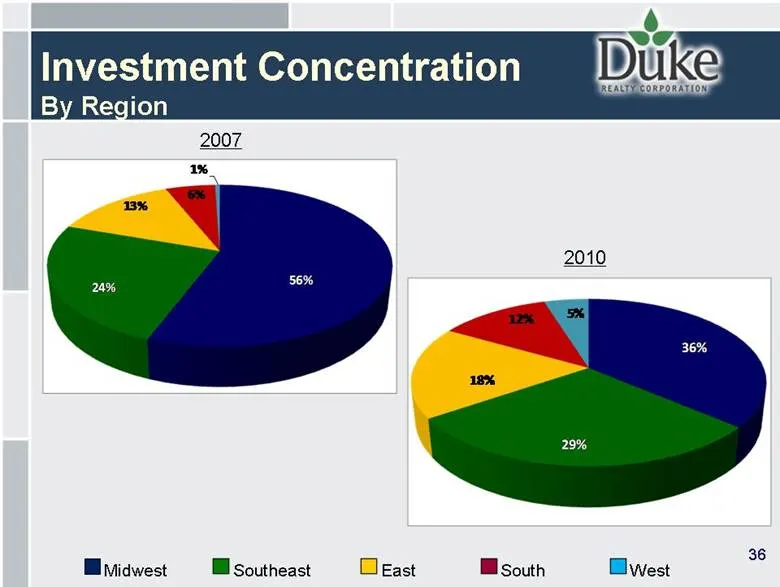
Slide 36: Investment Concentration By Region
36 Investment Concentration By Region 36% 29% 18% 12% 5% 2010 2007 56% 24% 13% 6% 1% Southeast East Midwest South West
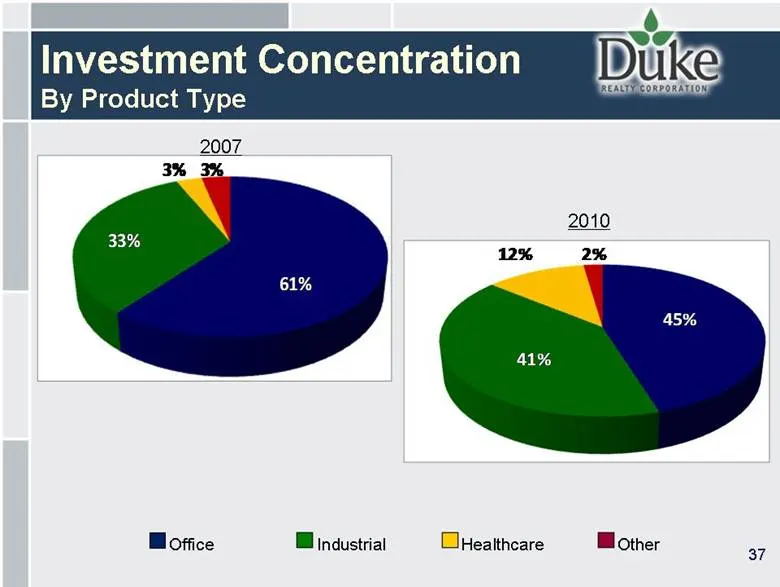
Slide 37: Investment Concentration By Product Type
37 Investment Concentration By Product Type 61% 33% 3% 3% 2007 45% 41% 12% 2% 2010 Industrial Healthcare Office Other
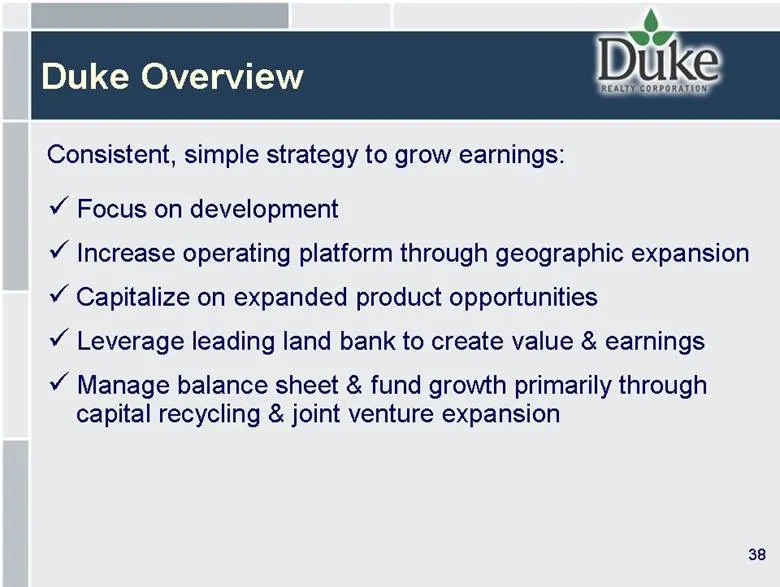
Slide 38: Duke Overview
38 Duke Overview Consistent, simple strategy to grow earnings: Focus on development Increase operating platform through geographic expansion Capitalize on expanded product opportunities Leverage leading land bank to create value & earnings Manage balance sheet & fund growth primarily through capital
Source: SEC EDGAR · 8-K filed Mar 3, 2008
More decks from Duke Realty Corporation
 Merger or Acquisition (June 2022)14 slides · Jun 13, 2022
 Investor Presentation (June 2021)58 slides · Jun 7, 2021
 Investor Presentation (May 2021)44 slides · May 10, 2021
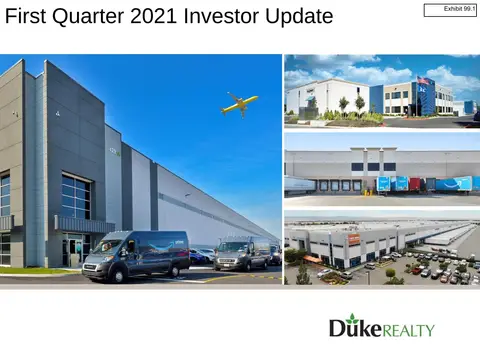 Investor Presentation (February 2021)58 slides · Feb 22, 2021
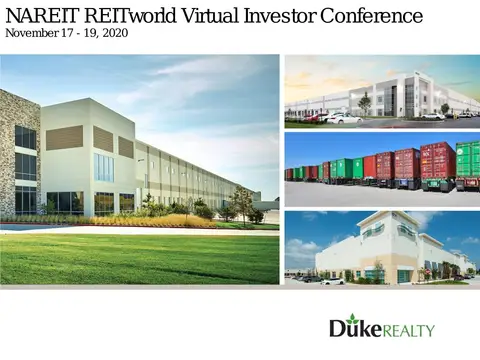 NAREIT REITworld Virtual Investor Conference 202056 slides · Nov 16, 2020
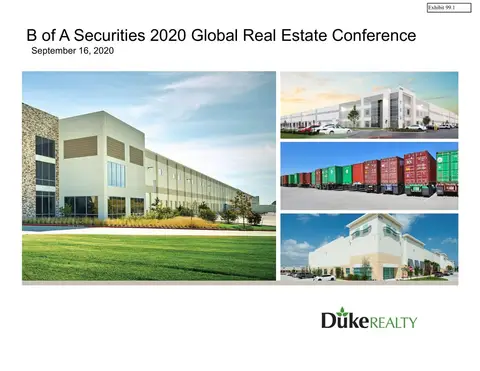 B of A Securities 2020 Global Real Estate Conference56 slides · Sep 15, 2020