Abbott Laboratories · NYSE:ABT
Abbott Laboratories — Q3 2020 Earnings Presentation
19 slides from Abbott Laboratories's earnings presentation, Dec 22, 2020
Slide 1: Corporate Briefing Session - 2020
Corporate Briefing Session - 2020 22nd December, 2020
Slide 2: Table of Contents
Abbott Pakistan - Analyst Briefing – Q3 2020 Table of Contents • Company Overview • Economic Overview • Financial Results for 2019 • Financial Results for Q3 2020 • Q&A pk.abbott.com
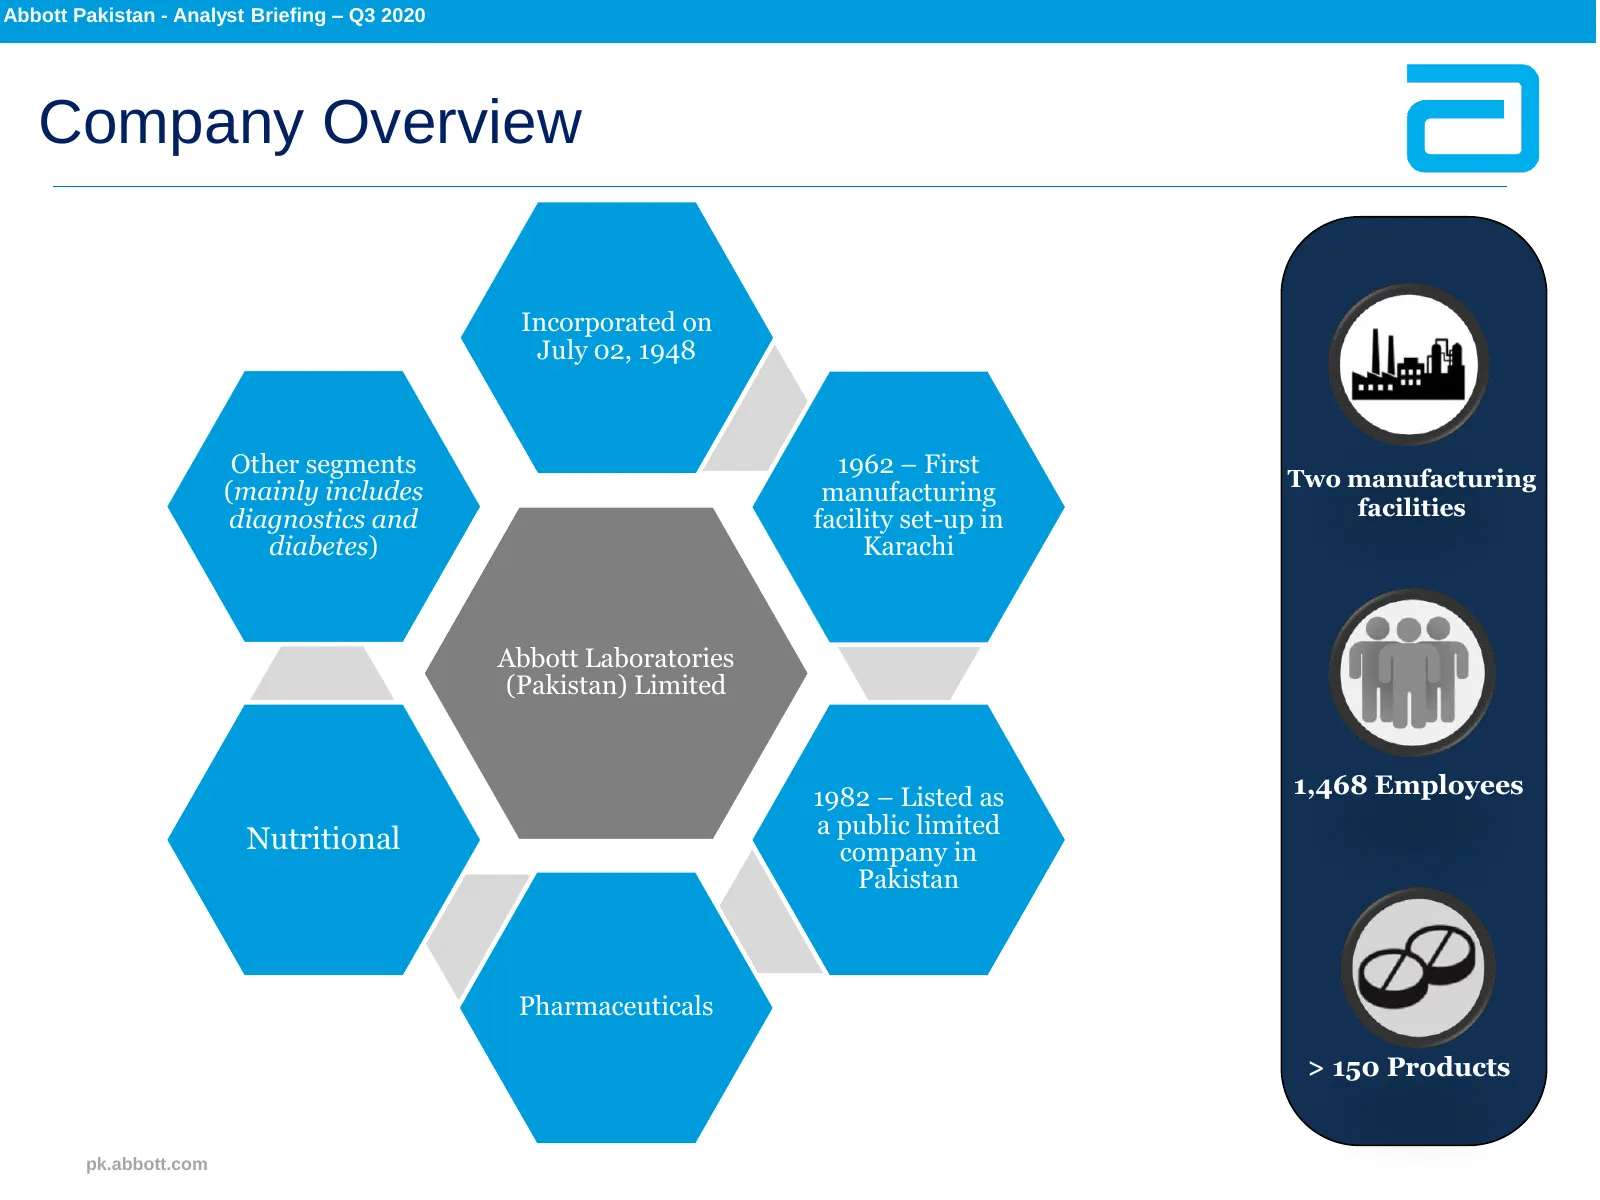
Slide 3: Company Overview
Abbott Pakistan - Analyst Briefing – Q3 2020 Company Overview Incorporated on July 02, 1948 Other segments 1962 – First Two manufacturing (mainly includes manufacturing diagnostics and facility set-up in facilities diabetes) Karachi Abbott Laboratories (Pakistan) Limited 1982 – Listed as 1,468 Emplo
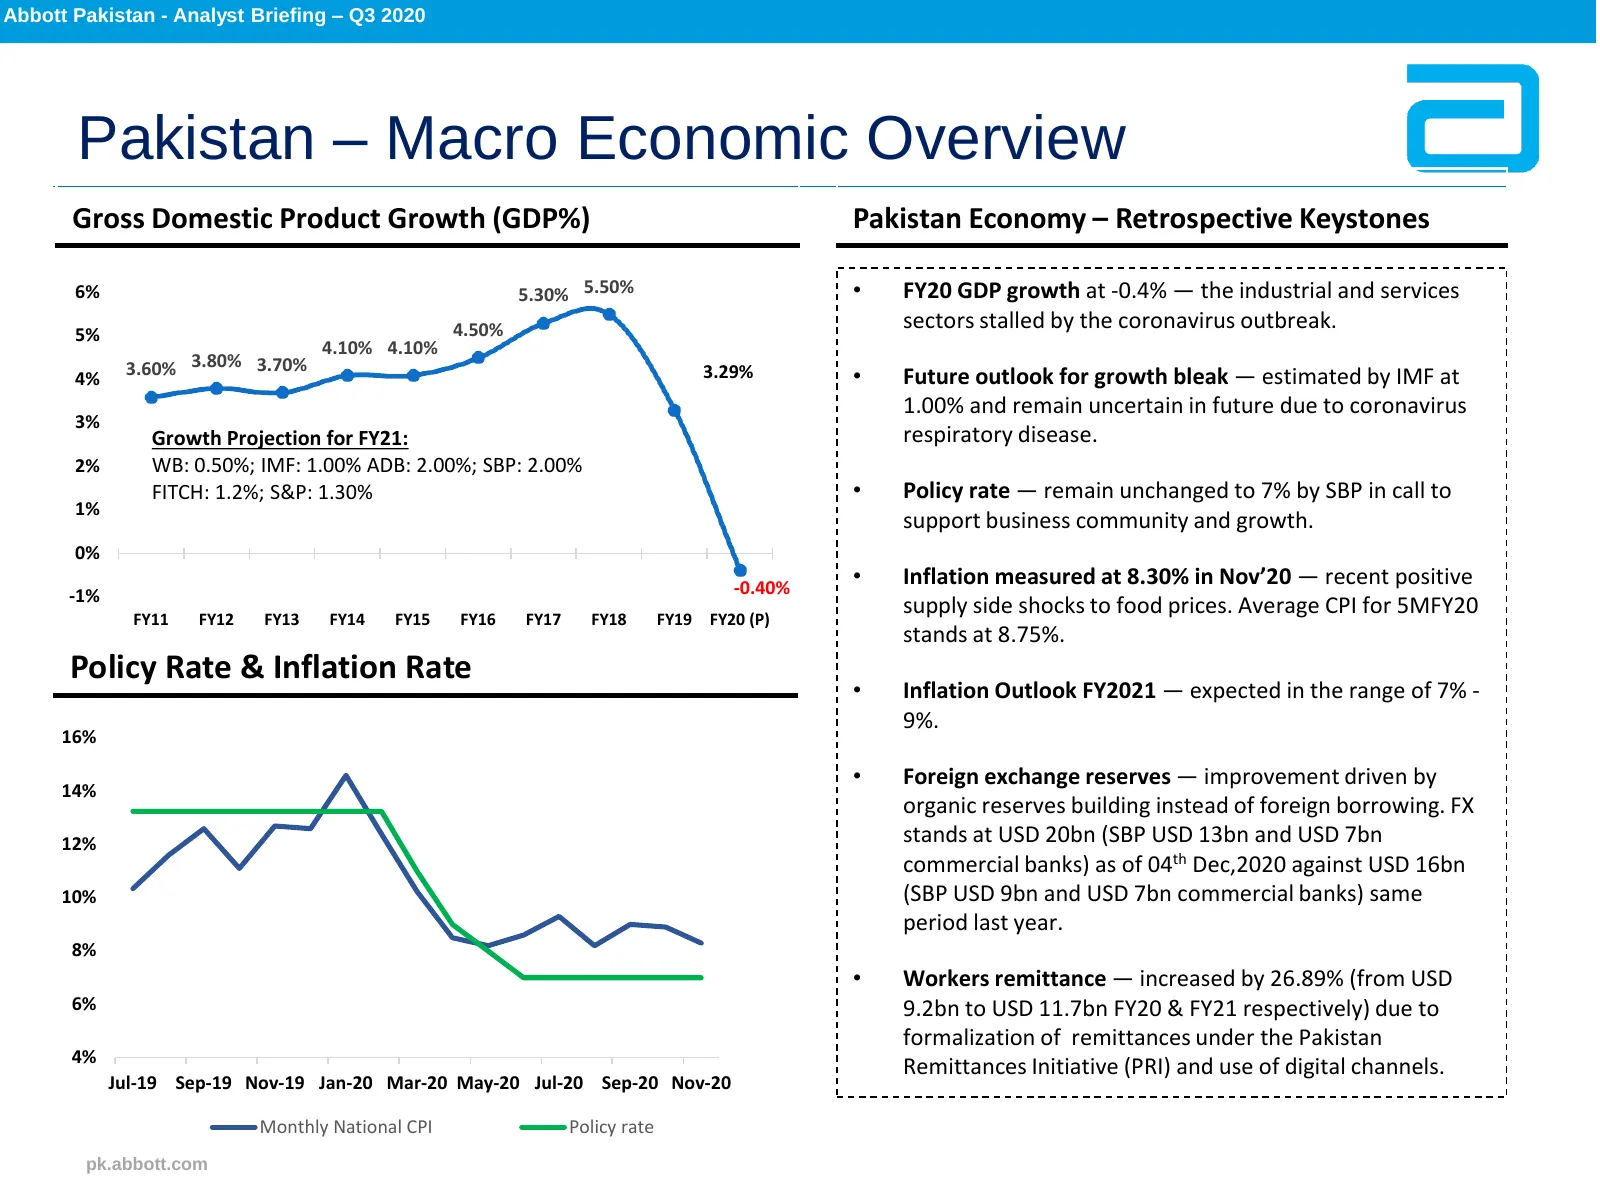
Slide 4: Pakistan – Macro Economic Overview
Abbott Pakistan - Analyst Briefing – Q3 2020 Pakistan – Macro Economic Overview Gross Domestic Product Growth (GDP%) Pakistan Economy – Retrospective Keystones 6% 5.30% 5.50% • FY20 GDP growth at -0.4% — the industrial and services 4.50% sectors stalled by the coronavirus outbreak. 5% 4.10% 4.10% 4%
Slide 5: Inflow & Outflow
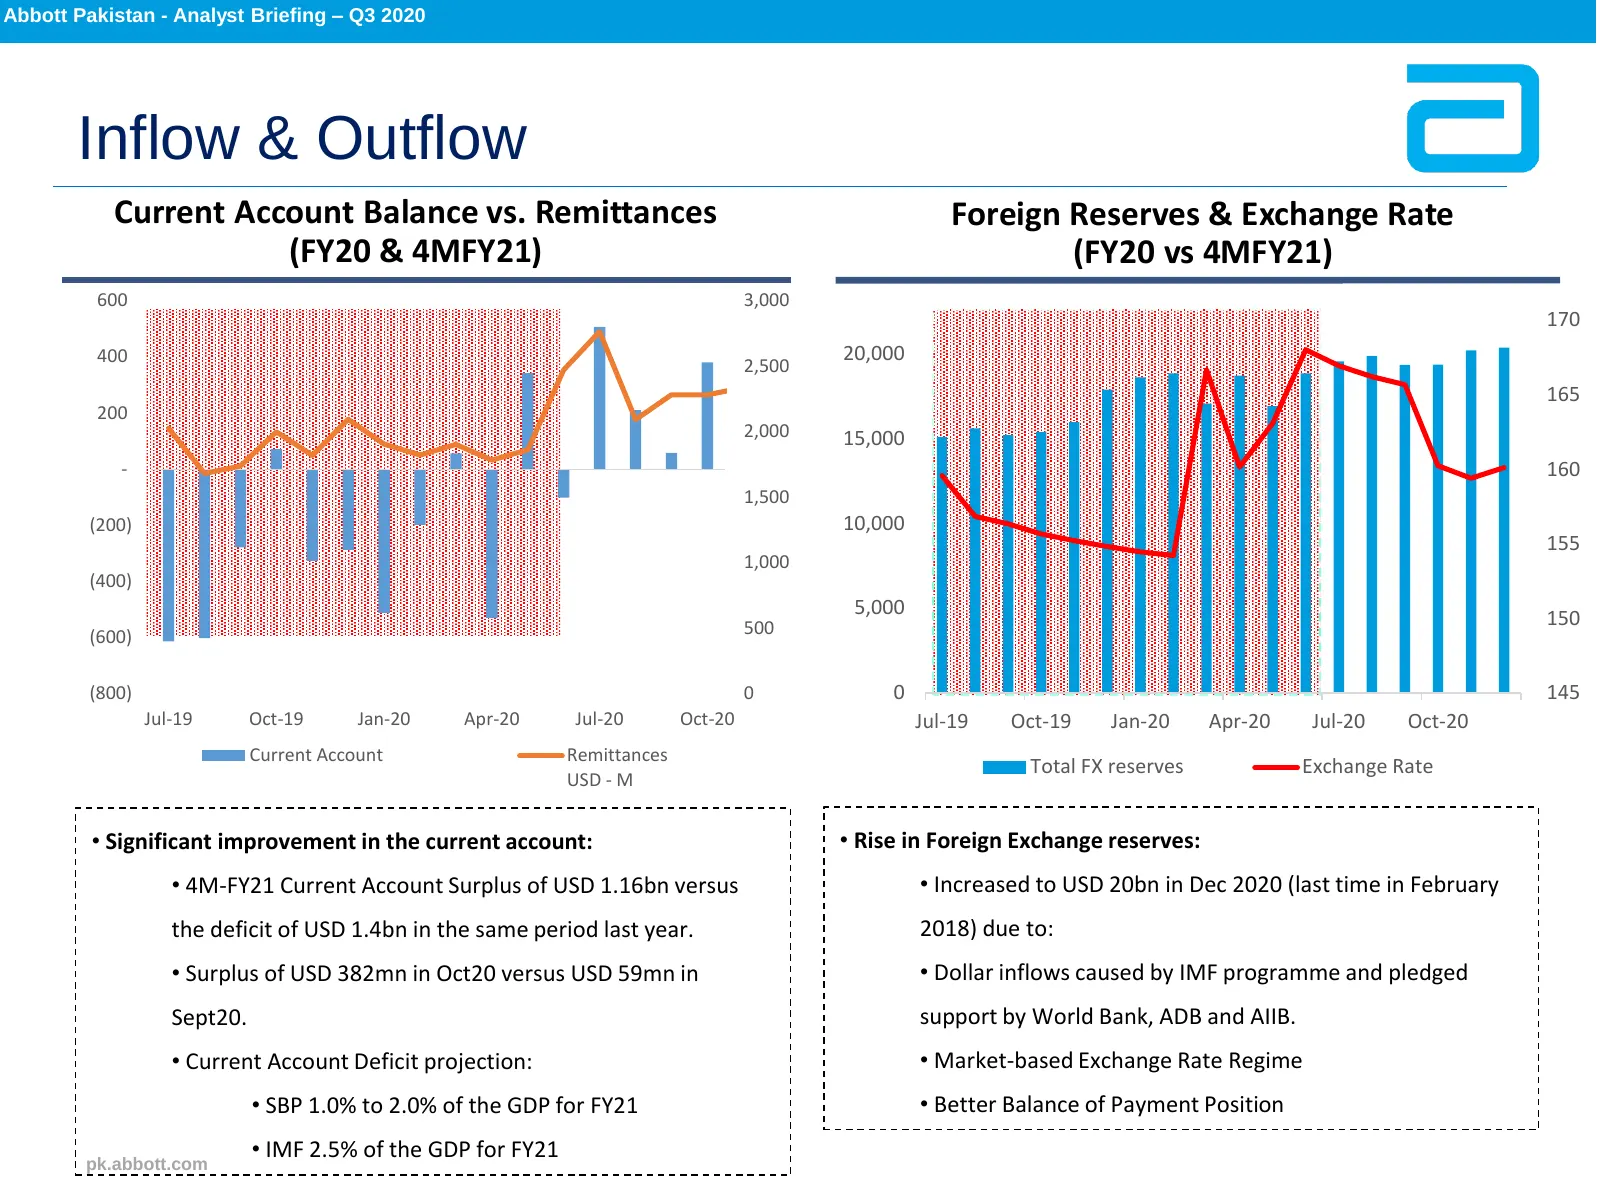
Abbott Pakistan - Analyst Briefing – Q3 2020 Inflow & Outflow Current Account Balance vs. Remittances Foreign Reserves & Exchange Rate (FY20 & 4MFY21) (FY20 vs 4MFY21) 600 3,000 170 400 20,000 2,500 165 200 2,000 15,000 - 160 1,500 (200) 10,000 155 1,000 (400) 5,000 150 (600) 500 (800) 0 0 145 Jul-1
Slide 6: Foreign Exchange Parity
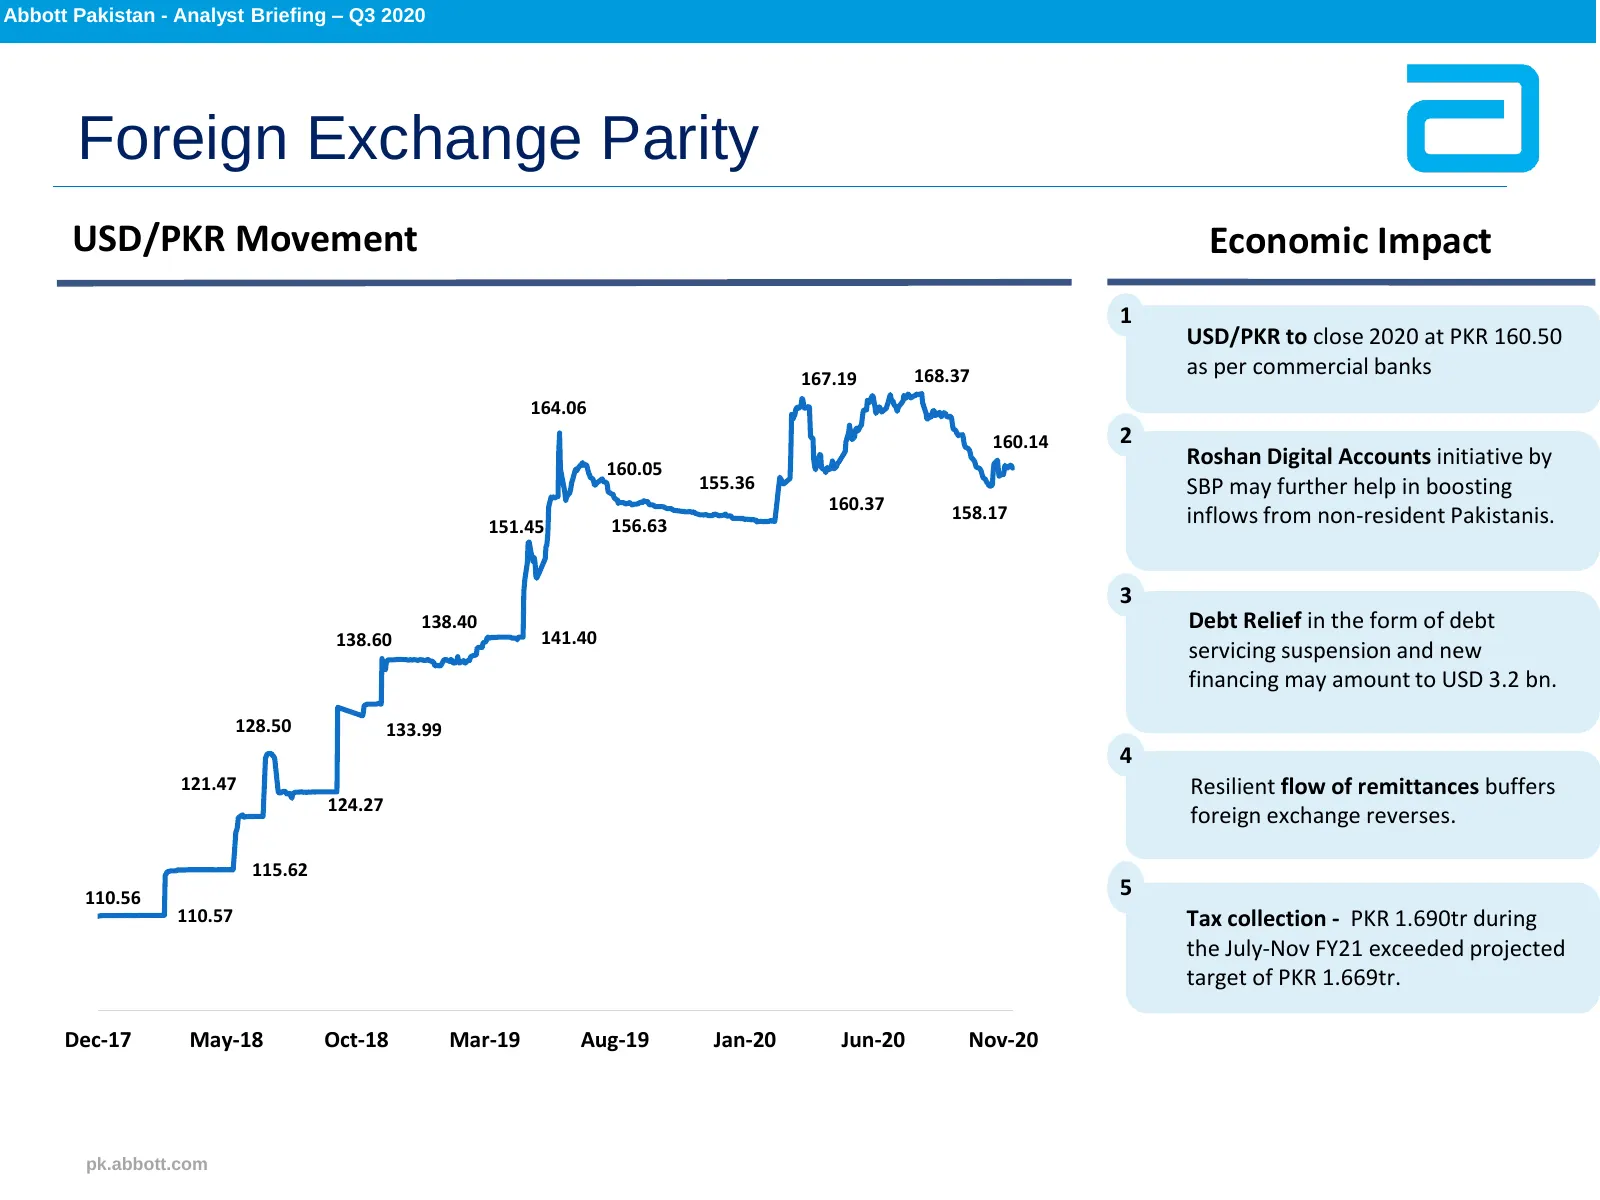
Abbott Pakistan - Analyst Briefing – Q3 2020 Foreign Exchange Parity USD/PKR Movement Economic Impact 1 USD/PKR to close 2020 at PKR 160.50 167.19 168.37 as per commercial banks 164.06 160.14 2 160.05 Roshan Digital Accounts initiative by 155.36 SBP may further help in boosting 160.37 158.17 151.45

Slide 7: Financial Results - 2019
Financial Results - 2019
Slide 8: Key Highlights – FY2019
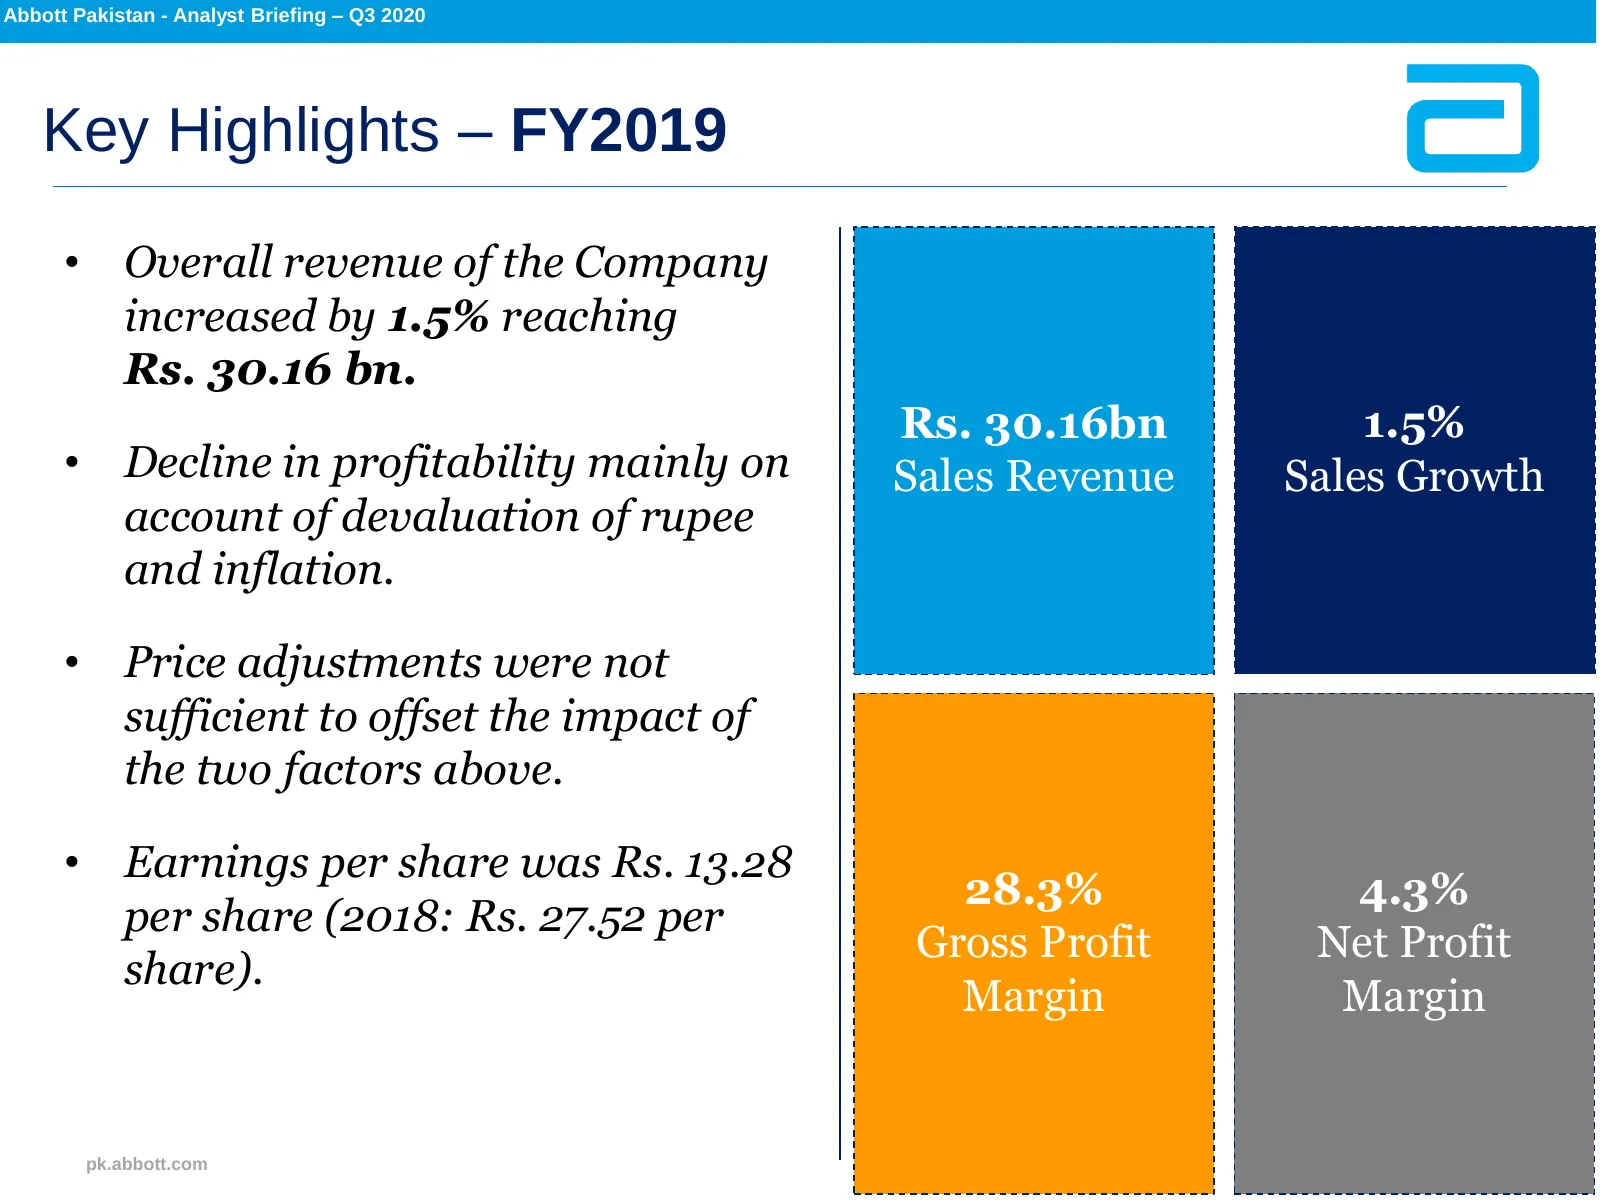
Abbott Pakistan - Analyst Briefing – Q3 2020 Key Highlights – FY2019 • Overall revenue of the Company increased by 1.5% reaching Rs. 30.16 bn. Rs. 30.16bn 1.5% • Decline in profitability mainly on Sales Revenue Sales Growth account of devaluation of rupee and inflation. • Price adjustments were not
Slide 9: Revenue Analysis – FY19
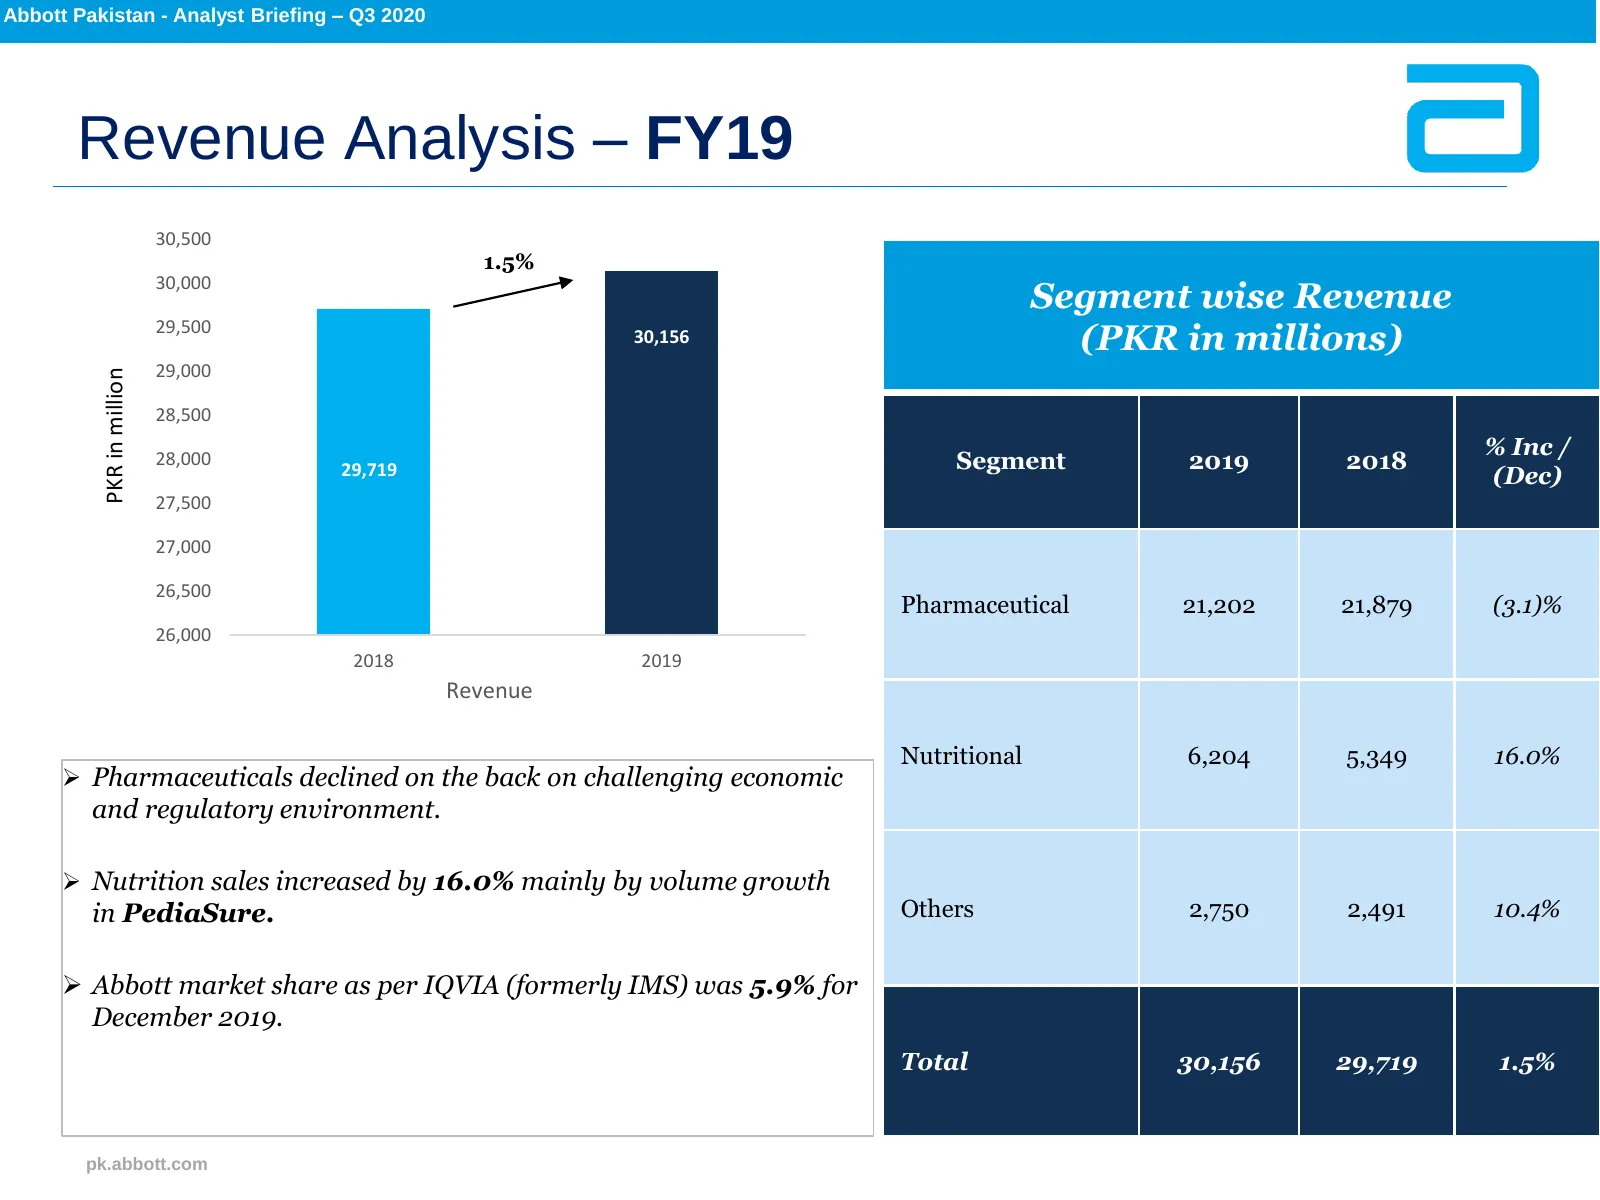
Abbott Pakistan - Analyst Briefing – Q3 2020 Revenue Analysis – FY19 30,500 1.5% 30,000 Segment wise Revenue 29,500 30,156 (PKR in millions) 29,000 PKR in million 28,500 % Inc / 28,000 29,719 Segment 2019 2018 (Dec) 27,500 27,000 26,500 Pharmaceutical 21,202 21,879 (3.1)% 26,000 2018 2019 Revenue Nu
Slide 10: Segment Gross Profit analysis – FY19
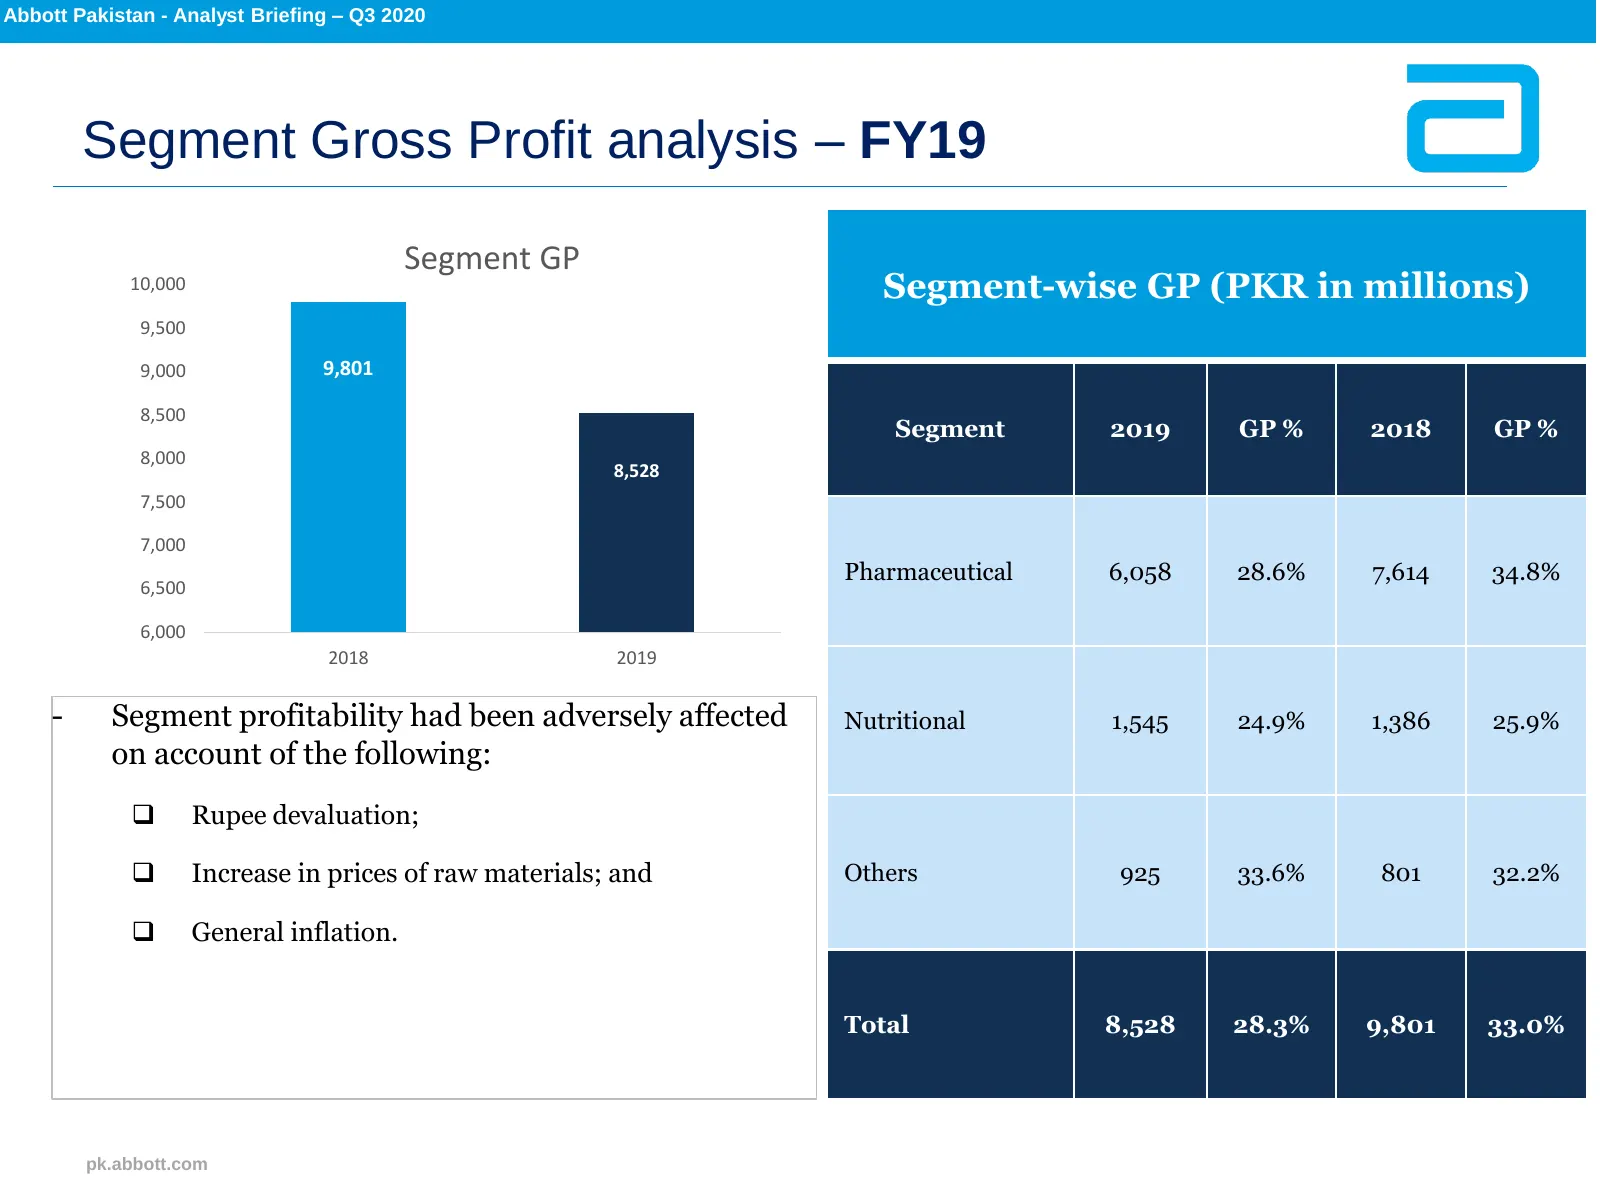
Abbott Pakistan - Analyst Briefing – Q3 2020 Segment Gross Profit analysis – FY19 Segment GP 10,000 Segment-wise GP (PKR in millions) 9,500 9,000 9,801 8,500 Segment 2019 GP % 2018 GP % 8,000 8,528 7,500 7,000 Pharmaceutical 6,058 28.6% 7,614 34.8% 6,500 6,000 2018 2019 - Segment profitability had b
Slide 11: Financial Results – Q3 2020
Financial Results – Q3 2020
Slide 12: Key Highlights – Q3 2020
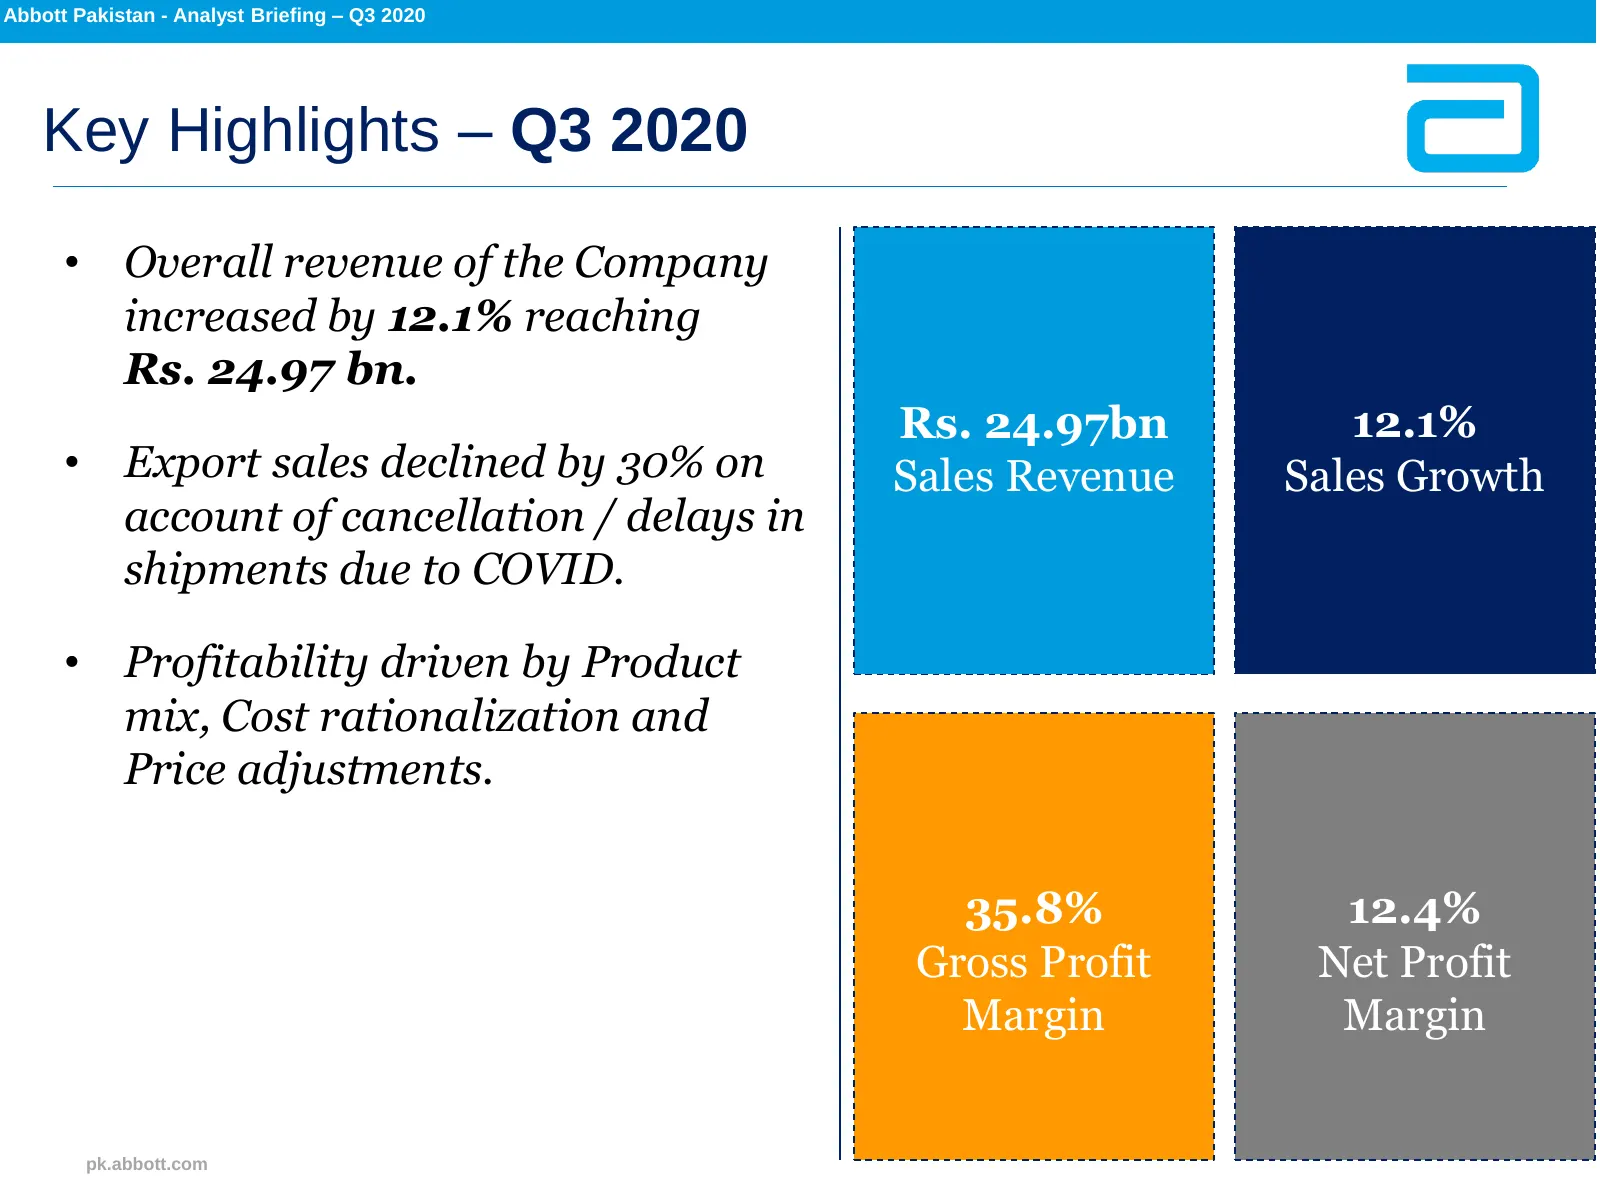
Abbott Pakistan - Analyst Briefing – Q3 2020 Key Highlights – Q3 2020 • Overall revenue of the Company increased by 12.1% reaching Rs. 24.97 bn. Rs. 24.97bn 12.1% • Export sales declined by 30% on Sales Revenue Sales Growth account of cancellation / delays in shipments due to COVID. • Profitability
Slide 13: Revenue Analysis – Q3 2020
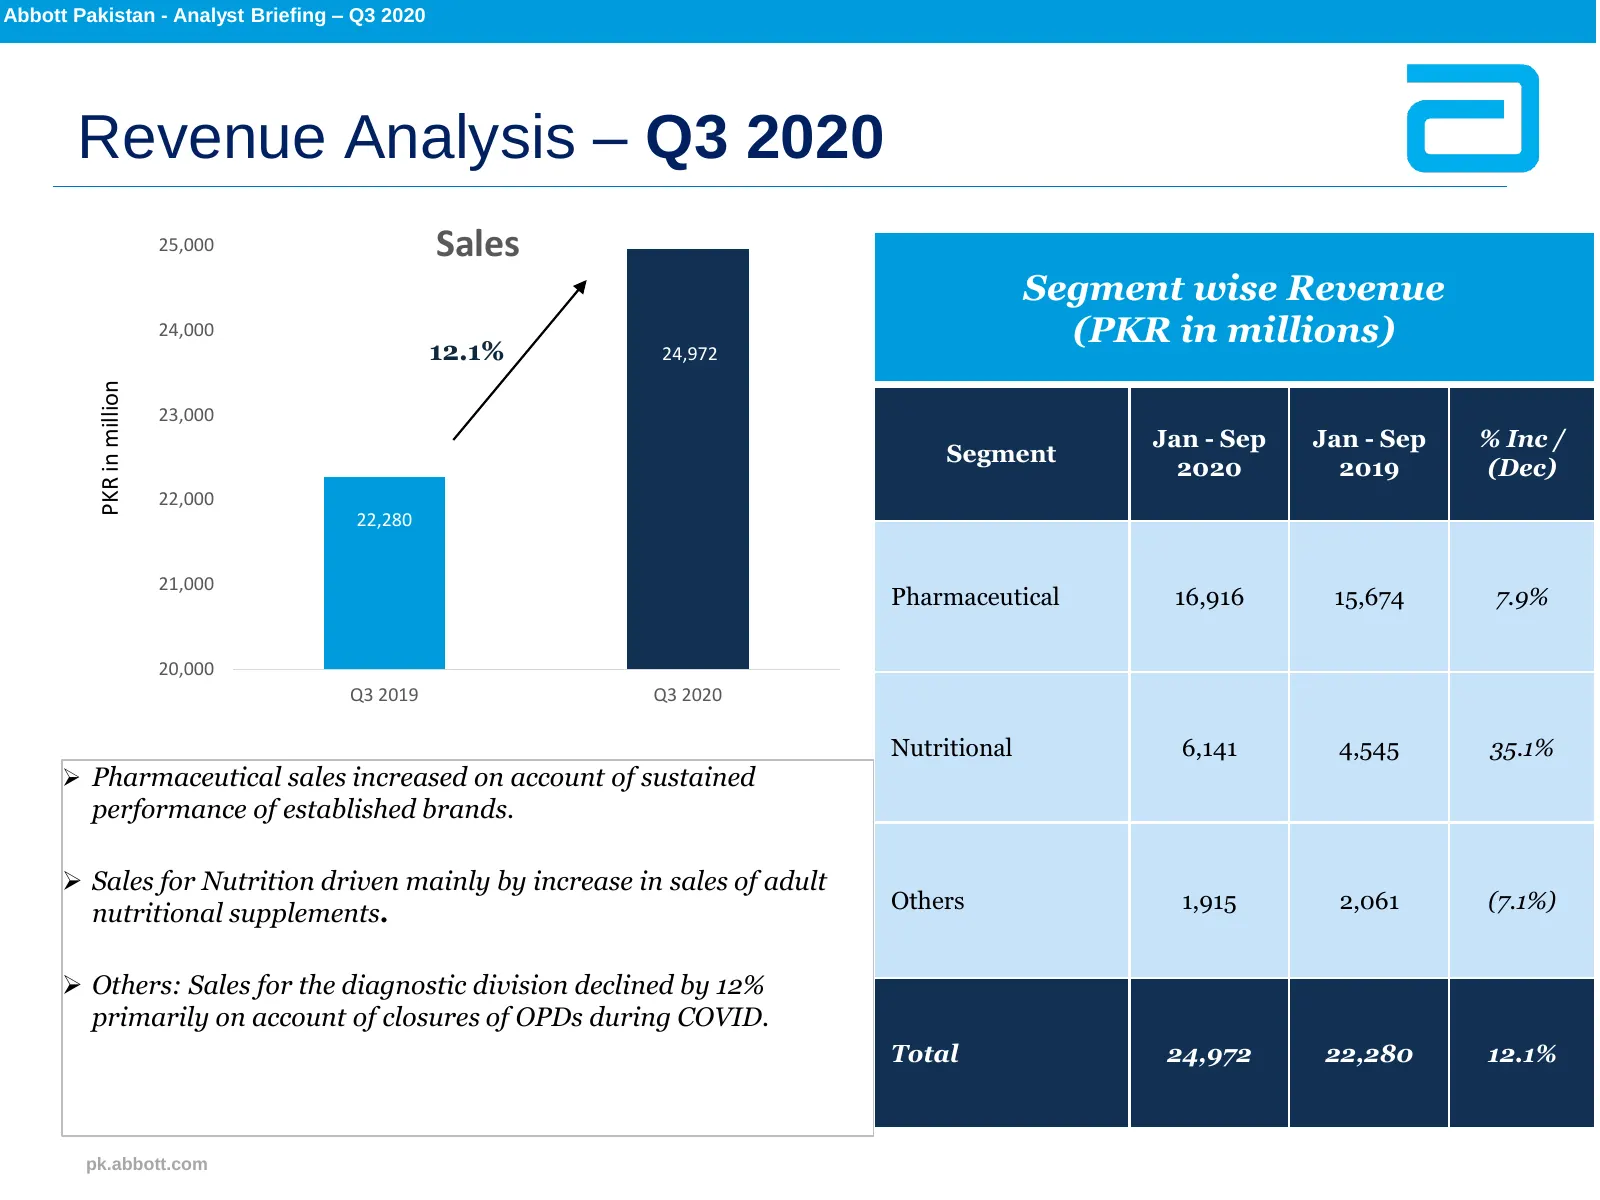
Abbott Pakistan - Analyst Briefing – Q3 2020 Revenue Analysis – Q3 2020 25,000 Sales Segment wise Revenue 24,000 12.1% 24,972 (PKR in millions) PKR in million 23,000 Jan - Sep Jan - Sep % Inc / Segment 2020 2019 (Dec) 22,000 22,280 21,000 Pharmaceutical 16,916 15,674 7.9% 20,000 Q3 2019 Q3 2020 Nutr
Slide 14: Segment Gross Profit analysis – Q3 2020
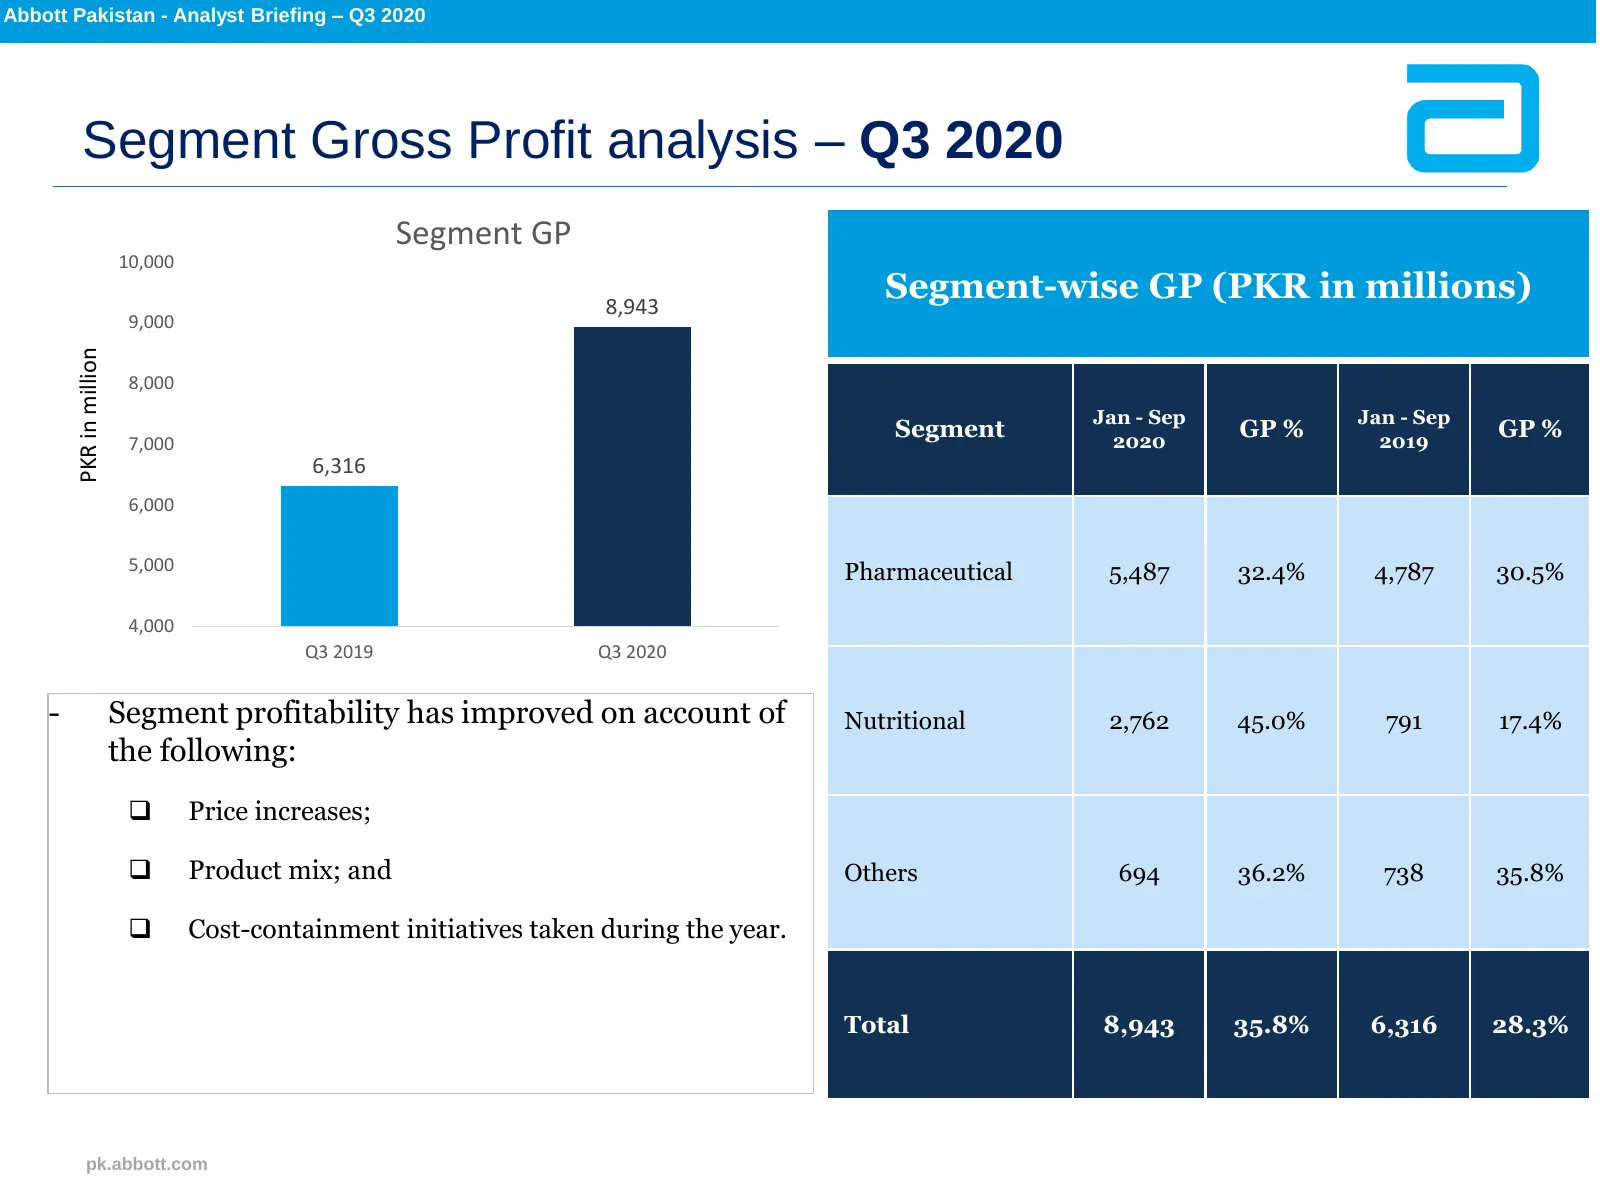
Abbott Pakistan - Analyst Briefing – Q3 2020 Segment Gross Profit analysis – Q3 2020 Segment GP 10,000 8,943 Segment-wise GP (PKR in millions) 9,000 PKR in million 8,000 Jan - Sep Jan - Sep Segment 2020 GP % 2019 GP % 7,000 6,316 6,000 5,000 Pharmaceutical 5,487 32.4% 4,787 30.5% 4,000 Q3 2019 Q3 20
Slide 15: Statement of Profit or Loss – Q3 2020
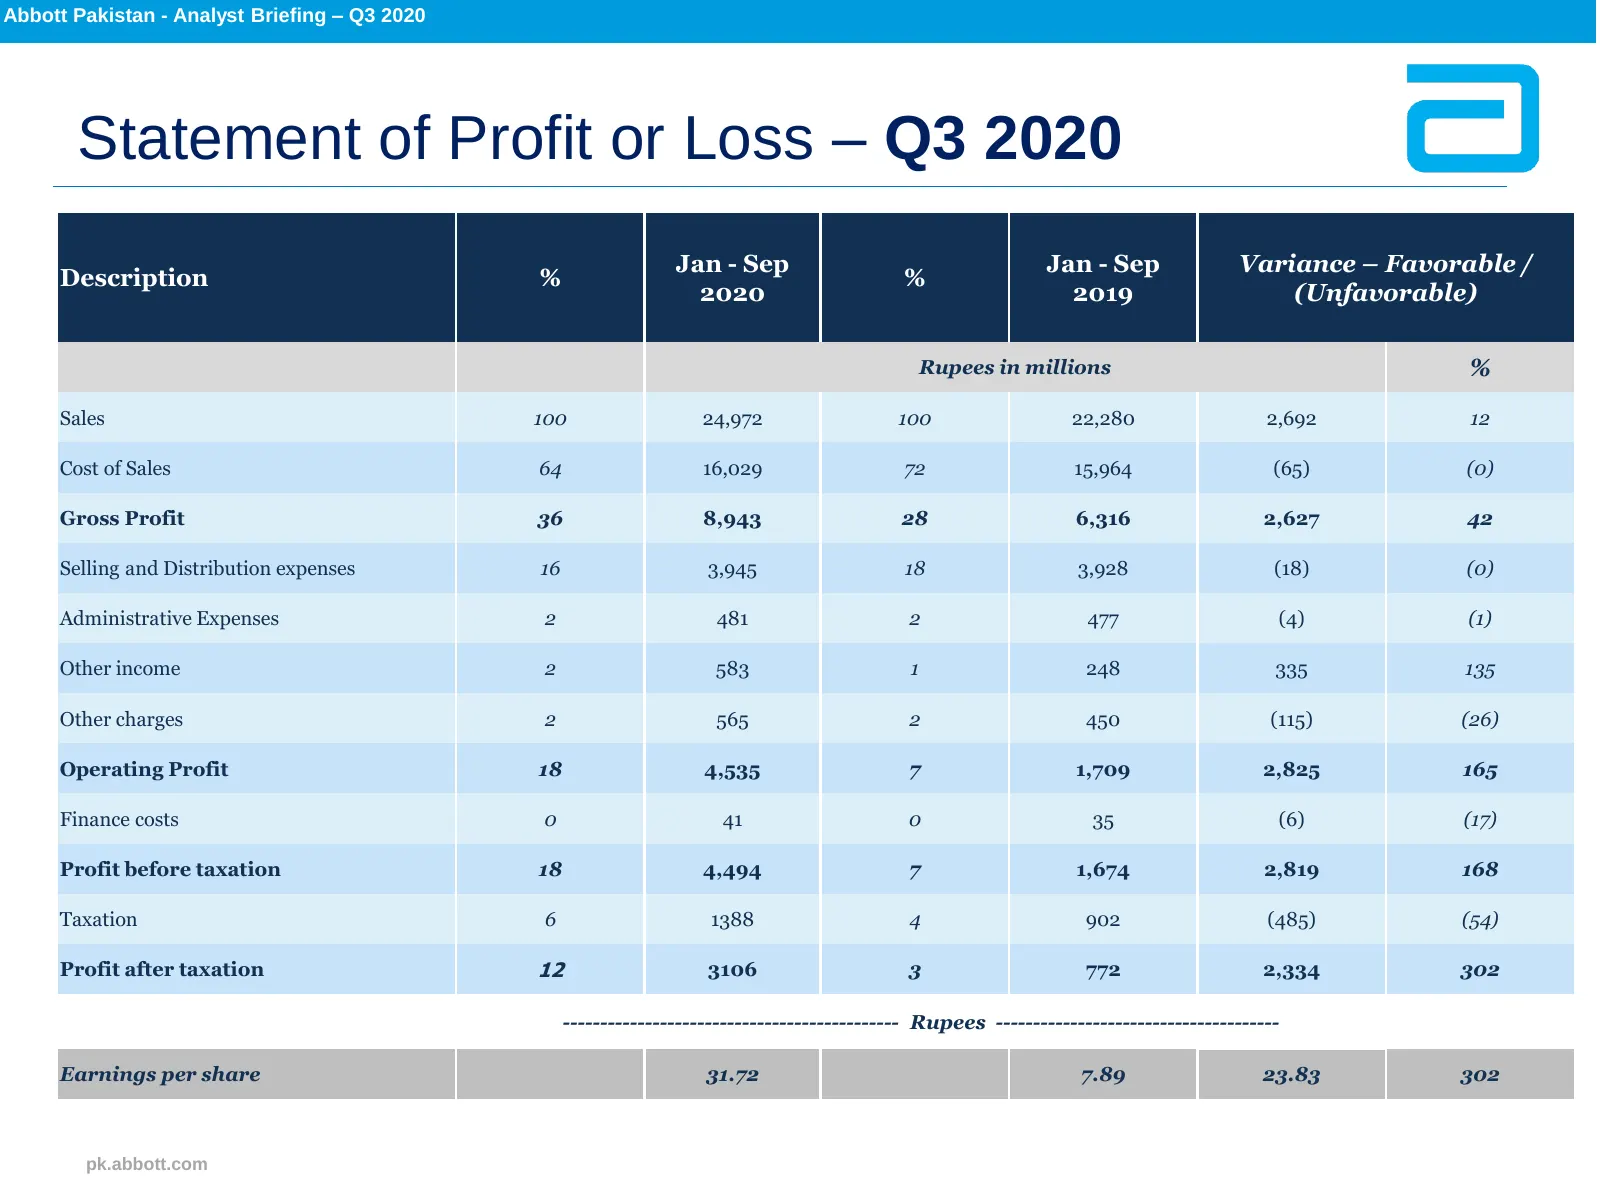
Abbott Pakistan - Analyst Briefing – Q3 2020 Statement of Profit or Loss – Q3 2020 Jan - Sep Jan - Sep Variance – Favorable / Description % % 2020 2019 (Unfavorable) Rupees in millions % Sales 100 24,972 100 22,280 2,692 12 Cost of Sales 64 16,029 72 15,964 (65) (0) Gross Profit 36 8,943 28 6,316 2,
Slide 16: Key Financial Ratios
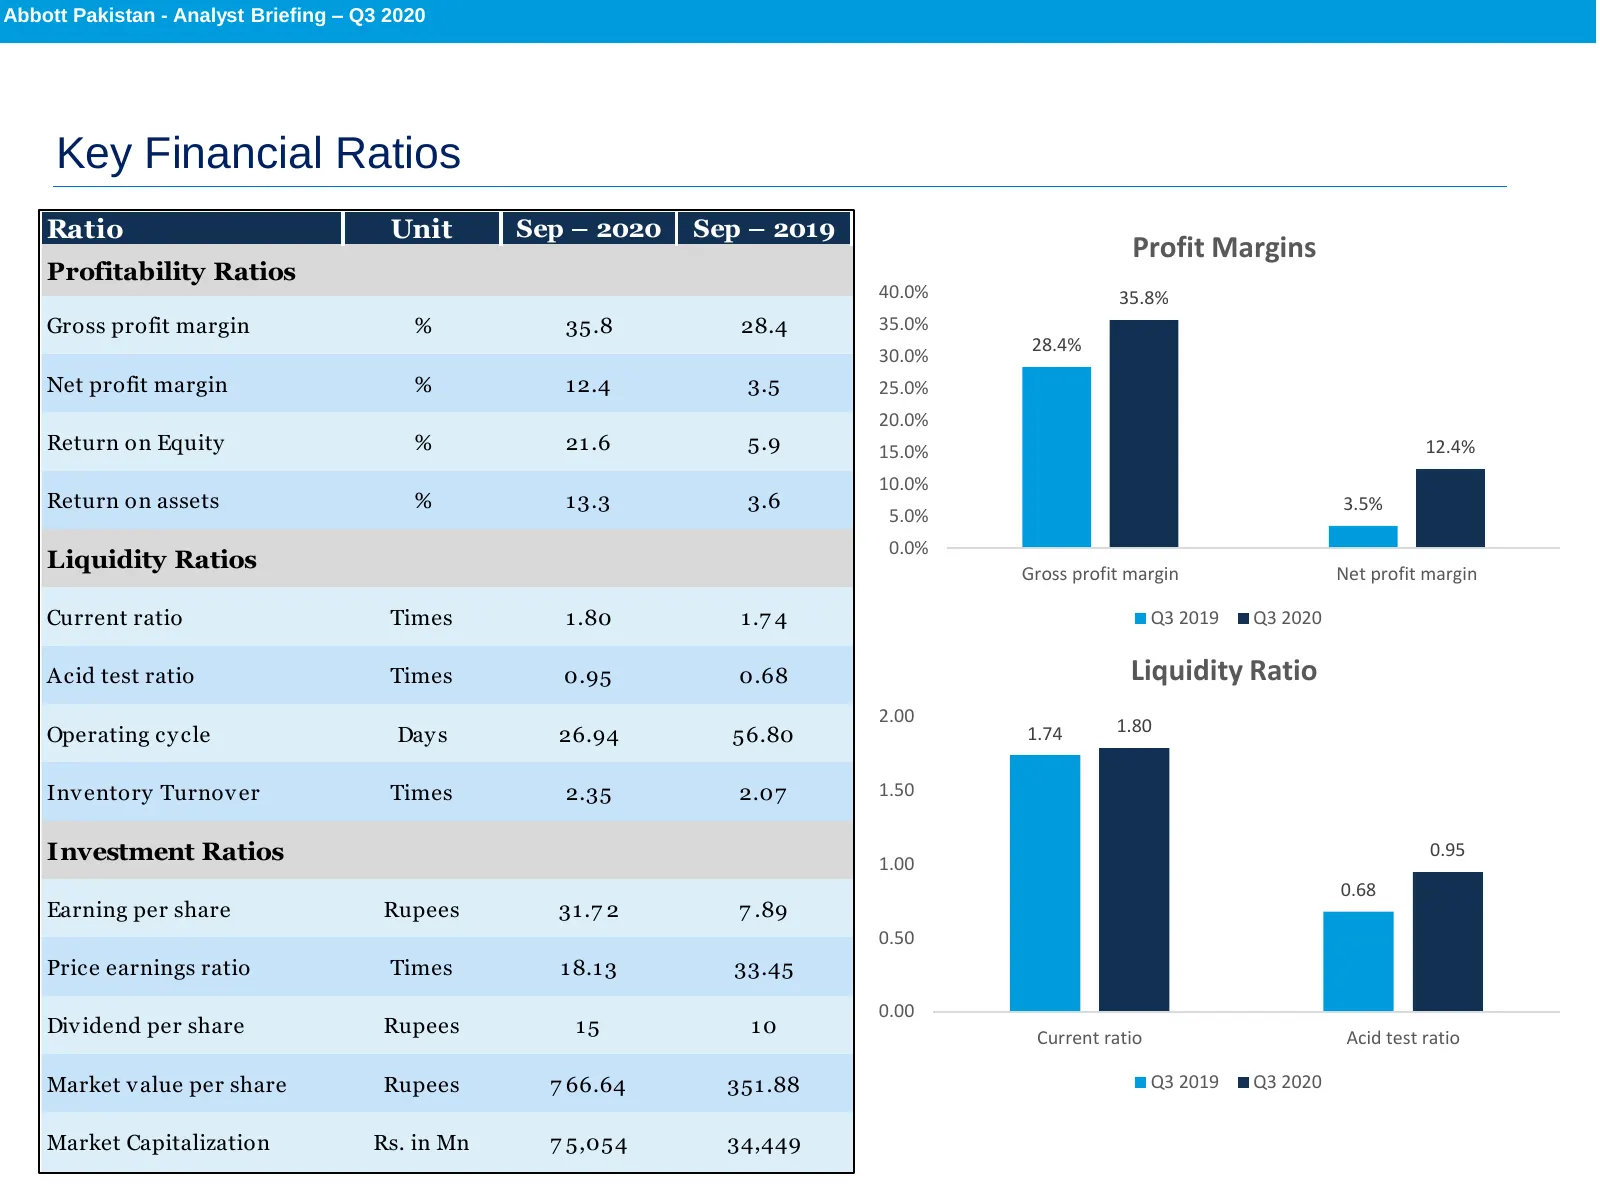
Abbott Pakistan - Analyst Briefing – Q3 2020 Key Financial Ratios Ratio Unit Sep – 2020 Sep – 2019 Profit Margins Profitability Ratios 40.0% 35.8% Gross profit margin % 35.8 28.4 35.0% 28.4% 30.0% Net profit margin % 1 2.4 3.5 25.0% 20.0% Return on Equity % 21 .6 5.9 15.0% 12.4% 10.0% Return on asse
Slide 17: Statement of Financial Position – Sep 30, 2020
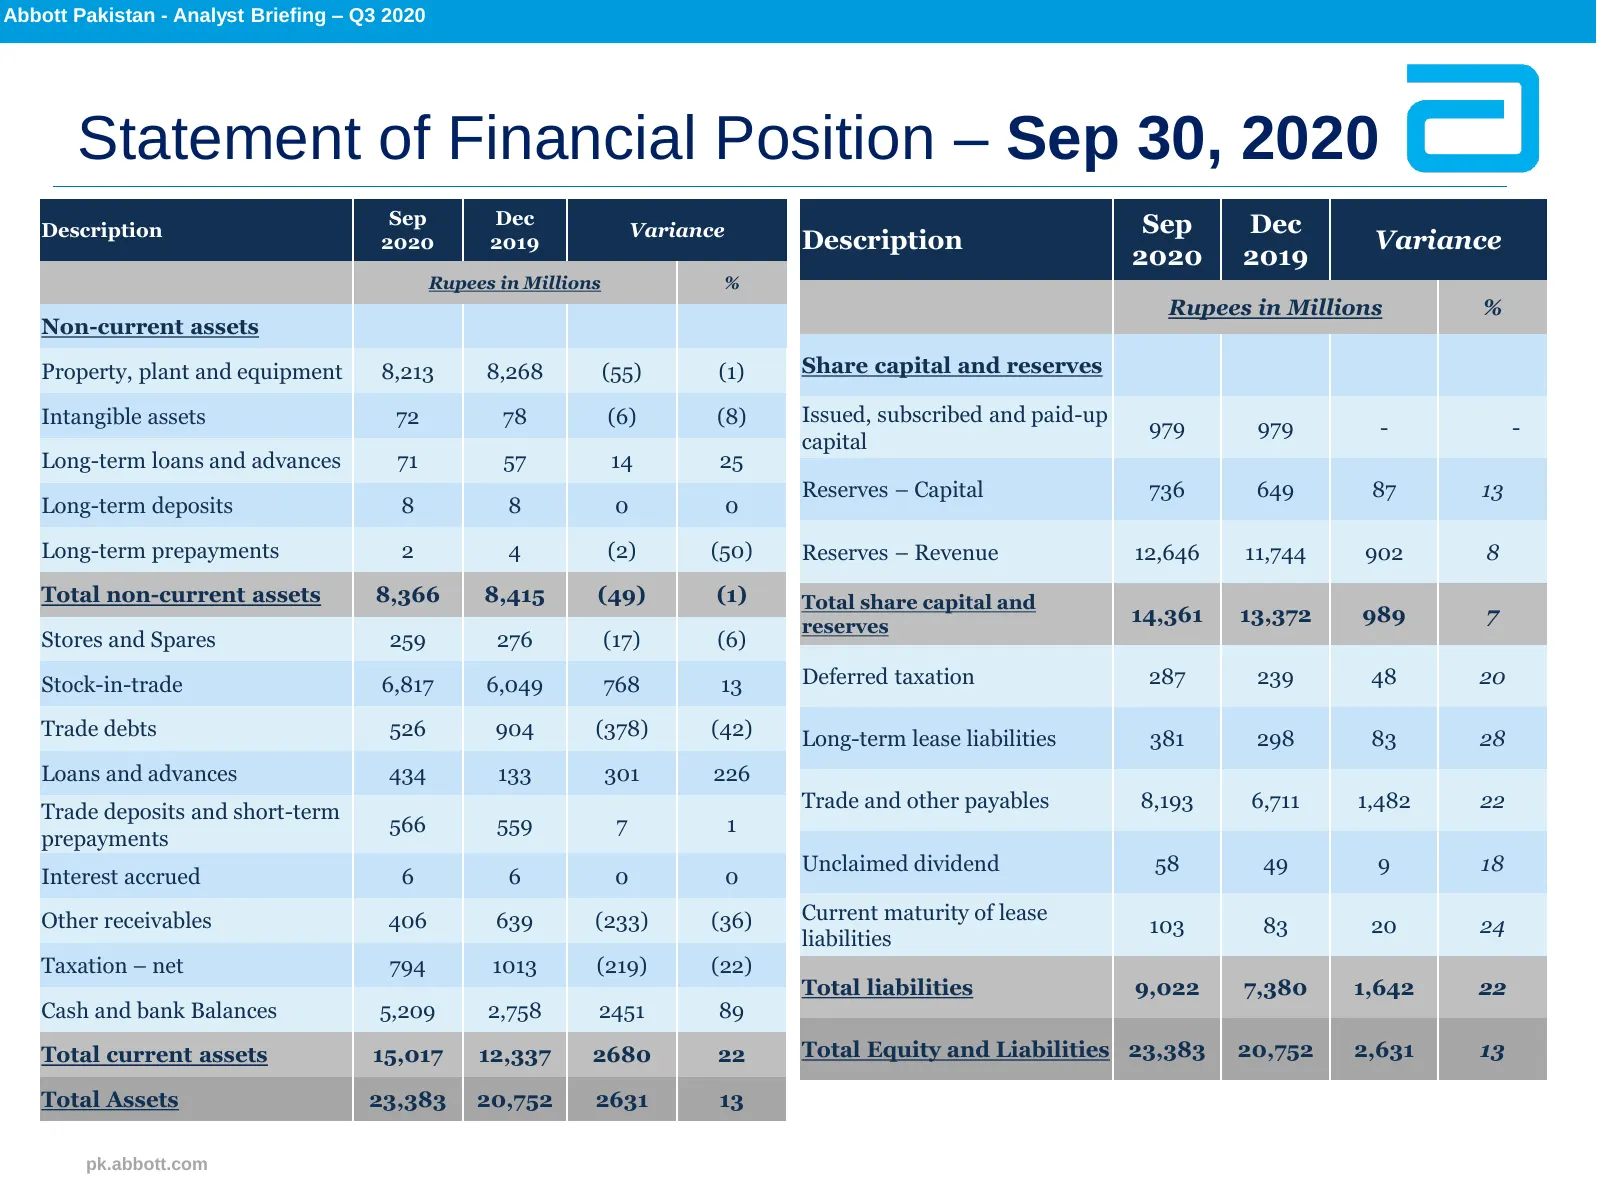
Abbott Pakistan - Analyst Briefing – Q3 2020 Statement of Financial Position – Sep 30, 2020 Sep Dec Sep Dec Description Variance 2020 2019 Description Variance 2020 2019 Rupees in Millions % Rupees in Millions % Non-current assets Property, plant and equipment 8,213 8,268 (55) (1) Share capital and

Slide 18: Q&A
Q&A

Slide 19: Thank you
Thank you
Source: Internet Archive copy of dam.abbott.com
More decks from Abbott Laboratories
 Merger or Acquisition (November 2025)13 slides · Nov 20, 2025
 Technical Presentation (October 2025)16 slides · Oct 26, 2025
 Investor Presentation (October 2024)41 slides · October 2024
 Conference Presentation (October 2024)24 slides · October 2024
 Technical Presentation (November 2023)8 slides · November 2023
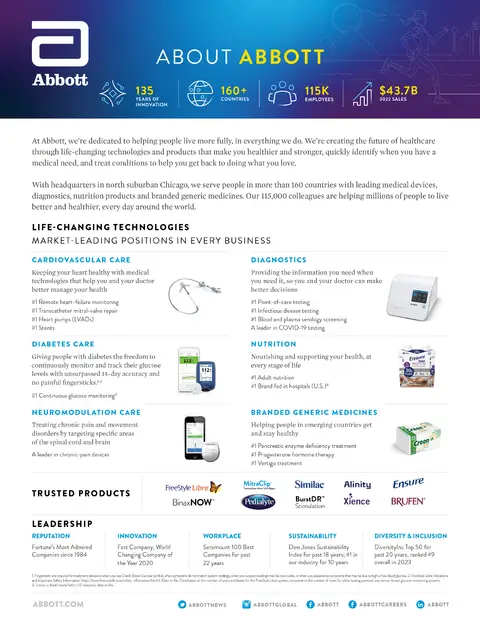 Fact Sheet (October 2023)1 slide · Oct 11, 2023