Rexel SA · EURONEXT:RXL
Rexel SA — Investor Day (May 2012)
107 slides from Rexel SA's investor day presentation, May 29, 2012
Slide 1: Rexel 2012 Investor Day
REXEL 2012 INVESTOR DAY Paris, May 29, 2012
Slide 2: Introduction
INTRODUCTION Rudy PROVOOST, Chairman of the Management Board and CEO
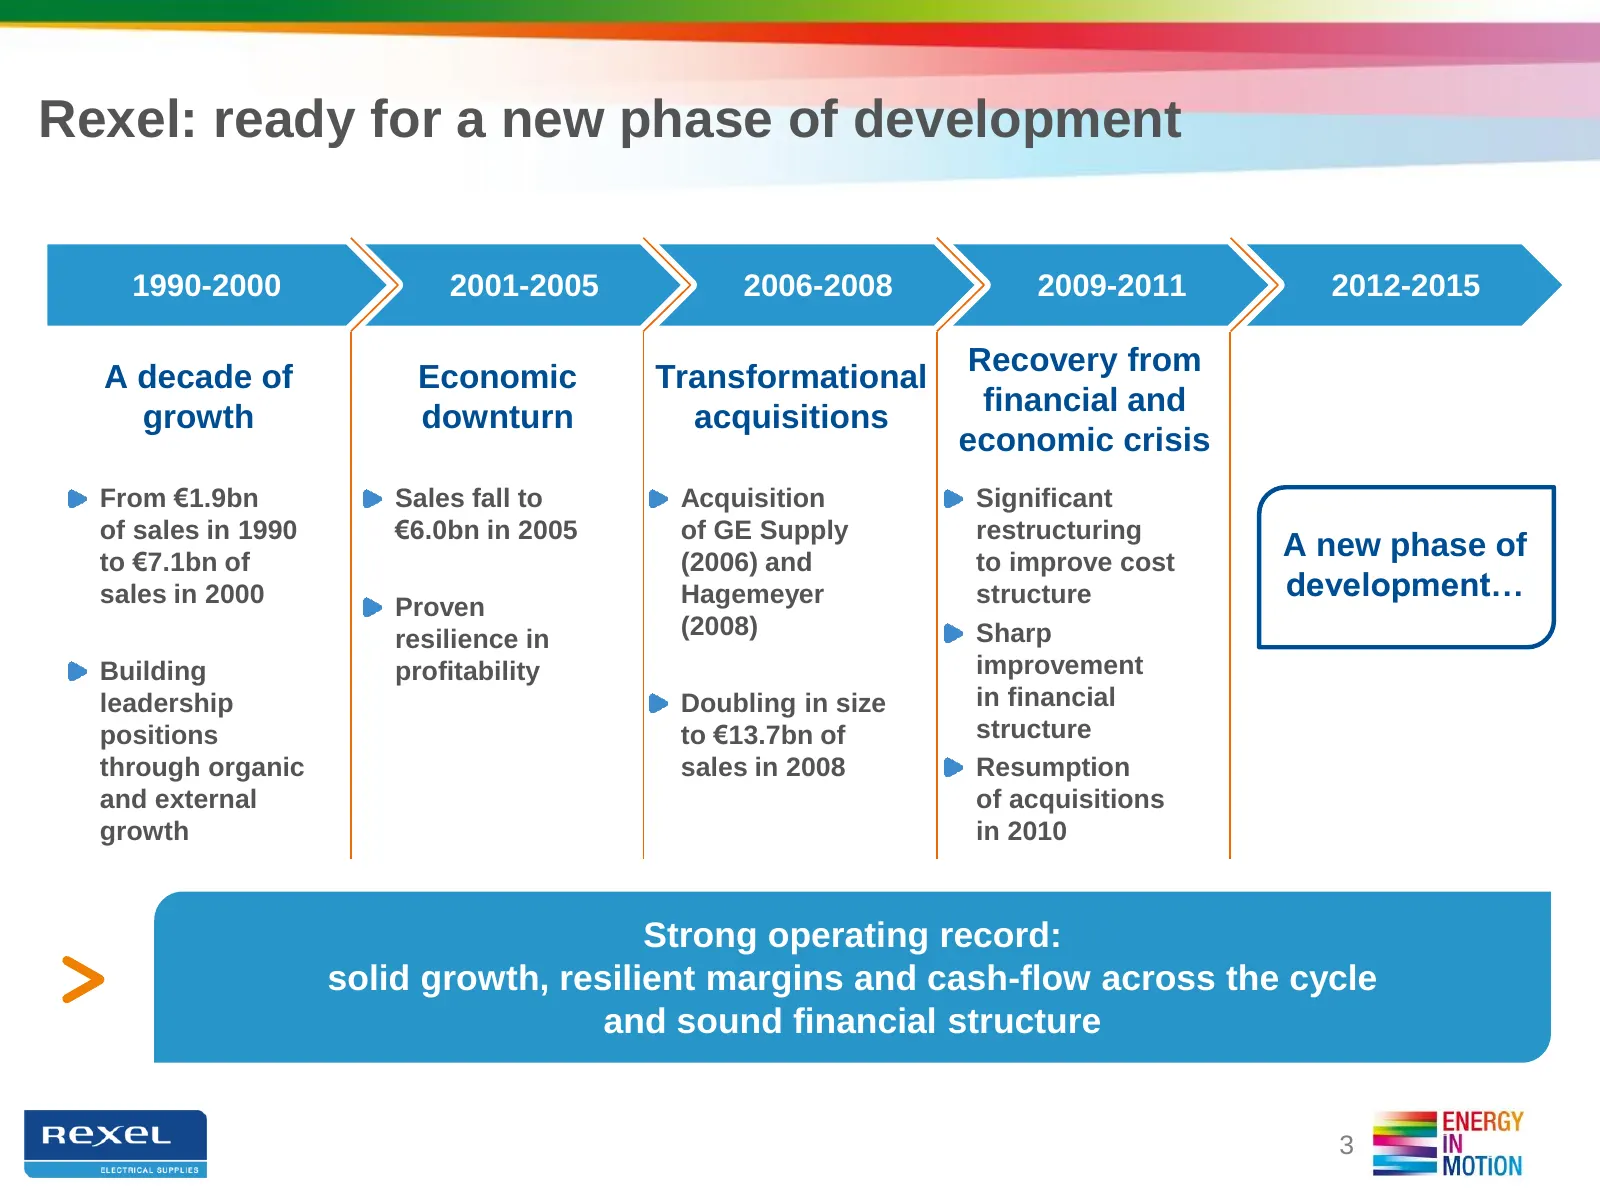
Slide 3: Rexel: ready for a new phase of development
Rexel: ready for a new phase of development 1990-2000 2001-2005 2006-2008 2009-2011 2012-2015 A decade of Economic Transformational Recovery from growth downturn acquisitions financial and economic crisis From €1.9bn Sales fall to Acquisition Significant of sales in 1990 €6.0bn in 2005 of GE Supply
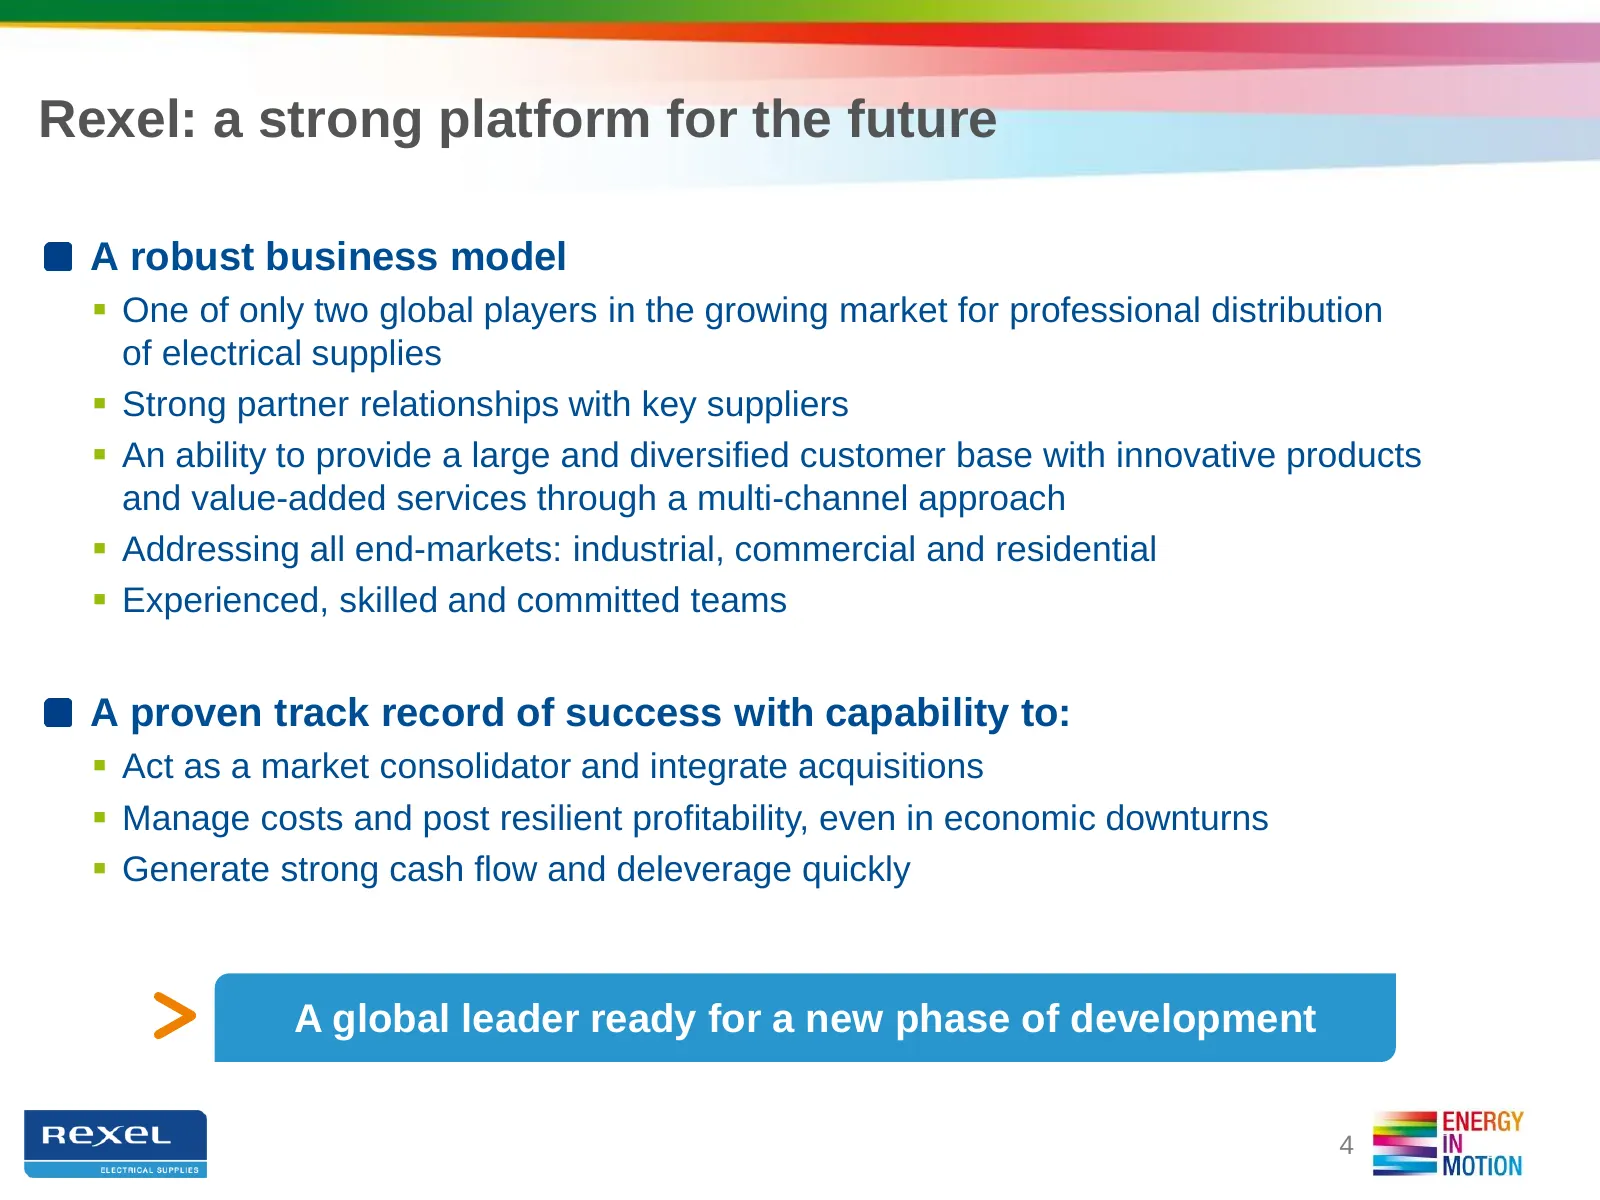
Slide 4: Rexel: a strong platform for the future
Rexel: a strong platform for the future A robust business model One of only two global players in the growing market for professional distribution of electrical supplies Strong partner relationships with key suppliers An ability to provide a large and diversified customer base with innovative
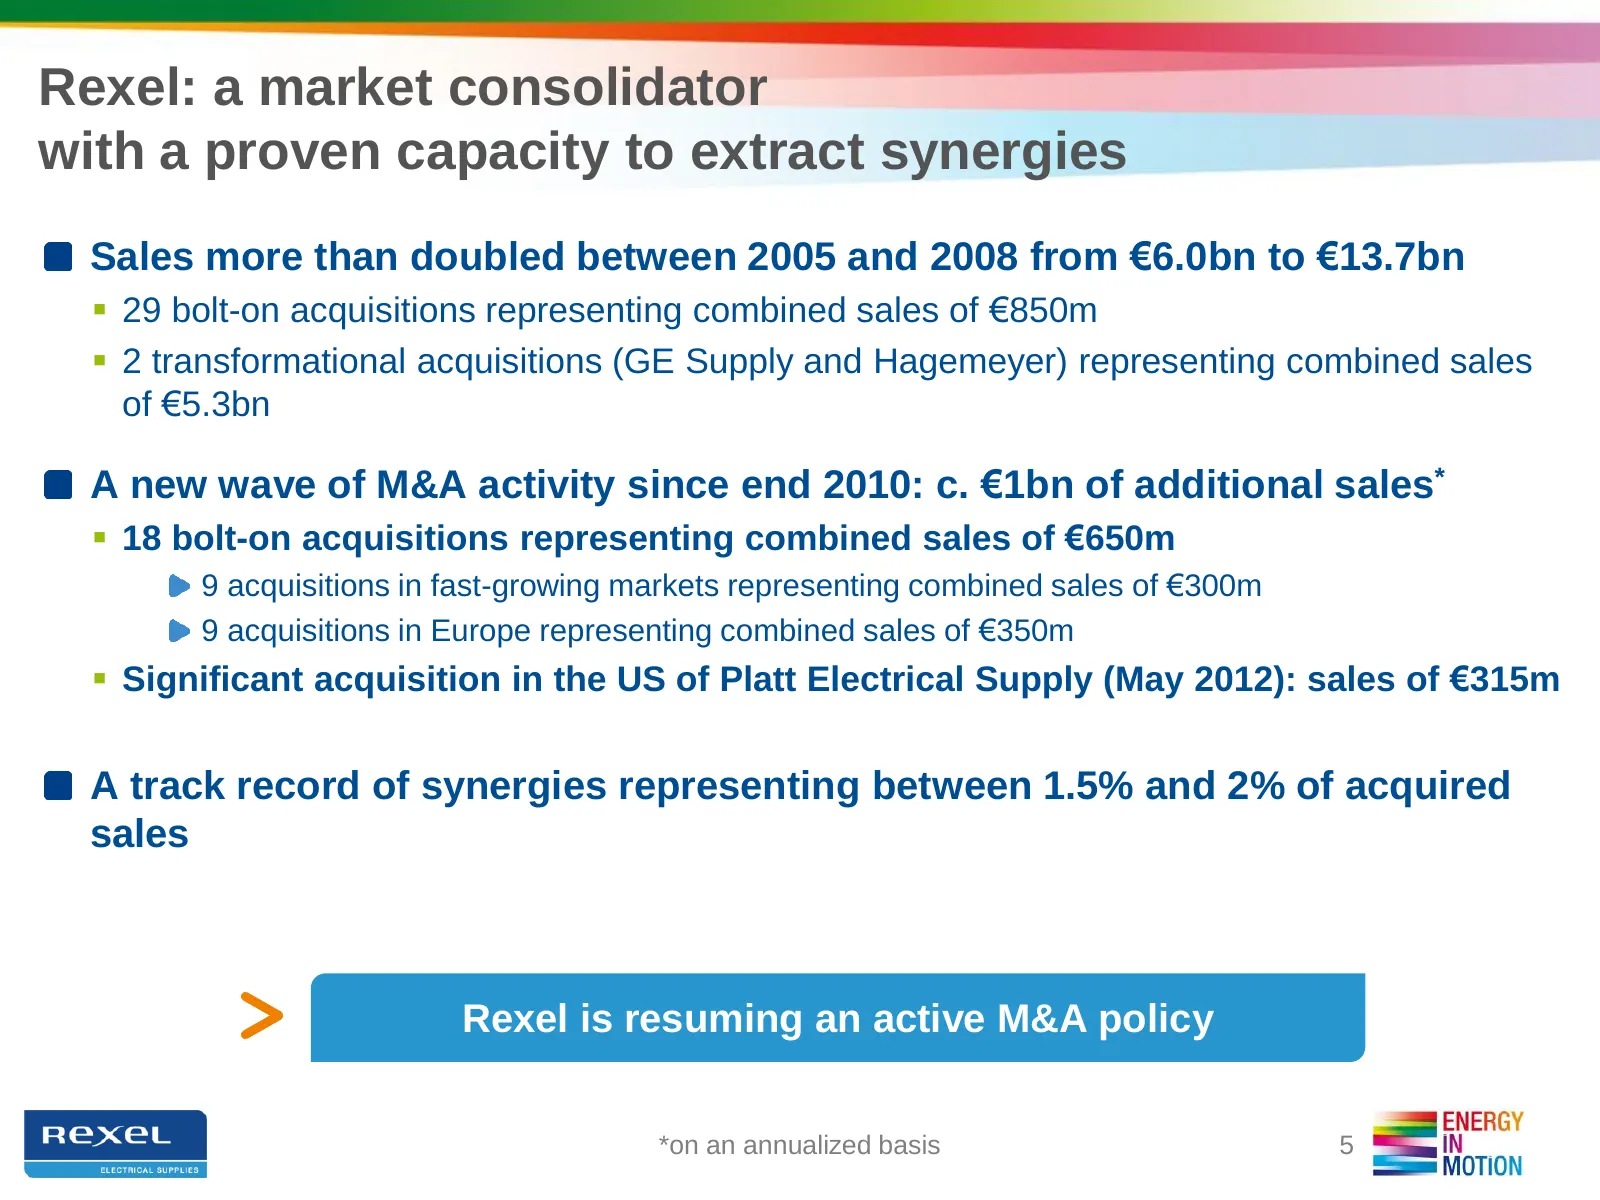
Slide 5: Rexel: a market consolidator with a proven capacity to extract synergies
Rexel: a market consolidator with a proven capacity to extract synergies Sales more than doubled between 2005 and 2008 from €6.0bn to €13.7bn 29 bolt-on acquisitions representing combined sales of €850m 2 transformational acquisitions (GE Supply and Hagemeyer) representing combined sales of €5.3
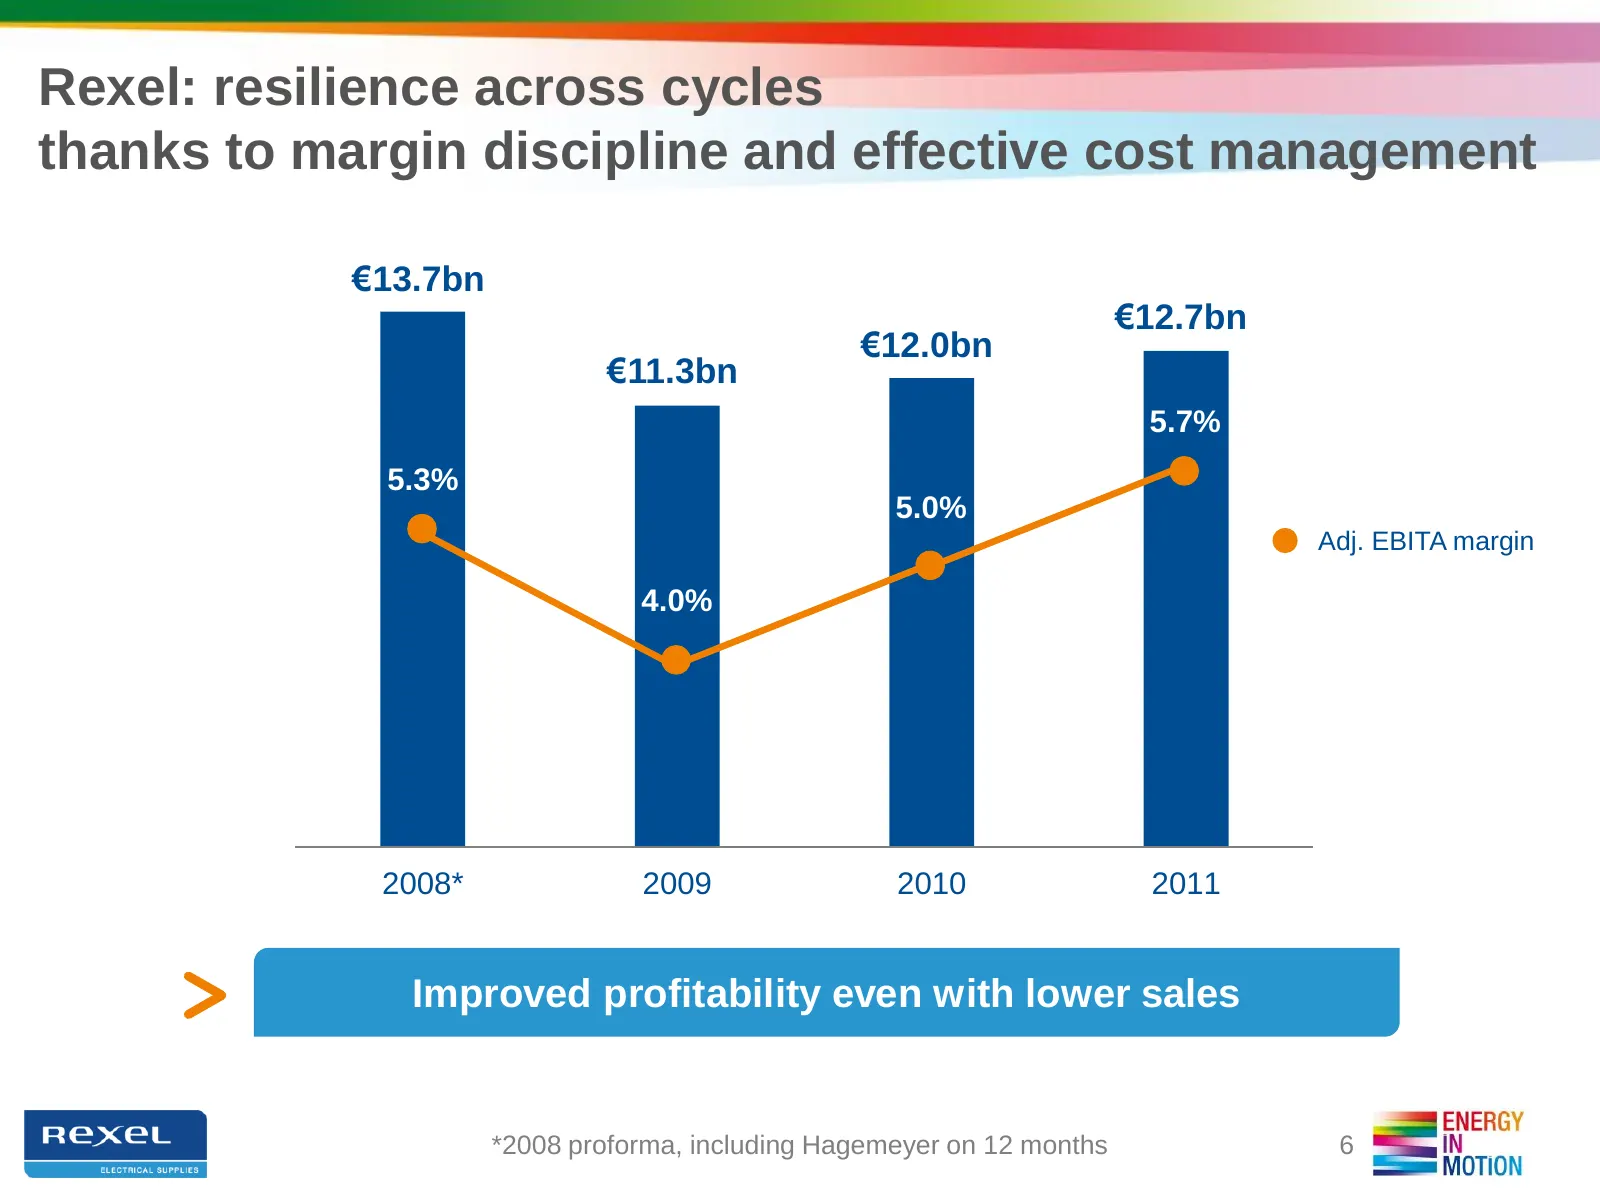
Slide 6: Rexel: resilience across cycles thanks to margin discipline and cost management
Rexel: resilience across cycles thanks to margin discipline and effective cost management €13.7bn €12.7bn €12.0bn €11.3bn 5.7% 5.3% 5.0% Adj. EBITA margin 4.0% 2008* 2009 2010 2011 Improved profitability even with lower sales *2008 proforma, including Hagemeyer on 12 months 6
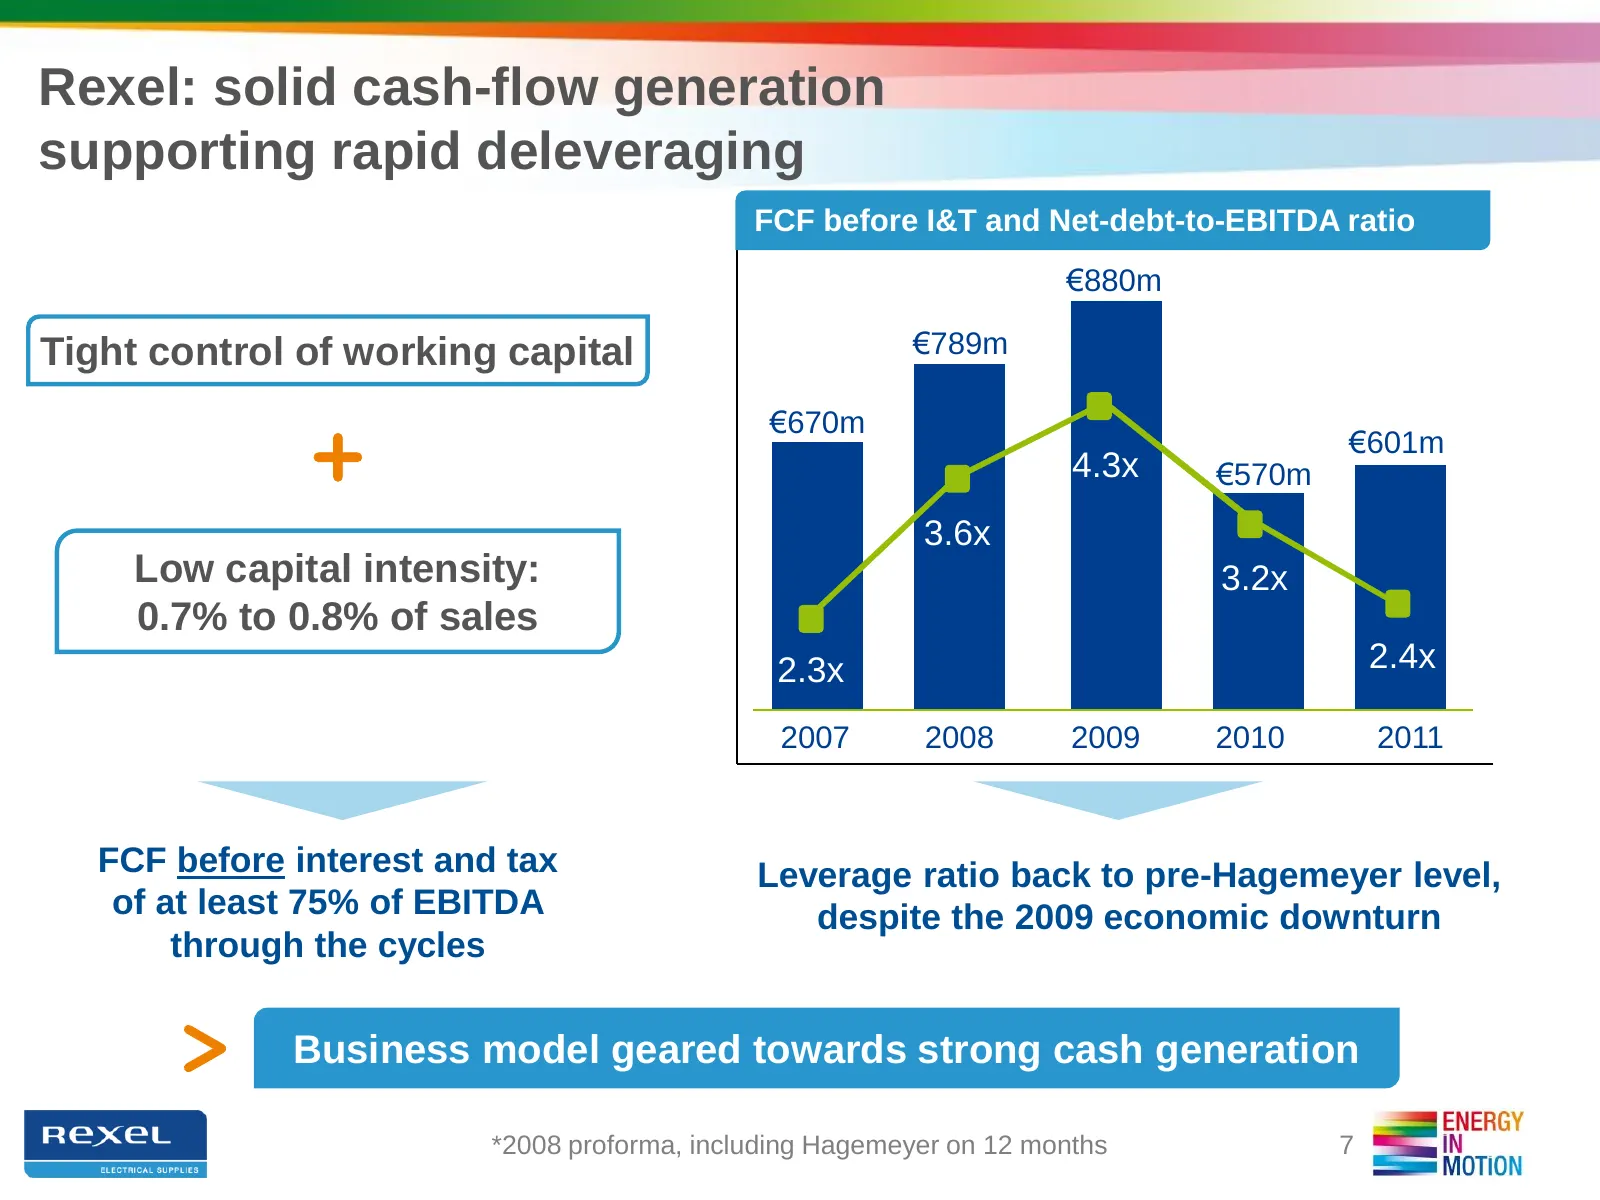
Slide 7: Rexel: solid cash-flow generation supporting rapid deleveraging
Rexel: solid cash-flow generation supporting rapid deleveraging FCF before I&T and Net-debt-to-EBITDA ratio €880m Tight control of working capital €789m €670m €601m 4.3x €570m 3.6x Low capital intensity: 3.2x 0.7% to 0.8% of sales 2.3x 2.4x 2007 2008 2009 2010 2011 FCF before interest and tax Levera
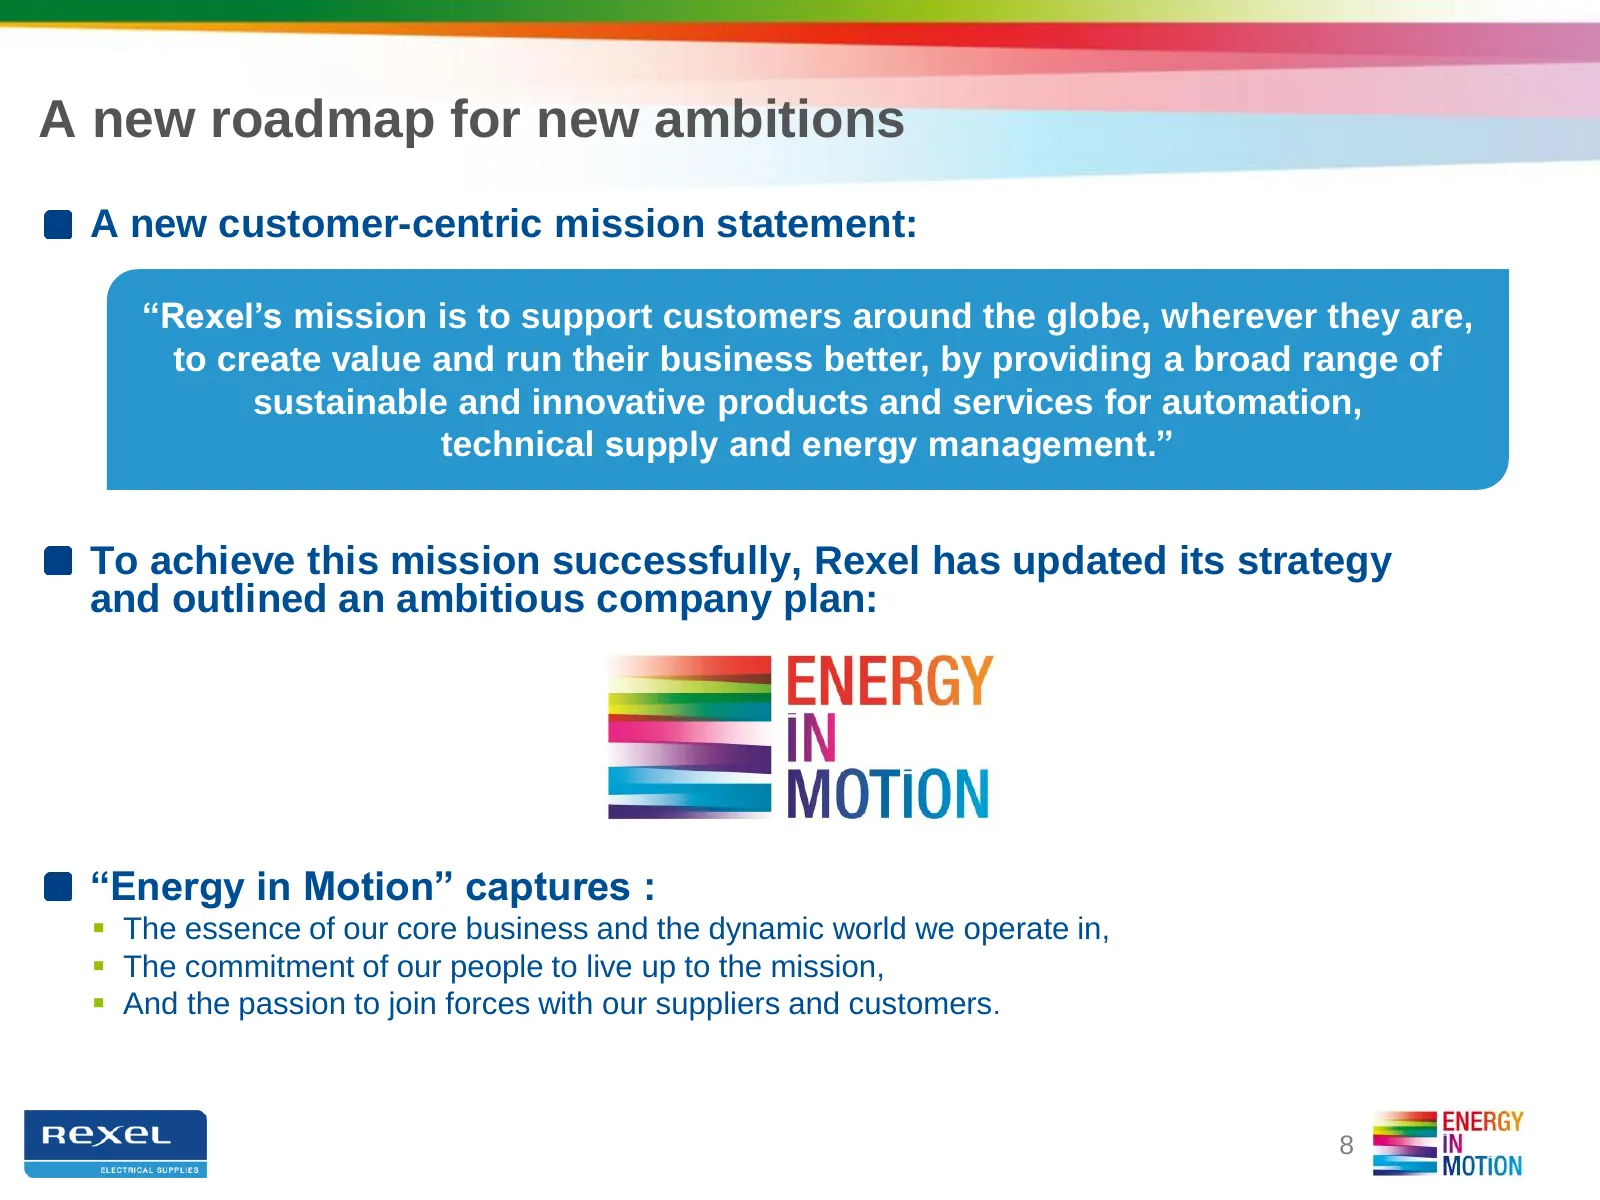
Slide 8: A new roadmap for new ambitions
A new roadmap for new ambitions A new customer-centric mission statement: “Rexel’s mission is to support customers around the globe, wherever they are, to create value and run their business better, by providing a broad range of sustainable and innovative products and services for automation, techni
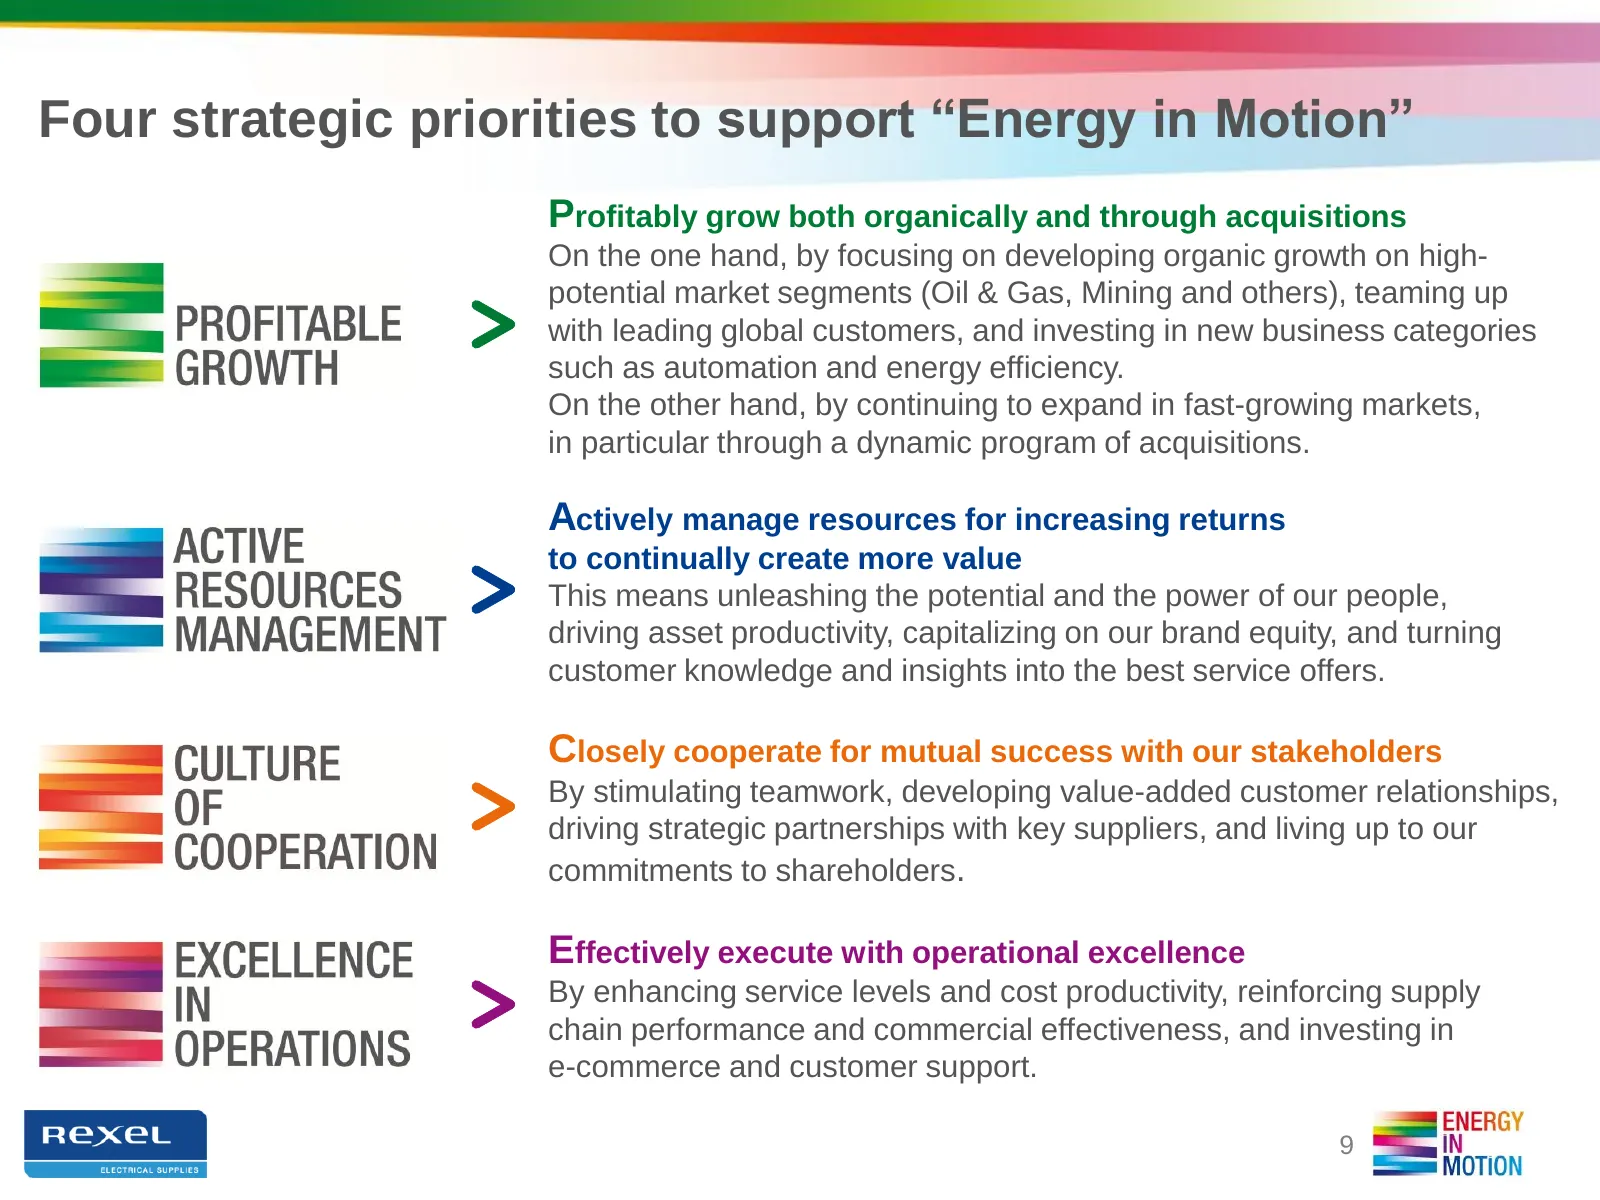
Slide 9: Four strategic priorities to support Energy in Motion
Four strategic priorities to support “Energy in Motion” Profitably grow both organically and through acquisitions On the one hand, by focusing on developing organic growth on high- potential market segments (Oil & Gas, Mining and others), teaming up with leading global customers, and investing in ne
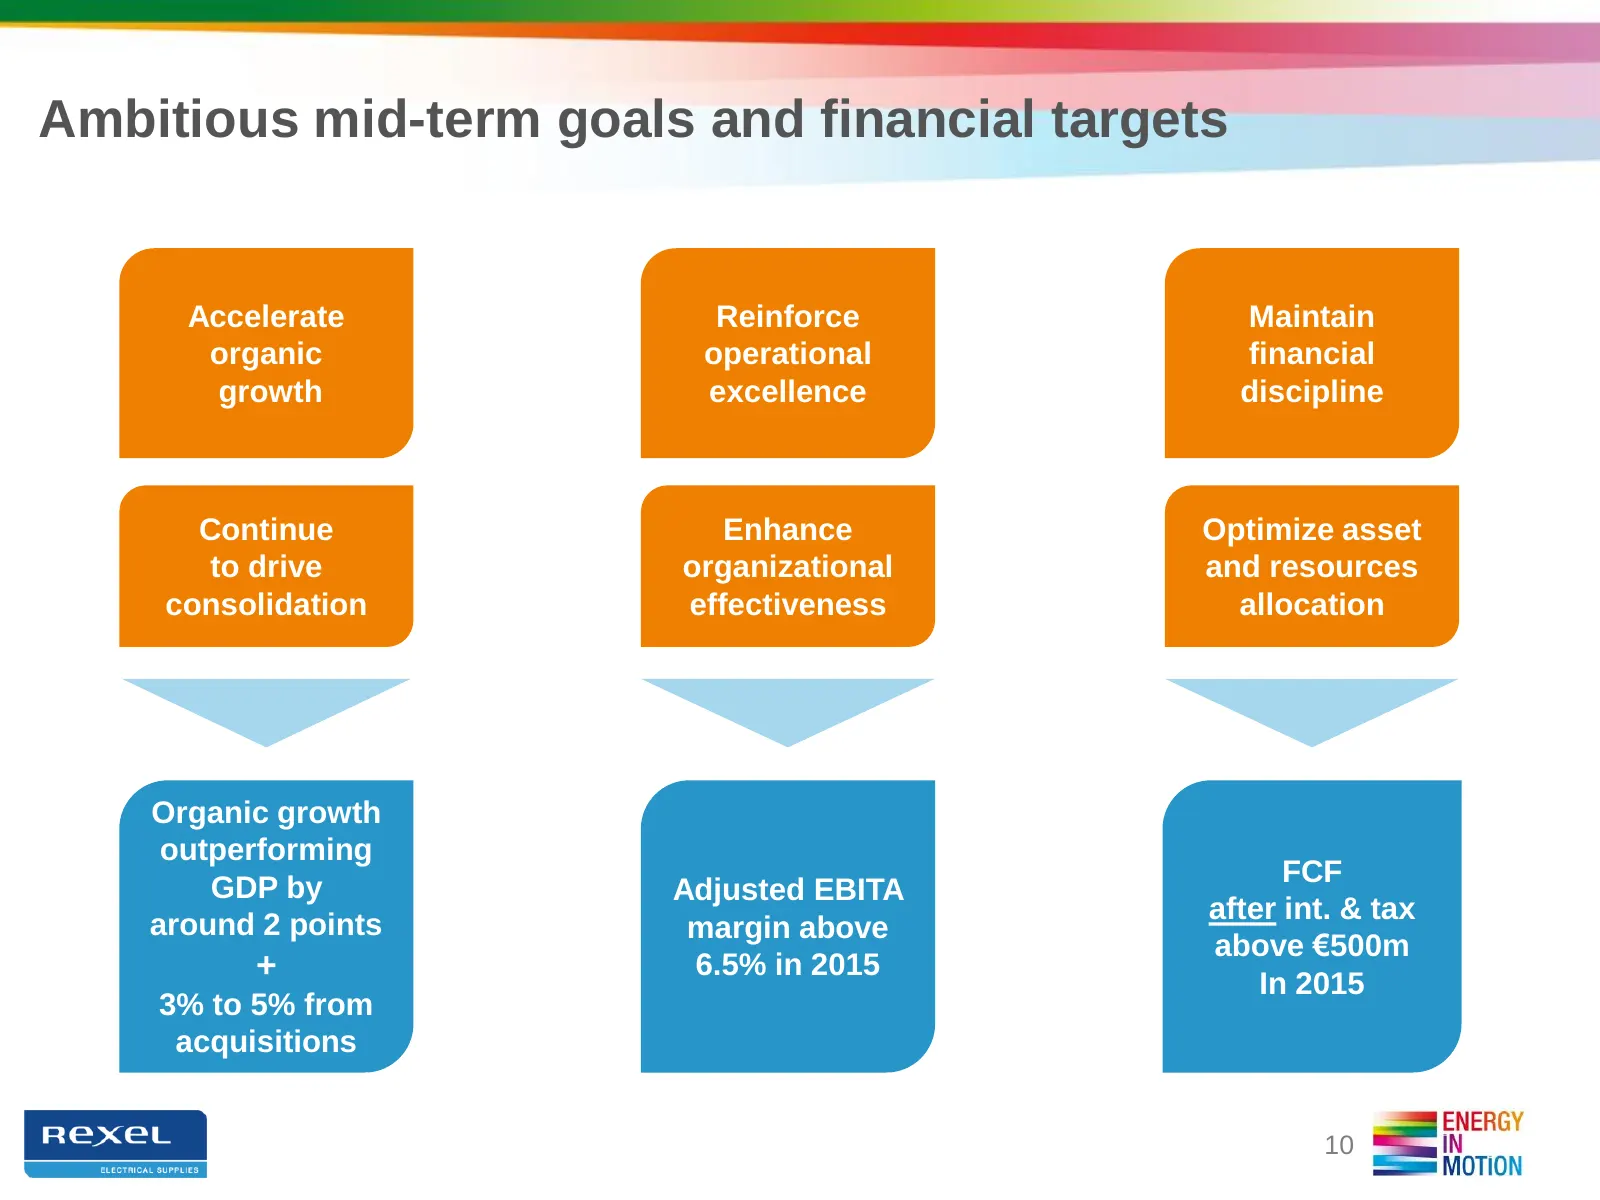
Slide 10: Ambitious mid-term goals and financial targets
Ambitious mid-term goals and financial targets Accelerate Reinforce Maintain organic operational financial growth excellence discipline Continue Enhance Optimize asset to drive organizational and resources consolidation effectiveness allocation Organic growth outperforming FCF GDP by Adjusted EBITA
Slide 11: A new phase of development (1/3): Accelerate organic growth
A new phase of development (1/3): Accelerate organic growth Accelerate organic growth focusing on 3 main areas: High-potential business categories by seizing opportunities related to energy efficiency International customers and projects by developing international key accounts and large project
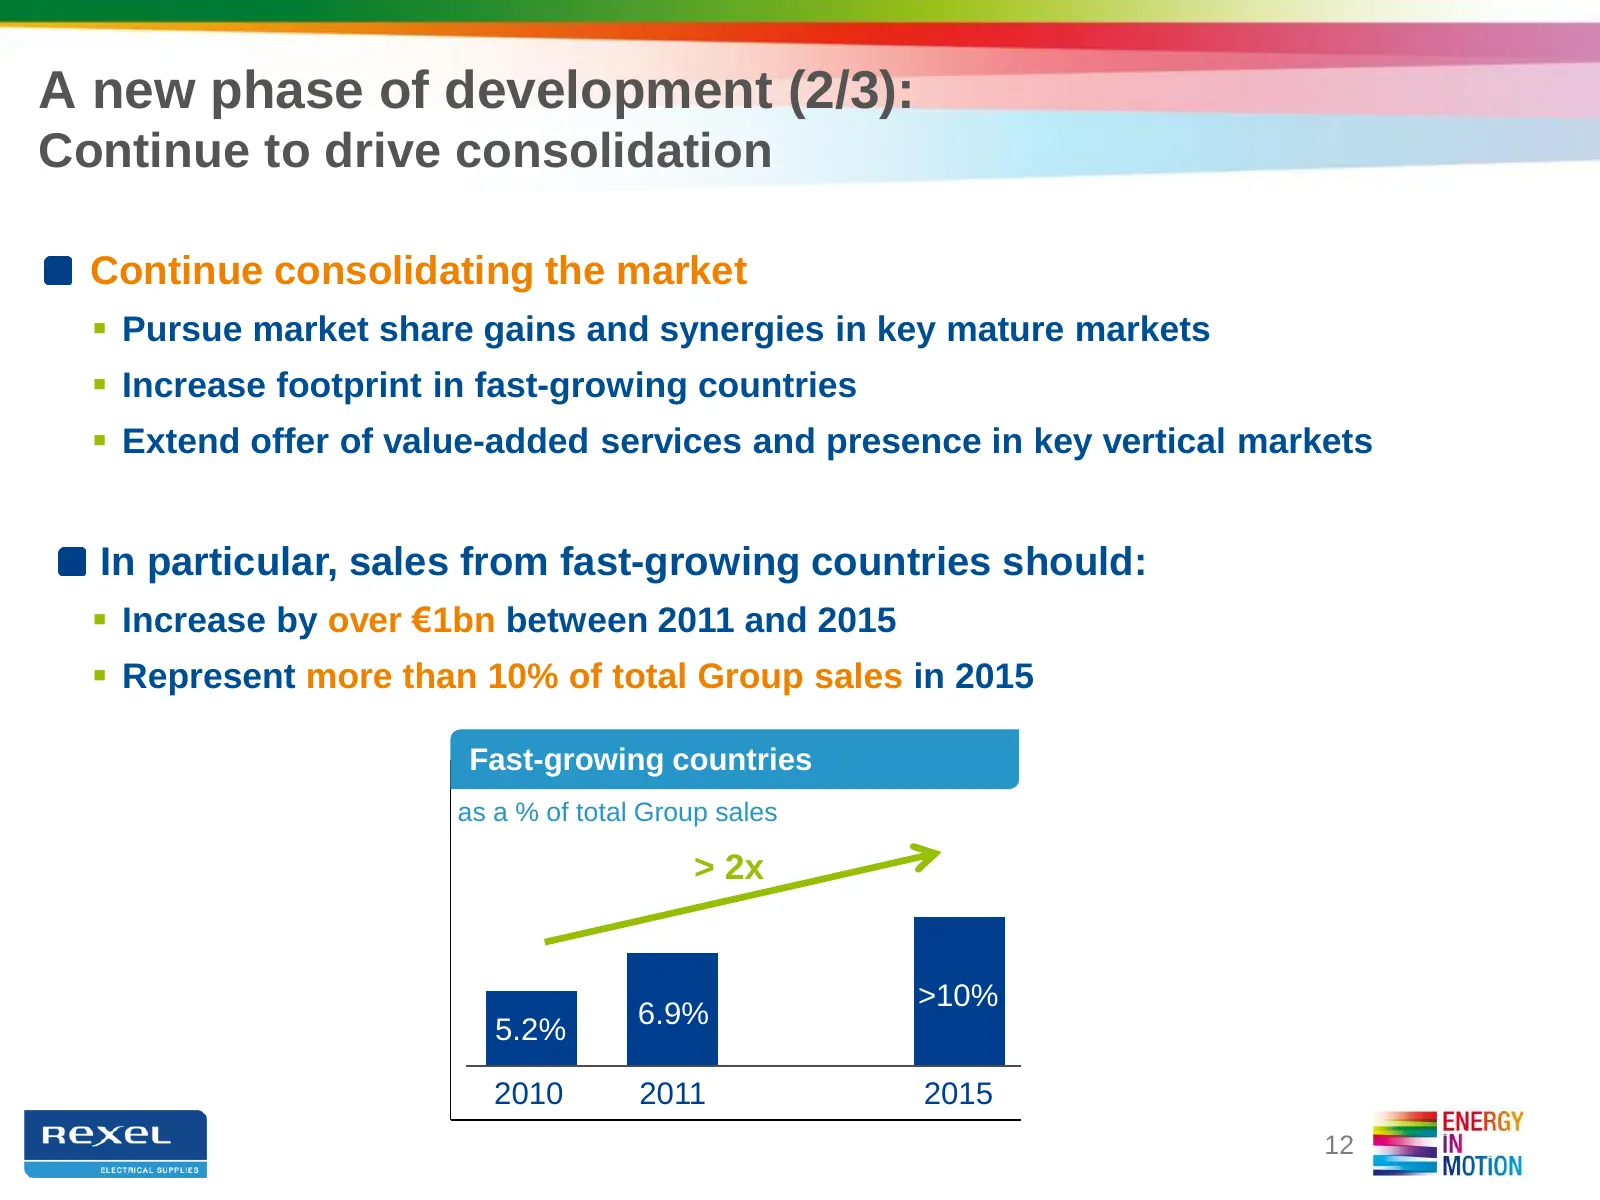
Slide 12: A new phase of development (2/3): Continue to drive consolidation
A new phase of development (2/3): Continue to drive consolidation Continue consolidating the market Pursue market share gains and synergies in key mature markets Increase footprint in fast-growing countries Extend offer of value-added services and presence in key vertical markets In particular
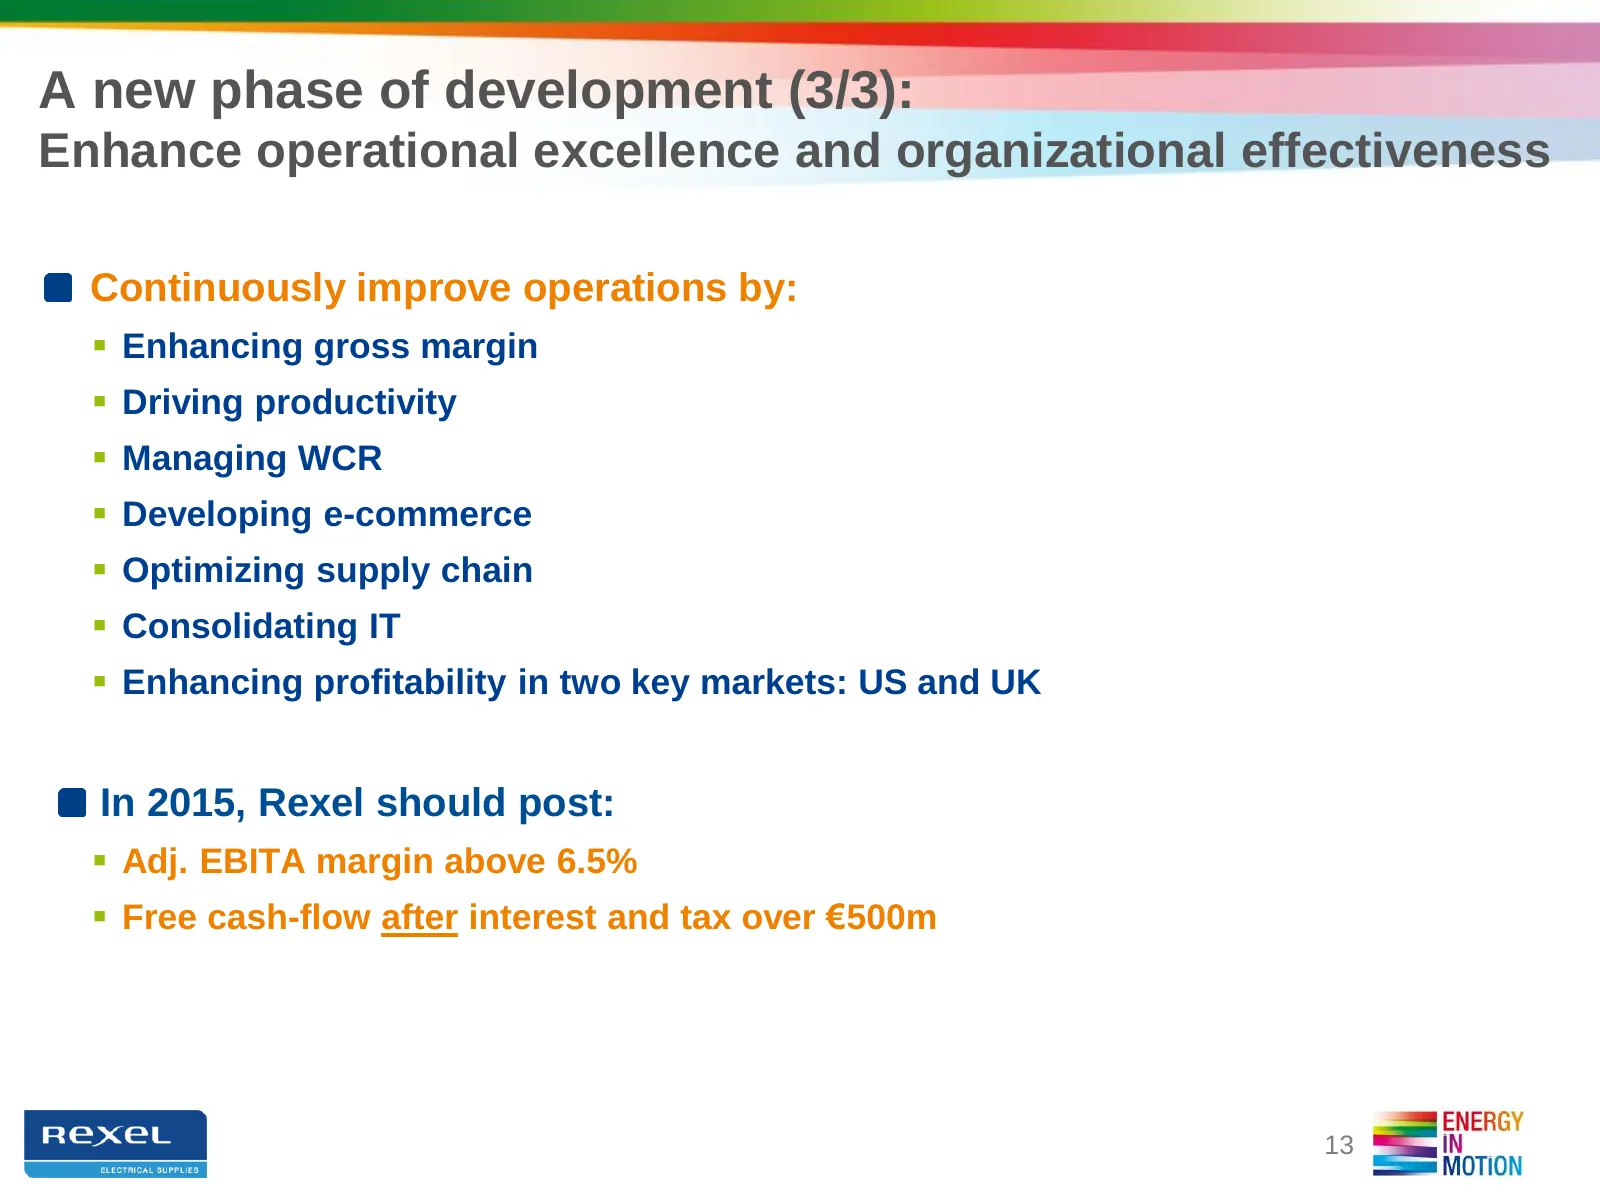
Slide 13: A new phase of development (3/3): Operational excellence
A new phase of development (3/3): Enhance operational excellence and organizational effectiveness Continuously improve operations by: Enhancing gross margin Driving productivity Managing WCR Developing e-commerce Optimizing supply chain Consolidating IT Enhancing profitability in two k
Slide 14: Accelerating organic growth
ACCELERATING ORGANIC GROWTH Patrick BERARD, Senior VP Southern Continental Europe Chris HARTMANN, Executive VP & CEO, Rexel Holdings USA Henri-Paul LASCHKAR, Senior VP UK and Ireland Pascal MARTIN, Group Senior VP, Corporate Strategy, Business Portfolio Management and New Business Development
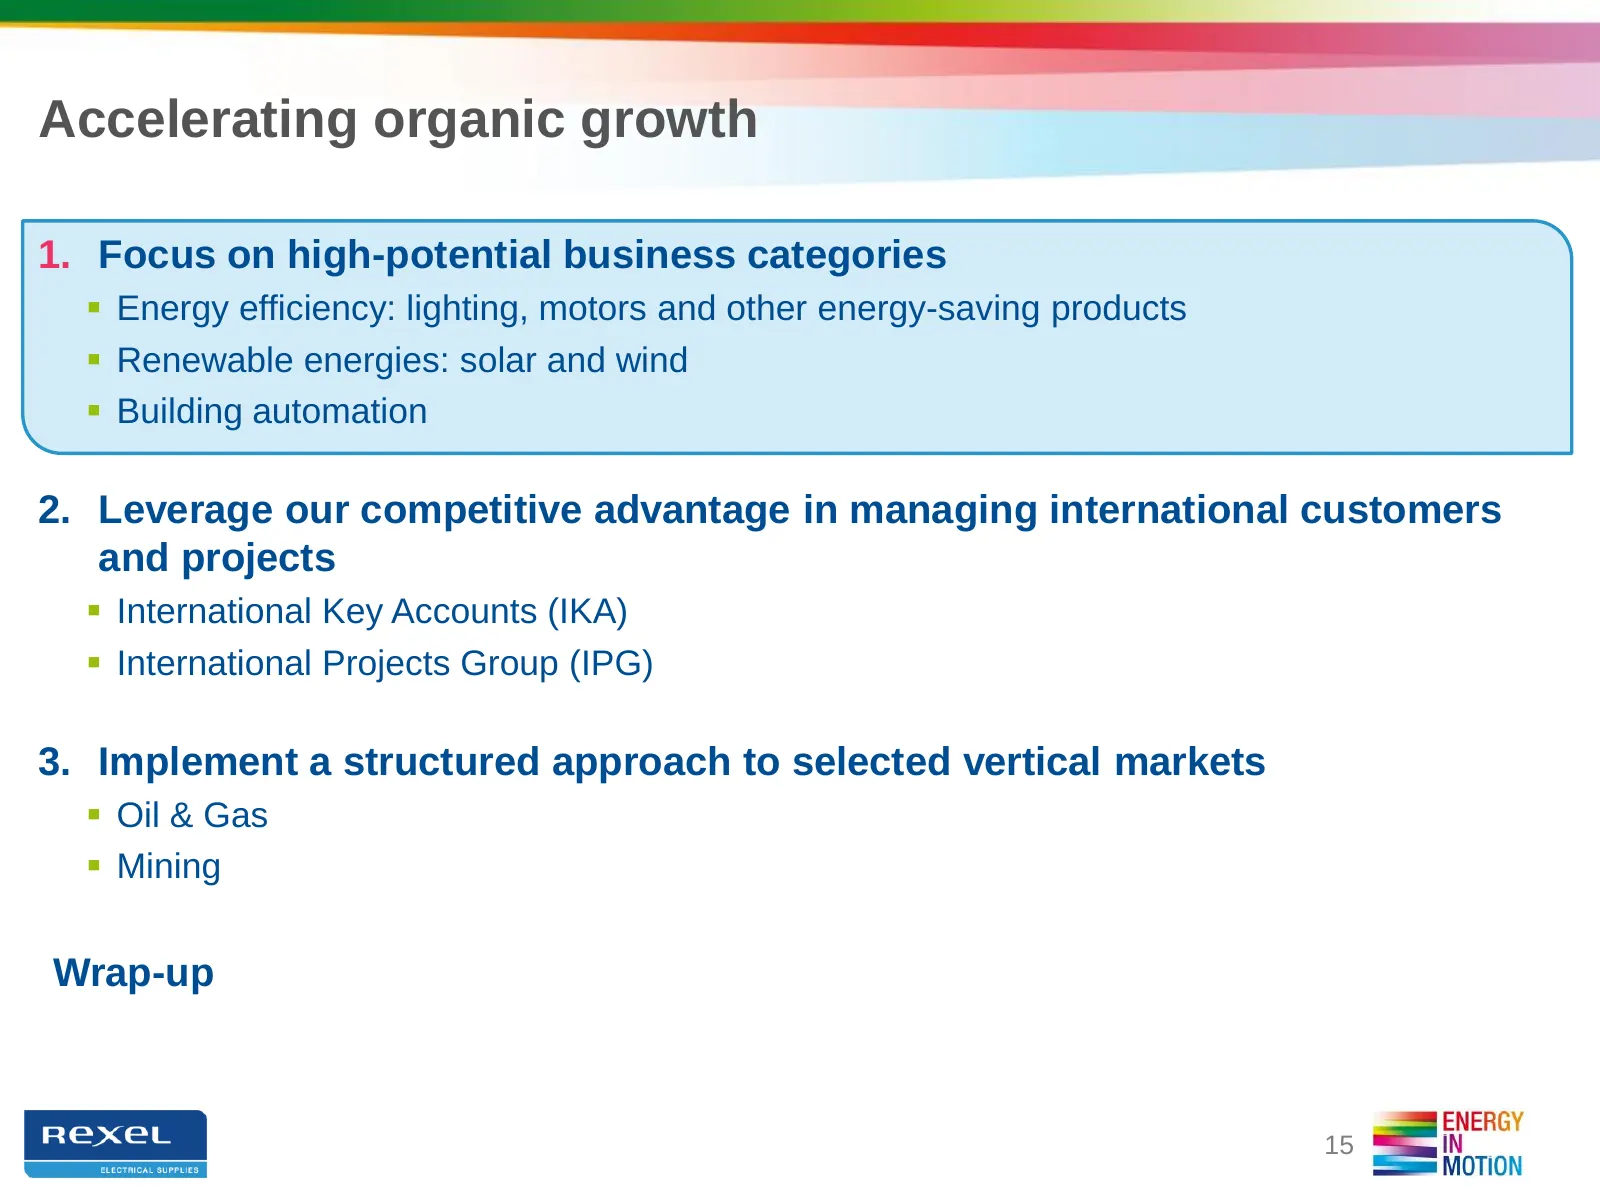
Slide 15: Accelerating organic growth
Accelerating organic growth 1. Focus on high-potential business categories Energy efficiency: lighting, motors and other energy-saving products Renewable energies: solar and wind Building automation 2. Leverage our competitive advantage in managing international customers and projects Intern
Slide 16: Accelerating organic growth
Accelerating organic growth 1. Focus on high-potential business categories Energy efficiency: lighting, motors and other energy-saving products Renewable energies: solar and wind Building automation 2. Leverage our competitive advantage in managing international customers and projects Intern
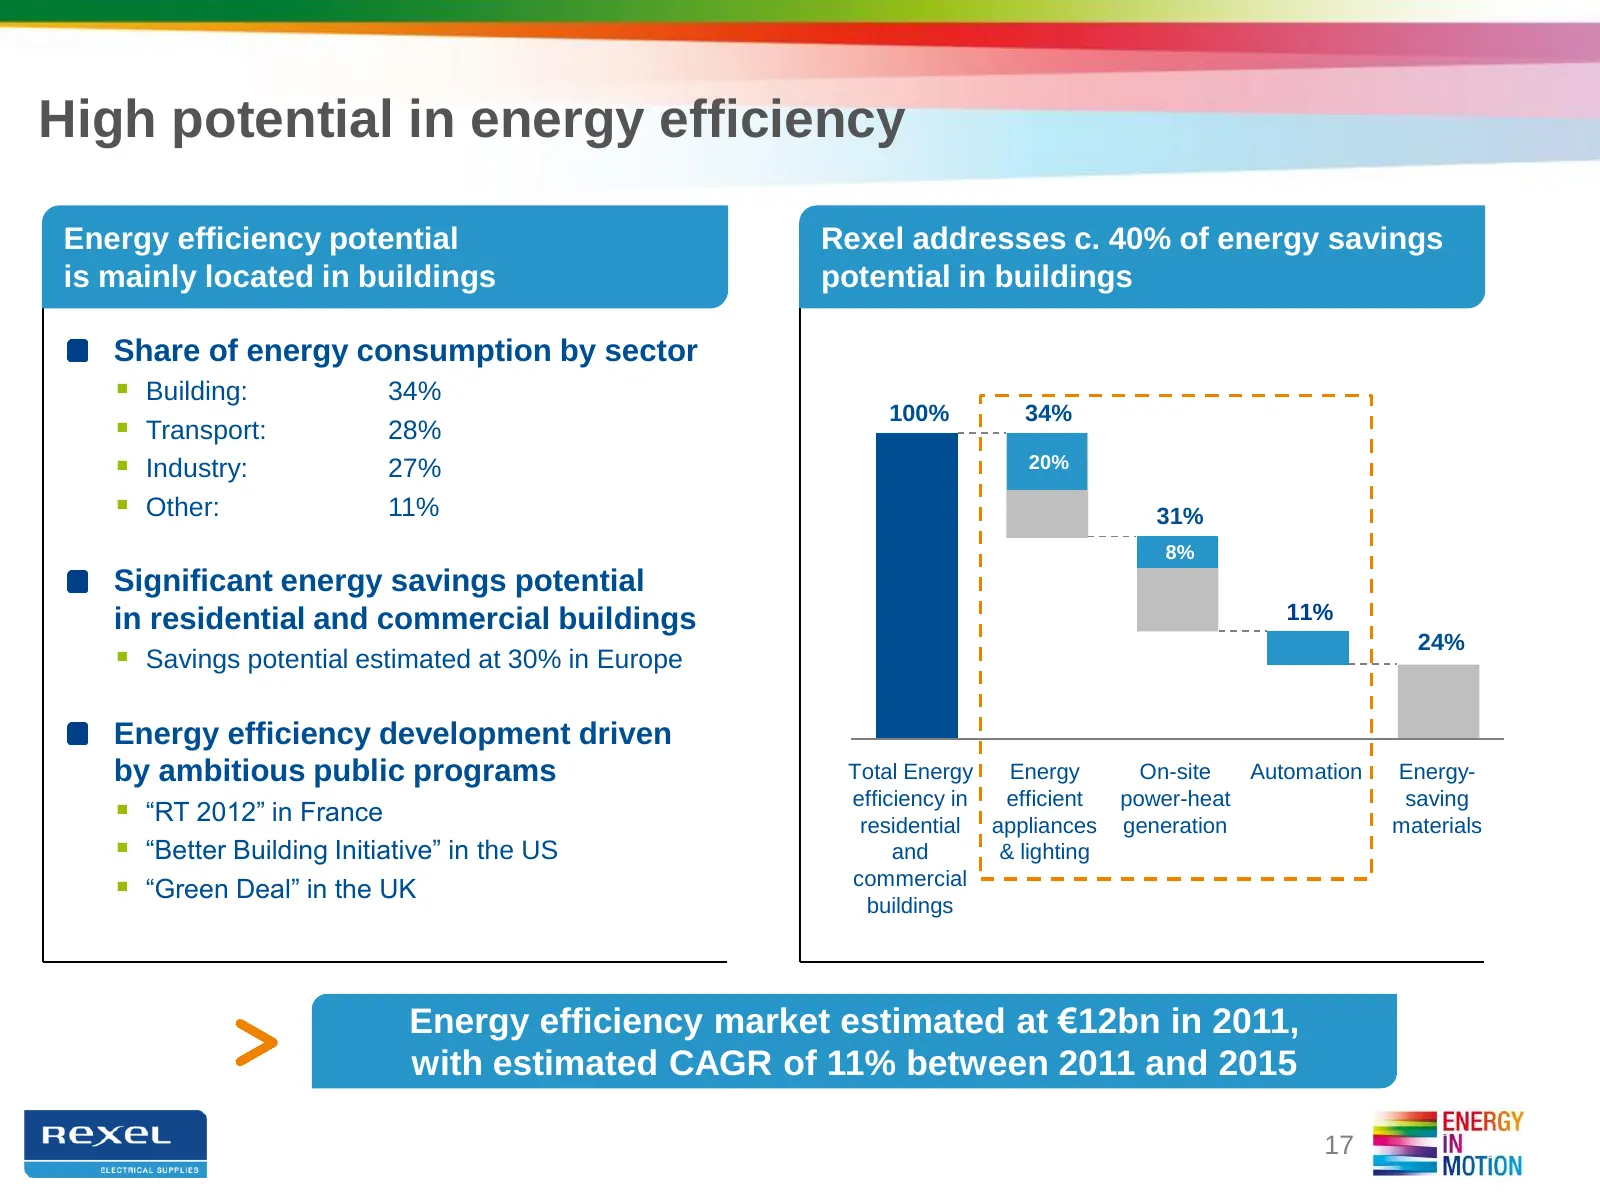
Slide 17: High potential in energy efficiency
High potential in energy efficiency Energy efficiency potential Rexel addresses c. 40% of energy savings is mainly located in buildings potential in buildings Share of energy consumption by sector Building: 34% 100% 34% Transport: 28% Industry: 27% 20% Other: 11% 31% 8% Significant energy sa
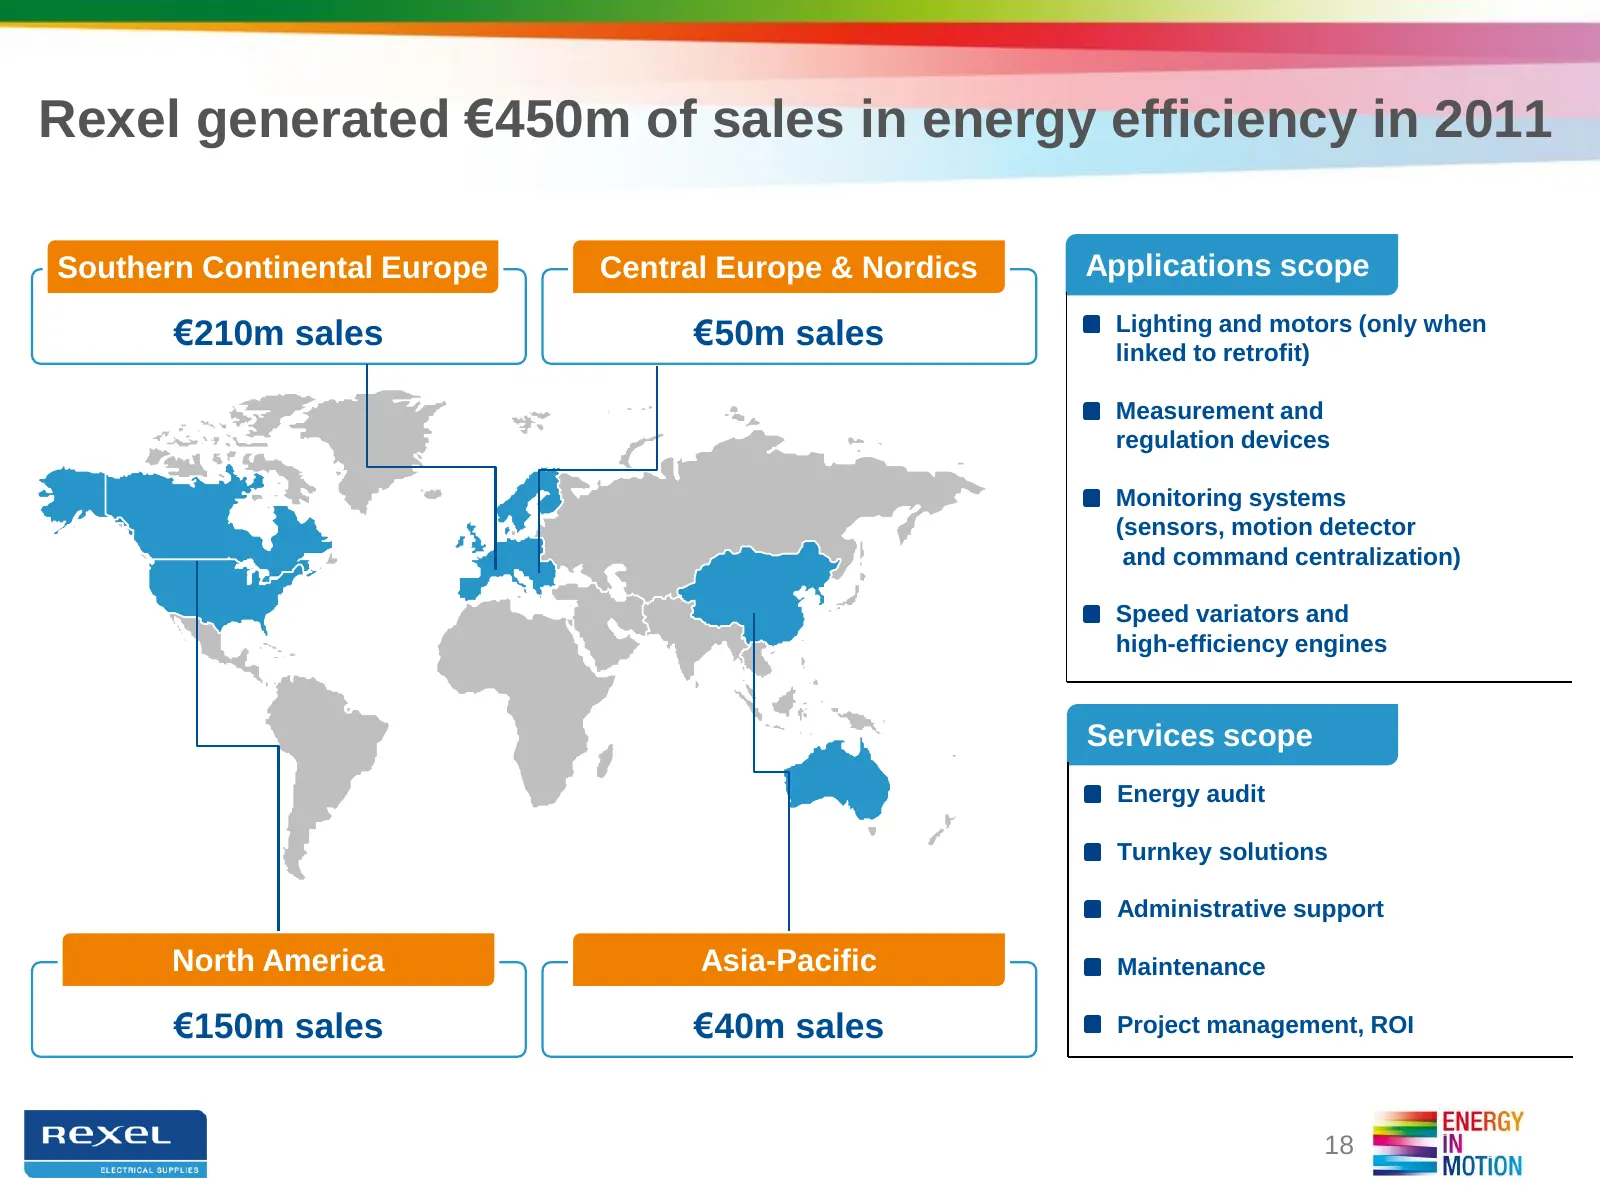
Slide 18: Rexel generated €450m of sales in energy efficiency in 2011
Rexel generated €450m of sales in energy efficiency in 2011 Southern Continental Europe Central Europe & Nordics Applications scope €210m sales €50m sales Lighting and motors (only when linked to retrofit) Measurement and regulation devices Monitoring systems (sensors, motion detector and command ce
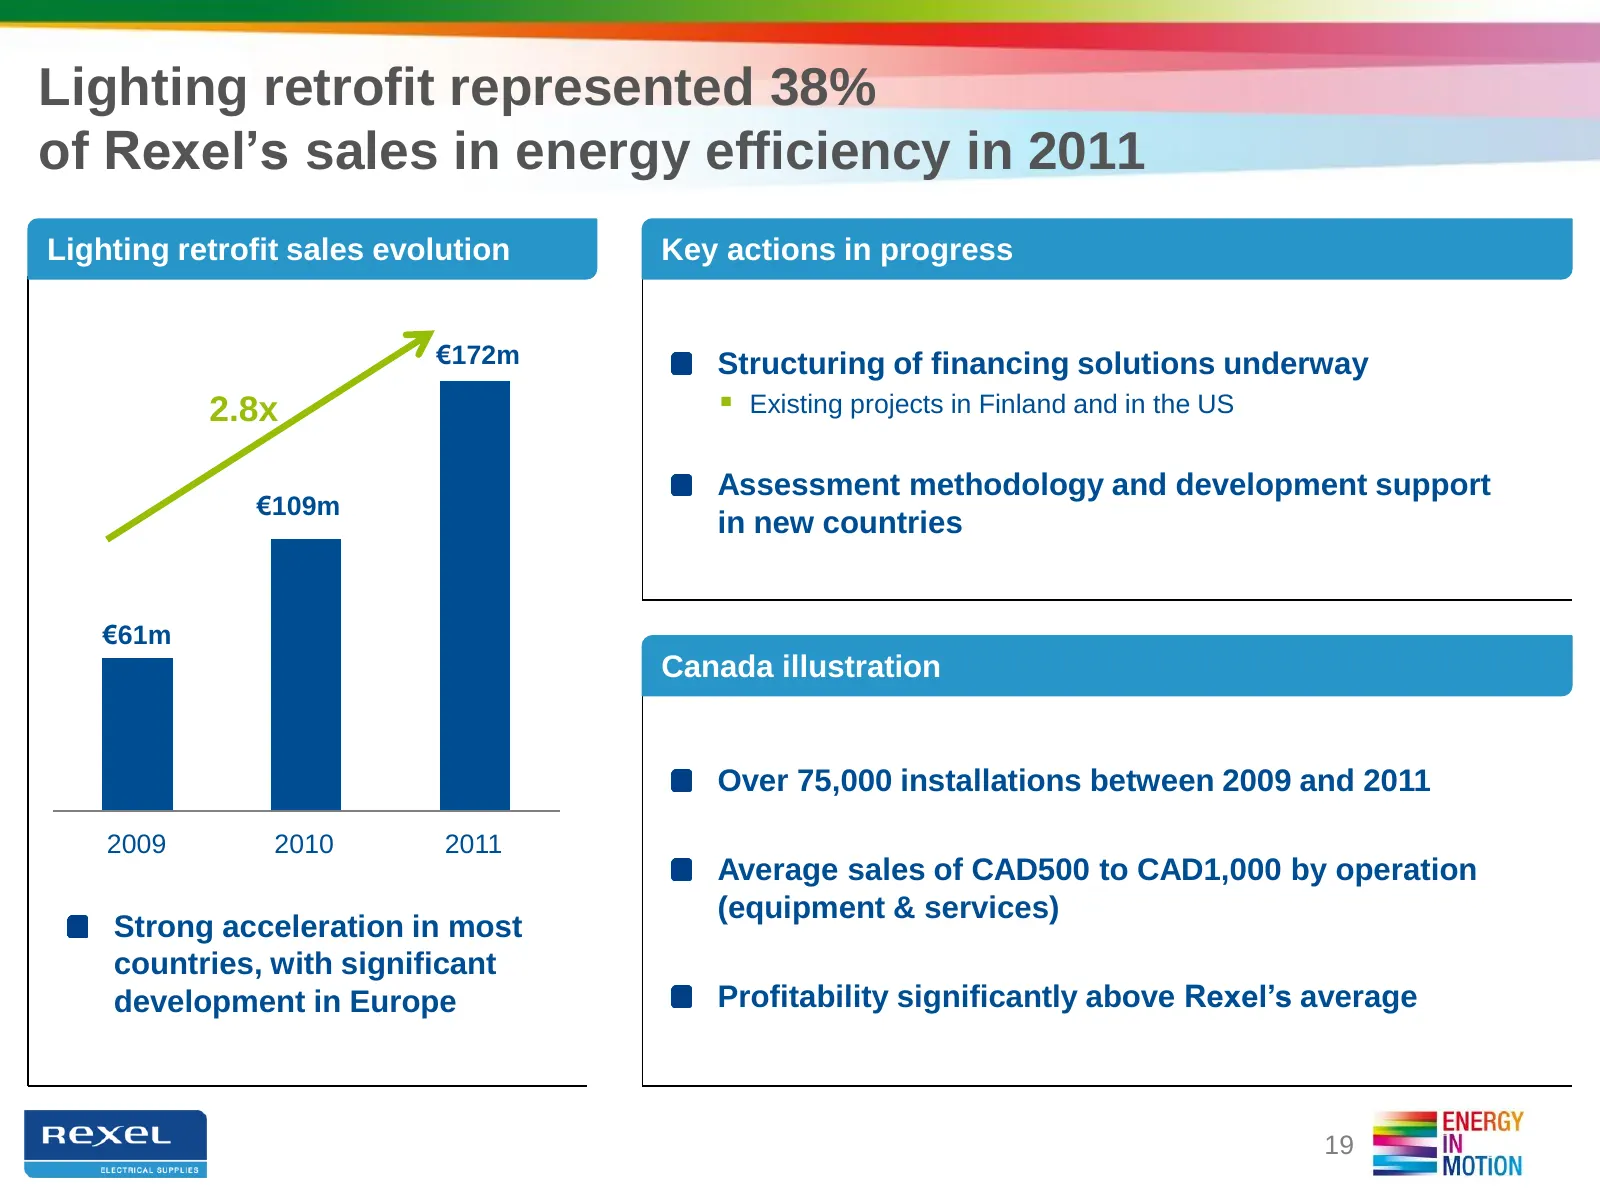
Slide 19: Lighting retrofit represented 38% of energy efficiency sales in 2011
Lighting retrofit represented 38% of Rexel’s sales in energy efficiency in 2011 Lighting retrofit sales evolution Key actions in progress €172m Structuring of financing solutions underway 2.8x Existing projects in Finland and in the US Assessment methodology and development support €109m in new co
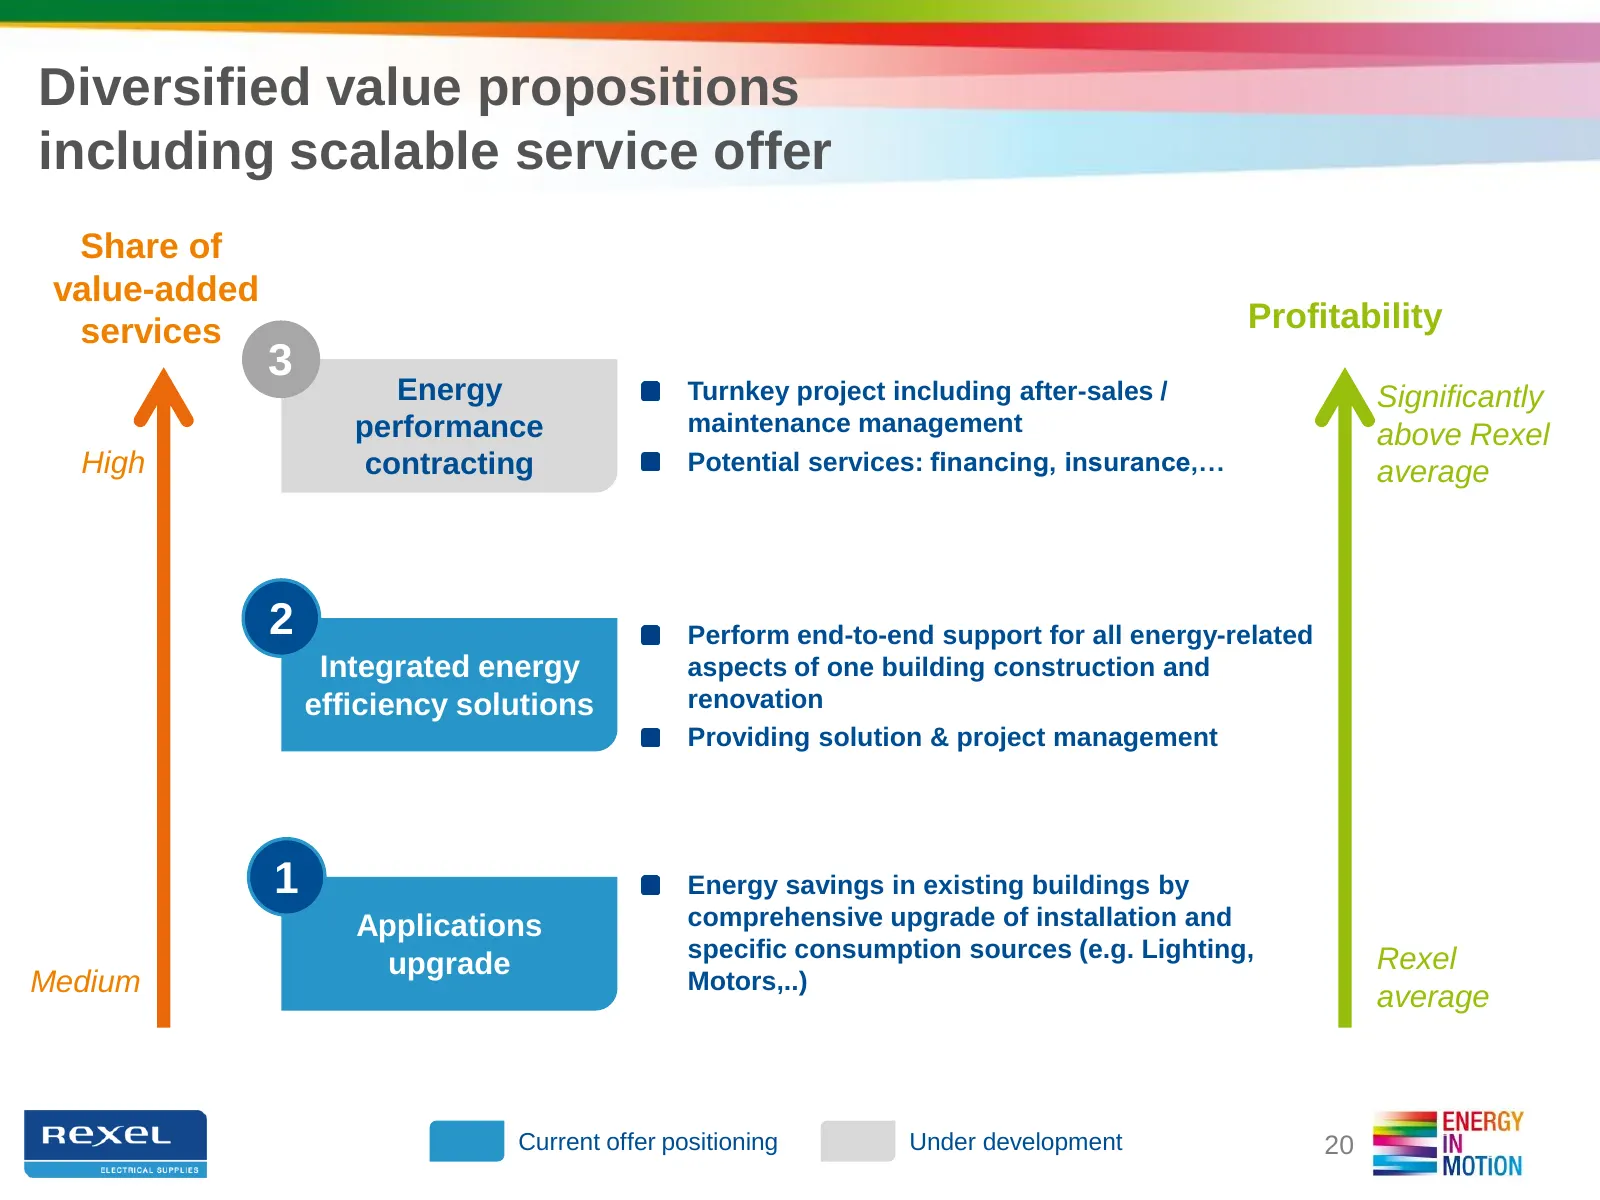
Slide 20: Diversified value propositions including scalable service offer
Diversified value propositions including scalable service offer Share of value-added services Profitability 3 Energy Turnkey project including after-sales / Significantly performance maintenance management above Rexel High contracting Potential services: financing, insurance,… average 2 Perform end-
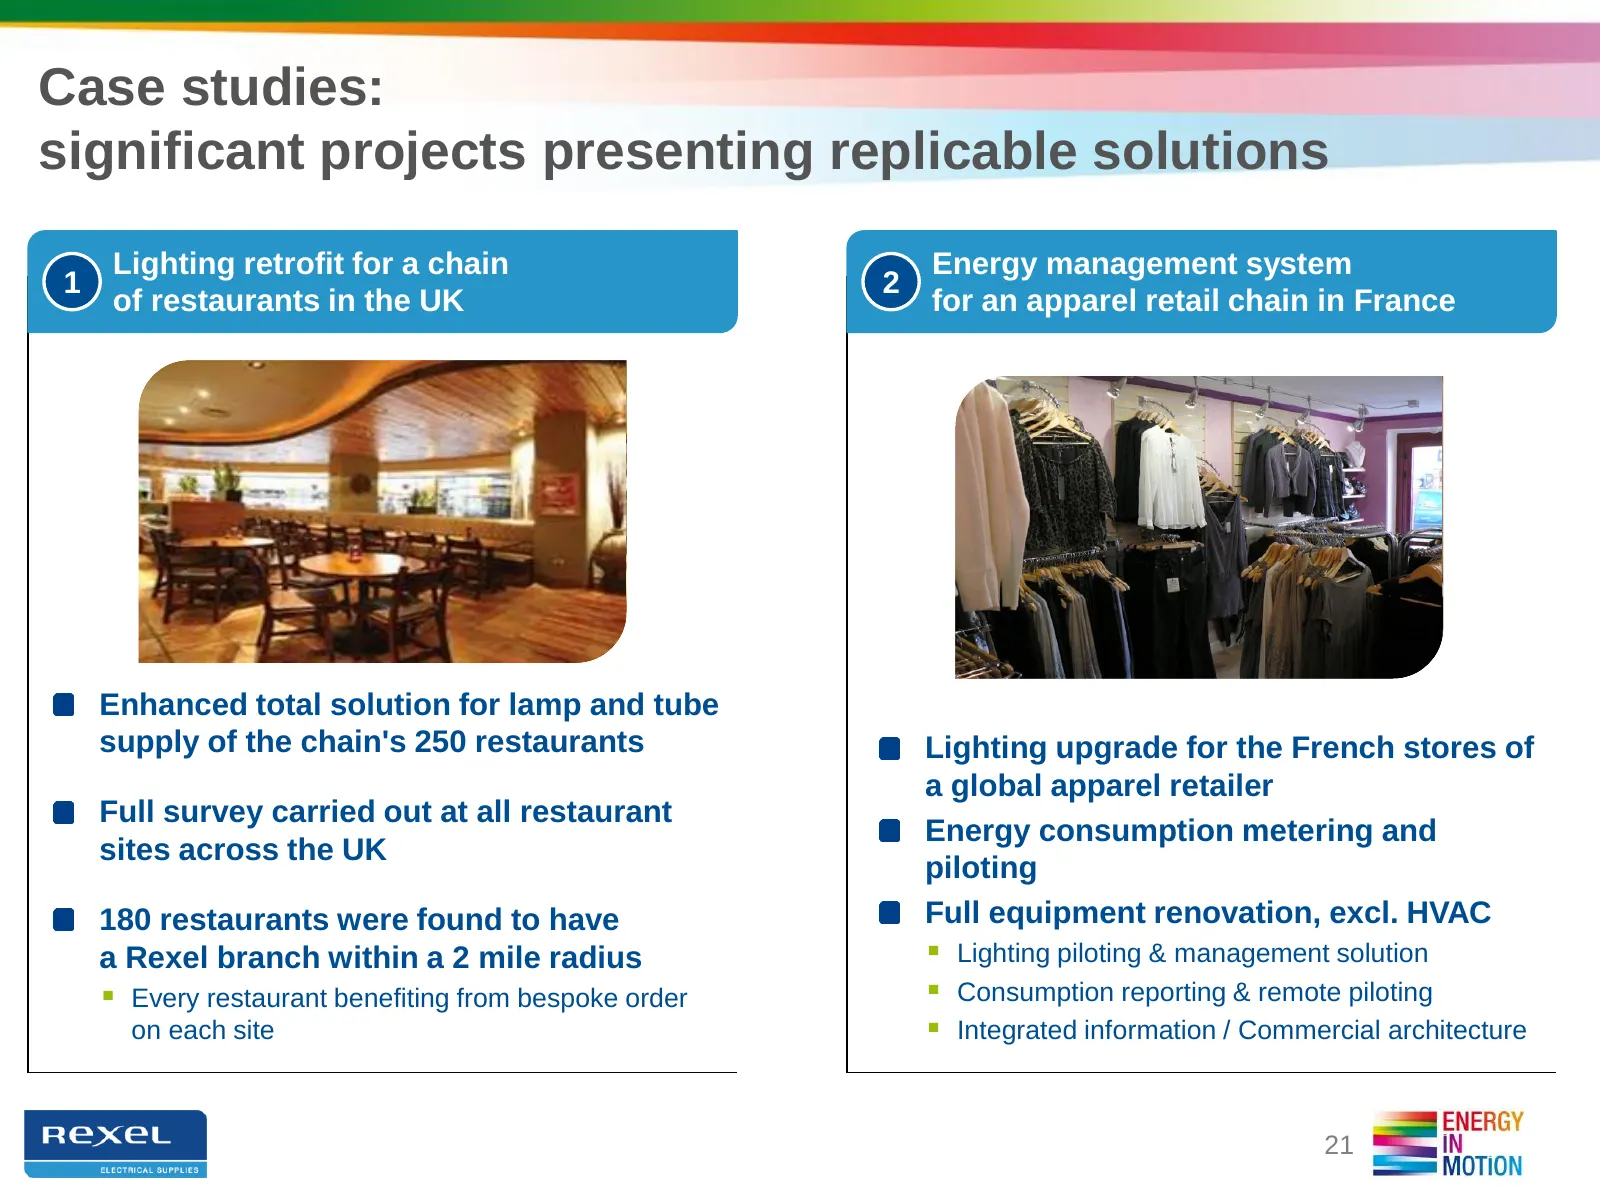
Slide 21: Case studies: significant projects presenting replicable solutions
Case studies: significant projects presenting replicable solutions Lighting retrofit for a chain Energy management system 1 2 of restaurants in the UK for an apparel retail chain in France Enhanced total solution for lamp and tube supply of the chain's 250 restaurants Lighting upgrade for the French
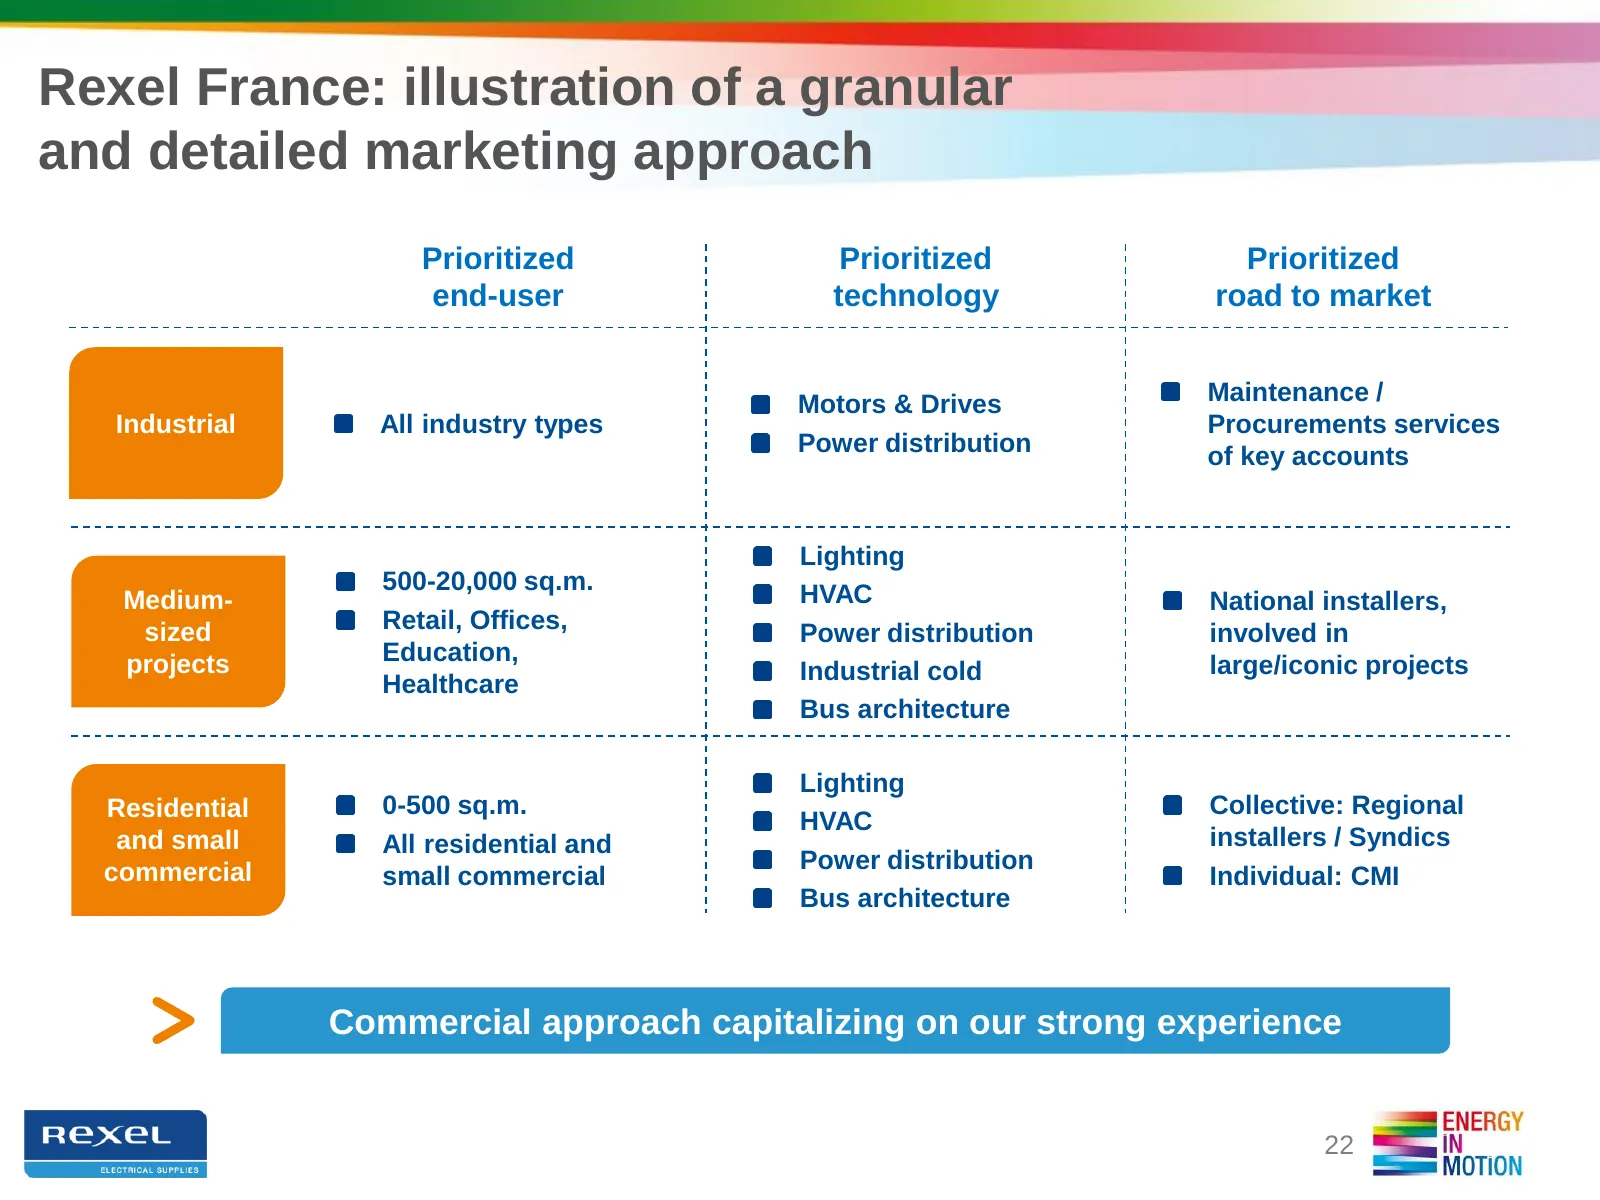
Slide 22: Rexel France: a granular and detailed marketing approach
Rexel France: illustration of a granular and detailed marketing approach Prioritized Prioritized Prioritized end-user technology road to market Motors & Drives Maintenance / Industrial All industry types Procurements services Power distribution of key accounts Lighting 500-20,000 sq.m. HVAC Medium-
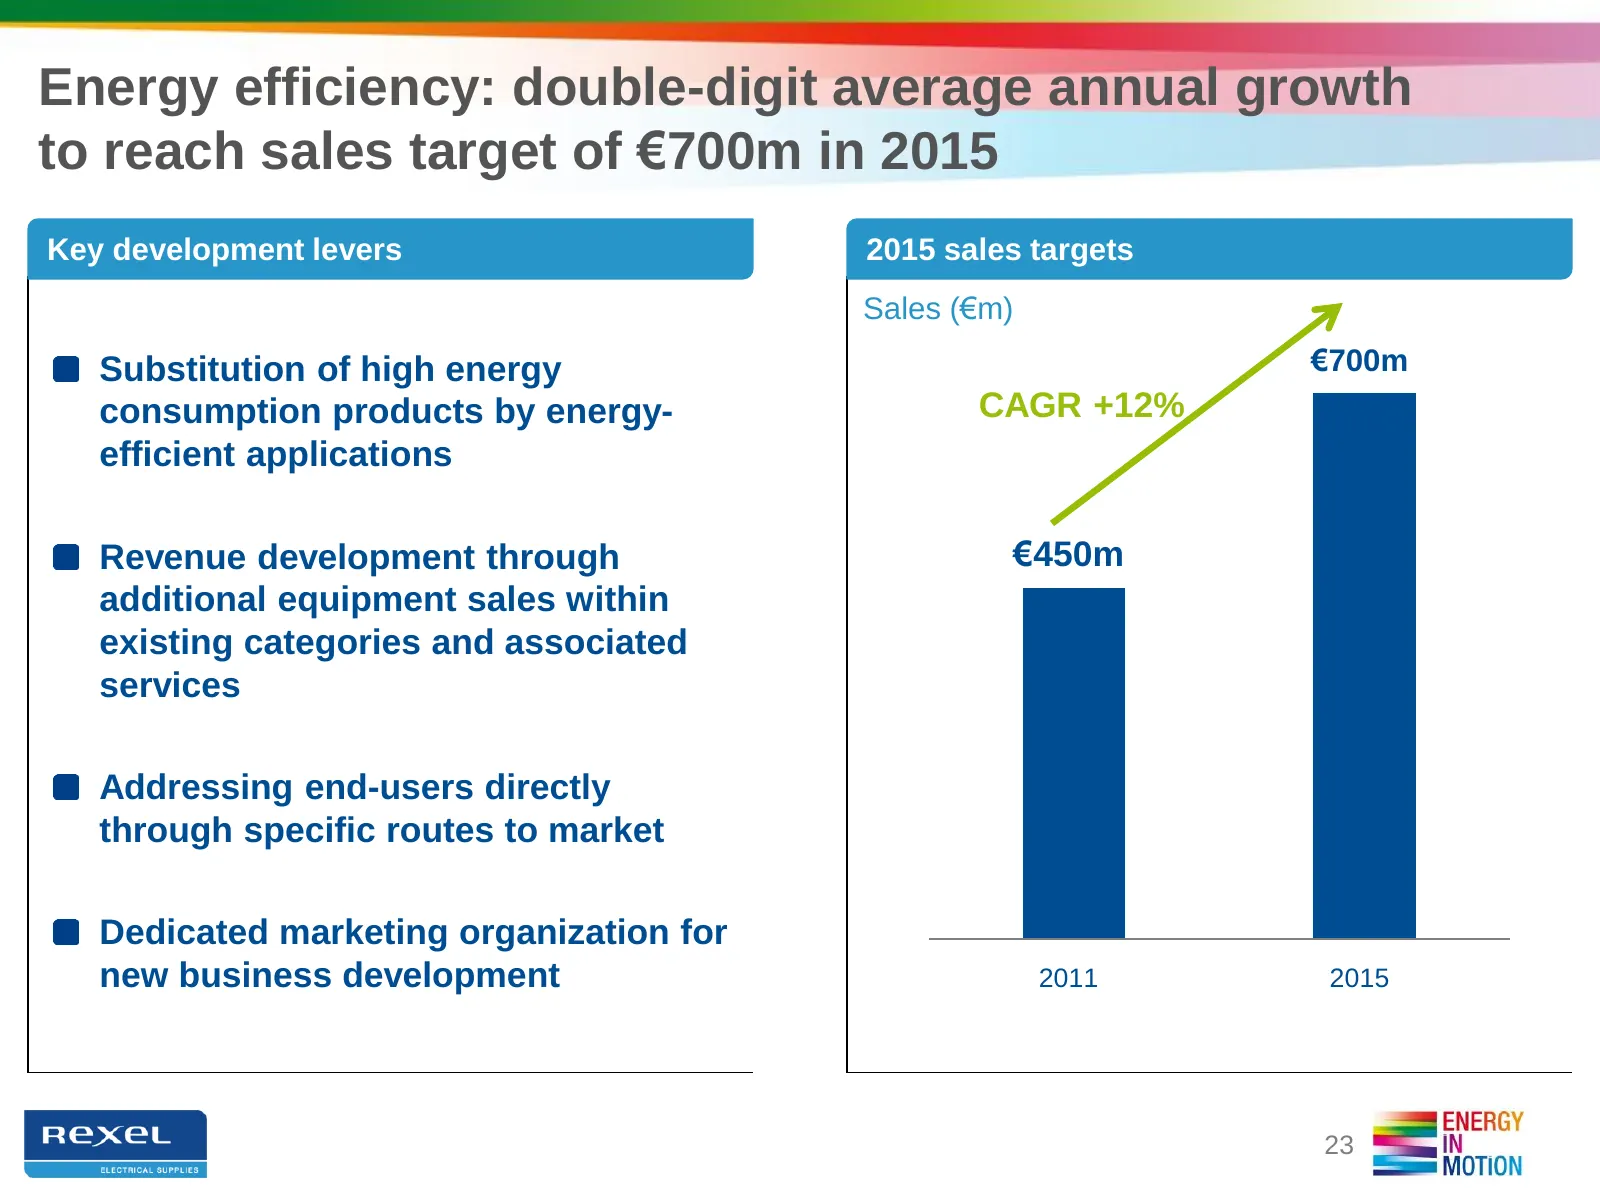
Slide 23: Energy efficiency: double-digit growth to reach €700m in 2015
Energy efficiency: double-digit average annual growth to reach sales target of €700m in 2015 Key development levers 2015 sales targets Sales (€m) Substitution of high energy €700m consumption products by energy- CAGR +12% efficient applications Revenue development through €450m additional equipment
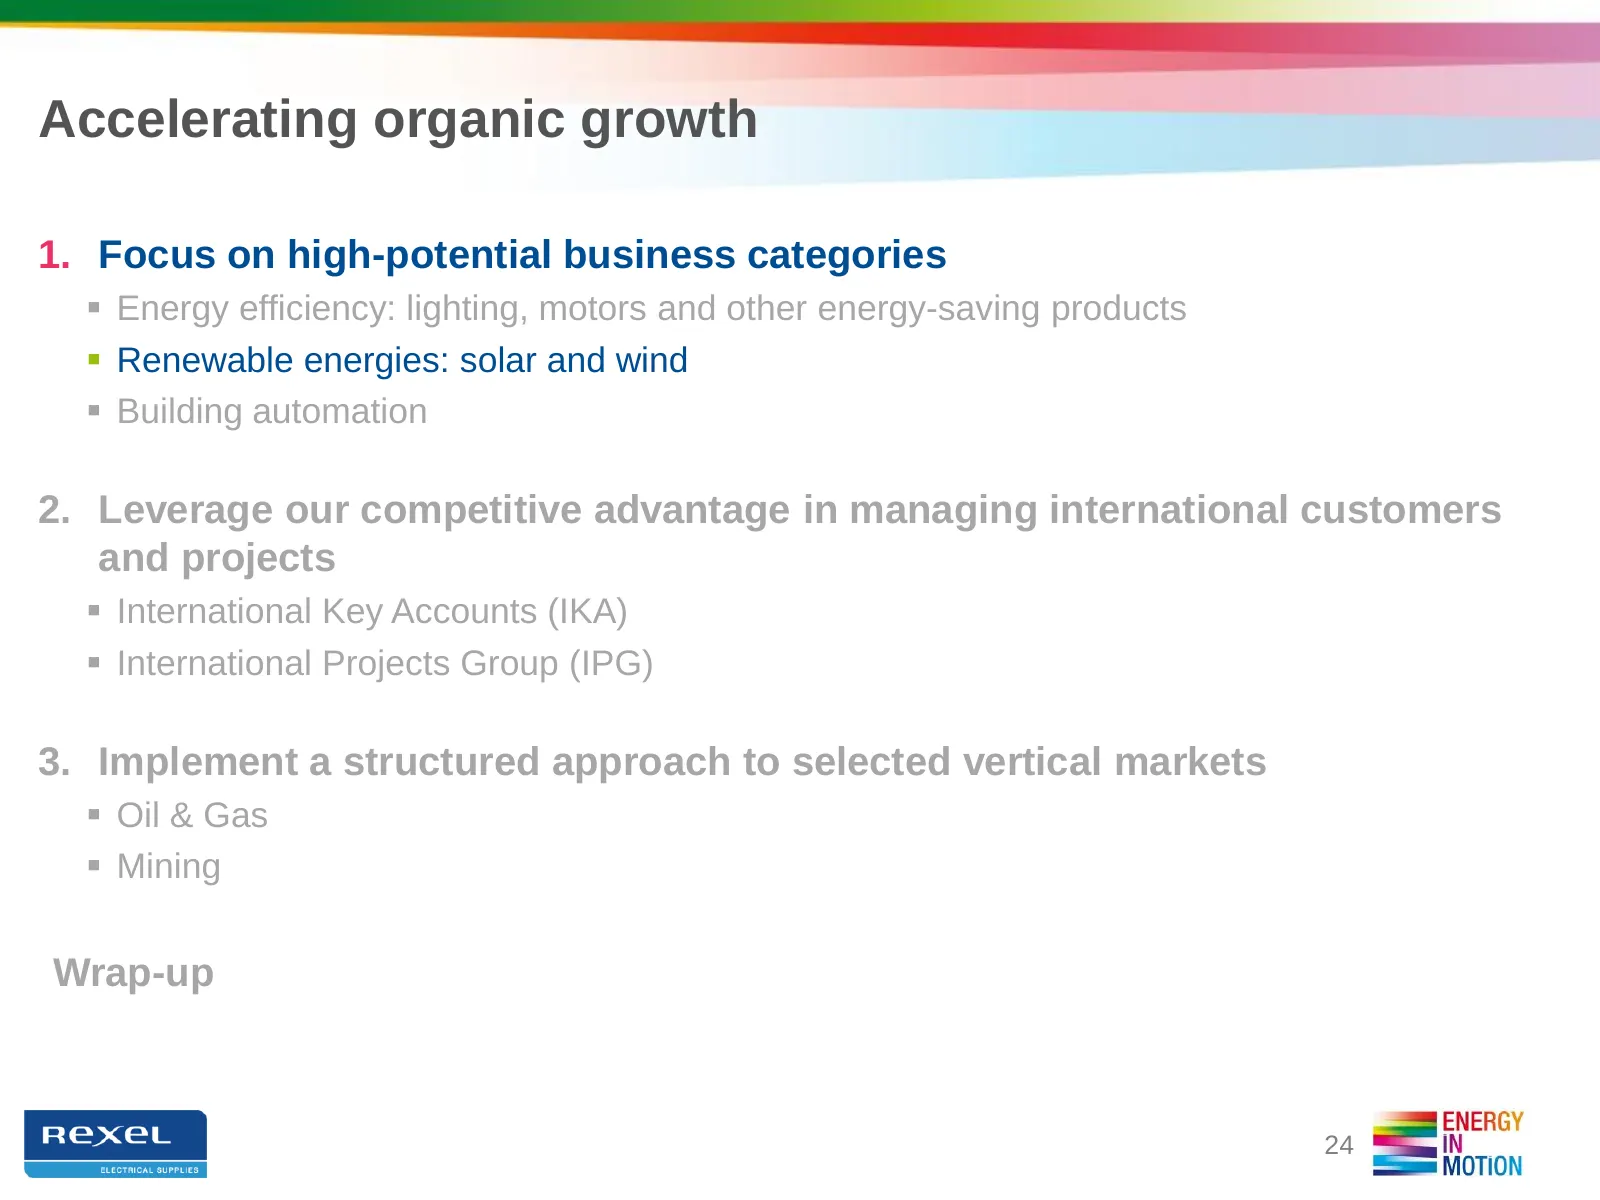
Slide 24: Accelerating organic growth
Accelerating organic growth 1. Focus on high-potential business categories Energy efficiency: lighting, motors and other energy-saving products Renewable energies: solar and wind Building automation 2. Leverage our competitive advantage in managing international customers and projects Intern
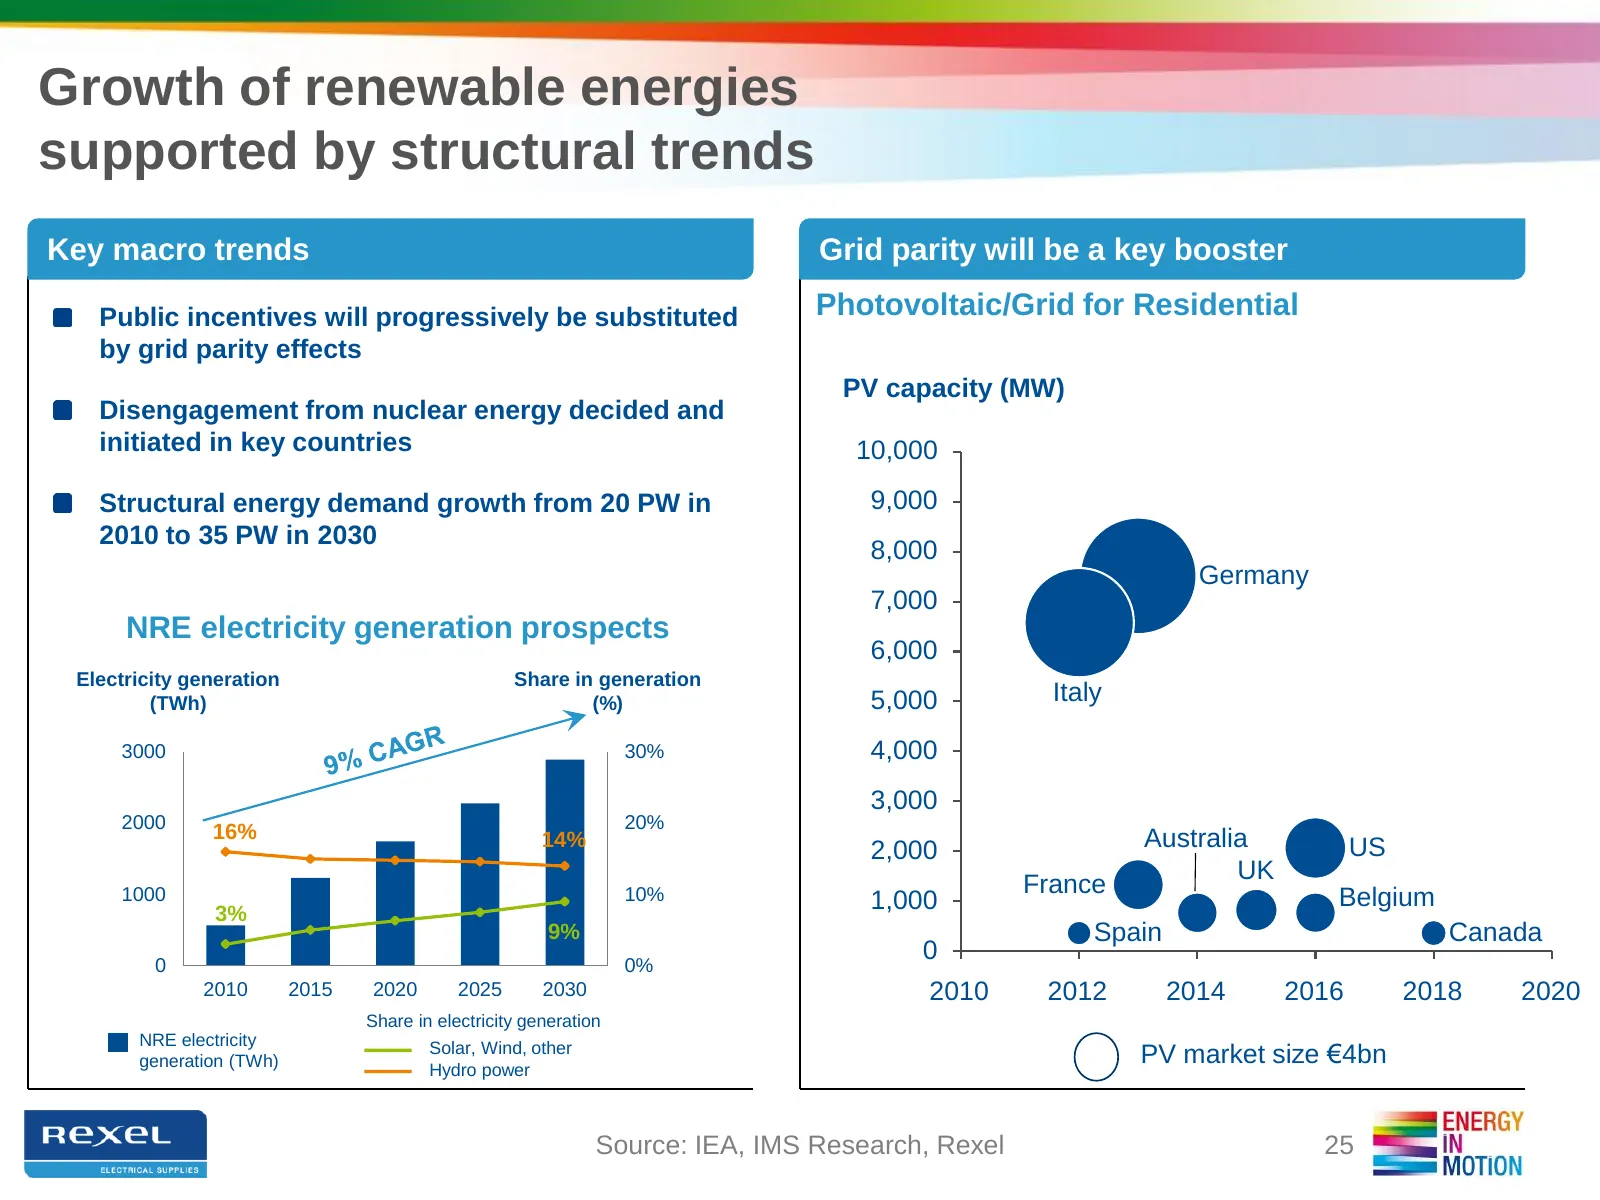
Slide 25: Growth of renewable energies supported by structural trends
Growth of renewable energies supported by structural trends Key macro trends Grid parity will be a key booster Public incentives will progressively be substituted Photovoltaic/Grid for Residential by grid parity effects PV capacity (MW) Disengagement from nuclear energy decided and initiated in key
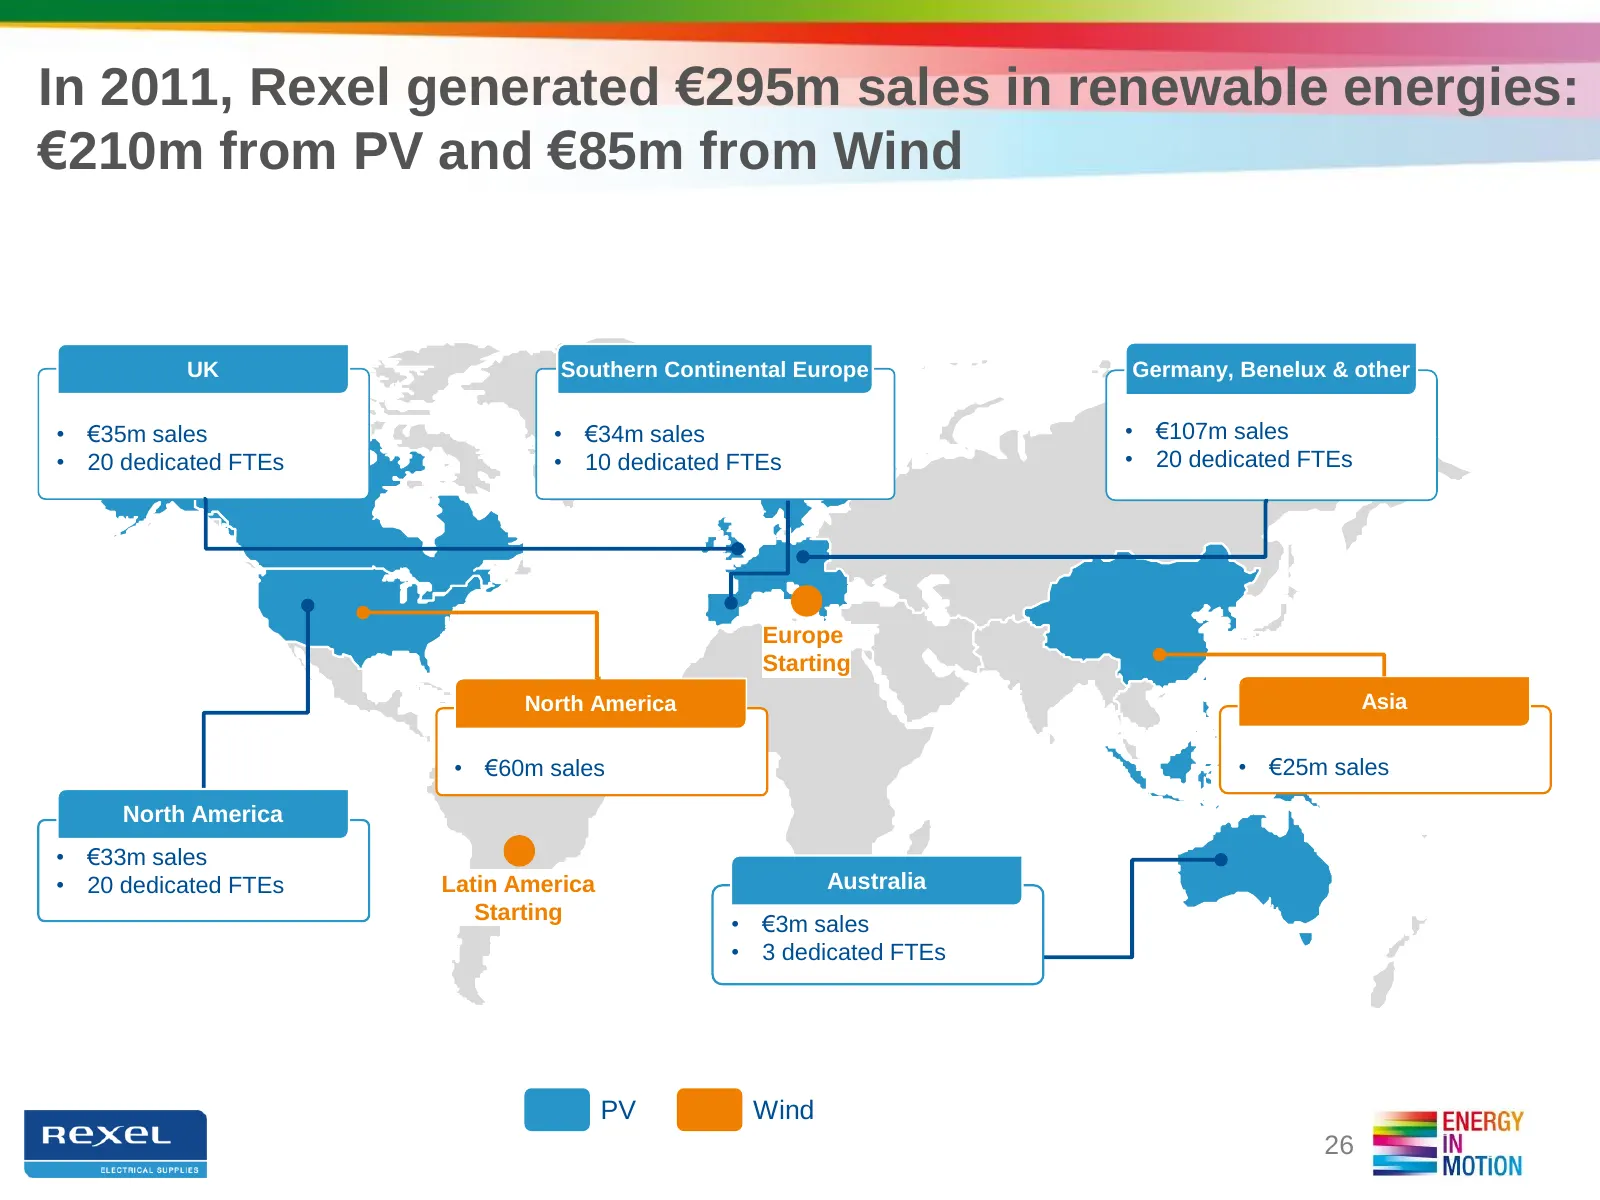
Slide 26: In 2011, Rexel generated €295m sales in renewable energies
In 2011, Rexel generated €295m sales in renewable energies: €210m from PV and €85m from Wind UK Southern Continental Europe Germany, Benelux & other • €35m sales • €34m sales • €107m sales • 20 dedicated FTEs • 10 dedicated FTEs • 20 dedicated FTEs Europe Starting North America Asia • €60m sales • €
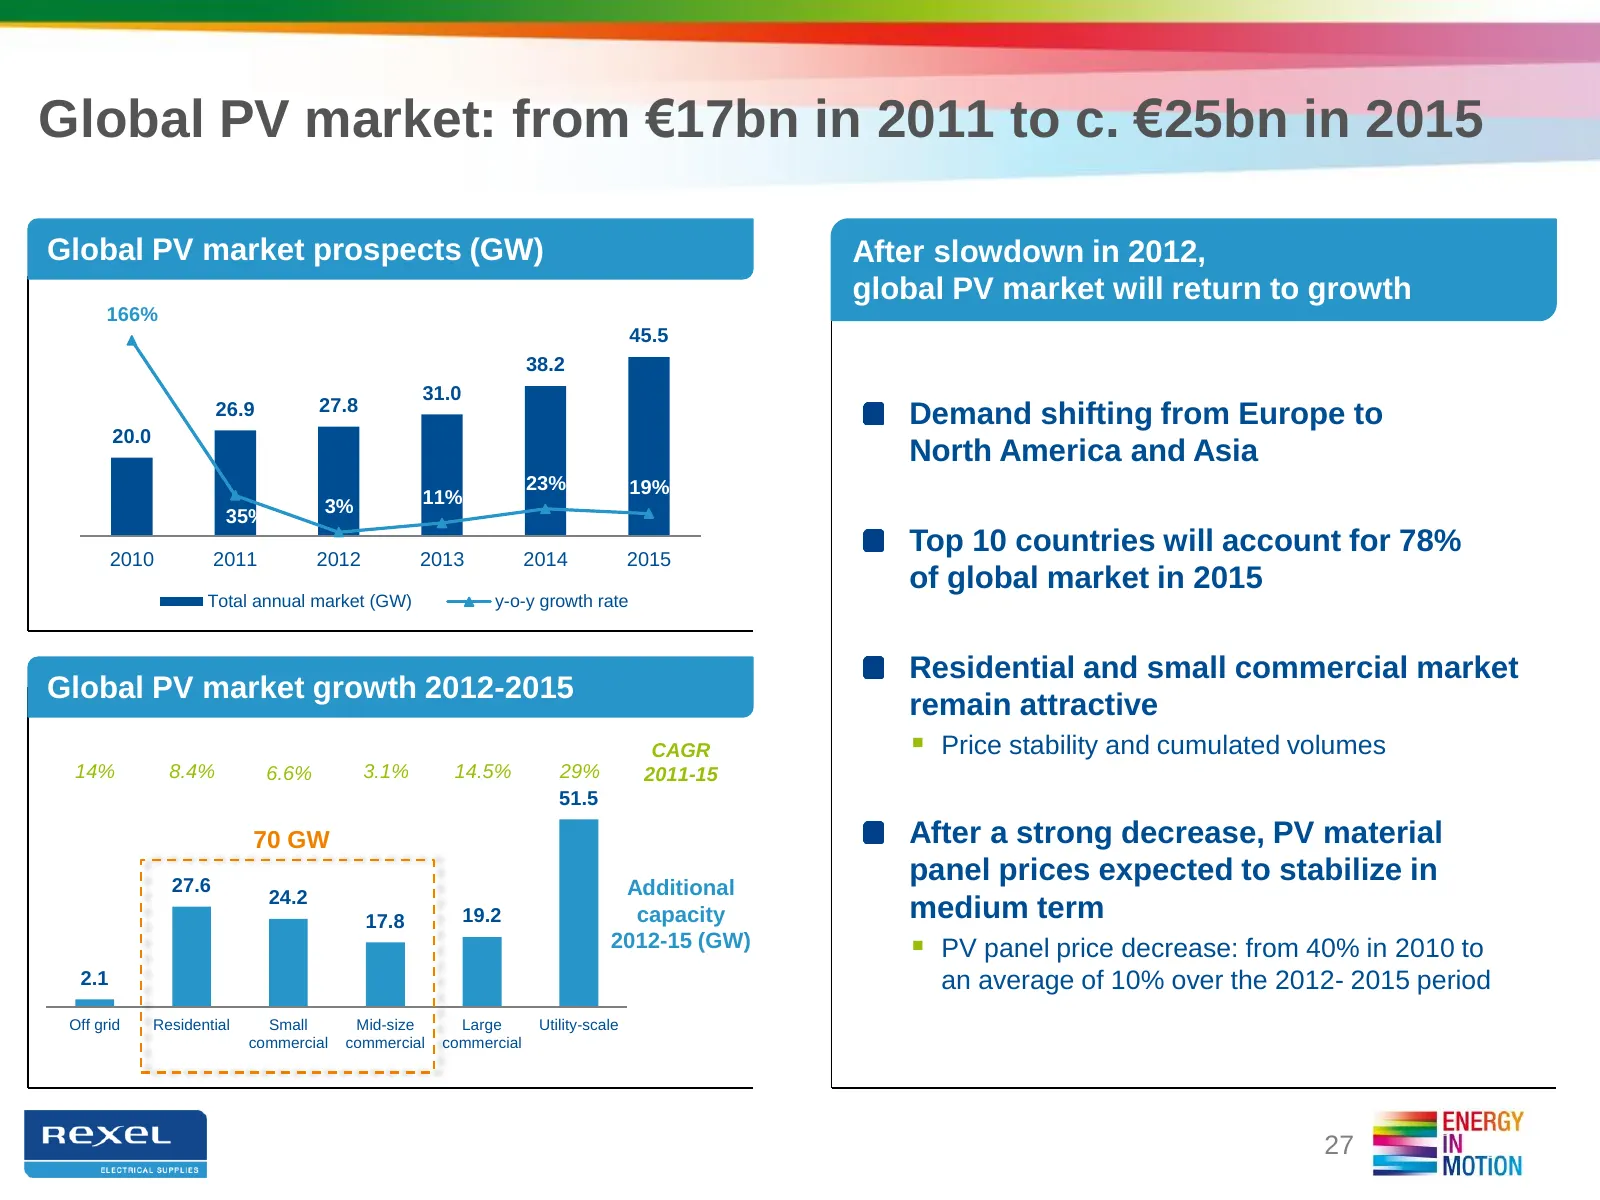
Slide 27: Global PV market: from €17bn in 2011 to c. €25bn in 2015
Global PV market: from €17bn in 2011 to c. €25bn in 2015 Global PV market prospects (GW) After slowdown in 2012, global PV market will return to growth 166% 45.5 38.2 31.0 27.8 26.9 Demand shifting from Europe to 20.0 North America and Asia 23% 19% 3% 11% 35% Top 10 countries will account for 78% 20
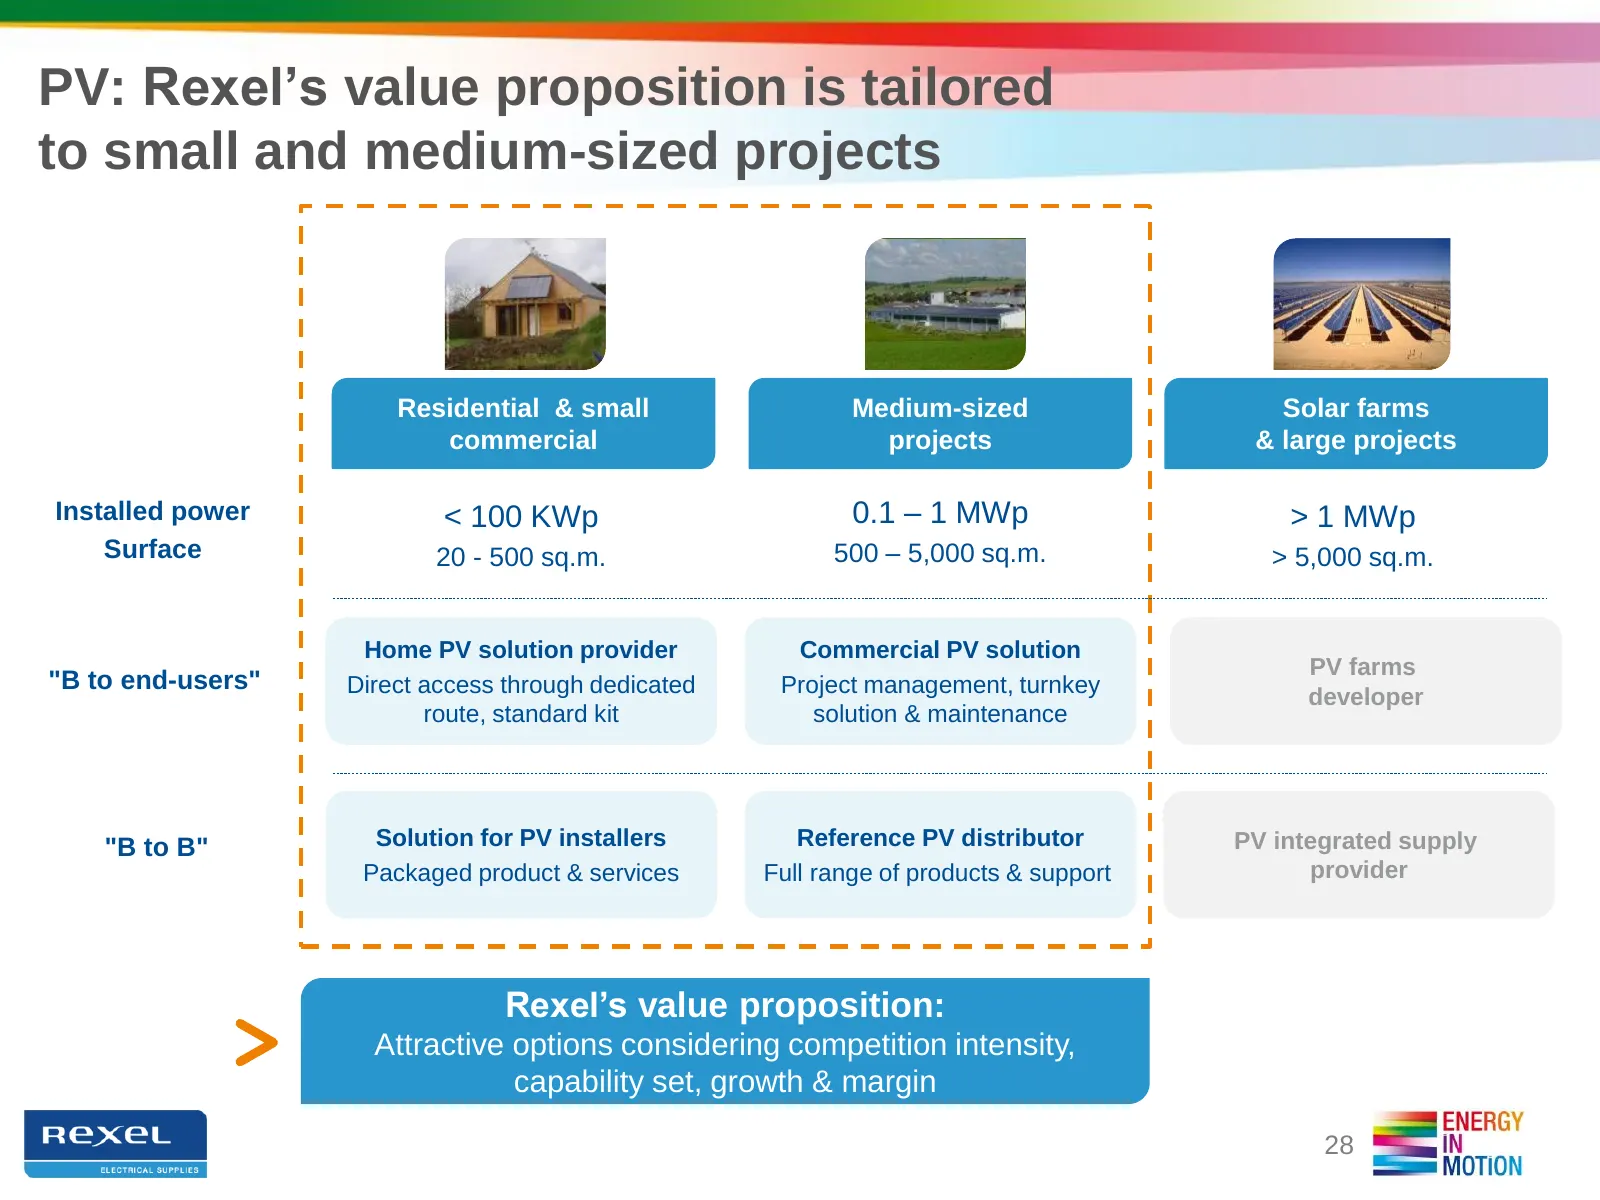
Slide 28: PV: Rexel's value proposition tailored to small and medium-sized projects
PV: Rexel’s value proposition is tailored to small and medium-sized projects Residential & small Medium-sized Solar farms commercial projects & large projects Installed power < 100 KWp 0.1 – 1 MWp > 1 MWp Surface 20 - 500 sq.m. 500 – 5,000 sq.m. > 5,000 sq.m. Home PV solution provider Commercial PV
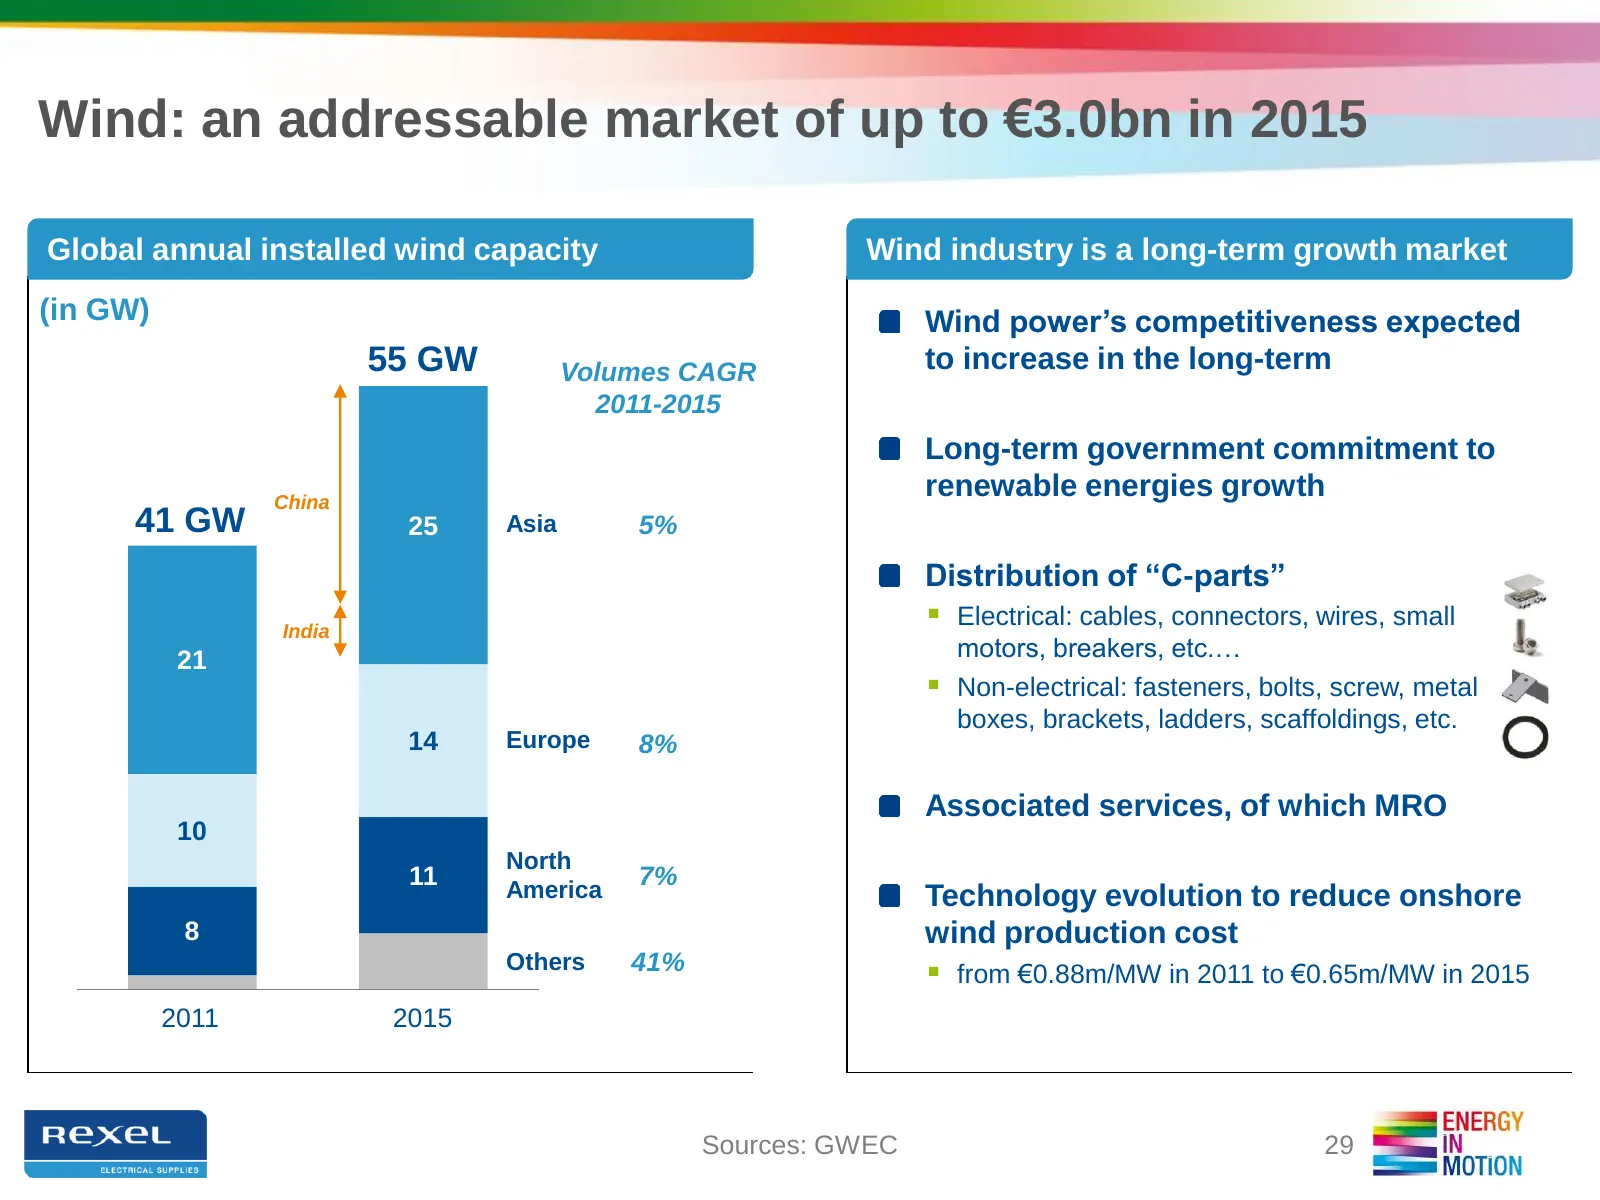
Slide 29: Wind: an addressable market of up to €3.0bn in 2015
Wind: an addressable market of up to €3.0bn in 2015 Global annual installed wind capacity Wind industry is a long-term growth market (in GW) Wind power’s competitiveness expected 55 GW Volumes CAGR to increase in the long-term 2011-2015 Long-term government commitment to China renewable energies gro
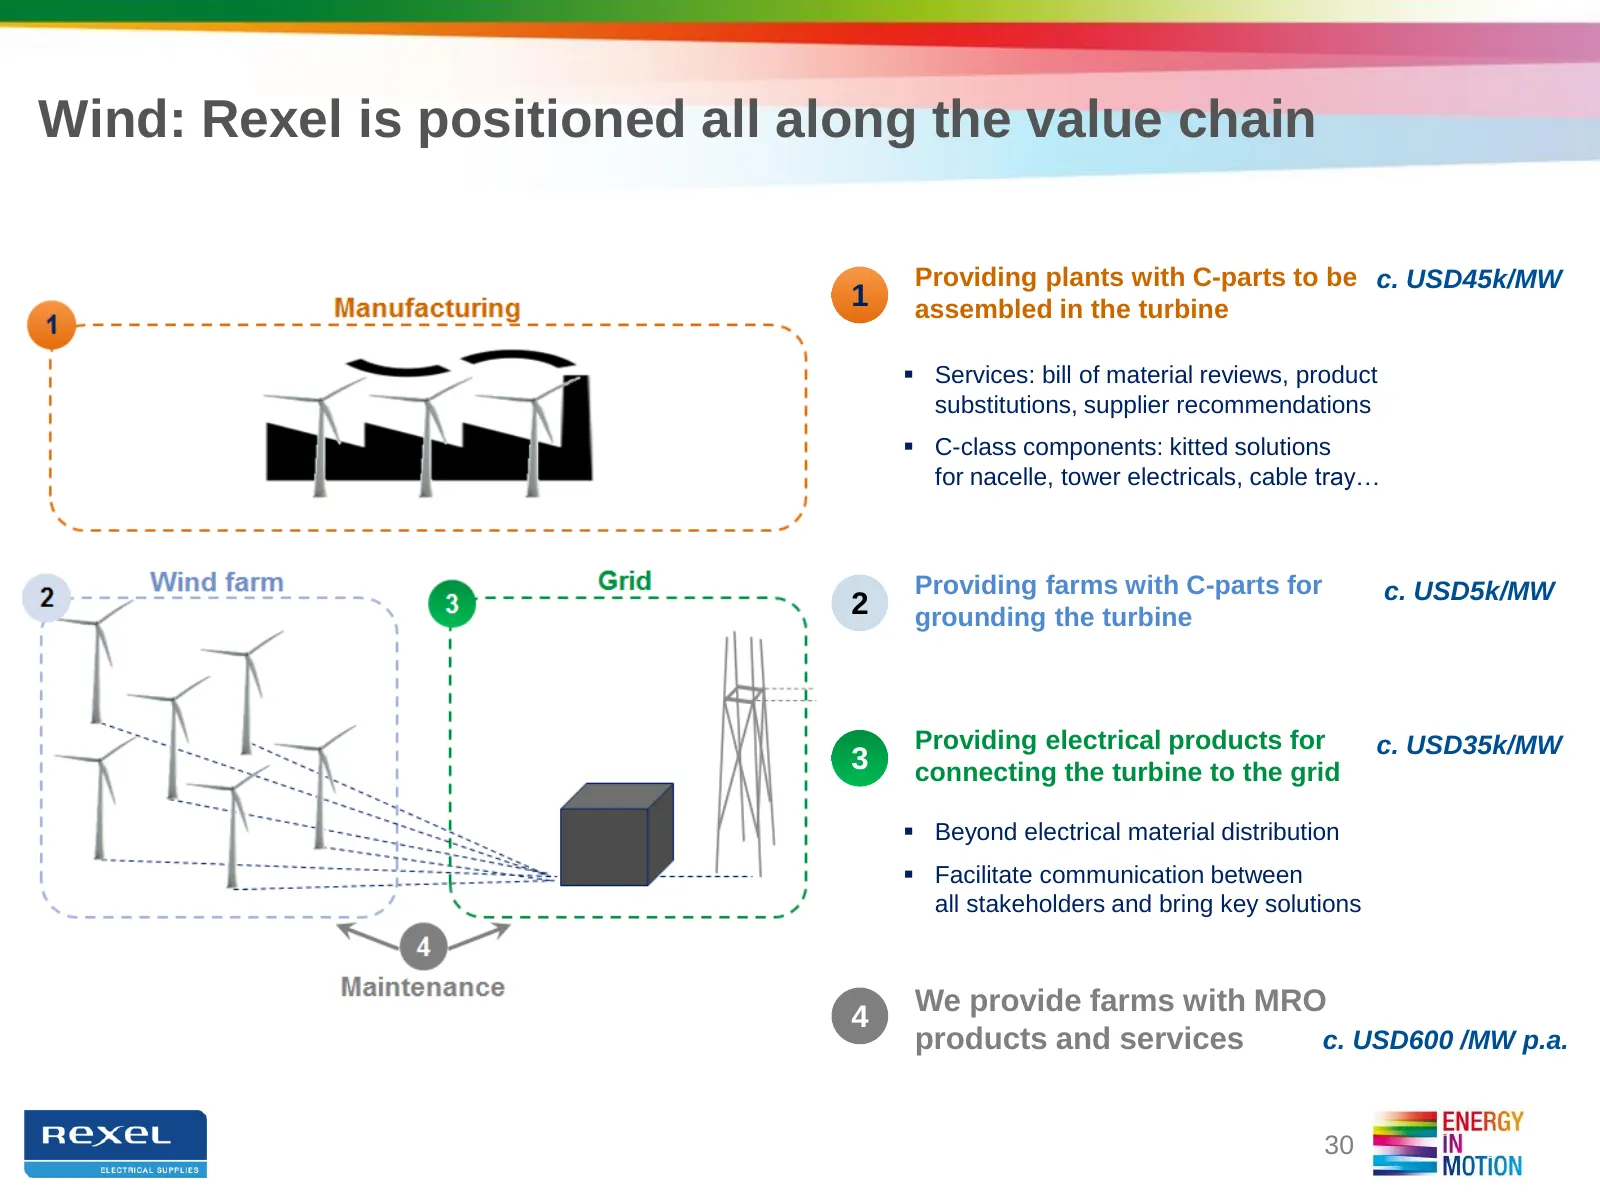
Slide 30: Wind: Rexel is positioned all along the value chain
Wind: Rexel is positioned all along the value chain Providing plants with C-parts to be c. USD45k/MW 1 assembled in the turbine Services: bill of material reviews, product substitutions, supplier recommendations C-class components: kitted solutions for nacelle, tower electricals, cable tray… Pro
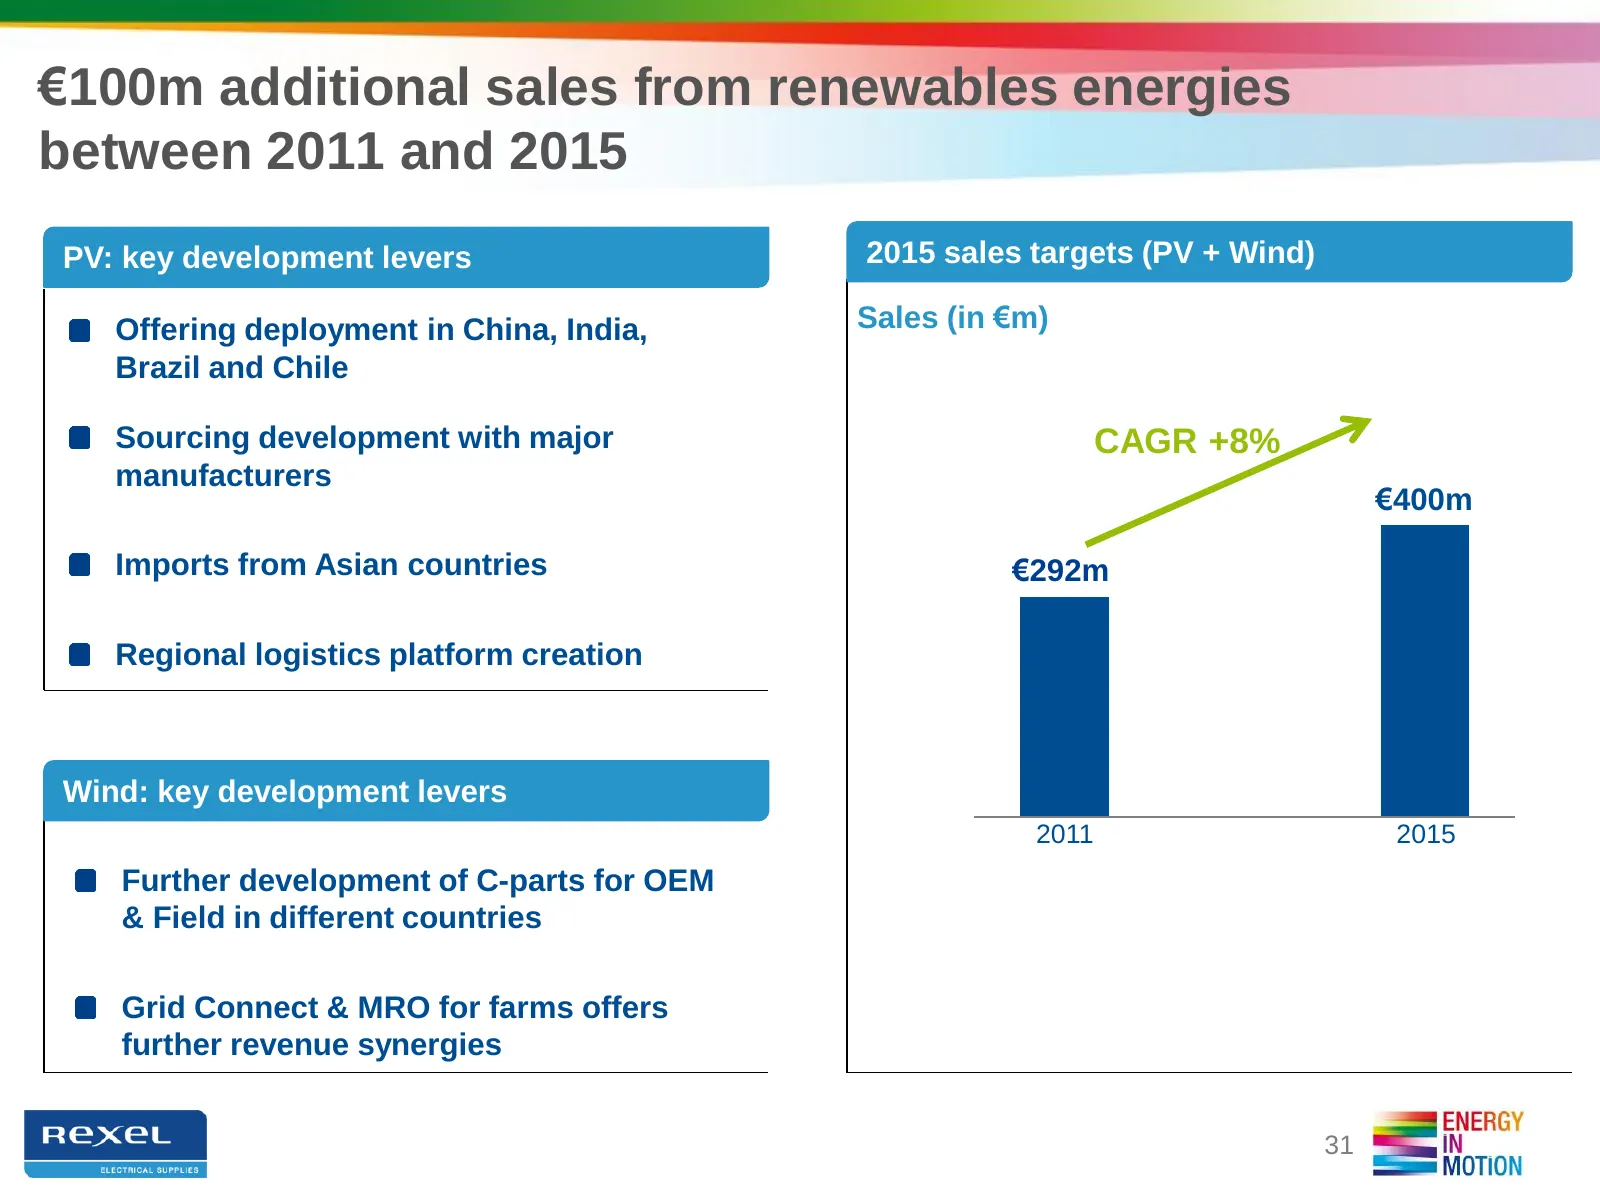
Slide 31: €100m additional sales from renewable energies
€100m additional sales from renewables energies between 2011 and 2015 PV: key development levers 2015 sales targets (PV + Wind) Offering deployment in China, India, Sales (in €m) Brazil and Chile Sourcing development with major CAGR +8% manufacturers €400m €292m Imports from Asian countries €292m Re
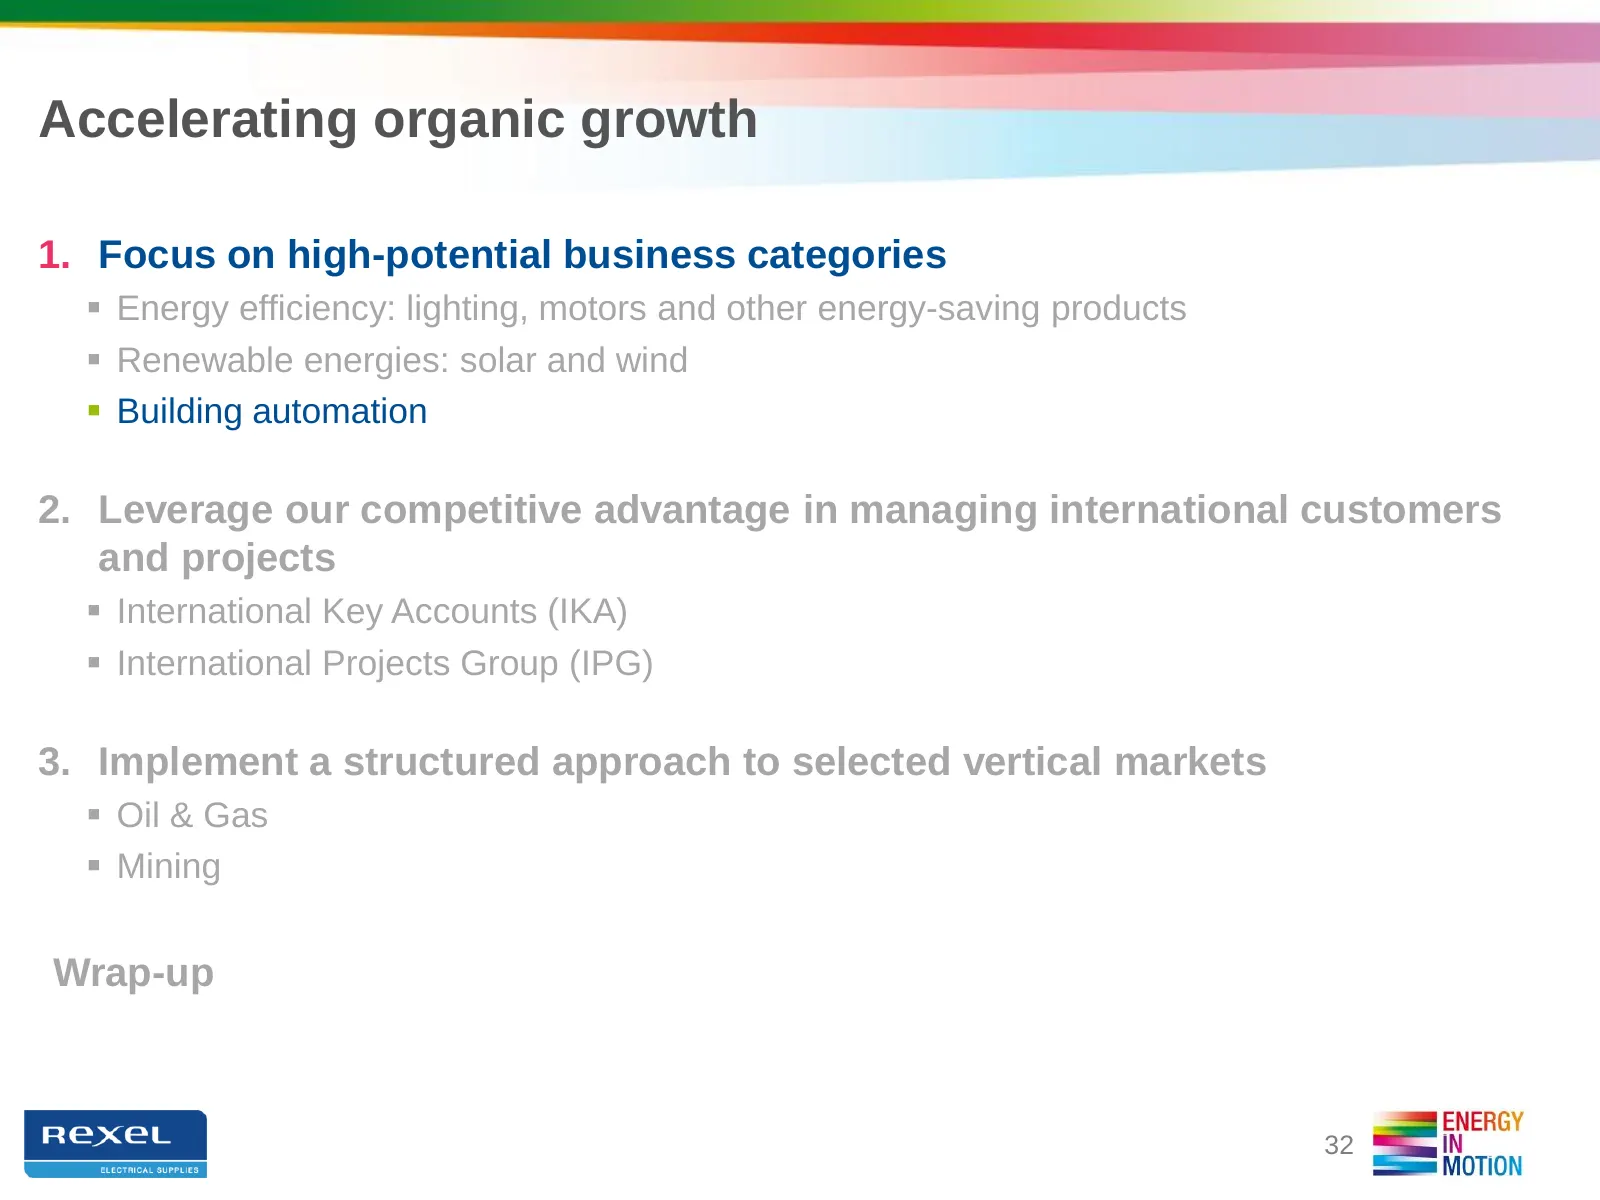
Slide 32: Accelerating organic growth
Accelerating organic growth 1. Focus on high-potential business categories Energy efficiency: lighting, motors and other energy-saving products Renewable energies: solar and wind Building automation 2. Leverage our competitive advantage in managing international customers and projects Intern
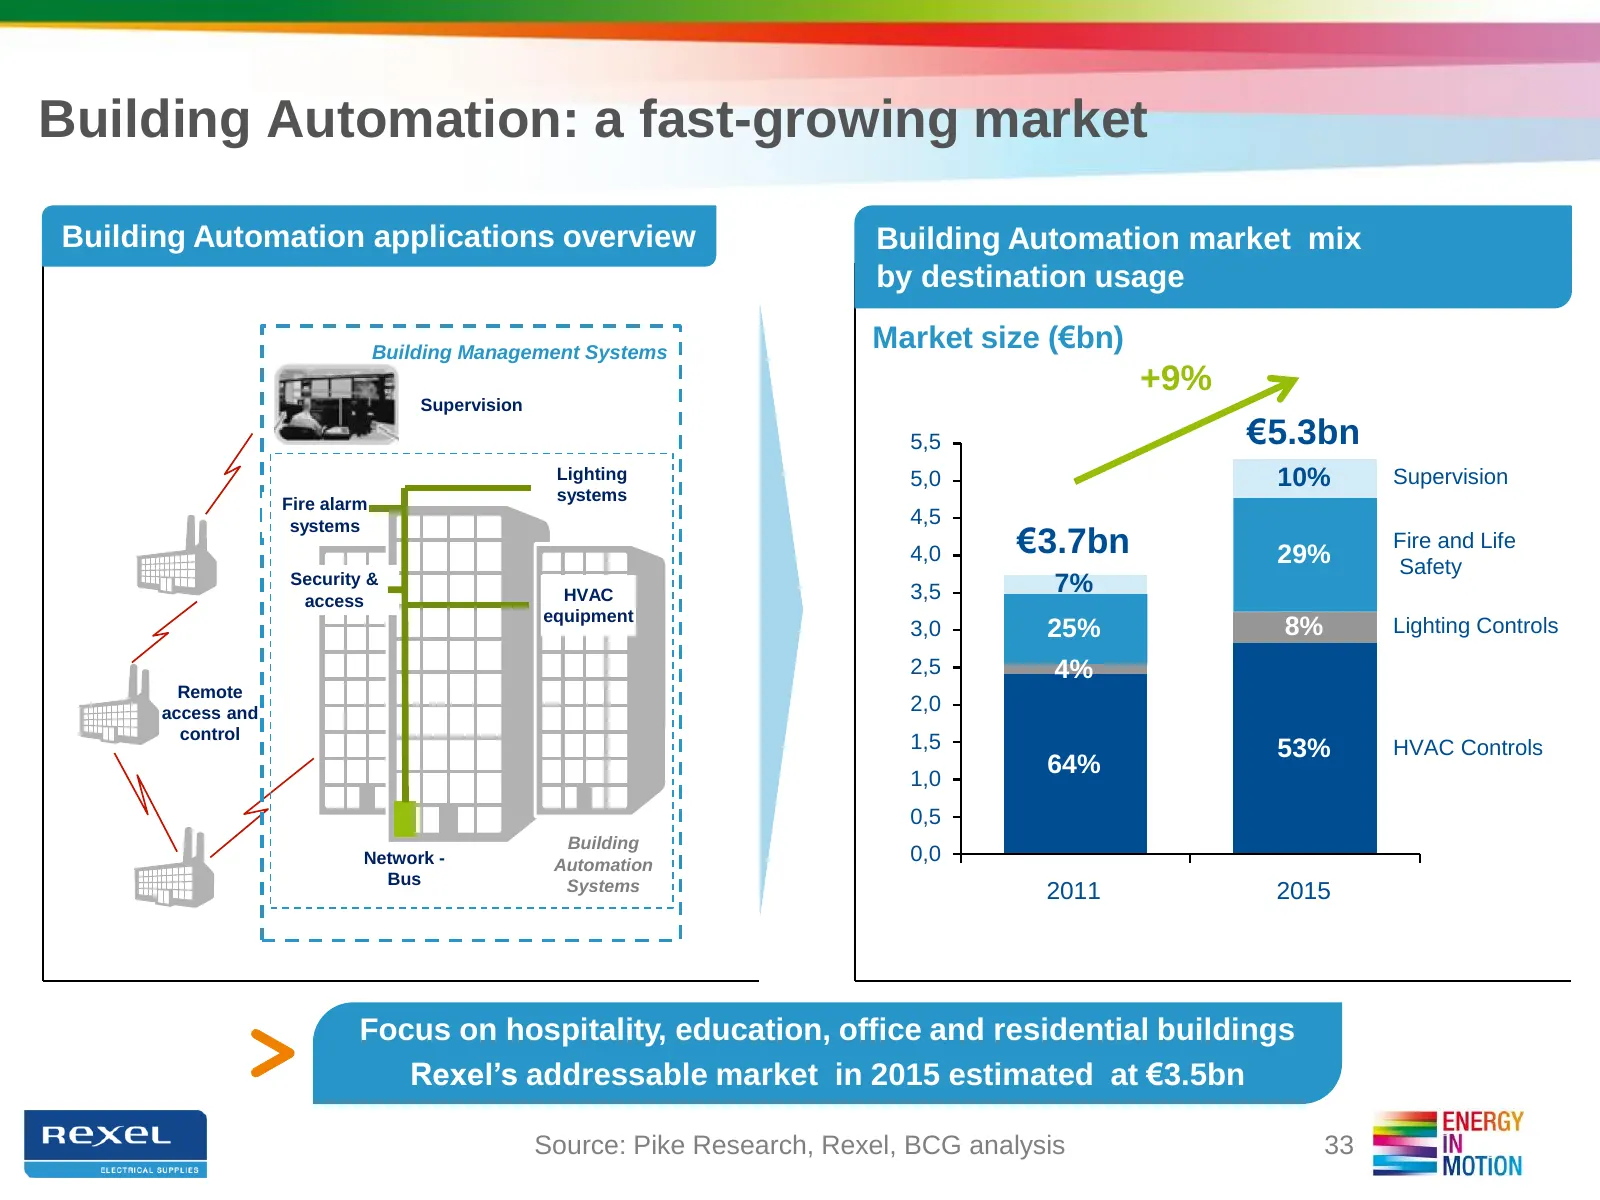
Slide 33: Building Automation: a fast-growing market
Building Automation: a fast-growing market Building Automation applications overview Building Automation market mix by destination usage Building Management Systems Market size (€bn) +9% Supervision 5,5 €5.3bn Lighting 5,0 10% Supervision systems Fire alarm systems 4,5 4,0 €3.7bn 29% Fire and Life S
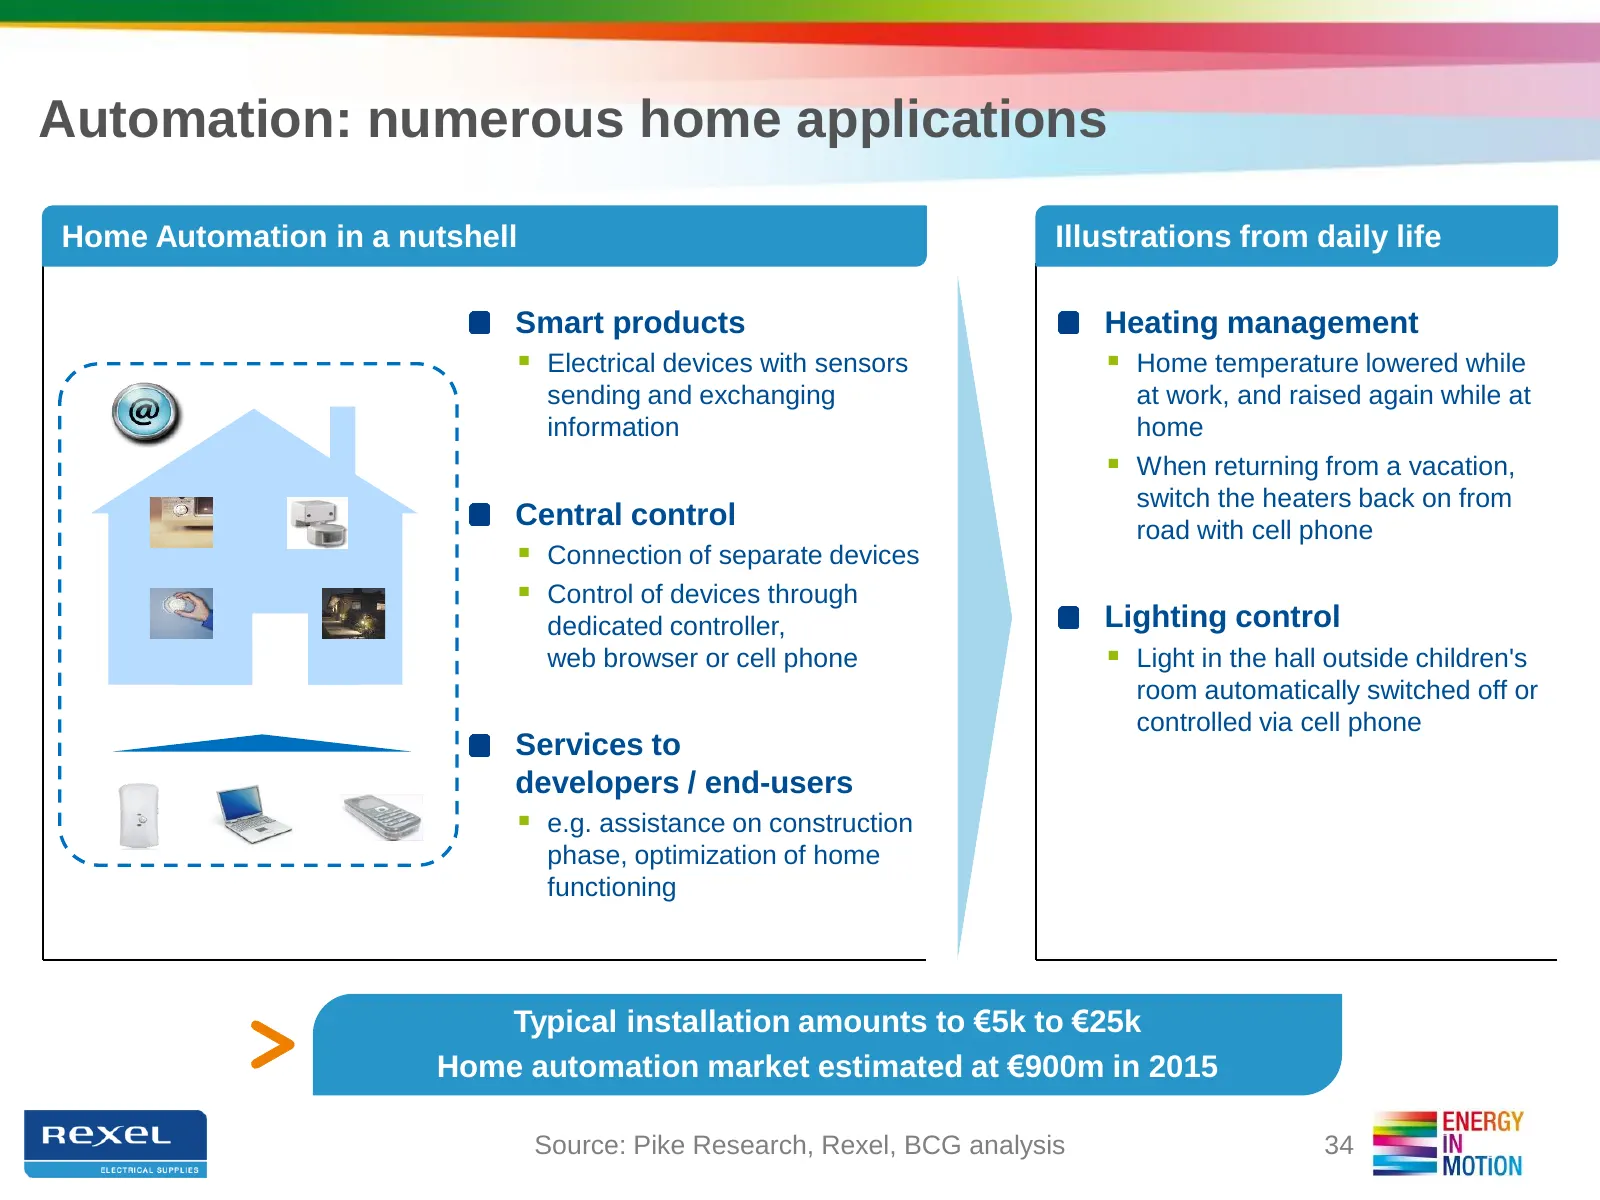
Slide 34: Automation: numerous home applications
Automation: numerous home applications Home Automation in a nutshell Illustrations from daily life Smart products Heating management Electrical devices with sensors Home temperature lowered while sending and exchanging at work, and raised again while at information home When returning from a v
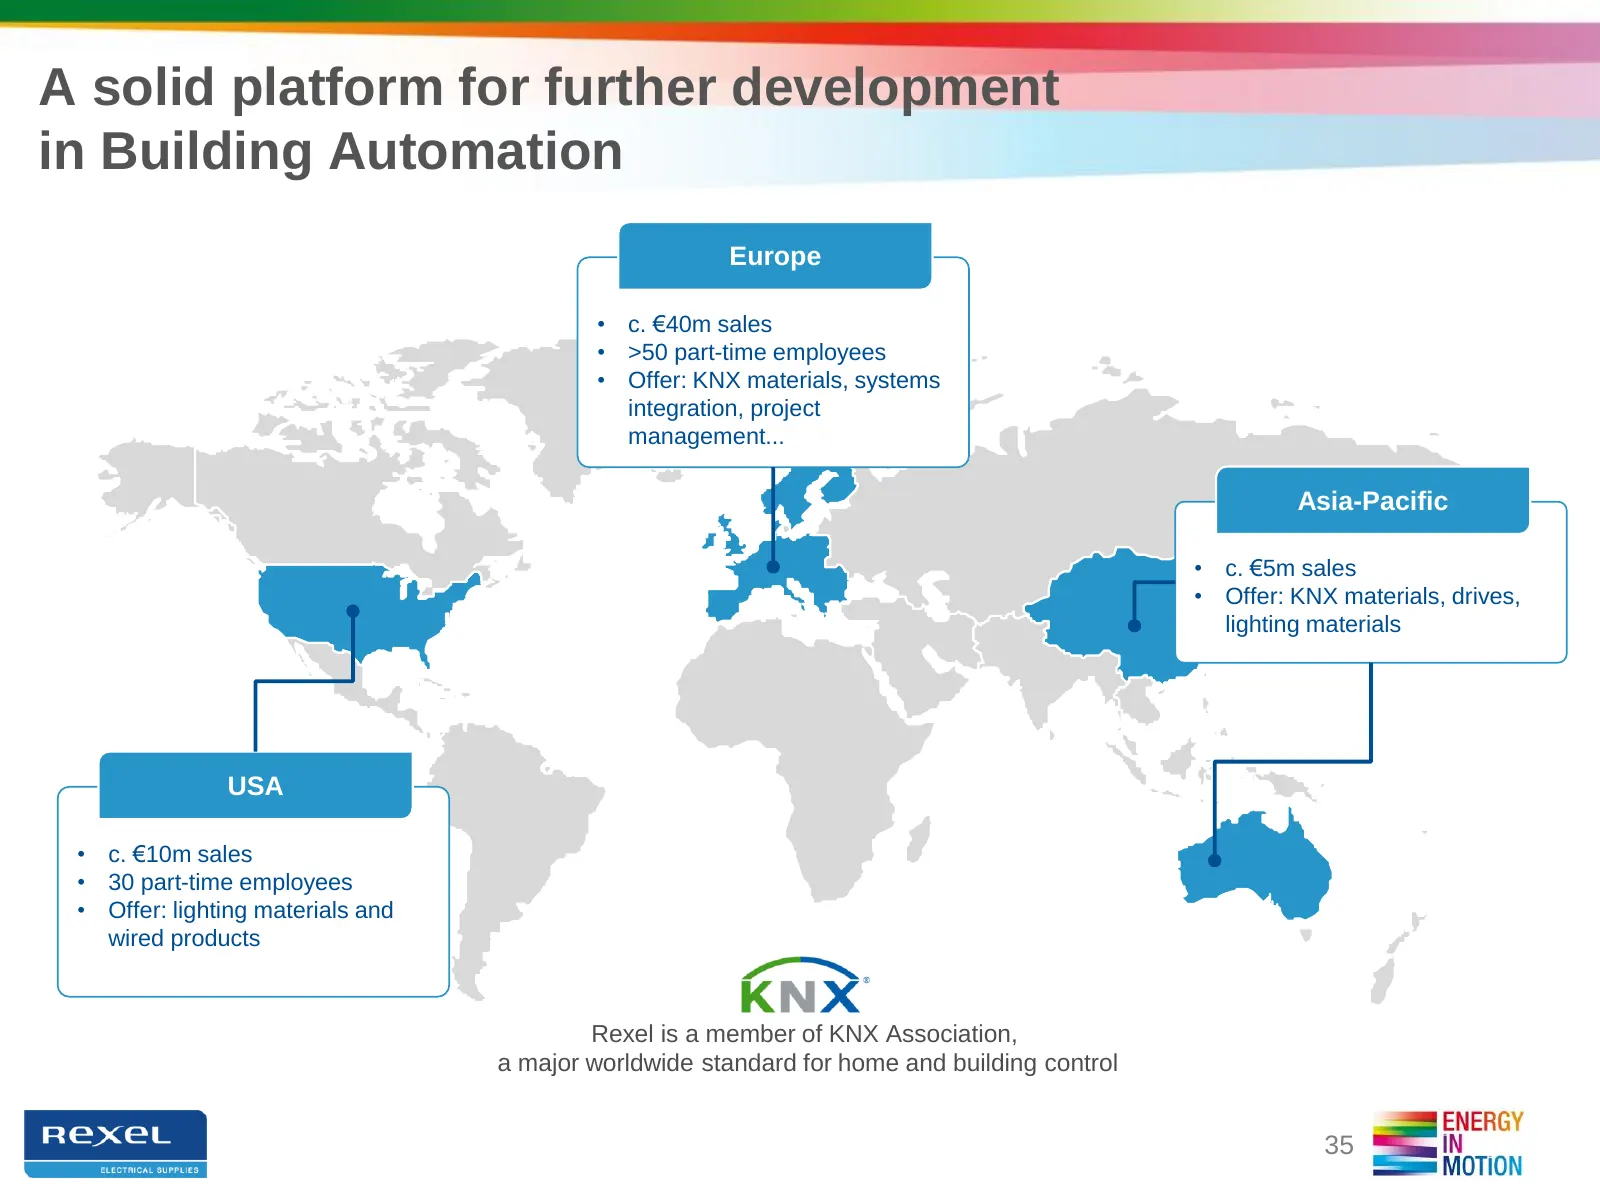
Slide 35: A solid platform for further development in Building Automation
A solid platform for further development in Building Automation Europe • c. €40m sales • >50 part-time employees • Offer: KNX materials, systems integration, project management... Asia-Pacific • c. €5m sales • Offer: KNX materials, drives, lighting materials USA • c. €10m sales • 30 part-time employ
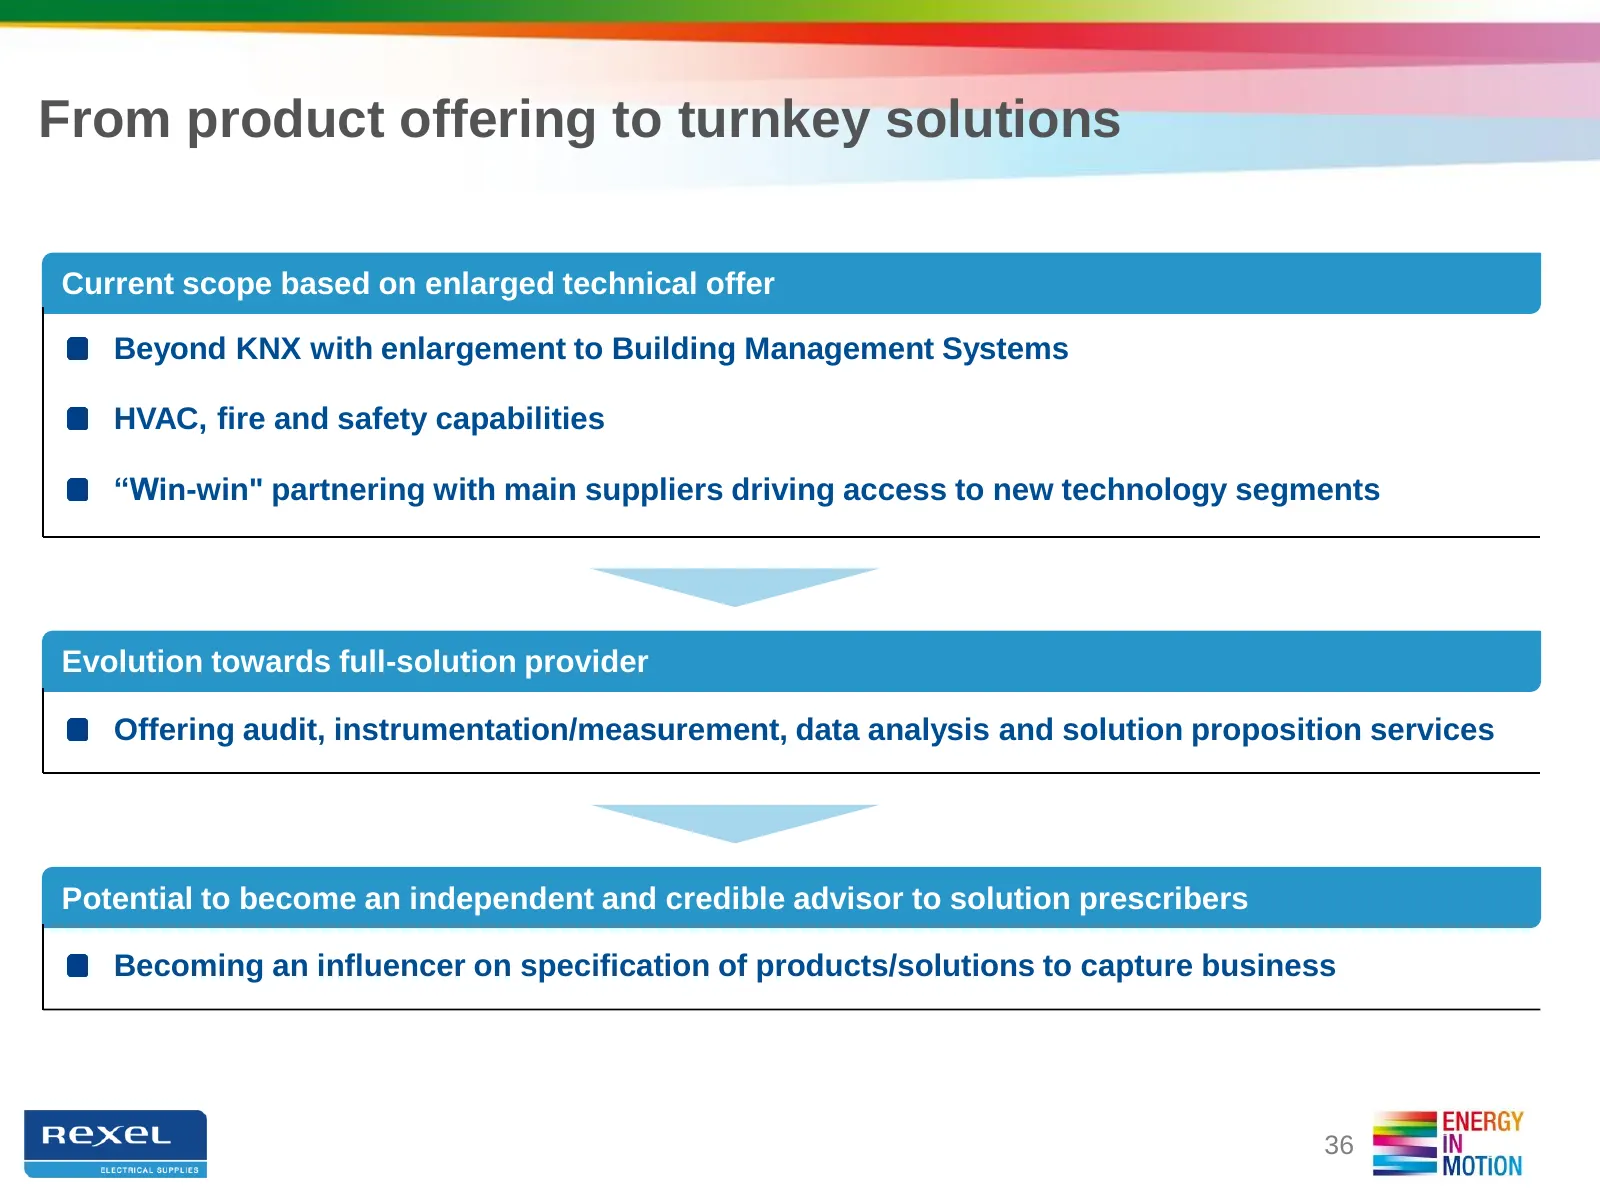
Slide 36: From product offering to turnkey solutions
From product offering to turnkey solutions Current scope based on enlarged technical offer Beyond KNX with enlargement to Building Management Systems HVAC, fire and safety capabilities “Win-win" partnering with main suppliers driving access to new technology segments Evolution towards full-solution
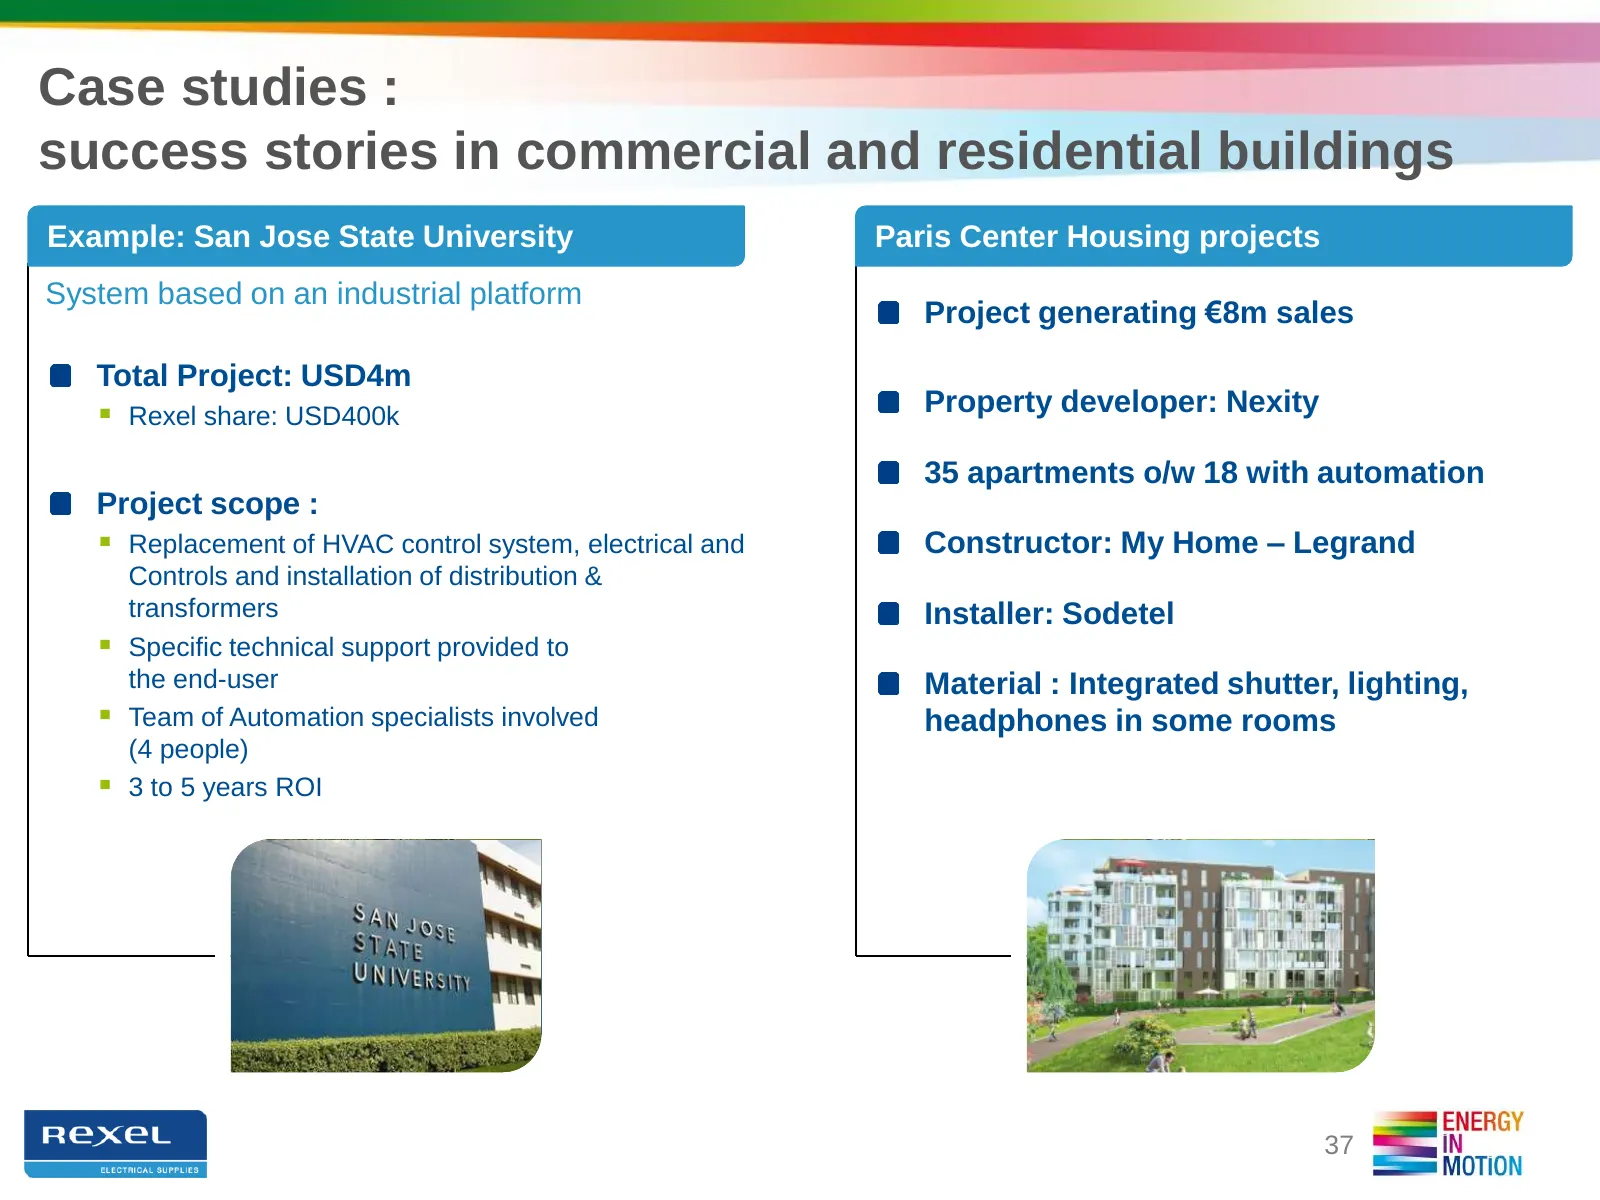
Slide 37: Case studies: success stories in commercial and residential buildings
Case studies : success stories in commercial and residential buildings Example: San Jose State University Paris Center Housing projects System based on an industrial platform Project generating €8m sales Total Project: USD4m Rexel share: USD400k Property developer: Nexity 35 apartments o/w 18 with
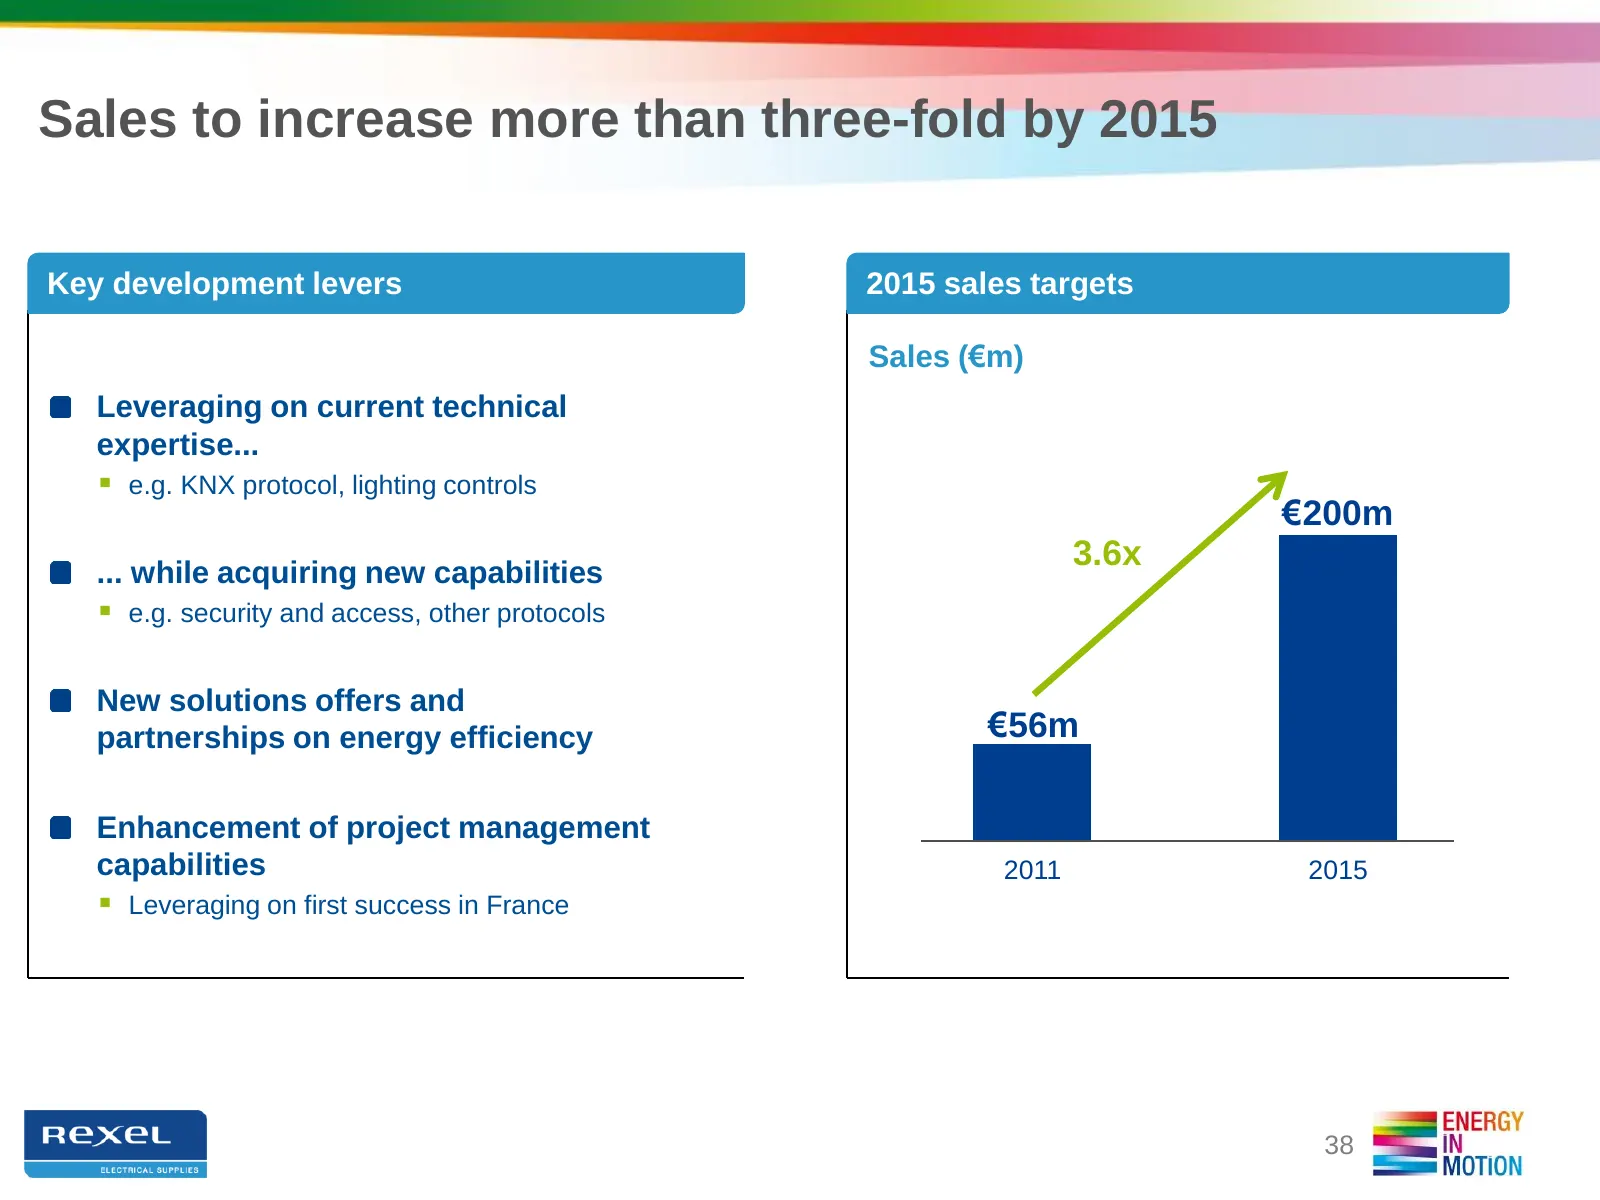
Slide 38: Sales to increase more than three-fold by 2015
Sales to increase more than three-fold by 2015 Key development levers 2015 sales targets Sales (€m) Leveraging on current technical expertise... e.g. KNX protocol, lighting controls €200m ... while acquiring new capabilities 3.6x e.g. security and access, other protocols New solutions offers and
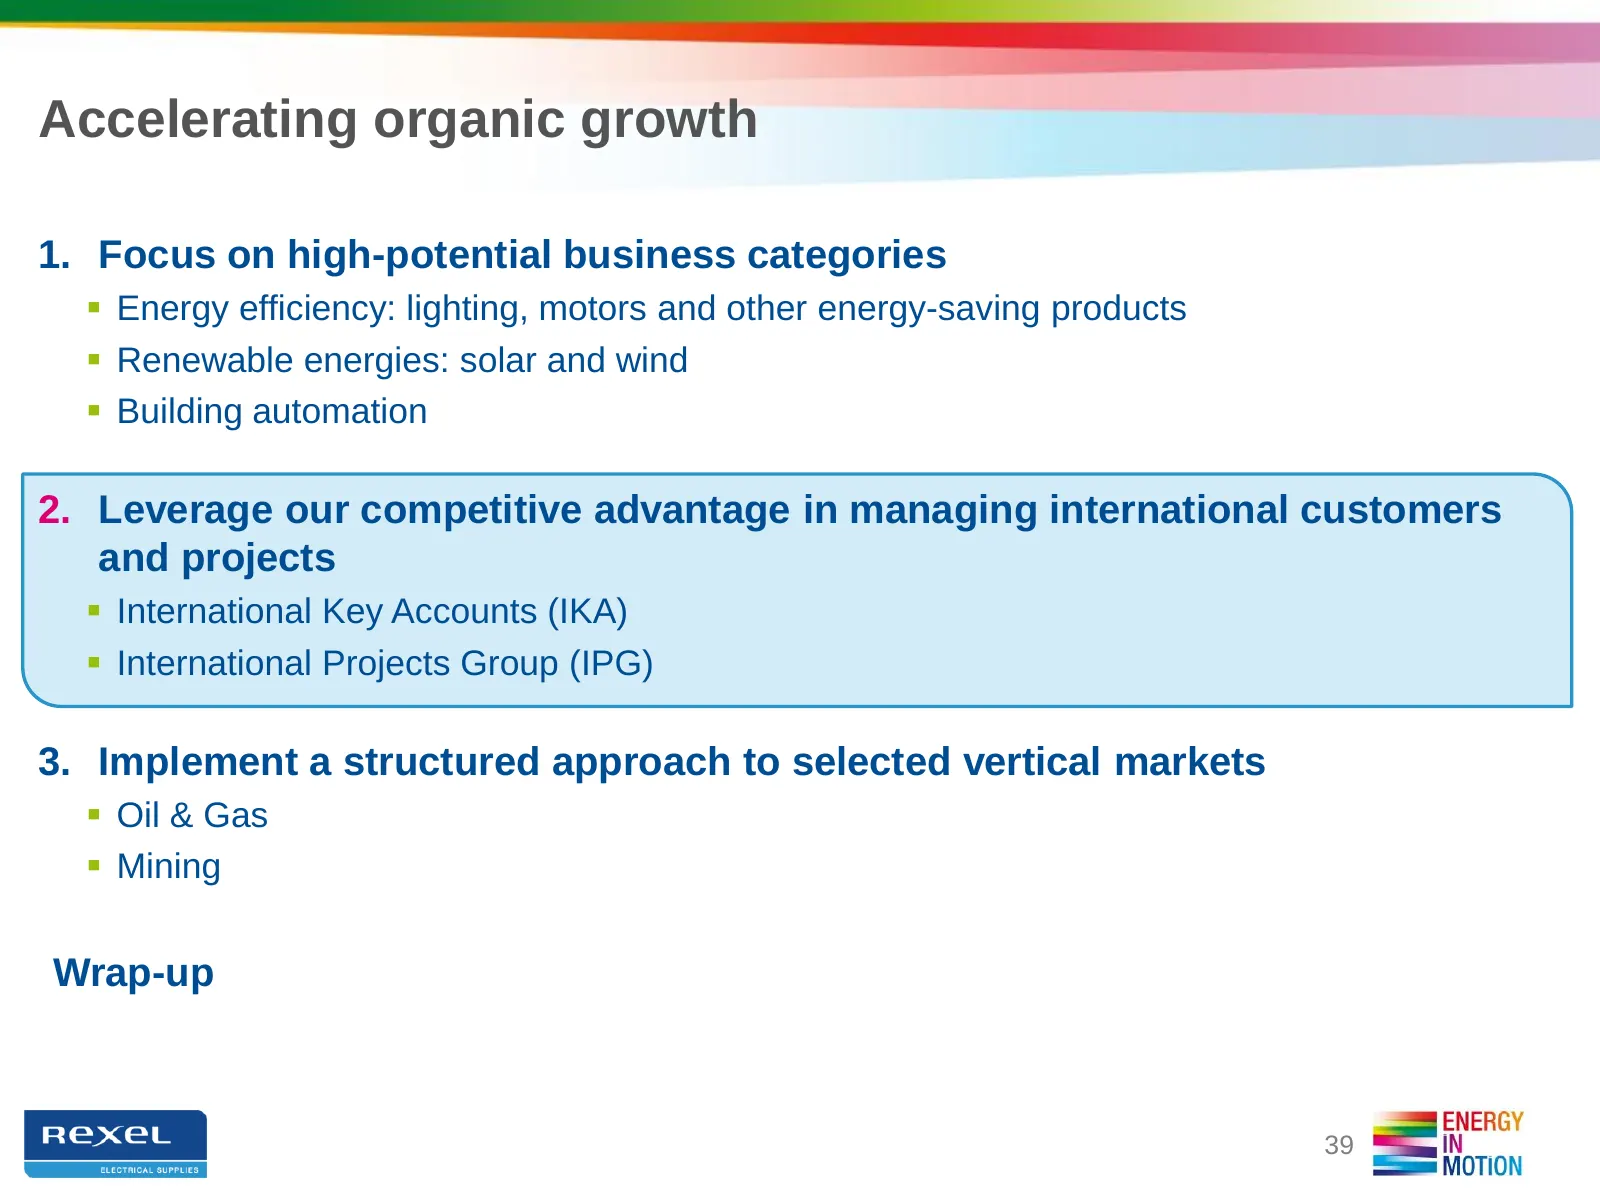
Slide 39: Accelerating organic growth
Accelerating organic growth 1. Focus on high-potential business categories Energy efficiency: lighting, motors and other energy-saving products Renewable energies: solar and wind Building automation 2. Leverage our competitive advantage in managing international customers and projects Intern
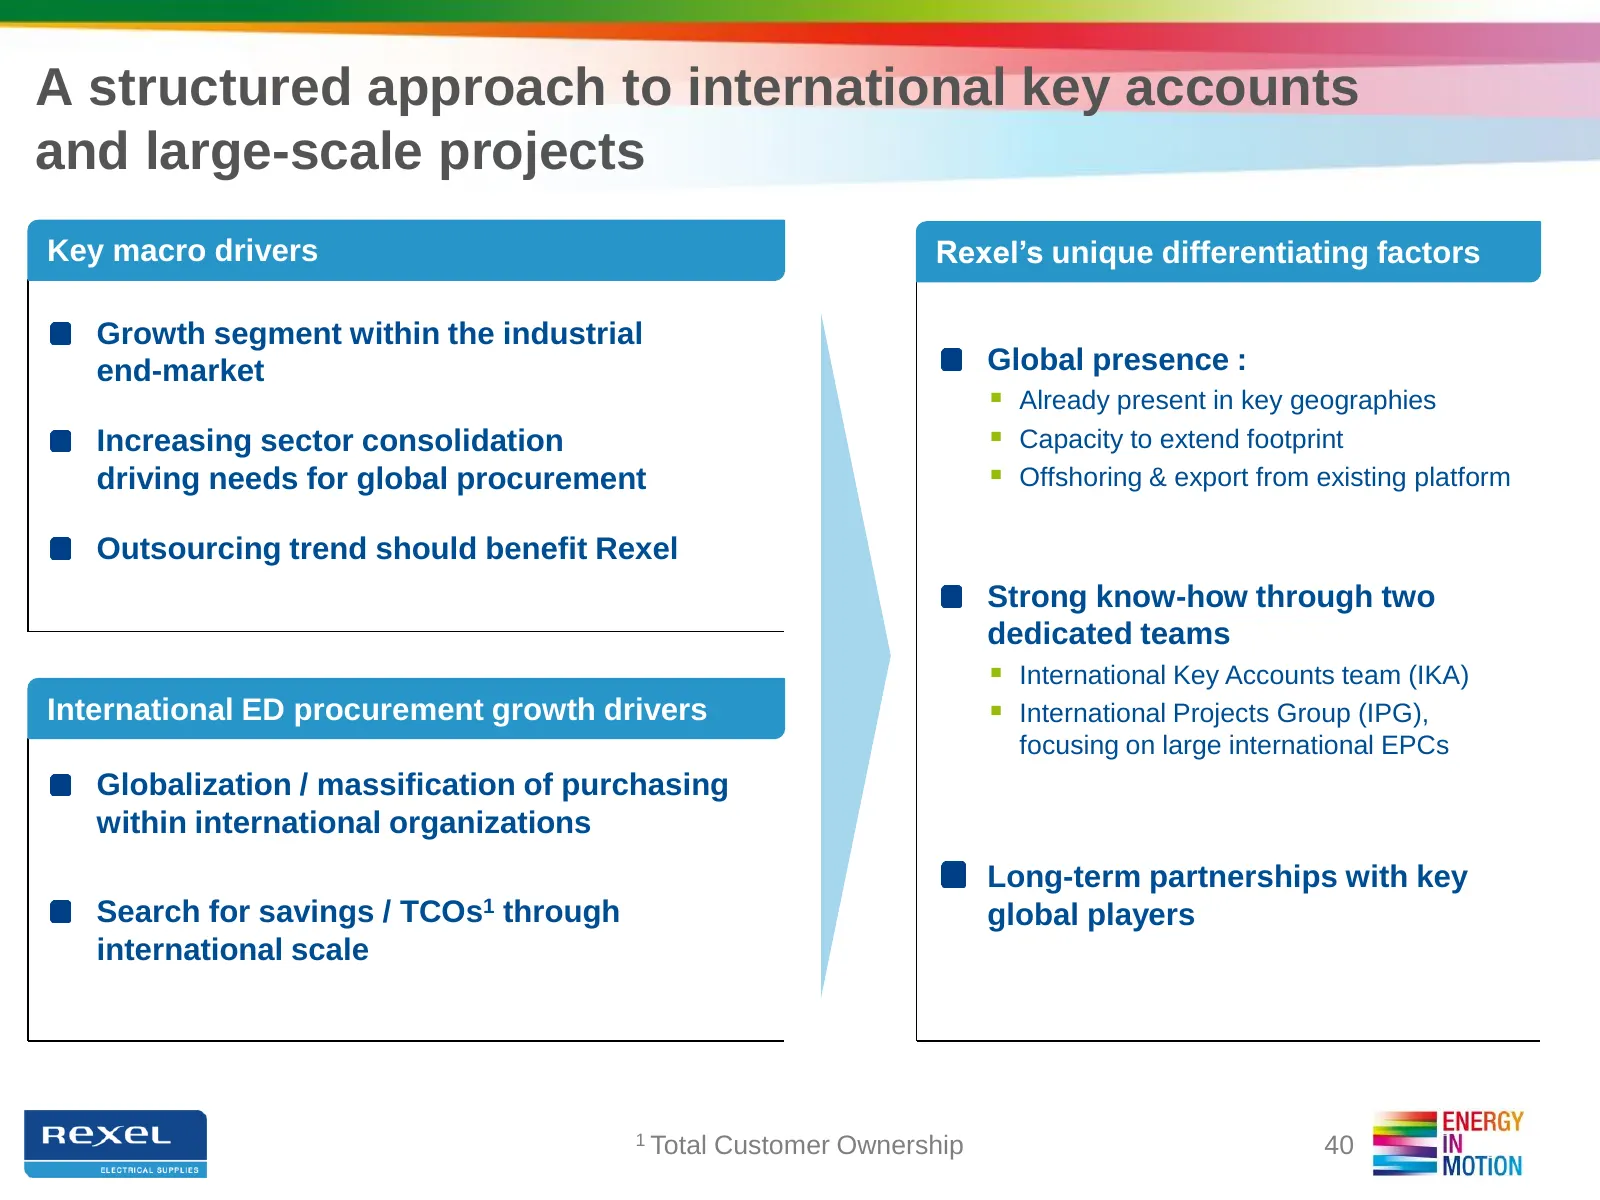
Slide 40: A structured approach to international key accounts and large-scale projects
A structured approach to international key accounts and large-scale projects Key macro drivers Rexel’s unique differentiating factors Growth segment within the industrial end-market Global presence : Already present in key geographies Increasing sector consolidation Capacity to extend footprint
Slide 41: In-depth partnerships with key global accounts
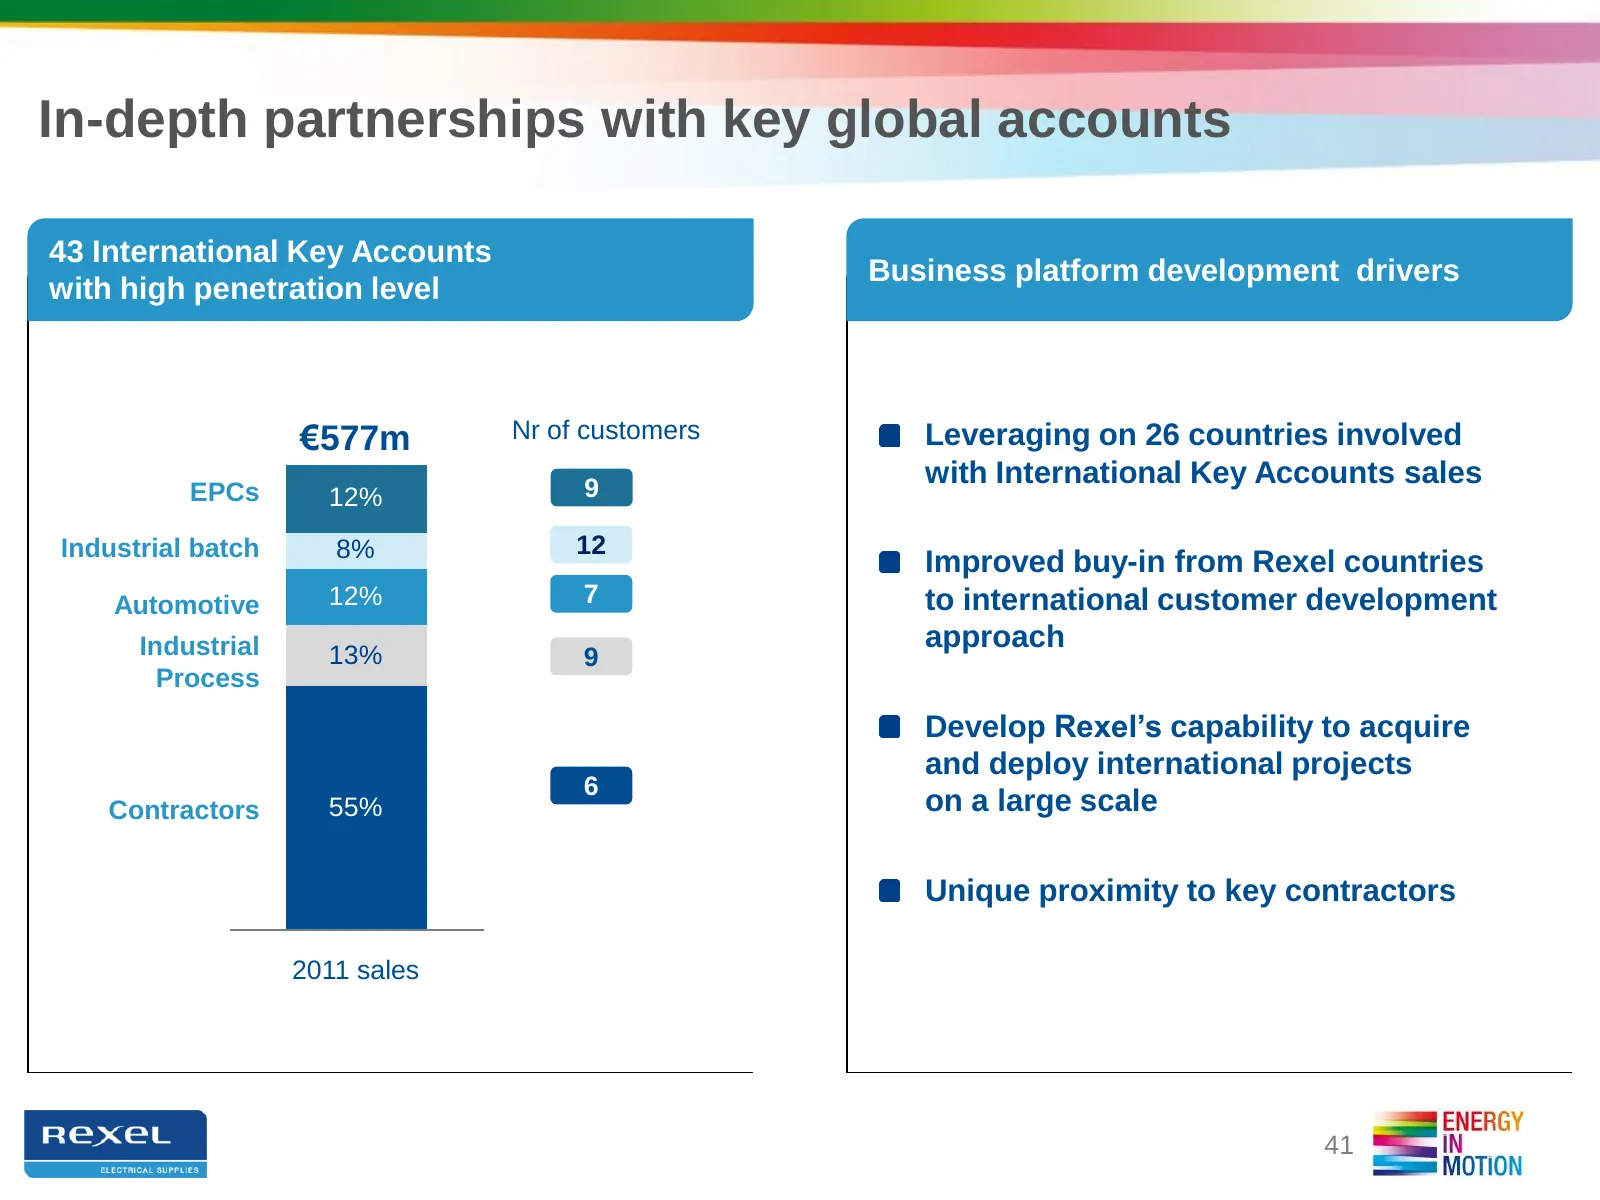
In-depth partnerships with key global accounts 43 International Key Accounts Business platform development drivers with high penetration level €577m Nr of customers Leveraging on 26 countries involved 9 with International Key Accounts sales EPCs 12% Industrial batch 8% 12 Improved buy-in from Rexel
Slide 42: IPG: a fast-growing business with EPCs
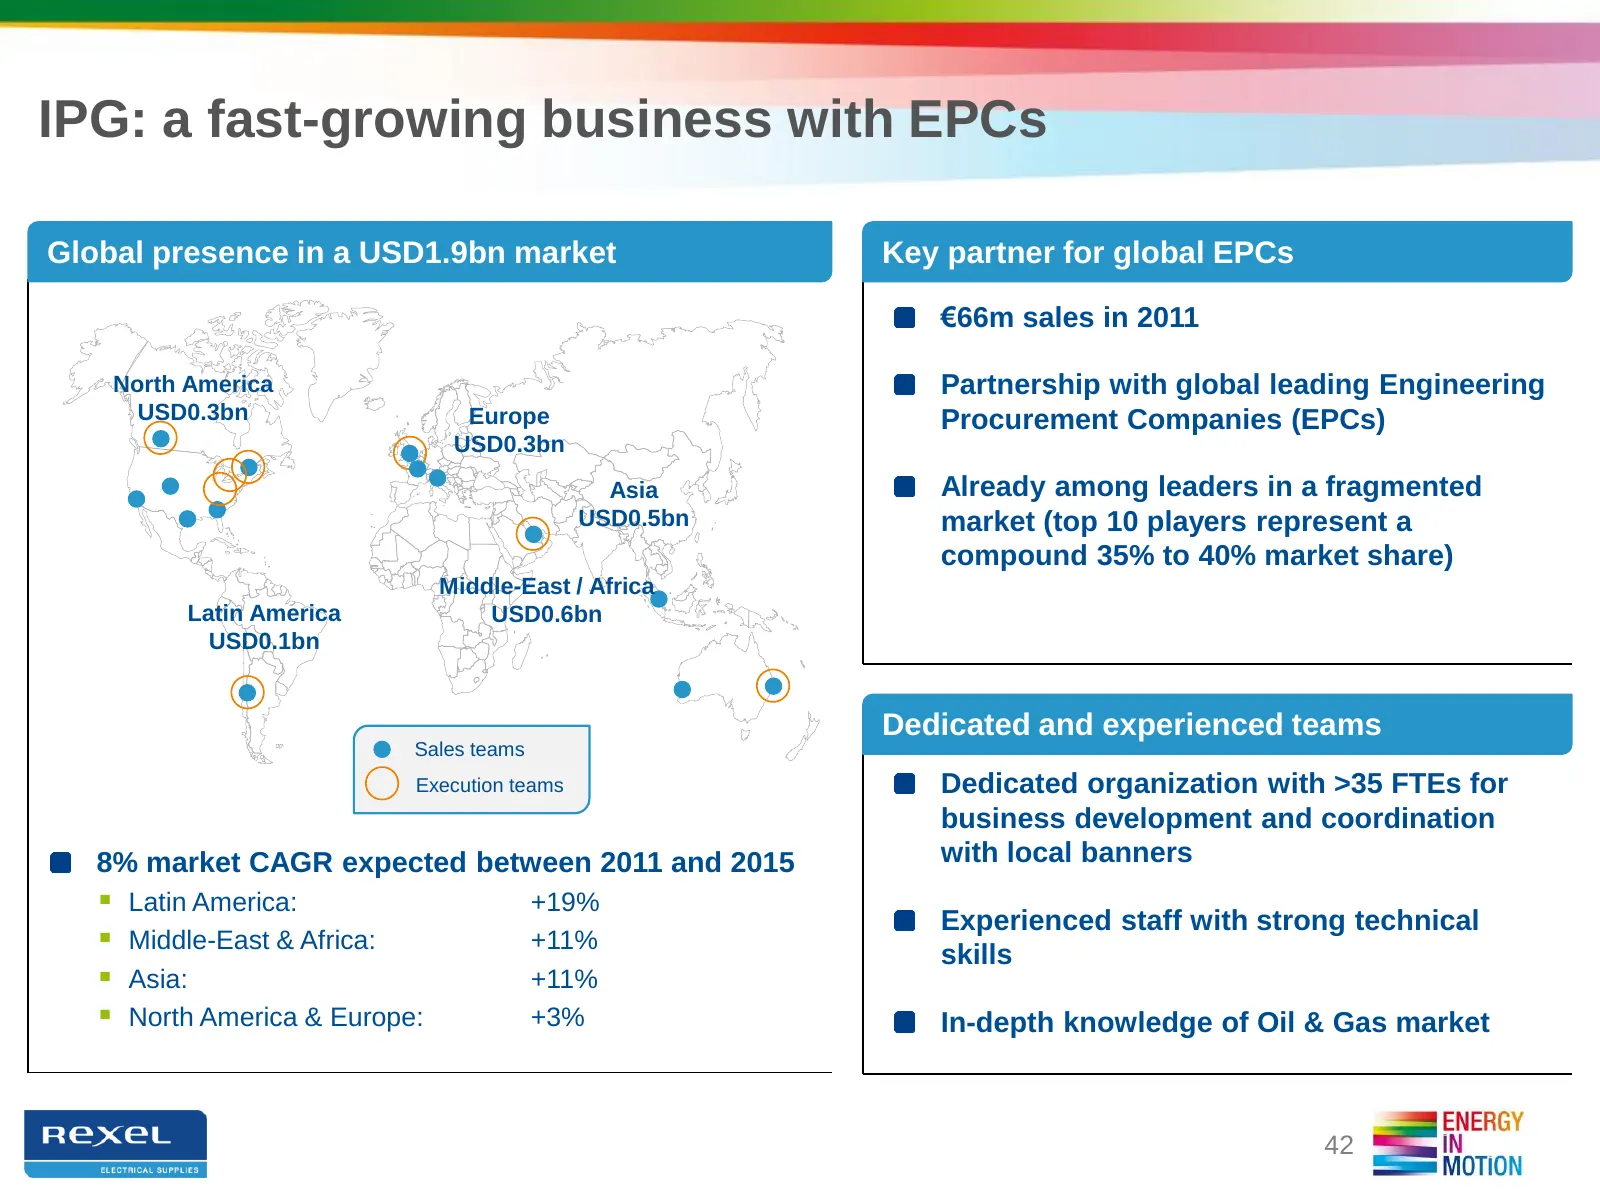
IPG: a fast-growing business with EPCs Global presence in a USD1.9bn market Key partner for global EPCs €66m sales in 2011 North America Partnership with global leading Engineering USD0.3bn Europe Procurement Companies (EPCs) USD0.3bn Asia Already among leaders in a fragmented USD0.5bn market (top 1
Slide 43: Case study: Pascua Lama gold mine in Latin America
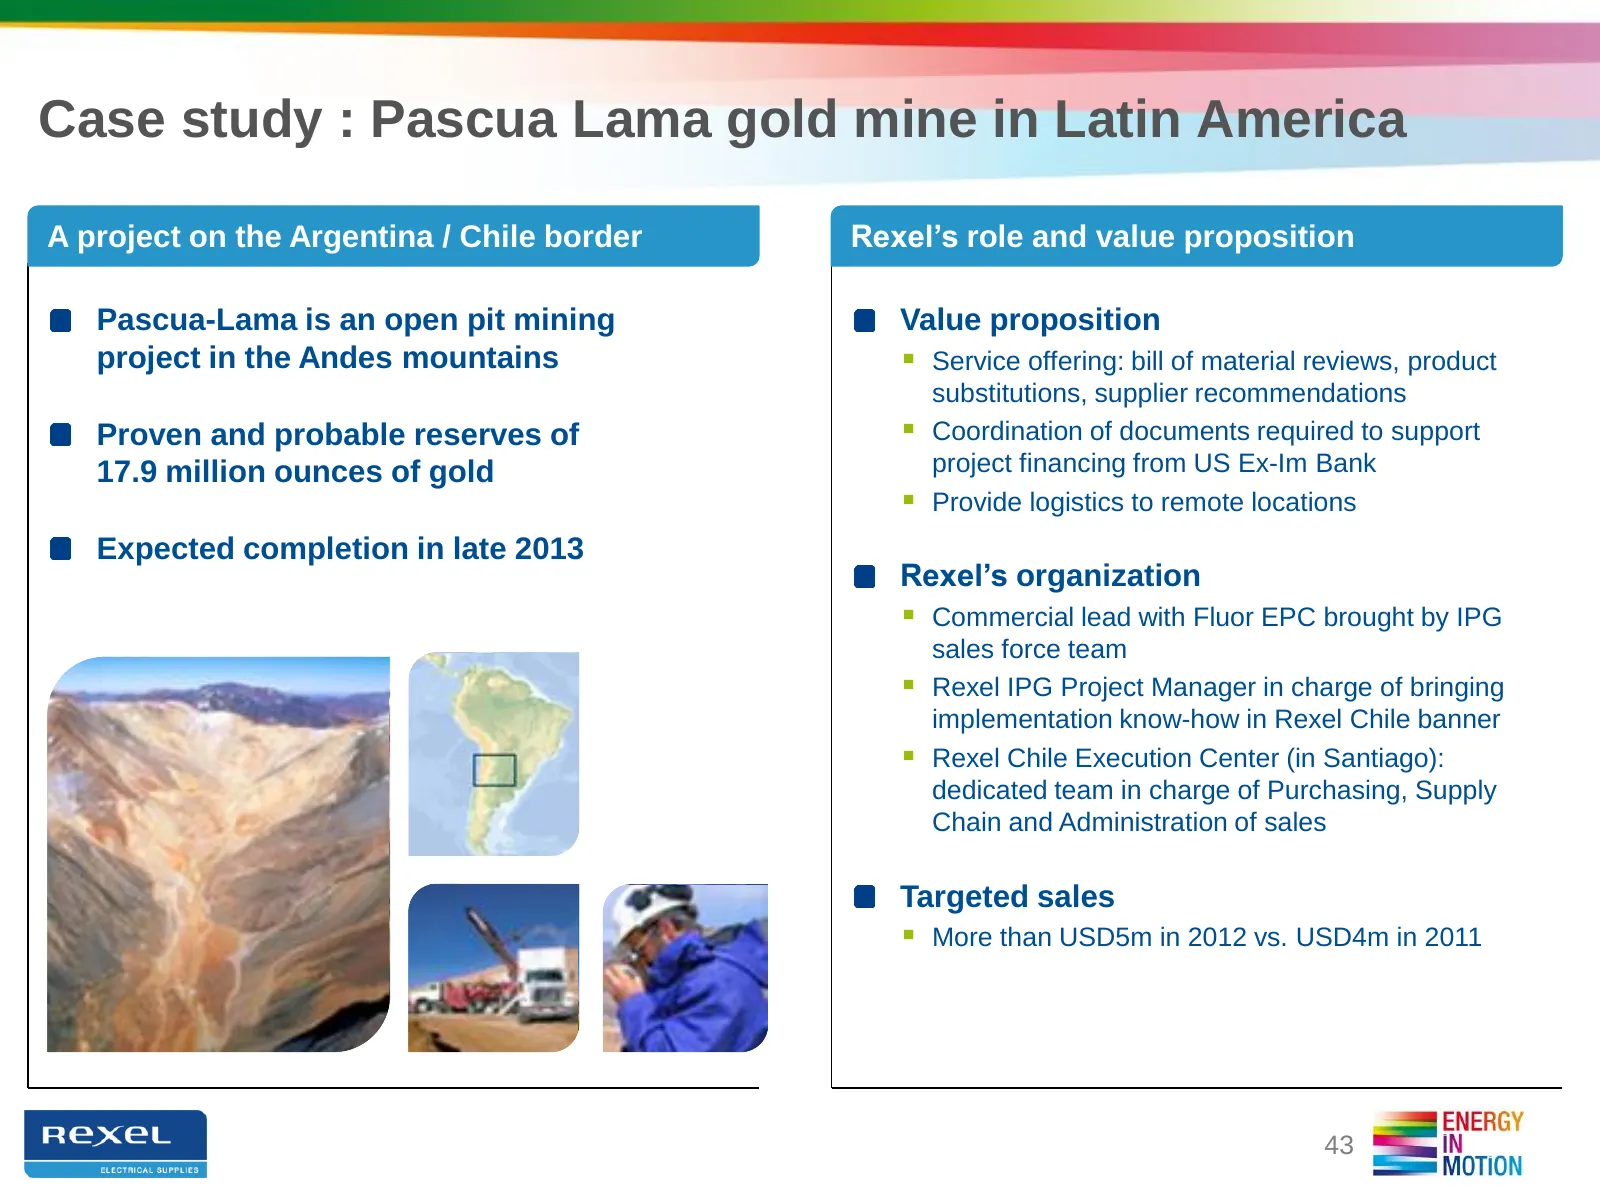
Case study : Pascua Lama gold mine in Latin America A project on the Argentina / Chile border Rexel’s role and value proposition Pascua-Lama is an open pit mining Value proposition project in the Andes mountains Service offering: bill of material reviews, product substitutions, supplier recommenda
Slide 44: Double-digit growth potential from international key accounts and large projects
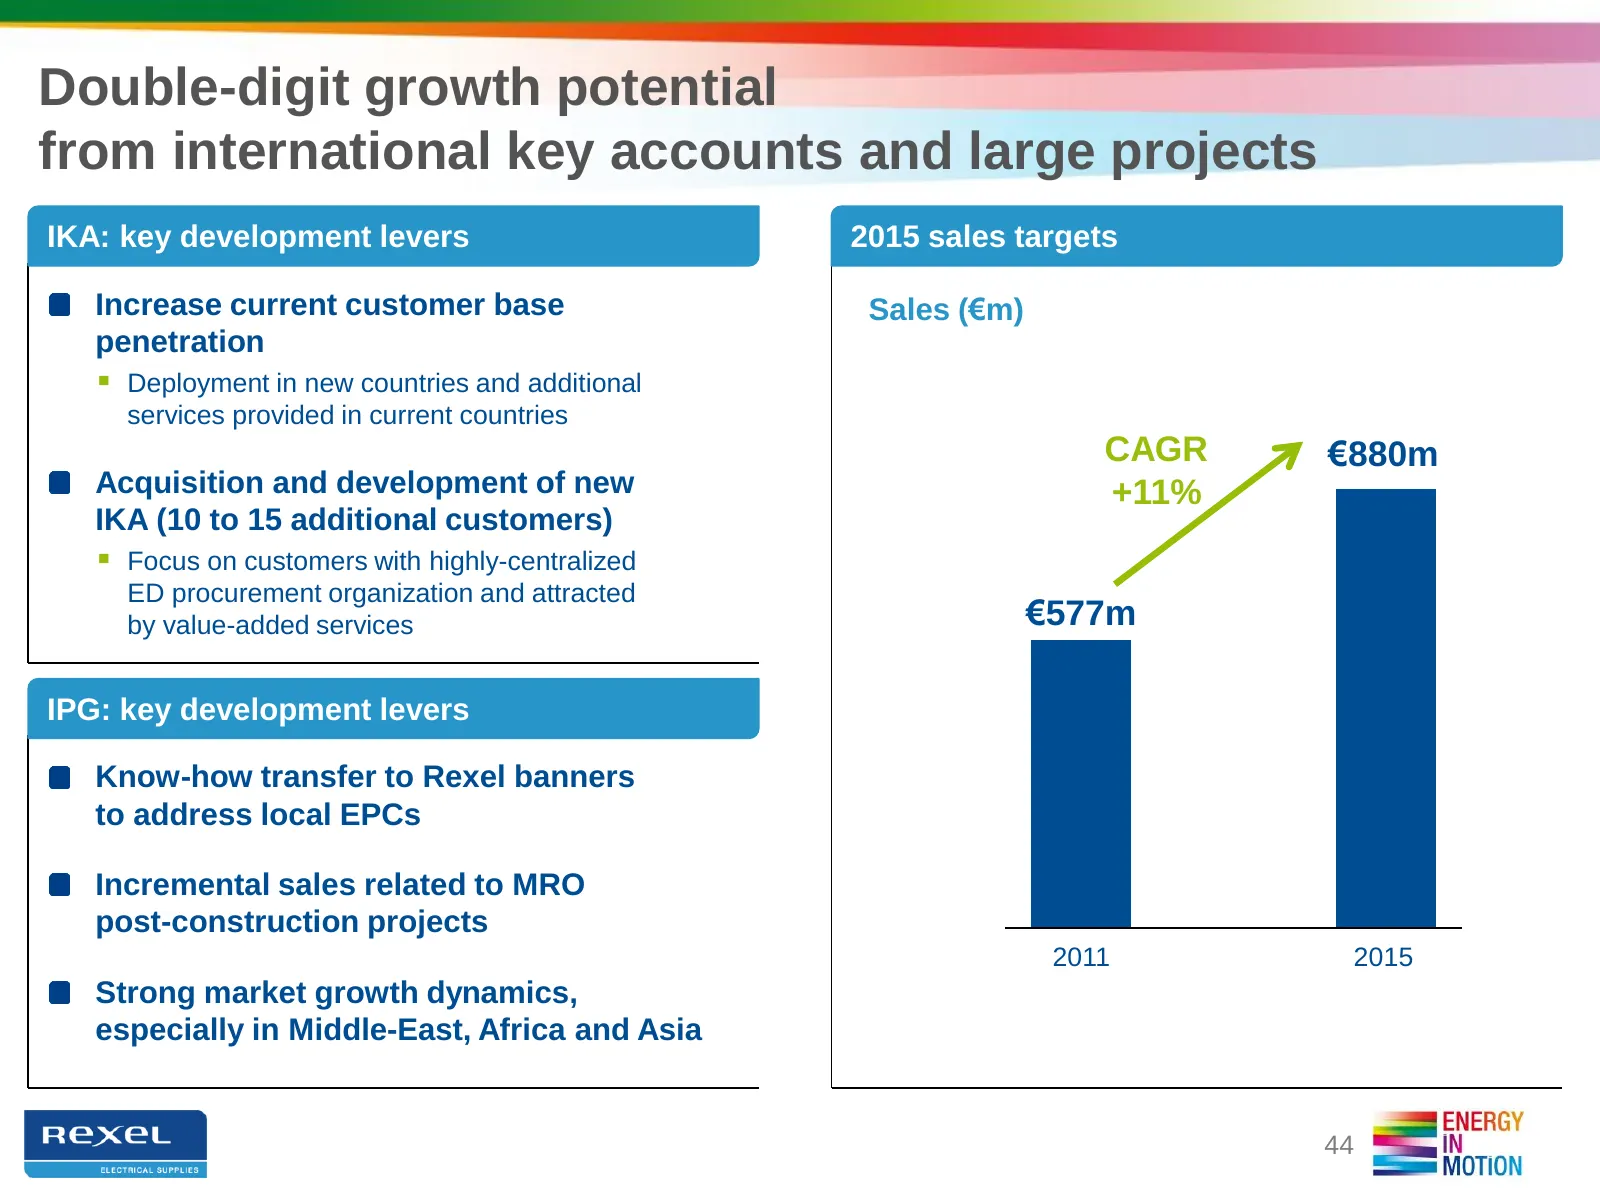
Double-digit growth potential from international key accounts and large projects IKA: key development levers 2015 sales targets Increase current customer base Sales (€m) penetration Deployment in new countries and additional services provided in current countries CAGR €880m Acquisition and develop
Slide 45: Accelerating organic growth
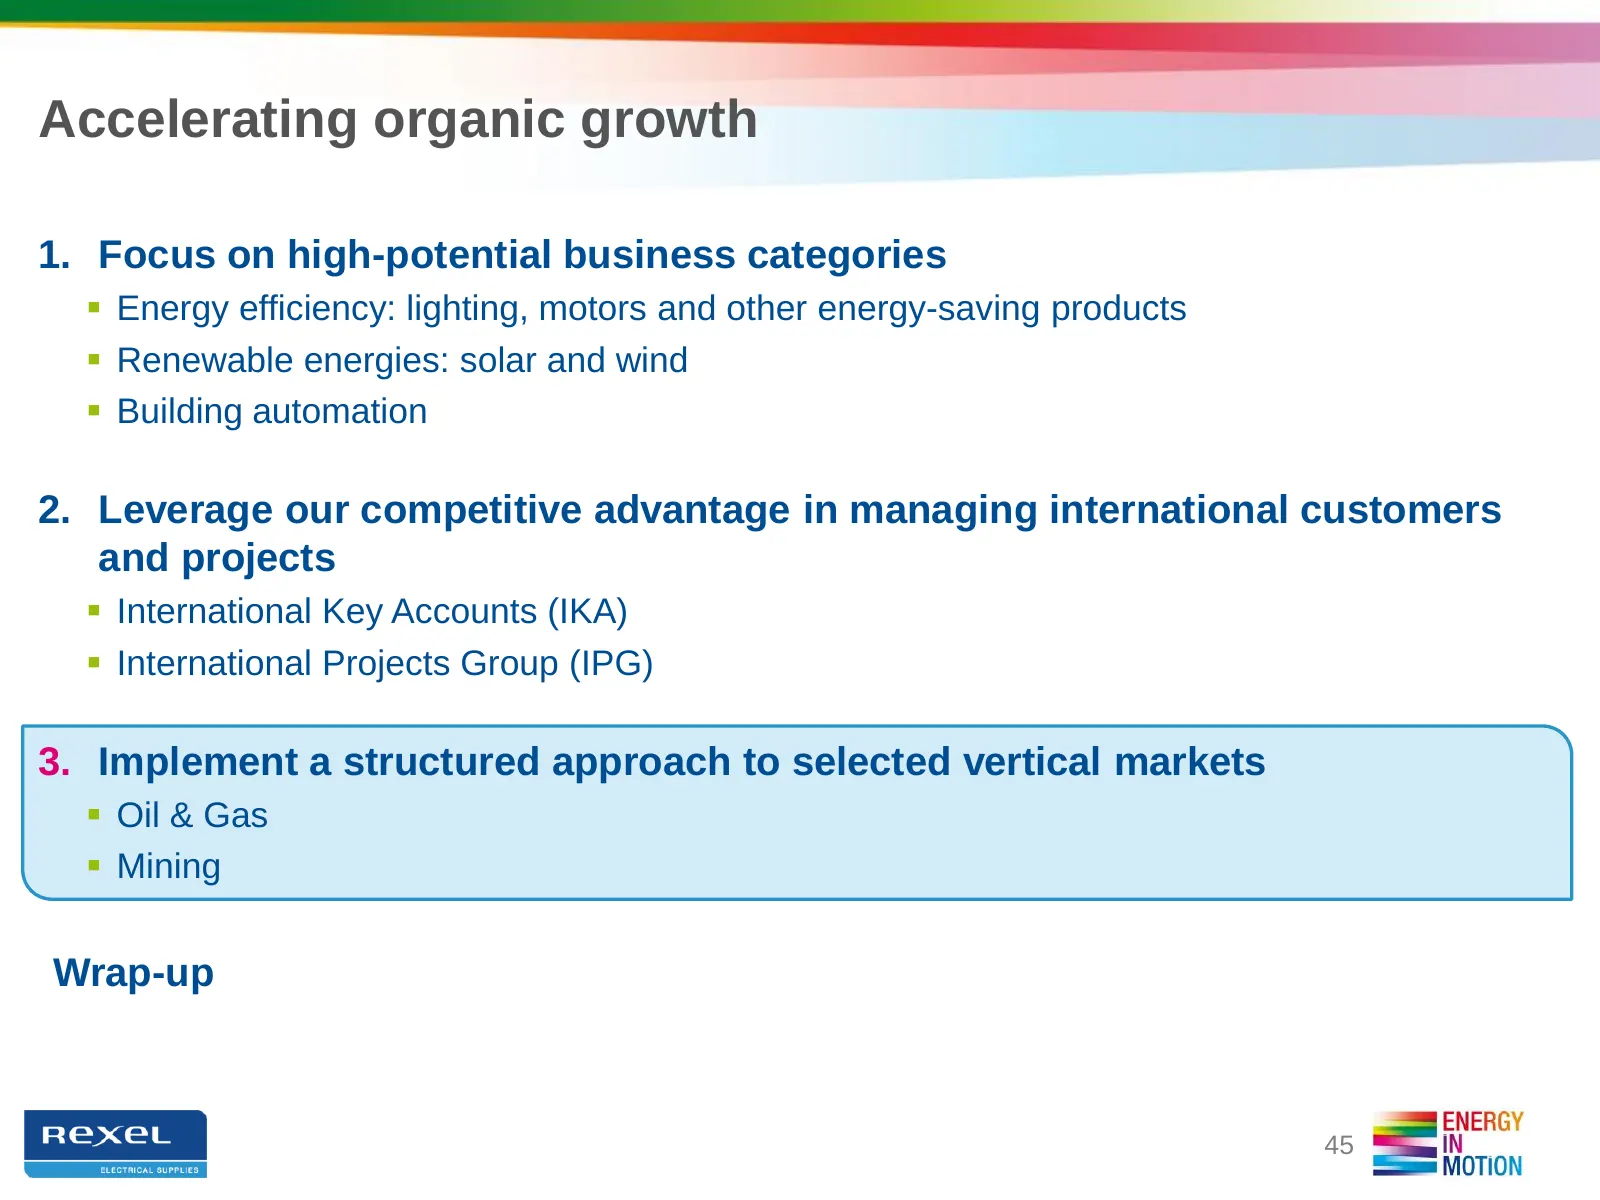
Accelerating organic growth 1. Focus on high-potential business categories Energy efficiency: lighting, motors and other energy-saving products Renewable energies: solar and wind Building automation 2. Leverage our competitive advantage in managing international customers and projects Intern
Slide 46: Accelerating organic growth
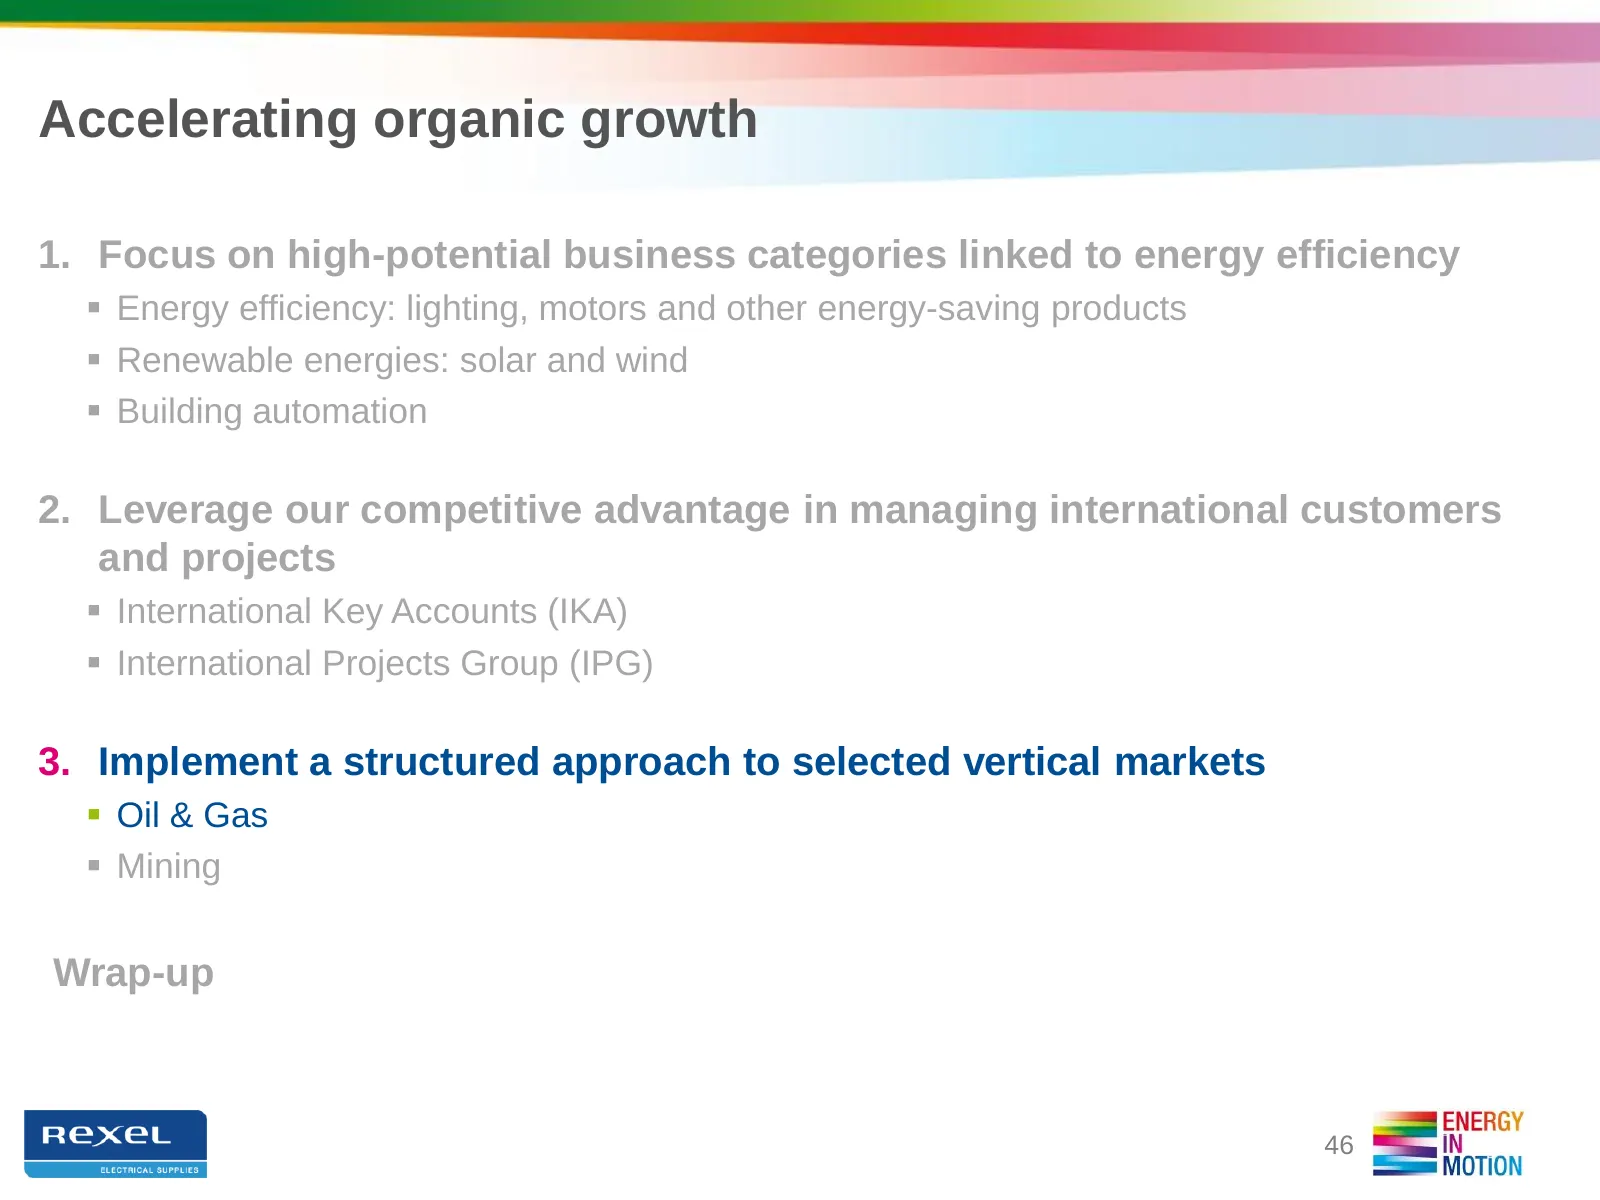
Accelerating organic growth 1. Focus on high-potential business categories linked to energy efficiency Energy efficiency: lighting, motors and other energy-saving products Renewable energies: solar and wind Building automation 2. Leverage our competitive advantage in managing international cus
Slide 47: Oil & Gas: a €5.0bn addressable market
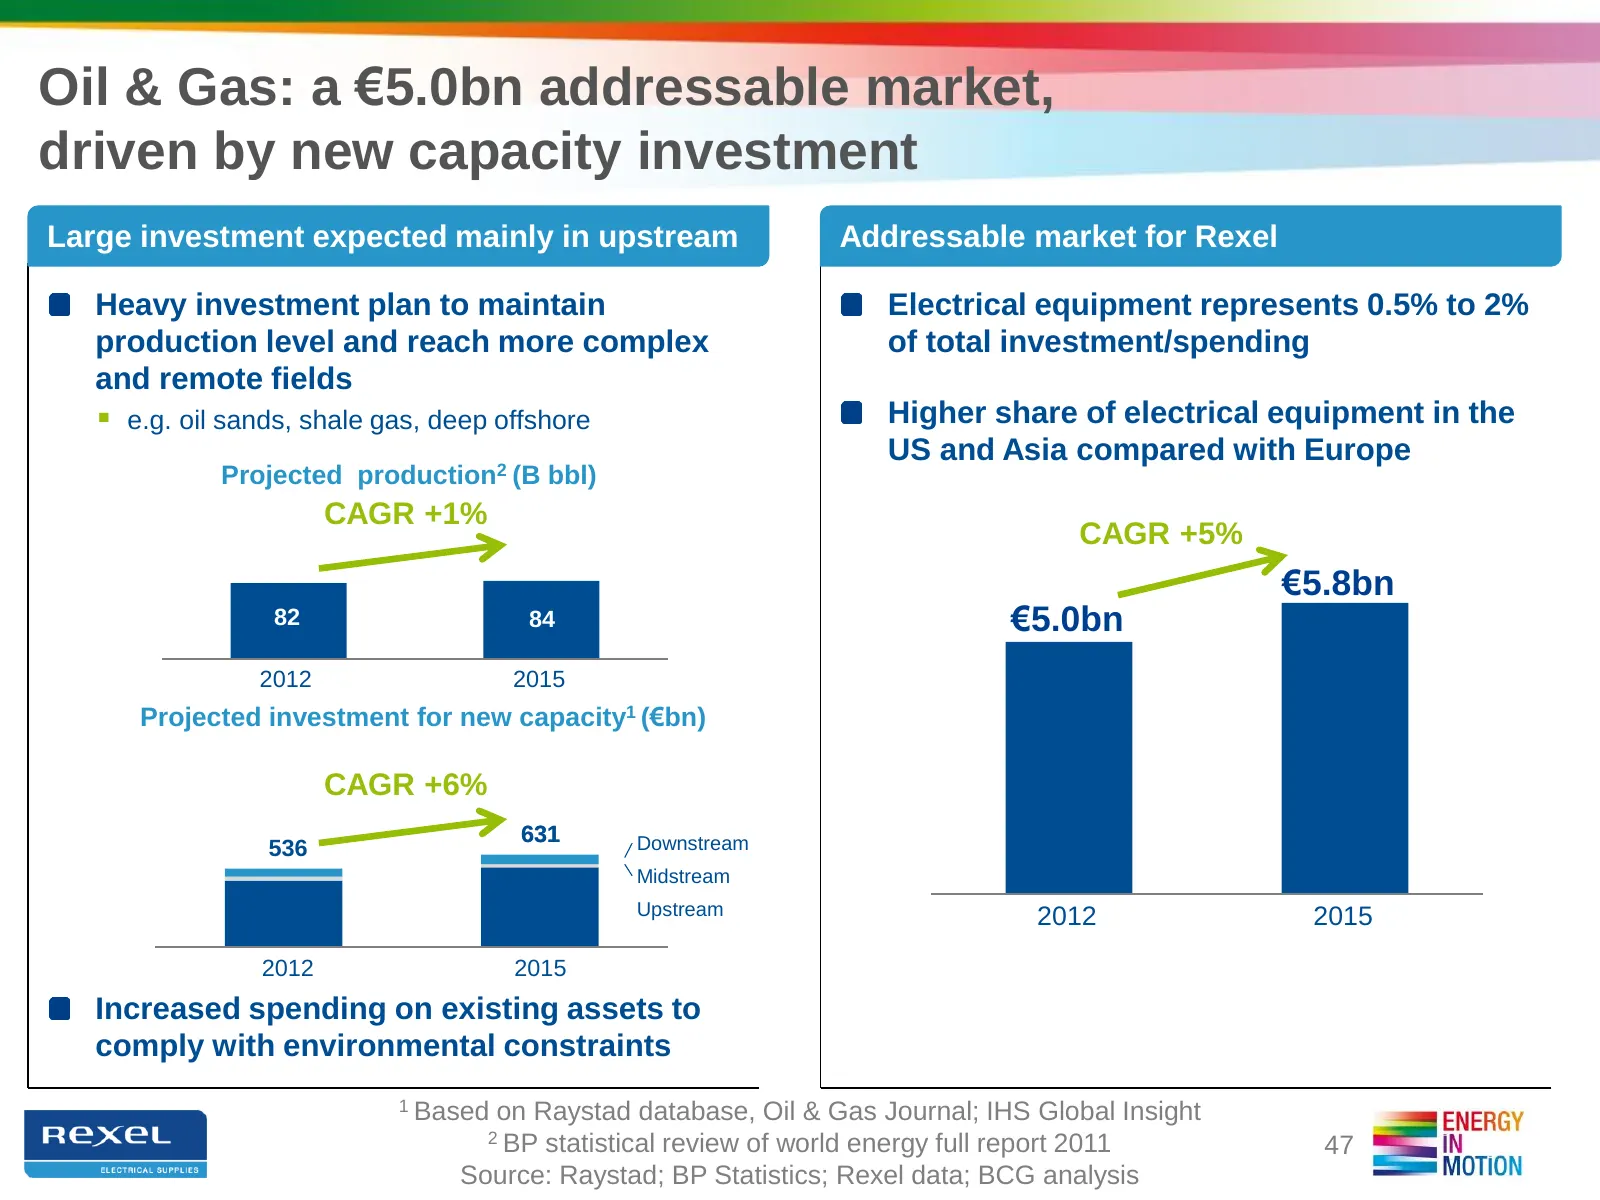
Oil & Gas: a €5.0bn addressable market, driven by new capacity investment Large investment expected mainly in upstream Addressable market for Rexel Heavy investment plan to maintain Electrical equipment represents 0.5% to 2% production level and reach more complex of total investment/spending and re
Slide 48: Rexel generated €380m sales from Oil & Gas in 2011
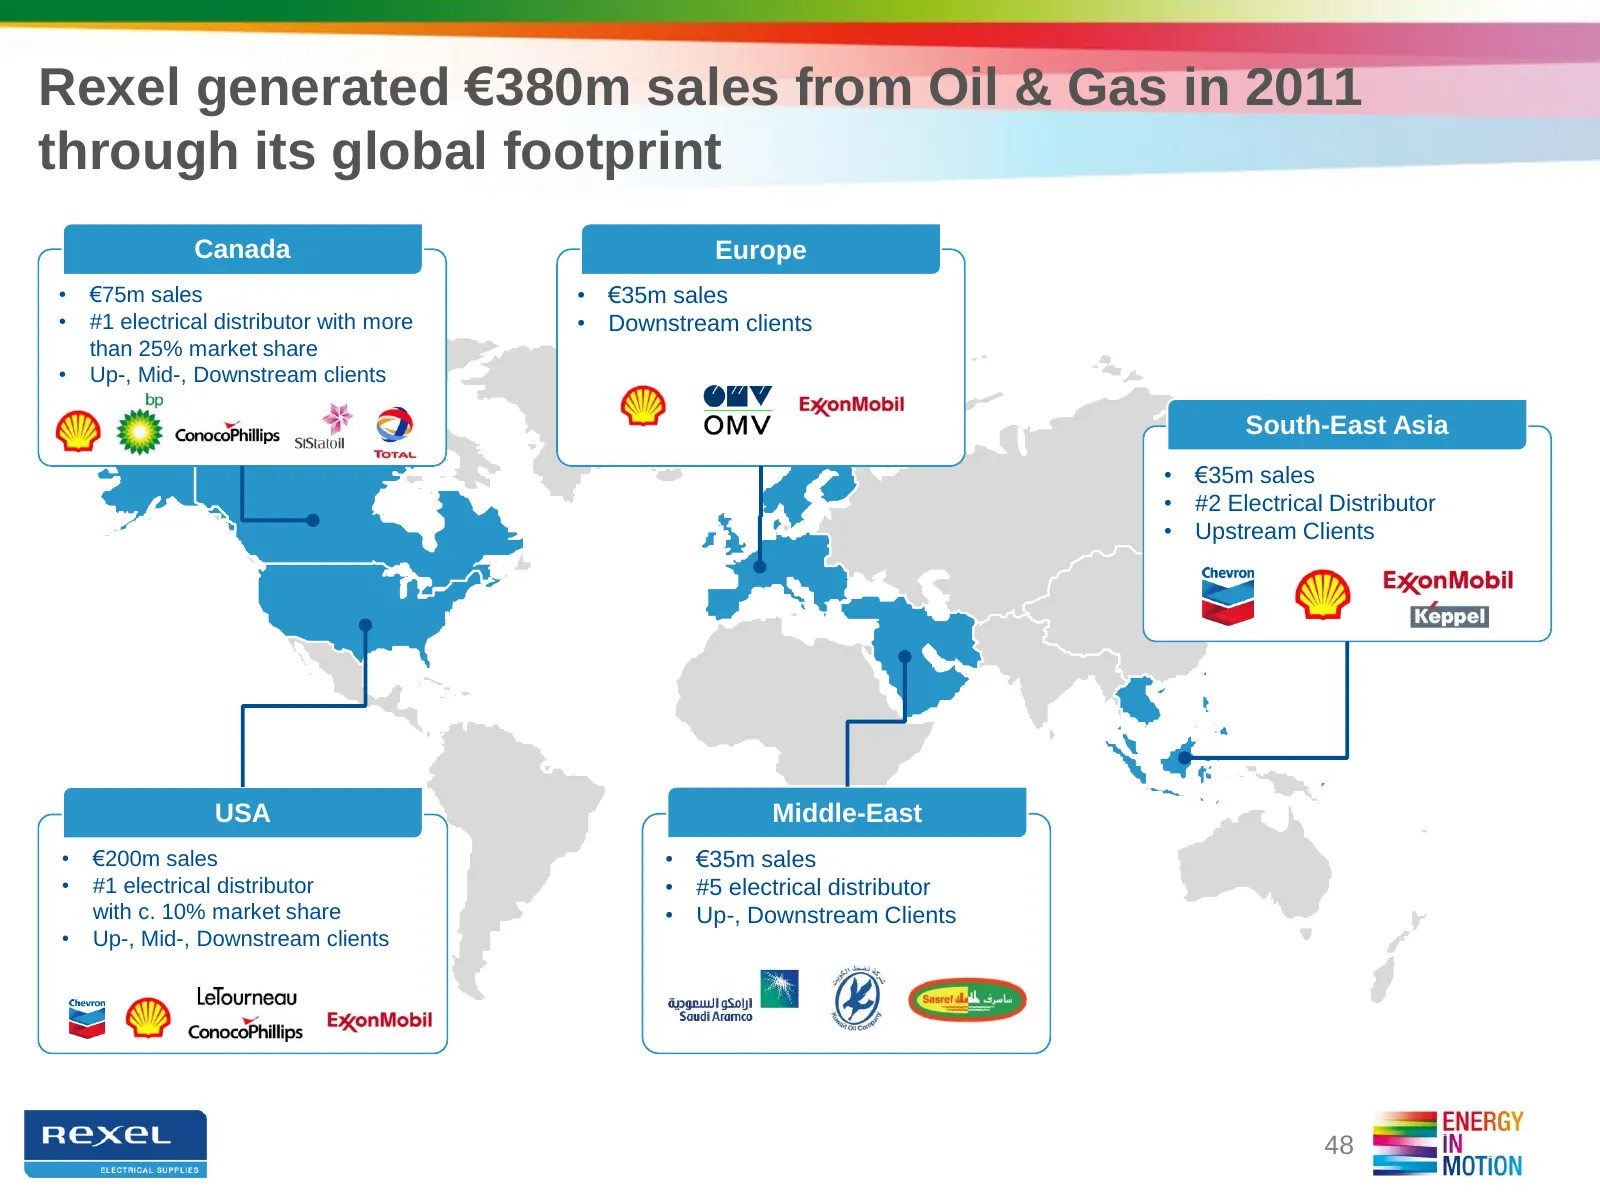
Rexel generated €380m sales from Oil & Gas in 2011 through its global footprint Canada Europe • €75m sales • €35m sales • #1 electrical distributor with more • Downstream clients than 25% market share • Up-, Mid-, Downstream clients South-East Asia • €35m sales • #2 Electrical Distributor • Upstream
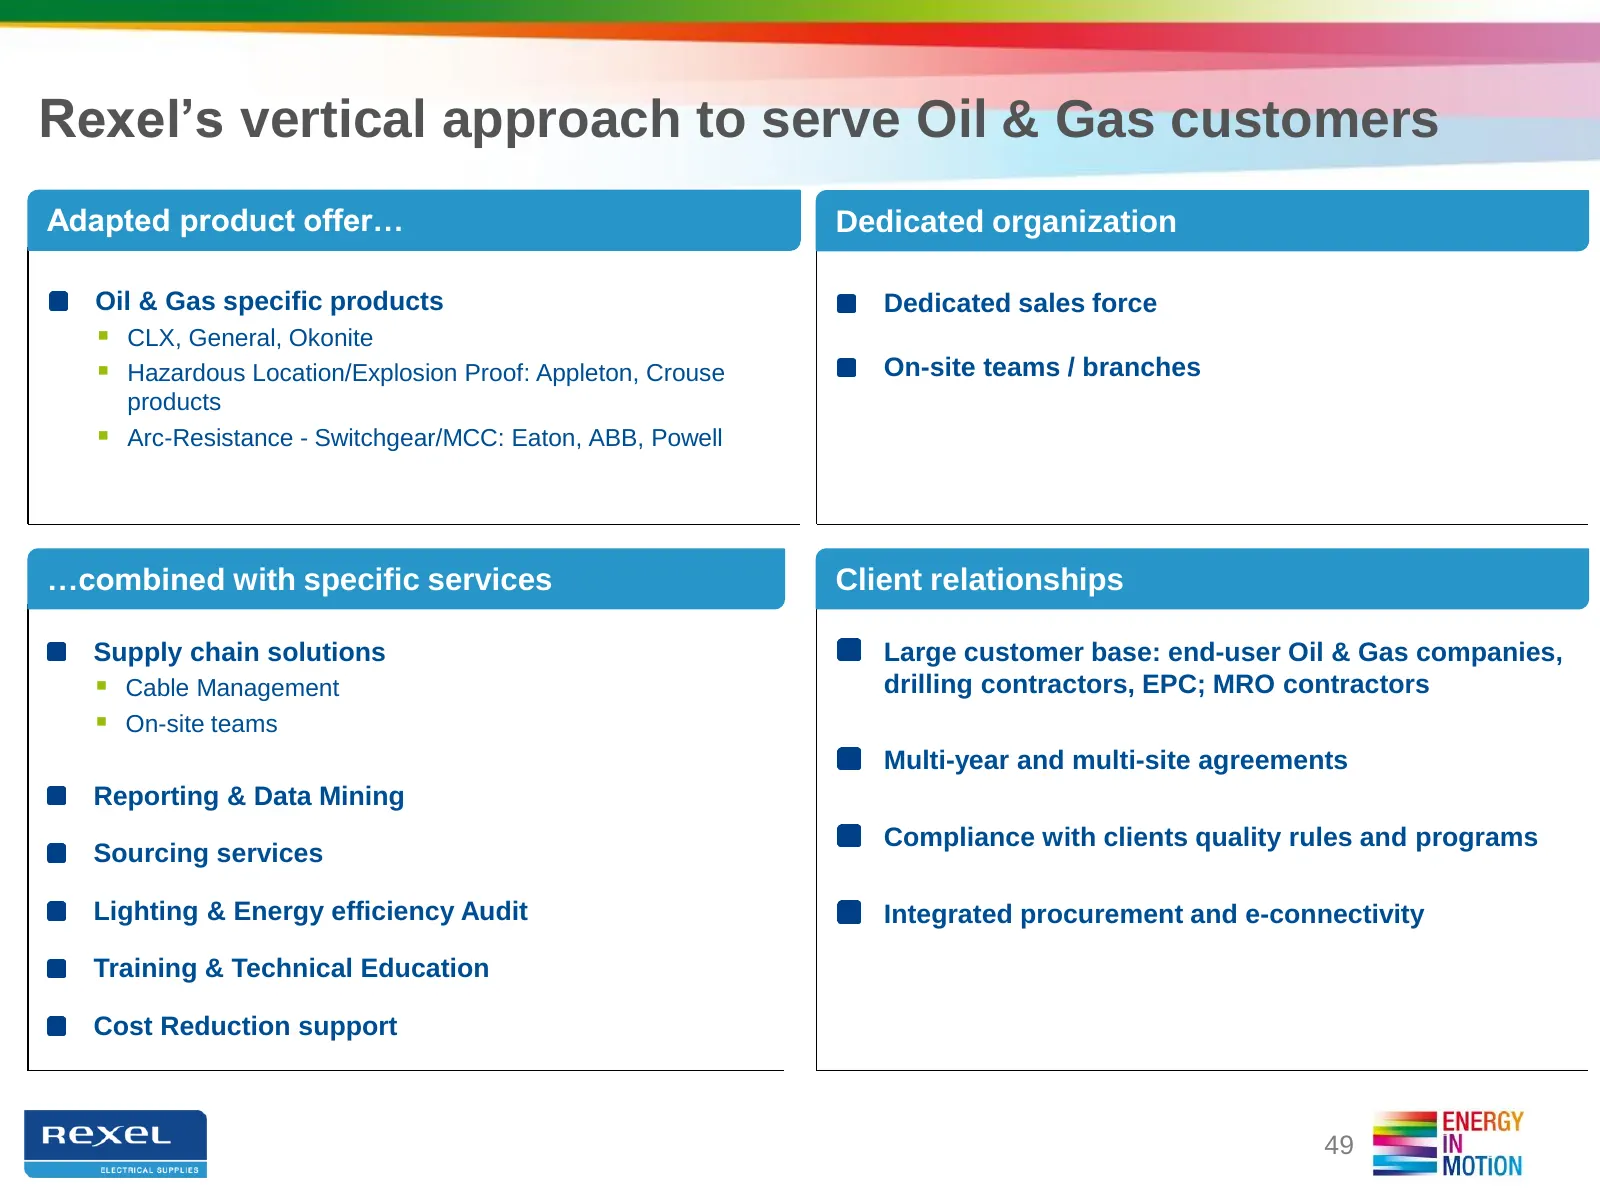
Slide 49: Rexel's vertical approach to serve Oil & Gas customers
Rexel’s vertical approach to serve Oil & Gas customers Adapted product offer… Dedicated organization Oil & Gas specific products Dedicated sales force CLX, General, Okonite Hazardous Location/Explosion Proof: Appleton, Crouse On-site teams / branches products Arc-Resistance - Switchgear/MCC: E
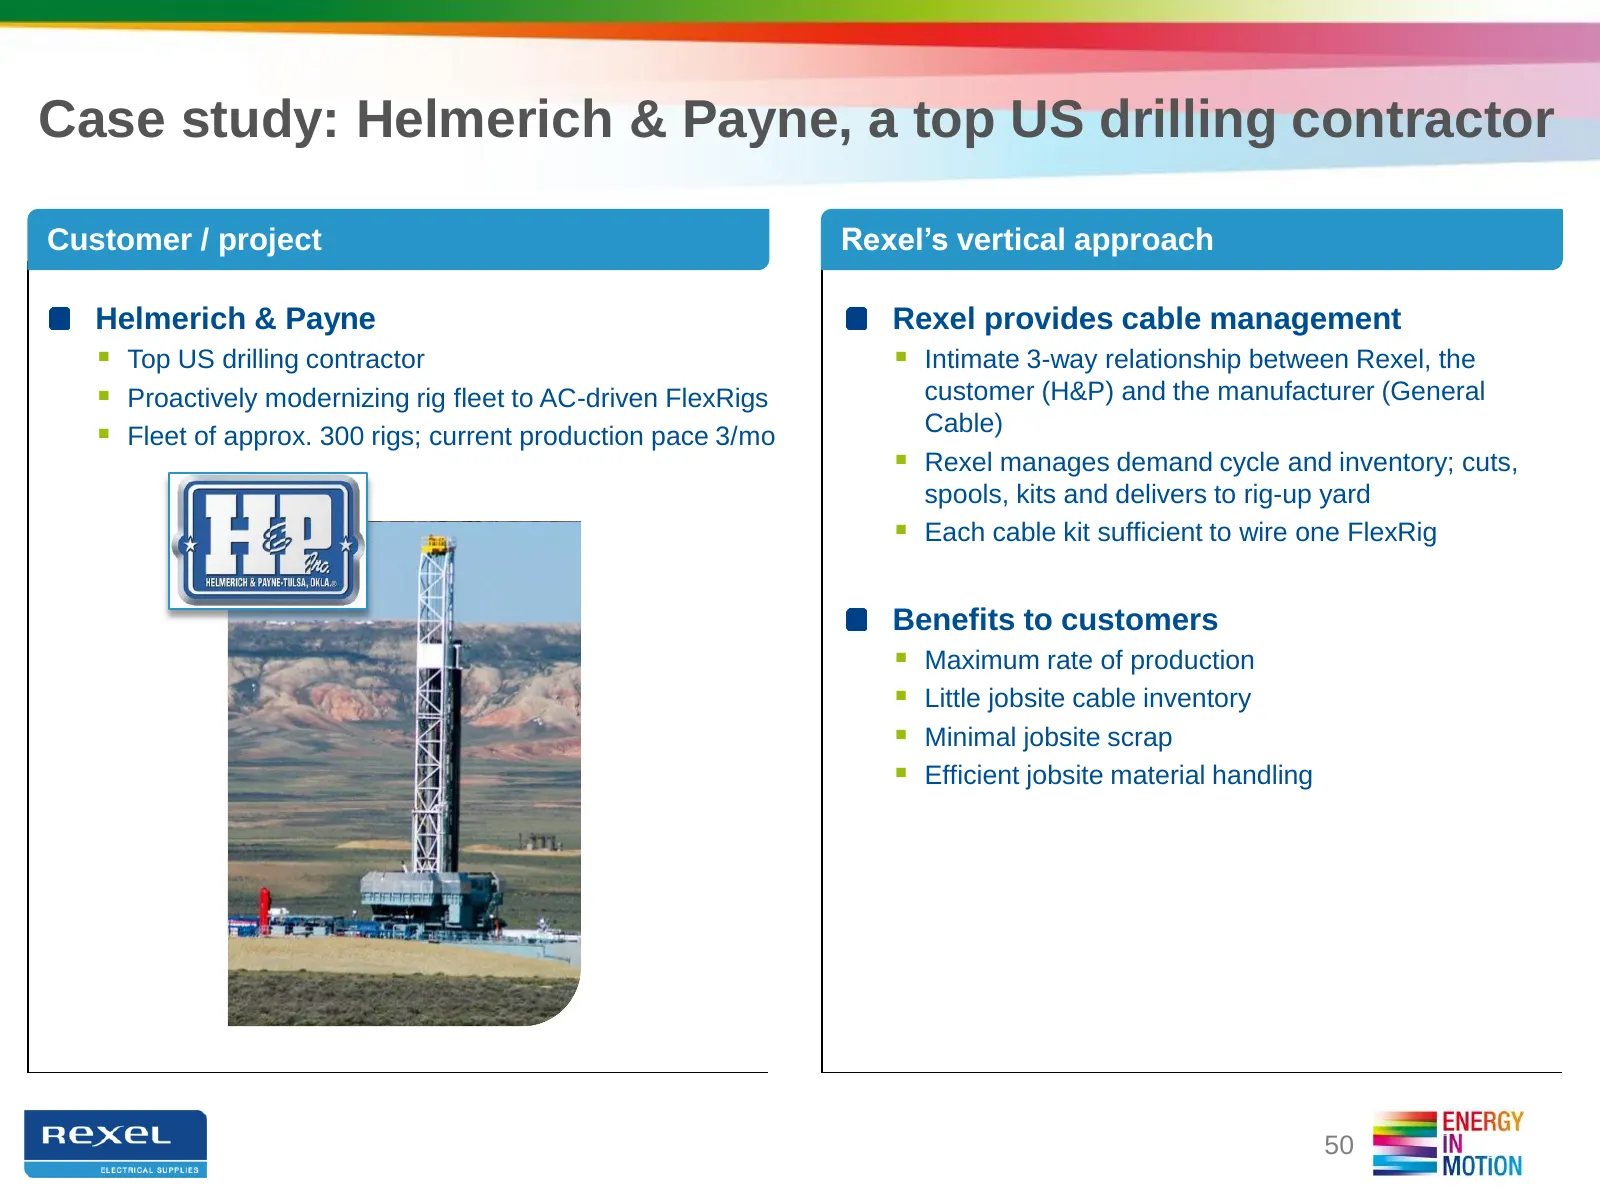
Slide 50: Case study: Helmerich & Payne, a top US drilling contractor
Case study: Helmerich & Payne, a top US drilling contractor Customer / project Rexel’s vertical approach Helmerich & Payne Rexel provides cable management Top US drilling contractor Intimate 3-way relationship between Rexel, the Proactively modernizing rig fleet to AC-driven FlexRigs customer
Slide 51: Accelerating organic growth
Accelerating organic growth 1. Focus on high-potential business categories linked to energy efficiency Energy efficiency: lighting, motors and other energy-saving products Renewable energies: solar and wind Building automation 2. Leverage our competitive advantage in managing international cus
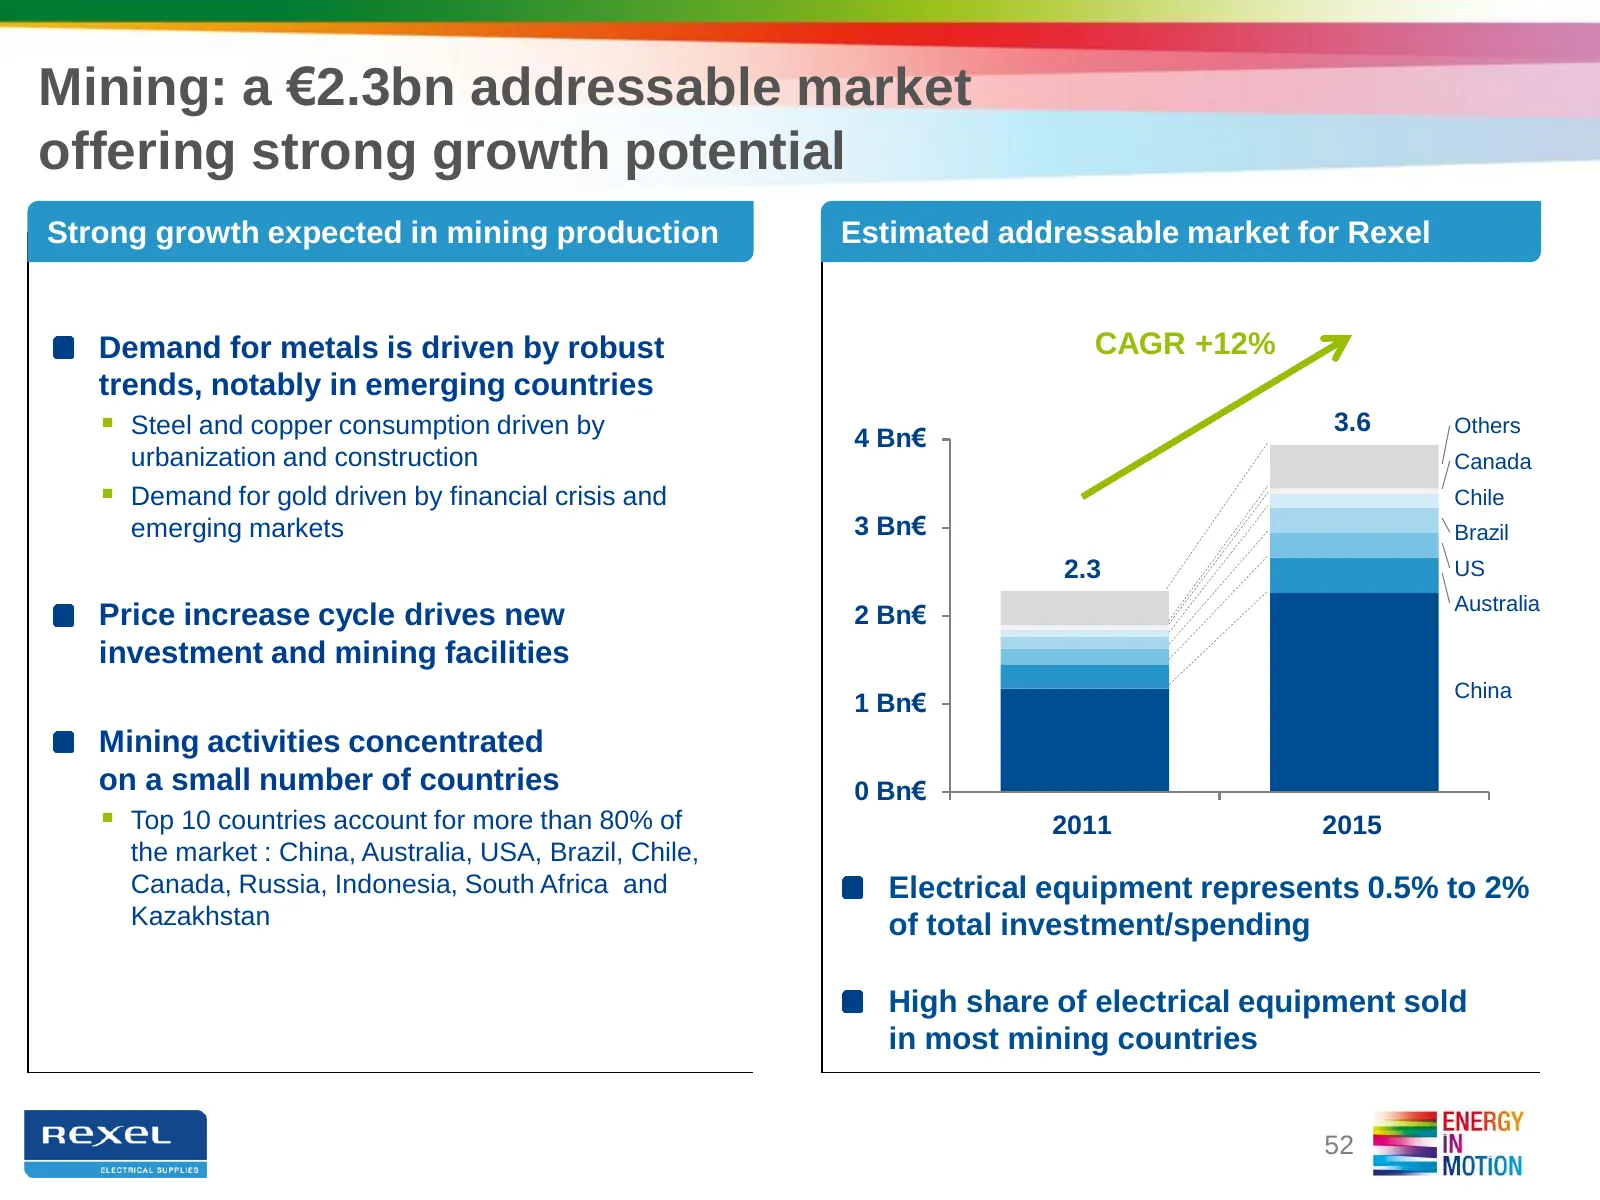
Slide 52: Mining: a €2.3bn addressable market
Mining: a €2.3bn addressable market offering strong growth potential Strong growth expected in mining production Estimated addressable market for Rexel Demand for metals is driven by robust CAGR +12% trends, notably in emerging countries Steel and copper consumption driven by 4 Bn€ 3.6 Others urba
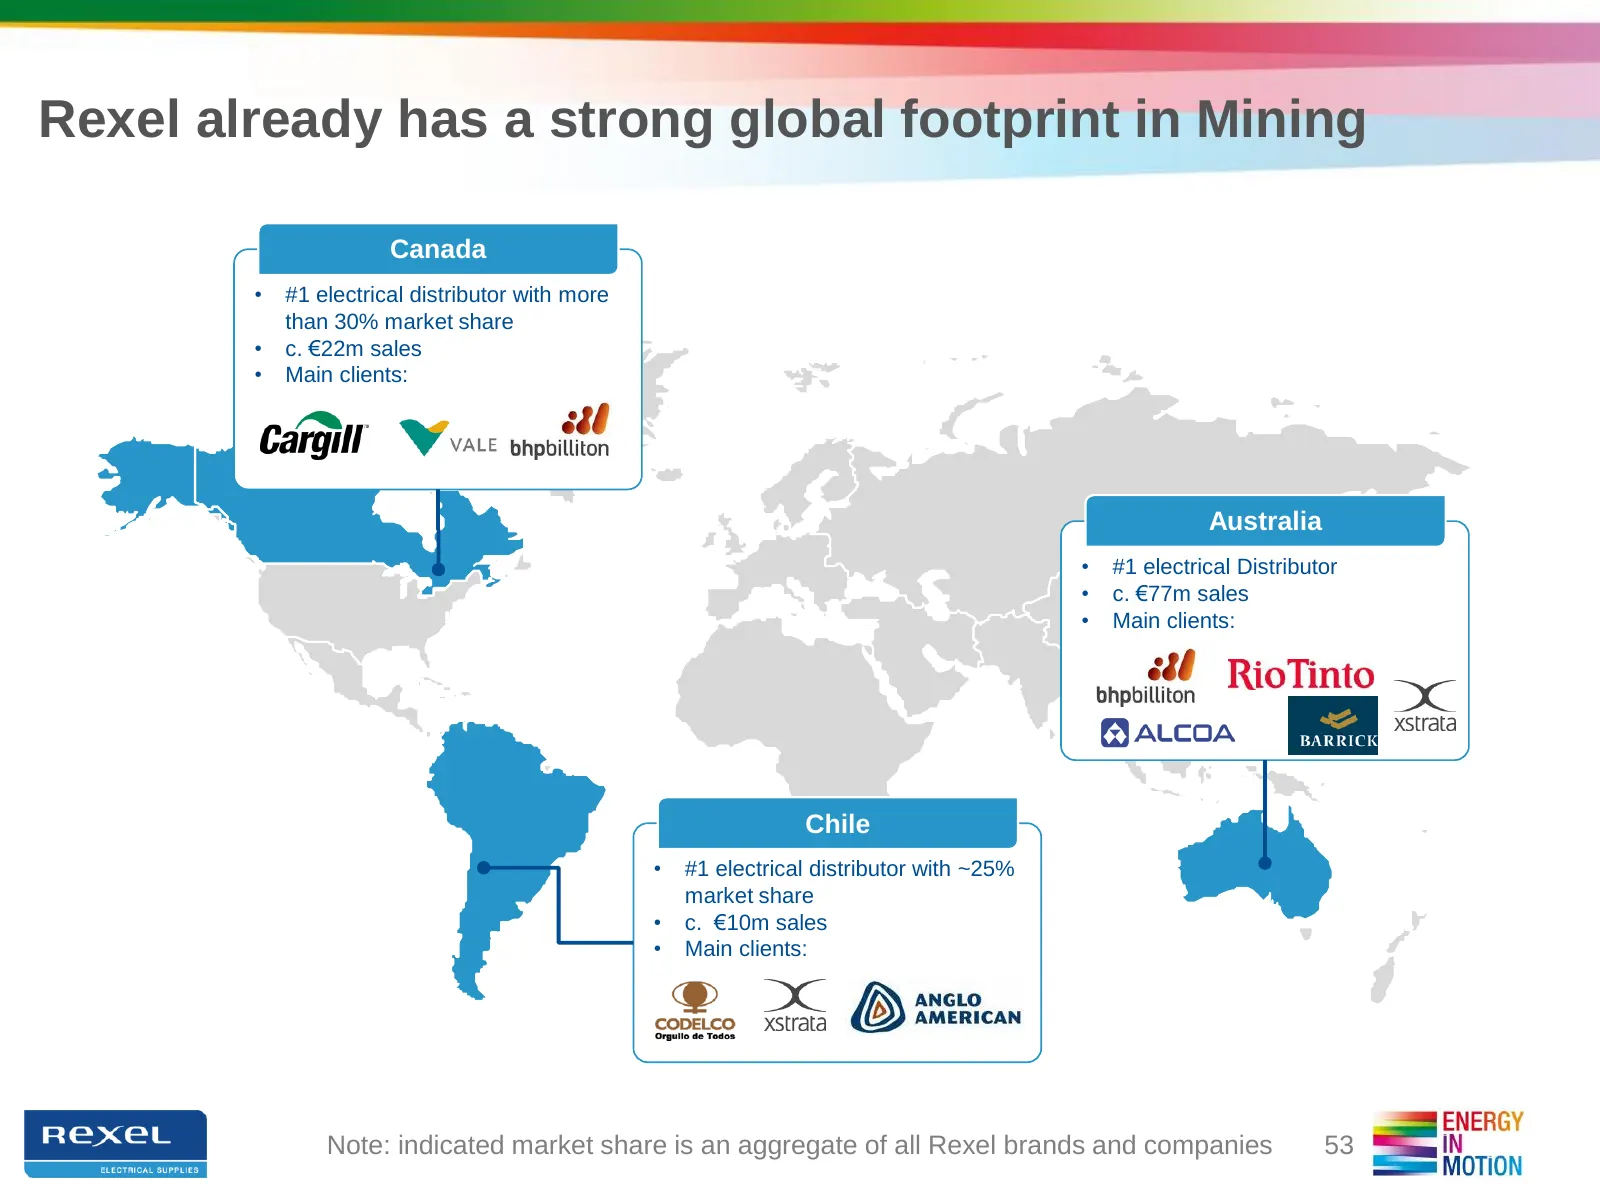
Slide 53: Rexel already has a strong global footprint in Mining
Rexel already has a strong global footprint in Mining Canada • #1 electrical distributor with more than 30% market share • c. €22m sales • Main clients: Australia • #1 electrical Distributor • c. €77m sales • Main clients: Chile • #1 electrical distributor with ~25% market share • c. €10m sales • Ma
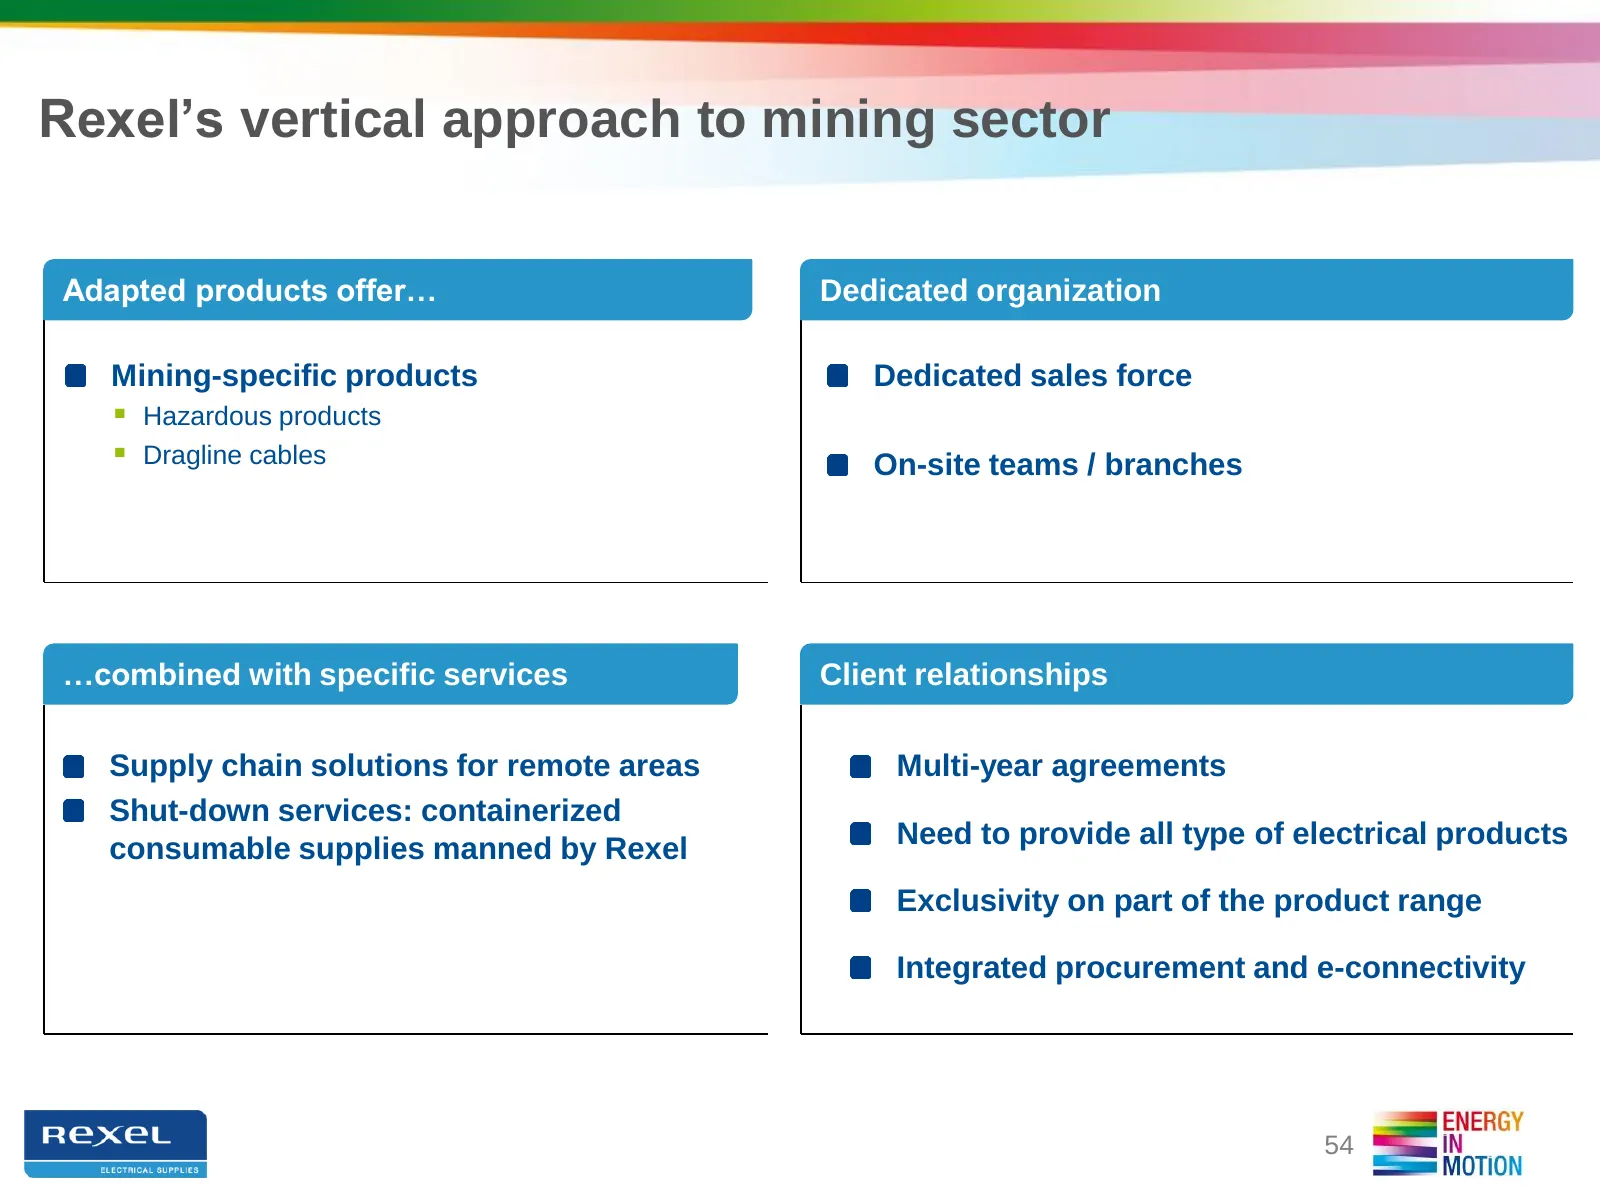
Slide 54: Rexel's vertical approach to mining sector
Rexel’s vertical approach to mining sector Adapted products offer… Dedicated organization Mining-specific products Dedicated sales force Hazardous products Dragline cables On-site teams / branches …combined with specific services Client relationships Supply chain solutions for remote areas Multi
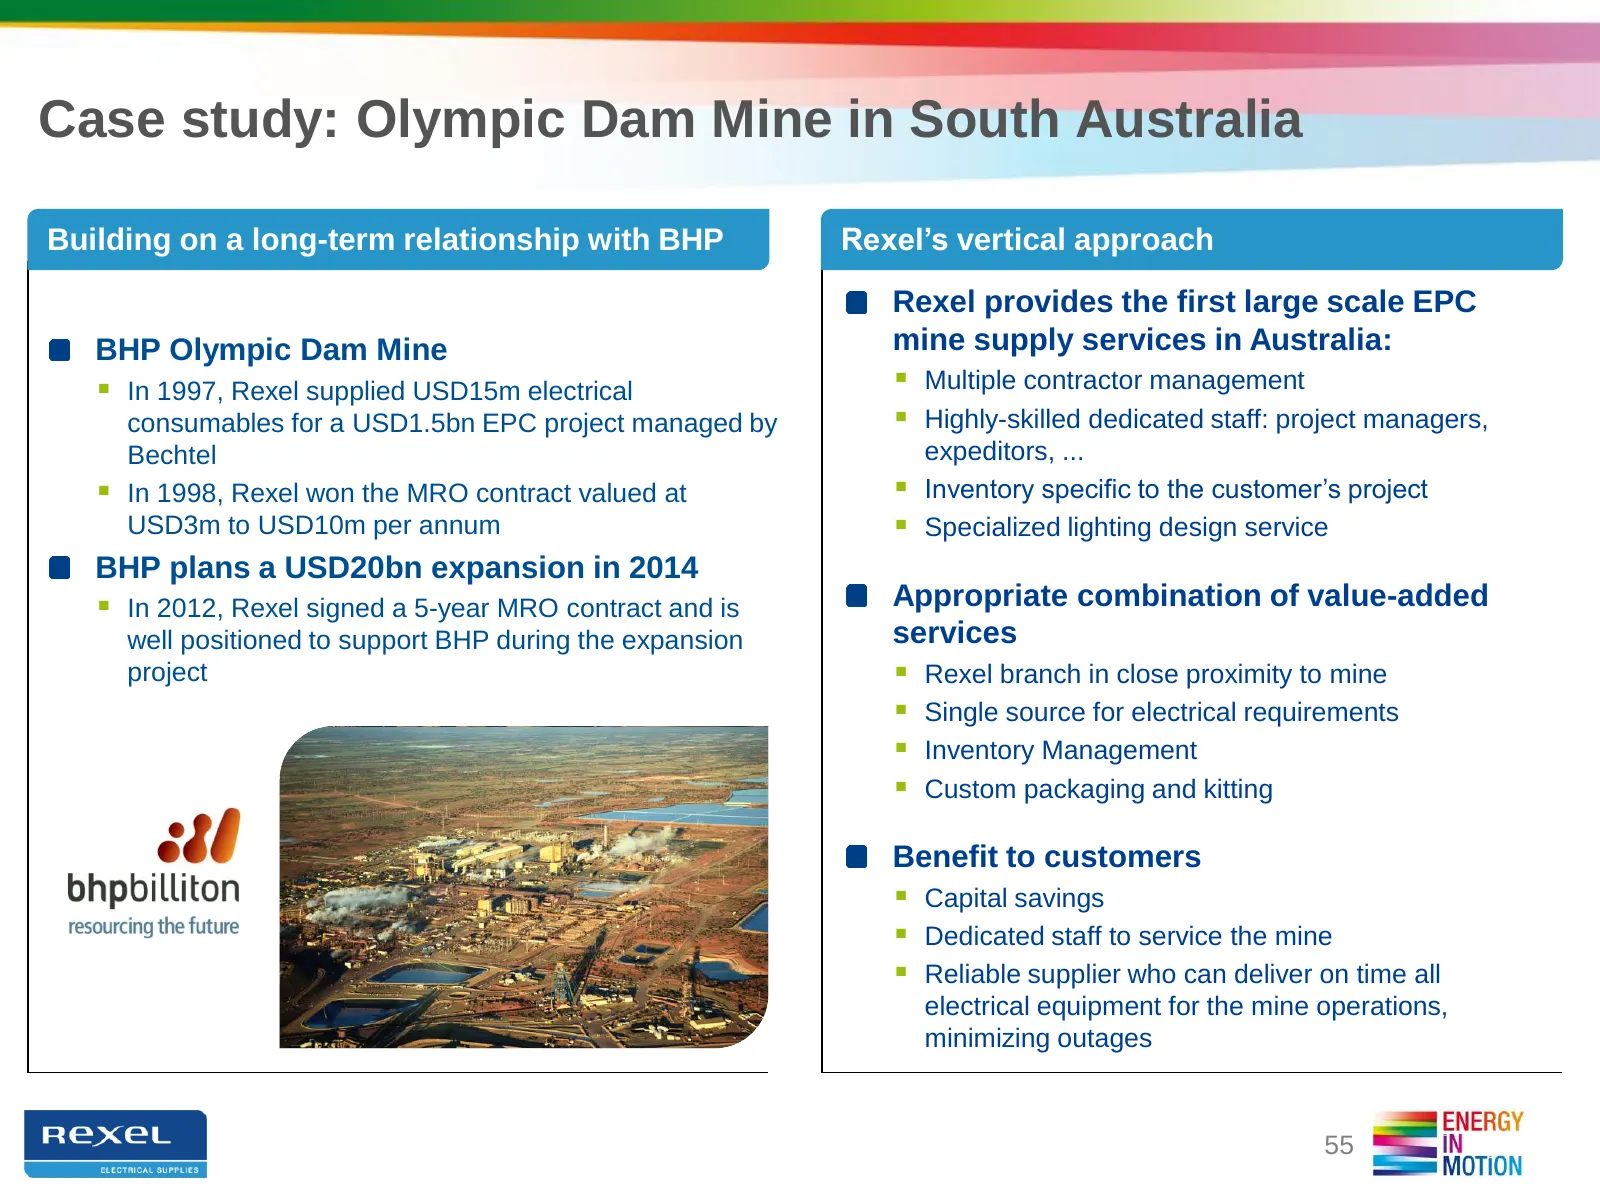
Slide 55: Case study: Olympic Dam Mine in South Australia
Case study: Olympic Dam Mine in South Australia Building on a long-term relationship with BHP Rexel’s vertical approach Rexel provides the first large scale EPC BHP Olympic Dam Mine mine supply services in Australia: In 1997, Rexel supplied USD15m electrical Multiple contractor management consum
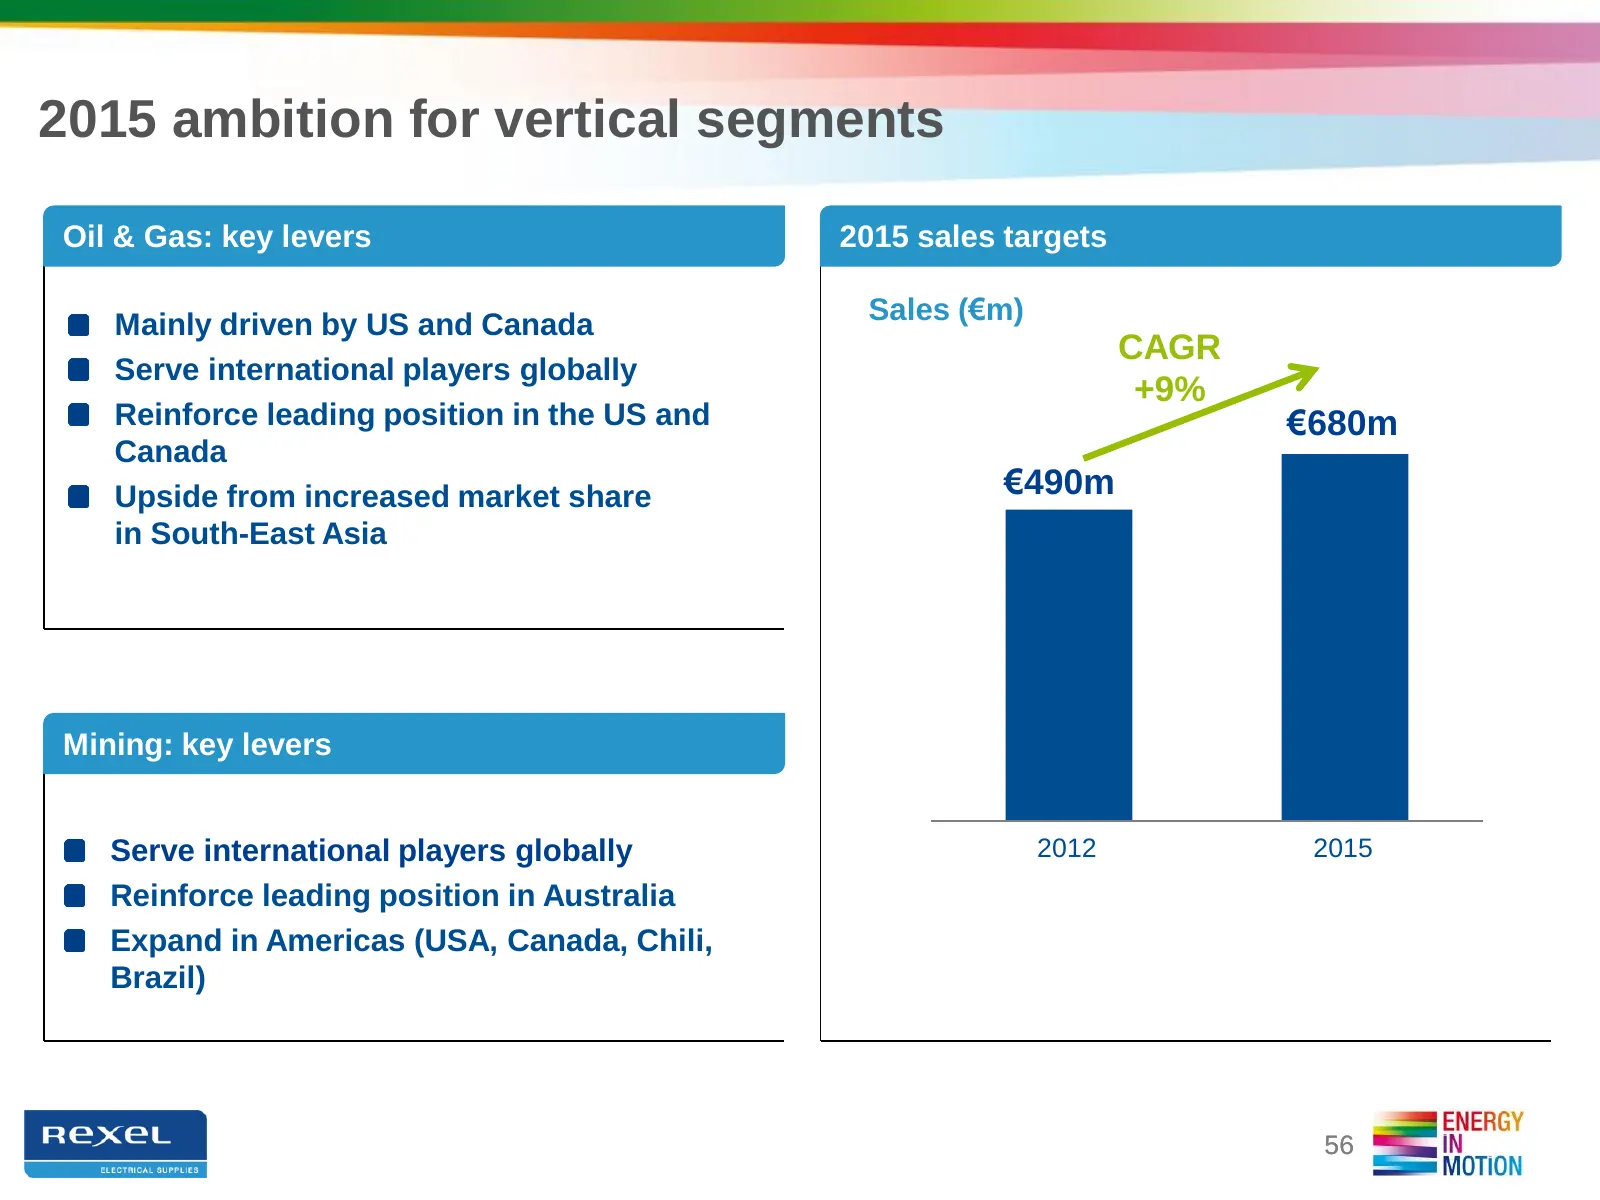
Slide 56: 2015 ambition for vertical segments
2015 ambition for vertical segments Oil & Gas: key levers 2015 sales targets Mainly driven by US and Canada Sales (€m) CAGR Serve international players globally +9% Reinforce leading position in the US and €680m Canada Upside from increased market share €490m in South-East Asia Mining: key levers Se
Slide 57: Accelerating organic growth
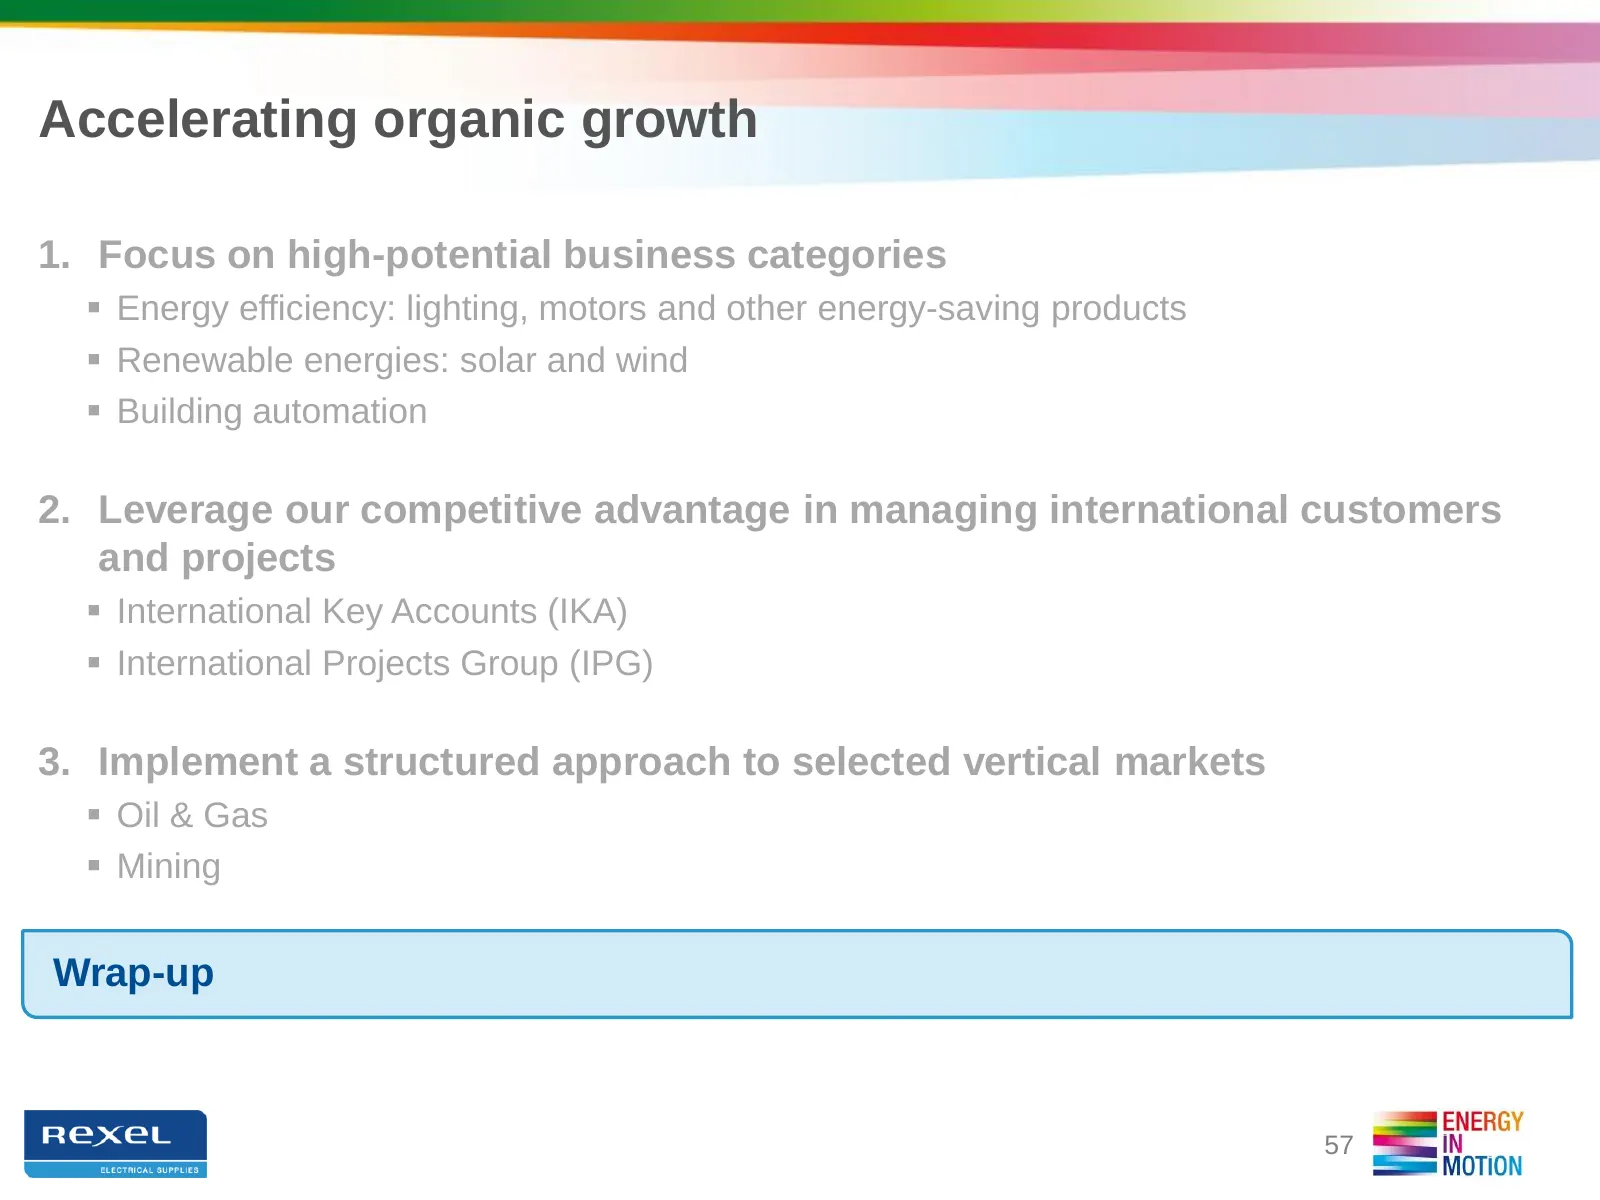
Accelerating organic growth 1. Focus on high-potential business categories Energy efficiency: lighting, motors and other energy-saving products Renewable energies: solar and wind Building automation 2. Leverage our competitive advantage in managing international customers and projects Intern
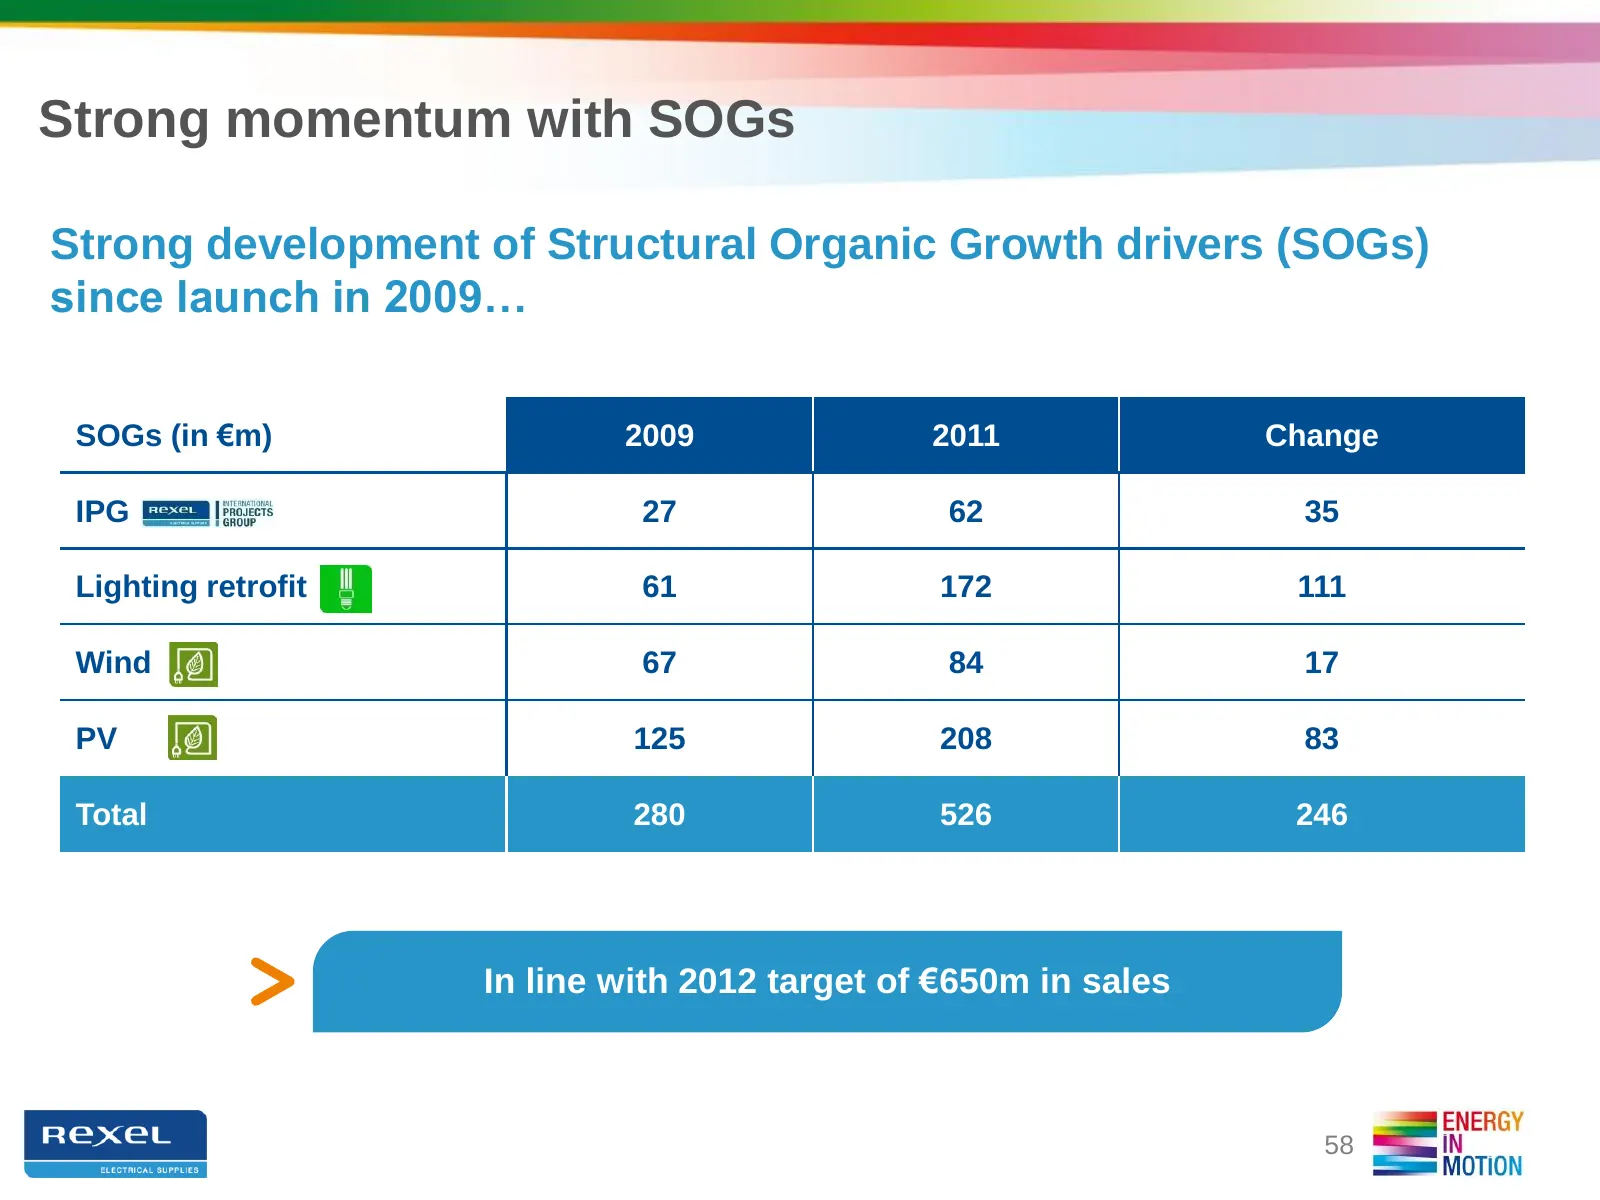
Slide 58: Strong momentum with SOGs since launch in 2009
Strong momentum with SOGs Strong development of Structural Organic Growth drivers (SOGs) since launch in 2009… SOGs (in €m) 2009 2011 Change IPG 27 62 35 Lighting retrofit 61 172 111 Wind 67 84 17 PV 125 208 83 Total 280 526 246 In line with 2012 target of €650m in sales 58
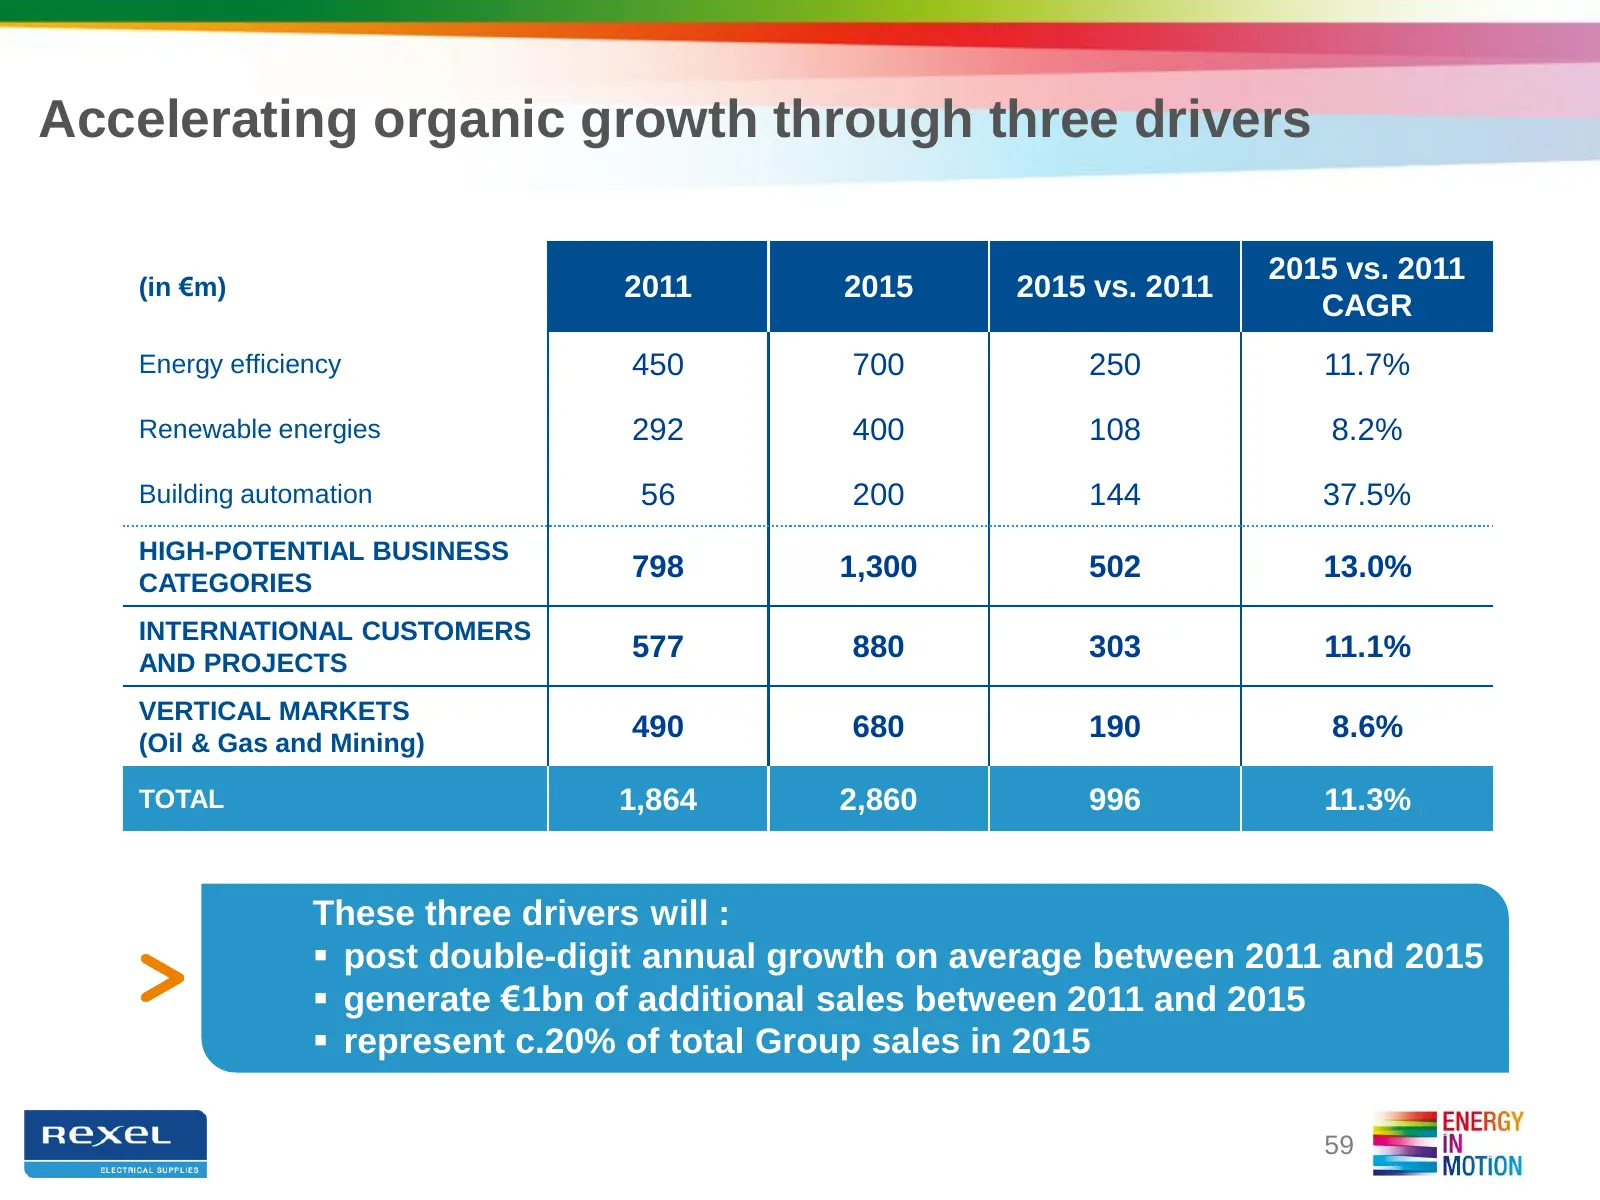
Slide 59: Accelerating organic growth through three drivers
Accelerating organic growth through three drivers 2015 vs. 2011 (in €m) 2011 2015 2015 vs. 2011 CAGR Energy efficiency 450 700 250 11.7% Renewable energies 292 400 108 8.2% Building automation 56 200 144 37.5% HIGH-POTENTIAL BUSINESS CATEGORIES 798 1,300 502 13.0% INTERNATIONAL CUSTOMERS AND PROJECT
Slide 60: Consolidating the market
CONSOLIDATING THE MARKET Pascal MARTIN, Group Senior VP, Corporate Strategy, Business Portfolio Management and New Business Development
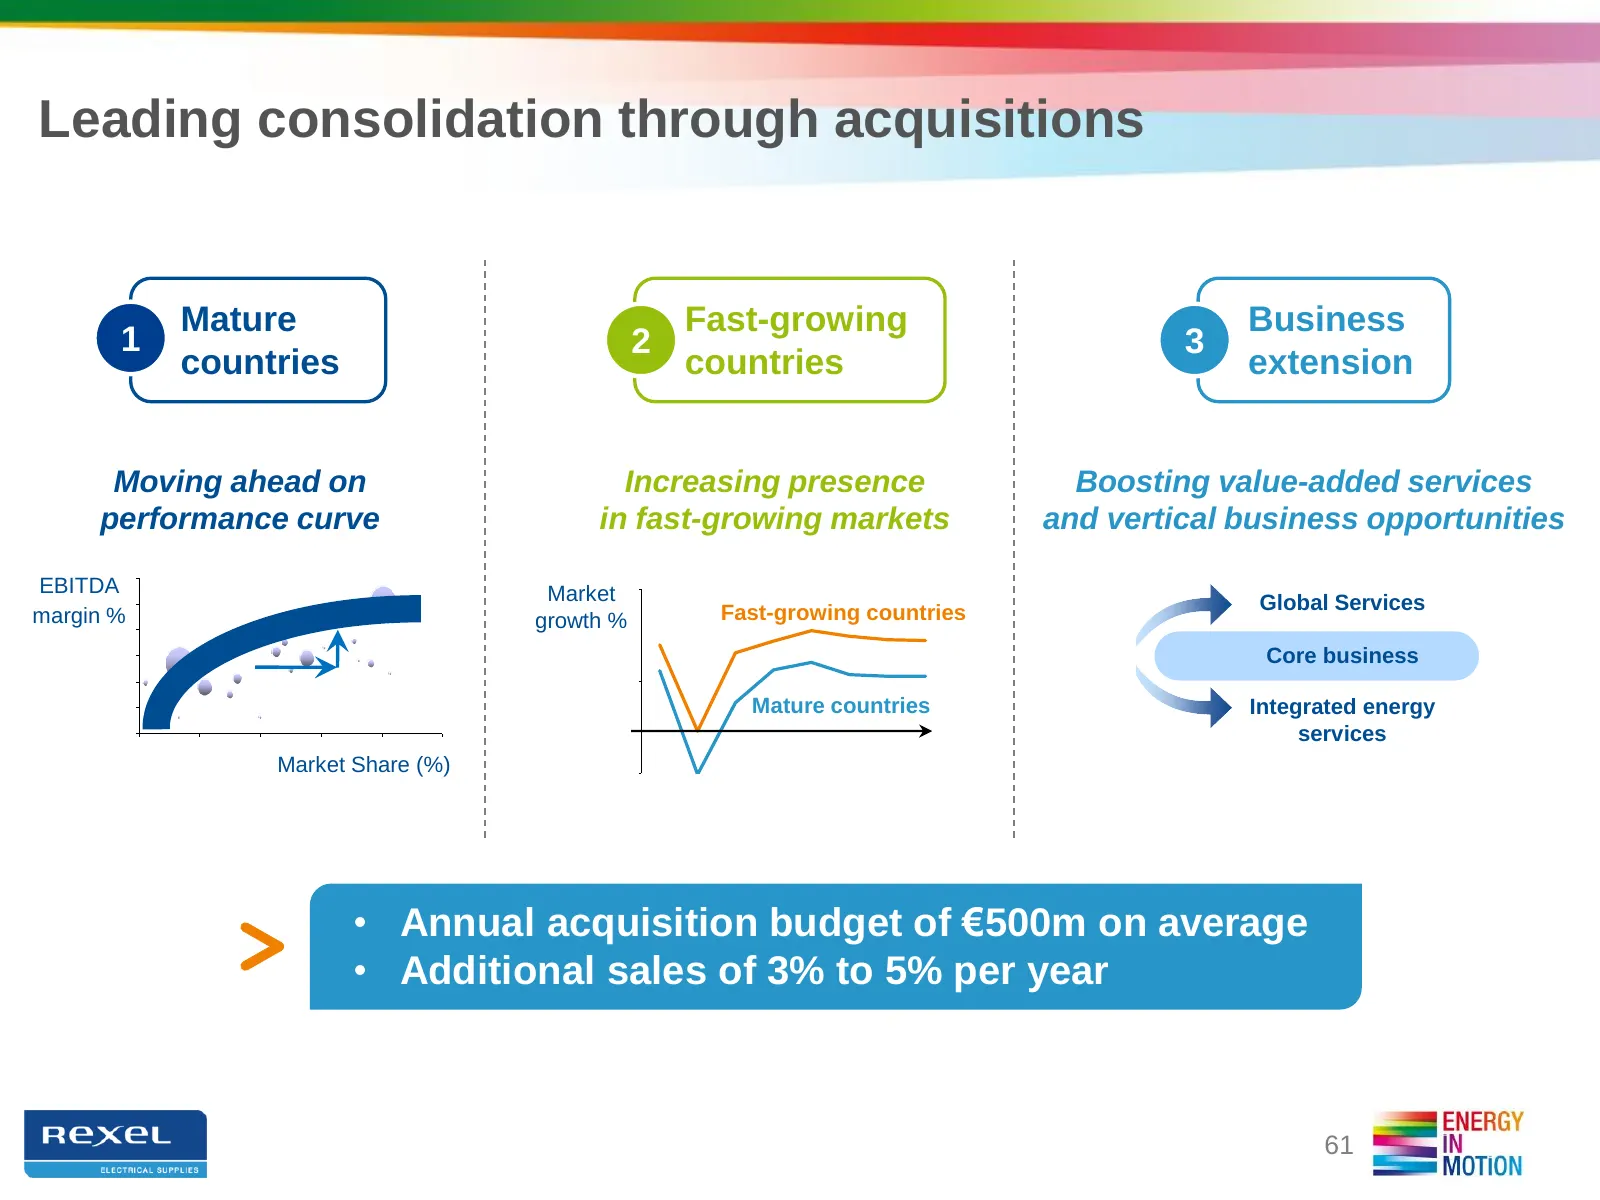
Slide 61: Leading consolidation through acquisitions
Leading consolidation through acquisitions Mature Fast-growing Business 1 2 3 countries countries extension Moving ahead on Increasing presence Boosting value-added services performance curve in fast-growing markets and vertical business opportunities 12% EBITDA Market 10% Fast-growing countries Glo
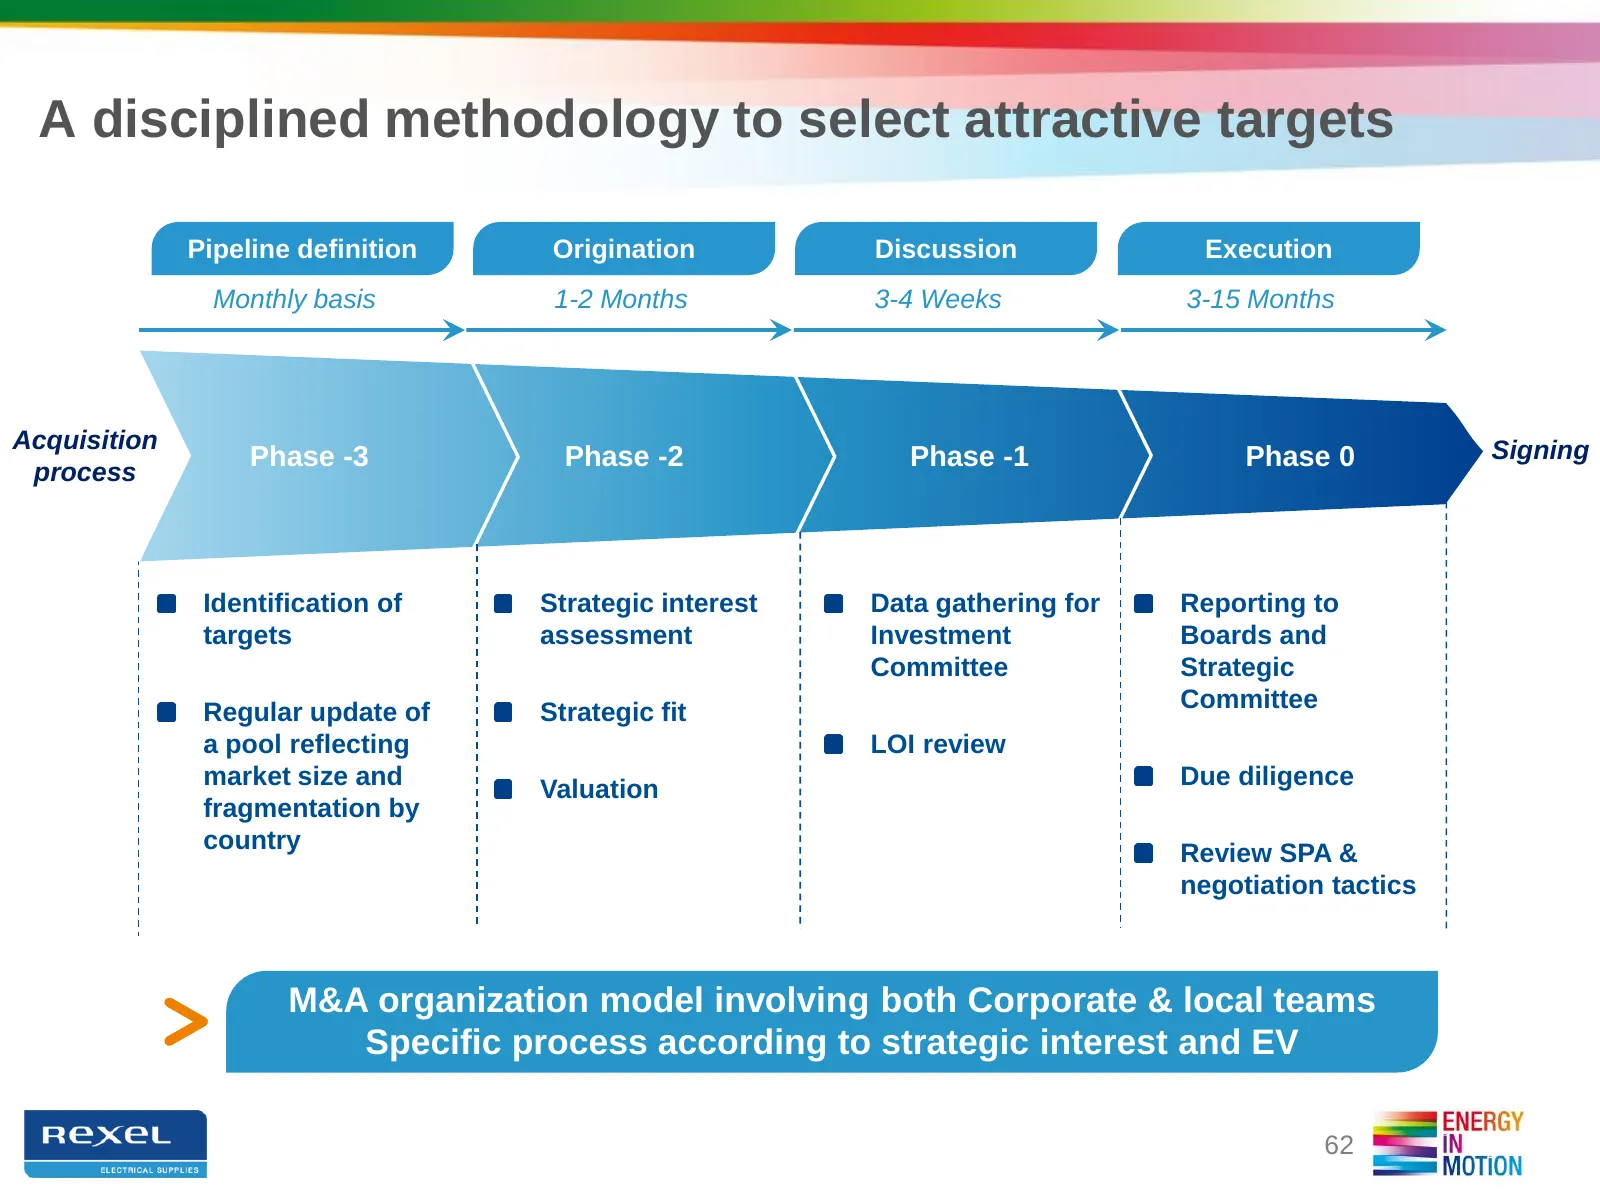
Slide 62: A disciplined methodology to select attractive targets
A disciplined methodology to select attractive targets Pipeline definition Origination Discussion Execution Monthly basis 1-2 Months 3-4 Weeks 3-15 Months Acquisition Signing Phase -3 Phase -2 Phase -1 Phase 0 process Identification of Strategic interest Data gathering for Reporting to targets asses
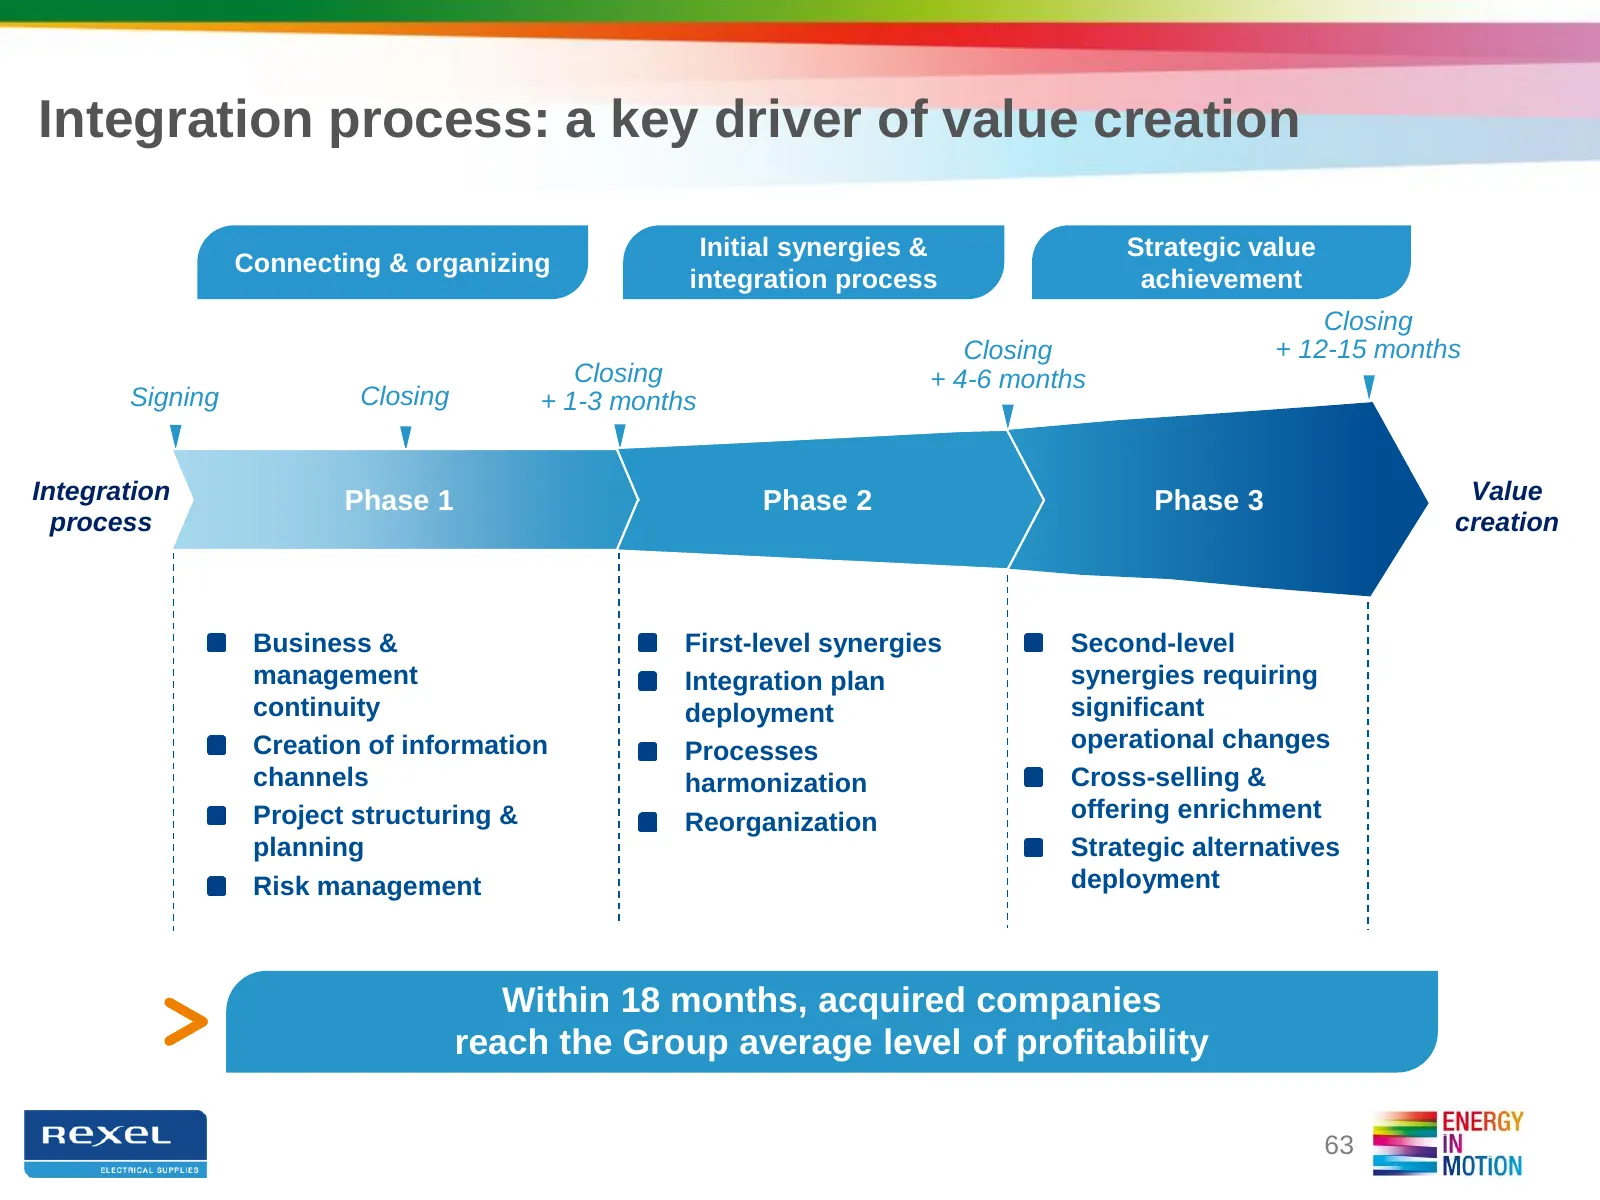
Slide 63: Integration process: a key driver of value creation
Integration process: a key driver of value creation Initial synergies & Strategic value Connecting & organizing integration process achievement Closing Closing + 12-15 months Closing + 4-6 months Signing Closing + 1-3 months Integration Phase 1 Phase 2 Phase 3 Value process creation Business & First
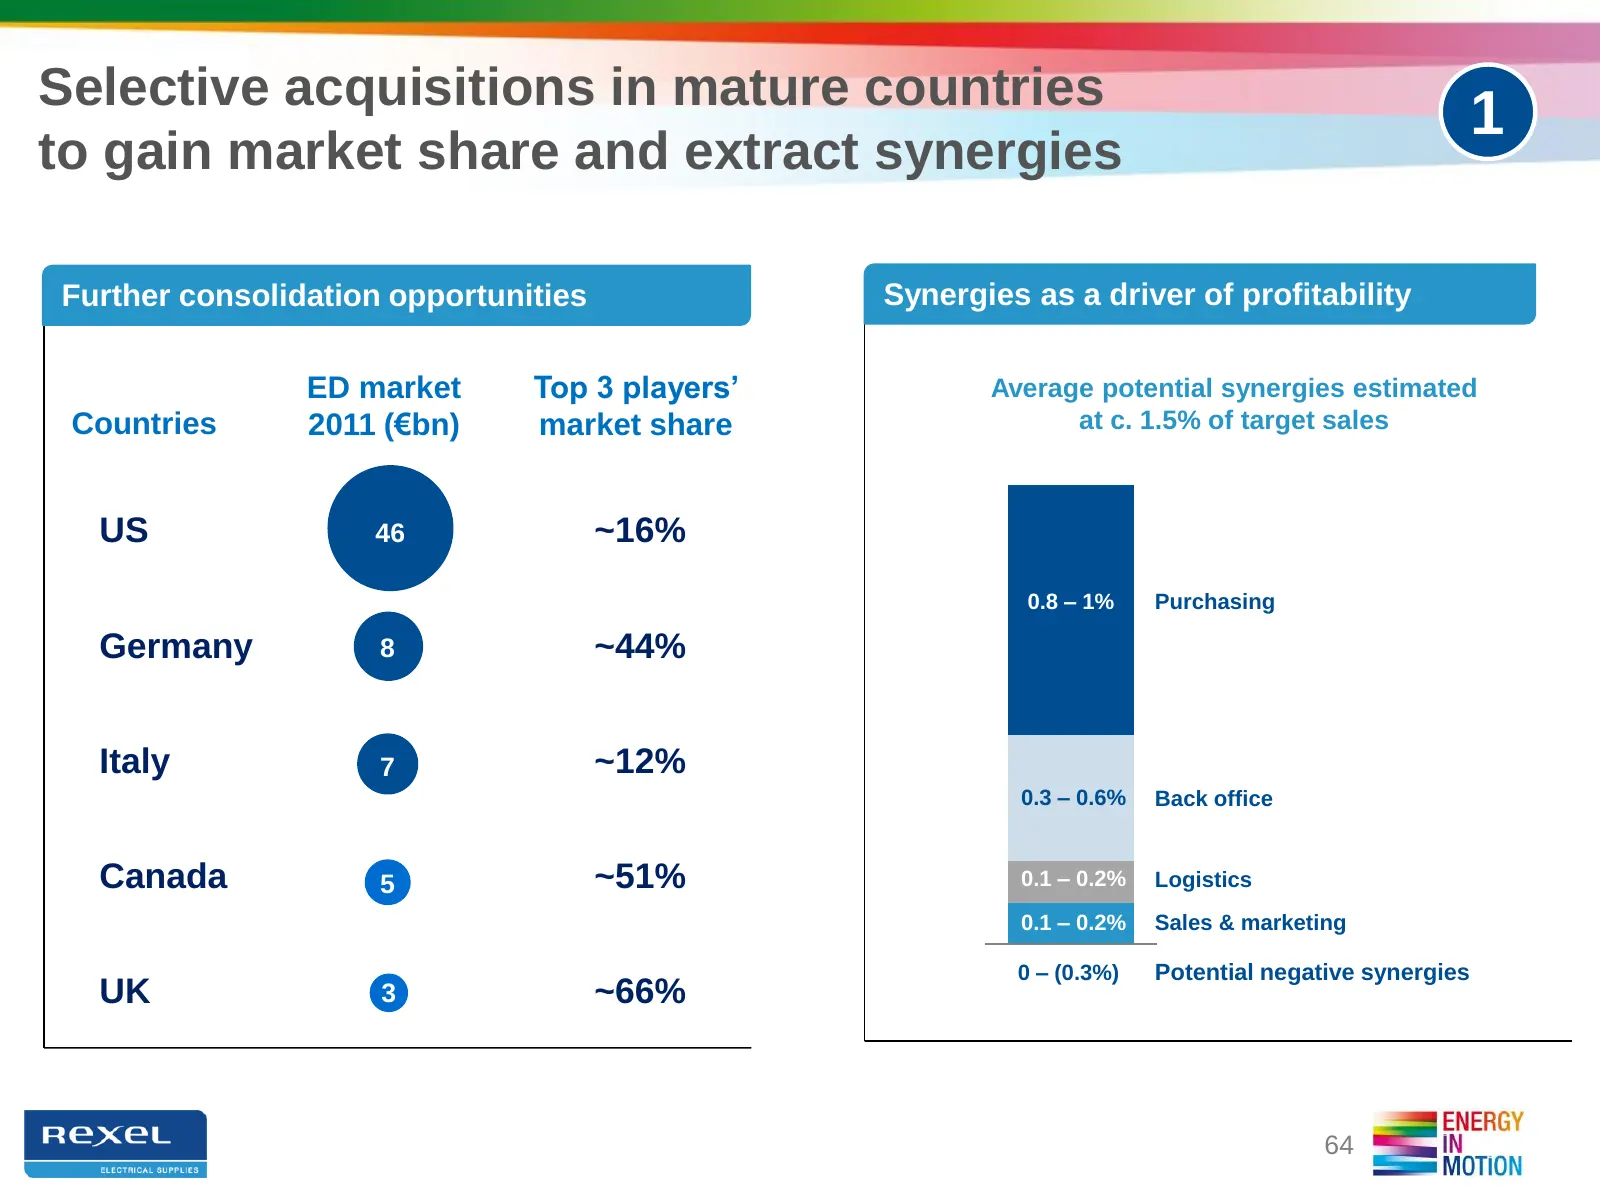
Slide 64: Selective acquisitions in mature countries to gain market share and extract synergies
Selective acquisitions in mature countries 1 to gain market share and extract synergies Further consolidation opportunities Synergies as a driver of profitability ED market Top 3 players’ Average potential synergies estimated Countries 2011 (€bn) market share at c. 1.5% of target sales US 46 ~16% 0.
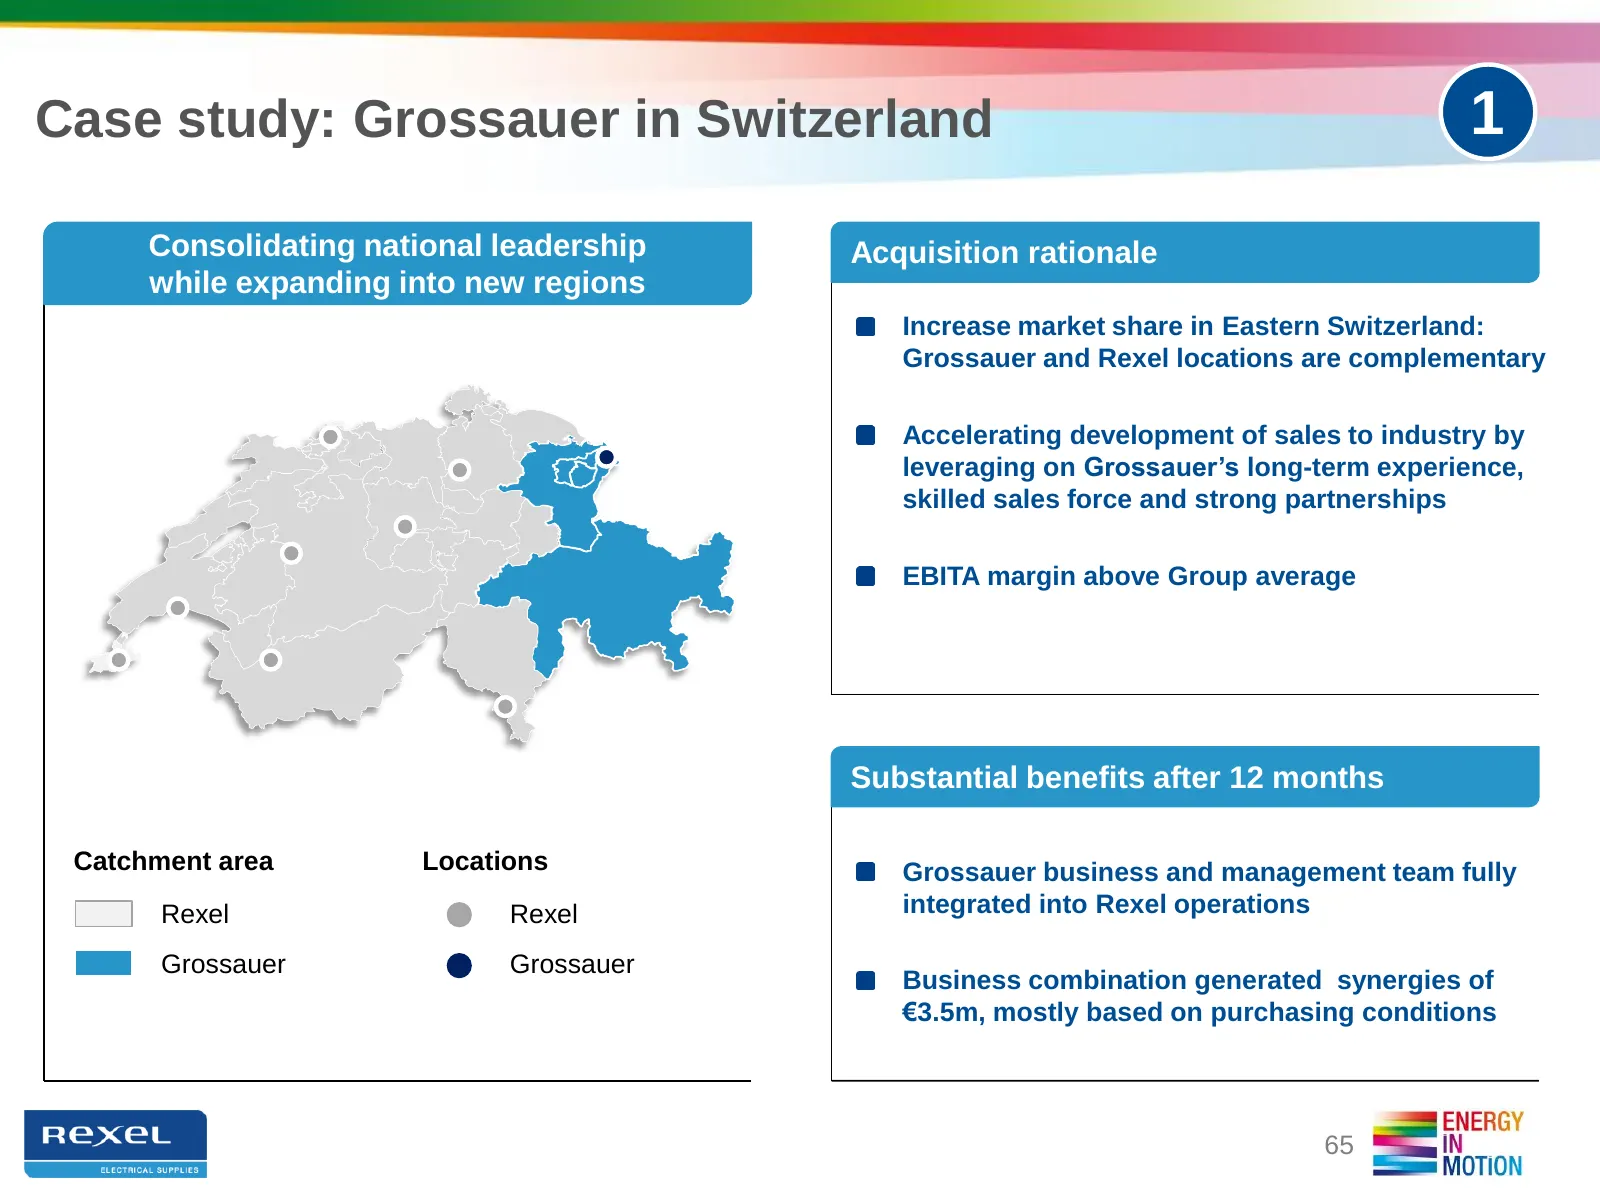
Slide 65: Case study: Grossauer in Switzerland
Case study: Grossauer in Switzerland 1 Consolidating national leadership Acquisition rationale while expanding into new regions Increase market share in Eastern Switzerland: Grossauer and Rexel locations are complementary Accelerating development of sales to industry by leveraging on Grossauer’s lon
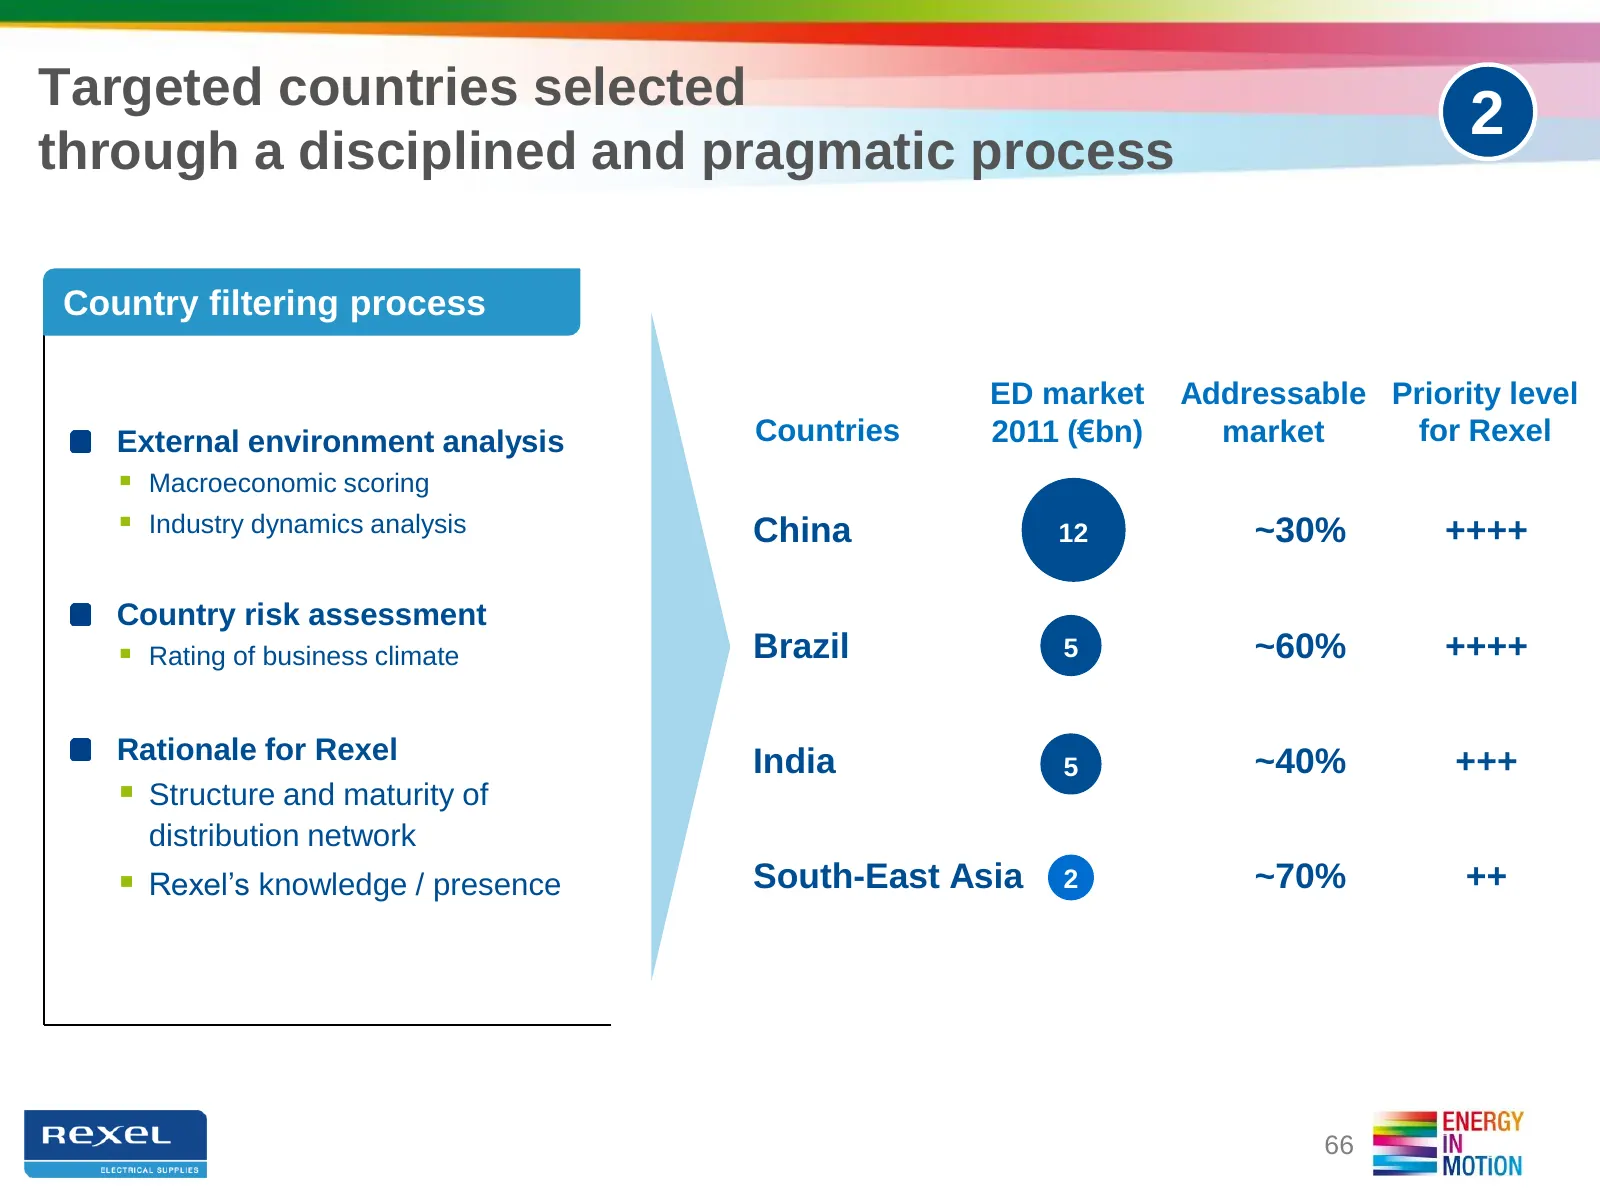
Slide 66: Targeted countries selected through a disciplined and pragmatic process
Targeted countries selected 2 through a disciplined and pragmatic process Country filtering process ED market Addressable Priority level External environment analysis Countries 2011 (€bn) market for Rexel Macroeconomic scoring Industry dynamics analysis China 12 ~30% ++++ Country risk assessment
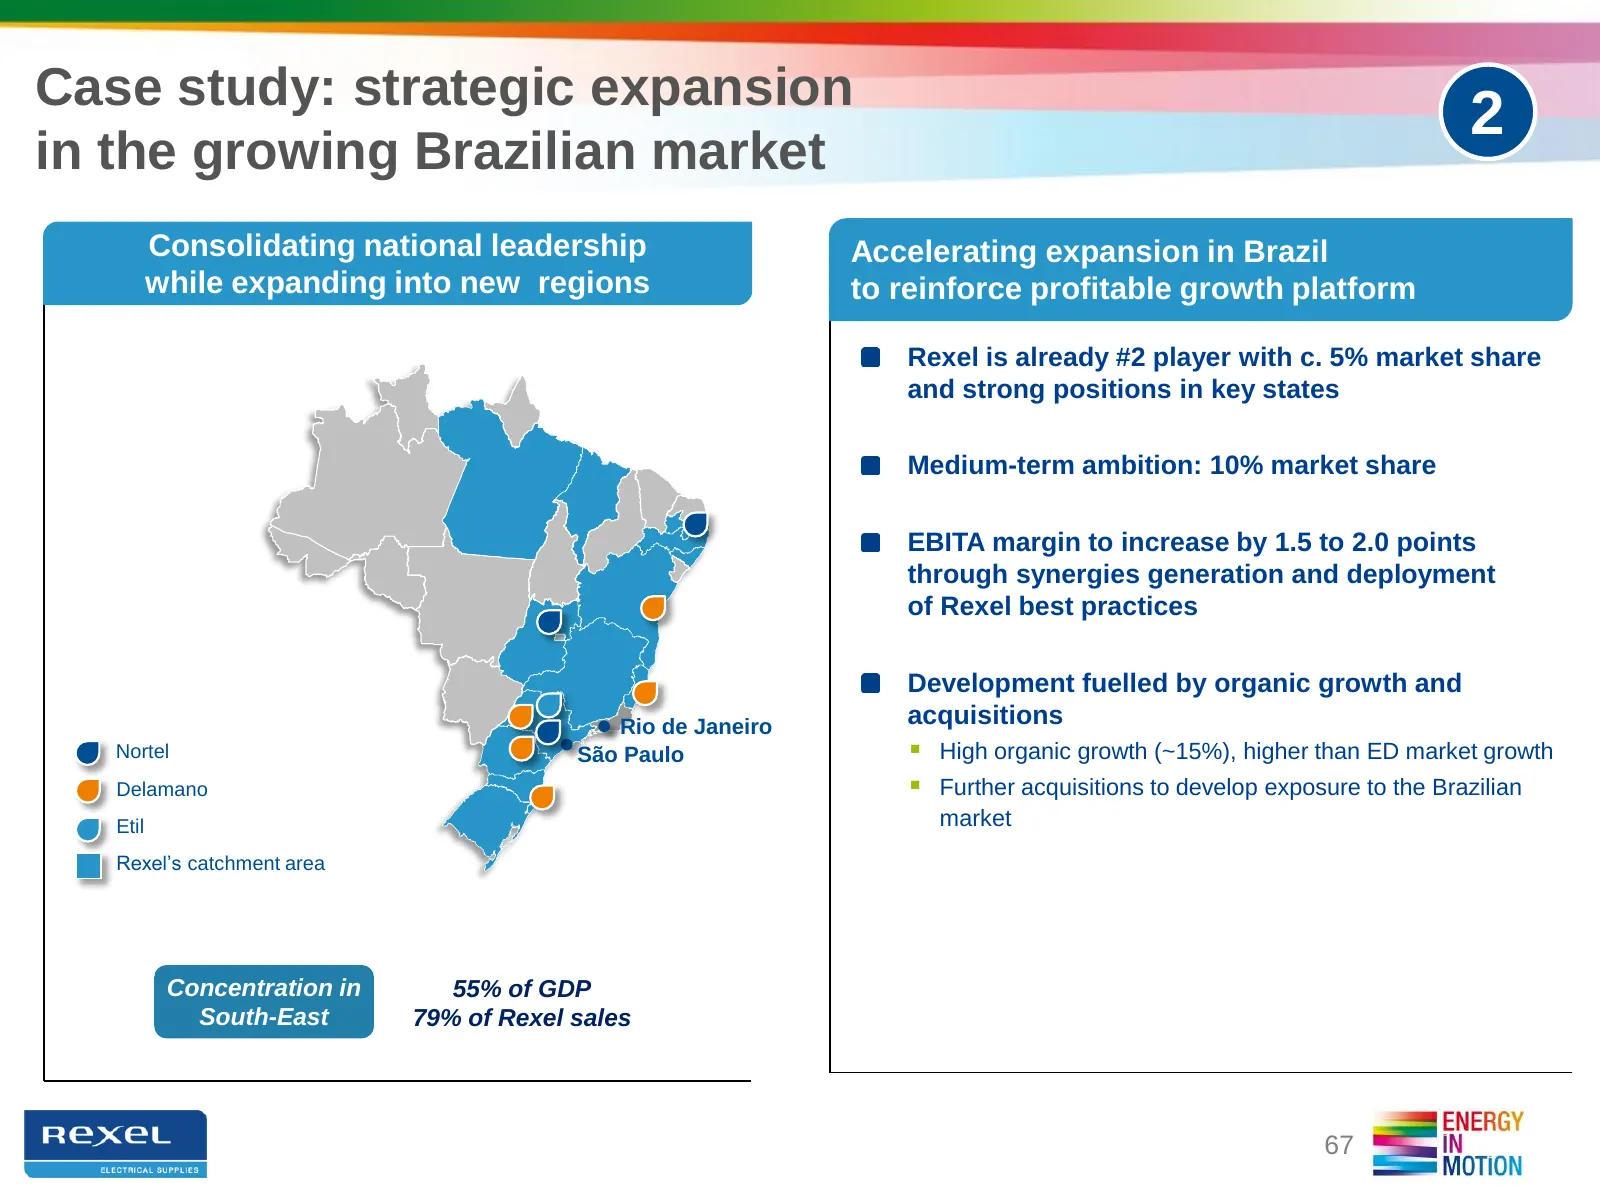
Slide 67: Case study: strategic expansion in the growing Brazilian market
Case study: strategic expansion 2 in the growing Brazilian market Consolidating national leadership Accelerating expansion in Brazil while expanding into new regions to reinforce profitable growth platform Rexel is already #2 player with c. 5% market share and strong positions in key states Medium-t
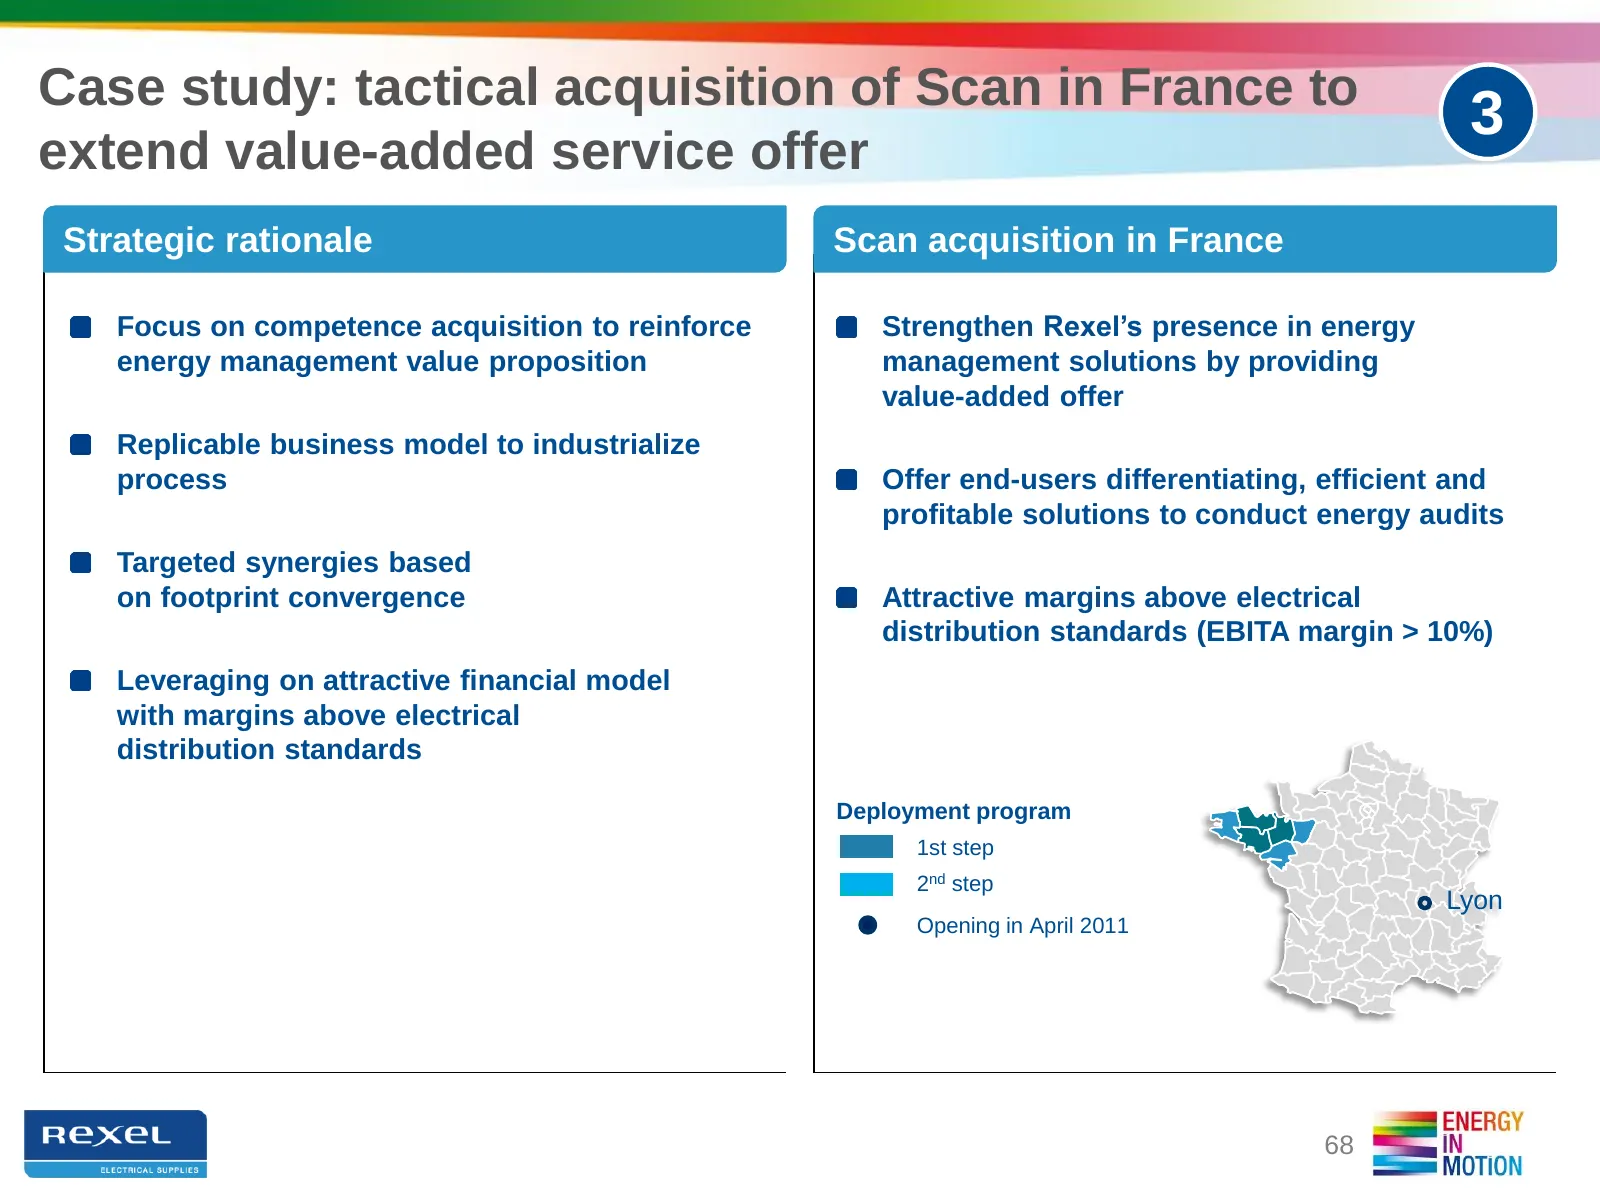
Slide 68: Case study: tactical acquisition of Scan in France
Case study: tactical acquisition of Scan in France to 3 extend value-added service offer Strategic rationale Scan acquisition in France Focus on competence acquisition to reinforce Strengthen Rexel’s presence in energy energy management value proposition management solutions by providing value-added
Slide 69: Enhancing operational excellence
ENHANCING OPERATIONAL EXCELLENCE Pascal MARTIN, Group Senior VP, Corporate Strategy, Business Portfolio Management and New Business Development
Slide 70: A customer-centric approach through a multi-channel model
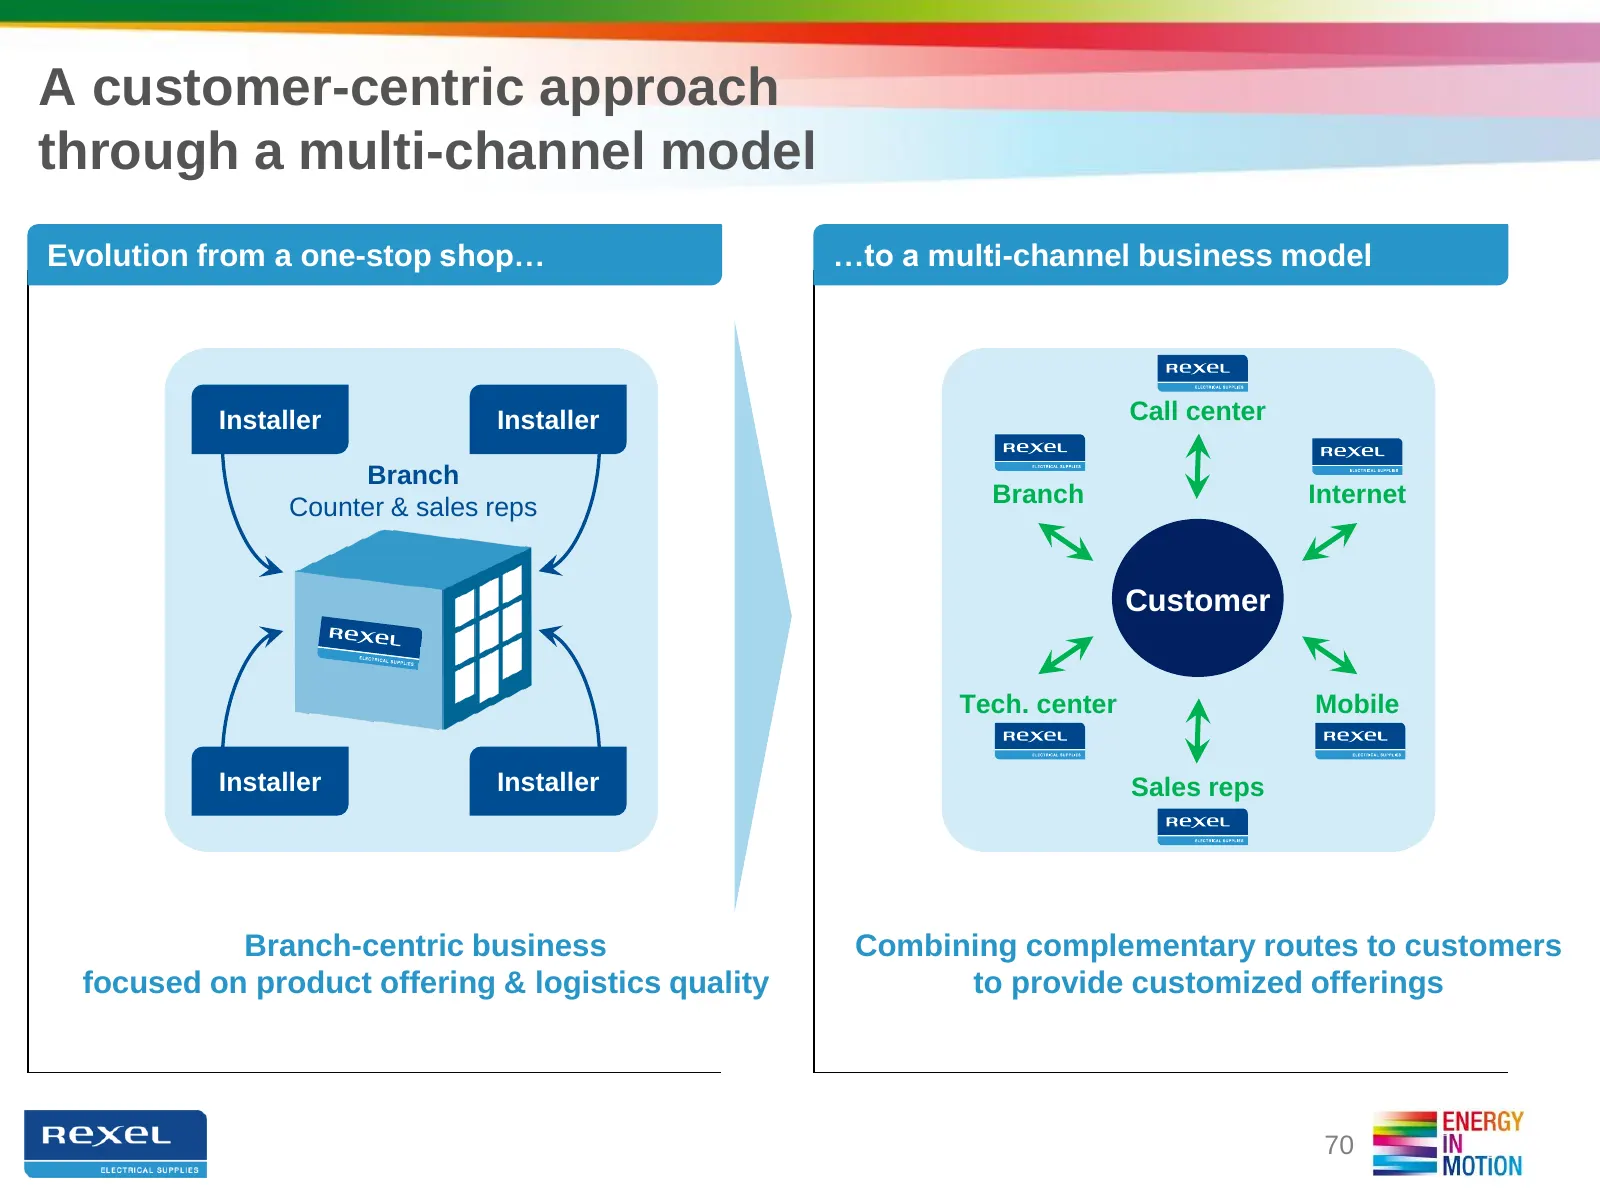
A customer-centric approach through a multi-channel model Evolution from a one-stop shop… …to a multi-channel business model Installer Installer Call center Branch Counter & sales reps Branch Internet Customer Tech. center Mobile Installer Installer Sales reps Branch-centric business Combining compl
Slide 71: e-commerce is entering a new development phase
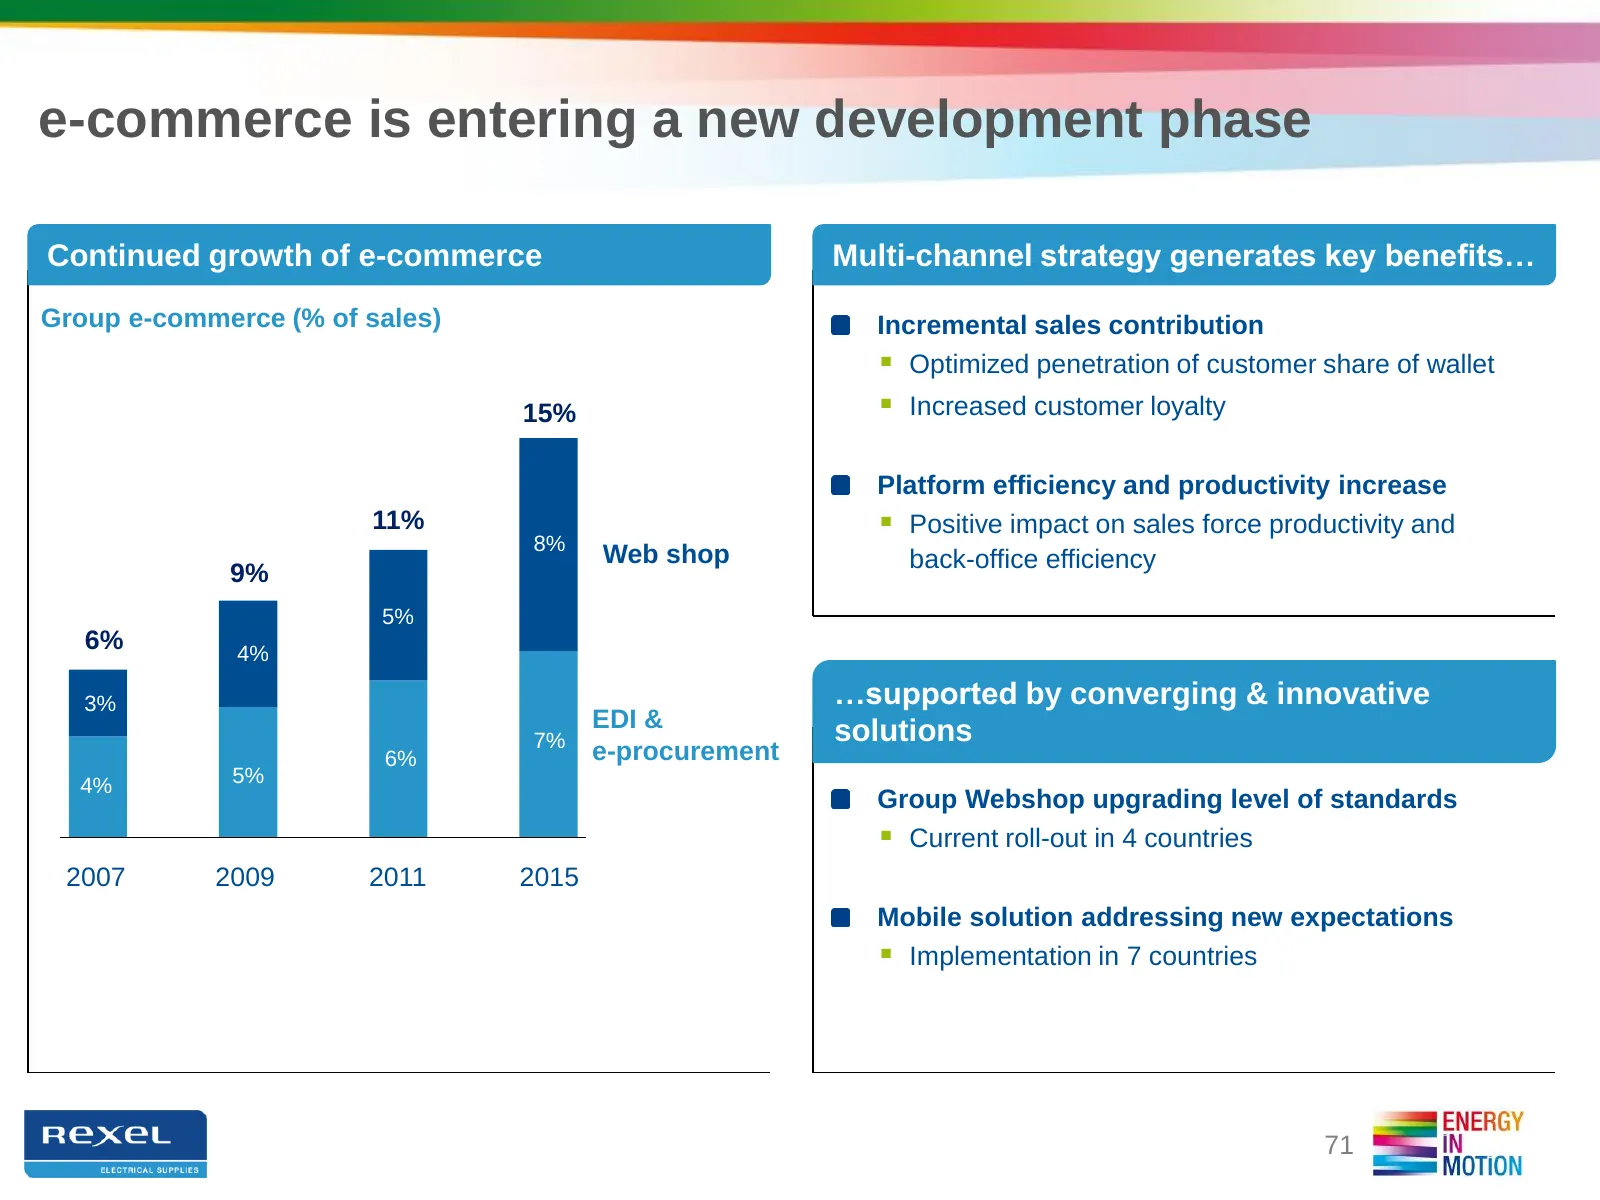
e-commerce is entering a new development phase Continued growth of e-commerce Multi-channel strategy generates key benefits… Group e-commerce (% of sales) Incremental sales contribution Optimized penetration of customer share of wallet 15% Increased customer loyalty Platform efficiency and produ
Slide 72: Case study: rapid growth of e-commerce in Austria
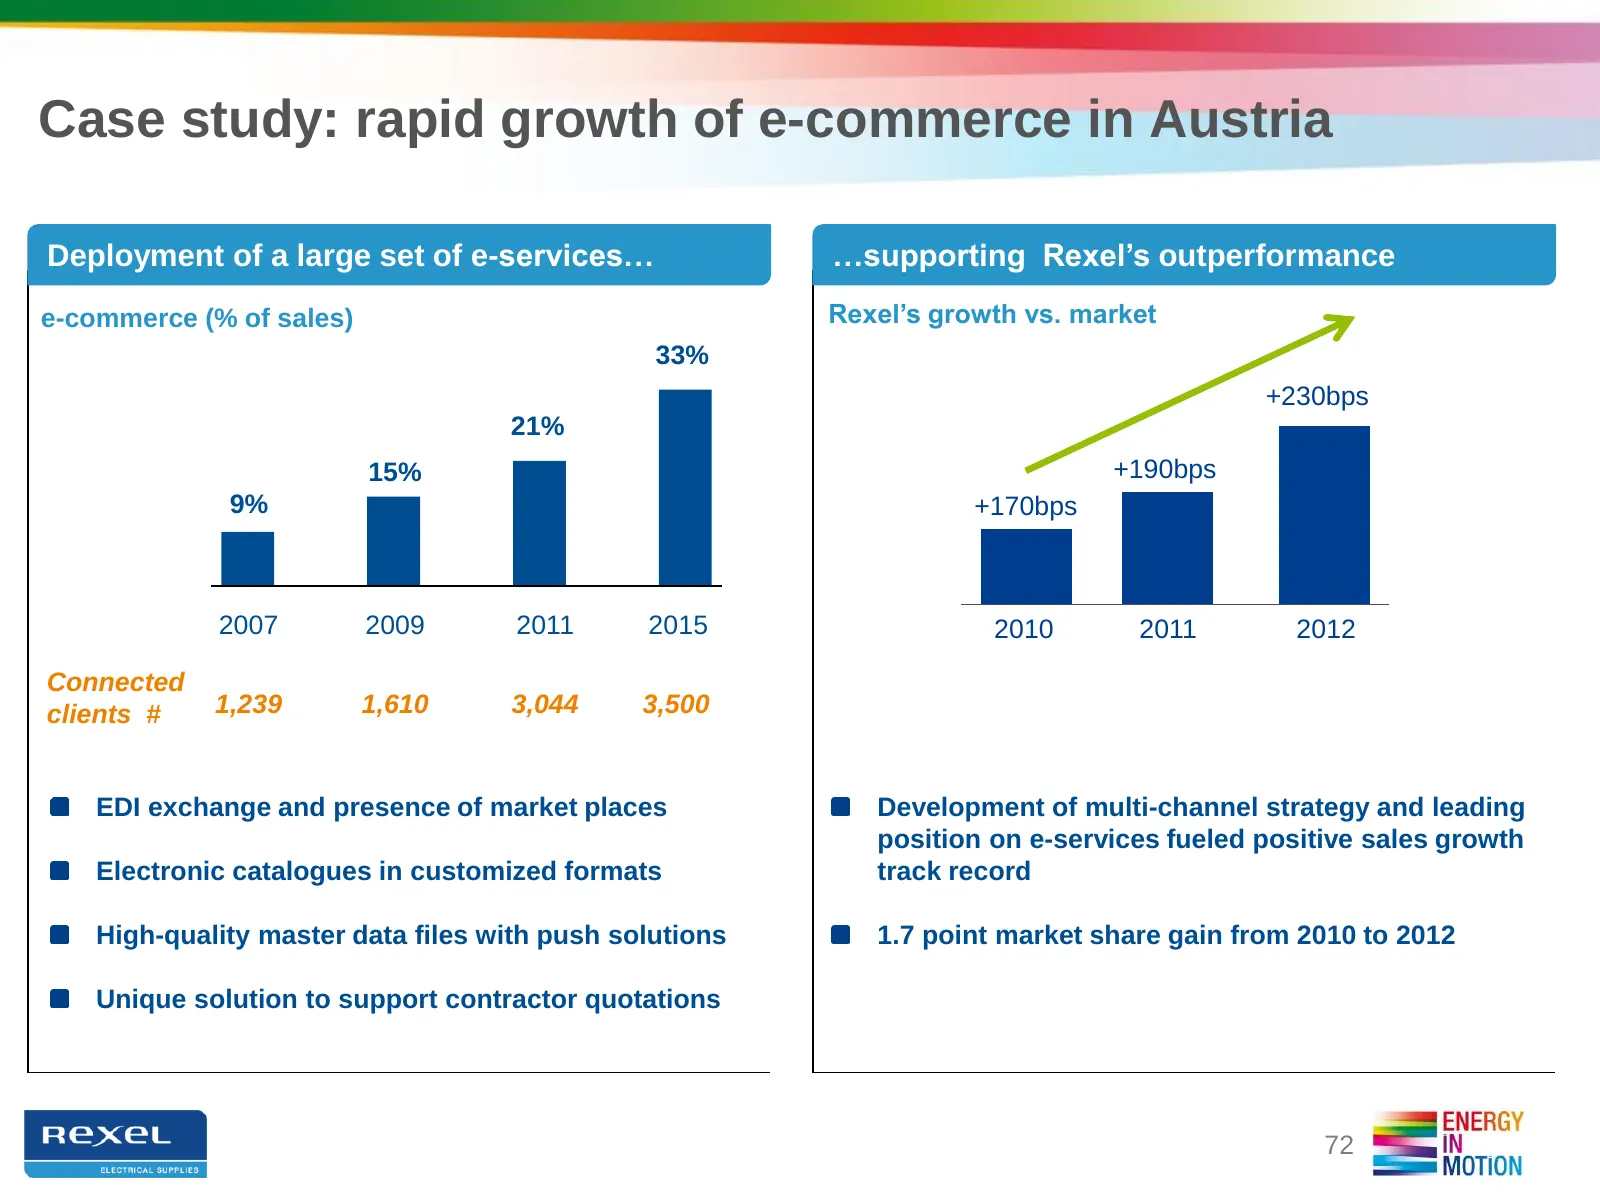
Case study: rapid growth of e-commerce in Austria Deployment of a large set of e-services… …supporting Rexel’s outperformance e-commerce (% of sales) Rexel’s growth vs. market 33% +230bps 21% 15% +190bps 9% +170bps 2007 2009 2011 2015 2010 2011 2012 Connected clients # 1,239 1,610 3,044 3,500 EDI ex
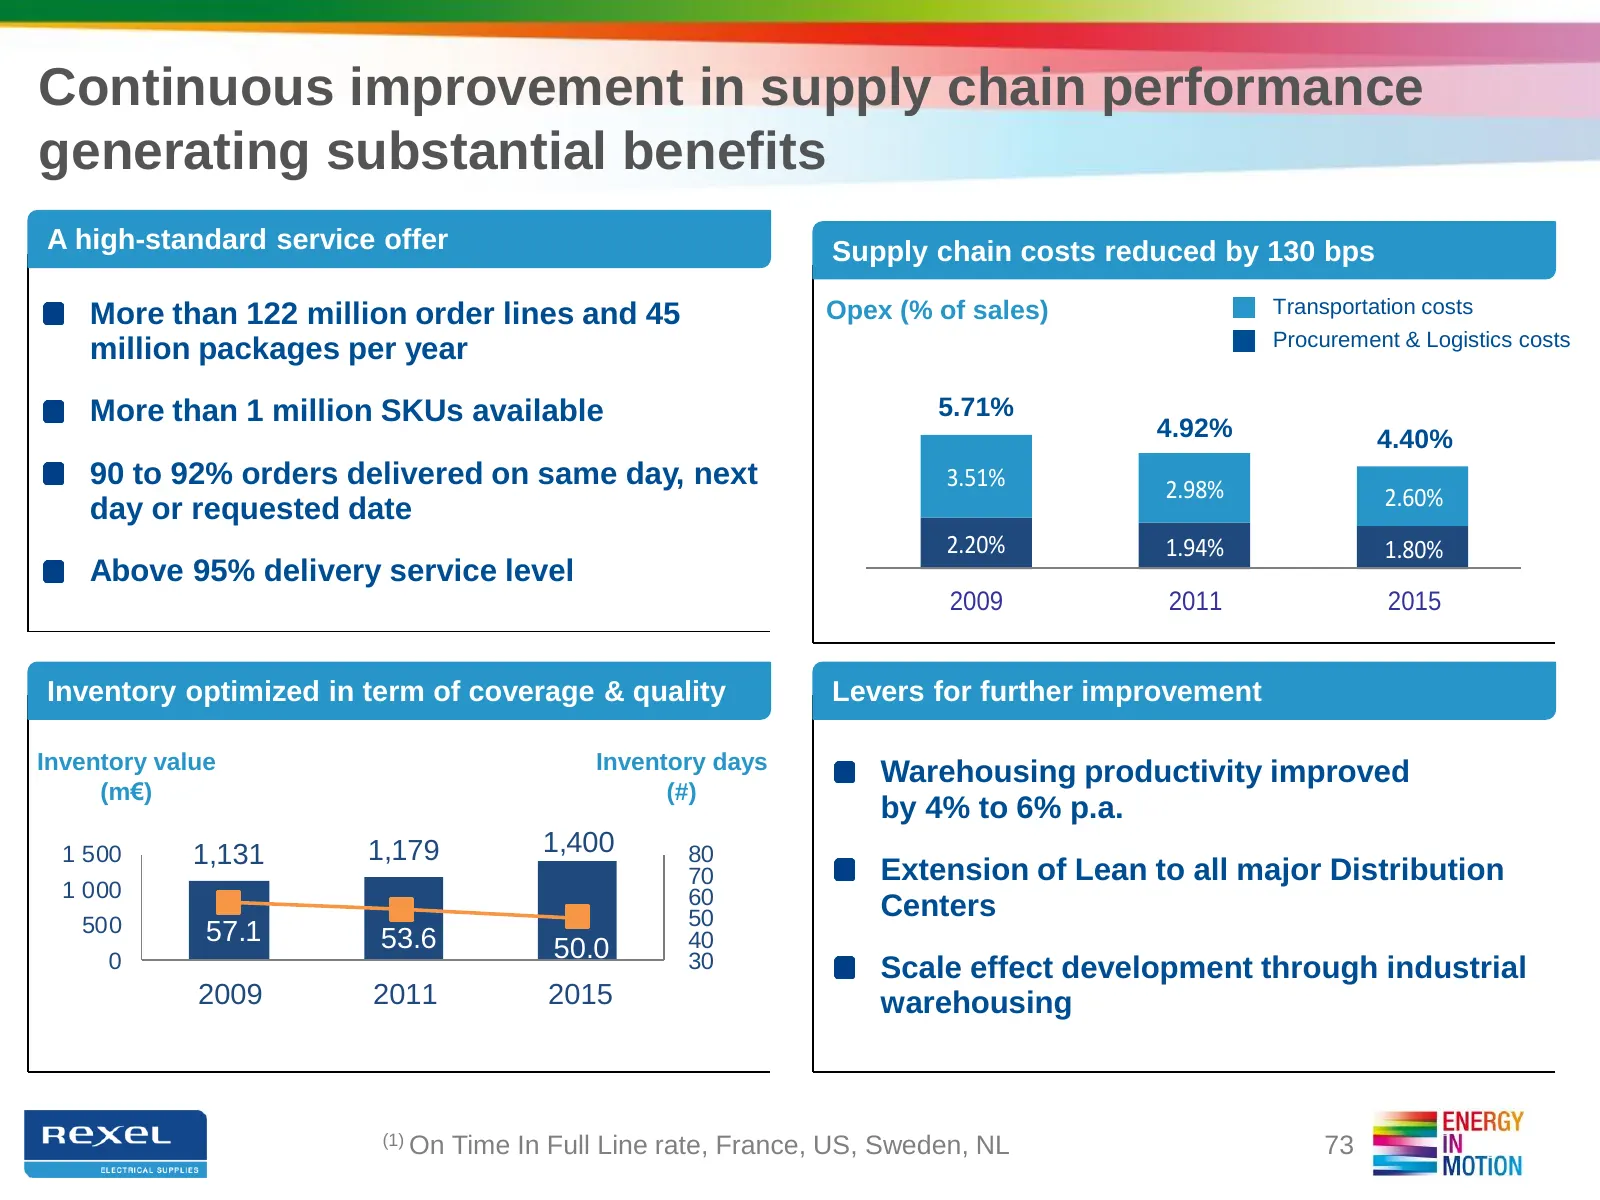
Slide 73: Continuous improvement in supply chain performance
Continuous improvement in supply chain performance generating substantial benefits A high-standard service offer Supply chain costs reduced by 130 bps More than 122 million order lines and 45 Opex (% of sales) Transportation costs Procurement & Logistics costs million packages per year More than 1 m
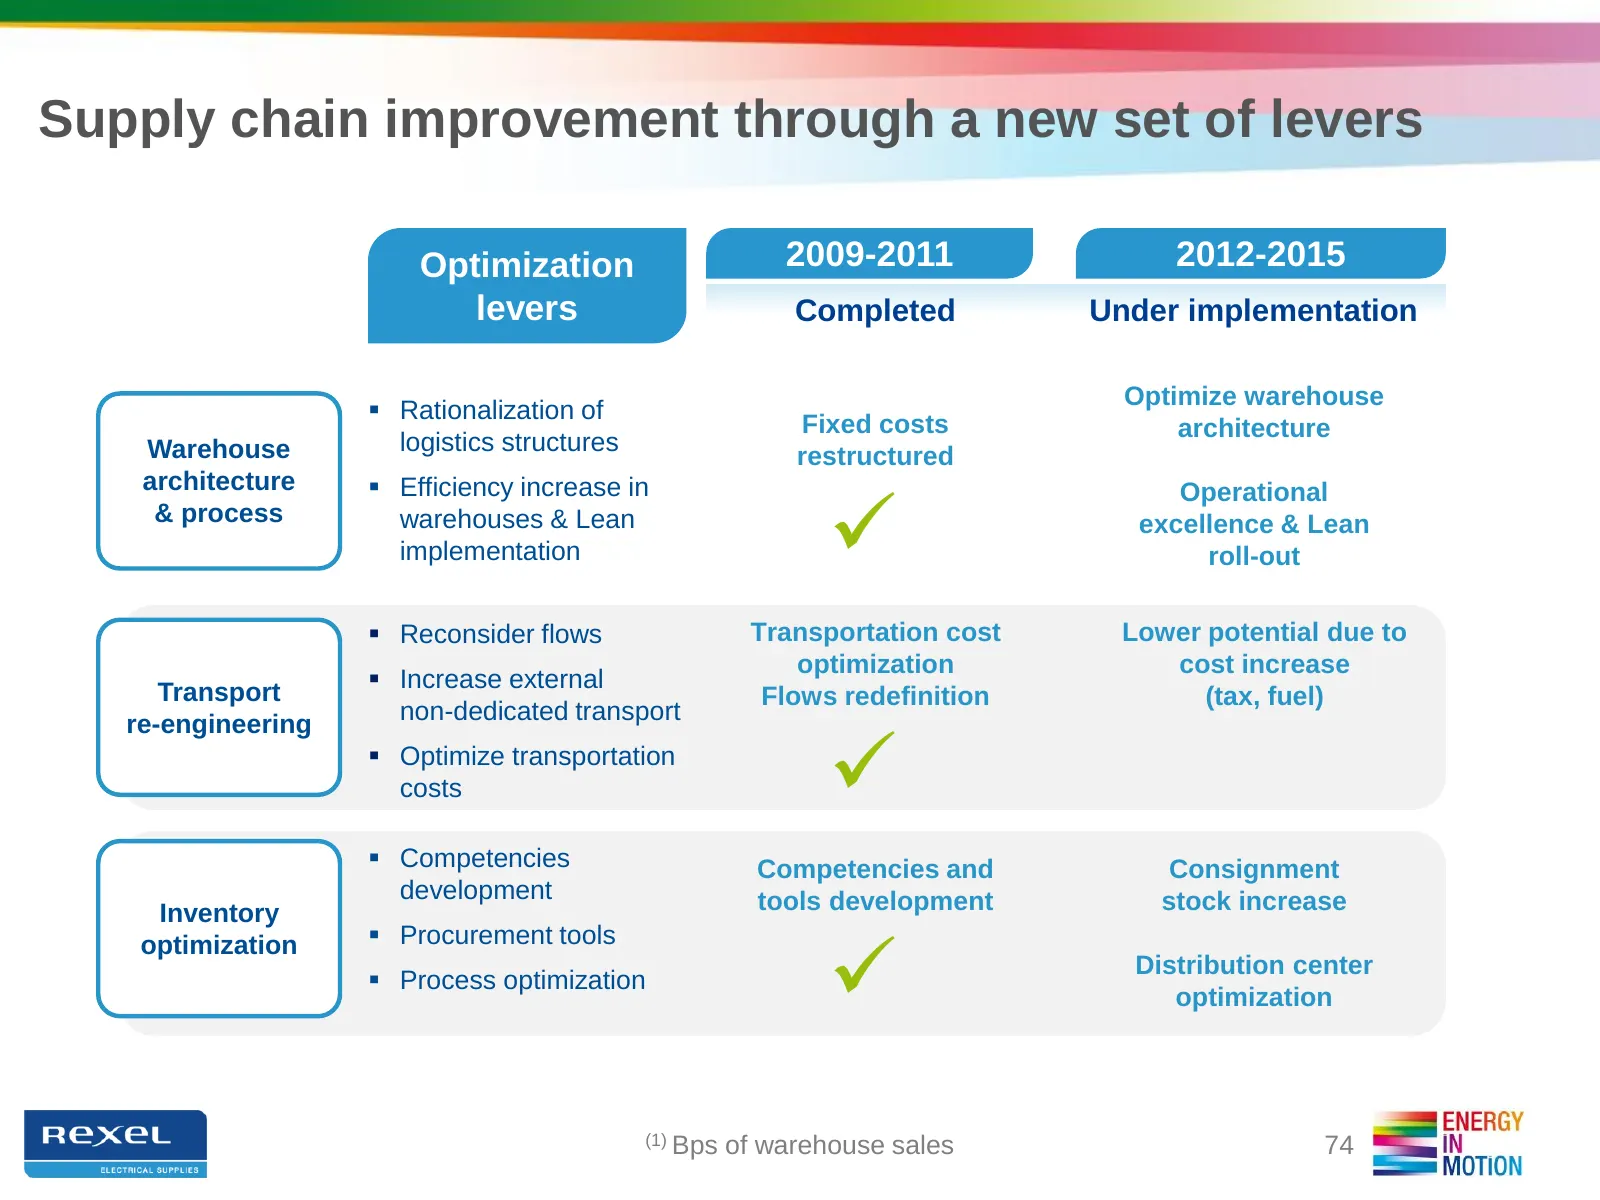
Slide 74: Supply chain improvement through a new set of levers
Supply chain improvement through a new set of levers Optimization 2009-2011 2012-2015 levers Completed Under implementation Optimize warehouse Rationalization of Fixed costs architecture Warehouse logistics structures restructured architecture Efficiency increase in Operational & process wareh
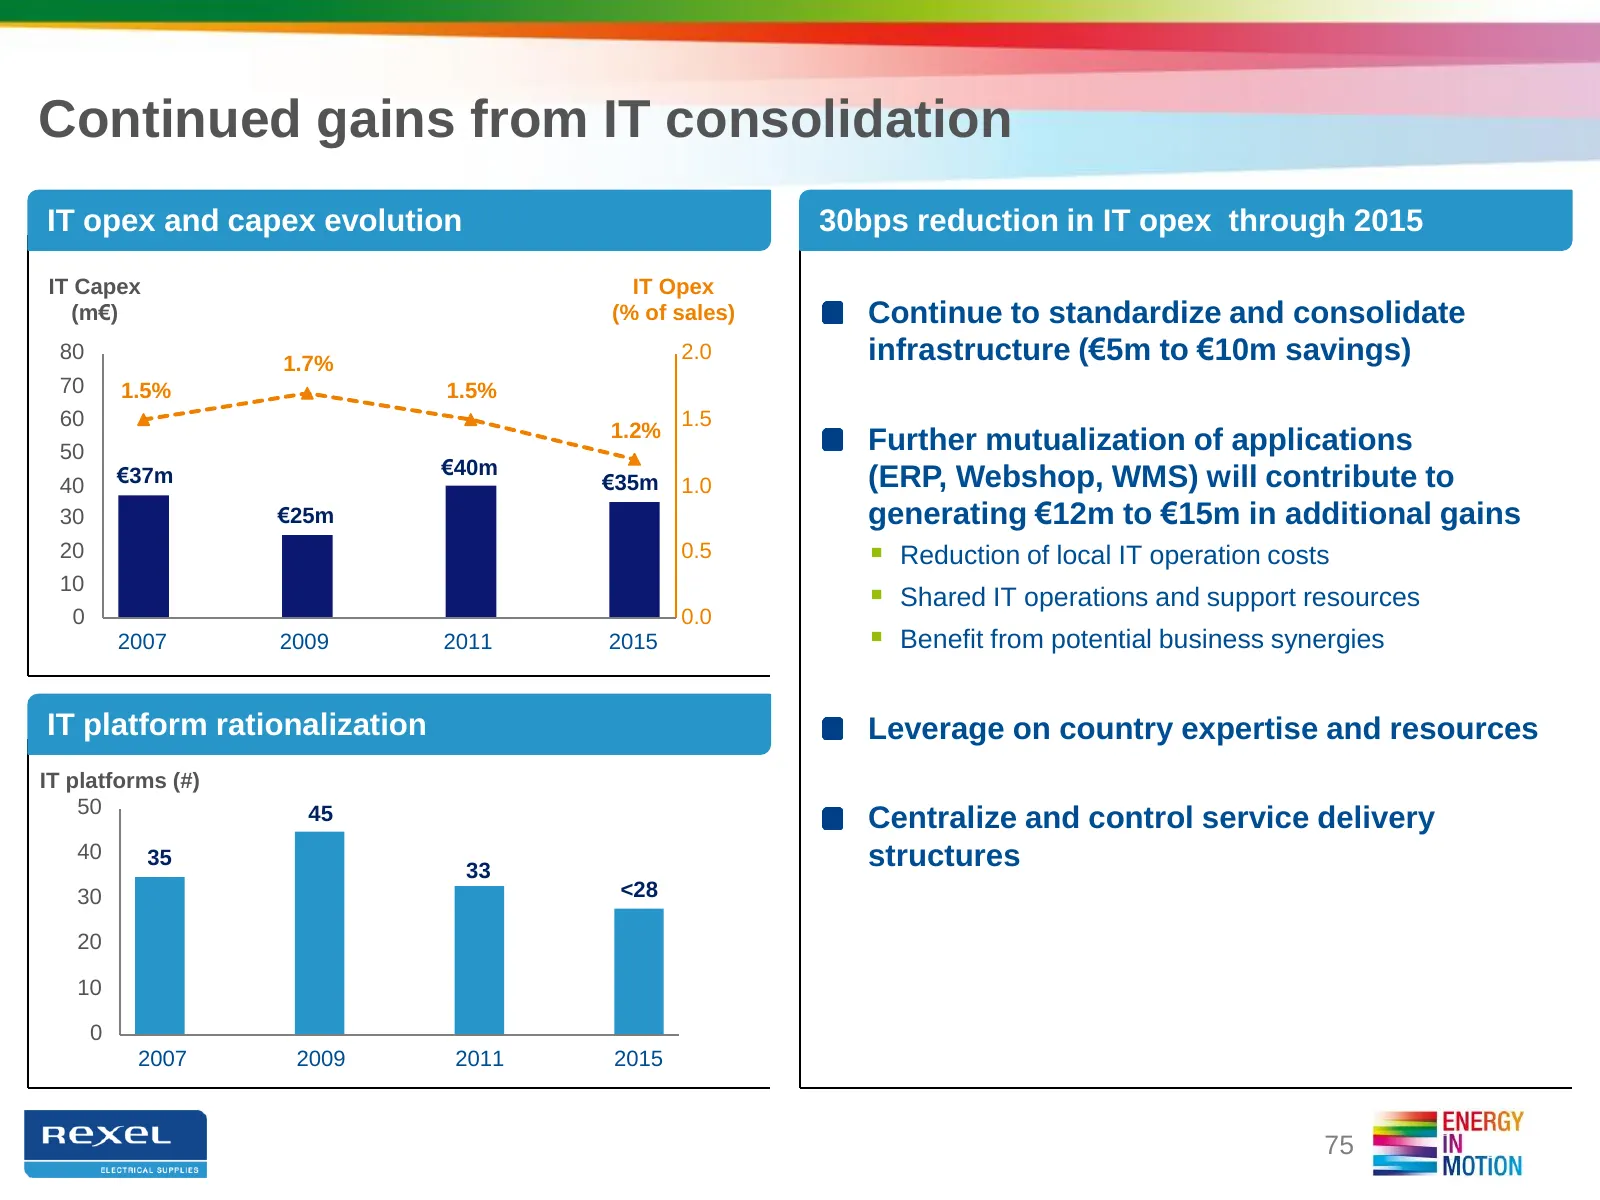
Slide 75: Continued gains from IT consolidation
Continued gains from IT consolidation IT opex and capex evolution 30bps reduction in IT opex through 2015 IT Capex IT Opex (m€) (% of sales) Continue to standardize and consolidate 80 1.7% 2.0 infrastructure (€5m to €10m savings) 70 1.5% 1.5% 60 1.5 1.2% 50 Further mutualization of applications €37m
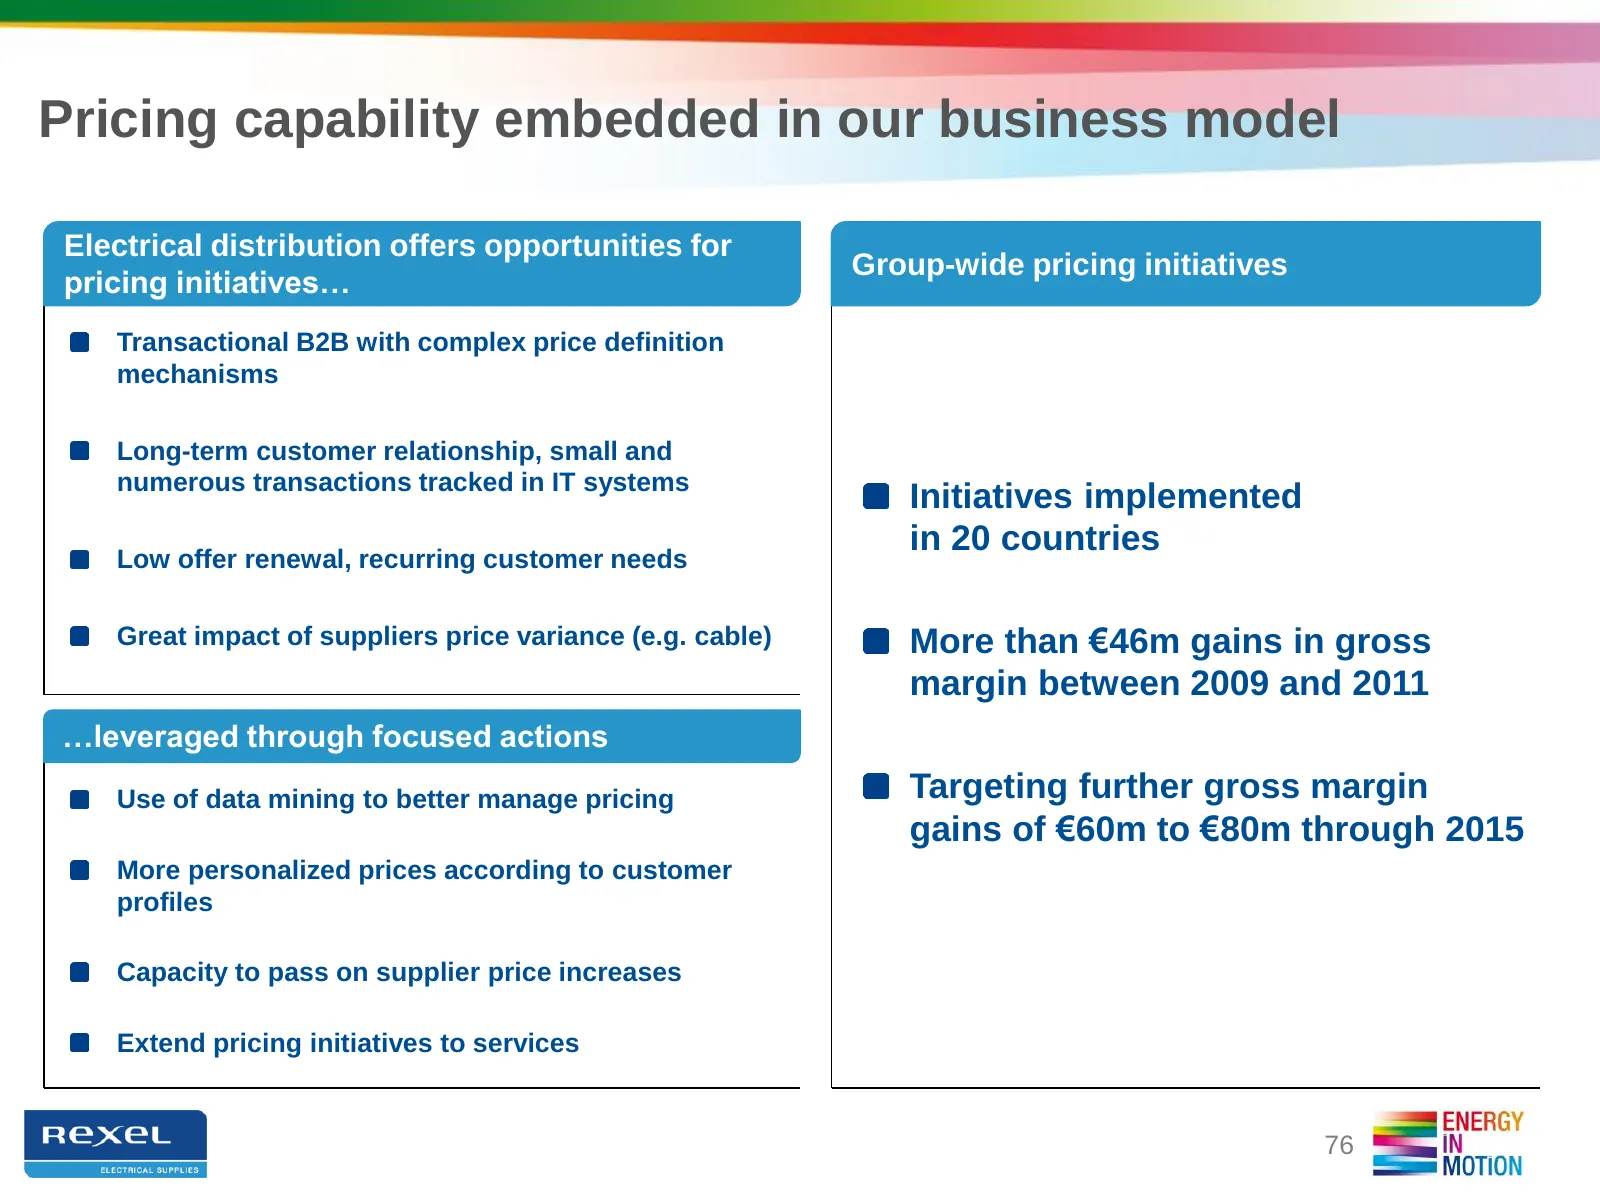
Slide 76: Pricing capability embedded in our business model
Pricing capability embedded in our business model Electrical distribution offers opportunities for Group-wide pricing initiatives pricing initiatives… Transactional B2B with complex price definition mechanisms Long-term customer relationship, small and numerous transactions tracked in IT systems Ini
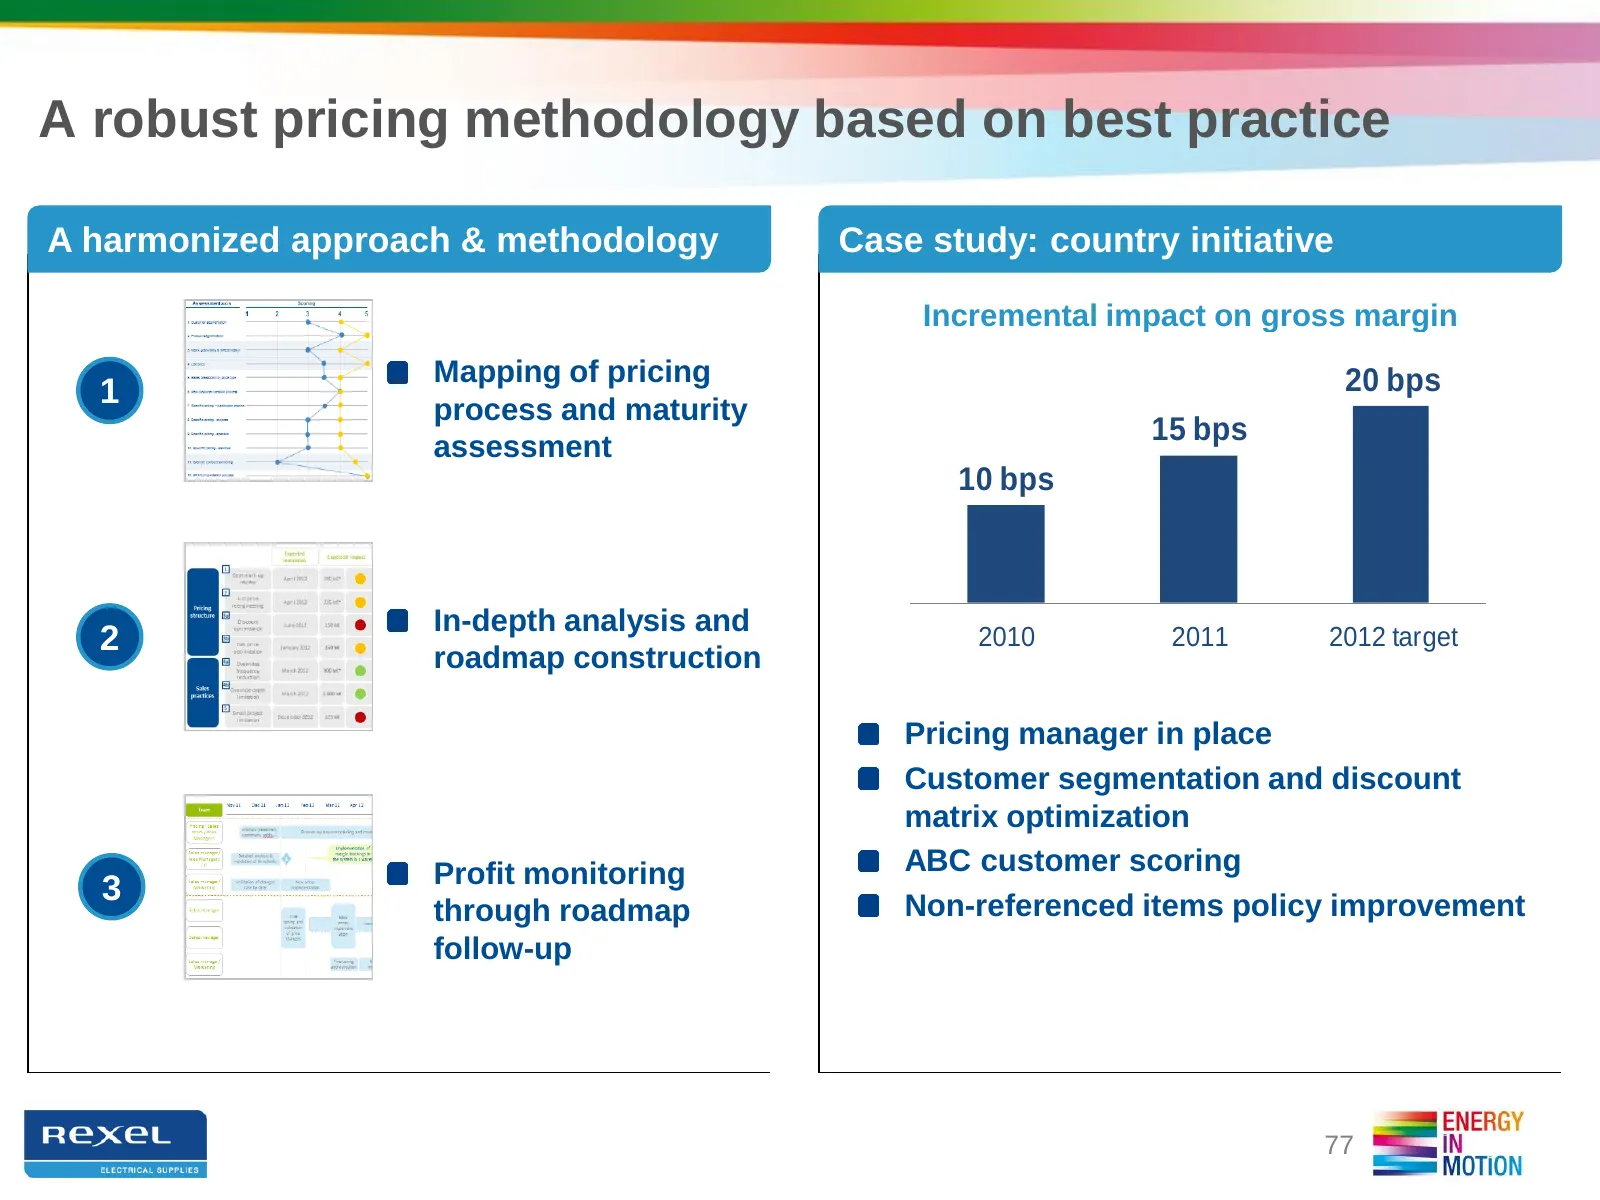
Slide 77: A robust pricing methodology based on best practice
A robust pricing methodology based on best practice A harmonized approach & methodology Case study: country initiative Incremental impact on gross margin Mapping of pricing 20 bps 1 process and maturity 15 bps assessment 10 bps In-depth analysis and 2 2010 2011 2012 target roadmap construction Prici
Slide 78: Enhancing profitability in two key markets
ENHANCING PROFITABILITY IN TWO KEY MARKETS Chris HARTMANN, Executive VP & CEO, Rexel Holdings USA Henri-Paul LASCHKAR, Senior VP UK and Ireland
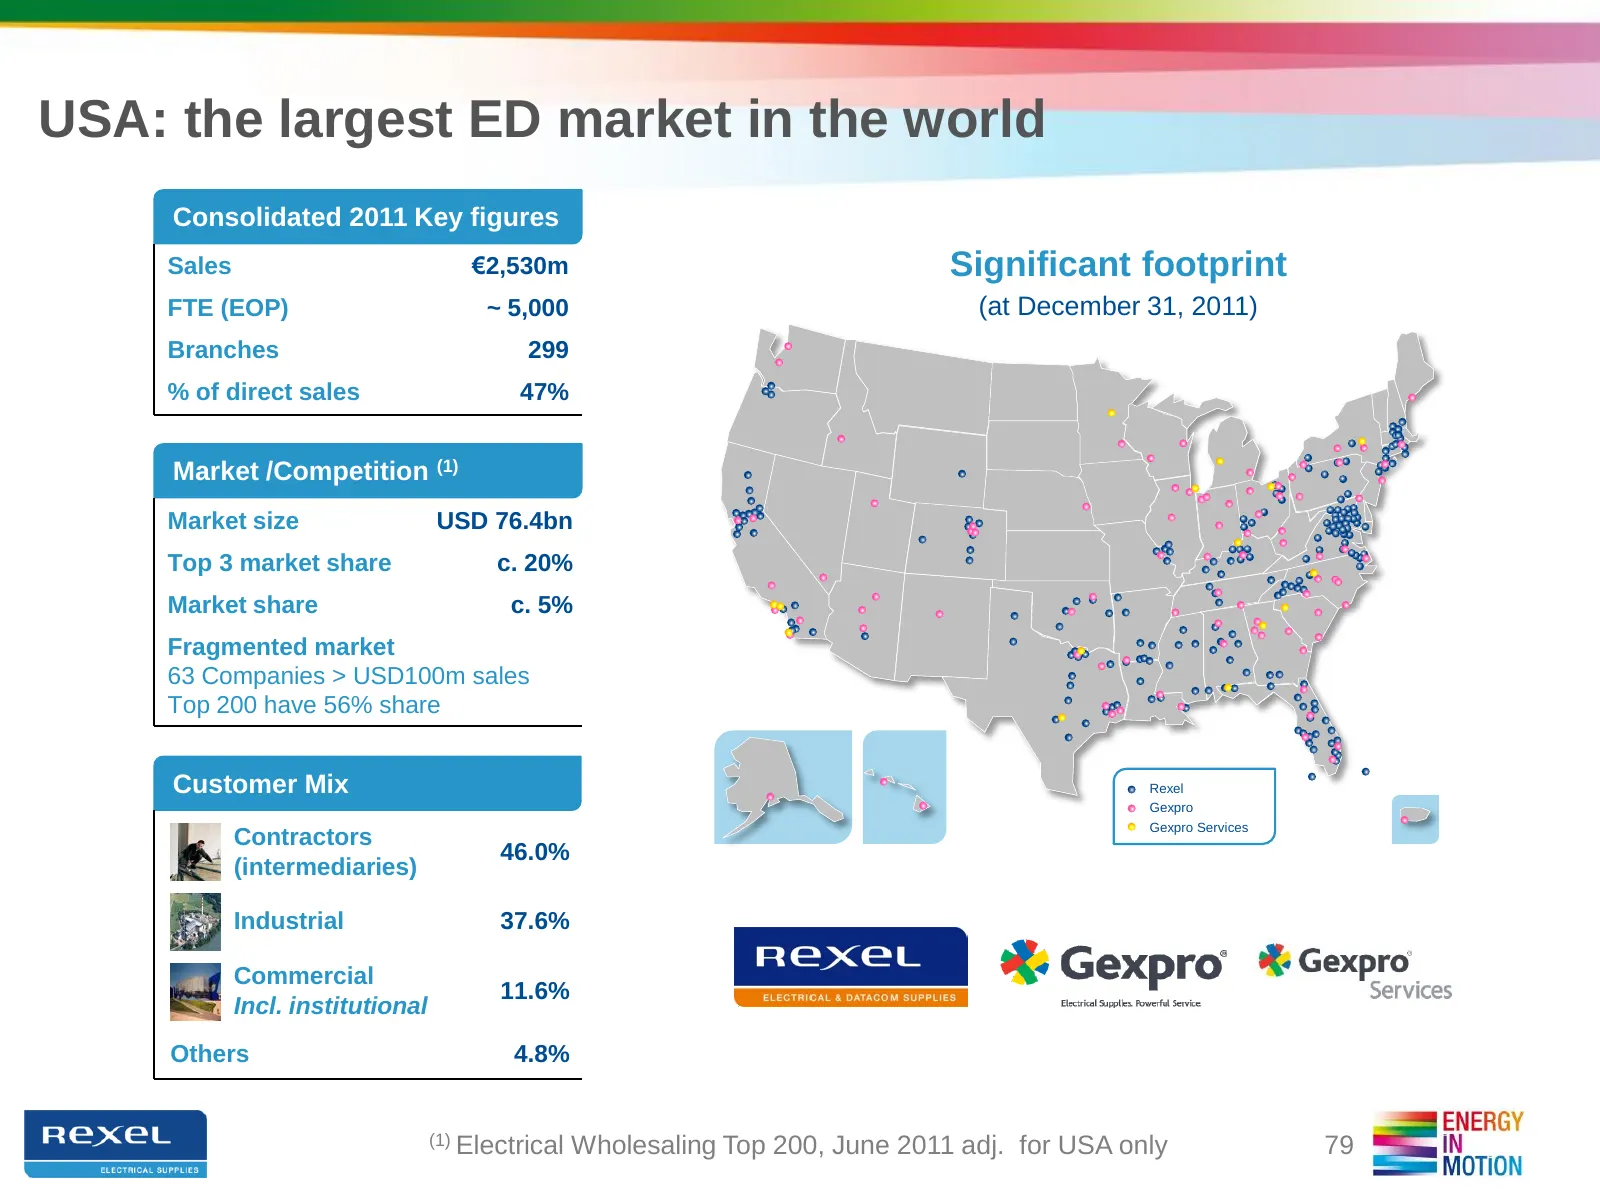
Slide 79: USA: the largest ED market in the world
USA: the largest ED market in the world Consolidated 2011 Key figures Sales €2,530m Significant footprint FTE (EOP) ~ 5,000 (at December 31, 2011) Branches 299 % of direct sales 47% Market /Competition (1) Market size USD 76.4bn Top 3 market share c. 20% Market share c. 5% Fragmented market 63 Compa
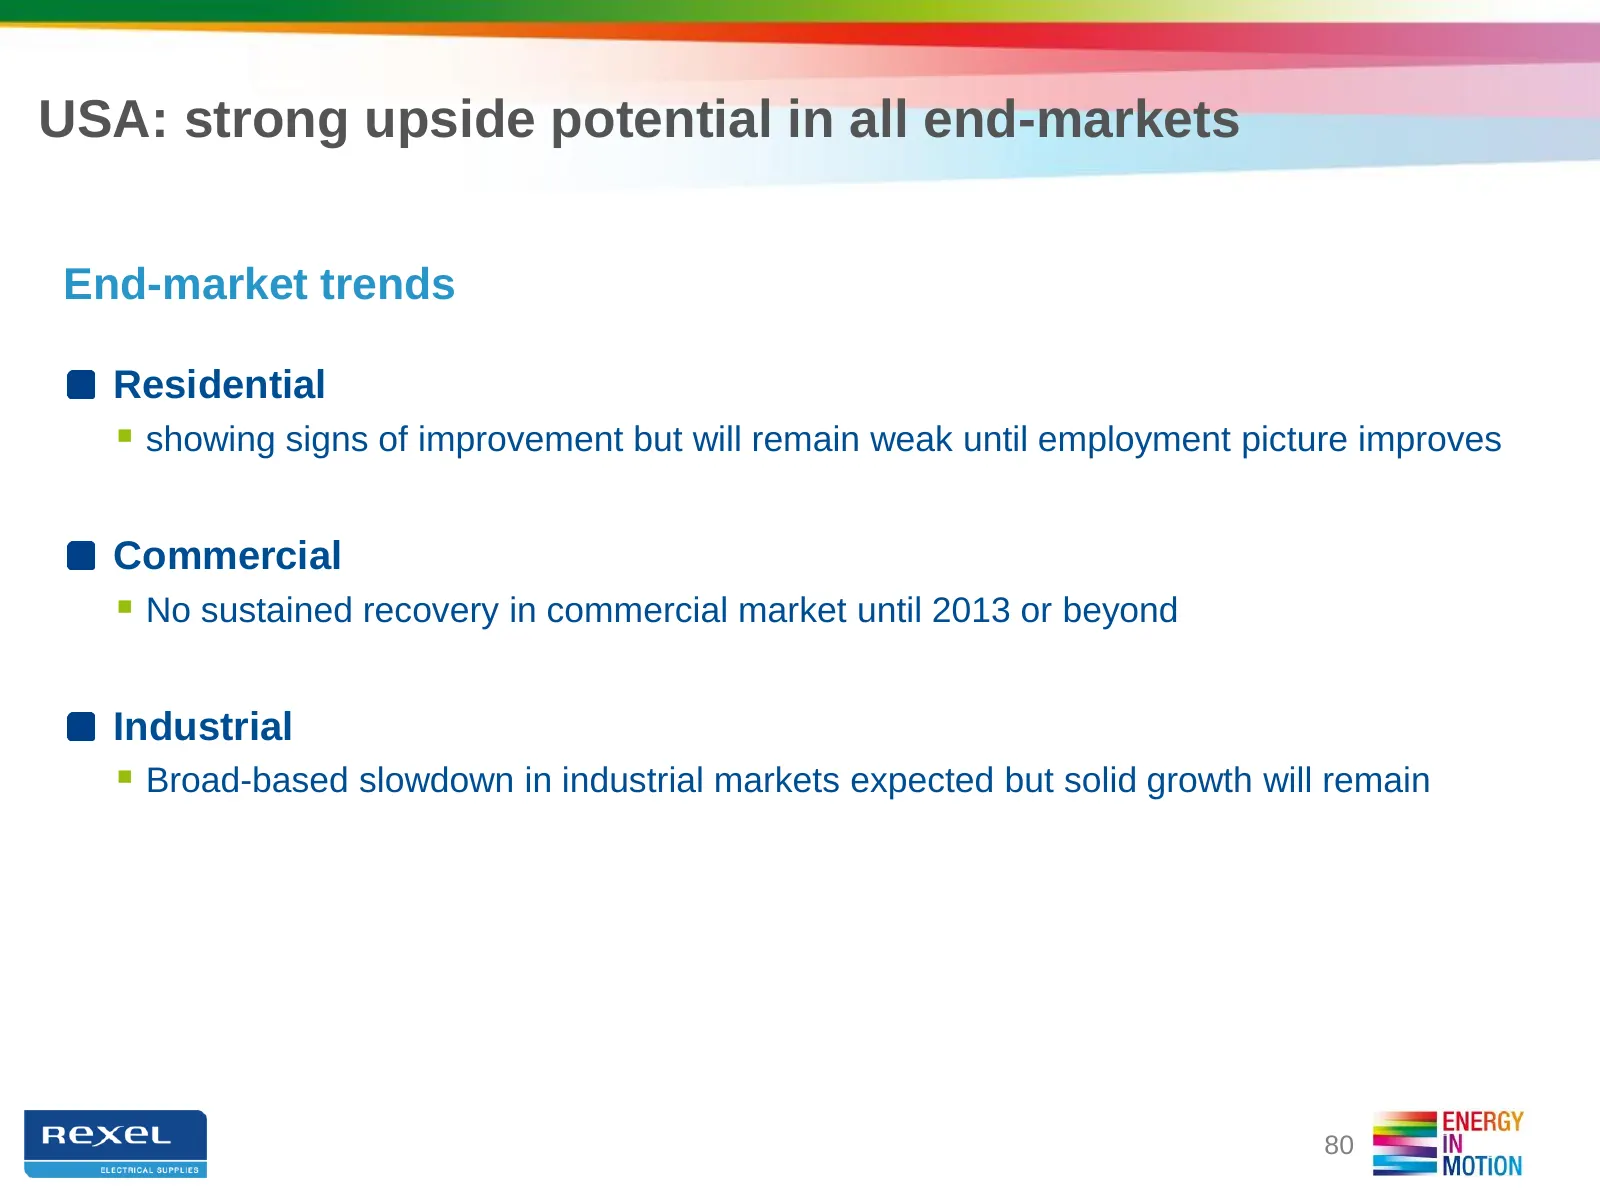
Slide 80: USA: strong upside potential in all end-markets
USA: strong upside potential in all end-markets End-market trends Residential showing signs of improvement but will remain weak until employment picture improves Commercial No sustained recovery in commercial market until 2013 or beyond Industrial Broad-based slowdown in industrial markets exp
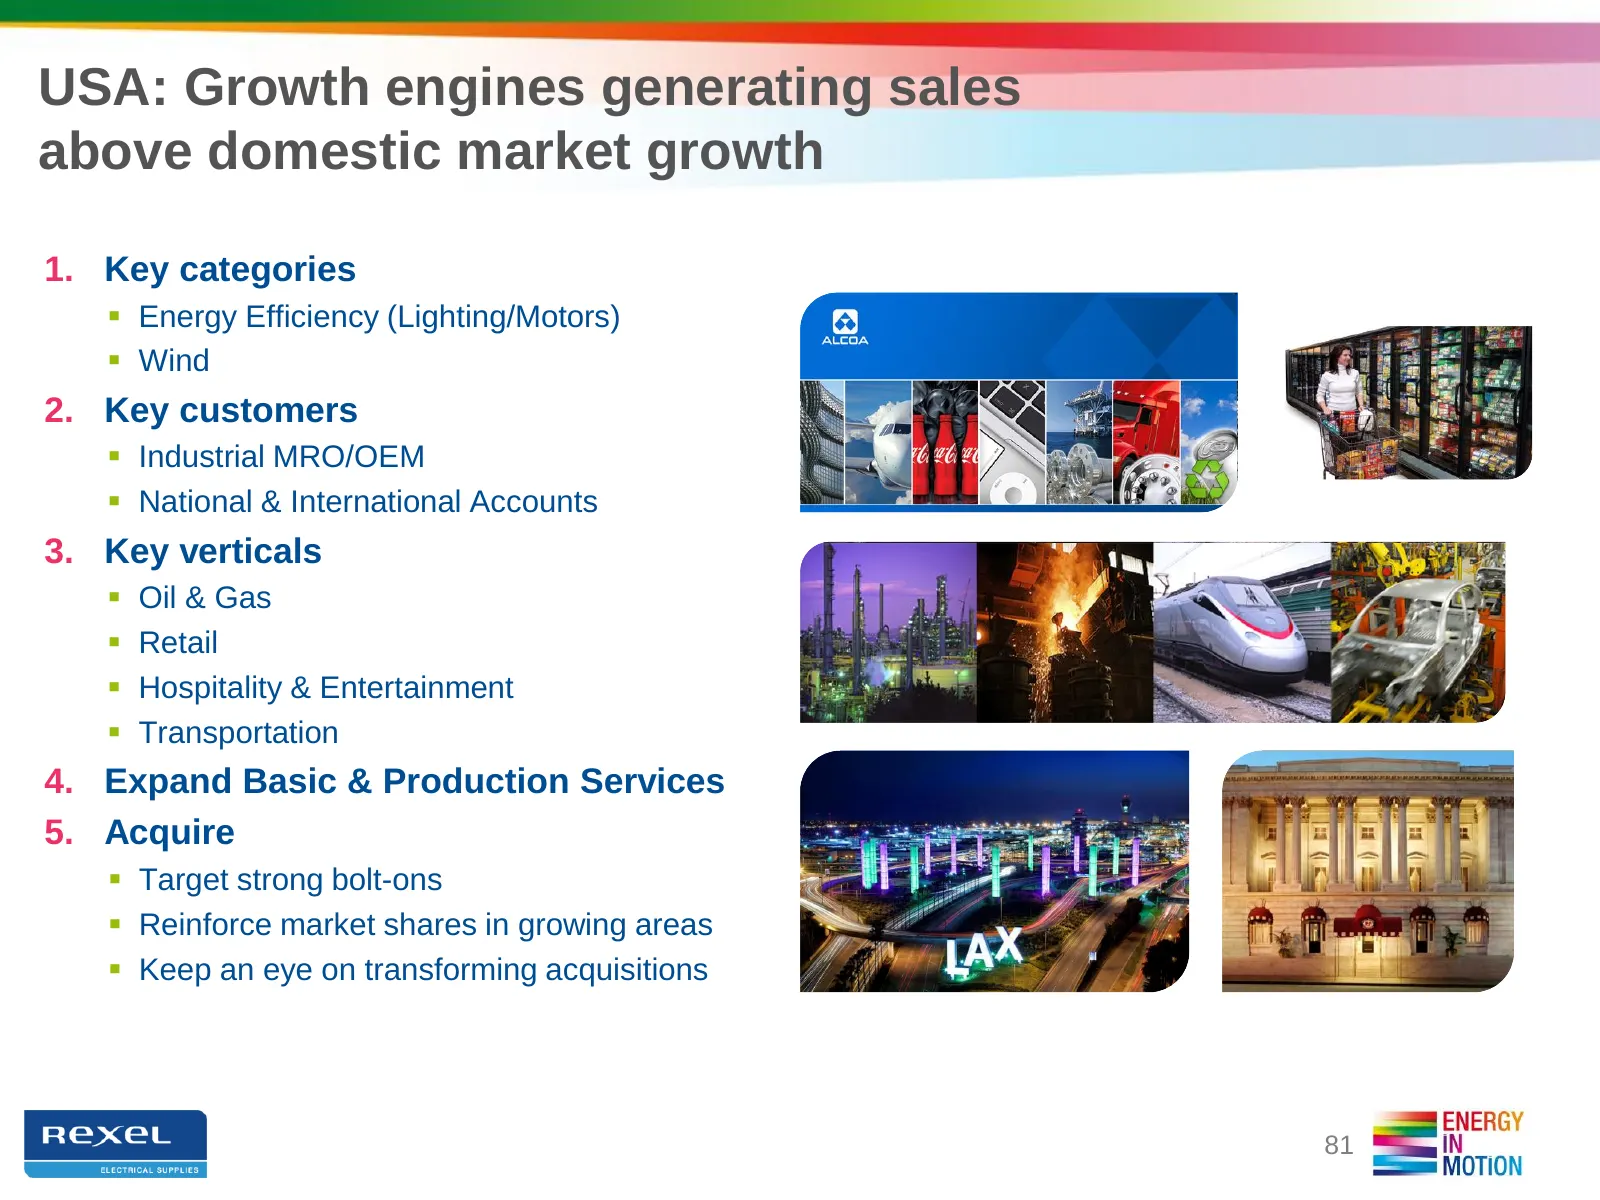
Slide 81: USA: Growth engines generating sales above domestic market growth
USA: Growth engines generating sales above domestic market growth 1. Key categories Energy Efficiency (Lighting/Motors) Wind 2. Key customers Industrial MRO/OEM National & International Accounts 3. Key verticals Oil & Gas Retail Hospitality & Entertainment Transportation 4. Expand Ba
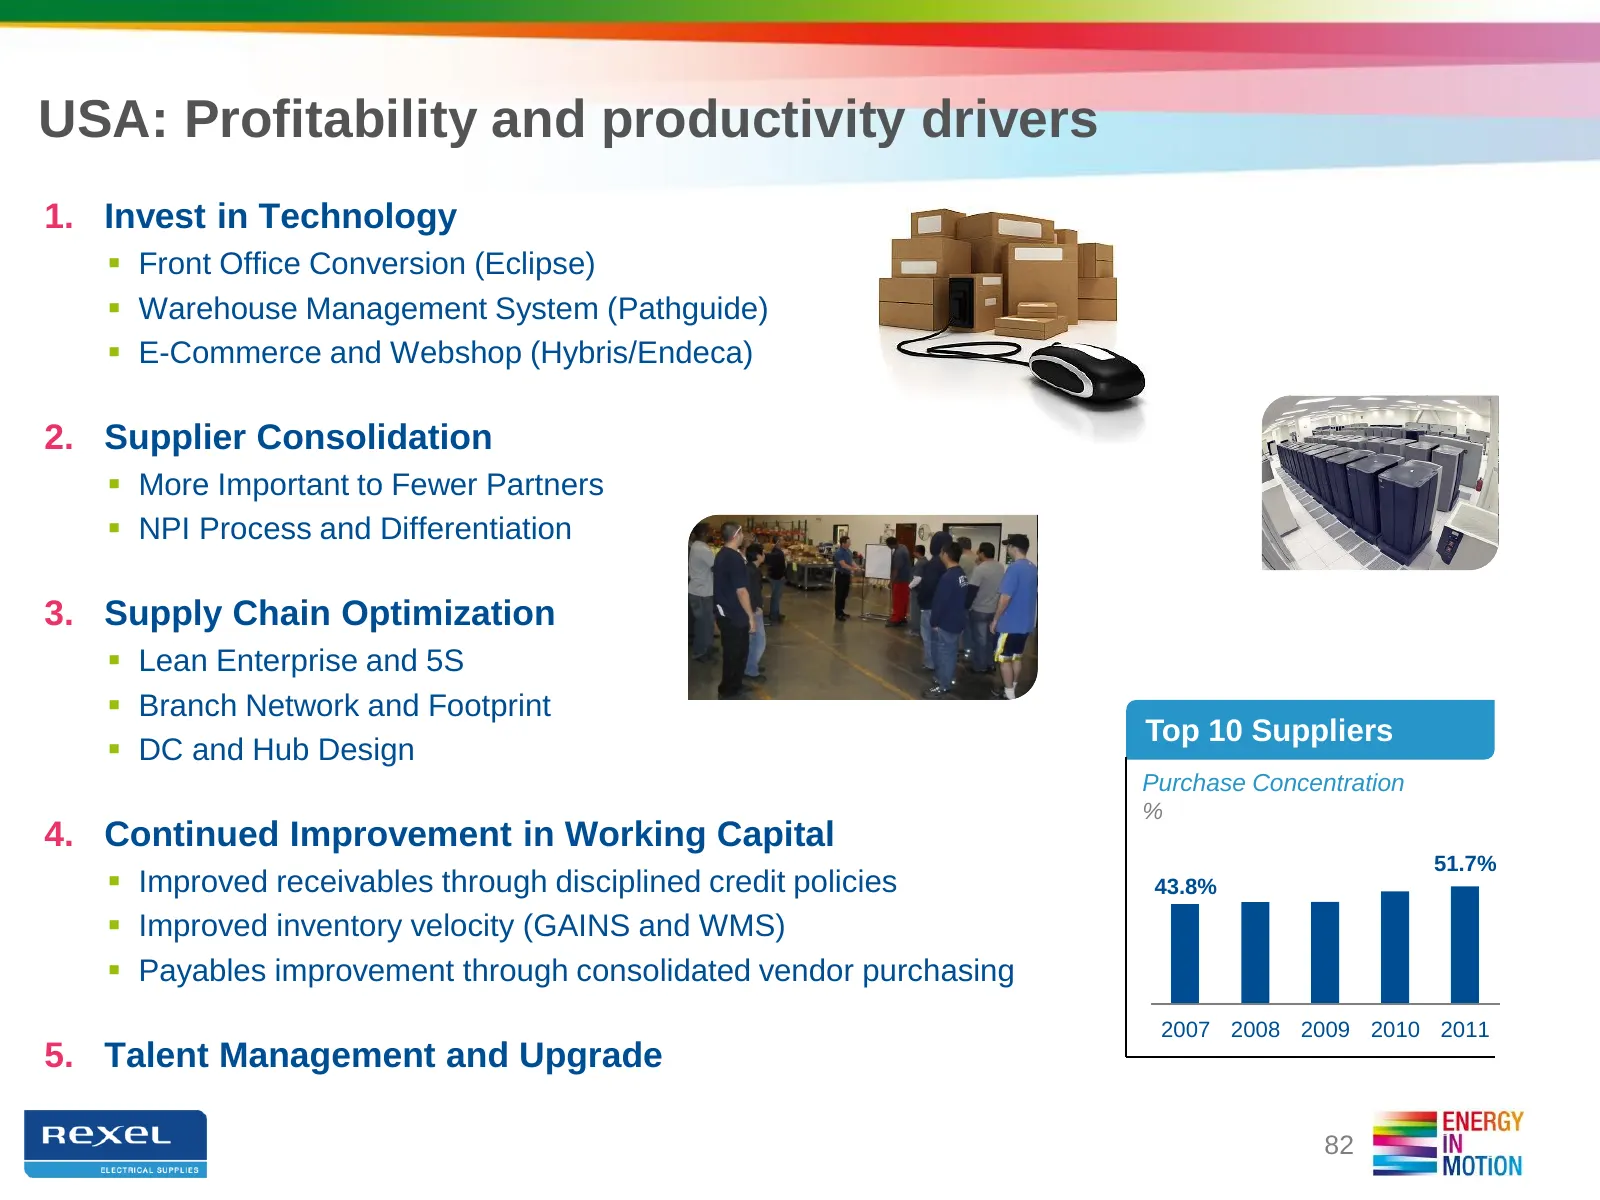
Slide 82: USA: Profitability and productivity drivers
USA: Profitability and productivity drivers 1. Invest in Technology Front Office Conversion (Eclipse) Warehouse Management System (Pathguide) E-Commerce and Webshop (Hybris/Endeca) 2. Supplier Consolidation More Important to Fewer Partners NPI Process and Differentiation 3. Supply Chain Op
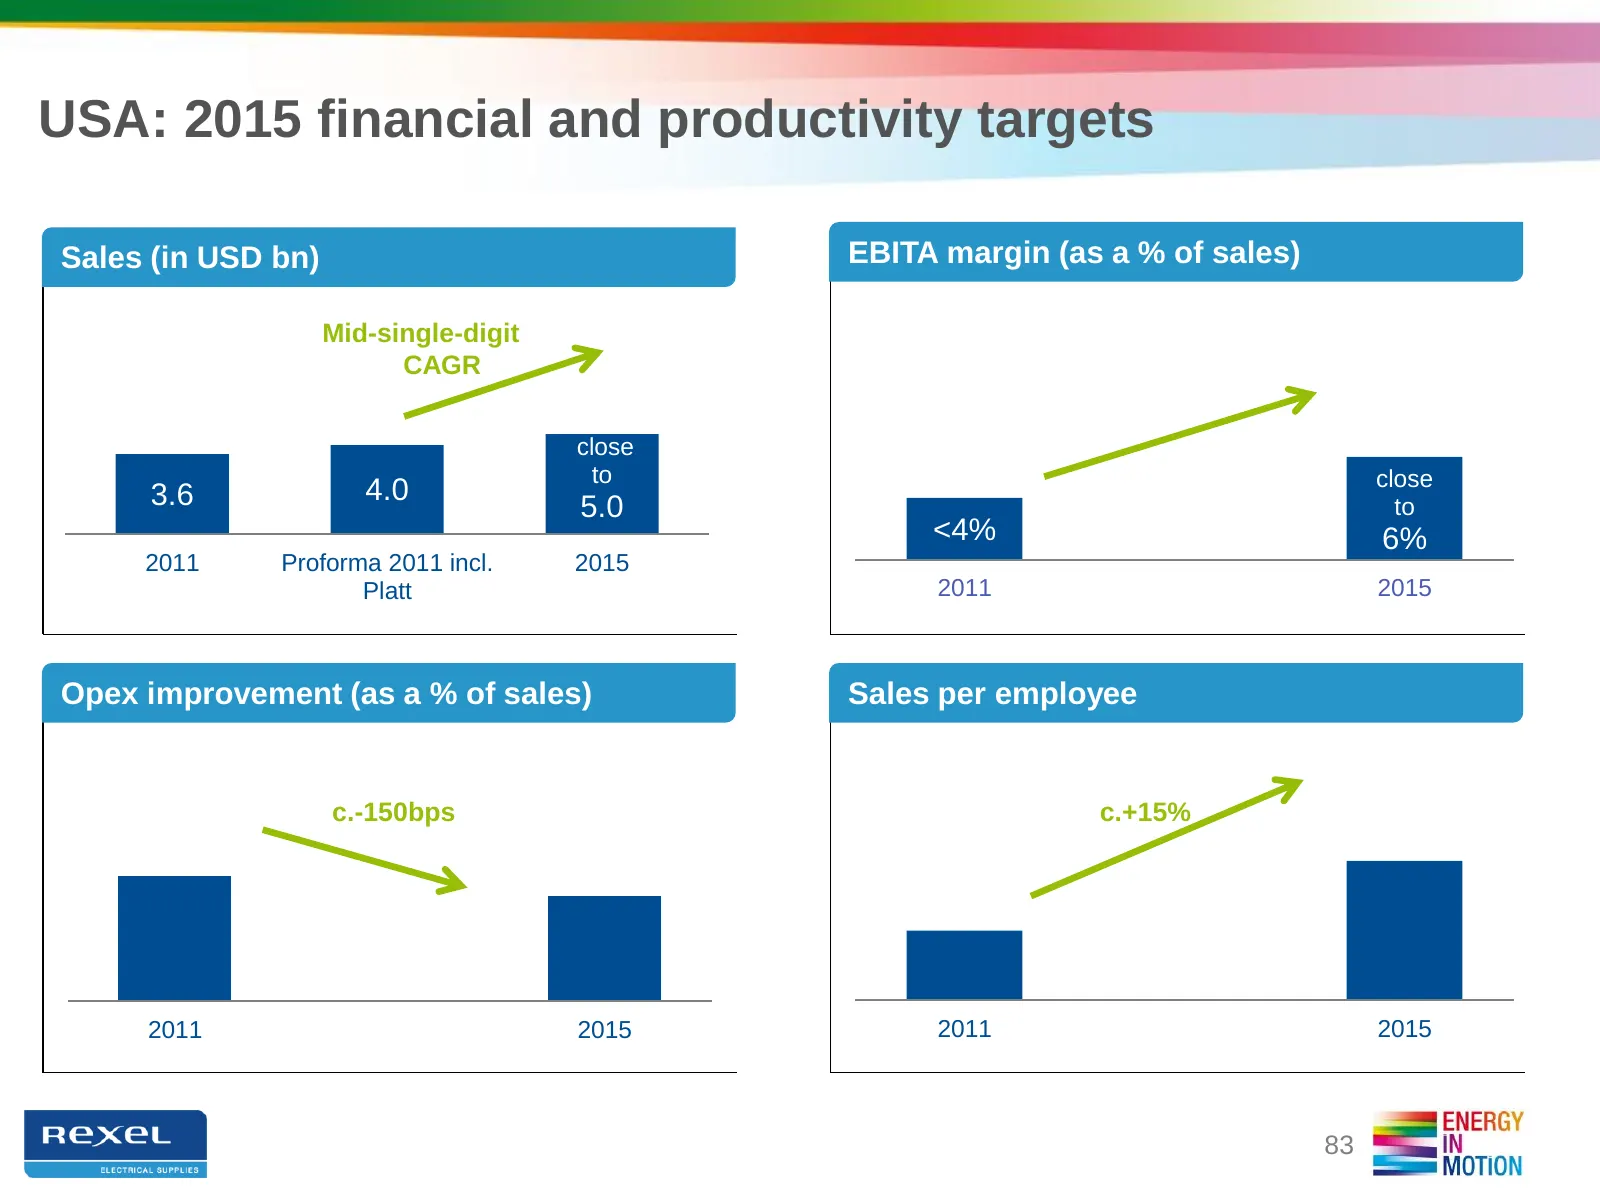
Slide 83: USA: 2015 financial and productivity targets
USA: 2015 financial and productivity targets Sales (in USD bn) EBITA margin (as a % of sales) Mid-single-digit CAGR close to close 3.6 4.0 5.0 to <4% 6% 2011 Proforma 2011 incl. 2015 Platt 2011 2015 Opex improvement (as a % of sales) Sales per employee c.-150bps c.+15% 2011 2015 2011 2015 83
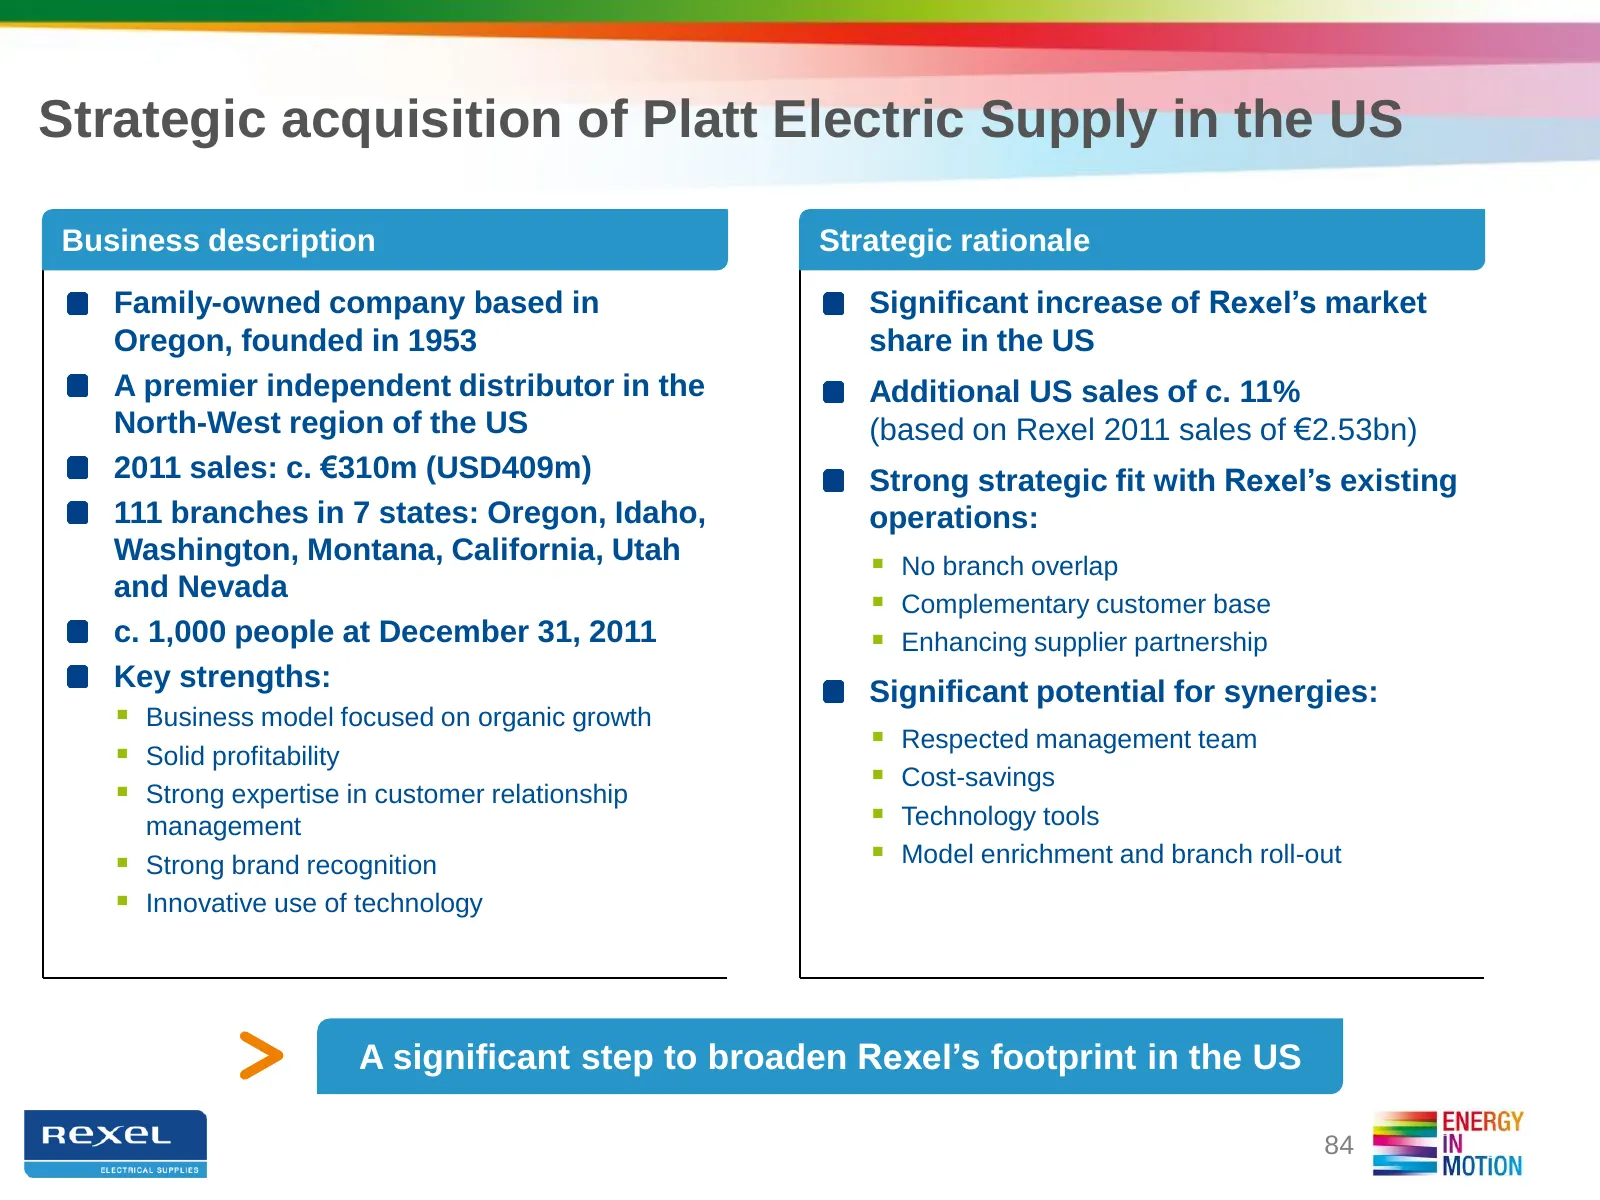
Slide 84: Strategic acquisition of Platt Electric Supply in the US
Strategic acquisition of Platt Electric Supply in the US Business description Strategic rationale Family-owned company based in Significant increase of Rexel’s market Oregon, founded in 1953 share in the US A premier independent distributor in the Additional US sales of c. 11% North-West region of t
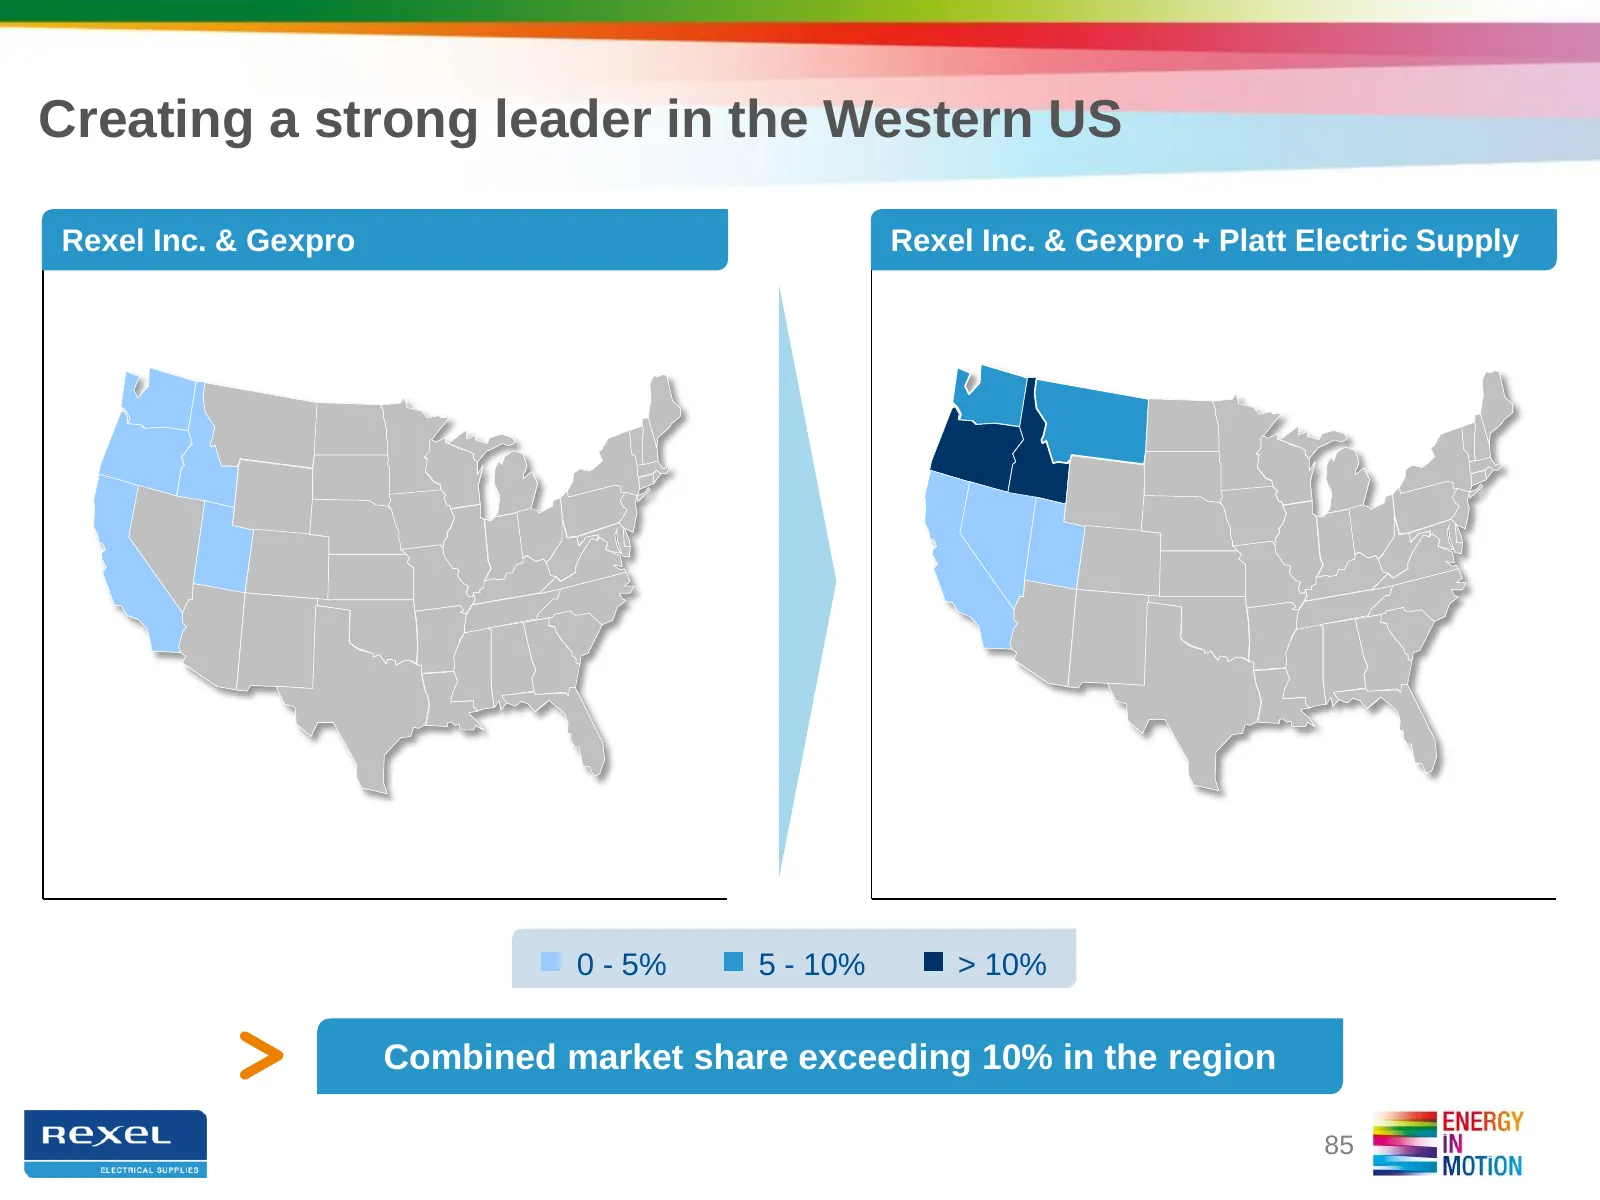
Slide 85: Creating a strong leader in the Western US
Creating a strong leader in the Western US Rexel Inc. & Gexpro Rexel Inc. & Gexpro + Platt Electric Supply 0 - 5% 5 - 10% > 10% Combined market share exceeding 10% in the region 85
Slide 86: Platt: an attractive acquisition in line with Rexel's strategy
Platt: an attractive acquisition in line with Rexel’s strategy Acquisition price: c. €300m Strong synergies representing at least 1.8% of acquired sales Cost synergies: mainly purchasing synergies and operating cost optimization Revenue synergies: mainly product offering and branches EV/EBITDA m
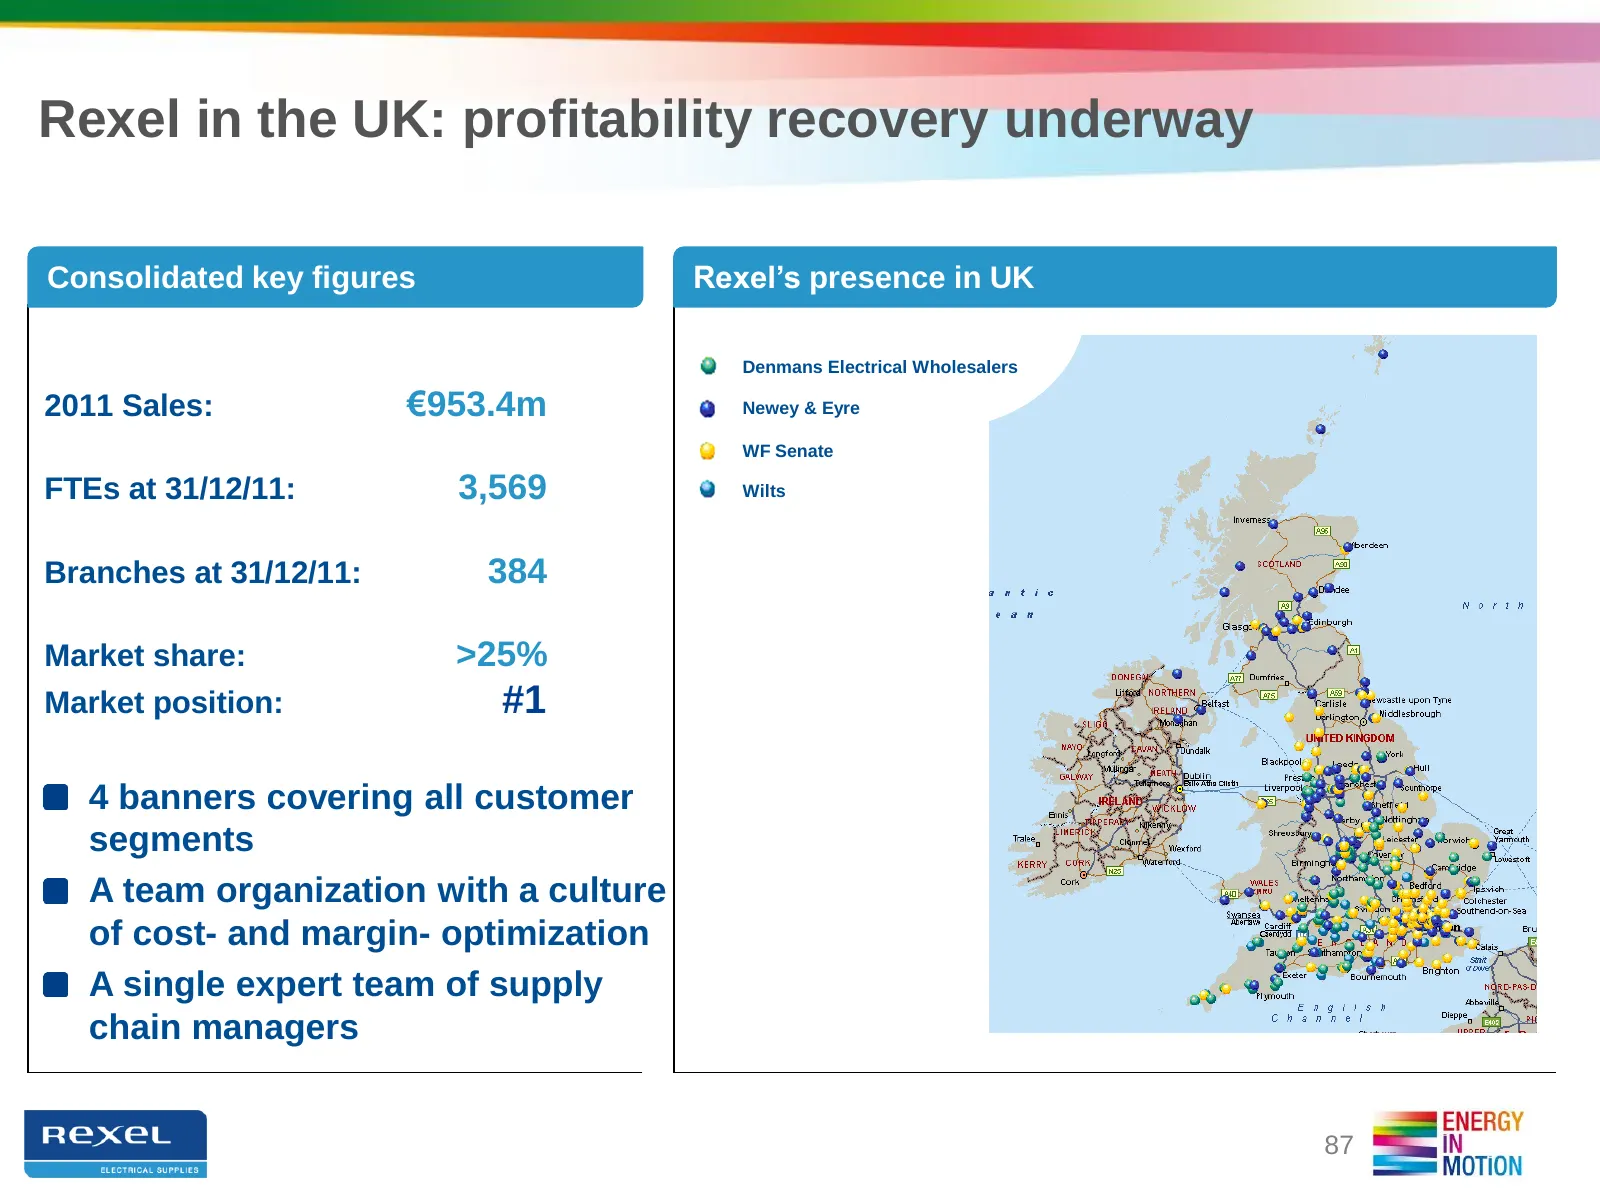
Slide 87: Rexel in the UK: profitability recovery underway
Rexel in the UK: profitability recovery underway Consolidated key figures Rexel’s presence in UK Denmans Electrical Wholesalers 2011 Sales: €953.4m Newey & Eyre WF Senate FTEs at 31/12/11: 3,569 Wilts Branches at 31/12/11: 384 Market share: >25% Market position: #1 4 banners covering all customer se
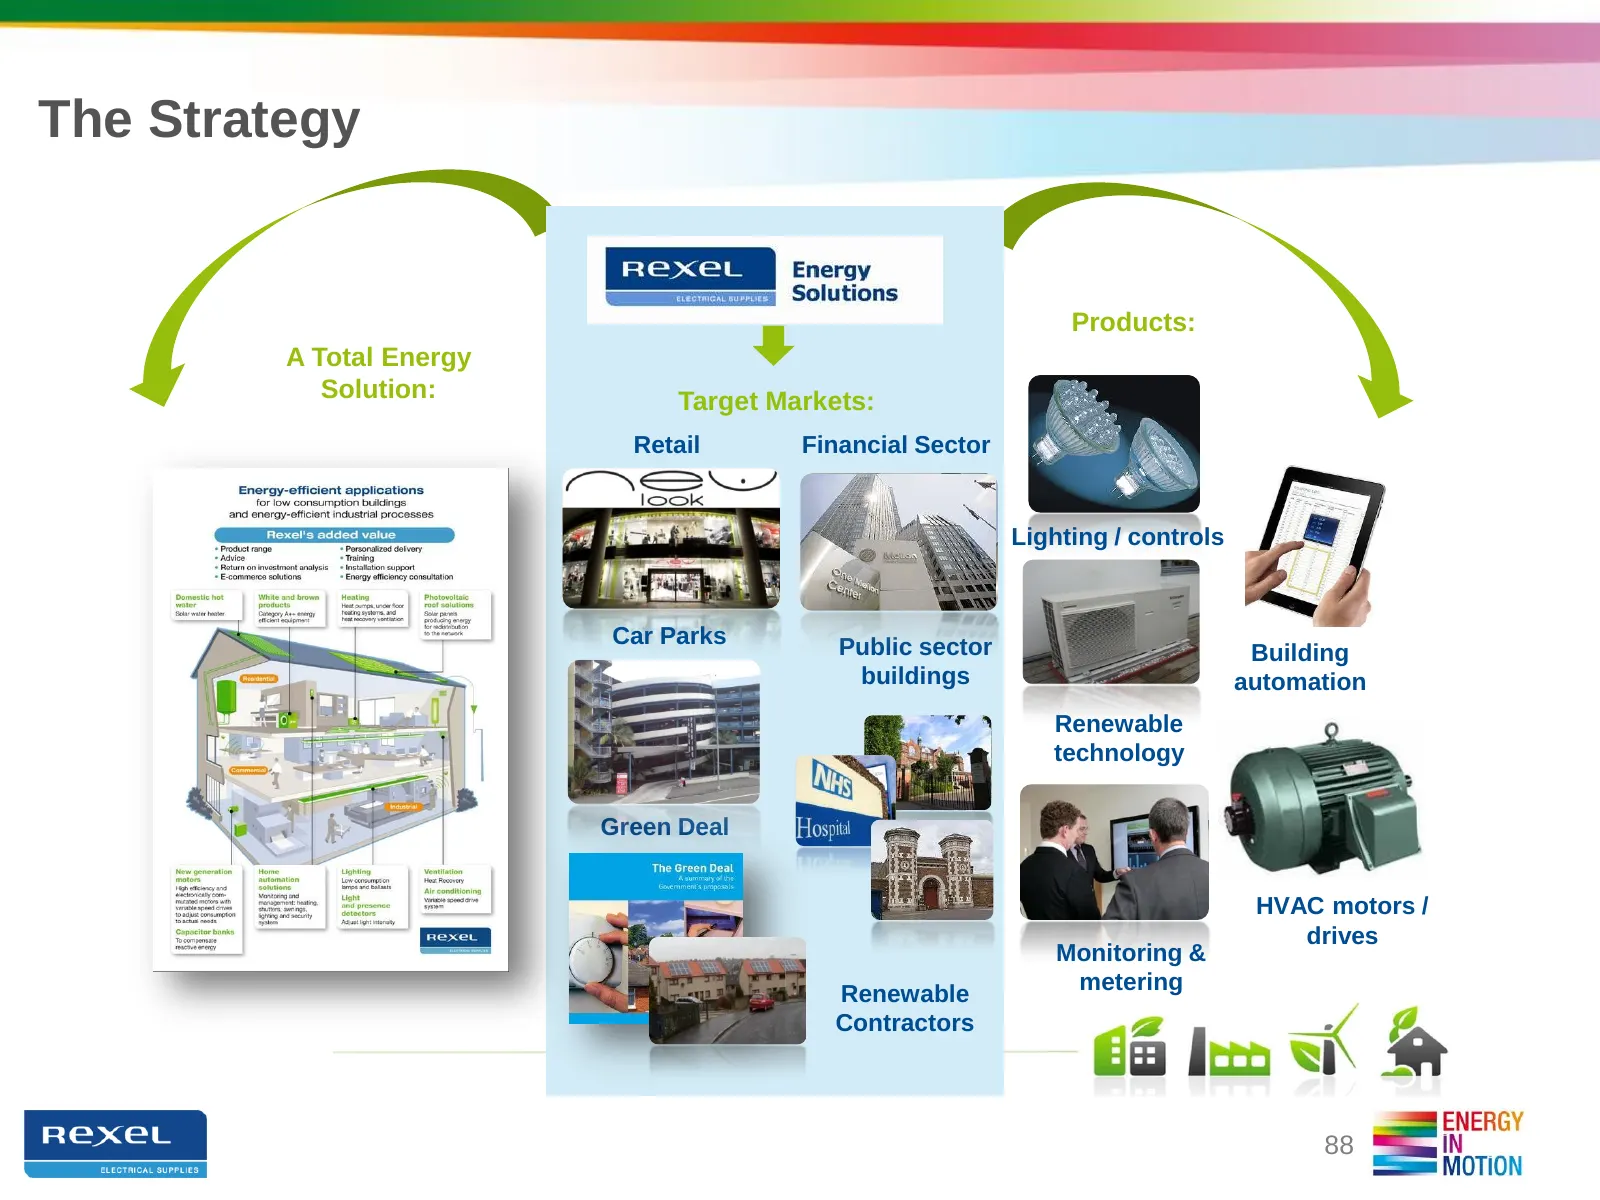
Slide 88: The Strategy
The Strategy Products: A Total Energy Solution: Target Markets: Retail Financial Sector Lighting / controls Car Parks Public sector Building buildings automation Renewable technology Green Deal HVAC motors / drives Monitoring & Renewable metering Contractors 88
Slide 89: UK: a new significant step for 2015
UK: a new significant step for 2015 2015 ambitions Outperform the traditional market Excellence of service Market intelligence Differentiate offers New routes for market Focus on “high-entry ticket” segments Main position as an "Energy Solutions Provider" Building Automation Energy Effic
Slide 90: UK: 2015 financial and productivity targets
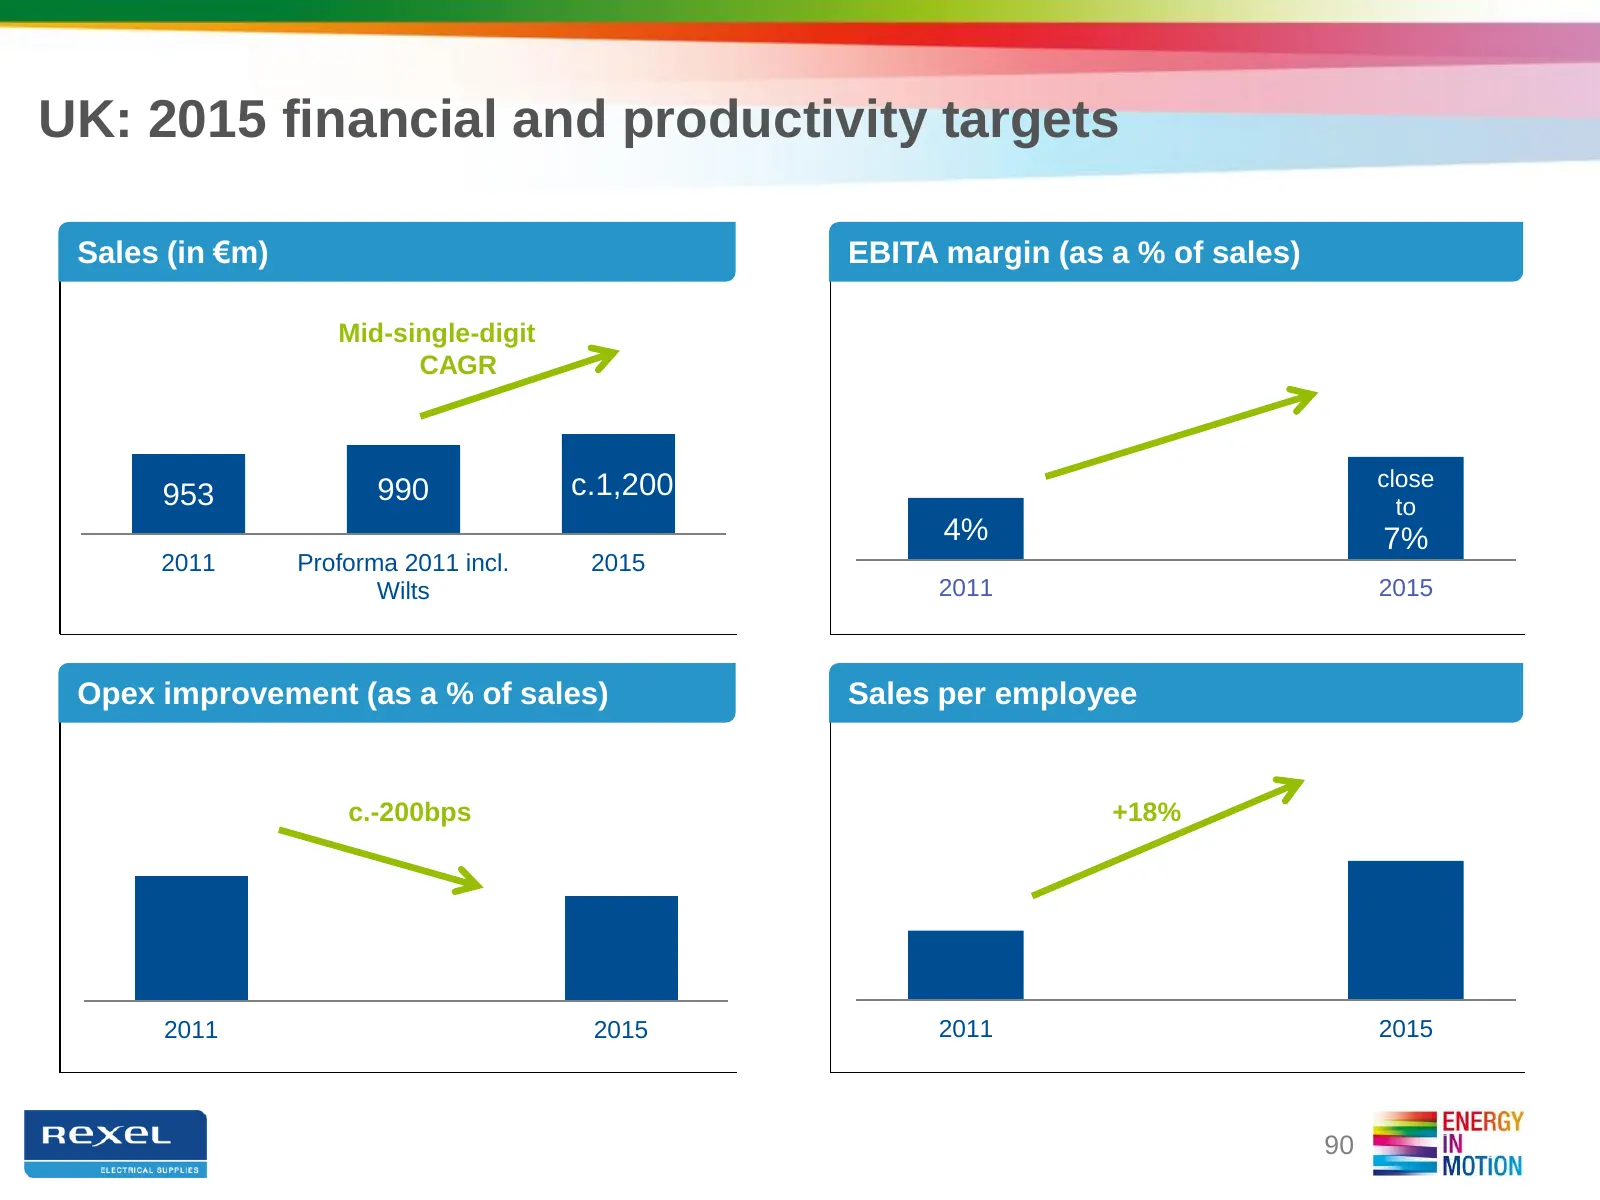
UK: 2015 financial and productivity targets Sales (in €m) EBITA margin (as a % of sales) Mid-single-digit CAGR c.1,200 close 953 990 to 4% 7% 2011 Proforma 2011 incl. 2015 Wilts 2011 2015 Opex improvement (as a % of sales) Sales per employee c.-200bps +18% 2011 2015 2011 2015 90
Slide 91: Wilts reinforces our position in the UK
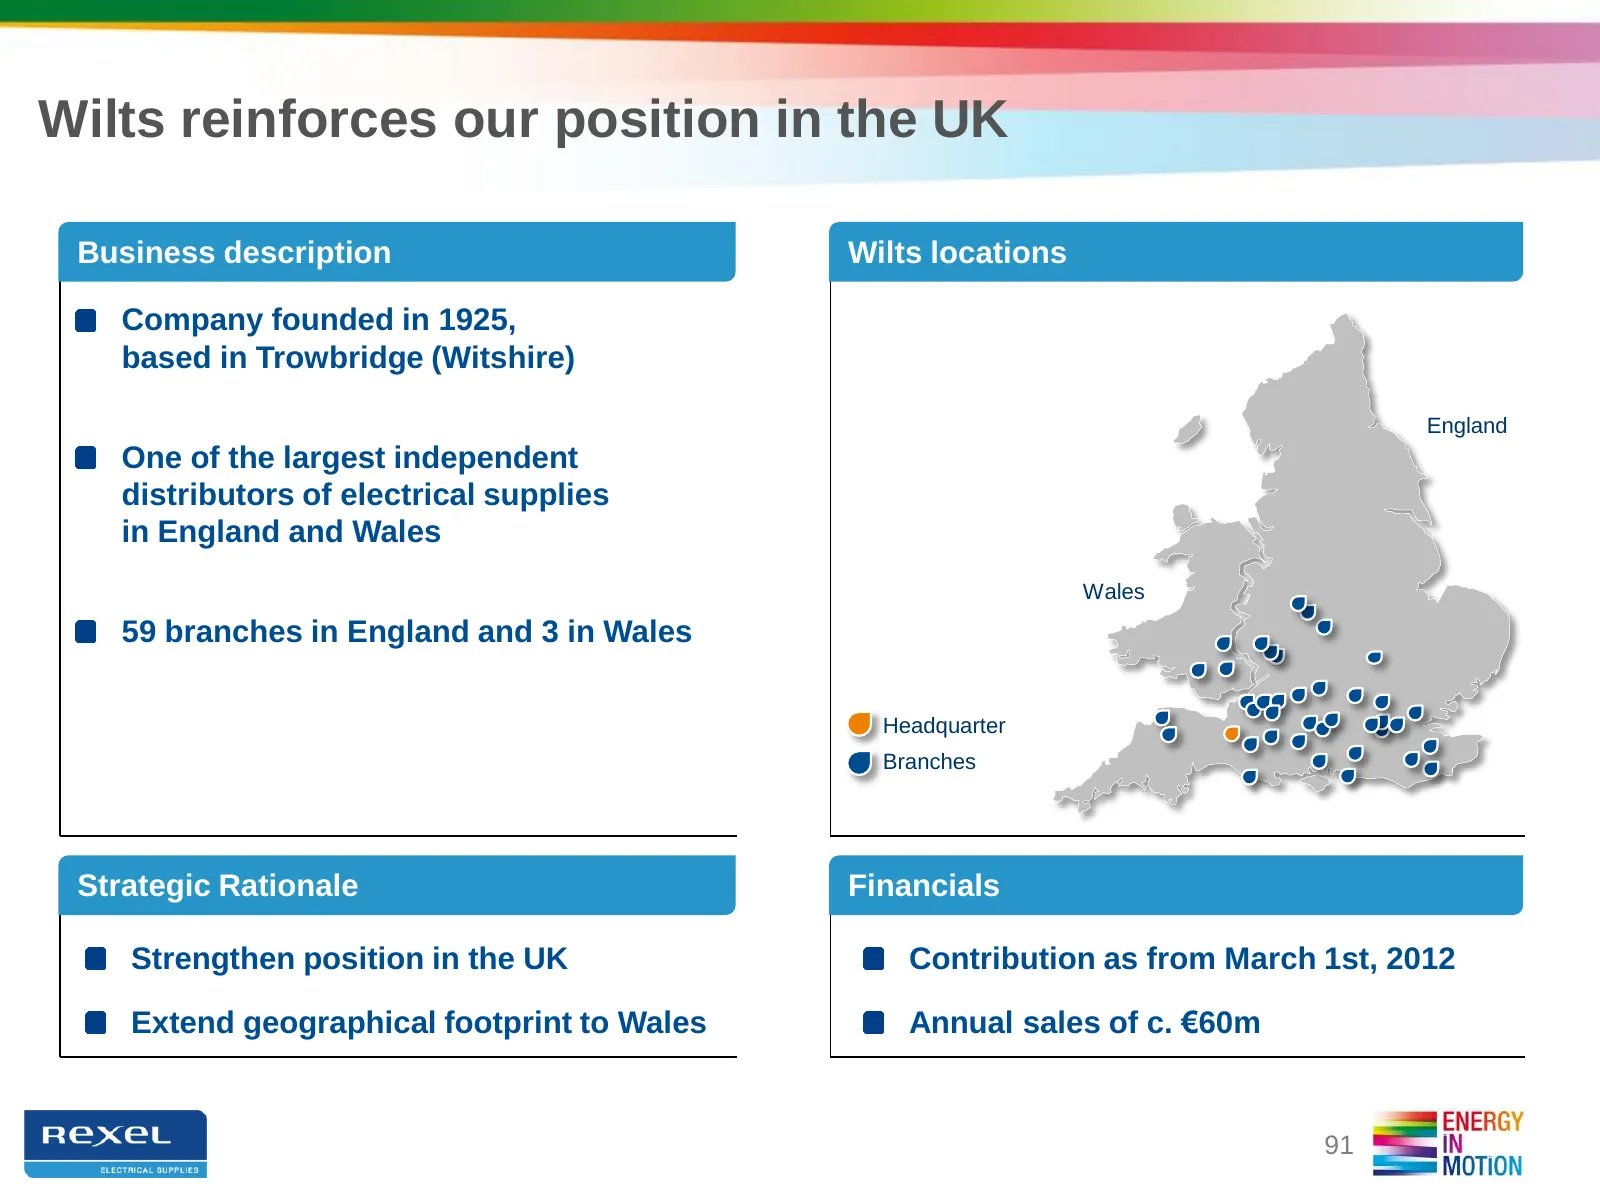
Wilts reinforces our position in the UK Business description Wilts locations Company founded in 1925, based in Trowbridge (Witshire) England One of the largest independent distributors of electrical supplies in England and Wales Wales 59 branches in England and 3 in Wales Headquarter Branches Strate
Slide 92: Financial prospects
FINANCIAL PROSPECTS Michel FAVRE, Group Senior VP, CFO
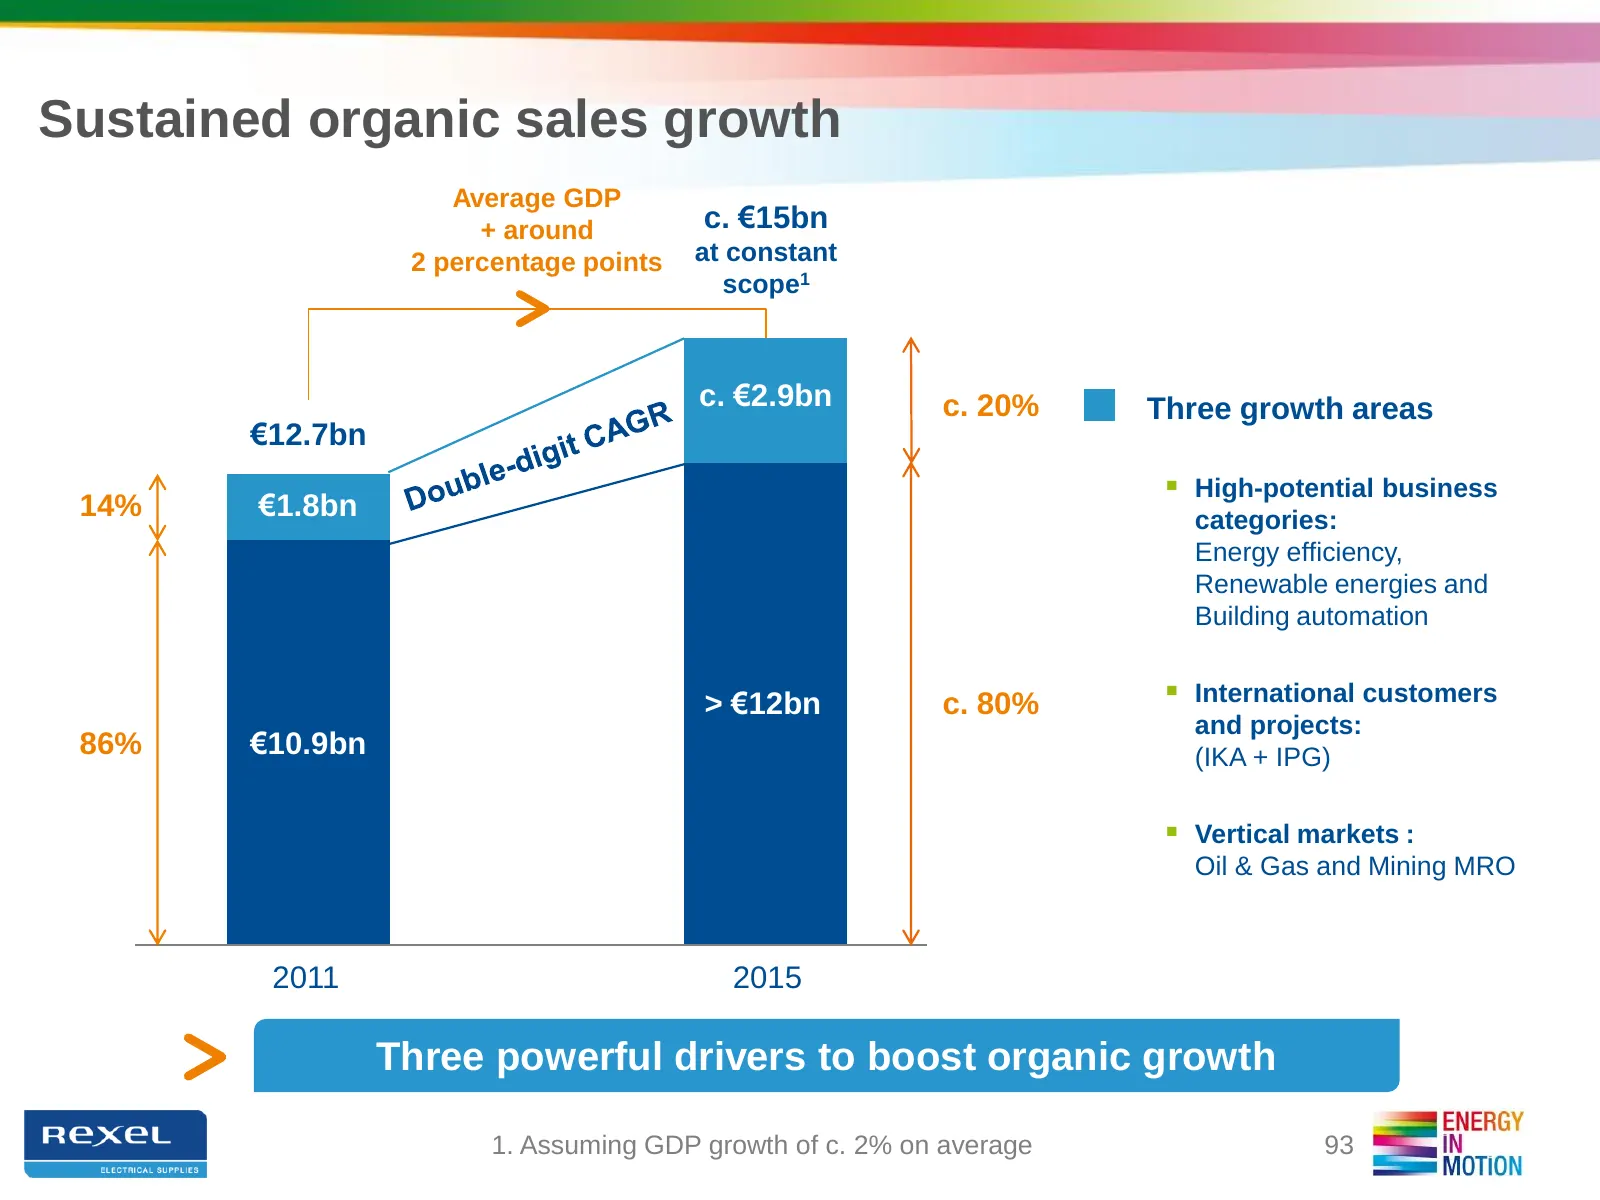
Slide 93: Sustained organic sales growth
Sustained organic sales growth Average GDP + around c. €15bn 2 percentage points at constant scope1 c. €2.9bn c. 20% Three growth areas €12.7bn High-potential business 14% €1.8bn categories: Energy efficiency, Renewable energies and Building automation > €12bn c. 80% International customers and
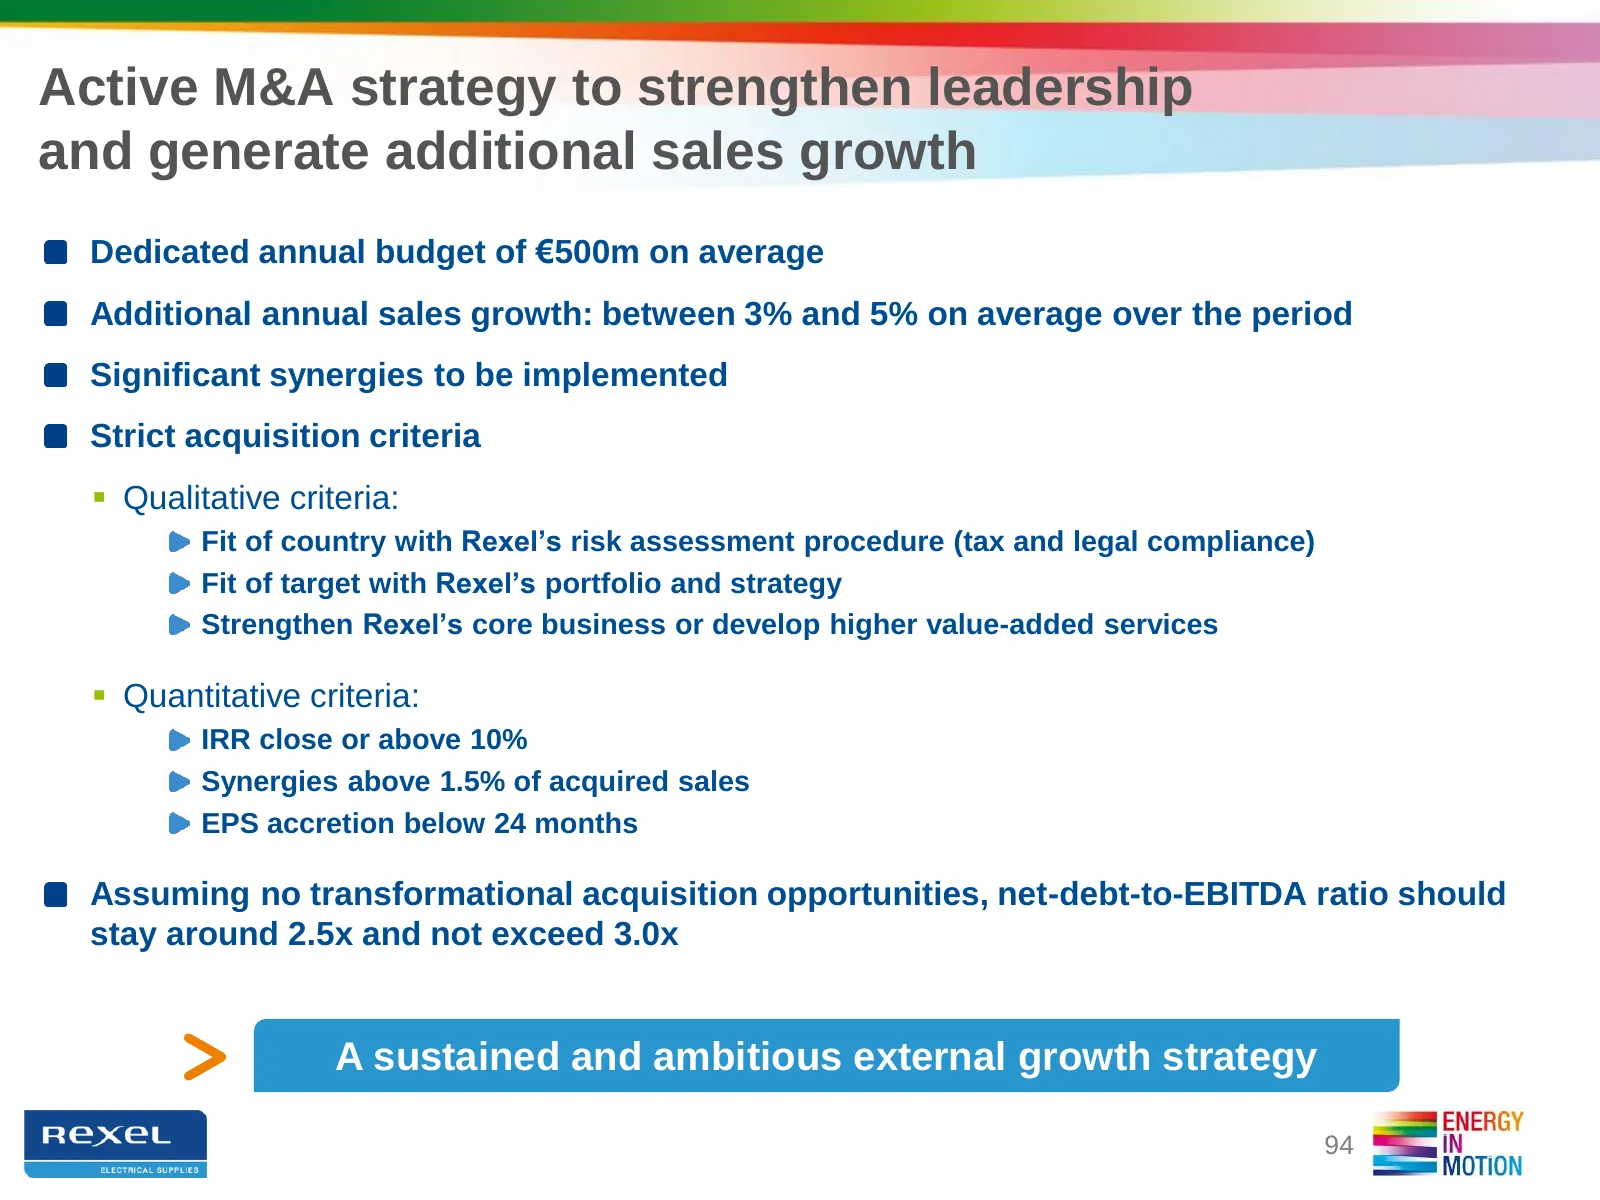
Slide 94: Active M&A strategy to strengthen leadership and generate additional sales growth
Active M&A strategy to strengthen leadership and generate additional sales growth Dedicated annual budget of €500m on average Additional annual sales growth: between 3% and 5% on average over the period Significant synergies to be implemented Strict acquisition criteria Qualitative criteria: Fit o
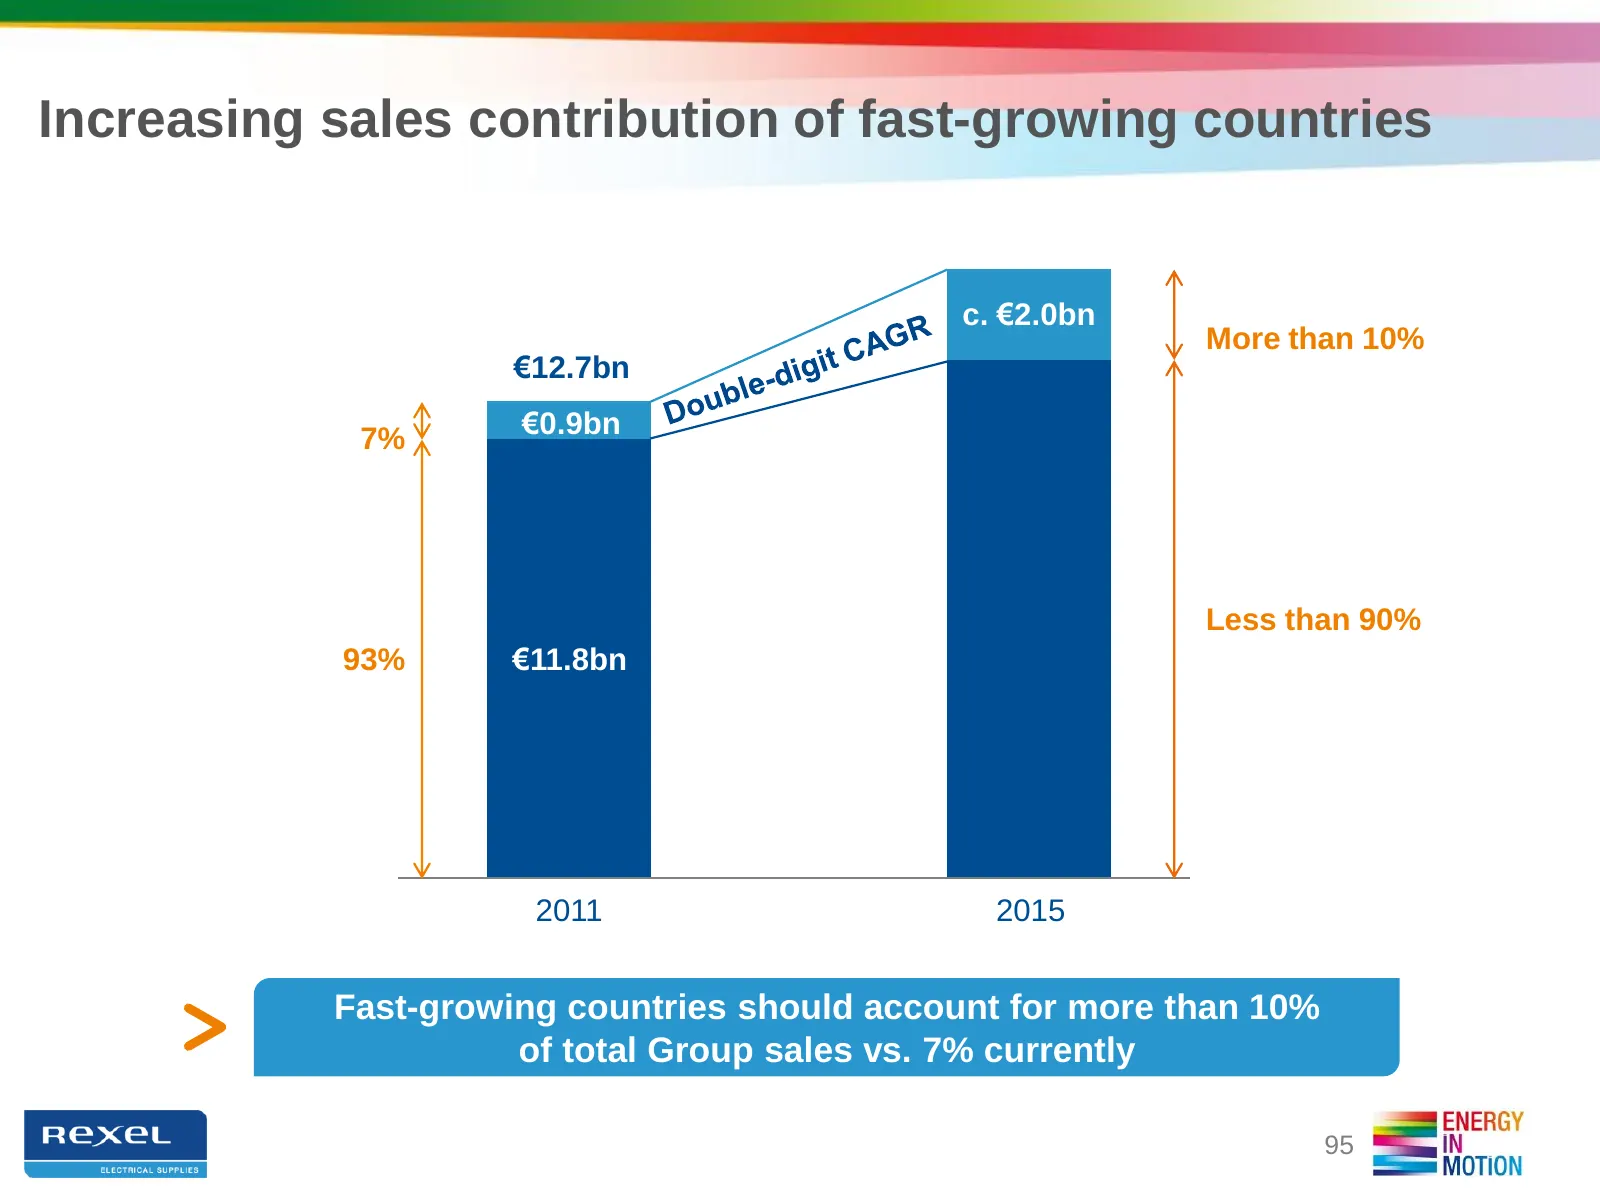
Slide 95: Increasing sales contribution of fast-growing countries
Increasing sales contribution of fast-growing countries c. €2.0bn More than 10% €12.7bn 7% €0.9bn Less than 90% 93% €11.8bn 2011 2015 Fast-growing countries should account for more than 10% of total Group sales vs. 7% currently 95
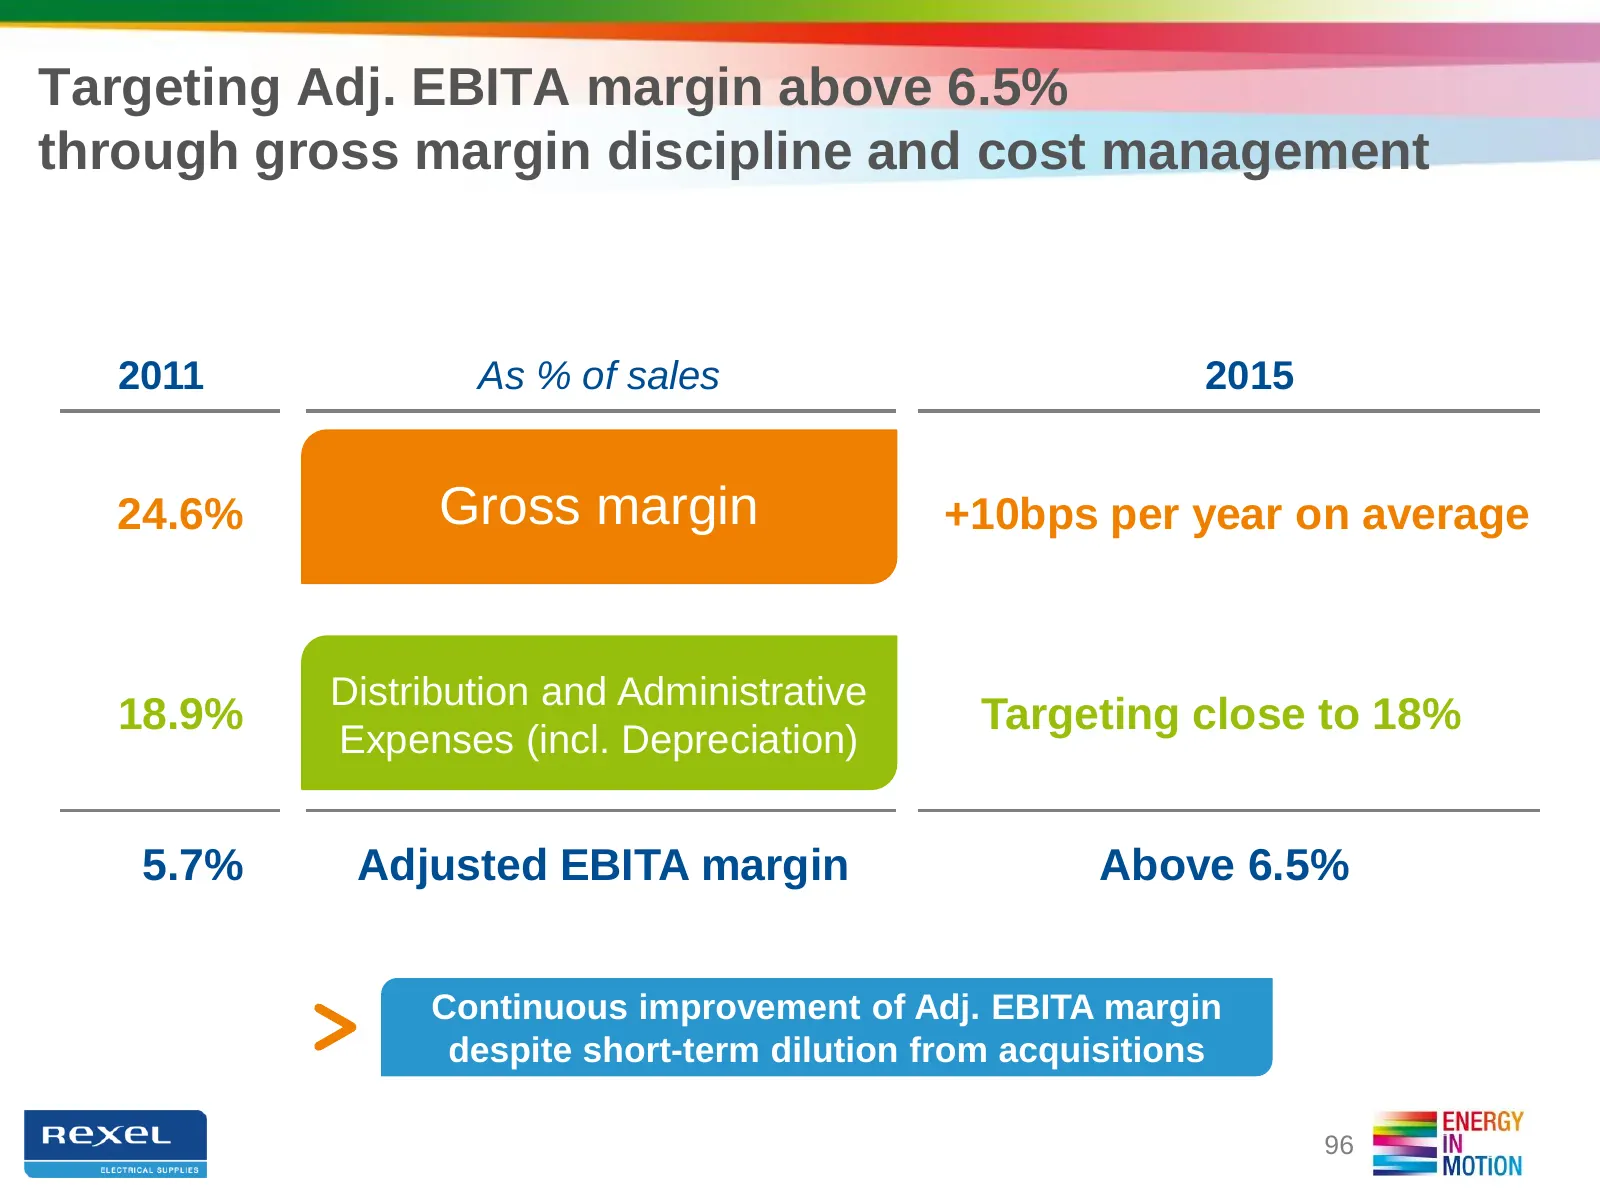
Slide 96: Targeting Adj. EBITA margin above 6.5%
Targeting Adj. EBITA margin above 6.5% through gross margin discipline and cost management 2011 As % of sales 2015 24.6% Gross margin +10bps per year on average Distribution and Administrative 18.9% Targeting close to 18% Expenses (incl. Depreciation) 5.7% Adjusted EBITA margin Above 6.5% Continuous
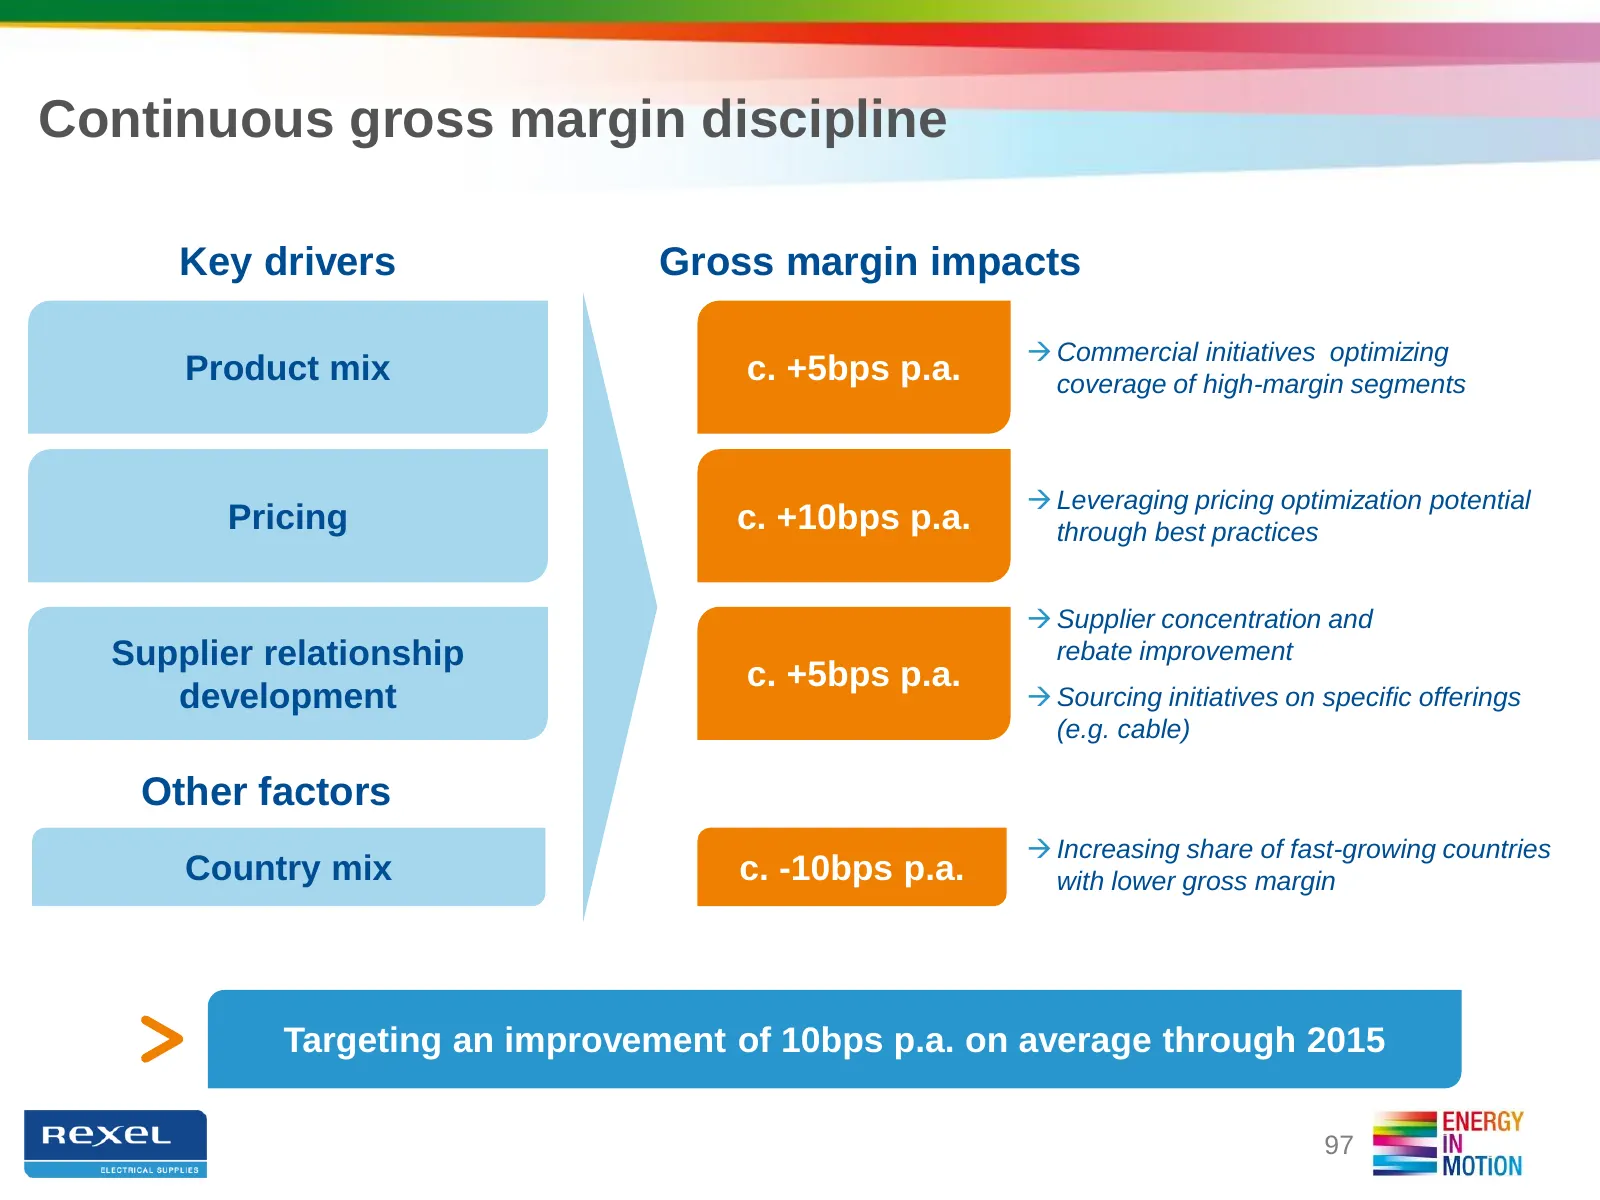
Slide 97: Continuous gross margin discipline
Continuous gross margin discipline Key drivers Gross margin impacts Commercial initiatives optimizing Product mix c. +5bps p.a. coverage of high-margin segments Leveraging pricing optimization potential Pricing c. +10bps p.a. through best practices Supplier concentration and Supplier relations
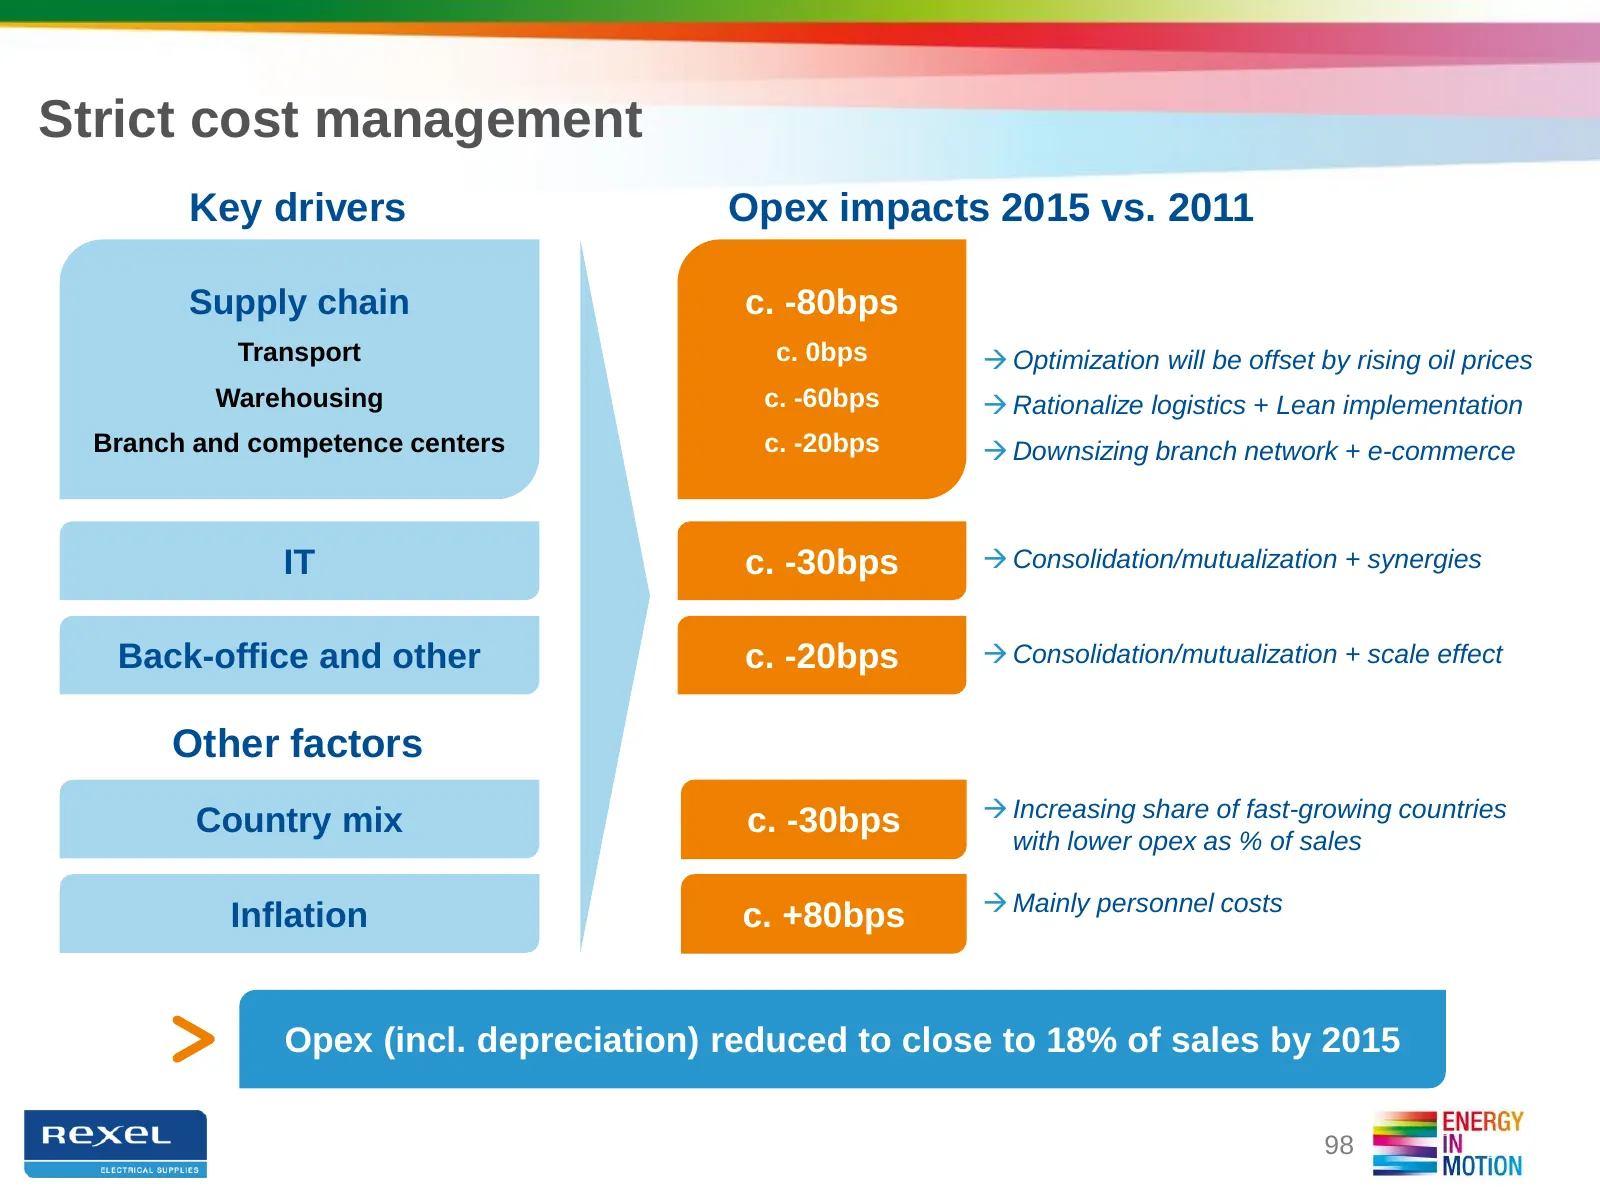
Slide 98: Strict cost management
Strict cost management Key drivers Opex impacts 2015 vs. 2011 Supply chain c. -80bps Transport c. 0bps Optimization will be offset by rising oil prices Warehousing c. -60bps Rationalize logistics + Lean implementation Branch and competence centers c. -20bps Downsizing branch network + e-commer
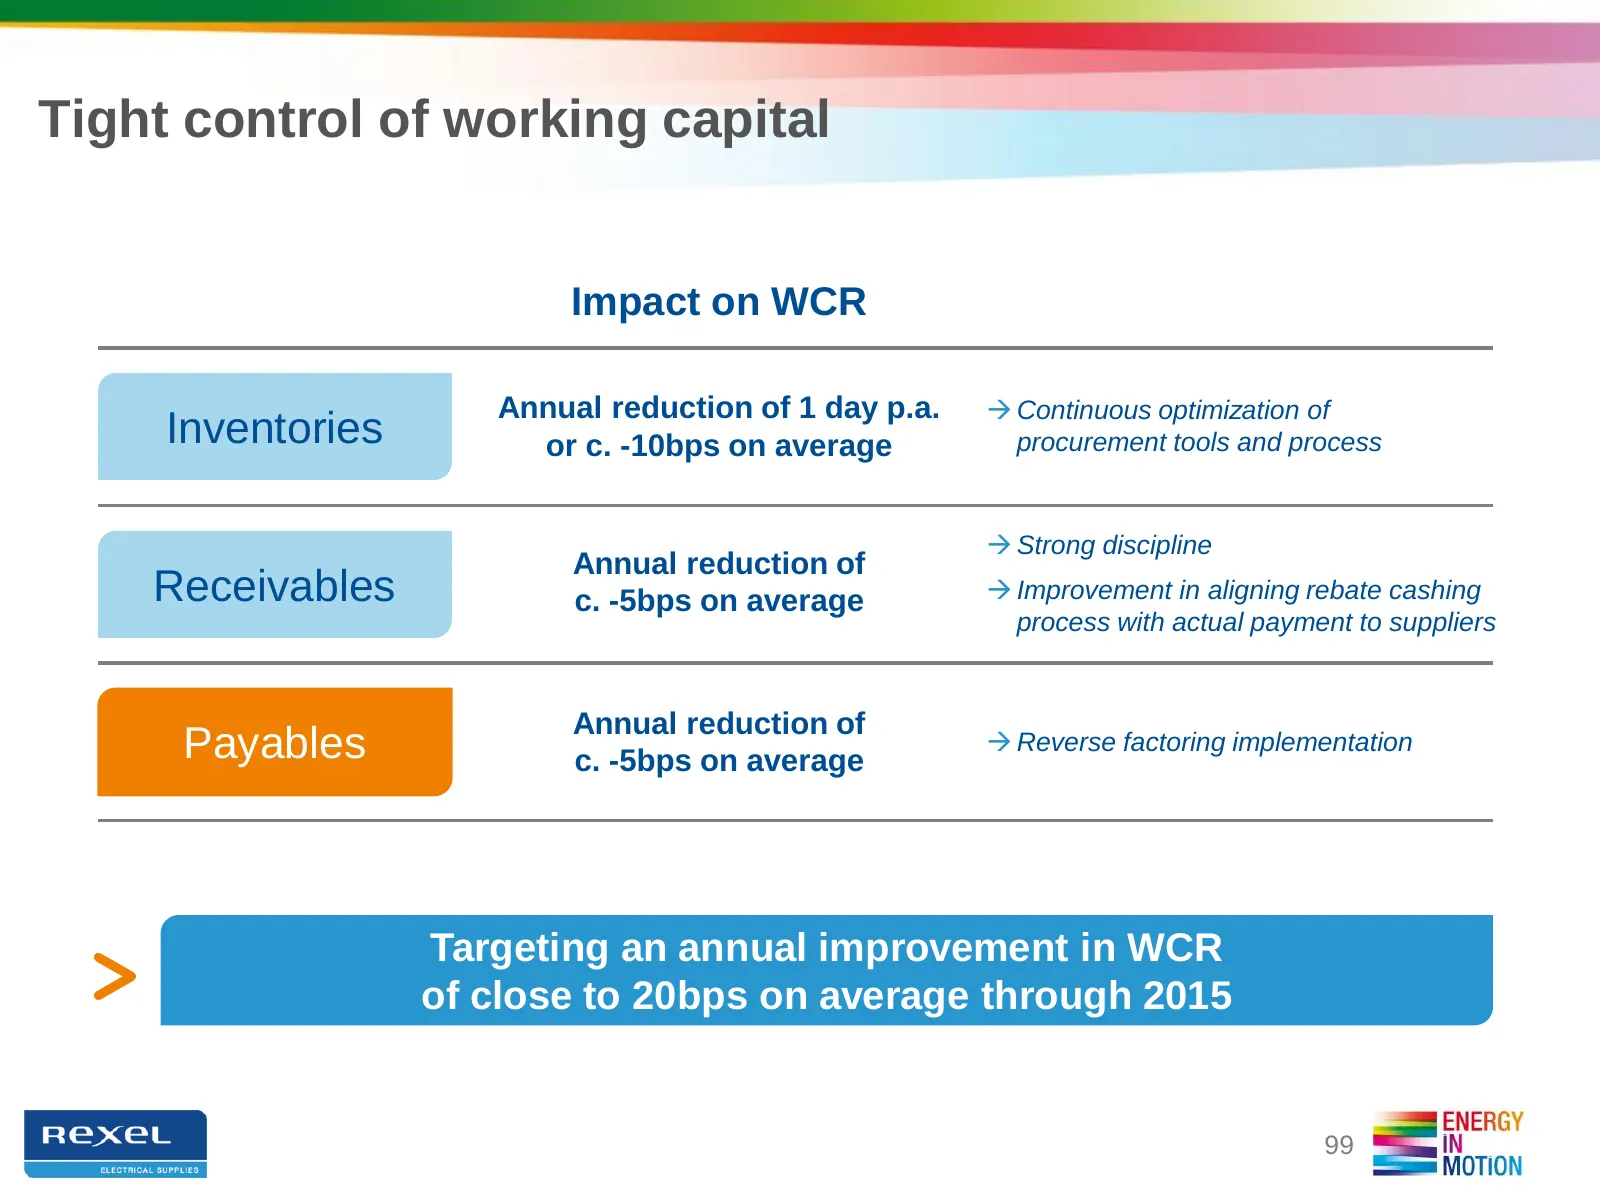
Slide 99: Tight control of working capital
Tight control of working capital Impact on WCR Annual reduction of 1 day p.a. Continuous optimization of Inventories or c. -10bps on average procurement tools and process Strong discipline Annual reduction of Receivables c. -5bps on average Improvement in aligning rebate cashing process with a
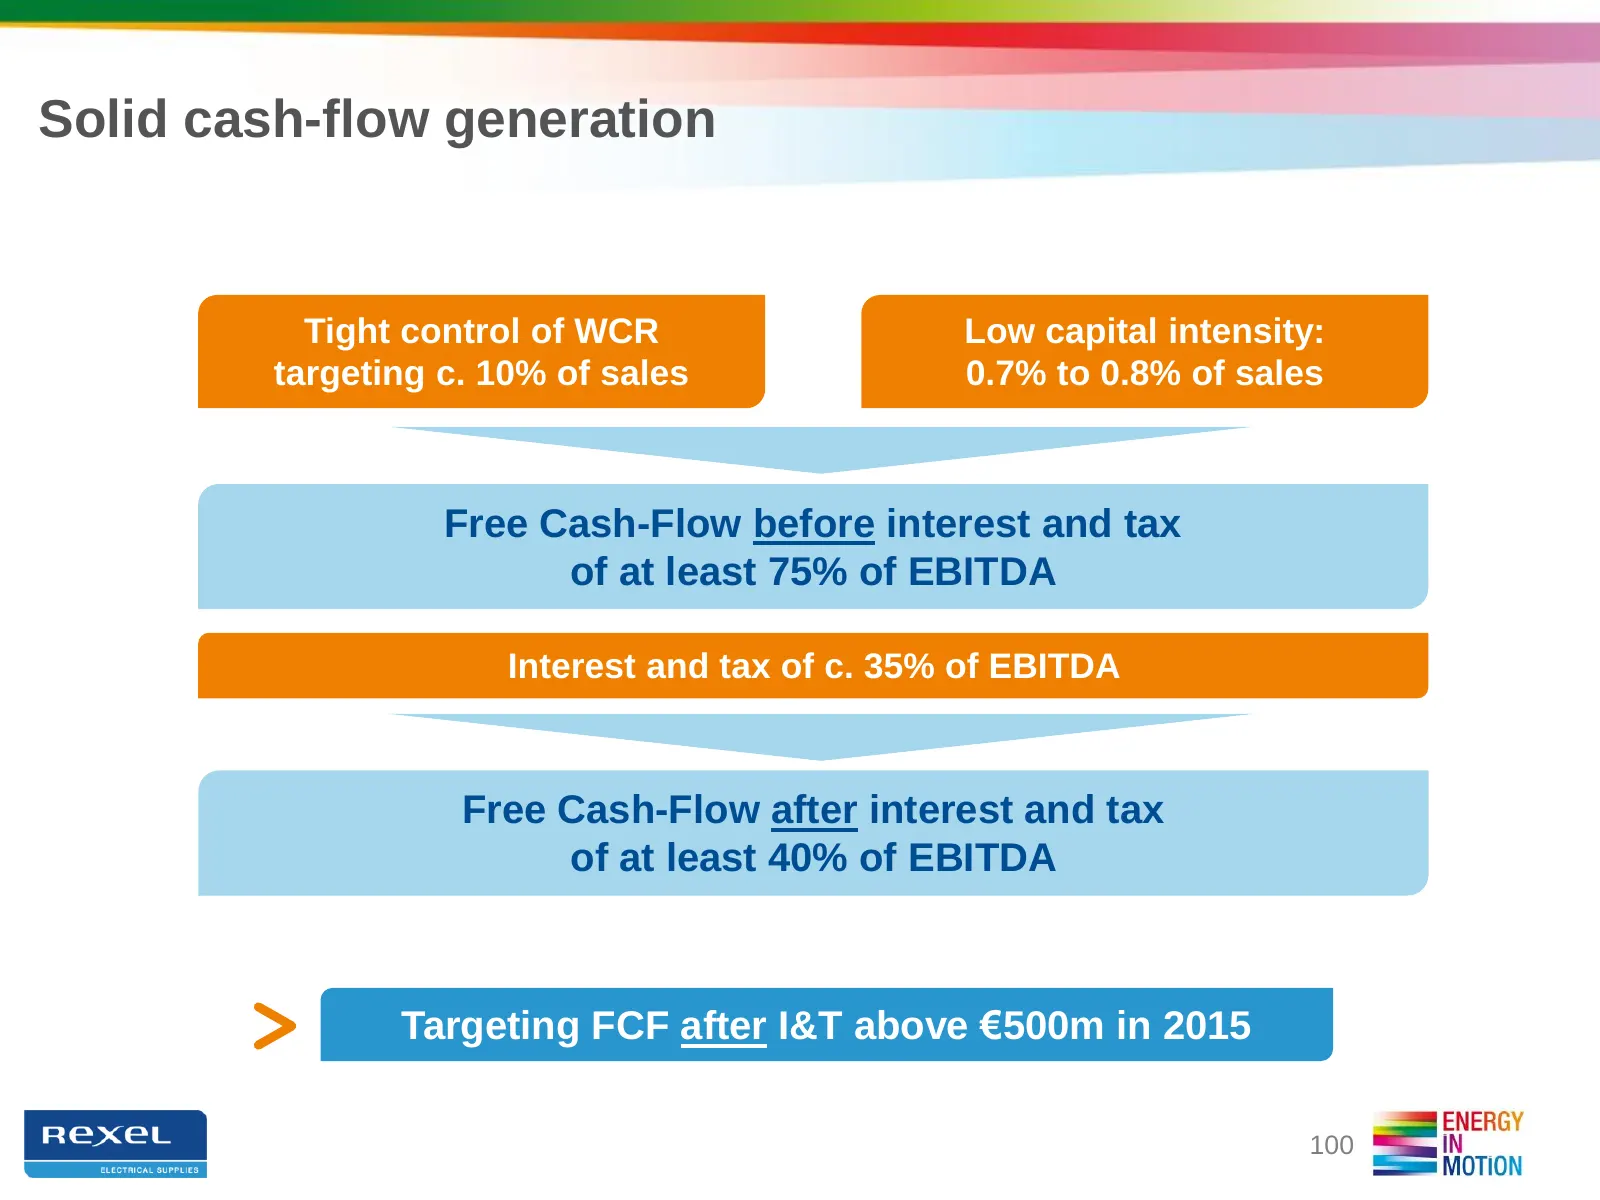
Slide 100: Solid cash-flow generation
Solid cash-flow generation Tight control of WCR Low capital intensity: targeting c. 10% of sales 0.7% to 0.8% of sales Free Cash-Flow before interest and tax of at least 75% of EBITDA Interest and tax of c. 35% of EBITDA Free Cash-Flow after interest and tax of at least 40% of EBITDA Targeting FCF a
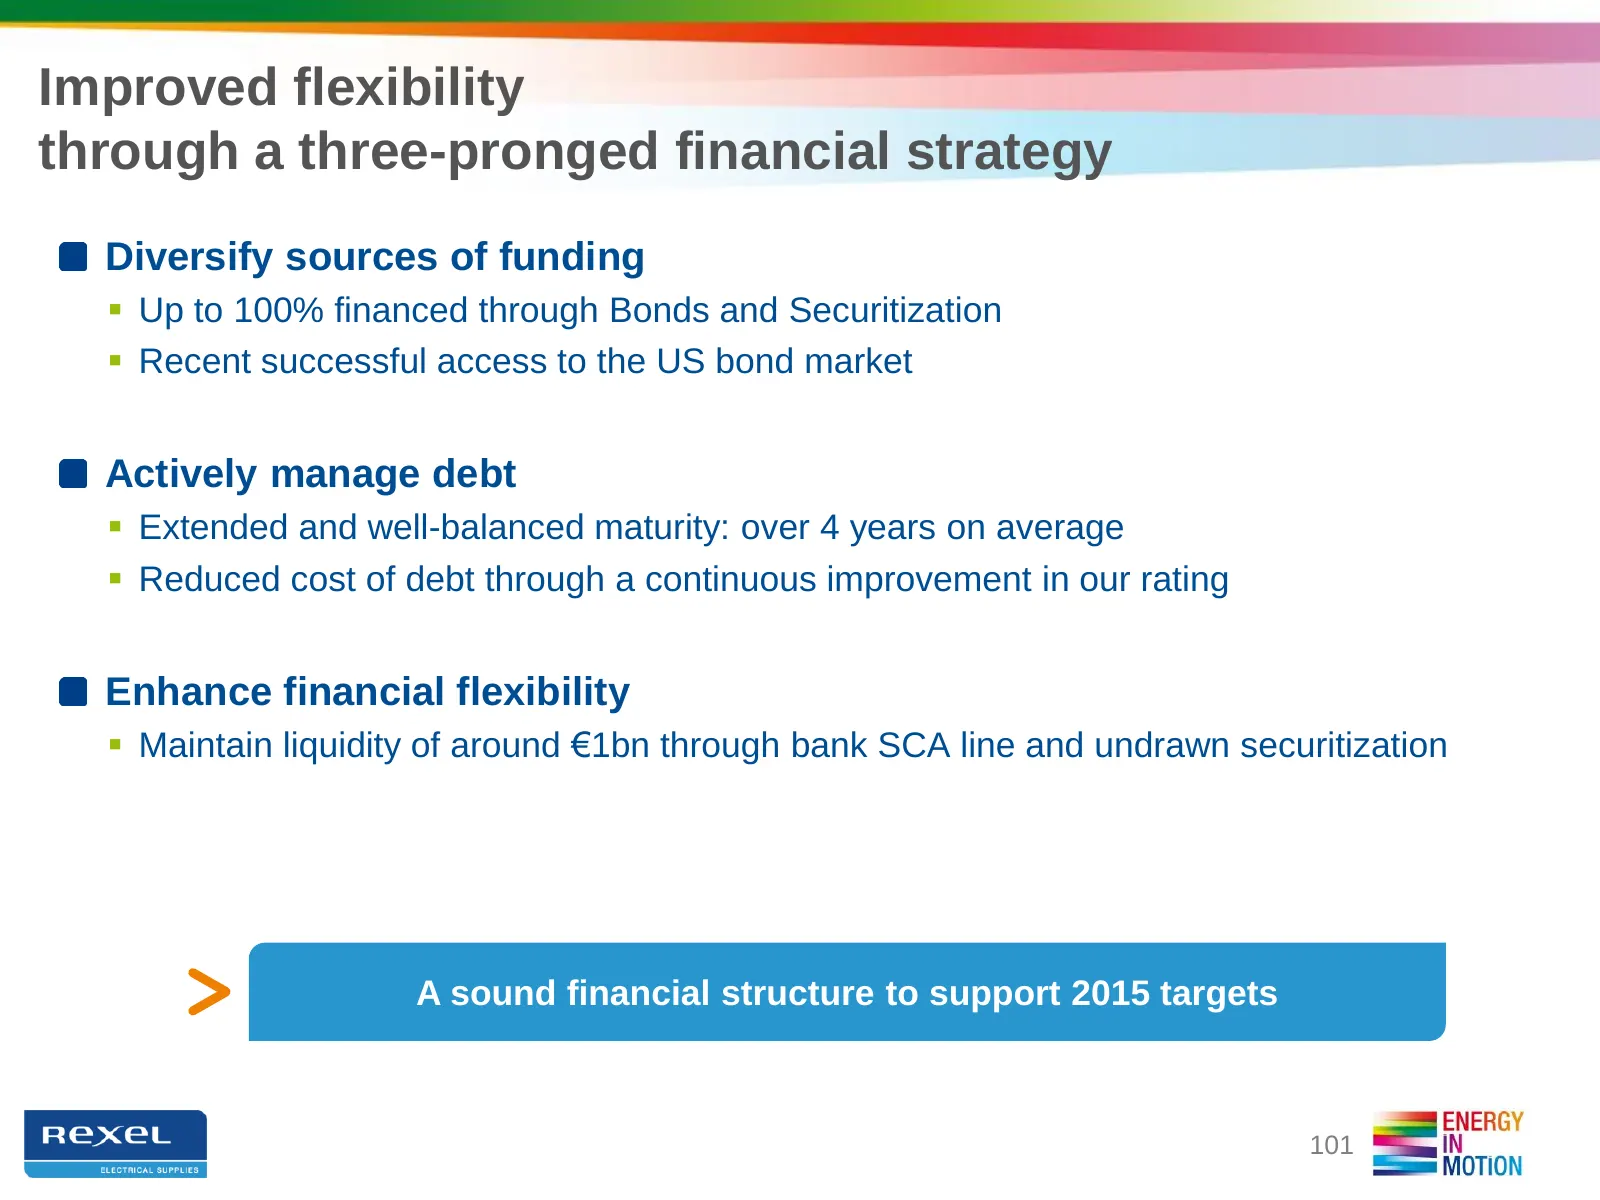
Slide 101: Improved flexibility through a three-pronged financial strategy
Improved flexibility through a three-pronged financial strategy Diversify sources of funding Up to 100% financed through Bonds and Securitization Recent successful access to the US bond market Actively manage debt Extended and well-balanced maturity: over 4 years on average Reduced cost of d
Slide 102: Outlook & conclusion
OUTLOOK & CONCLUSION Rudy PROVOOST, Chairman of the Management Board and CEO
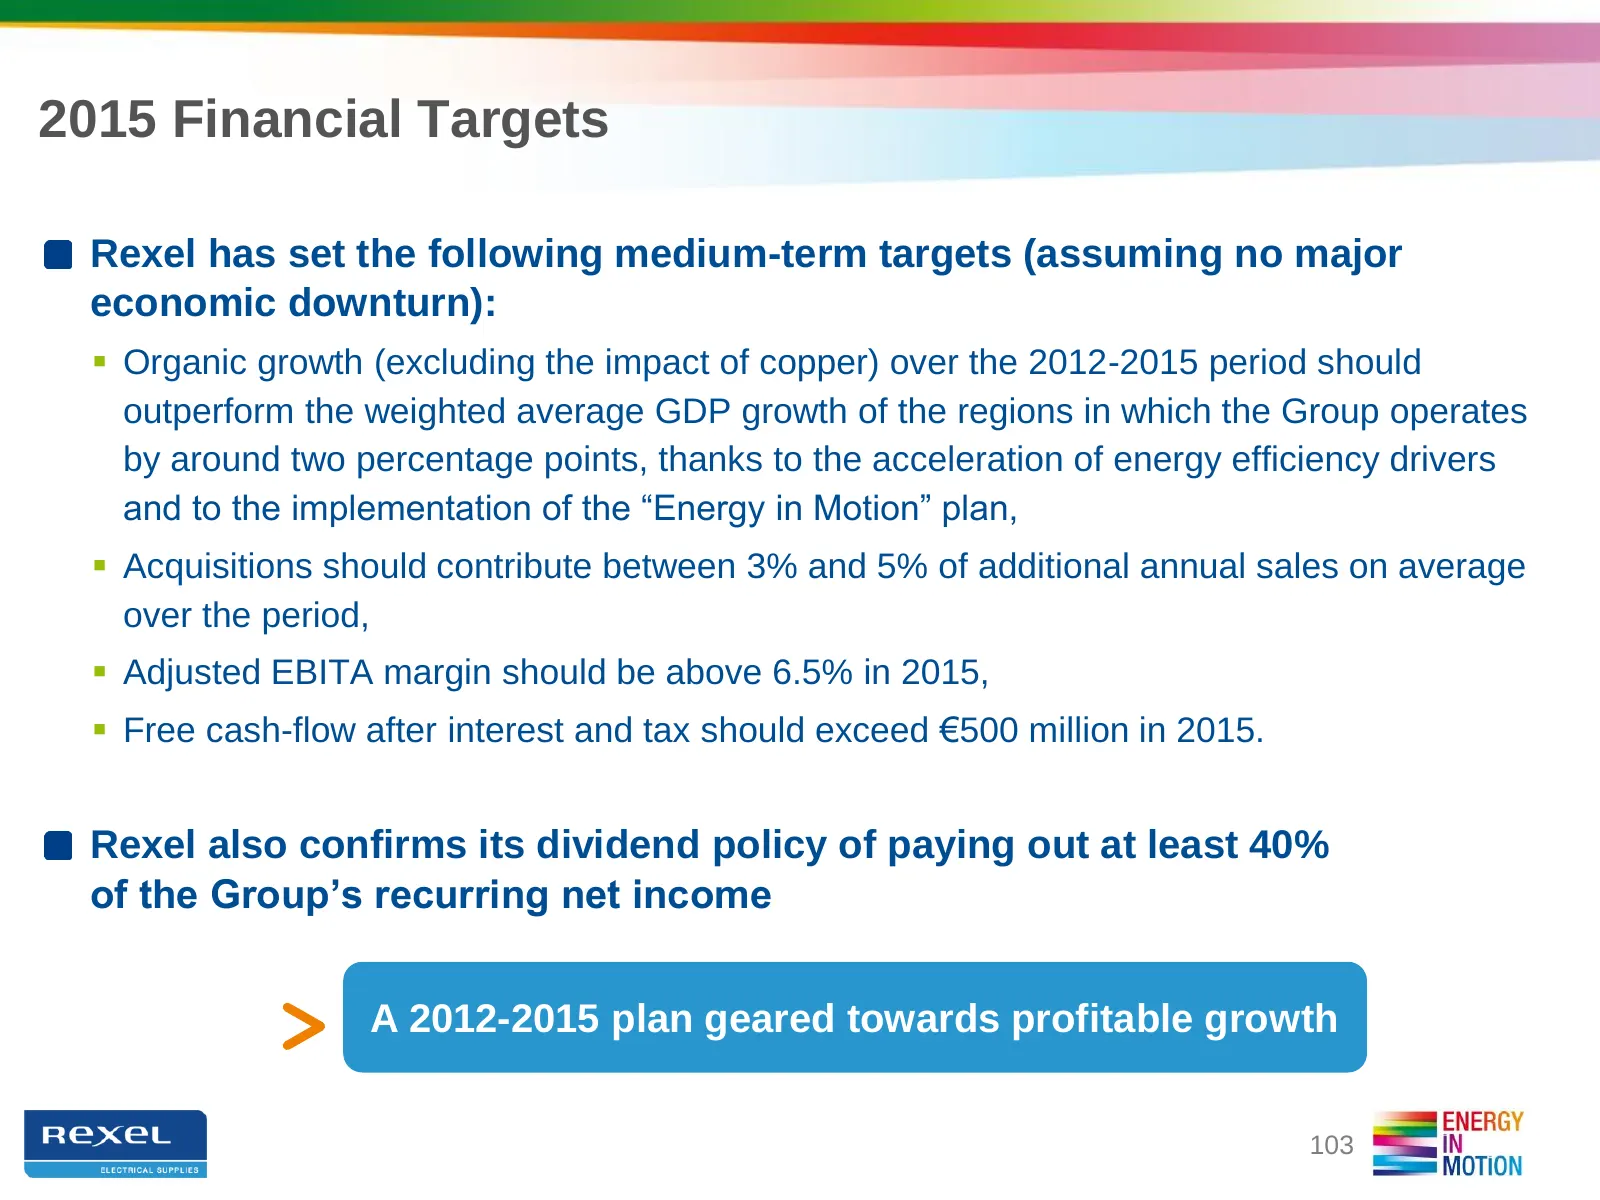
Slide 103: 2015 Financial Targets
2015 Financial Targets Rexel has set the following medium-term targets (assuming no major economic downturn): Organic growth (excluding the impact of copper) over the 2012-2015 period should outperform the weighted average GDP growth of the regions in which the Group operates by around two percent
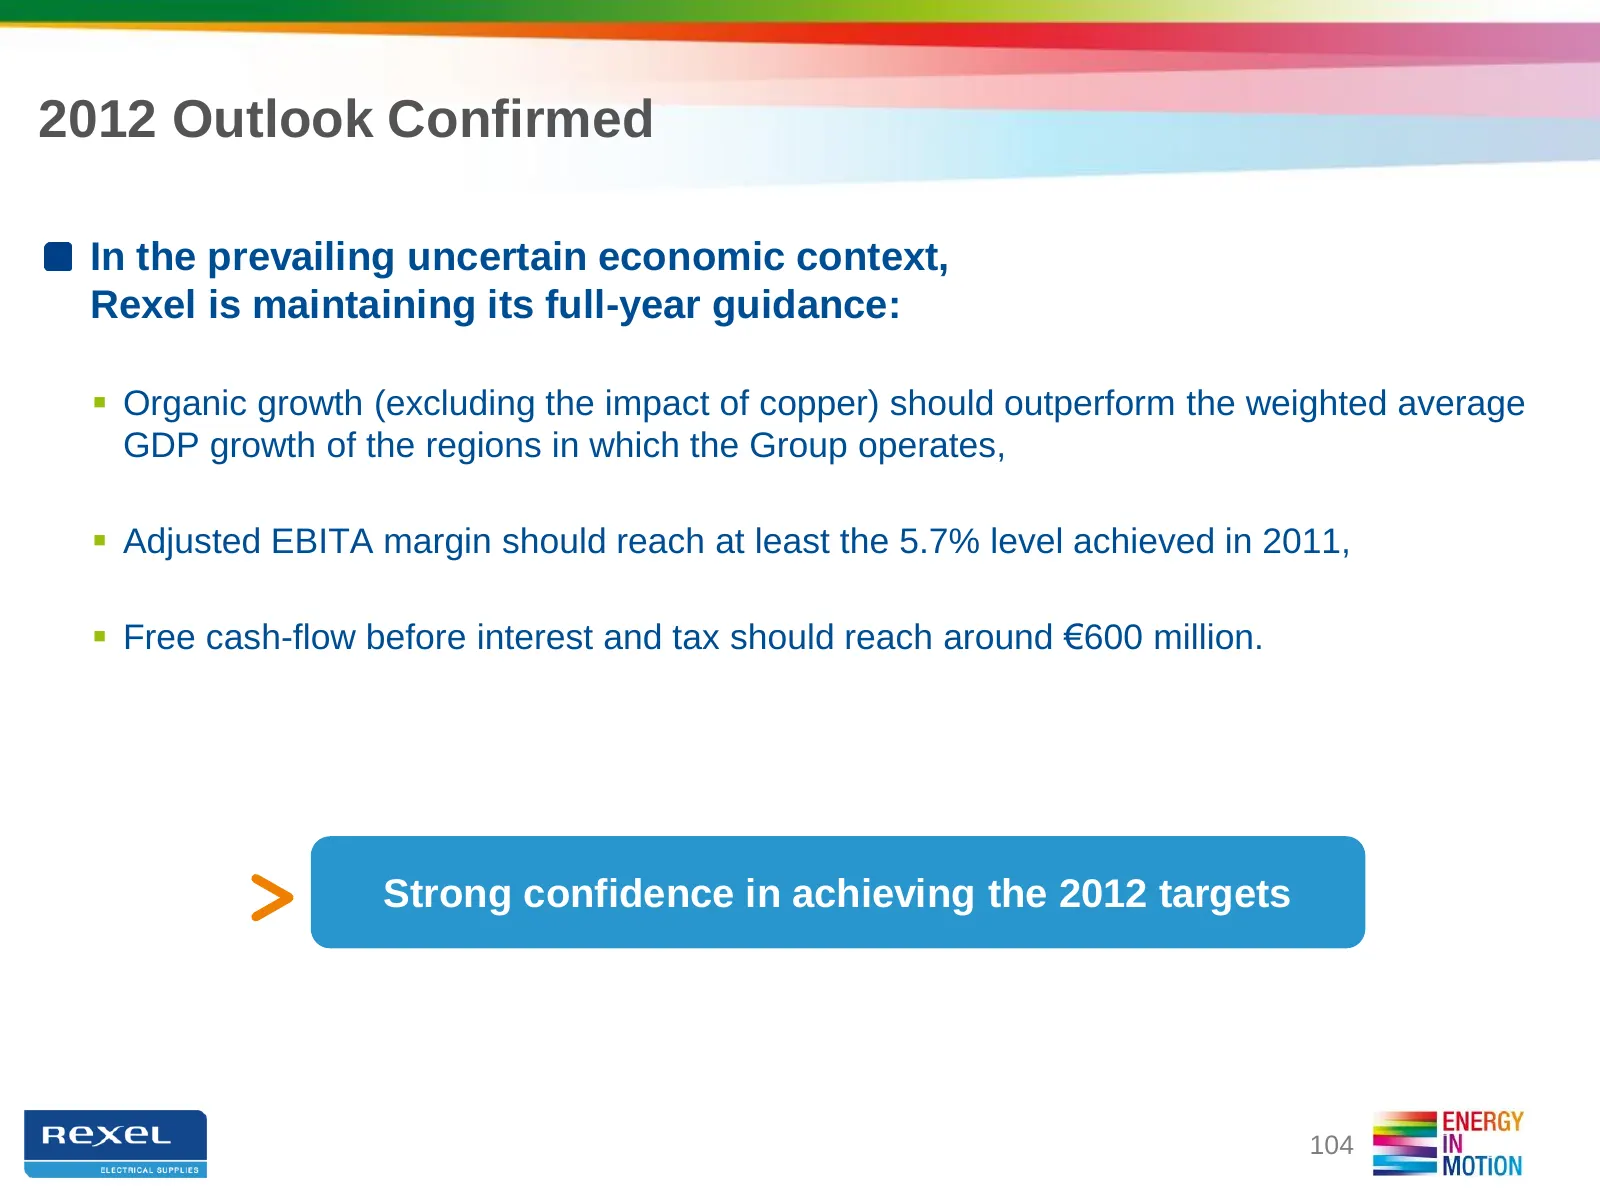
Slide 104: 2012 Outlook Confirmed
2012 Outlook Confirmed In the prevailing uncertain economic context, Rexel is maintaining its full-year guidance: Organic growth (excluding the impact of copper) should outperform the weighted average GDP growth of the regions in which the Group operates, Adjusted EBITA margin should reach at le
Slide 105: Key take-aways
Key take-aways We are writing a new chapter of Rexel’s success story… A new strategic roadmap: “Energy in Motion” New ambitions New medium-term targets …for all our stakeholders: Enriching our service offer for customers Developing our partnership with suppliers Energizing our teams Cr
Slide 106: Contacts
Contacts INVESTORS & ANALYSTS PRESS Marc MAILLET Pénélope LINAGE-COHEN Tel: +33 1 42 85 76 12 Tel: +33 1 42 85 76 28 Email: mmaillet@rexel.com Email: plinage@rexel.com Florence MEILHAC Brunswick - Thomas KAMM Tel: +33 1 42 85 57 61 Tel: +33 1 53 96 83 92 Email: fmeilhac@rexel.com Email: tkamm@brunsw
Slide 107: Disclaimer
Disclaimer The Group is exposed to fluctuations in copper prices in connection with its distribution of cable products. Cables accounted for approximately 17% of the Group's sales, and copper accounts for approximately 60% of the composition of cables. This exposure is indirect since cable prices al
Source: Internet Archive copy of rexel.com
More decks from Rexel SA
 Q3 2026 Earnings Presentation13 slides · Oct 22, 2026
 Q2 2026 Earnings Presentation24 slides · Jul 27, 2026
 FY 2025 Earnings Presentation31 slides · Feb 11, 2026
 Q3 2025 Earnings Presentation15 slides · Oct 15, 2025
 Q2 2025 Earnings Presentation20 slides · Jul 28, 2025
 Q1 2025 Earnings Presentation16 slides · Apr 29, 2025