Reliant Bancorp — KBW Community Bank Conference 2018
22 slides from Reliant Bancorp's conference presentation, Jul 27, 2018
Slide 1: July 2018 KBW Community Bank Conference Investor Presentation
July 2018 KBW Community Bank Conference Investor Presentation
Slide 2: Safe Harbor Statements
Safe Harbor Statements Forward Looking StatementsThis presentation includes forward-looking statements within the meaning of the safe harbor provisions of the Private Securities Litigation Reform Act of 1995, which management believes are a benefit to shareholders. These statements are necessarily s
Slide 3: Company Overview
CQ) Reliant BANCORP, INC. Company Overview July 2018
Slide 4: Reliant Bank Franchise Overview
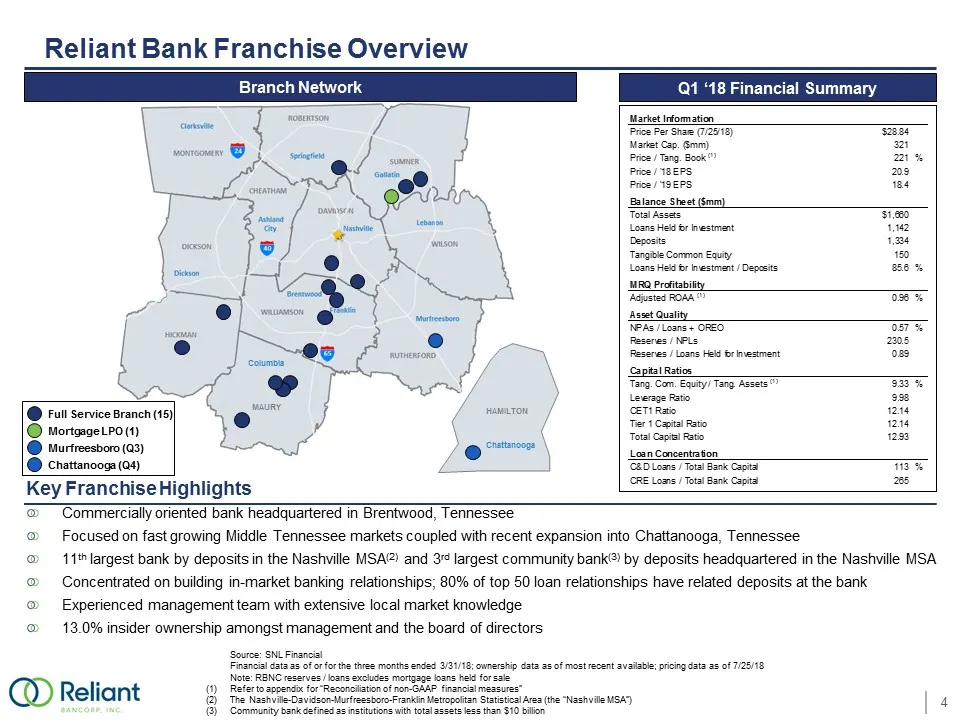
Reliant Bank Franchise Overview Source: SNL Financial Financial data as of or for the three months ended 3/31/18; ownership data as of most recent available; pricing data as of 7/25/18 Note: RBNC reserves / loans excludes mortgage loans held for sale (1) Refer to appendix for “Reconciliation of non-
Slide 5: Experienced Management Team
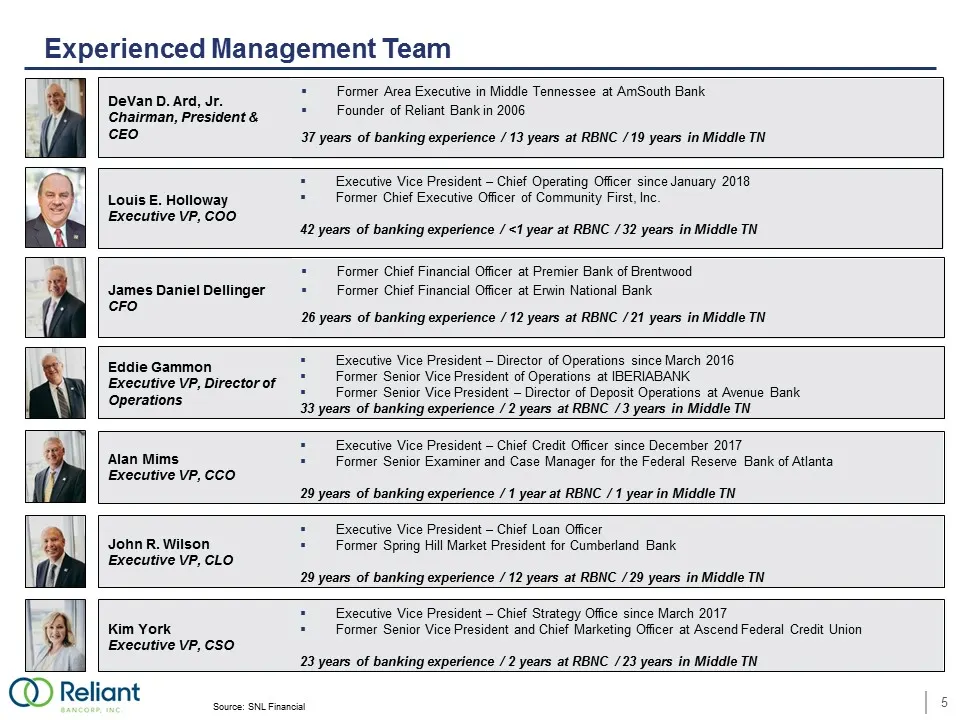
Experienced Management Team Source: SNL Financial DeVan D. Ard, Jr.Chairman, President & CEO Former Area Executive in Middle Tennessee at AmSouth BankFounder of Reliant Bank in 2006 37 years of banking experience / 13 years at RBNC / 19 years in Middle TN James Daniel Dellinger CFO Former Chief Fina
Slide 6: Nashville Deposit Market Share
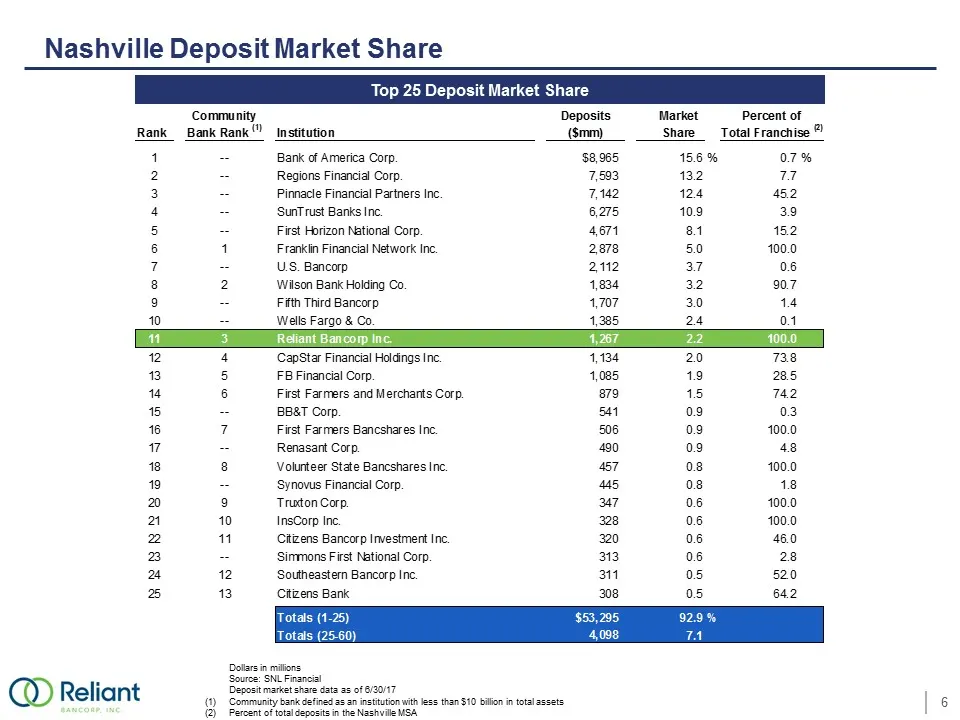
Nashville Deposit Market Share Dollars in millions Source: SNL Financial Deposit market share data as of 6/30/17 (1)Community bank defined as an institution with less than $10 billion in total assets (2)Percent of total deposits in the Nashville MSA Top 25 Deposit Market Share Community Deposits Mar
Slide 7: Nashville MSA Demographics
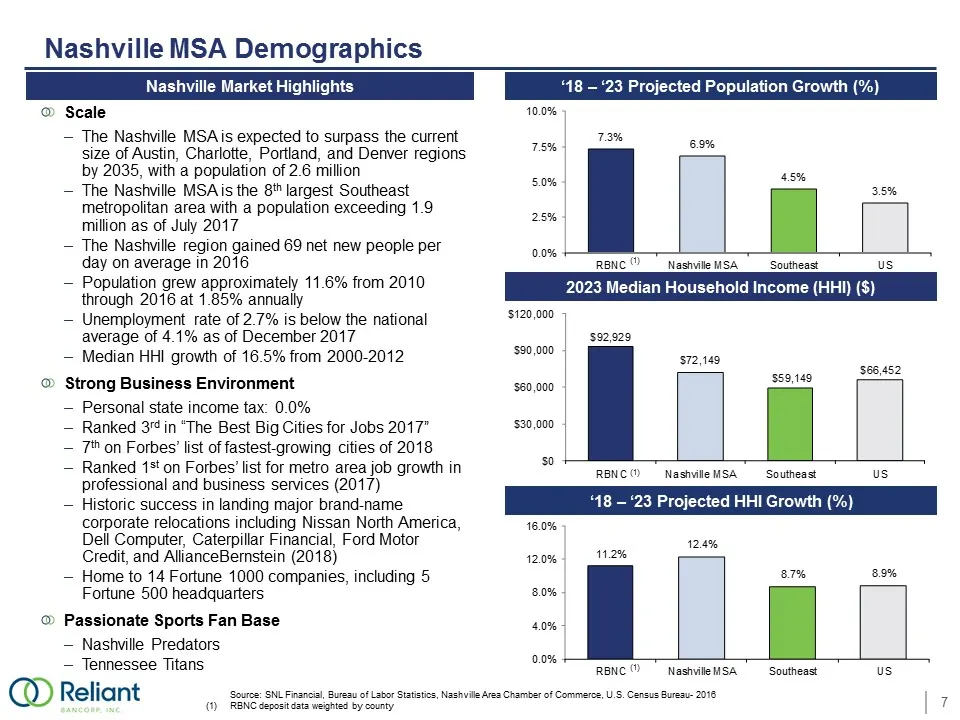
Nashville MSA Demographics Source: SNL Financial, Bureau of Labor Statistics, Nashville Area Chamber of Commerce, U.S. Census Bureau- 2016 (1) RBNC deposit data weighted by county Nashville Market Highlights 2023 Median Household Income (HHI) ($) ‘18 – ‘23 Projected HHI Growth (%) ‘18 – ‘23 Projecte
Slide 8: Projected Population Growth by County
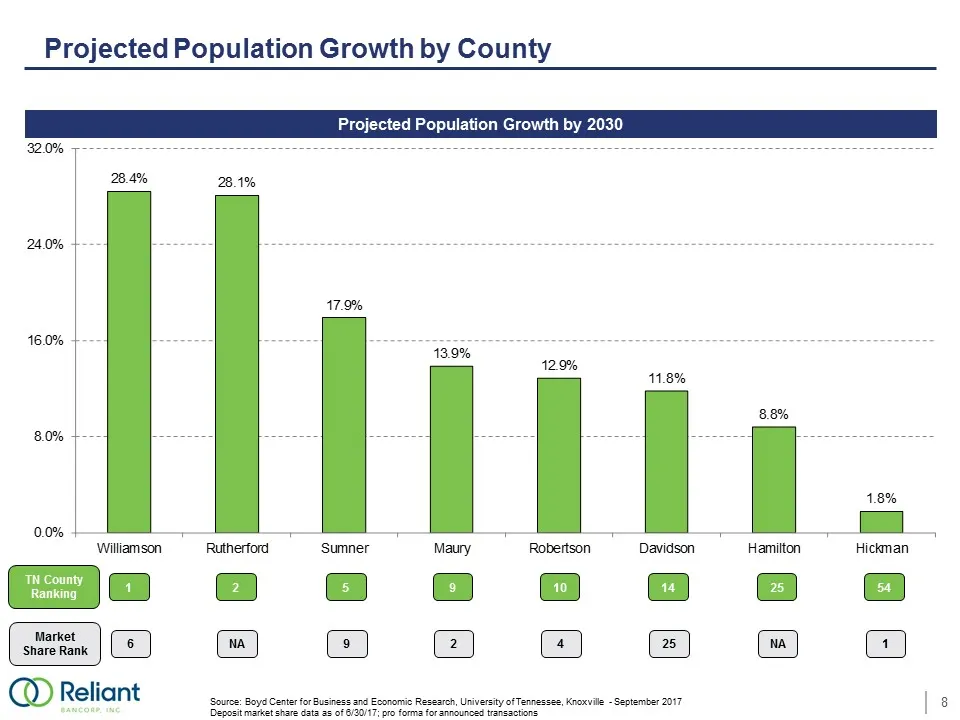
Projected Population Growth by County Projected Population Growth by 2030 Source: Boyd Center for Business and Economic Research, University of Tennessee, Knoxville - September 2017 Deposit market share data as of 6/30/17; pro forma for announced transactions TN County Ranking 1 2 5 9 10 14 25 54 28
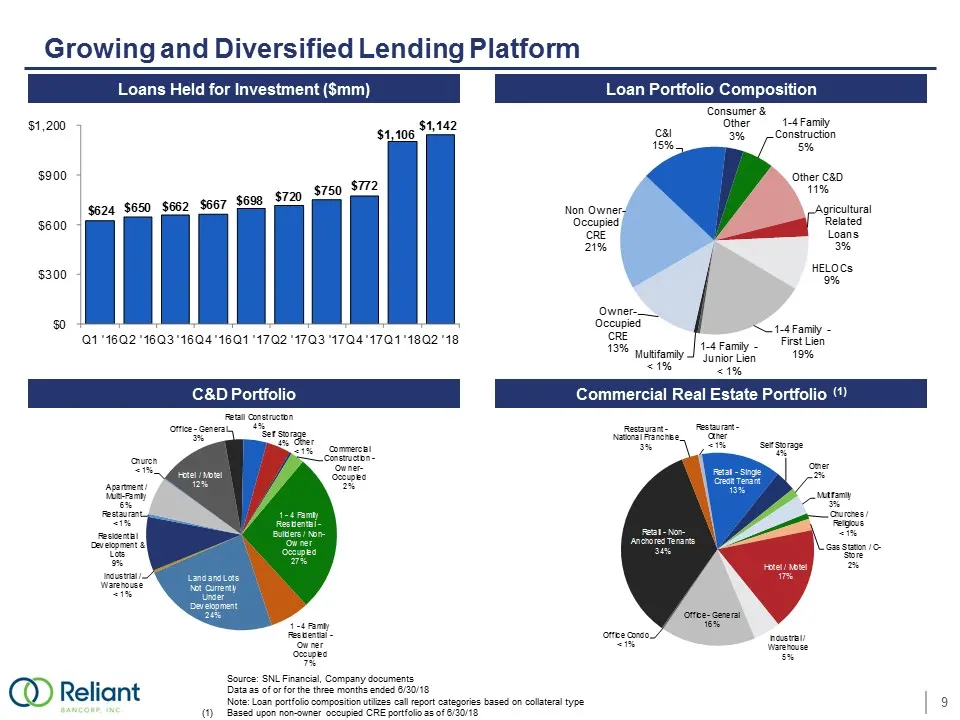
Slide 9: Growing and Diversified Lending Platform
Growing and Diversified Lending Platform Source: SNL Financial, Company documents Data as of or for the three months ended 6/30/18 Note: Loan portfolio composition utilizes call report categories based on collateral type (1) Based upon non-owner occupied CRE portfolio as of 6/30/18 Loan Portfolio Co
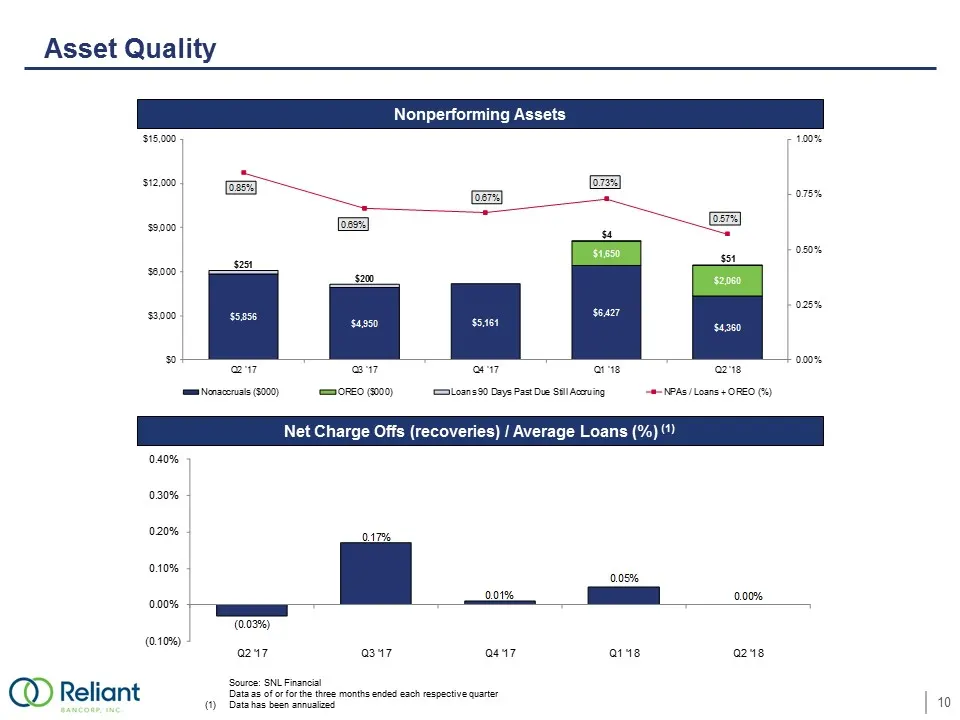
Slide 10: Asset Quality
Asset Quality Source: SNL Financial Data as of or for the three months ended each respective quarter (1) Data has been annualized Nonperforming Assets Net Charge Offs (recoveries) / Average Loans (%) (1) $5,856 $4,950 $5,161 $6,427 $4,360 $1,650 $2,060 $251 $200 $4 $51 0.85% 0.69% 0.67% 0.73% 0.57%
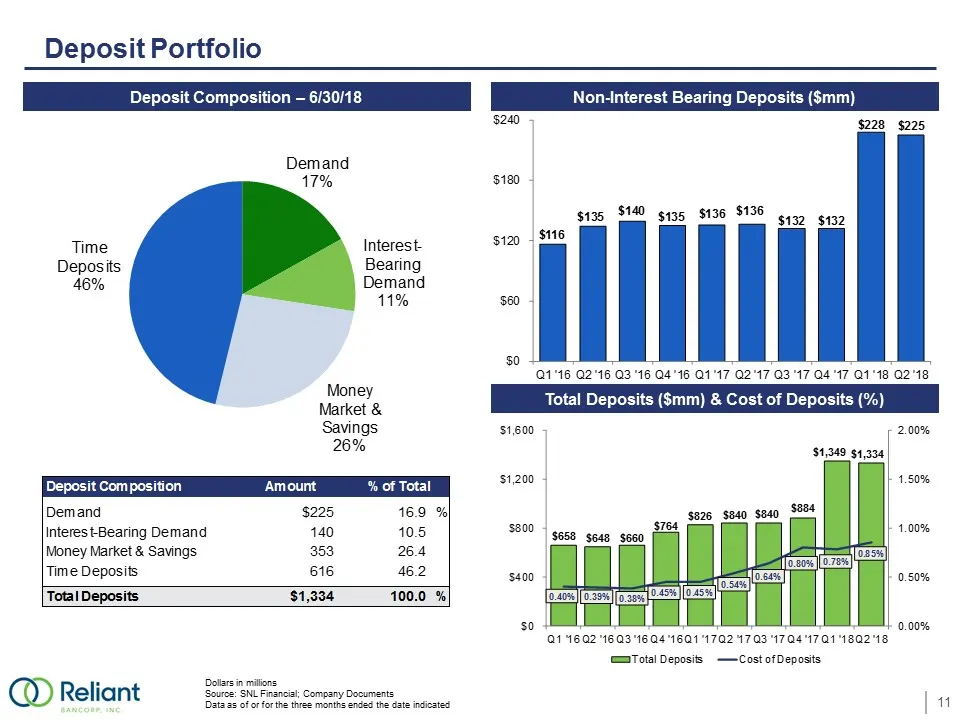
Slide 11: Deposit Portfolio
Deposit Portfolio Dollars in millions Source: SNL Financial; Company Documents Data as of or for the three months ended the date indicated Deposit Composition – 6/30/18 Non-Interest Bearing Deposits ($mm) Total Deposits ($mm) & Cost of Deposits (%) Demand 17% Interest- Bearing Demand 11% Money Marke
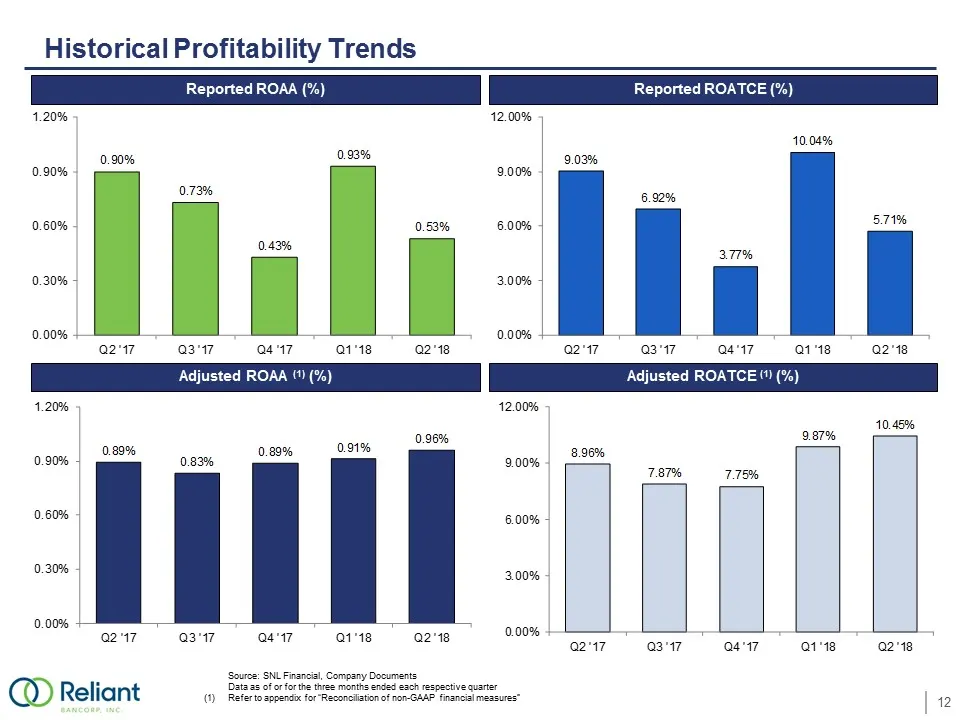
Slide 12: Historical Profitability Trends
Historical Profitability Trends Source: SNL Financial, Company Documents Data as of or for the three months ended each respective quarter (1) Refer to appendix for “Reconciliation of non-GAAP financial measures” Adjusted ROAA (1) (%) Reported ROATCE (%) Adjusted ROATCE (1) (%) 0.90% 0.73% 0.43% 0.93
Slide 13: Historical Profitability Trends
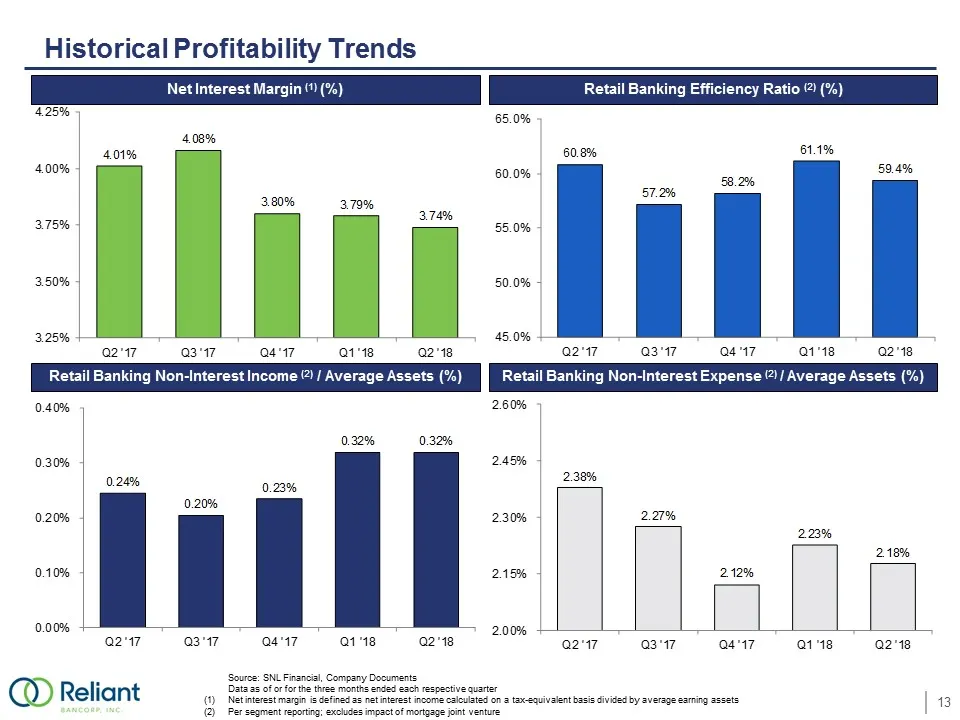
Historical Profitability Trends Source: SNL Financial, Company Documents Data as of or for the three months ended each respective quarter (1) Net interest margin is defined as net interest income calculated on a tax-equivalent basis divided by average earning assets (2) Per segment reporting; exclud
Slide 14: Capital & Liquidity Position
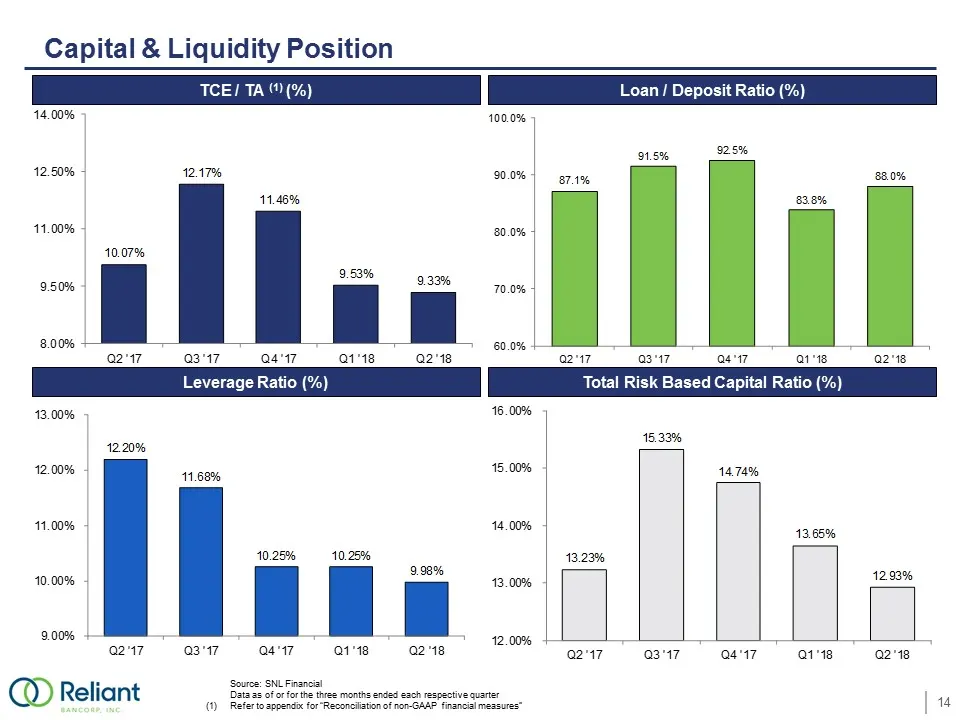
Capital & Liquidity Position TCE / TA (1) (%) Loan / Deposit Ratio (%) Leverage Ratio (%) Total Risk Based Capital Ratio (%) Source: SNL Financial Data as of or for the three months ended each respective quarter (1) Refer to appendix for “Reconciliation of non-GAAP financial measures” 10.07% 12.17%
Slide 15: Focused on Delivering Shareholder Value
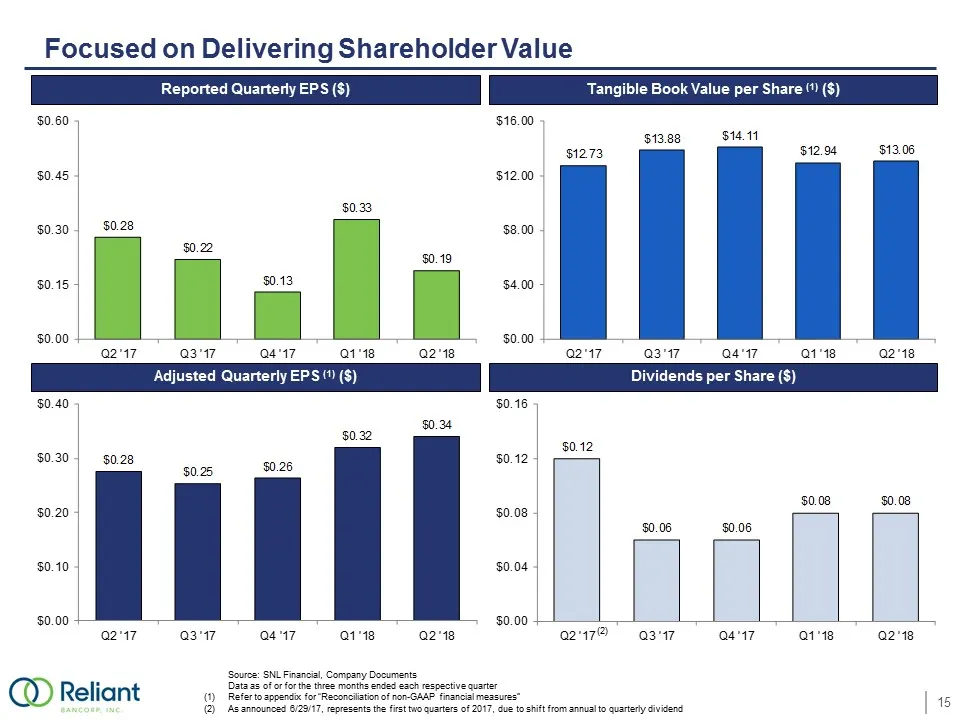
Focused on Delivering Shareholder Value Source: SNL Financial, Company Documents Data as of or for the three months ended each respective quarter (1) Refer to appendix for “Reconciliation of non-GAAP financial measures” (2) As announced 6/29/17, represents the first two quarters of 2017, due to shif
Slide 16: Our History
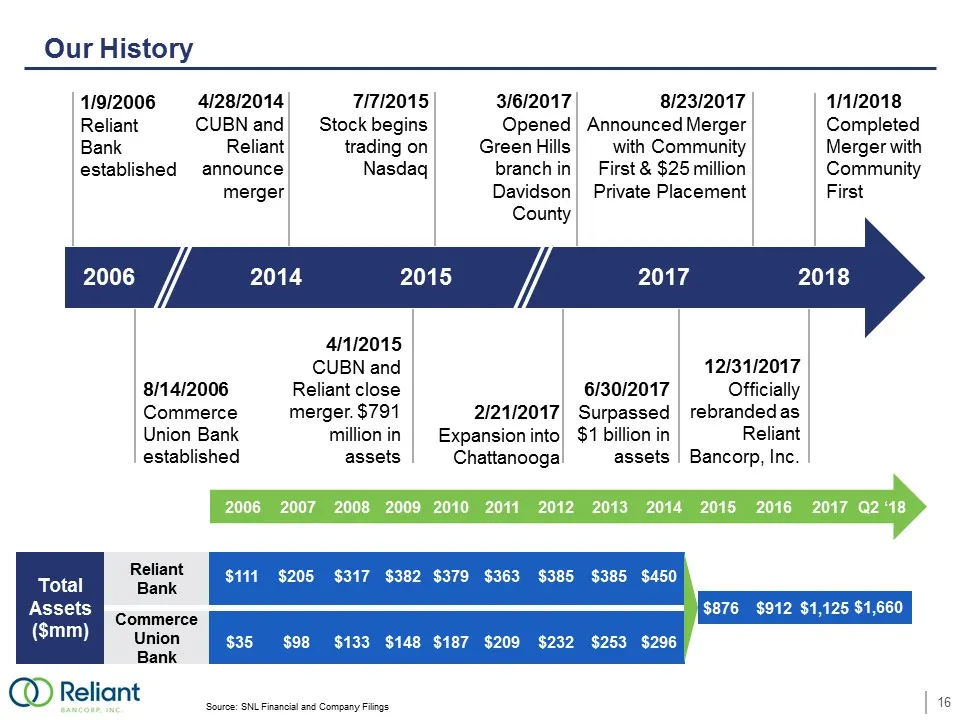
Our History Source: SNL Financial and Company Filings 2006 2014 2015 2017 1/9/2006 Reliant Bank established 4/1/2015 CUBN and Reliant close merger. $791 million in assets 4/28/2014 CUBN and Reliant announce merger 7/7/2015 Stock begins trading on Nasdaq 3/6/2017 Opened Green Hills branch in Davidson
Slide 17: Our Strategy for 2018
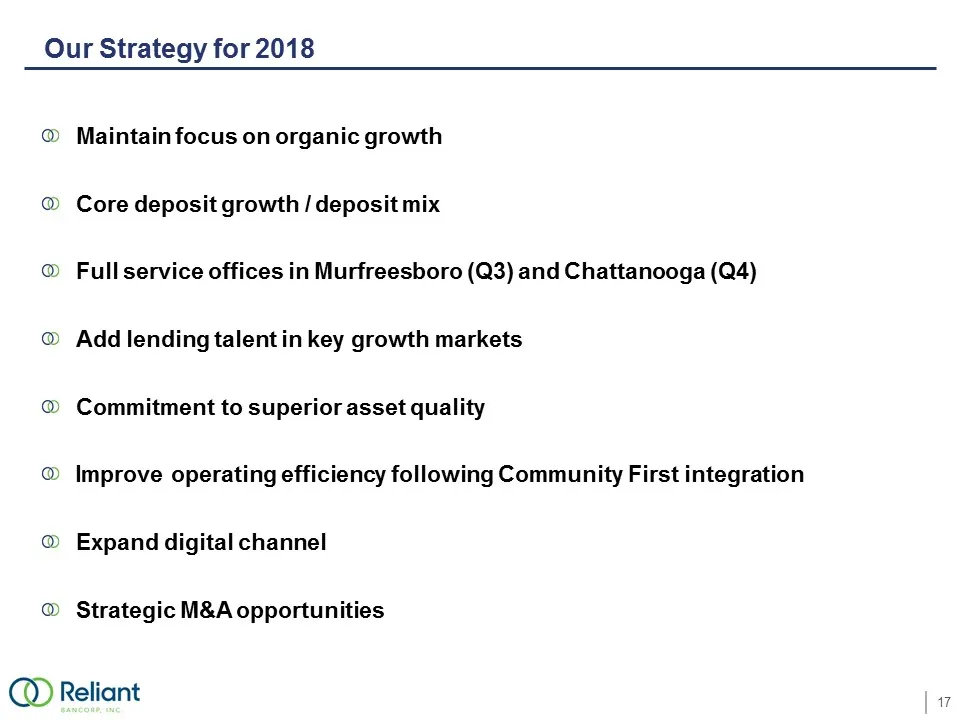
Our Strategy for 2018 Maintain focus on organic growthCore deposit growth / deposit mixFull service offices in Murfreesboro (Q3) and Chattanooga (Q4) Add lending talent in key growth marketsCommitment to superior asset qualityImprove operating efficiency following Community First integrationExpand d
Slide 18: Appendix
GROW TOGETHER Appendix
Slide 19: Reconciliation of Non-GAAP Financial Measures
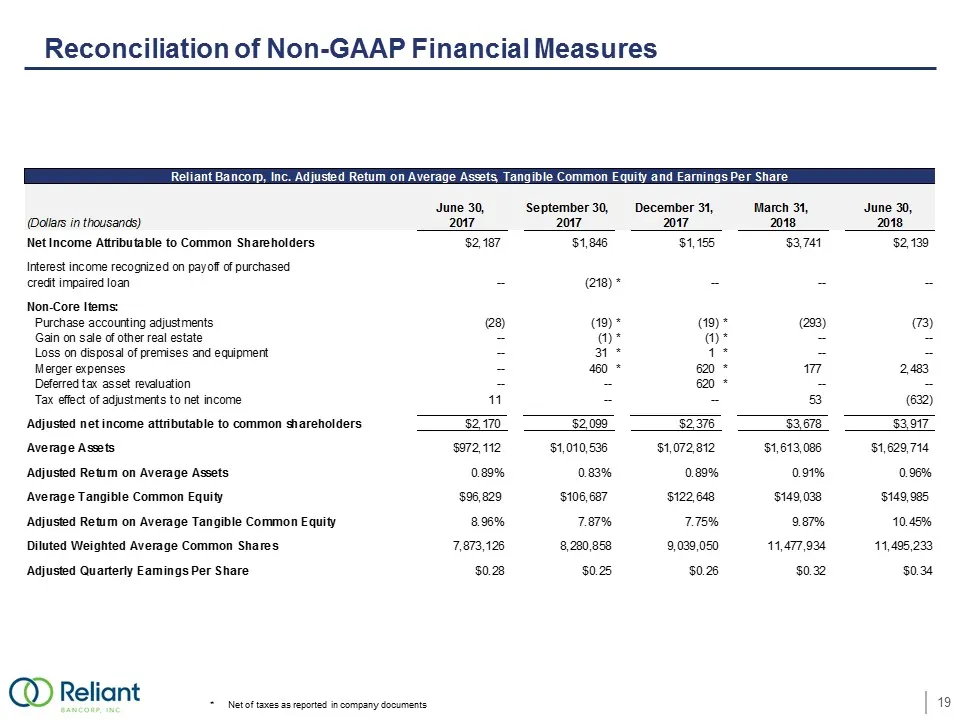
Reconciliation of Non-GAAP Financial Measures *Net of taxes as reported in company documentsReliant Bancorp, Inc. Adjusted Return on Average Assets, Tangible Common Equity and Earnings Per ShareJune 30, September 30, December 31, March 31, June 30, (Dollars in thousands)20172017201720182018Net Incom
Slide 20: Reconciliation of Non-GAAP Financial Measures (cont.)
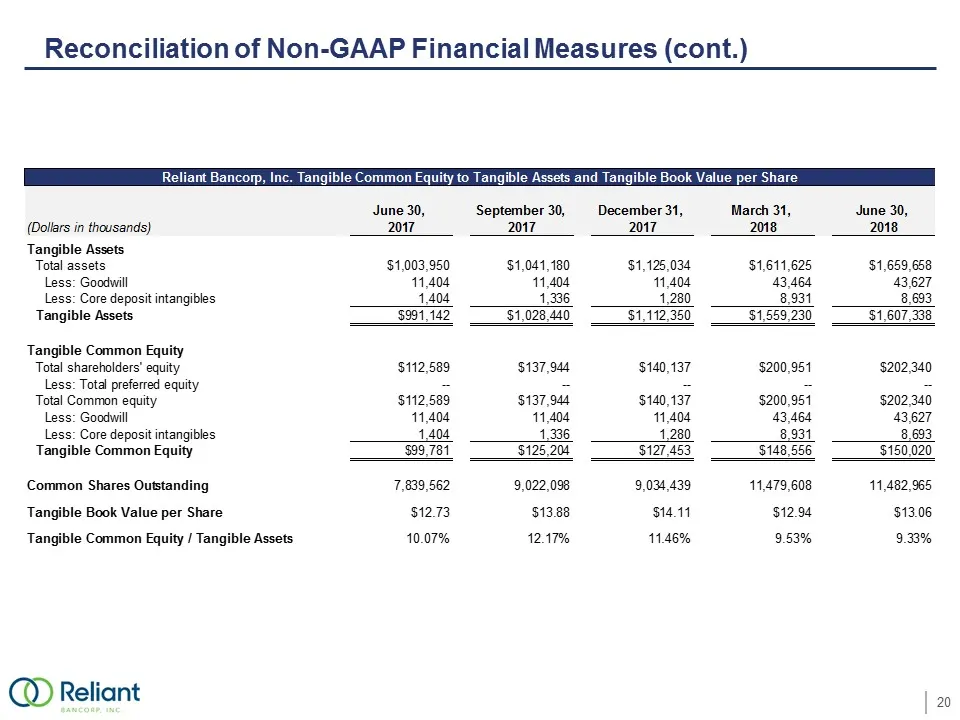
Reconciliation of Non-GAAP Financial Measures (cont.)Reliant Bancorp, Inc. Tangible Common Equity to Tangible Assets and Tangible Book Value per ShareJune 30, September 30, December 31, March 31, June 30, (Dollars in thousands)20172017201720182018Tangible AssetsTotal assets$1,003,950$1,041,180$1,125
Slide 21: Reconciliation of Non-GAAP Financial Measures (cont.)
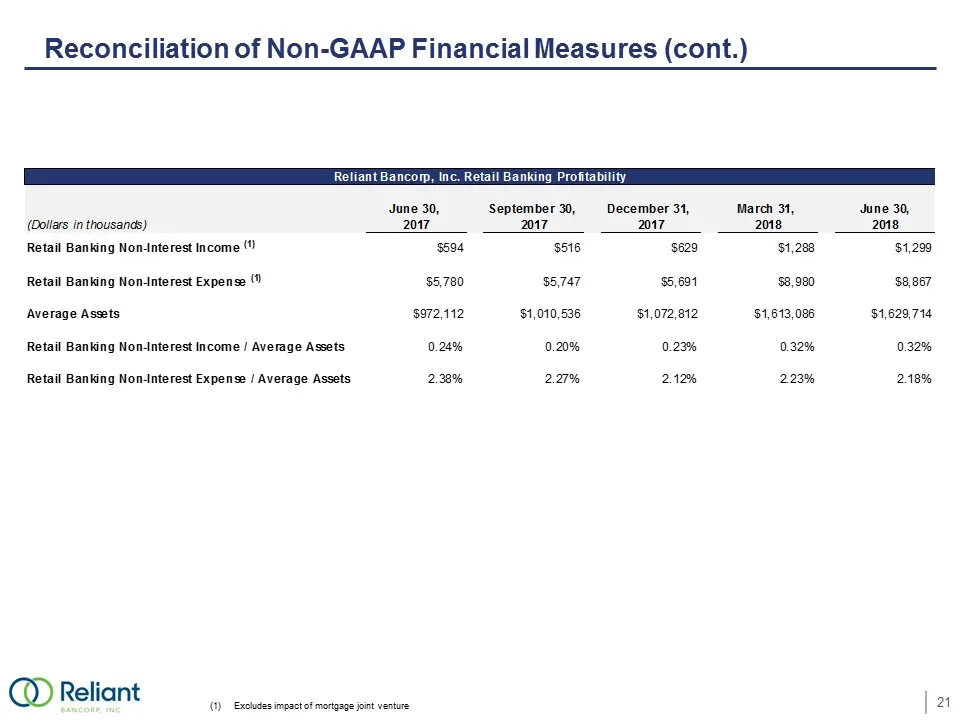
Reconciliation of Non-GAAP Financial Measures (cont.) (1)Excludes impact of mortgage joint venture Reliant Bancorp, Inc. Retail Banking ProfitabilityJune 30, September 30, December 31, March 31, June 30,(Dollars in thousands)20172017201720182018Retail Banking Non-Interest Income (1)$594$516$629$1,28
Slide 22: Reconciliation of Non-GAAP Financial Measures (cont.)
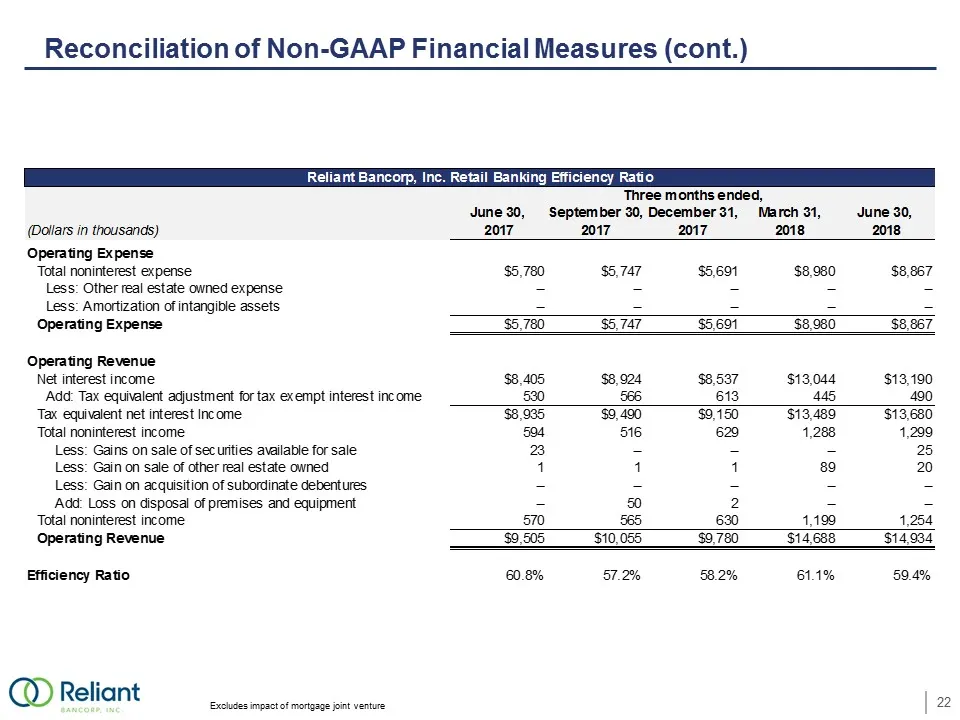
Reconciliation of Non-GAAP Financial Measures (cont.) Excludes impact of mortgage joint venture Reliant Bancorp, Inc. Retail Banking Efficiency RatioThree months ended,June 30, September 30,December 31,March 31,June 30, (Dollars in thousands)20172017201720182018Operating ExpenseTotal noninterest exp
Source: SEC EDGAR · 8-K filed Jul 27, 2018
More decks from Reliant Bancorp Inc
 Q3 2021 Earnings Presentation29 slides · Oct 21, 2021
 Q2 2021 Earnings Presentation28 slides · Jul 21, 2021
 Merger or Acquisition (July 2021)13 slides · Jul 15, 2021
 Gulf South Bank Conference 202128 slides · Apr 30, 2021
 Q1 2021 Earnings Presentation18 slides · Apr 22, 2021
 Raymond James Virtual Investor Meetings 202130 slides · Mar 10, 2021