Reliant Bancorp — Raymond James Virtual Investor Meetings 2021
30 slides from Reliant Bancorp's conference presentation, Mar 10, 2021
Slide 1: Raymond James Virtual Investor Meetings March 11, 2021
Raymond James Virtual Investor Meetings March 11, 2021
Slide 2: Safe Harbor Statements Forward-Looking Statements
Safe Harbor Statements Forward-Looking StatementsAll statements, other than statements of historical fact, included in this presentation and any oral statements made regarding the subject of this presentation that address activities, events or developments that Reliant Bancorp, Inc. (the “Company”)
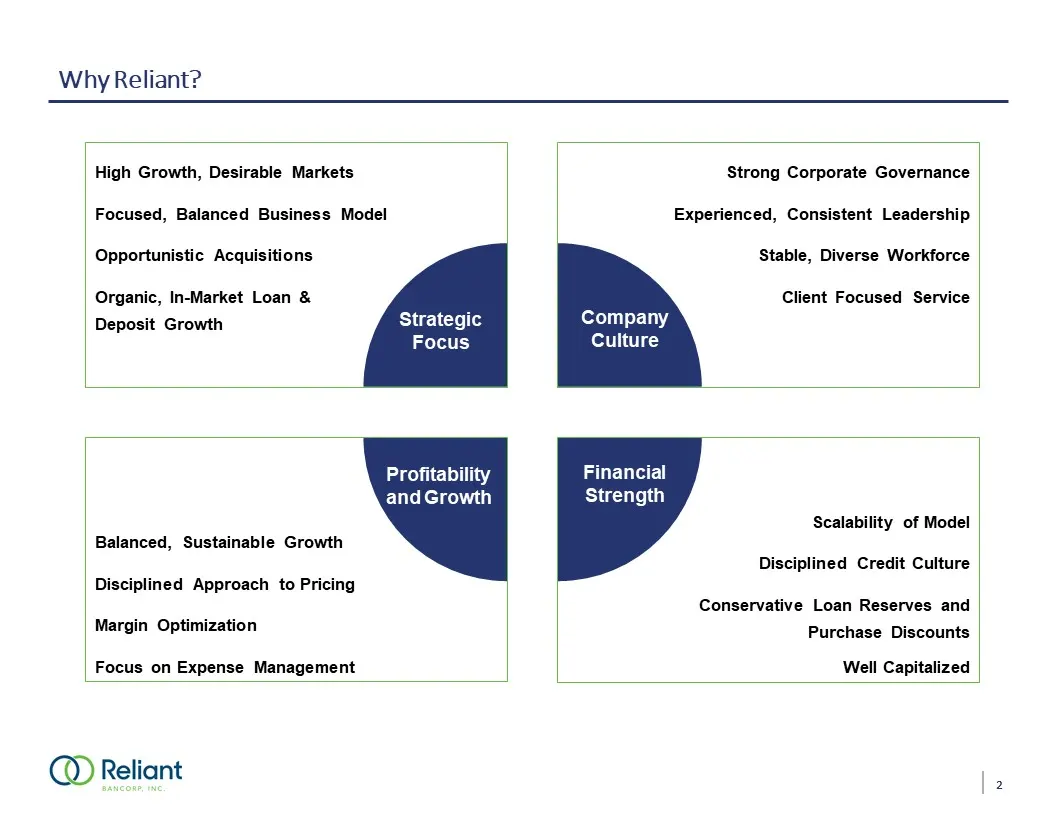
Slide 3: Why Reliant? High Growth, Desirable Markets
Why Reliant? High Growth, Desirable MarketsFocused, Balanced Business ModelOpportunistic AcquisitionsOrganic, In-Market Loan & Deposit Growth Balanced, Sustainable GrowthDisciplined Approach to PricingMargin OptimizationFocus on Expense Management Strong Corporate GovernanceExperienced, Consistent L
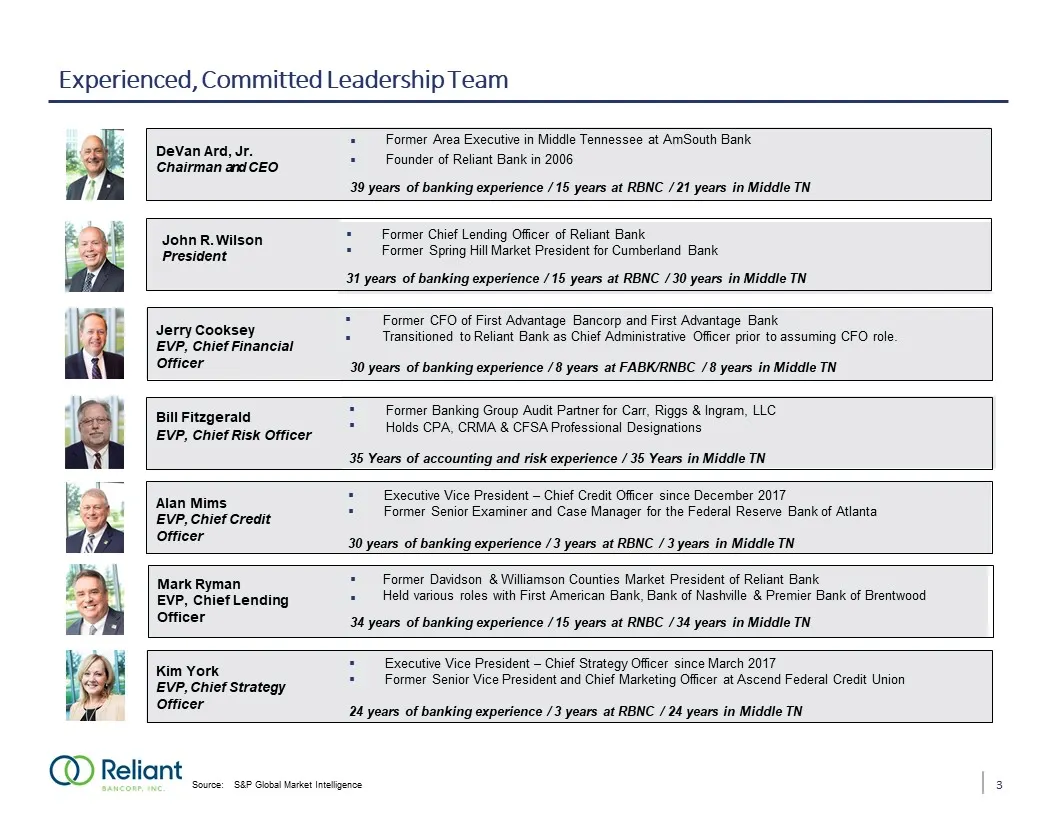
Slide 4: Experienced, Committed Leadership Team
Experienced, Committed Leadership Team 3 Source: S&P Global Market Intelligence DeVan Ard, Jr. Chairman and CEO Former Area Executive in Middle Tennessee at AmSouth Bank Founder of Reliant Bank in 2006 39 years of banking experience / 15 years at RBNC / 21 years in Middle TN Jerry CookseyEVP, Chi
Slide 5: Digital Channel Initiatives
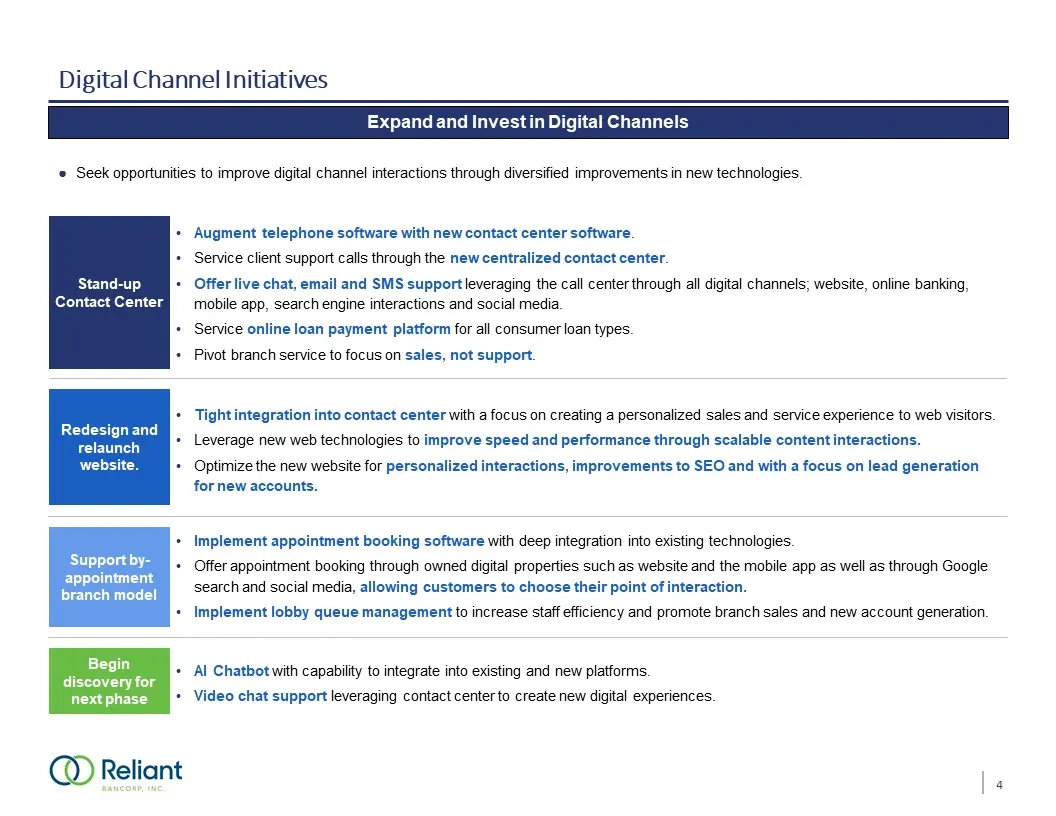
Digital Channel Initiatives EmployeesEnsuring Health and Safety of our Team Members CommunitiesHelping the Communities we Serve CommunitiesHelping the Communities we Serve CommunitiesHelping the Communities we Serve Seek opportunities to improve digital channel interactions through diversified impro
Slide 6: Digital Channel Usage
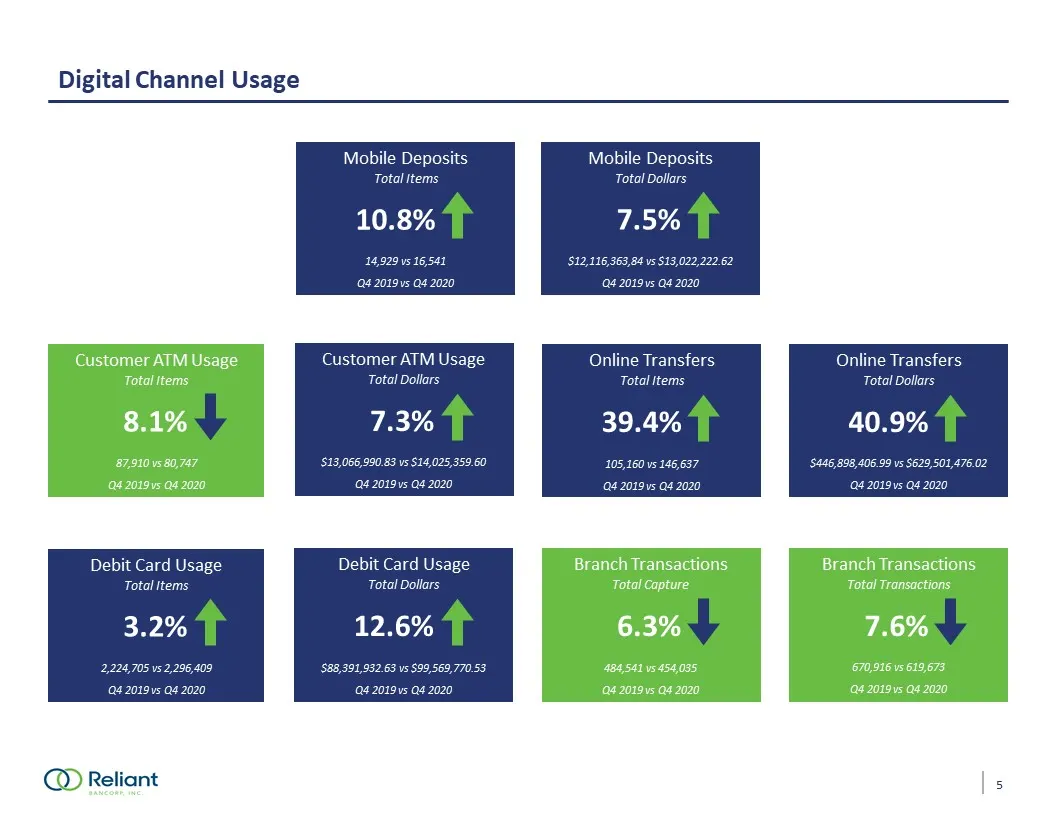
Digital Channel Usage 10.8% Mobile DepositsTotal Items 14,929 vs 16,541Q4 2019 vs Q4 2020 7.5% Mobile DepositsTotal Dollars $12,116,363,84 vs $13,022,222.62Q4 2019 vs Q4 2020 8.1% Customer ATM UsageTotal Items 87,910 vs 80,747Q4 2019 vs Q4 2020 7.3% Customer ATM UsageTotal Dollars $13,066,990.83 vs
Slide 7: Reliant Bank Franchise Overview
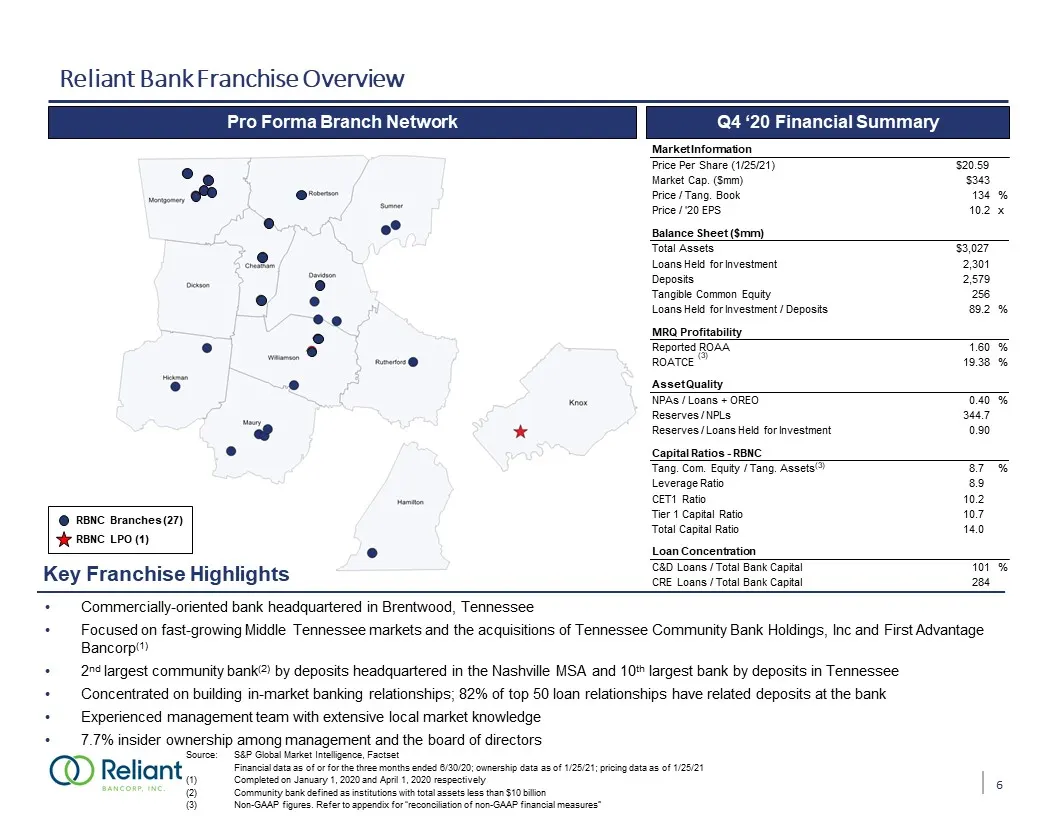
Reliant Bank Franchise Overview Commercially-oriented bank headquartered in Brentwood, Tennessee Focused on fast-growing Middle Tennessee markets and the acquisitions of Tennessee Community Bank Holdings, Inc and First Advantage Bancorp(1)2nd largest community bank(2) by deposits headquartered in th
Slide 8: Our History
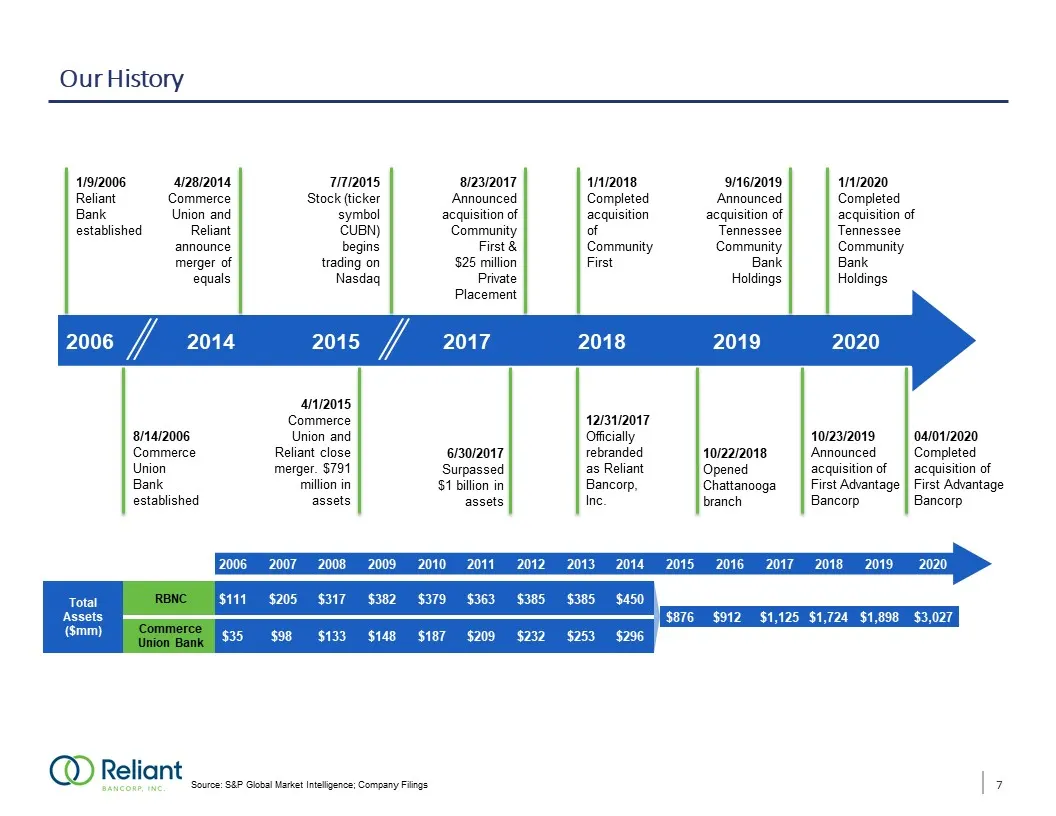
Source: S&P Global Market Intelligence; Company Filings 2006 Our History Total Assets($mm) RBNC Commerce Union Bank 1/9/2006Reliant Bank established 4/28/2014Commerce Union and Reliant announce merger of equals 7/7/2015Stock (ticker symbol CUBN) begins trading on Nasdaq 2006 2014 2017 2018 8/14/2006
Slide 9: Q4 2020 Financial Highlights & Results
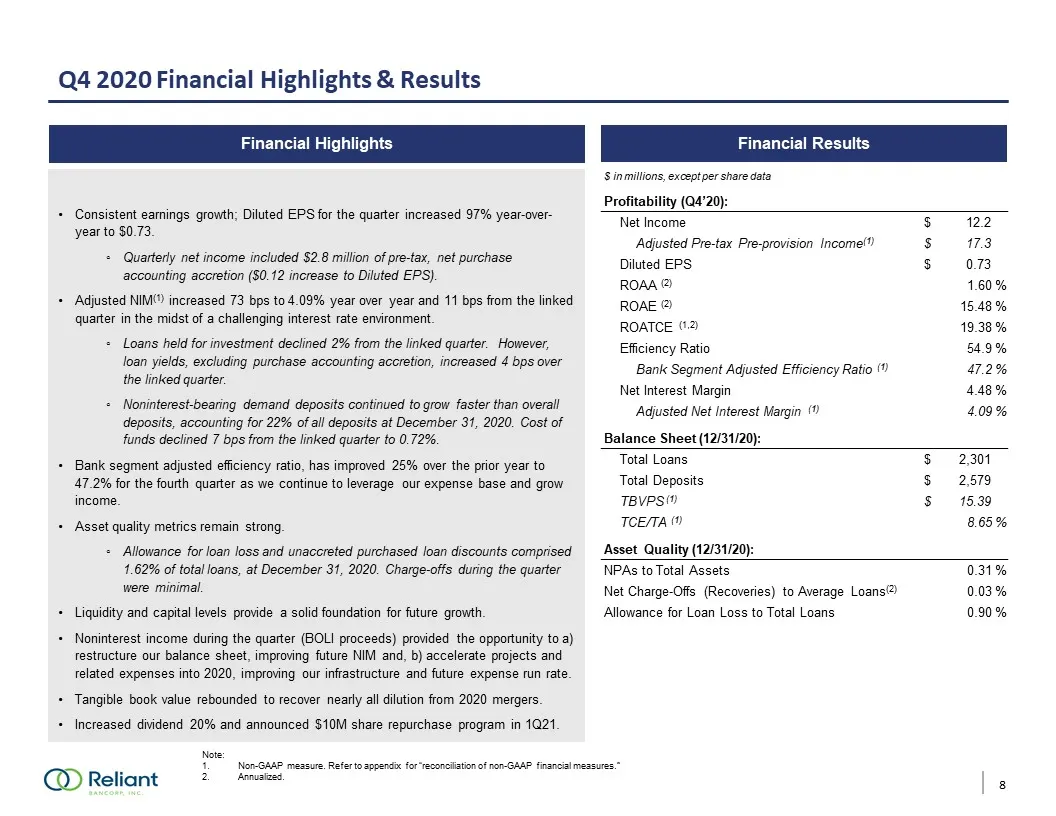
Q4 2020 Financial Highlights & Results Financial Highlights Financial Results Note: Non-GAAP measure. Refer to appendix for “reconciliation of non-GAAP financial measures.”Annualized. Consistent earnings growth; Diluted EPS for the quarter increased 97% year-over-year to $0.73.Quarterly net income i
Slide 10: Nashville MSA Deposit Market Share
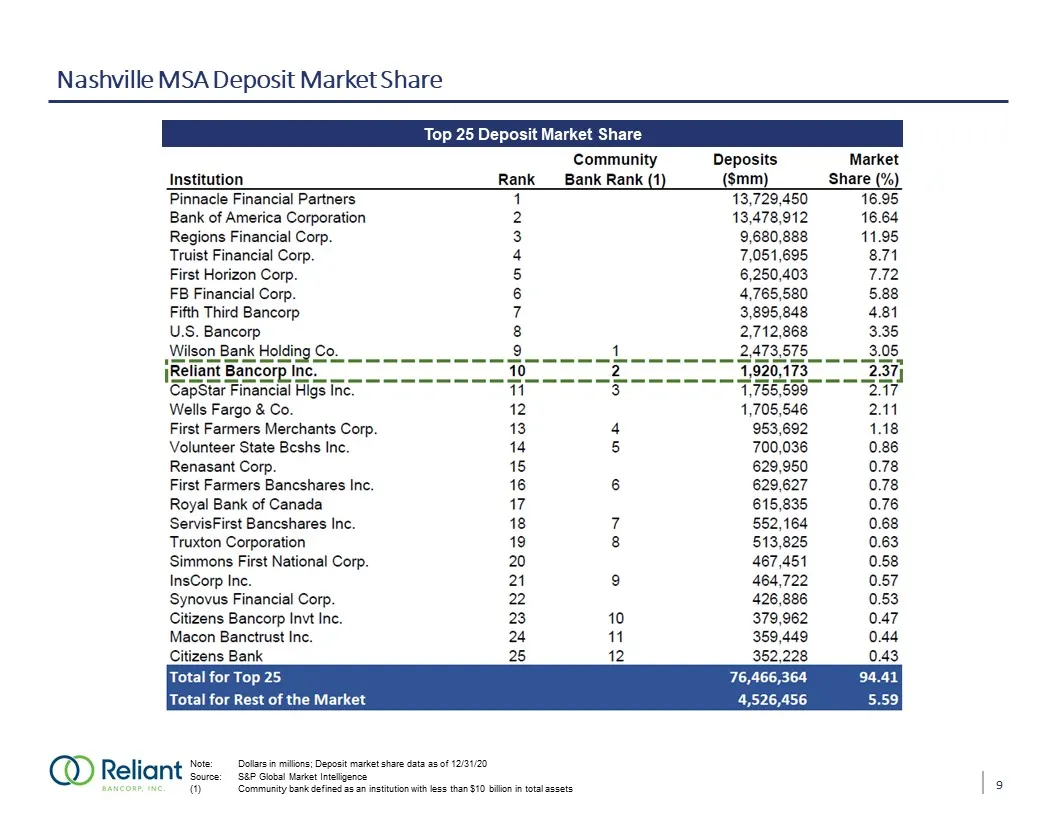
Nashville MSA Deposit Market Share Top 25 Deposit Market Share Note: Dollars in millions; Deposit market share data as of 12/31/20Source: S&P Global Market IntelligenceCommunity bank defined as an institution with less than $10 billion in total assets 9
Slide 11: Clarksville MSA Deposit Market Share
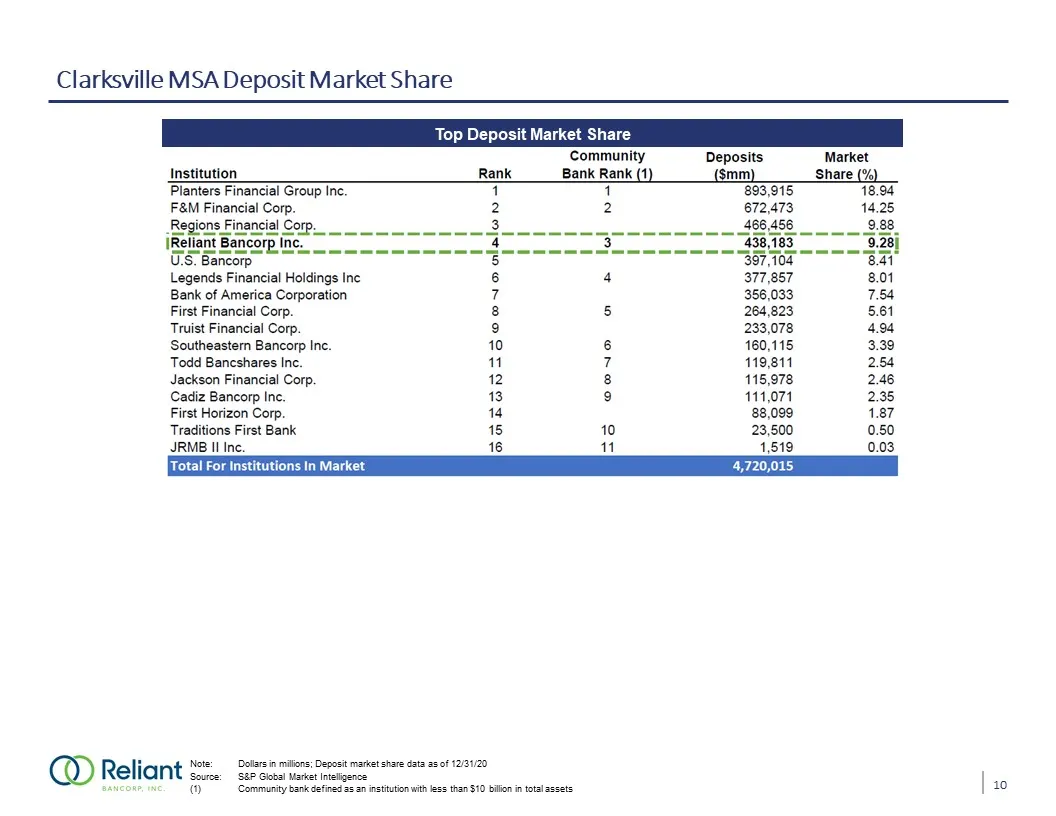
Clarksville MSA Deposit Market Share Top Deposit Market Share Note: Dollars in millions; Deposit market share data as of 12/31/20Source: S&P Global Market IntelligenceCommunity bank defined as an institution with less than $10 billion in total assets 10
Slide 12: RNBC Market Demographics
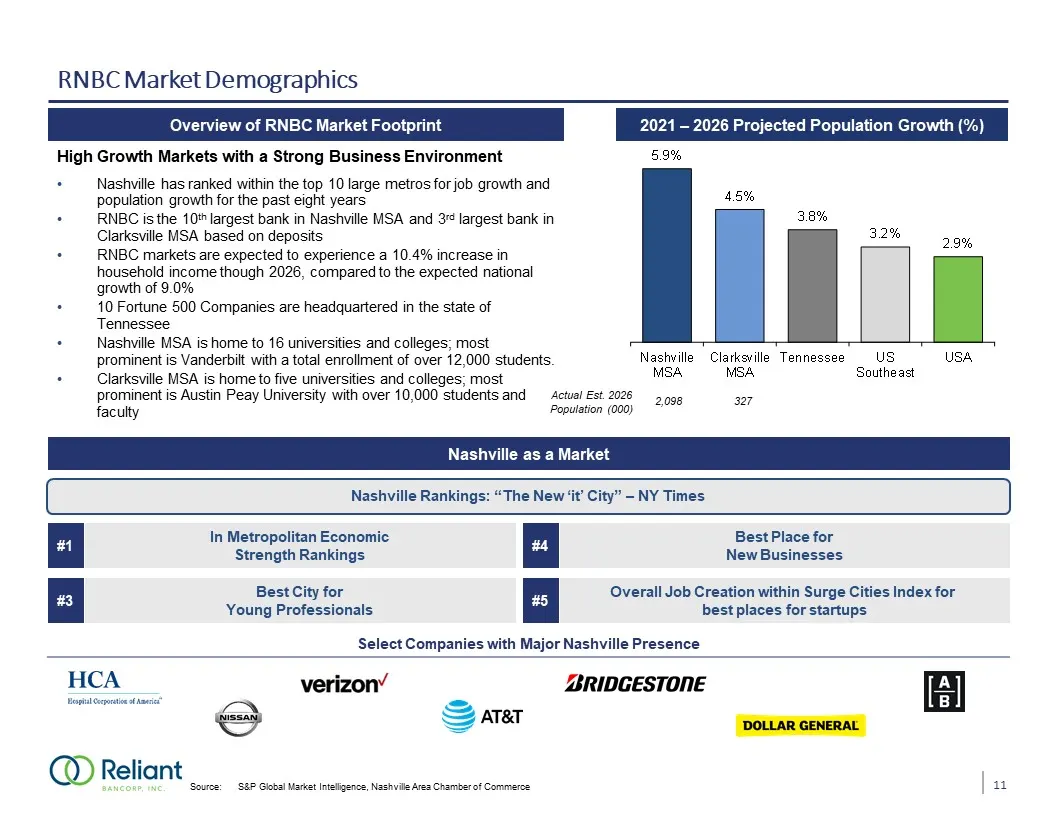
RNBC Market Demographics Overview of RNBC Market Footprint High Growth Markets with a Strong Business Environment Nashville has ranked within the top 10 large metros for job growth and population growth for the past eight yearsRNBC is the 10th largest bank in Nashville MSA and 3rd largest bank in Cl
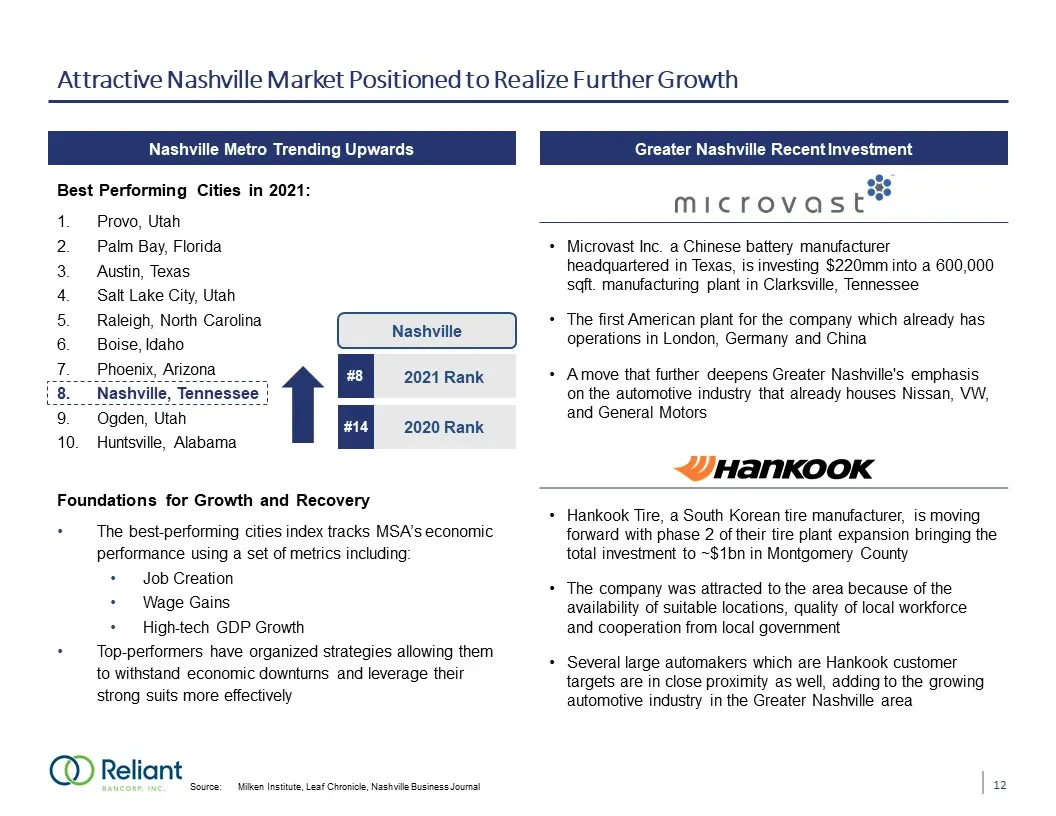
Slide 13: Attractive Nashville Market Positioned to Realize Further Growth
Best Performing Cities in 2021:Provo, UtahPalm Bay, FloridaAustin, TexasSalt Lake City, UtahRaleigh, North CarolinaBoise, IdahoPhoenix, ArizonaNashville, TennesseeOgden, UtahHuntsville, AlabamaFoundations for Growth and RecoveryThe best-performing cities index tracks MSA’s economic performance using
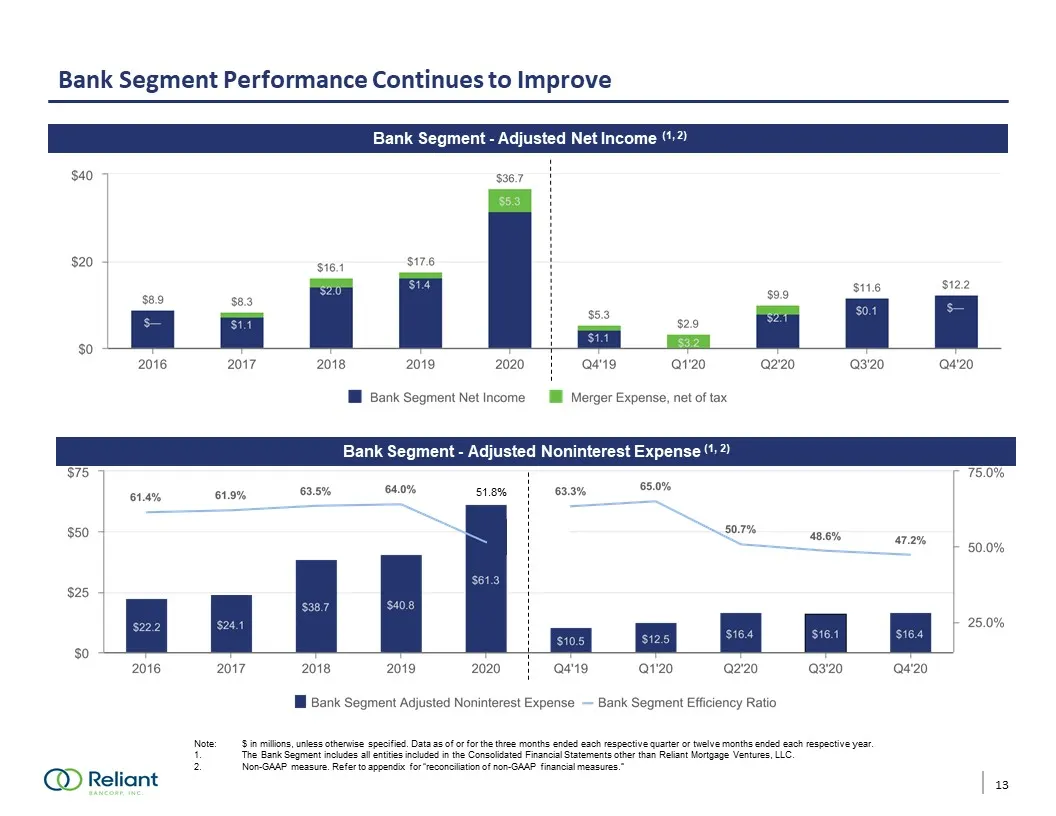
Slide 14: Bank Segment Performance Continues to Improve
Bank Segment Performance Continues to Improve Bank Segment - Adjusted Net Income (1, 2) Note: $ in millions, unless otherwise specified. Data as of or for the three months ended each respective quarter or twelve months ended each respective year. The Bank Segment includes all entities included in th
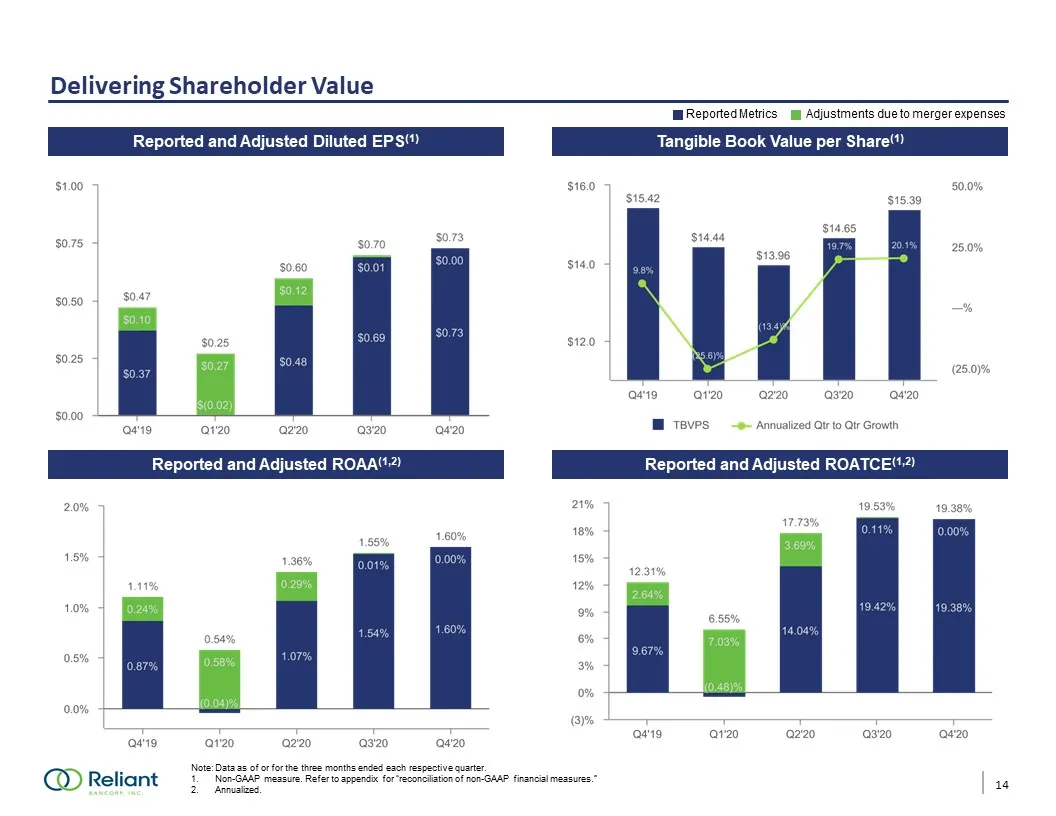
Slide 15: Delivering Shareholder Value
Delivering Shareholder Value Reported and Adjusted Diluted EPS(1) Tangible Book Value per Share(1) Reported and Adjusted ROAA(1,2) Reported and Adjusted ROATCE(1,2) Note: Data as of or for the three months ended each respective quarter. 1. Non-GAAP measure. Refer to appendix for “reconciliation of n
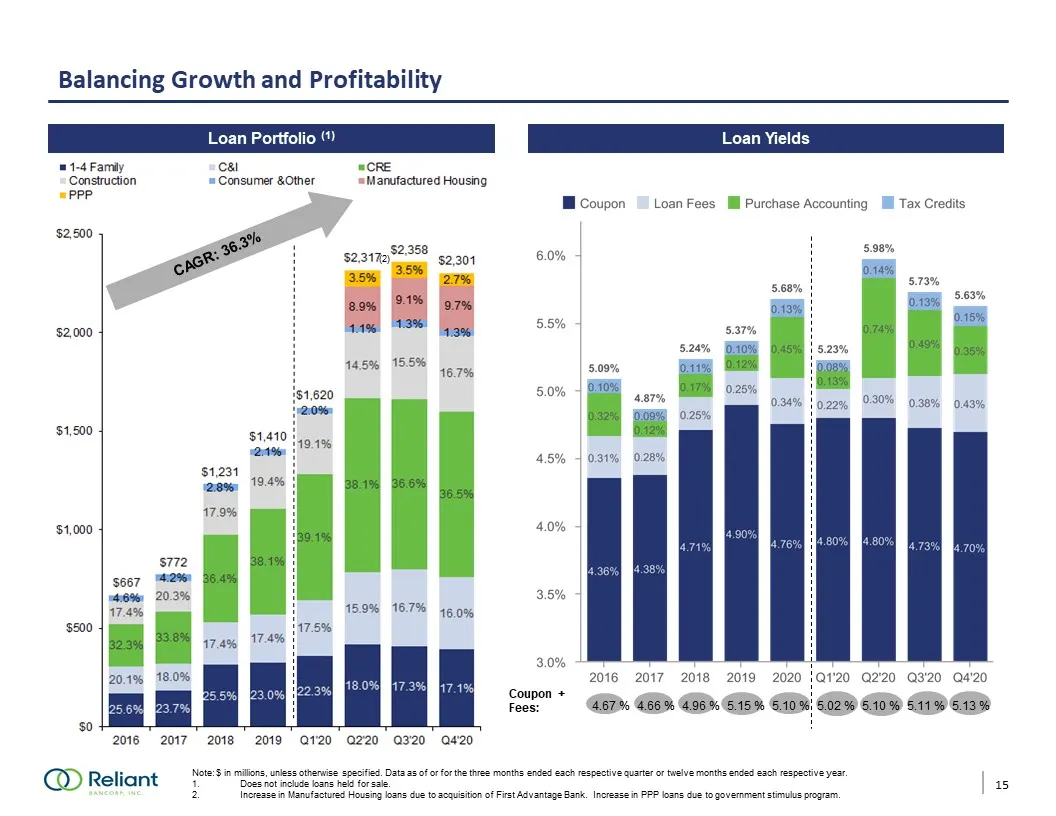
Slide 16: Balancing Growth and Profitability
Balancing Growth and Profitability Coupon + Fees: Loan Portfolio (1) Note: $ in millions, unless otherwise specified. Data as of or for the three months ended each respective quarter or twelve months ended each respective year. Does not include loans held for sale. Increase in Manufactured Housing l
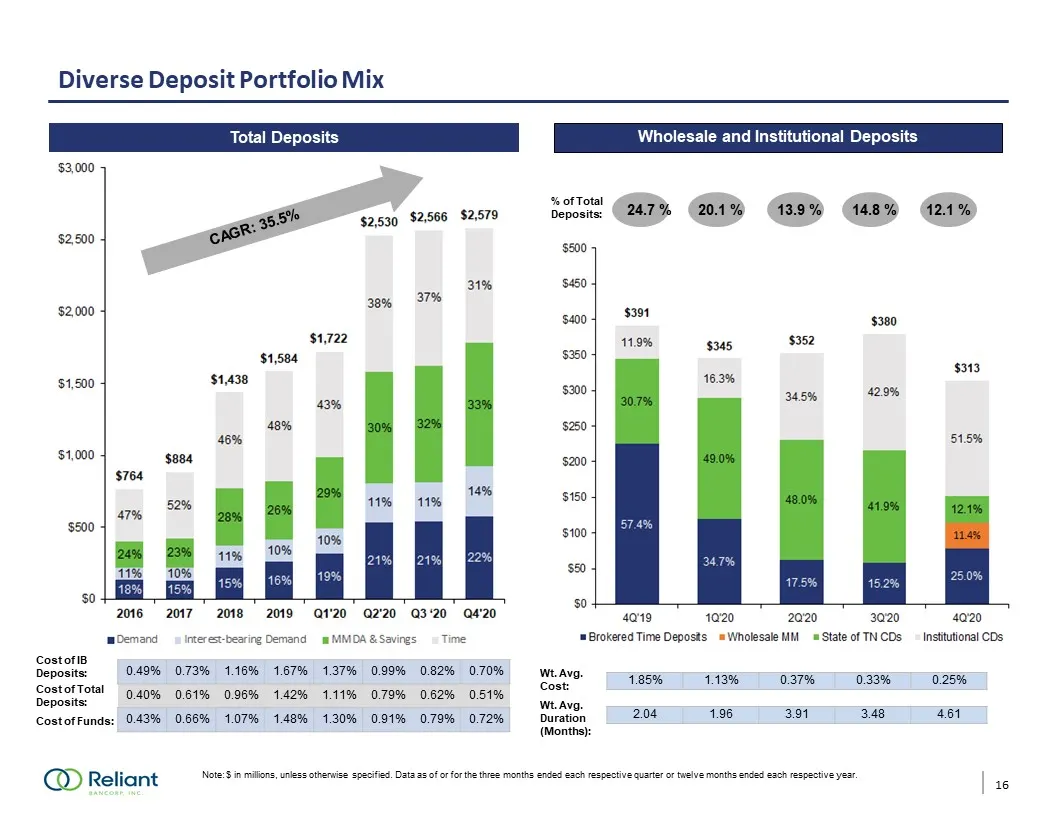
Slide 17: Diverse Deposit Portfolio Mix
Diverse Deposit Portfolio Mix Cost of IB Deposits: Cost of Funds: Note: $ in millions, unless otherwise specified. Data as of or for the three months ended each respective quarter or twelve months ended each respective year. Wholesale and Institutional Deposits 0.49% 0.73% 1.16% 1.67% 1.37% 0.99% 0.
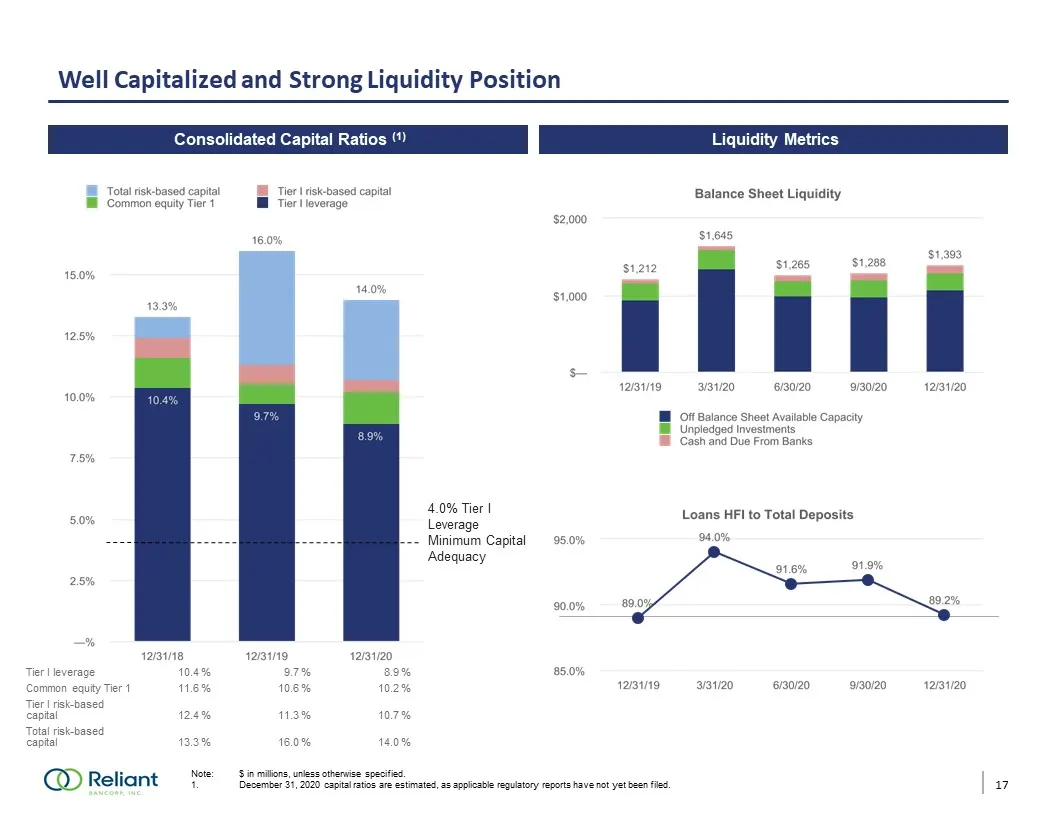
Slide 18: Well Capitalized and Strong Liquidity Position
Well Capitalized and Strong Liquidity Position Note: $ in millions, unless otherwise specified. December 31, 2020 capital ratios are estimated, as applicable regulatory reports have not yet been filed. Liquidity Sources Mar-20 Jun-20 Sep-20 Consolidated Capital Ratios (1) 4.0% Tier I Leverage Minimu
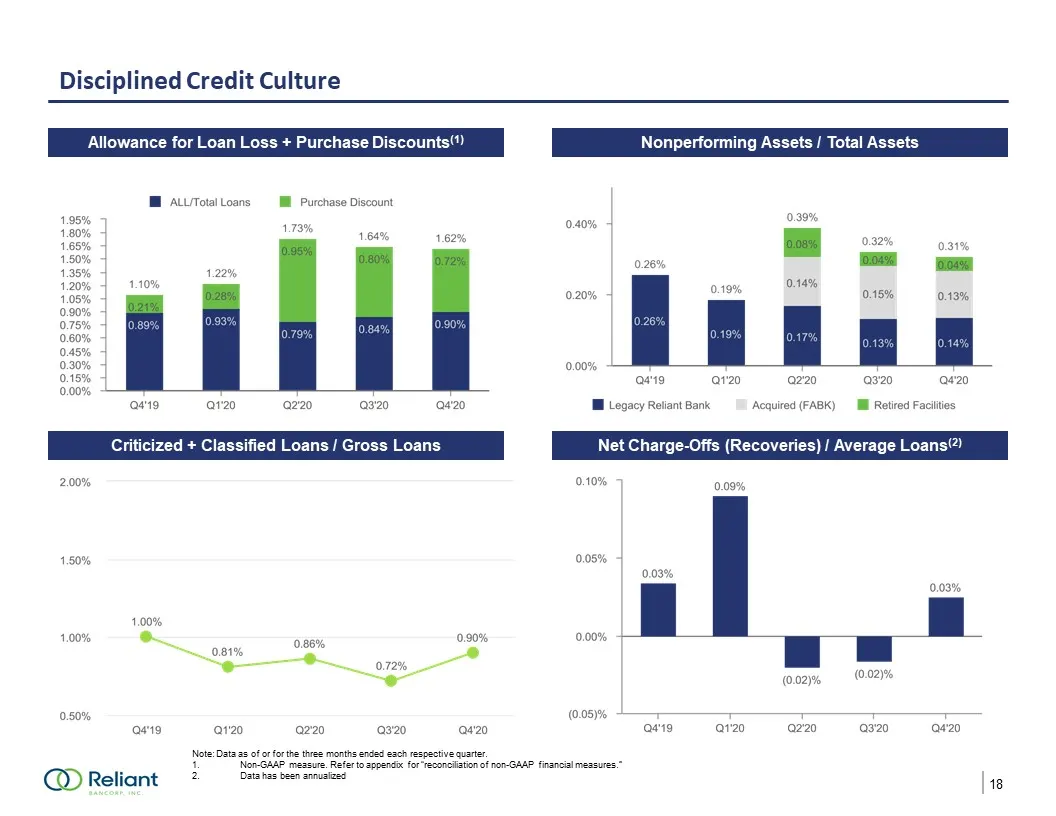
Slide 19: Disciplined Credit Culture
Disciplined Credit Culture Allowance for Loan Loss + Purchase Discounts(1) Net Charge-Offs (Recoveries) / Average Loans(2) Nonperforming Assets / Total Assets Note: Data as of or for the three months ended each respective quarter.Non-GAAP measure. Refer to appendix for “reconciliation of non-GAAP fi
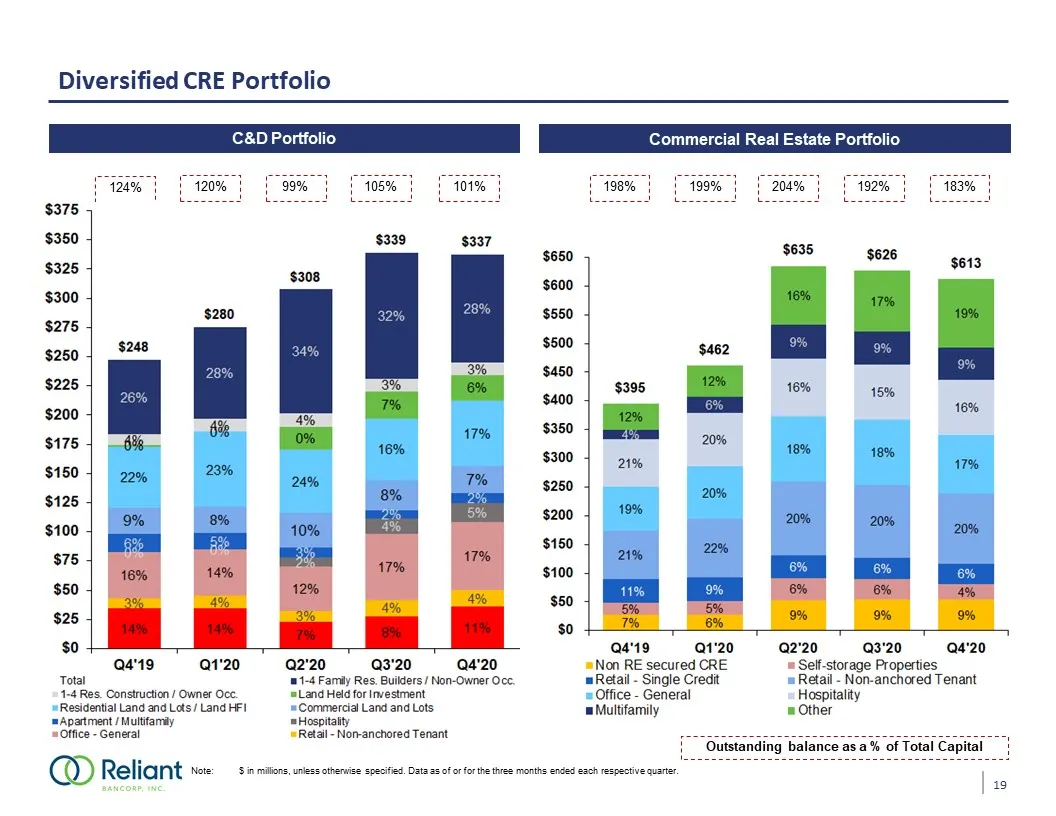
Slide 20: Diversified CRE Portfolio
Diversified CRE Portfolio C&D Portfolio Commercial Real Estate Portfolio Note: $ in millions, unless otherwise specified. Data as of or for the three months ended each respective quarter. 124% 120% 99% 105% 101% 198% 199% 204% 192% 183% Outstanding balance as a % of Total Capital 19
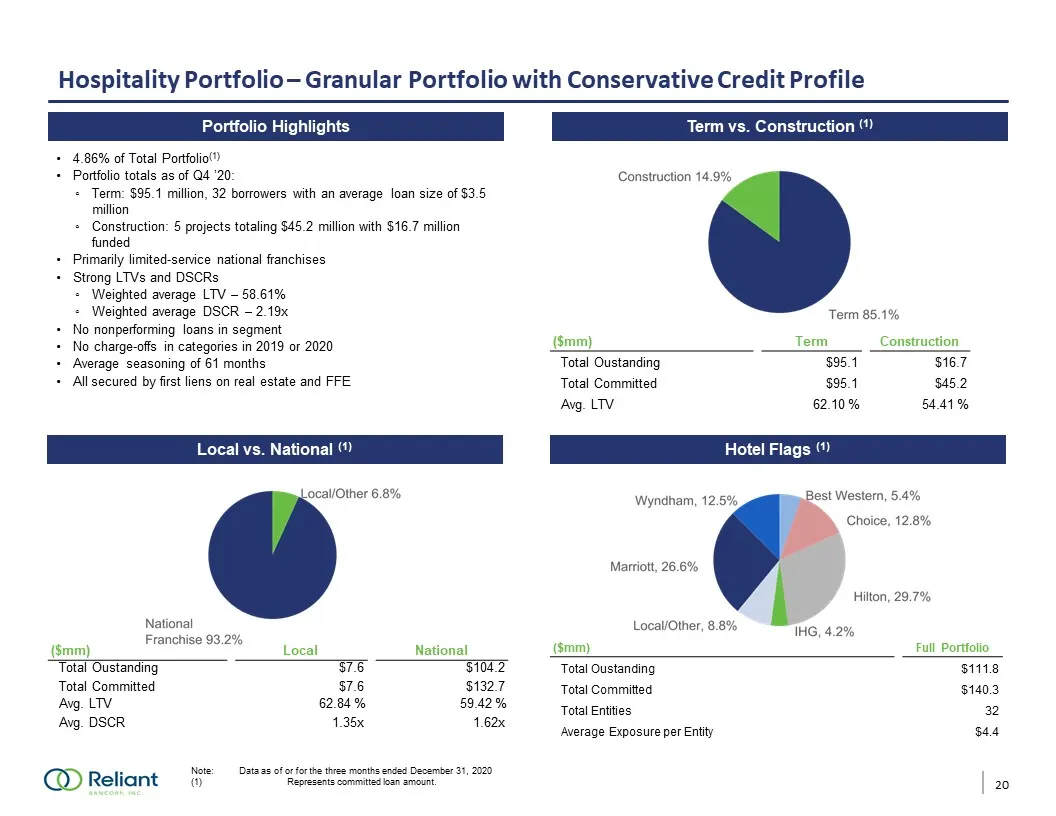
Slide 21: Hospitality Portfolio – Granular Portfolio with Conservative Credit Profile
Hospitality Portfolio – Granular Portfolio with Conservative Credit Profile Note: Data as of or for the three months ended December 31, 2020 (1) Represents committed loan amount. Local vs. National (1) Term vs. Construction (1) Portfolio Highlights Hotel Flags (1) 4.86% of Total Portfolio(1)Portfoli
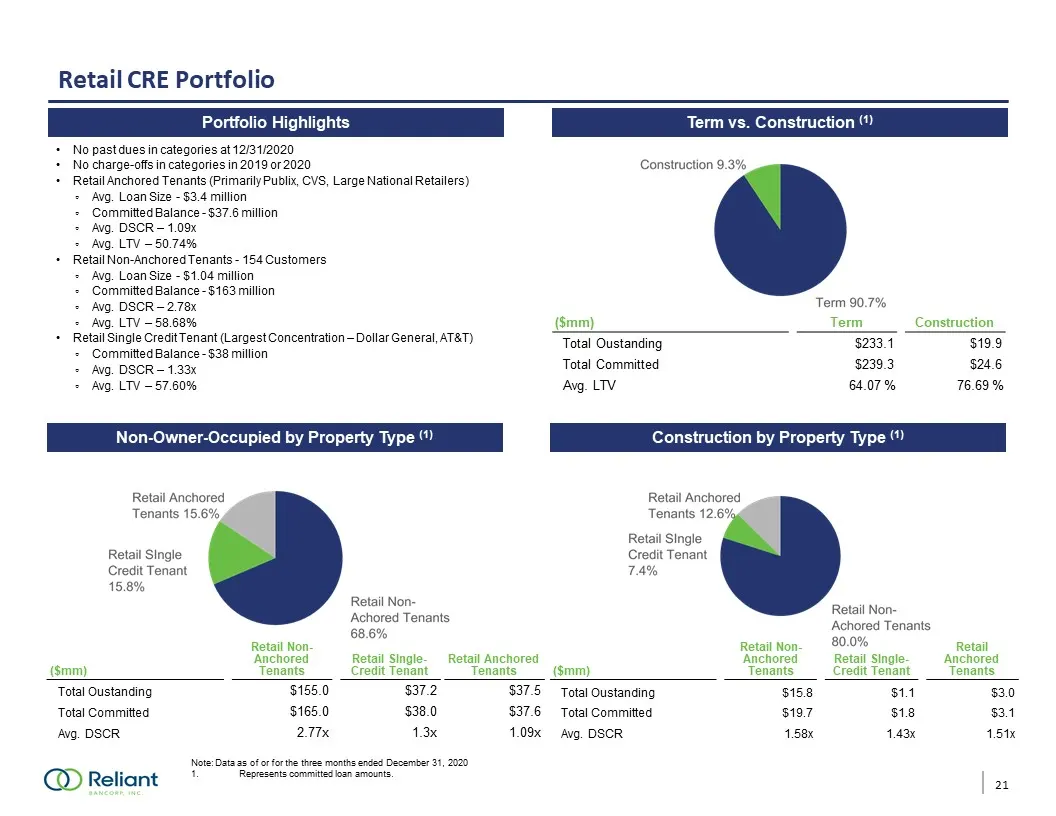
Slide 22: Retail CRE Portfolio
Retail CRE Portfolio Note: Data as of or for the three months ended December 31, 2020 Represents committed loan amounts. Total $93.7 million Total $124.4 million Portfolio Statistics Burger King Non-Owner-Occupied by Property Type (1) Term vs. Construction (1) Portfolio Highlights Construction by Pr
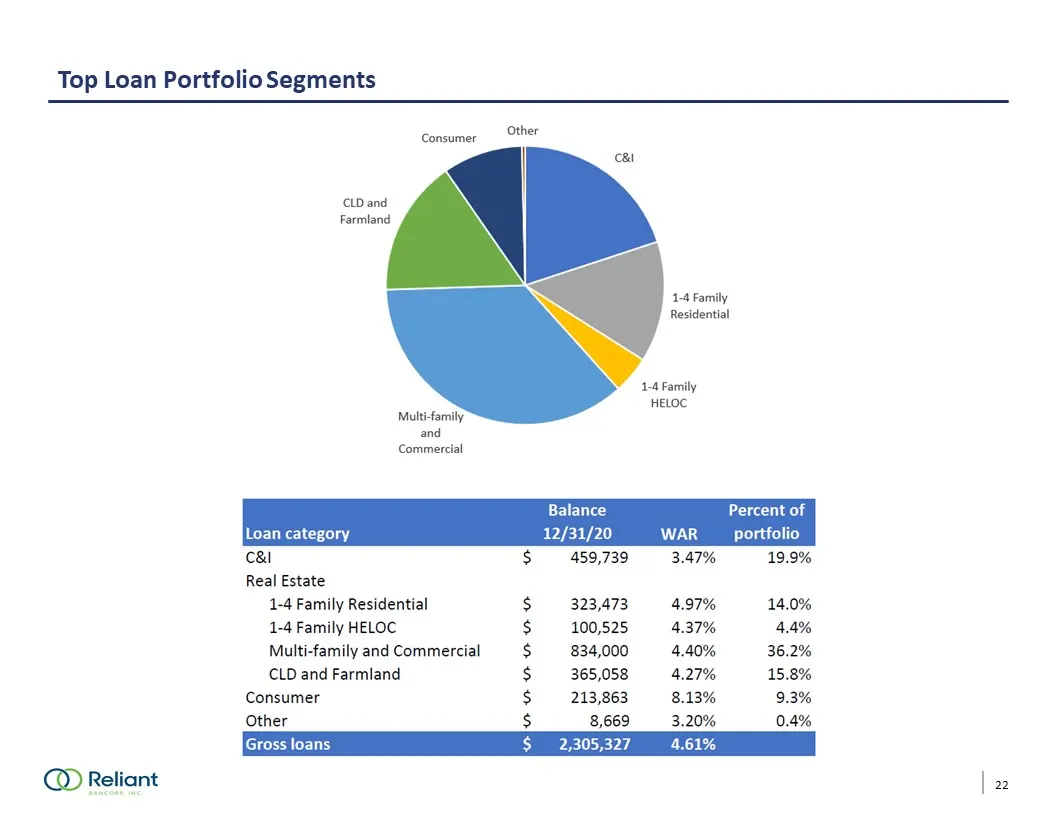
Slide 23: Top Loan Portfolio Segments
Top Loan Portfolio Segments 22
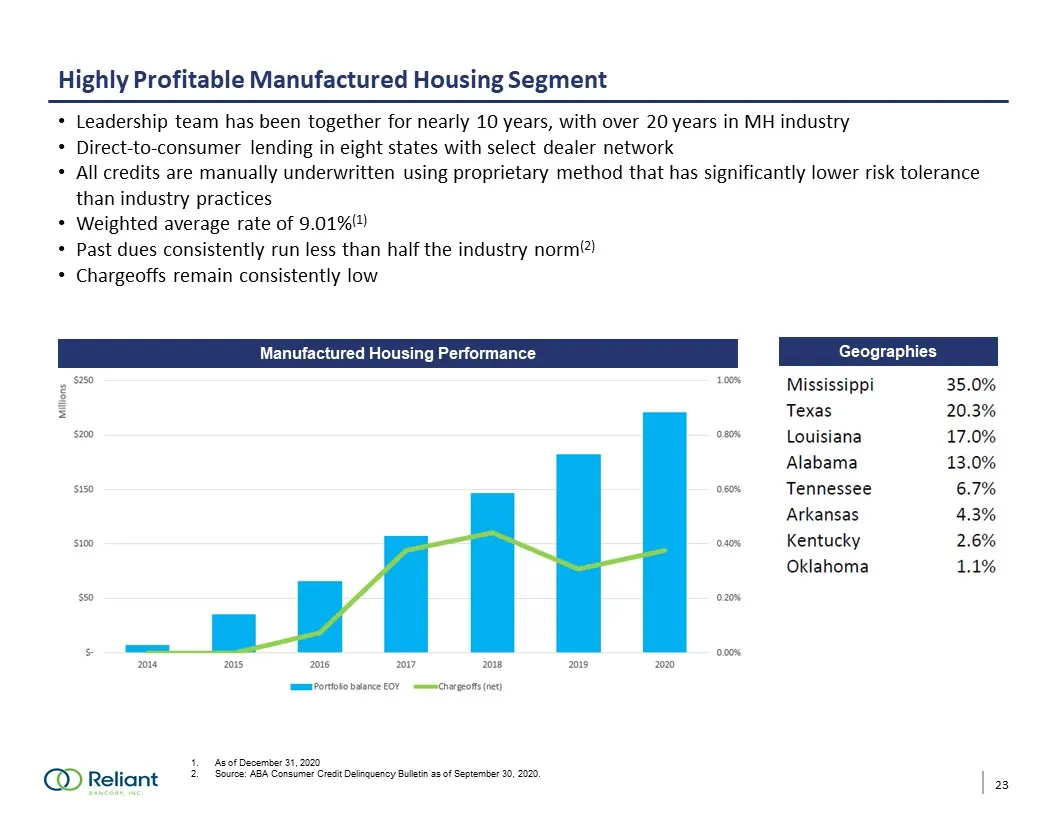
Slide 24: Highly Profitable Manufactured Housing Segment
Highly Profitable Manufactured Housing Segment 23 Leadership team has been together for nearly 10 years, with over 20 years in MH industryDirect-to-consumer lending in eight states with select dealer networkAll credits are manually underwritten using proprietary method that has significantly lower r
Slide 25: Providing Relief to Customers - Loan Modifications
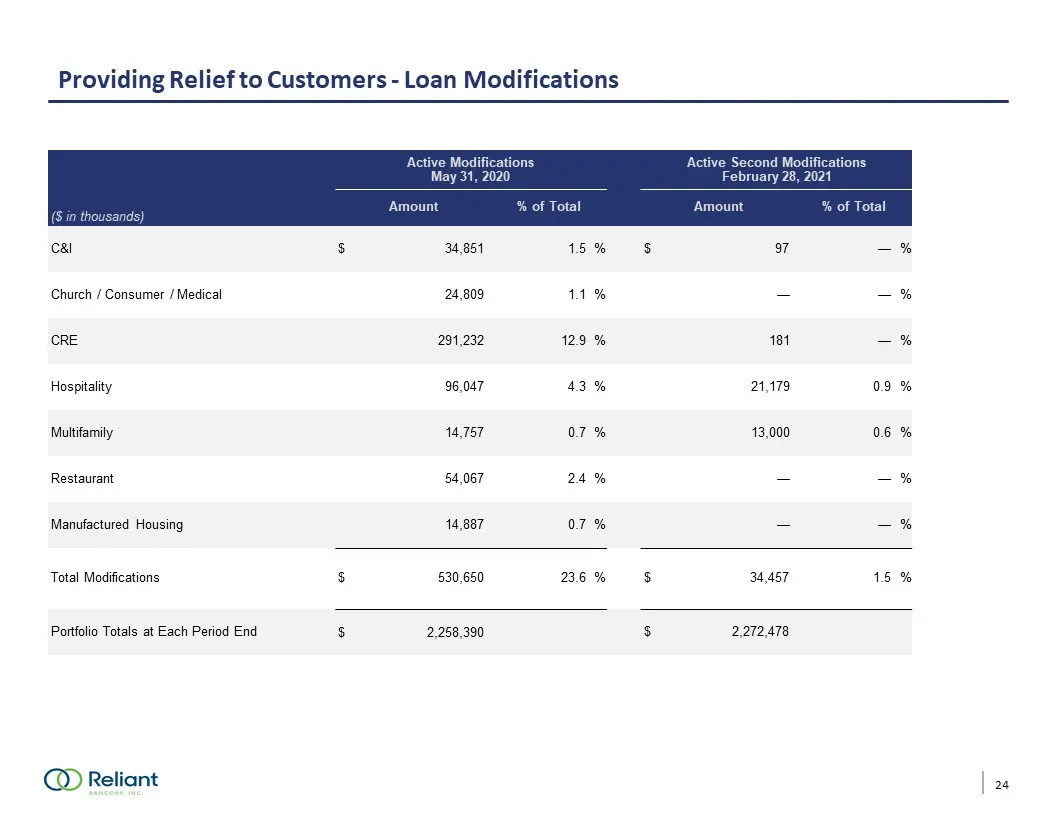
Providing Relief to Customers - Loan Modifications ($ in thousands) Active Modifications May 31, 2020 Active Second ModificationsFebruary 28, 2021 Amount % of Total Amount % of Total C&I $ 34,851 1.5 % $ 97 — % Church / Consumer / Medical 24,809 1.1 % — — % CRE 291,232 12.9 % 181 — % Hospitality 96,
Slide 26: Our Strategy for 2021
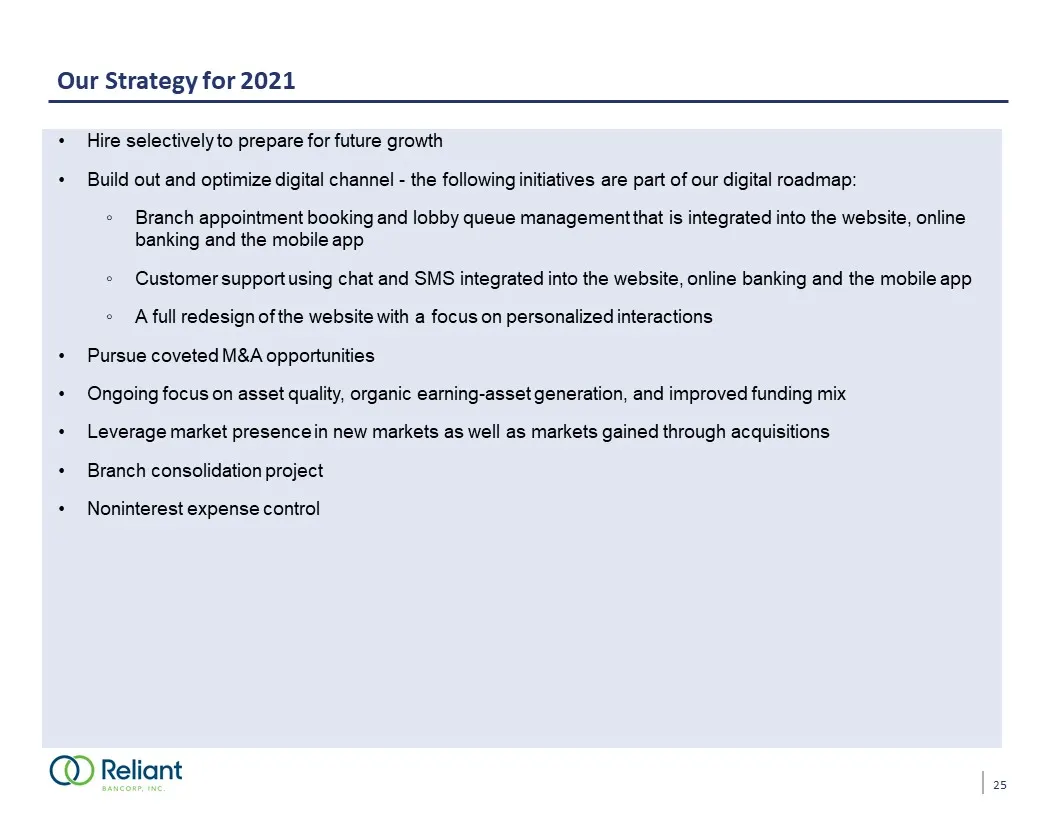
Our Strategy for 2021 Hire selectively to prepare for future growthBuild out and optimize digital channel - the following initiatives are part of our digital roadmap:Branch appointment booking and lobby queue management that is integrated into the website, online banking and the mobile appCustomer s
Slide 27: Appendix
GROW TOGETHER Appendix
Slide 28: Reconciliation of Non-GAAP Financial Measures
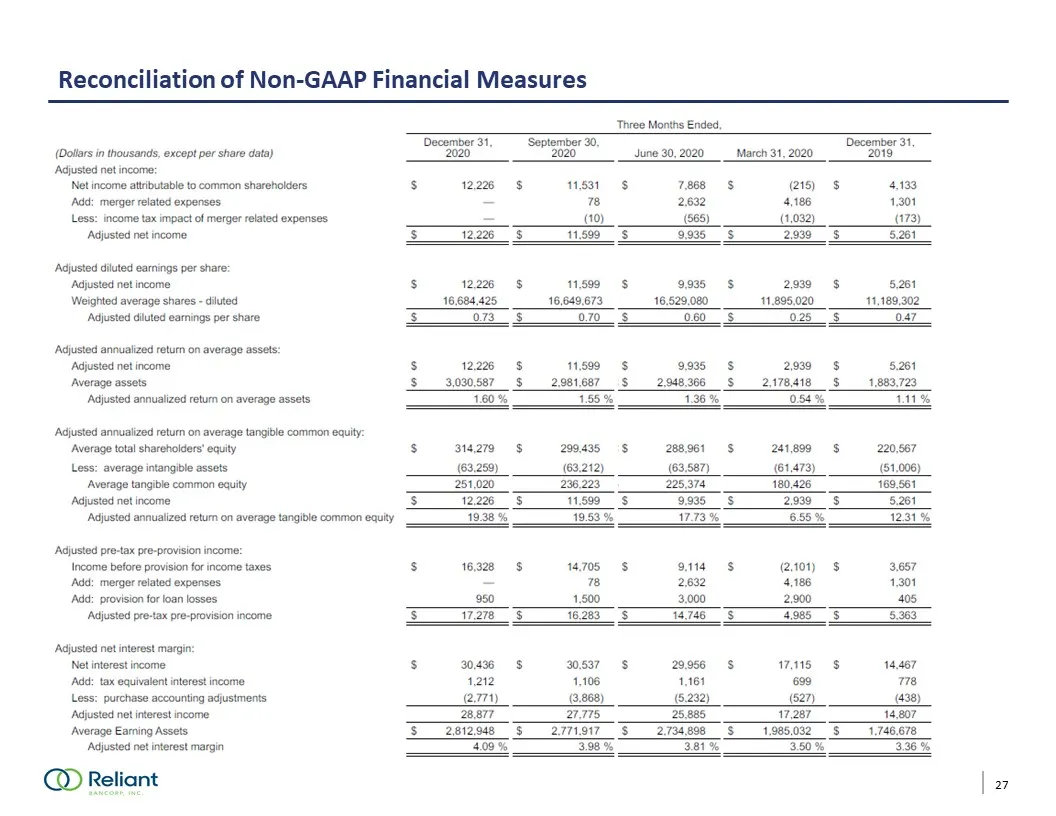
Reconciliation of Non-GAAP Financial Measures 27
Slide 29: Reconciliation of Non-GAAP Financial Measures
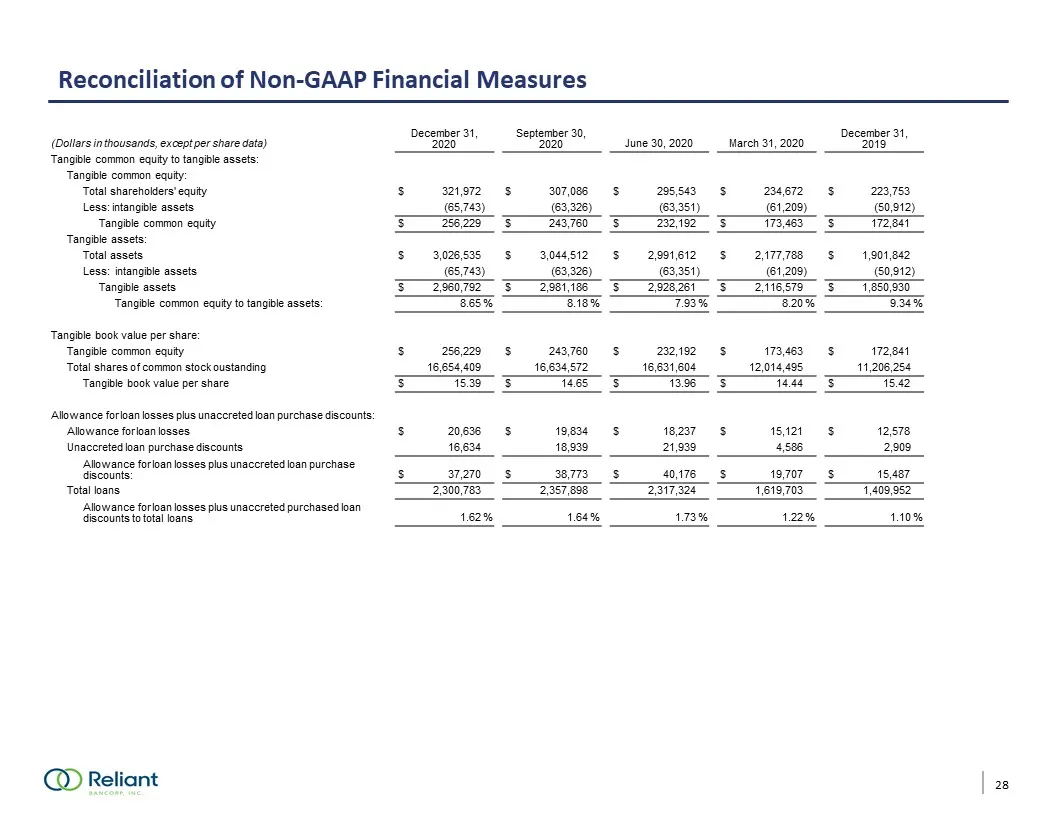
Reconciliation of Non-GAAP Financial Measures (Dollars in thousands, except per share data) December 31, 2020 September 30, 2020 June 30, 2020 March 31, 2020 December 31, 2019 Tangible common equity to tangible assets: Tangible common equity: Total shareholders' equity $ 321,972 $ 307,086 $ 295,543
Slide 30: Segment Income Statements & Reconciliation of Non-GAAP Financial Measures
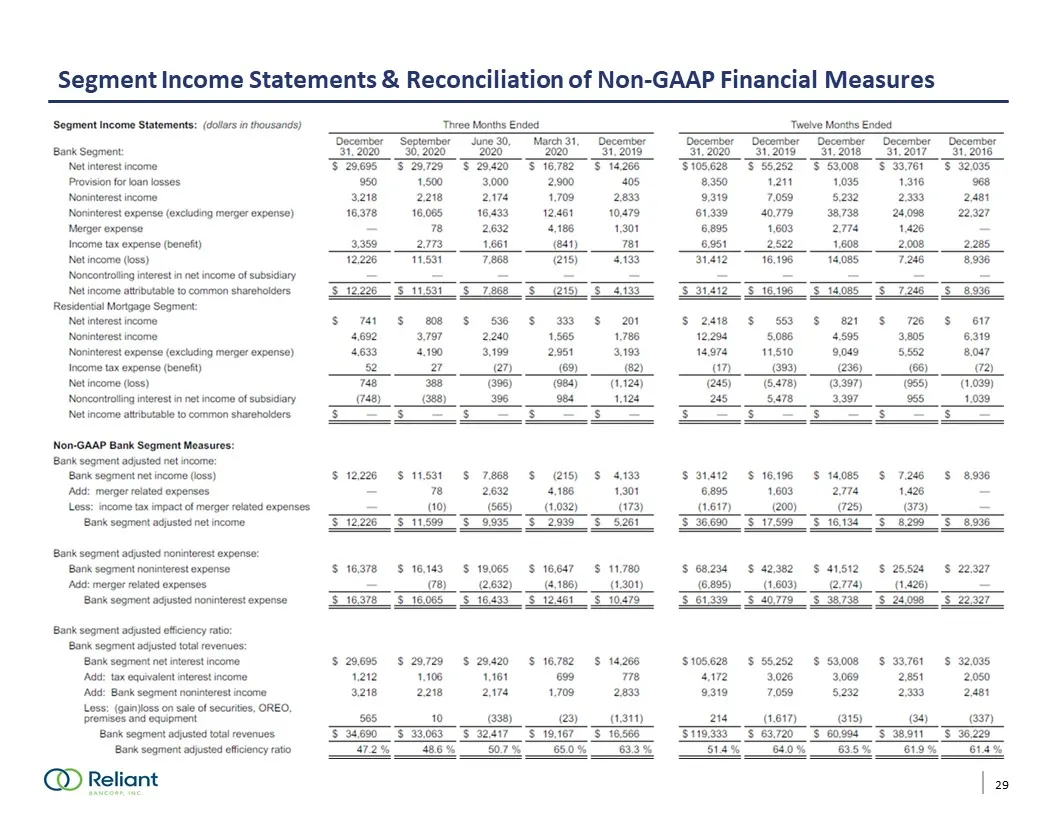
Segment Income Statements & Reconciliation of Non-GAAP Financial Measures 29
Source: SEC EDGAR · 8-K filed Mar 10, 2021
More decks from Reliant Bancorp Inc
 Q3 2021 Earnings Presentation29 slides · Oct 21, 2021
 Q2 2021 Earnings Presentation28 slides · Jul 21, 2021
 Merger or Acquisition (July 2021)13 slides · Jul 15, 2021
 Gulf South Bank Conference 202128 slides · Apr 30, 2021
 Q1 2021 Earnings Presentation18 slides · Apr 22, 2021
 Janney CEO Virtual Forum 202129 slides · Feb 2, 2021