Earthstone Energy — Investor Presentation (June 2022)
30 slides from Earthstone Energy's investor presentation, Jun 2, 2022
Slide 1: The Transformed Earthstone
The Transformed Earthstone J u n e 2 , 2 0 2 2 1 Exhibit 99.2
Slide 2: Disclaimer: Forward-Looking Statements
Disclaimer Forward‐Looking Statements This presentation contains forward‐looking statements within the meaning of Section 27A of the Securities Act of 1933, as amended (the “Securities Act”), and Section 21E of the Securities Exchange Act of 1934, as amended (the “Exchange Act”). Statements that are
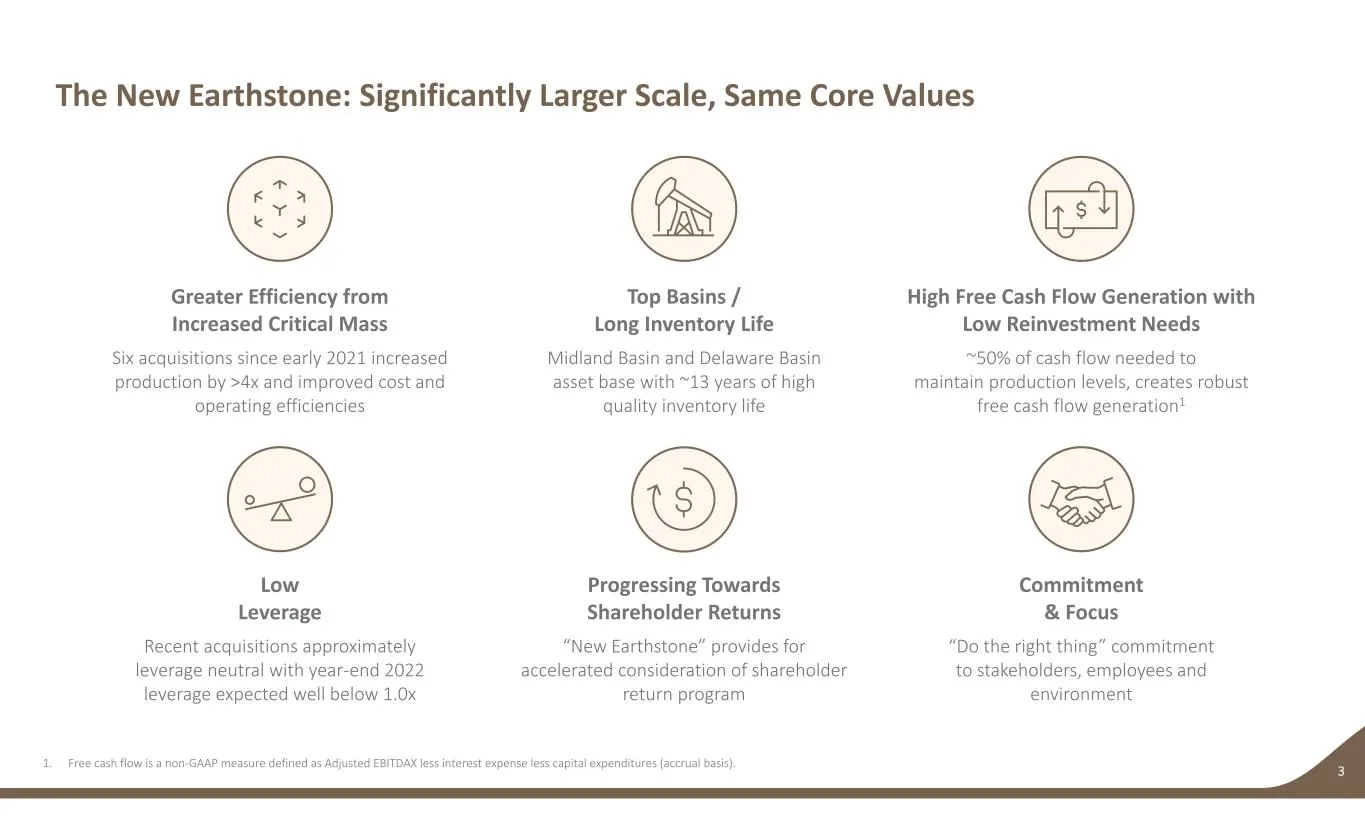
Slide 3: The New Earthstone: Significantly Larger Scale, Same Core Values
High Free Cash Flow Generation with Low Reinvestment Needs ~50% of cash flow needed to maintain production levels, creates robust free cash flow generation1 Top Basins / Long Inventory Life Midland Basin and Delaware Basin asset base with ~13 years of high quality inventory life The New Earthstone:
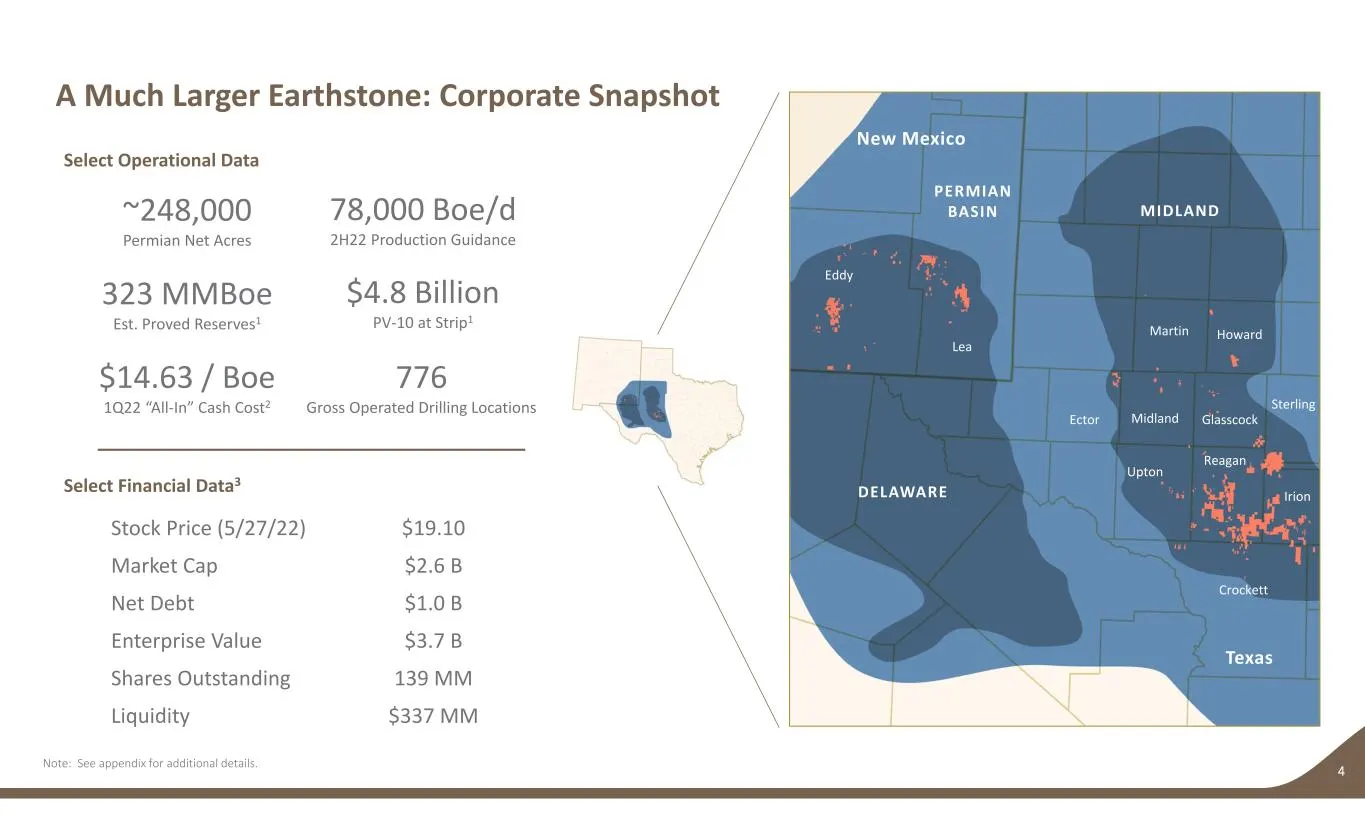
Slide 4: A Much Larger Earthstone: Corporate Snapshot
A Much Larger Earthstone: Corporate Snapshot 4 Select Operational Data 323 MMBoe Est. Proved Reserves1 $4.8 Billion PV‐10 at Strip1 78,000 Boe/d 2H22 Production Guidance ~248,000 Permian Net Acres Select Financial Data3 Stock Price (5/27/22) $19.10 Market Cap $2.6 B Net Debt $1.0 B Enterprise Value
Slide 5: Conservative Valuation Methodology Leads to High Impact Acquisitions
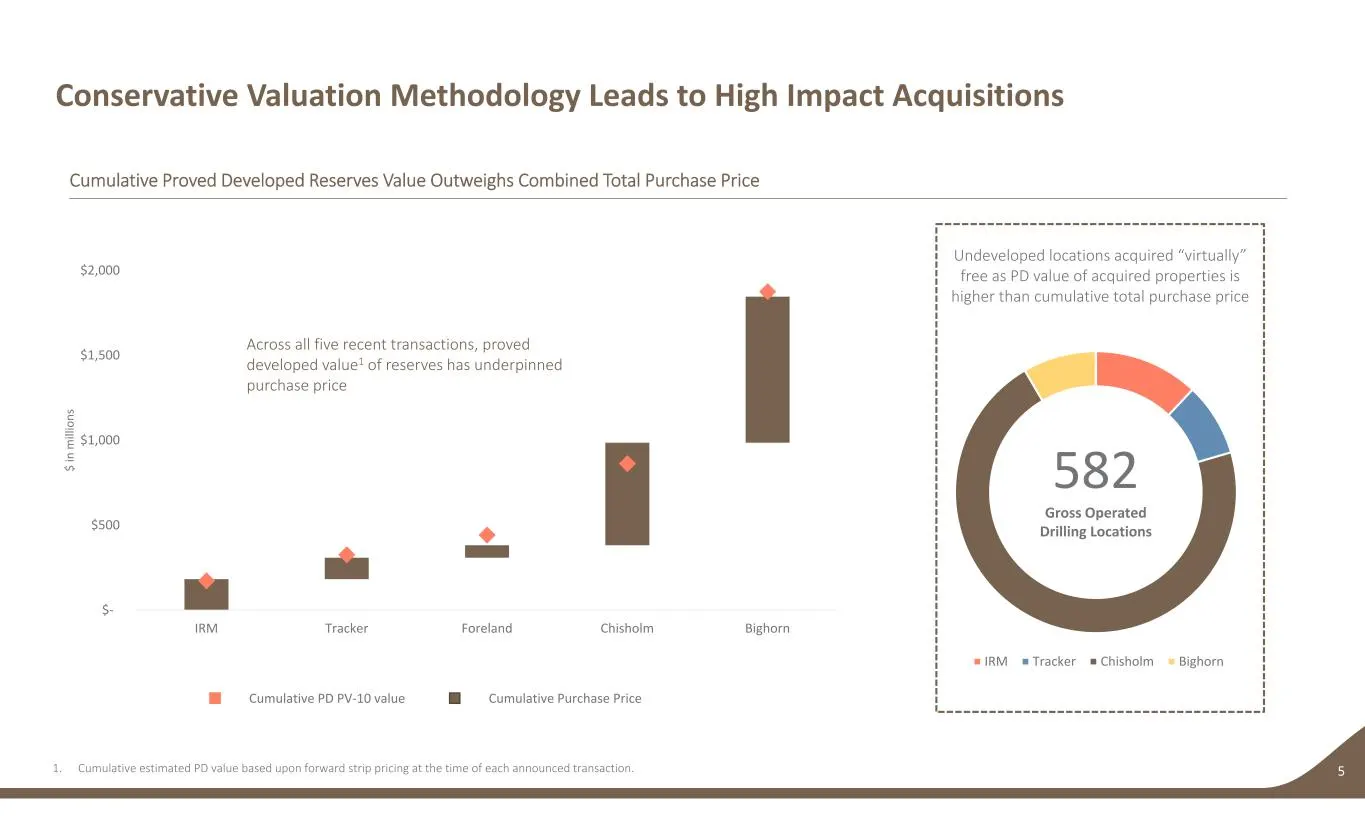
Conservative Valuation Methodology Leads to High Impact Acquisitions 5 Cumulative Proved Developed Reserves Value Outweighs Combined Total Purchase Price 1. Cumulative estimated PD value based upon forward strip pricing at the time of each announced transaction. $‐ $500 $1,000 $1,500 $2,000 IRM Trac
Slide 6: Strategic Acquisitions Driving Robust Cash Flow Outlook
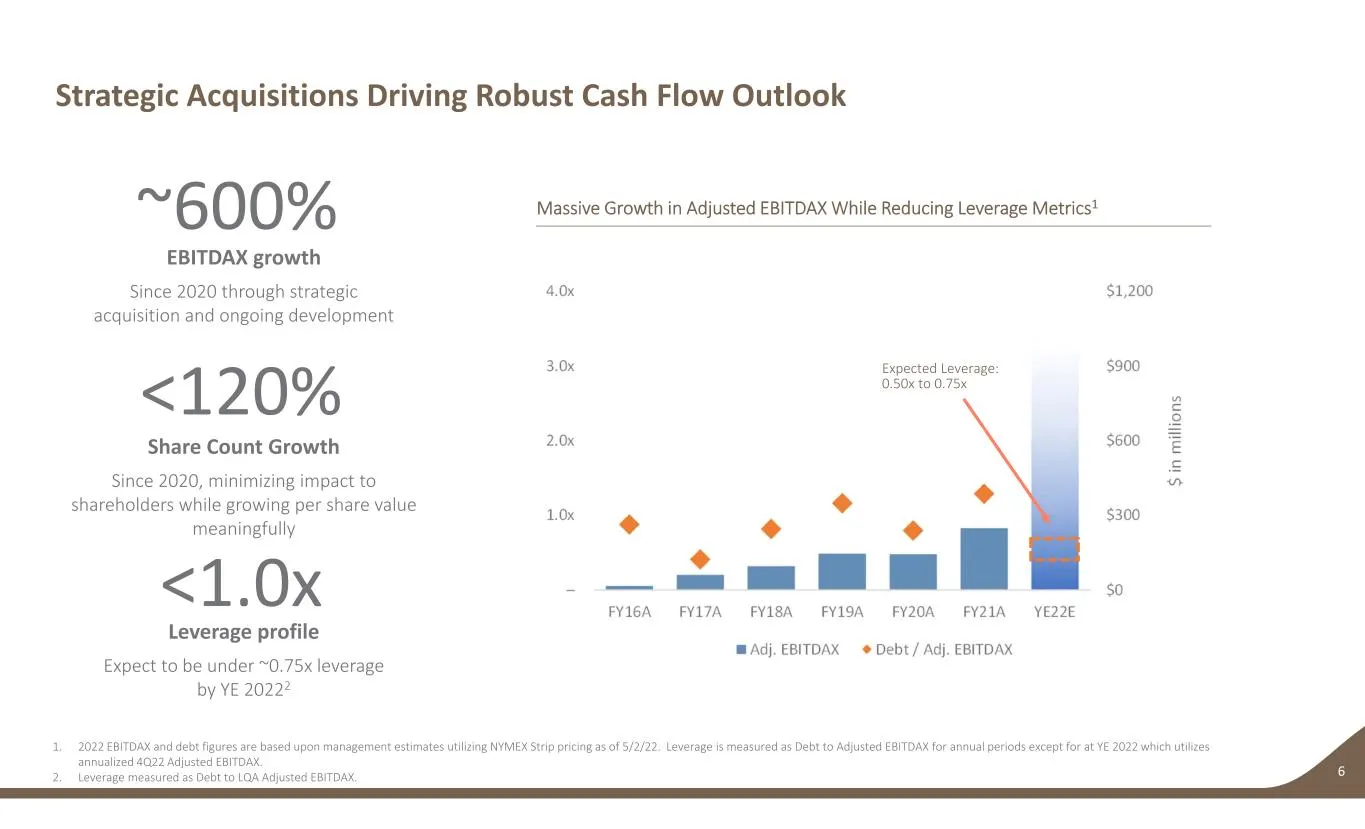
Leverage profile Expect to be under ~0.75x leverage by YE 20222 EBITDAX growth Since 2020 through strategic acquisition and ongoing development Strategic Acquisitions Driving Robust Cash Flow Outlook 6 ~600% <1.0x Massive Growth in Adjusted EBITDAX While Reducing Leverage Metrics1 Share Count Growth
Slide 7: Robust Value Growth in Proved Reserves
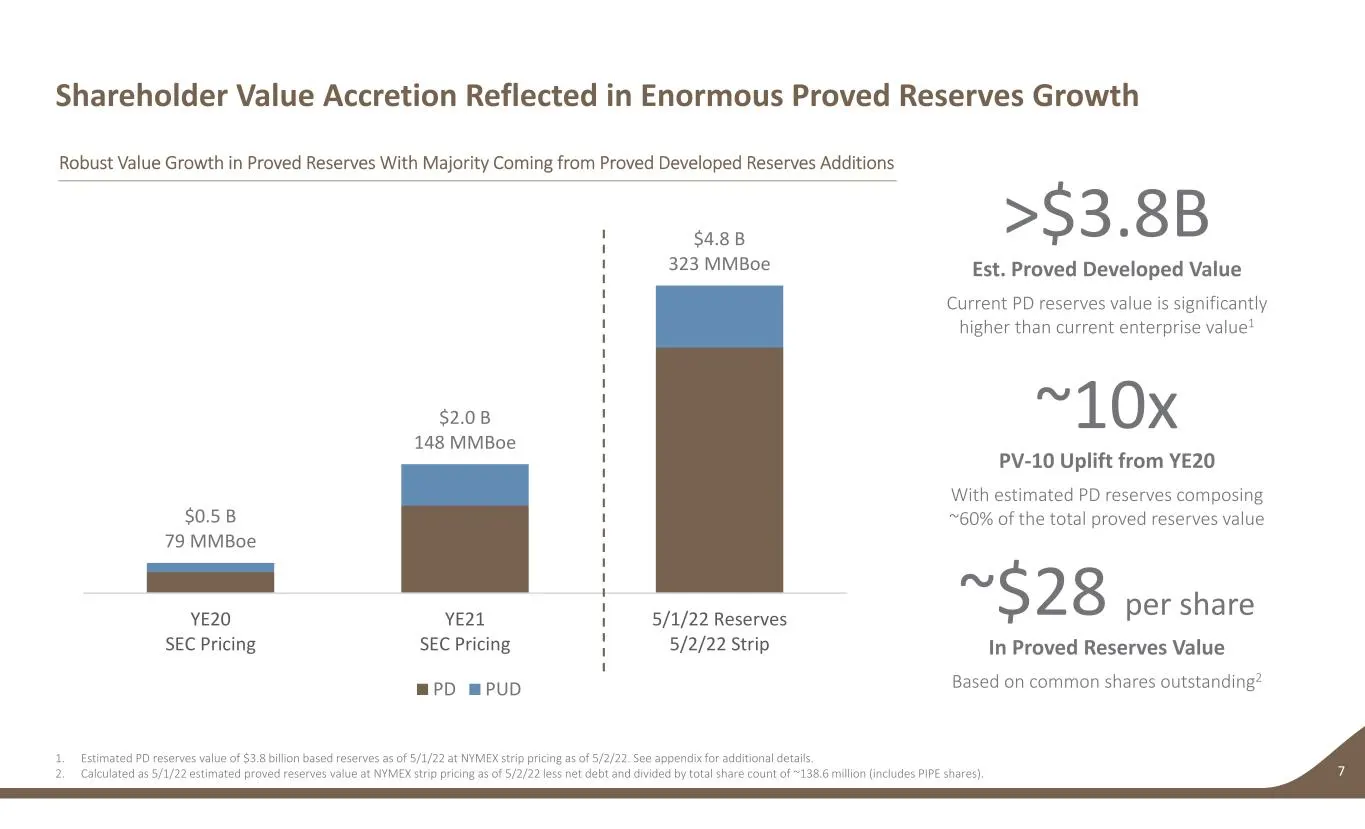
$0.5 B 79 MMBoe $2.0 B 148 MMBoe $4.8 B 323 MMBoe YE20 SEC Pricing YE21 SEC Pricing 5/1/22 Reserves 5/2/22 Strip PD PUD Shareholder Value Accretion Reflected in Enormous Proved Reserves Growth 7 PV‐10 Uplift from YE20 With estimated PD reserves composing ~60% of the total proved reserves value In Pr
Slide 8: Robust Inventory Within Premier Shale Basins
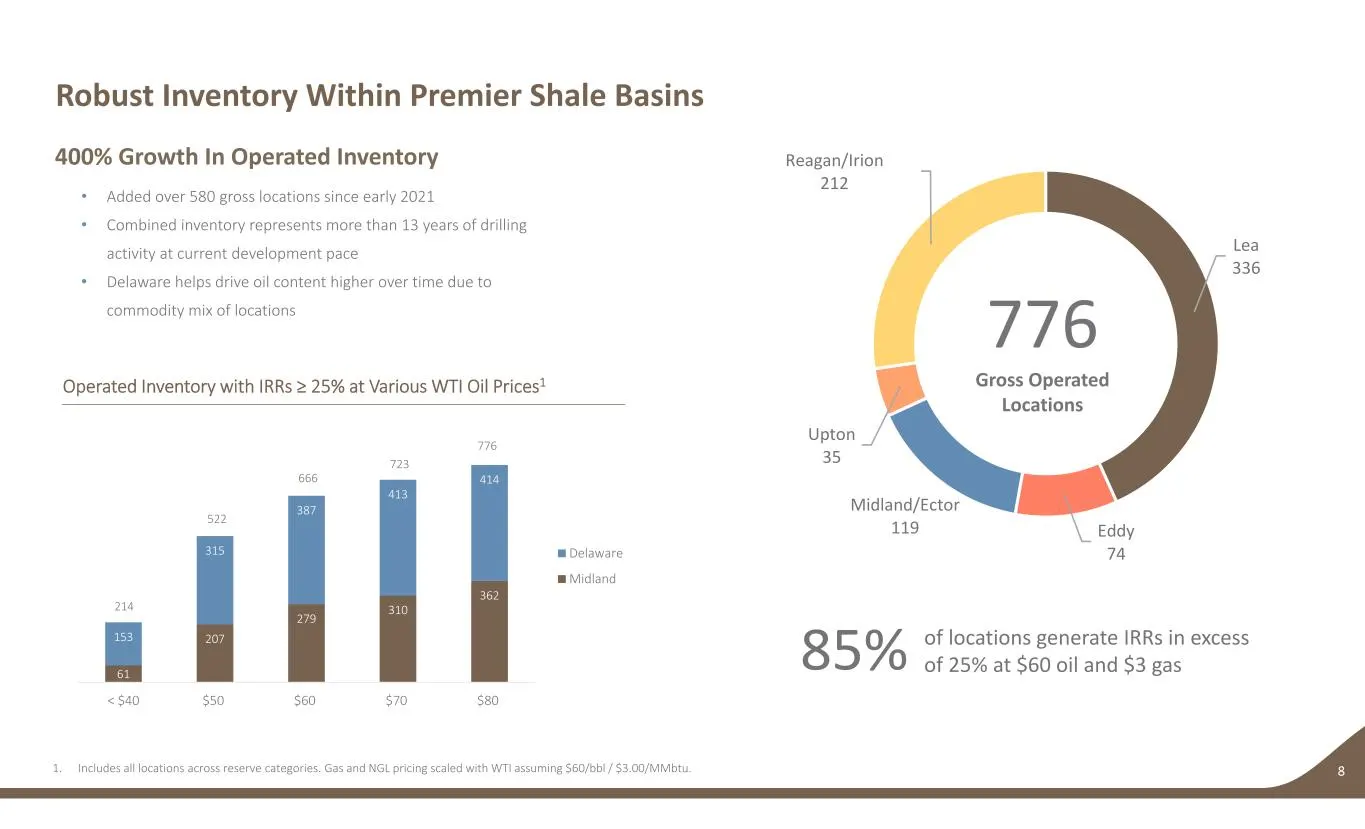
Lea 336 Eddy 74 Midland/Ector 119 Upton 35 Reagan/Irion 212 Robust Inventory Within Premier Shale Basins 8 400% Growth In Operated Inventory • Added over 580 gross locations since early 2021 • Combined inventory represents more than 13 years of drilling activity at current development pace • Delawar
Slide 9: Focused On Remaining a Low-Cost Leader With Top Tier Cash Margins
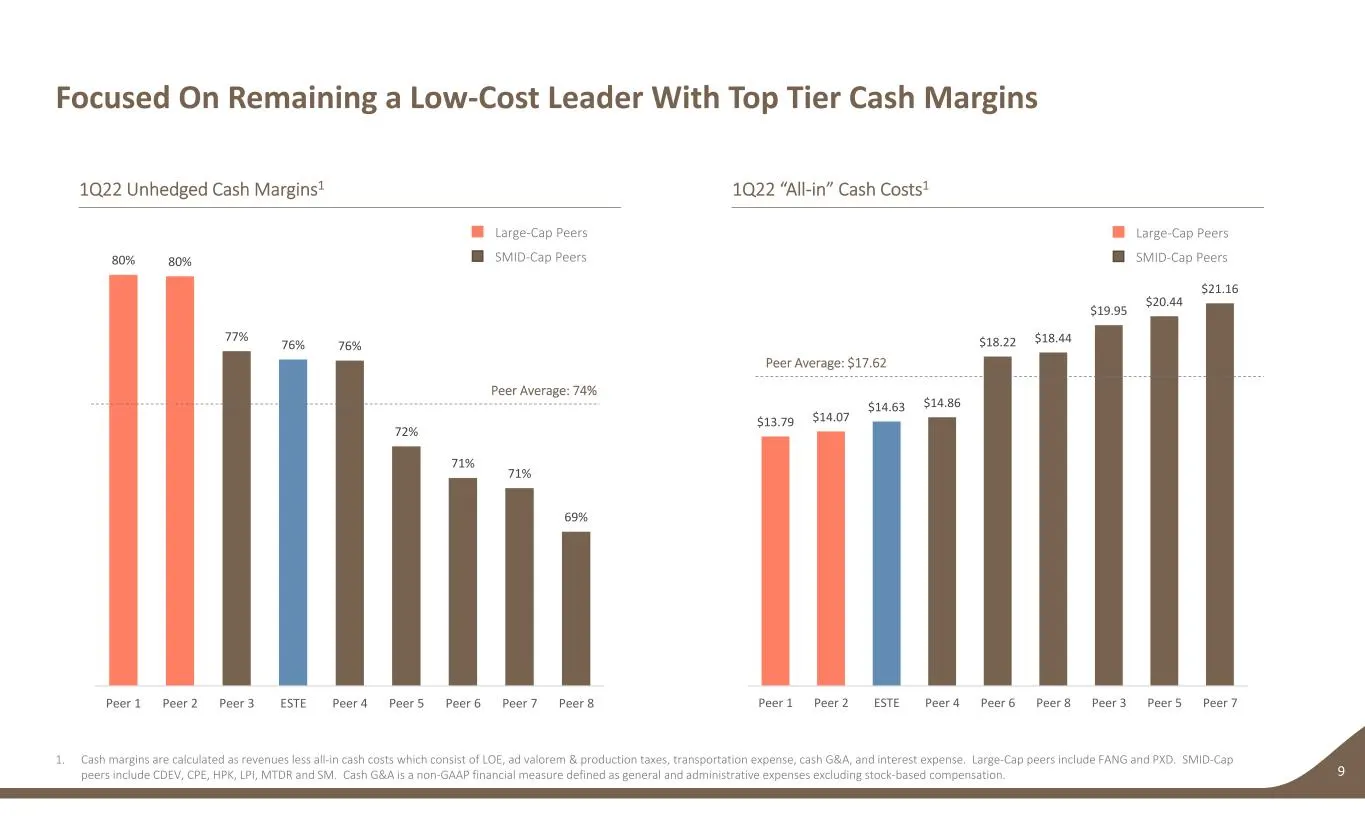
$13.79 $14.07 $14.63 $14.86 $18.22 $18.44 $19.95 $20.44 $21.16 Peer 1 Peer 2 ESTE Peer 4 Peer 6 Peer 8 Peer 3 Peer 5 Peer 7 80% 80% 77% 76% 76% 72% 71% 71% 69% Peer 1 Peer 2 Peer 3 ESTE Peer 4 Peer 5 Peer 6 Peer 7 Peer 8 Focused On Remaining a Low‐Cost Leader With Top Tier Cash Margins 9 1Q22 “All‐i
Slide 10: Strategic Advantages Gained Through Our Expanded Scale
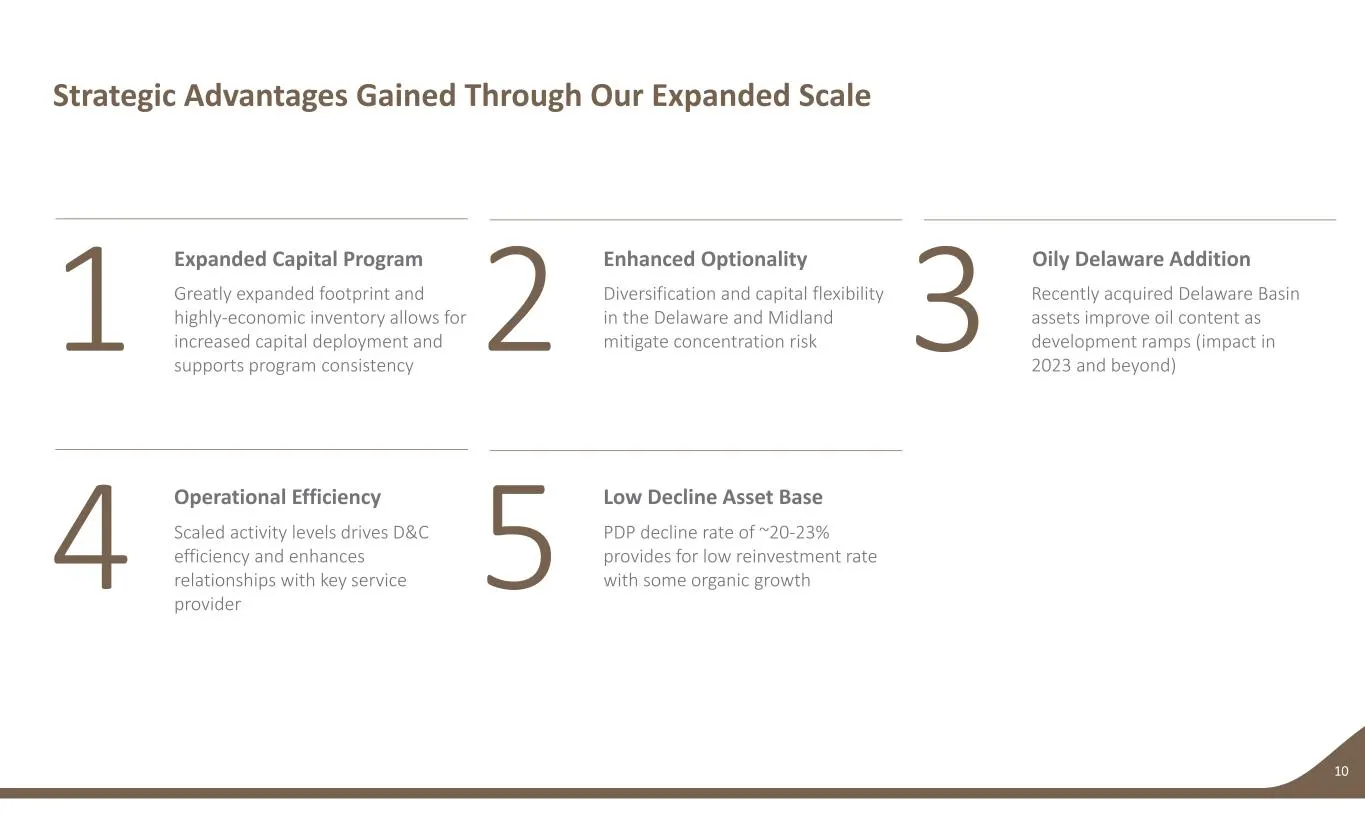
Expanded Capital Program Greatly expanded footprint and highly‐economic inventory allows for increased capital deployment and supports program consistency Enhanced Optionality Diversification and capital flexibility in the Delaware and Midland mitigate concentration risk Oily Delaware Addition Recen
Slide 11: Expanded Scale Supports Continuous Asset Development
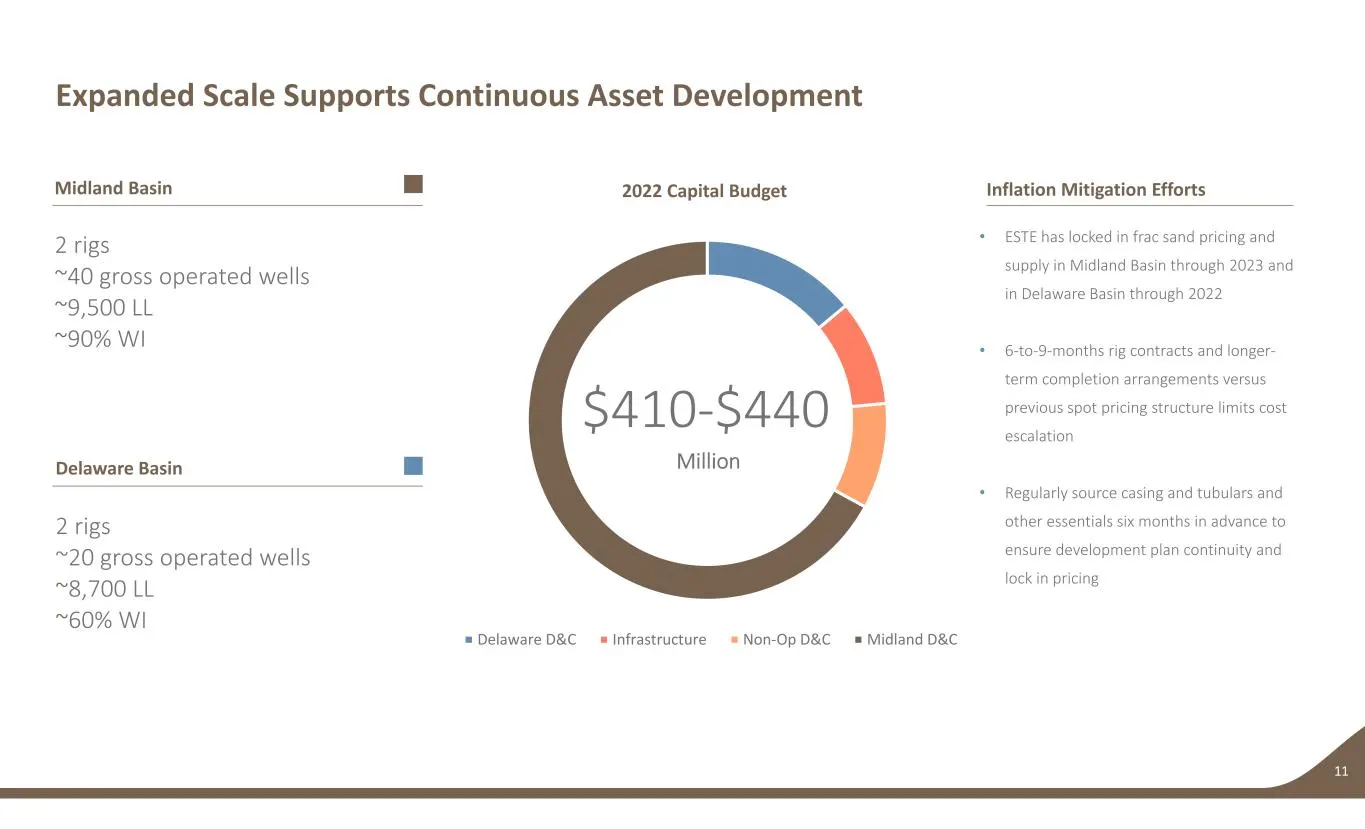
Delaware D&C Infrastructure Non‐Op D&C Midland D&C Expanded Scale Supports Continuous Asset Development 11 Midland Basin Delaware Basin 2 rigs ~40 gross operated wells ~9,500 LL ~90% WI 2 rigs ~20 gross operated wells ~8,700 LL ~60% WI $410‐$440 Million Inflation Mitigation Efforts • ESTE has locked
Slide 12: Strong Free Cash Flow Expected to Quickly Reduce Leverage to Well Below 1.0x
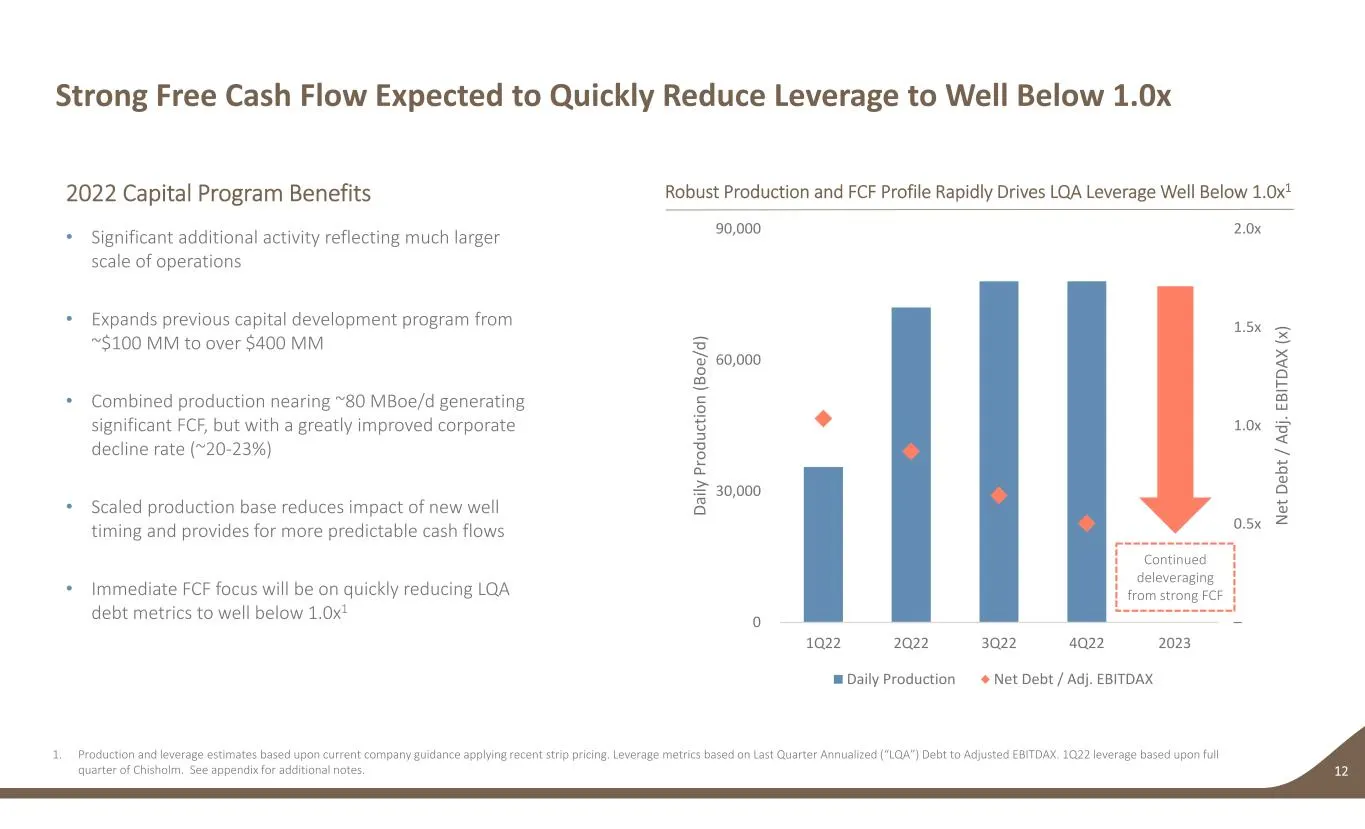
– 0.5x 1.0x 1.5x 2.0x 0 30,000 60,000 90,000 1Q22 2Q22 3Q22 4Q22 2023 N et D eb t / A dj . E BI TD AX (x ) Da ily P ro du ct io n (B oe /d ) Daily Production Net Debt / Adj. EBITDAX Strong Free Cash Flow Expected to Quickly Reduce Leverage to Well Below 1.0x 12 Robust Production and FCF Profile Rapi
Slide 13: Opportunities Broaden for Free Cash Allocation in the Future
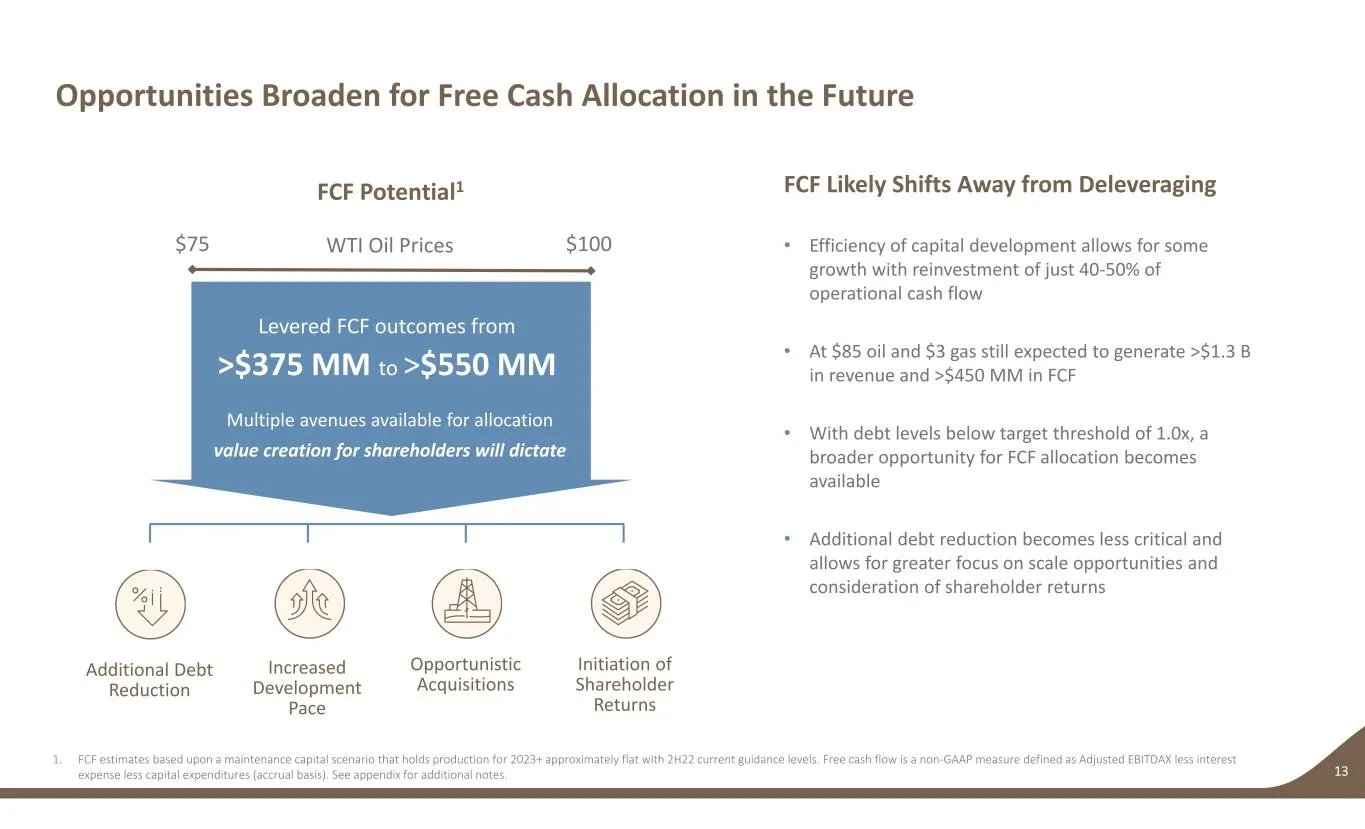
FCF Potential1 $75 $100WTI Oil Prices Multiple avenues available for allocation value creation for shareholders will dictate Levered FCF outcomes from >$375 MM to >$550 MM Opportunities Broaden for Free Cash Allocation in the Future 13 FCF Likely Shifts Away from Deleveraging • Efficiency of capital
Slide 14: Durable Multi-Year Free Cash Flow Profile Provides Extensive Options
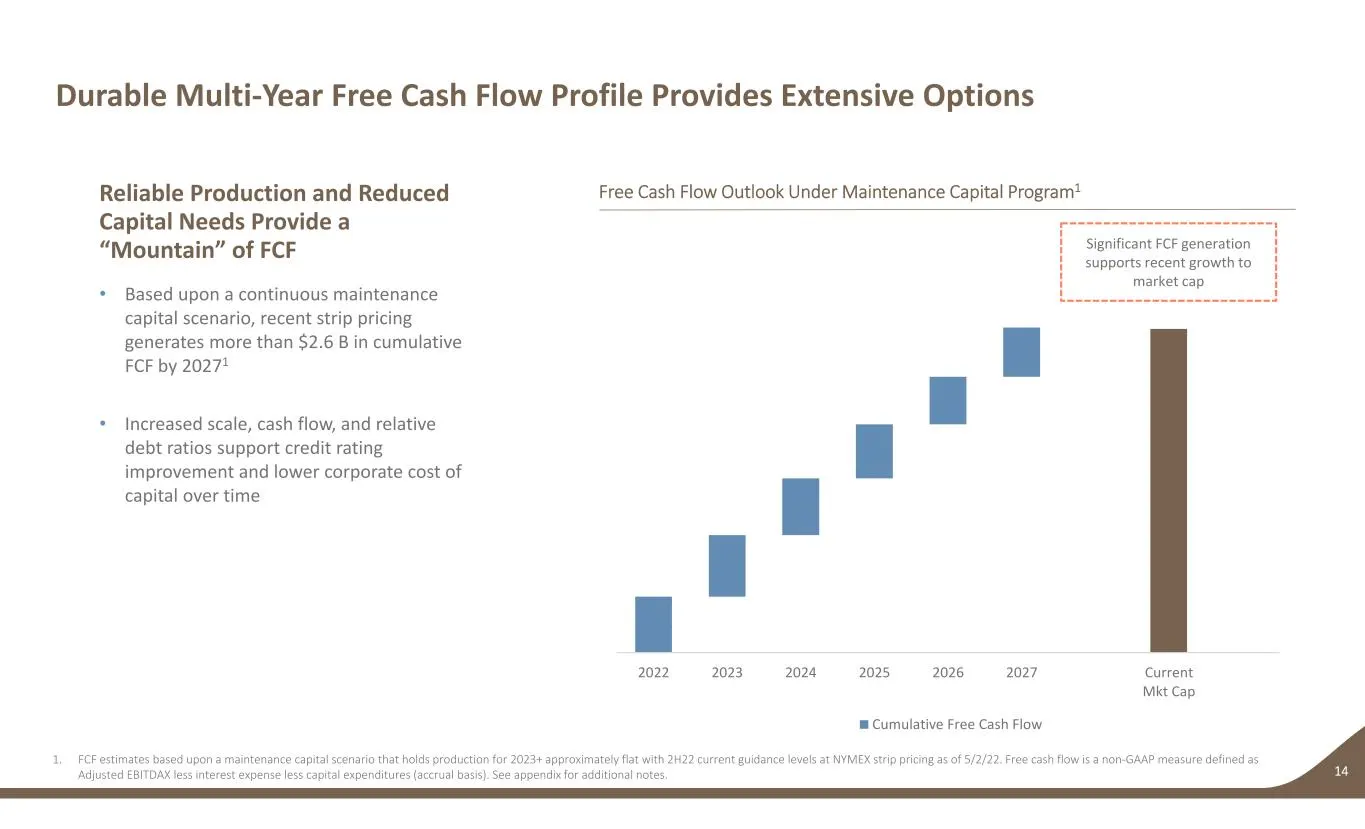
2022 2023 2024 2025 2026 2027 Current Mkt Cap Cumulative Free Cash Flow Durable Multi‐Year Free Cash Flow Profile Provides Extensive Options 14 Free Cash Flow Outlook Under Maintenance Capital Program1Reliable Production and Reduced Capital Needs Provide a “Mountain” of FCF • Based upon a continuous
Slide 15: Liquidity and Capital Structure Benefitting from Expanded Scale
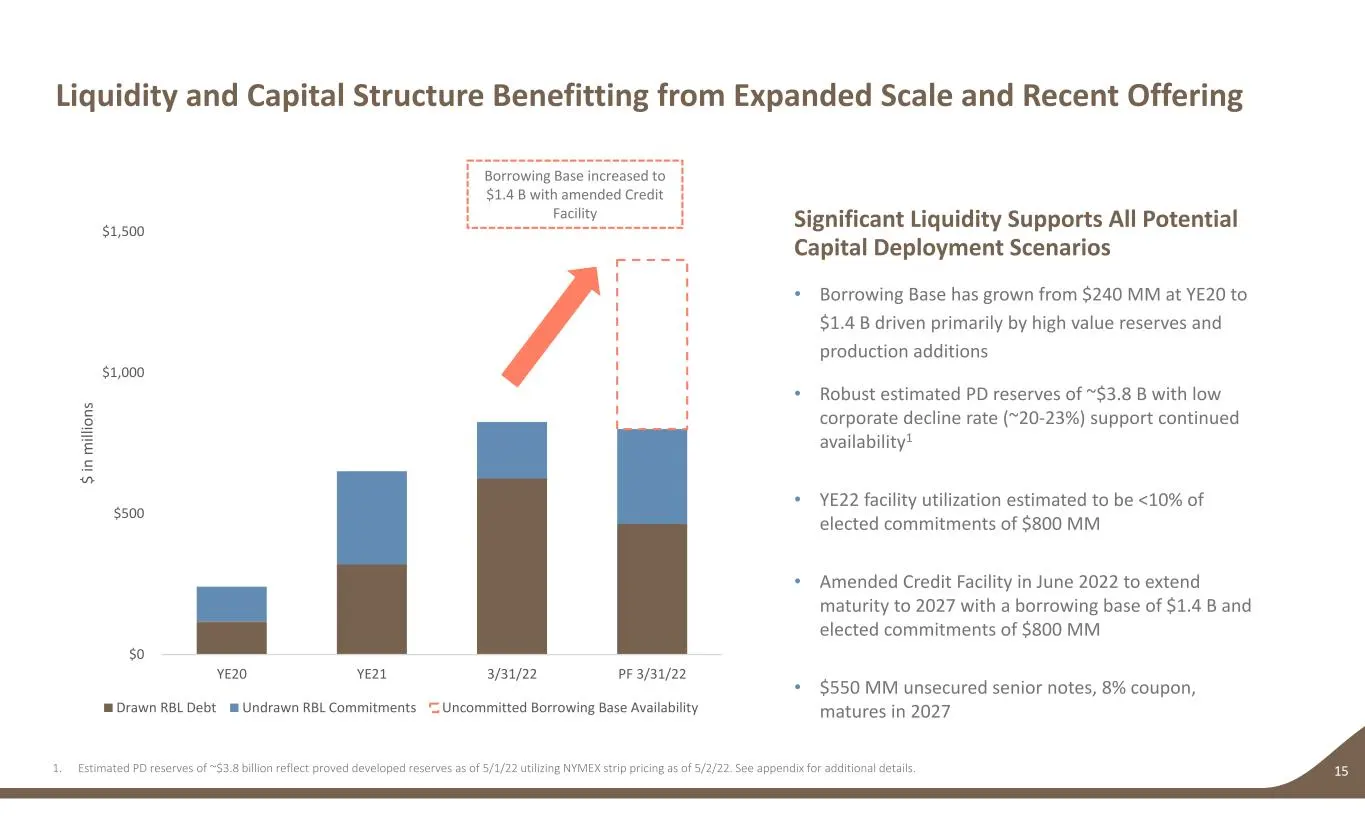
$0 $500 $1,000 $1,500 YE20 YE21 3/31/22 PF 3/31/22 $ in m ill io ns Drawn RBL Debt Undrawn RBL Commitments Uncommitted Borrowing Base Availability Liquidity and Capital Structure Benefitting from Expanded Scale and Recent Offering 15 Significant Liquidity Supports All Potential Capital Deployment Sc
Slide 16: Progressing Our Sustainability Initiatives While Leading the Pack
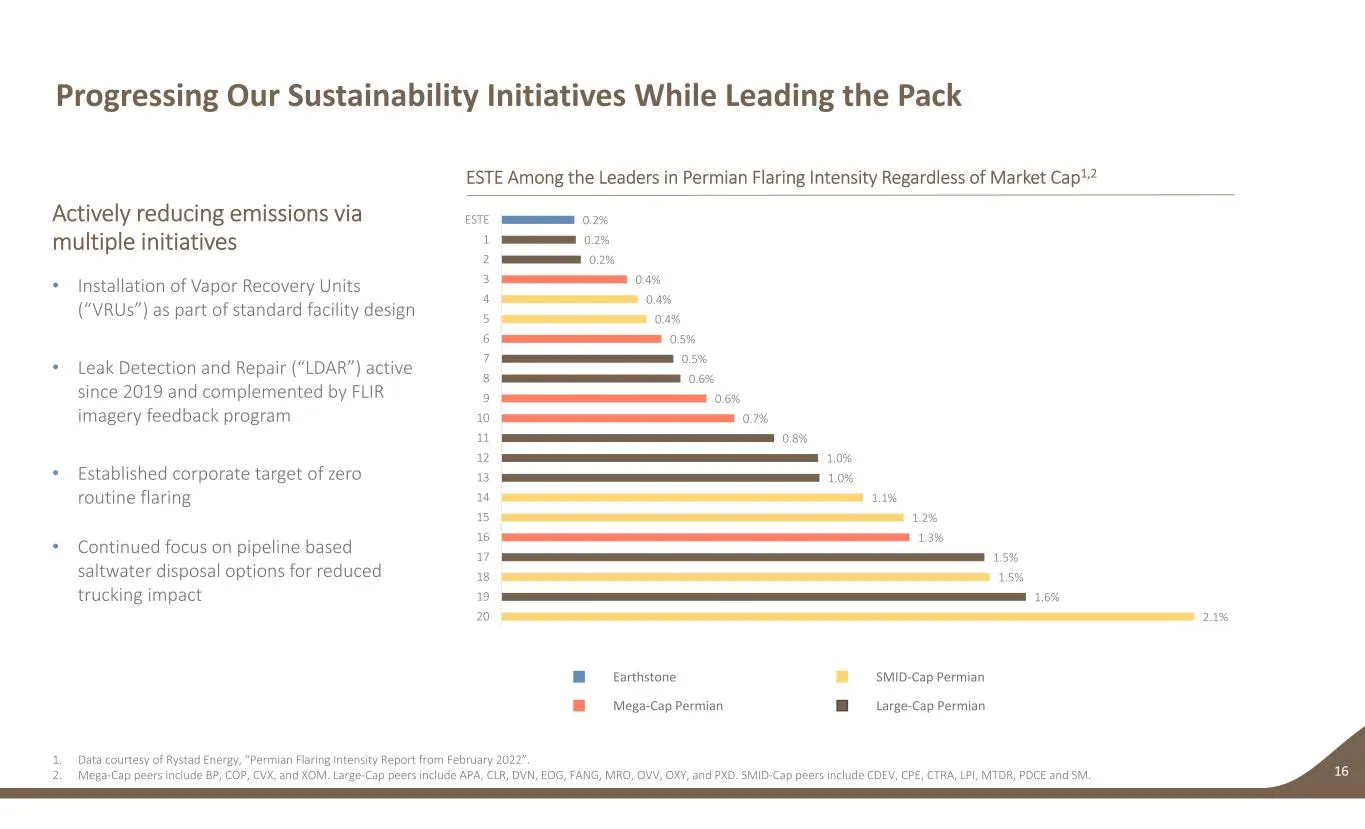
Progressing Our Sustainability Initiatives While Leading the Pack 16 Actively reducing emissions via multiple initiatives • Installation of Vapor Recovery Units (“VRUs”) as part of standard facility design • Leak Detection and Repair (“LDAR”) active since 2019 and complemented by FLIR imagery feedba
Slide 17: Highly Focused Environmental Stewardship
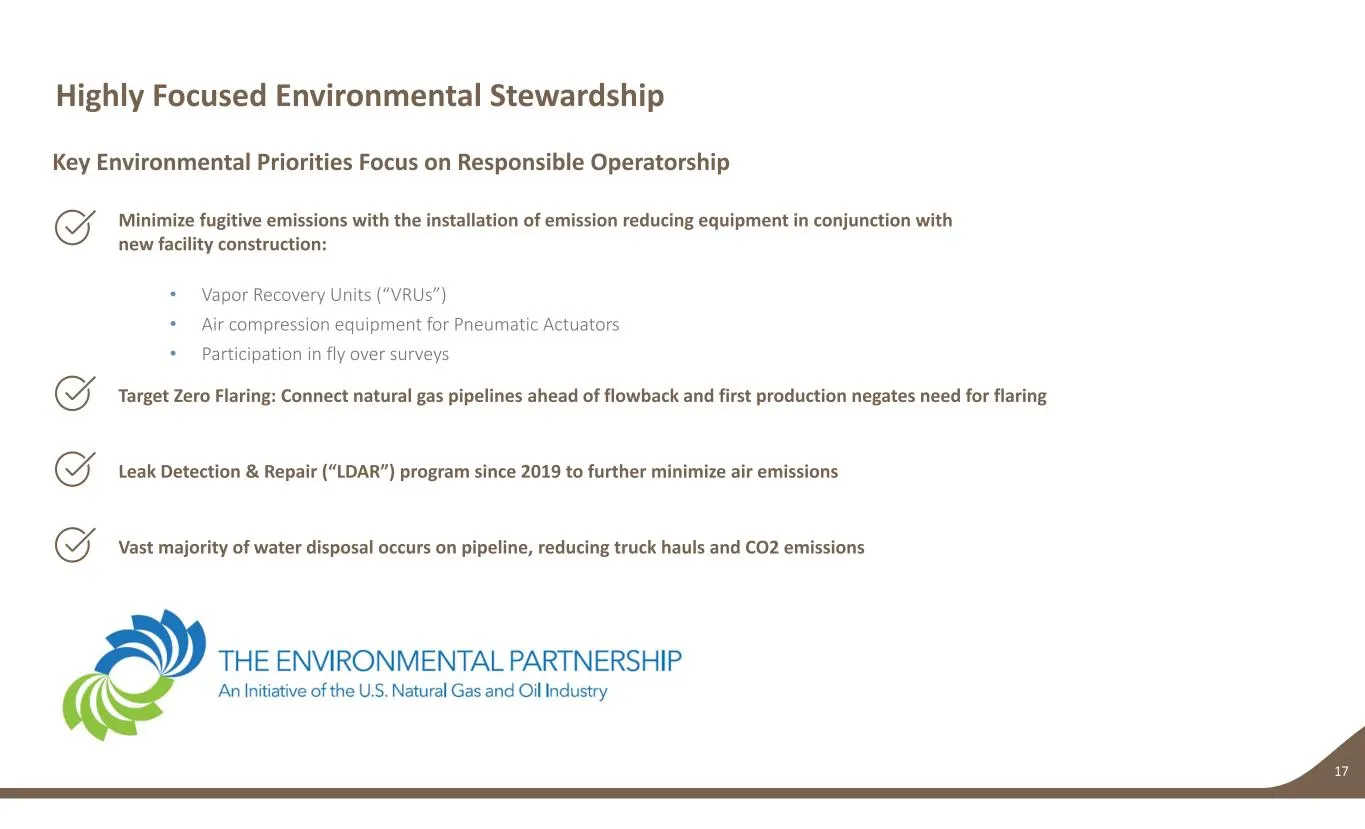
Highly Focused Environmental Stewardship 17 Key Environmental Priorities Focus on Responsible Operatorship Minimize fugitive emissions with the installation of emission reducing equipment in conjunction with new facility construction: • Vapor Recovery Units (“VRUs”) • Air compression equipment for P
Slide 18: Responsible Management of Fugitive Emissions and Flaring
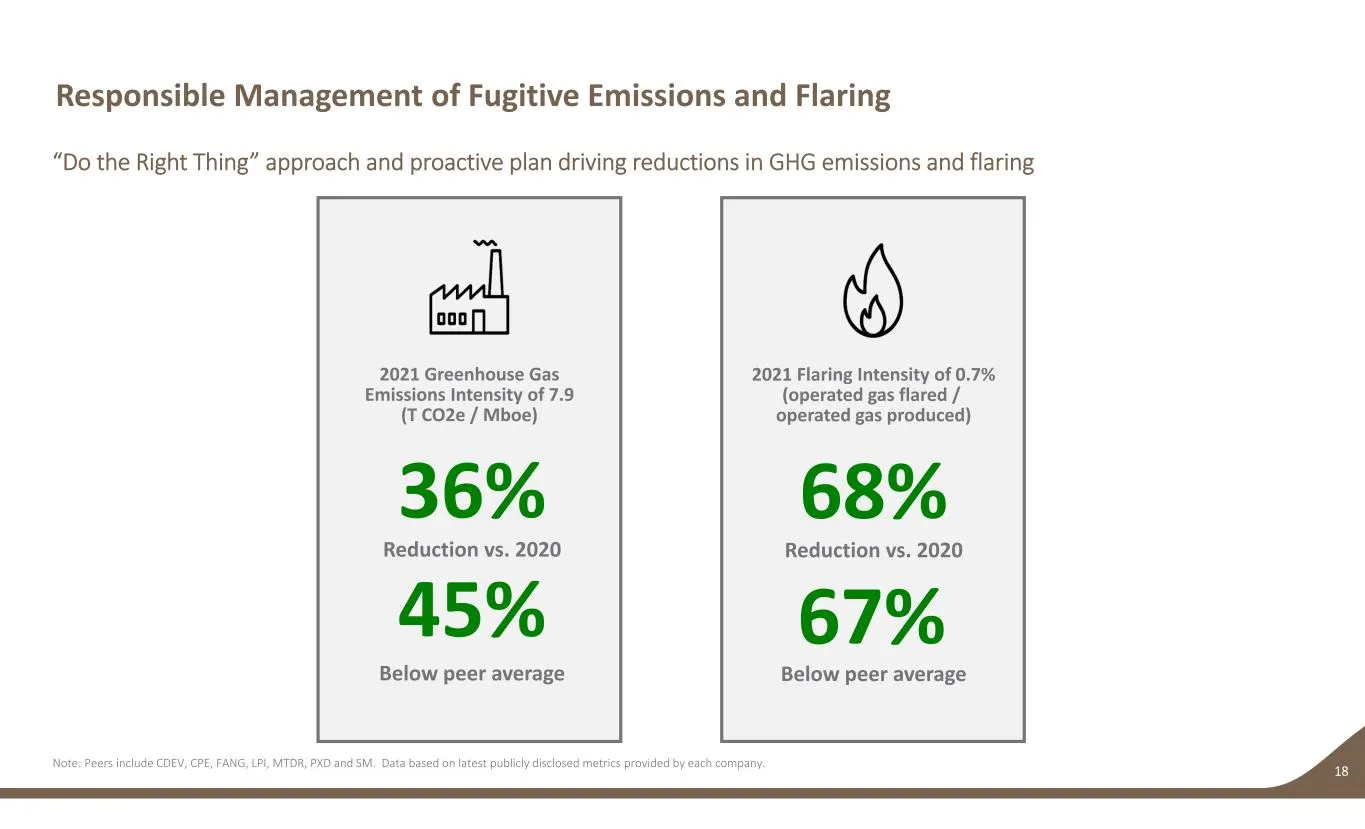
Responsible Management of Fugitive Emissions and Flaring 18 “Do the Right Thing” approach and proactive plan driving reductions in GHG emissions and flaring 68% Reduction vs. 2020 Below peer average 2021 Flaring Intensity of 0.7% (operated gas flared / operated gas produced) 67% Note: Peers include
Slide 19: Focused on Providing Shareholders a Path to Value Accretion
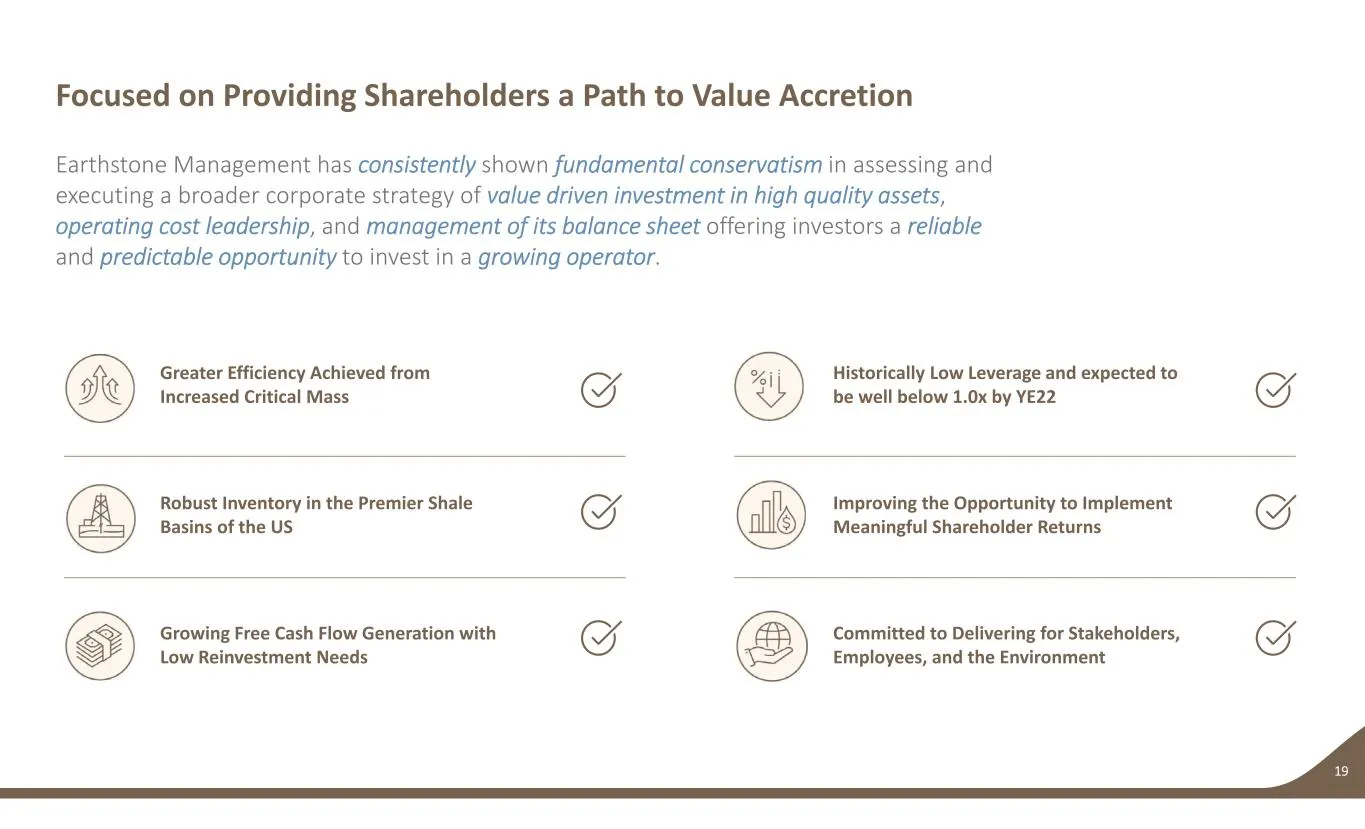
Focused on Providing Shareholders a Path to Value Accretion 19 Earthstone Management has consistently shown fundamental conservatism in assessing and executing a broader corporate strategy of value driven investment in high quality assets, operating cost leadership, and management of its balance she
Slide 20: Guidance & Appendix
Guidance & Appendix 20
Slide 21: Development Optionality Across A Larger Footprint
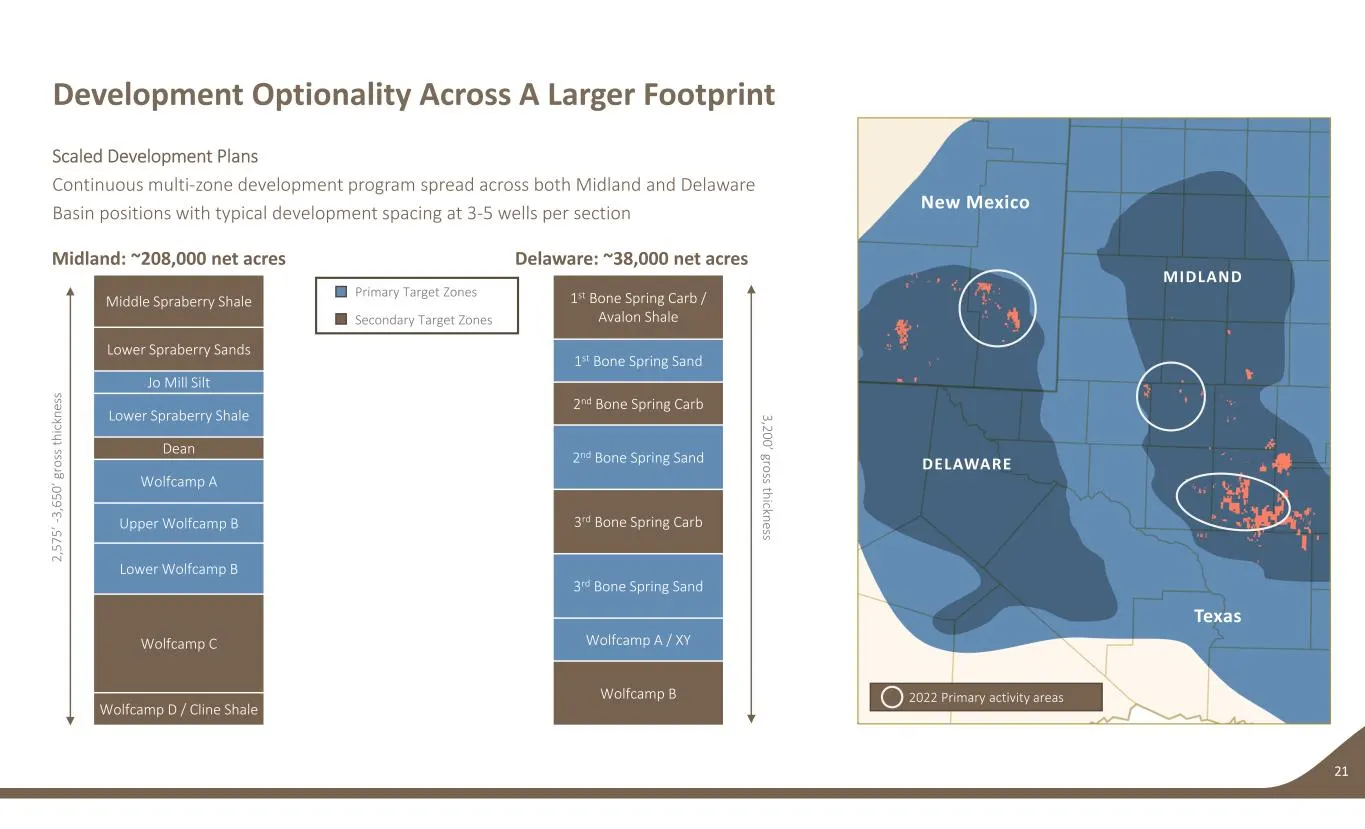
2022 Primary activity areas Development Optionality Across A Larger Footprint 21 Scaled Development Plans Continuous multi‐zone development program spread across both Midland and Delaware Basin positions with typical development spacing at 3‐5 wells per section Midland: ~208,000 net acres Delaware:
Slide 22: Company Guidance
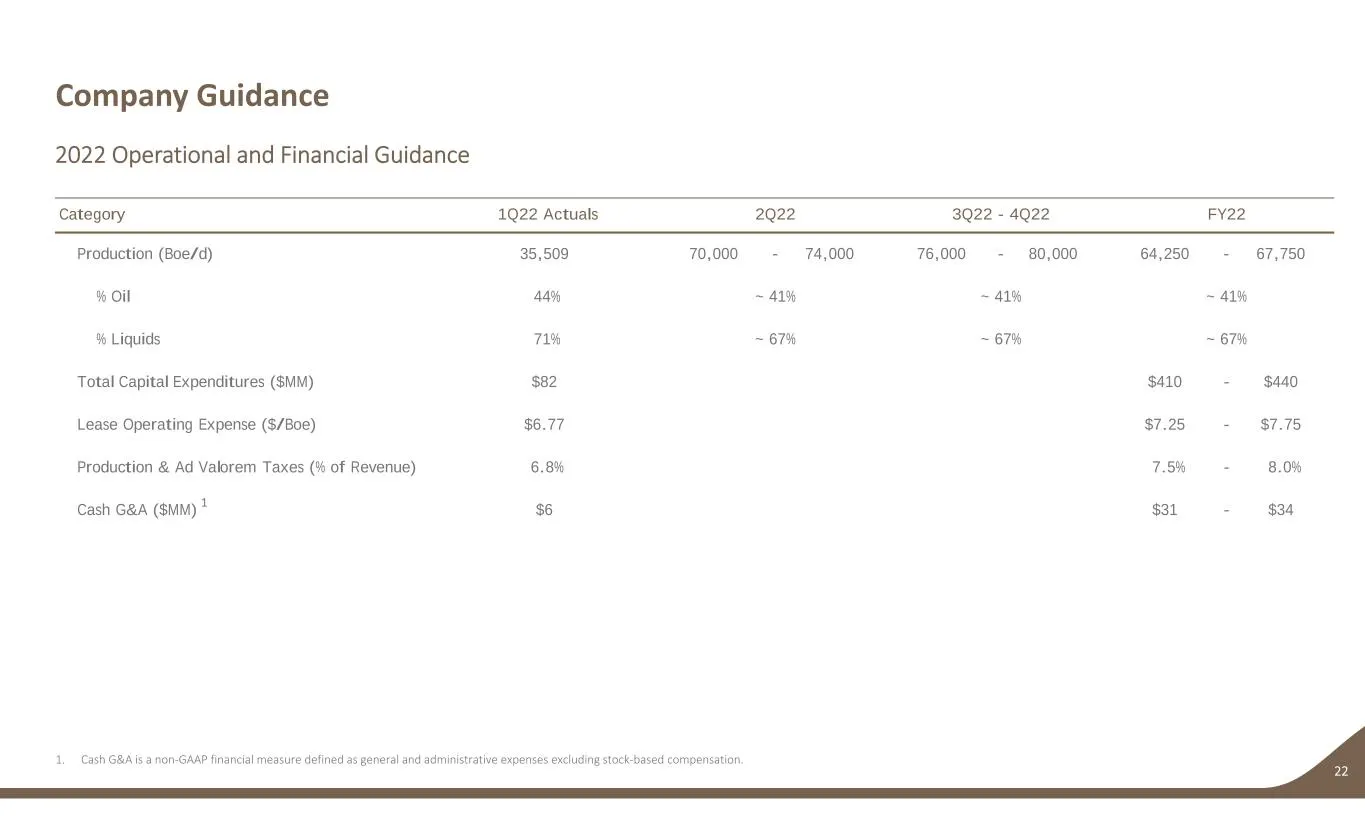
Company Guidance 22 2022 Operational and Financial Guidance Category 1Q22 Actuals 2Q22 3Q22 - 4Q22 FY22 Production (Boe/d) 35,509 70,000 - 74,000 76,000 - 80,000 64,250 - 67,750 % Oil 44% ~ 41% ~ 41% ~ 41% % Liquids 71% ~ 67% ~ 67% ~ 67% Total Capital Expenditures ($MM) $82 $410 - $440 Lease Operati
Slide 23: Oil and Gas Hedge Summary
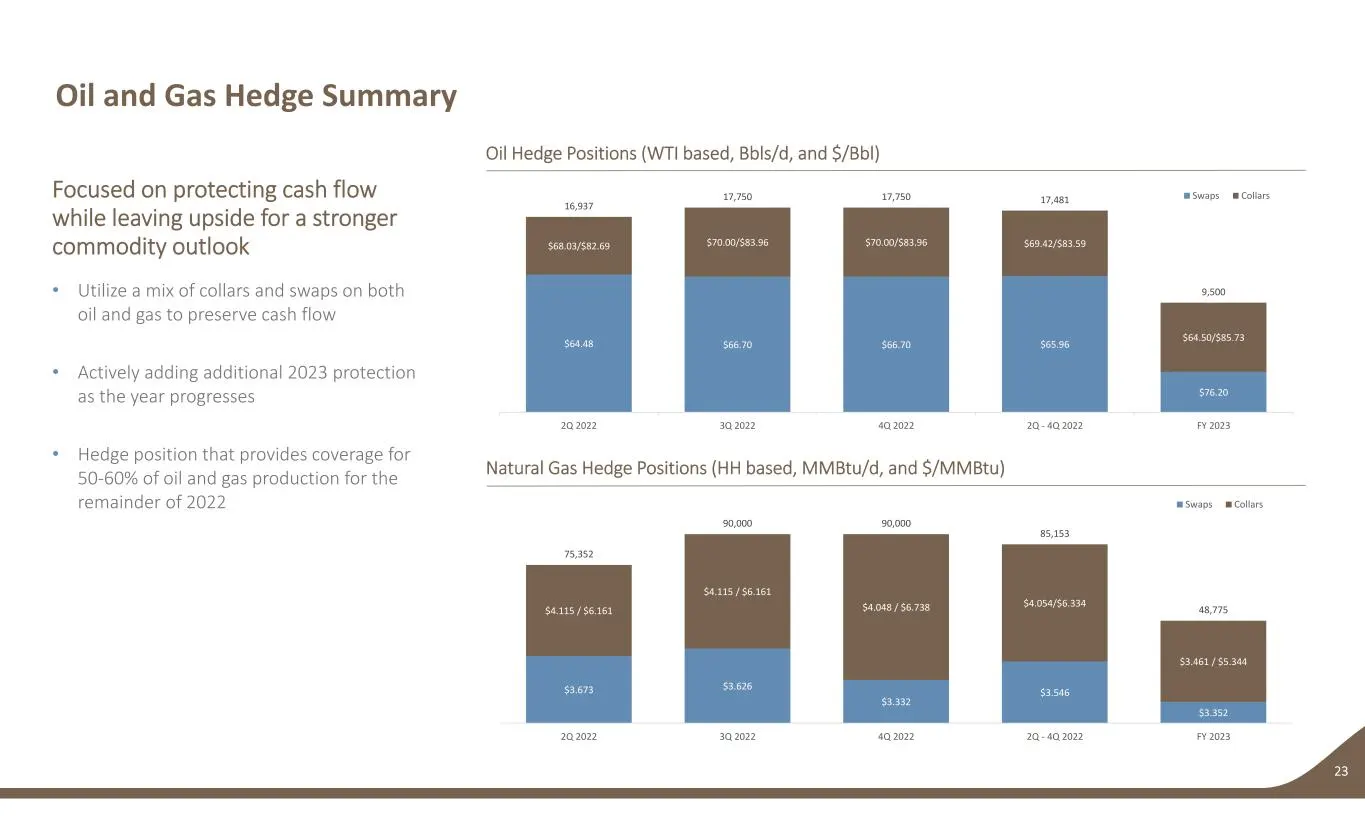
$3.673 $3.626 $3.332 $3.546 $3.352 $4.115 / $6.161 $4.115 / $6.161 $4.048 / $6.738 $4.054/$6.334 $3.461 / $5.344 75,352 90,000 90,000 85,153 48,775 2Q 2022 3Q 2022 4Q 2022 2Q ‐ 4Q 2022 FY 2023 Swaps Collars $64.48 $66.70 $66.70 $65.96 $76.20 $68.03/$82.69 $70.00/$83.96 $70.00/$83.96 $69.42/$83.59 $6
Slide 24: Oil and Gas Hedge Positions
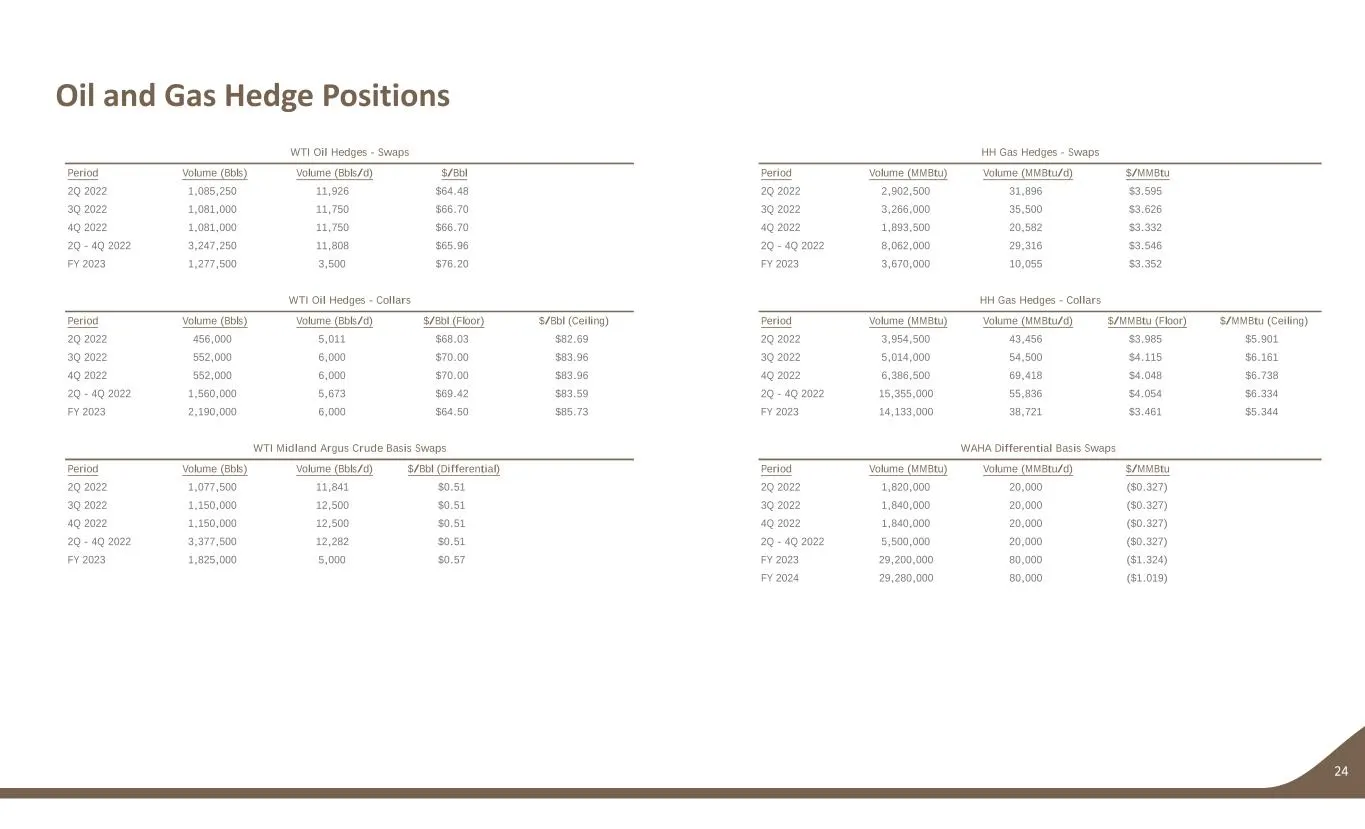
Oil and Gas Hedge Positions 24 WTI Oil Hedges - Swaps HH Gas Hedges - Swaps Period Volume (Bbls) Volume (Bbls/d) $/Bbl Period Volume (MMBtu) Volume (MMBtu/d) $/MMBtu 2Q 2022 1,085,250 11,926 $64.48 2Q 2022 2,902,500 31,896 $3.595 3Q 2022 1,081,000 11,750 $66.70 3Q 2022 3,266,000 35,500 $3.626 4Q 202
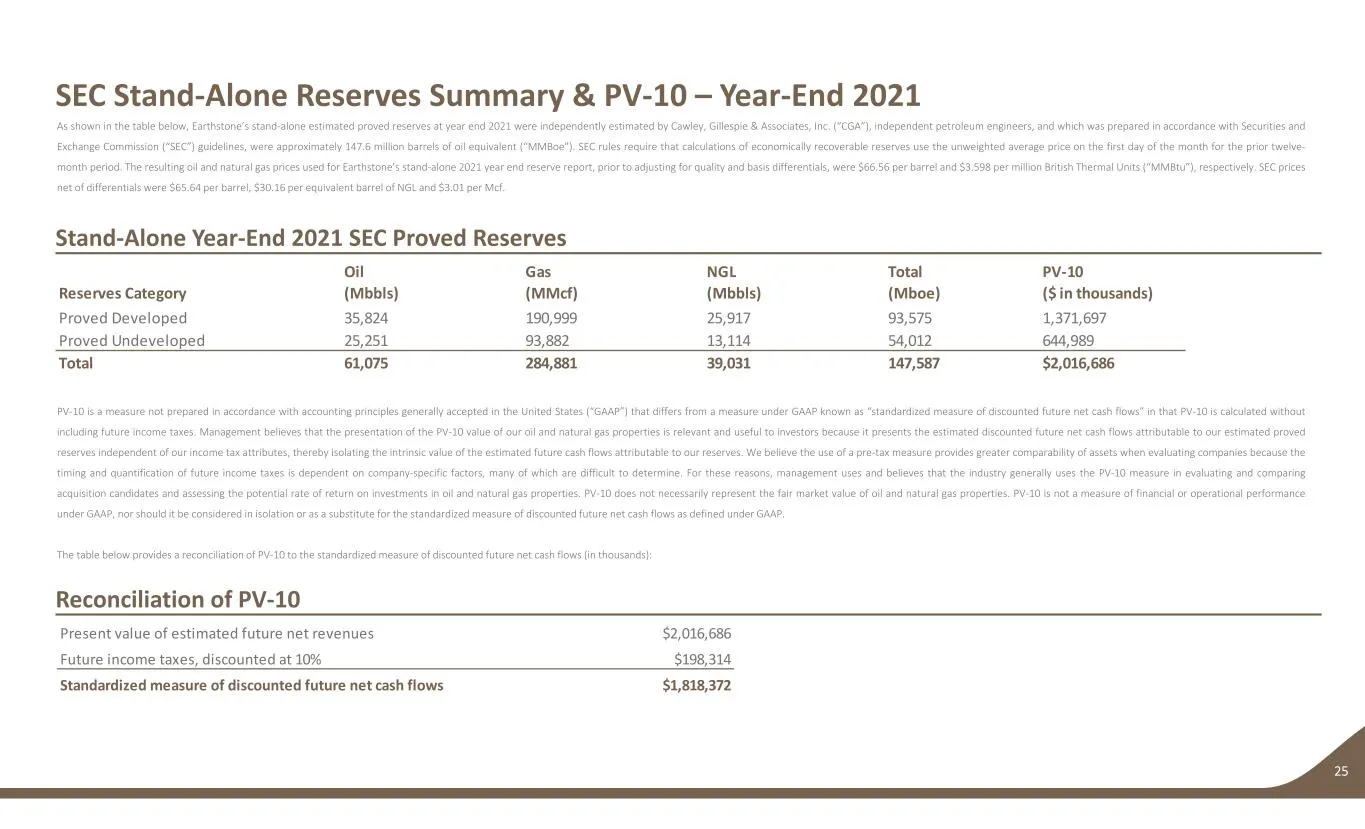
Slide 25: SEC Stand-Alone Reserves Summary & PV-10 – Year-End 2021
SEC Stand‐Alone Reserves Summary & PV‐10 – Year‐End 2021 25 Stand‐Alone Year‐End 2021 SEC Proved Reserves Reconciliation of PV‐10 As shown in the table below, Earthstone’s stand‐alone estimated proved reserves at year end 2021 were independently estimated by Cawley, Gillespie & Associates, Inc. (“CG
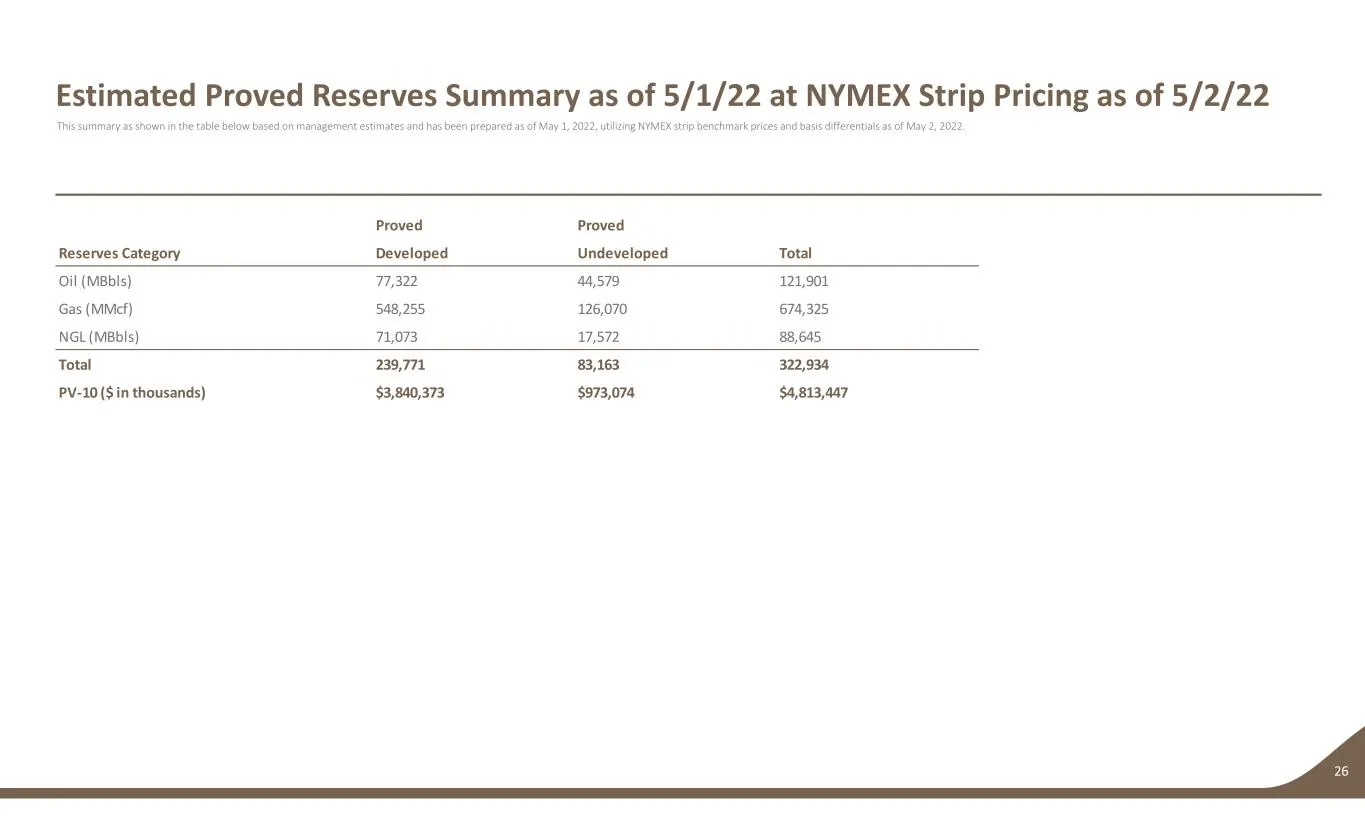
Slide 26: Estimated Proved Reserves Summary as of 5/1/22
Estimated Proved Reserves Summary as of 5/1/22 at NYMEX Strip Pricing as of 5/2/22 26 This summary as shown in the table below based on management estimates and has been prepared as of May 1, 2022, utilizing NYMEX strip benchmark prices and basis differentials as of May 2, 2022. Proved Proved Reserv
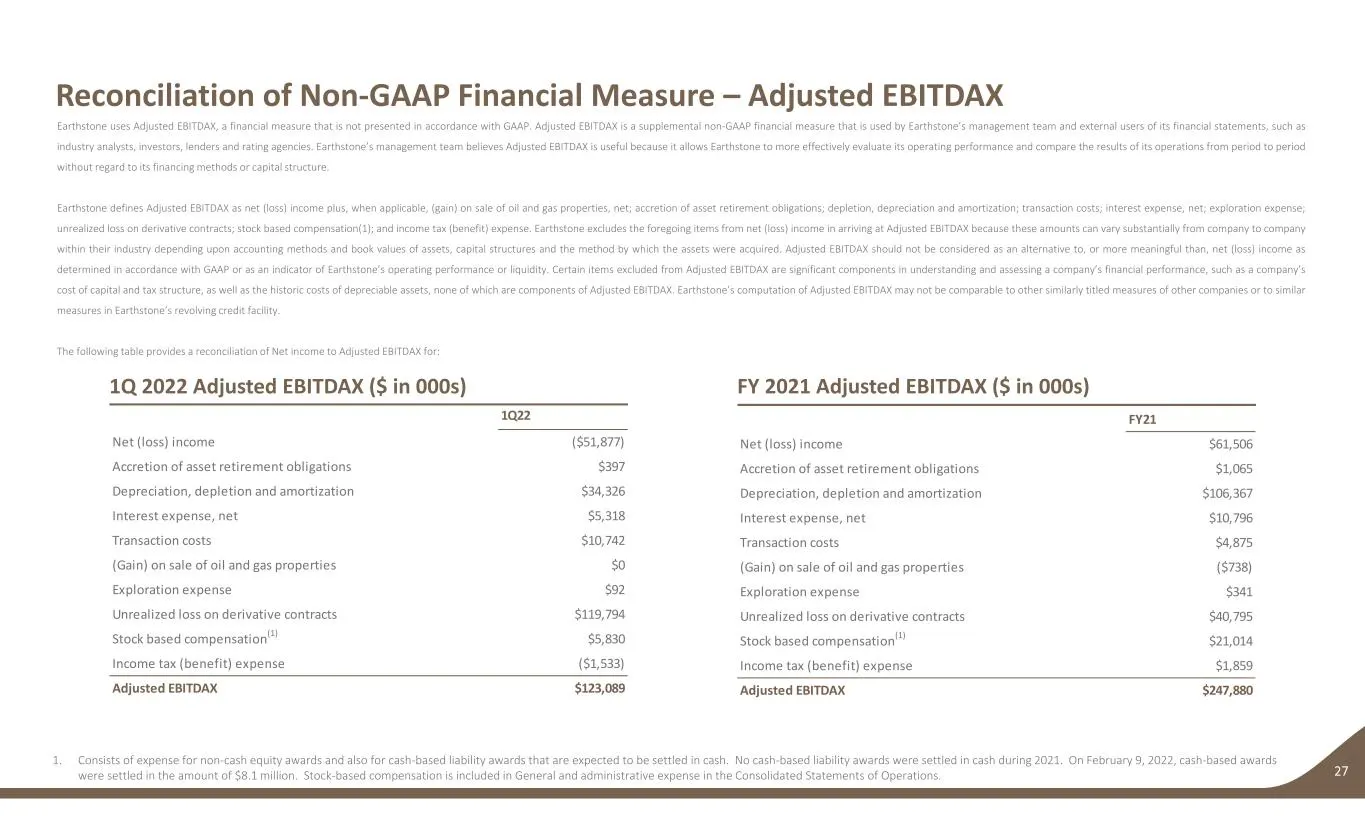
Slide 27: Reconciliation of Non-GAAP Financial Measure – Adjusted EBITDAX
Reconciliation of Non‐GAAP Financial Measure – Adjusted EBITDAX 27 1Q 2022 Adjusted EBITDAX ($ in 000s) 1. Consists of expense for non‐cash equity awards and also for cash‐based liability awards that are expected to be settled in cash. No cash‐based liability awards were settled in cash during 2021.
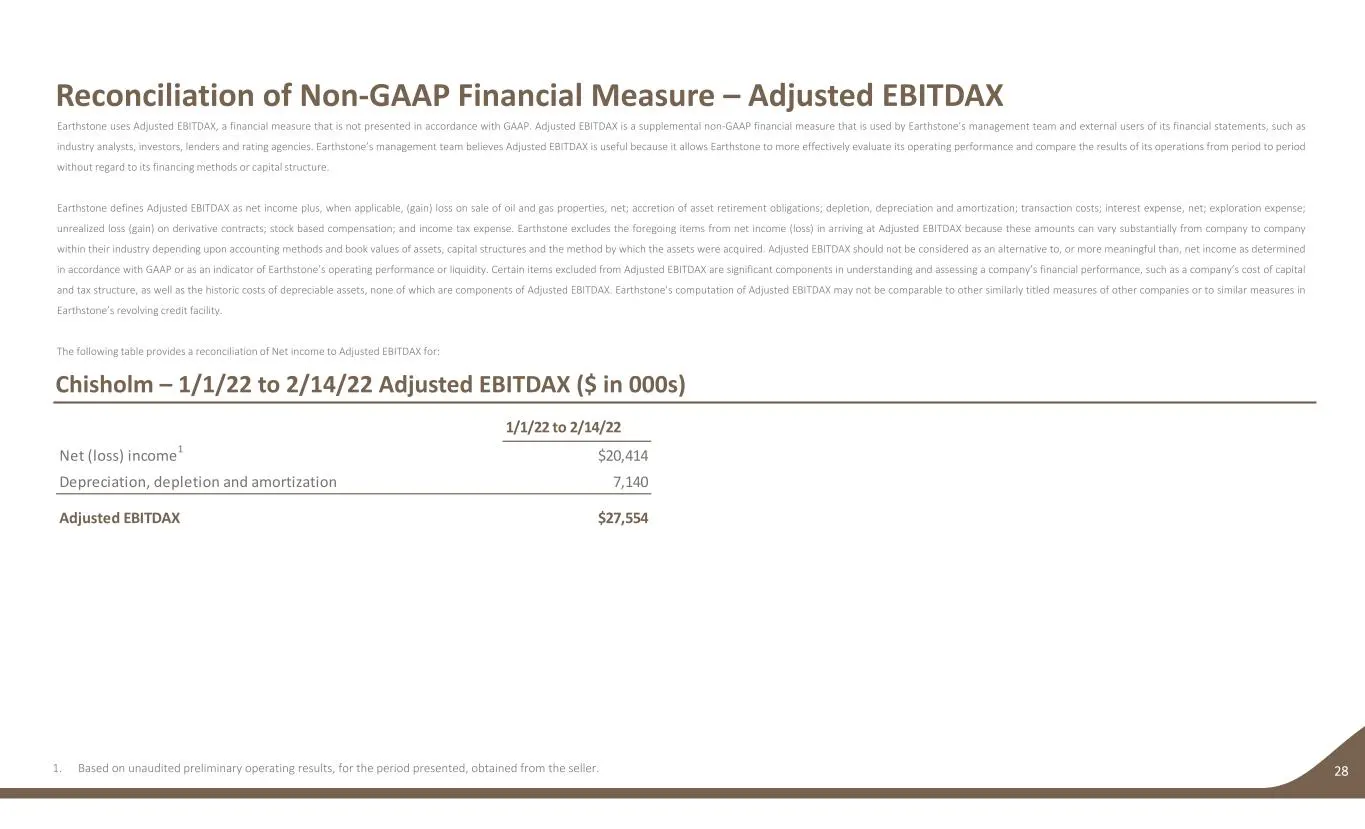
Slide 28: Reconciliation of Non-GAAP Financial Measure – Adjusted EBITDAX (Chisholm)
Reconciliation of Non‐GAAP Financial Measure – Adjusted EBITDAX 28 Chisholm – 1/1/22 to 2/14/22 Adjusted EBITDAX ($ in 000s) 1. Based on unaudited preliminary operating results, for the period presented, obtained from the seller. Earthstone uses Adjusted EBITDAX, a financial measure that is not pres
Slide 29: Market Capitalization Table
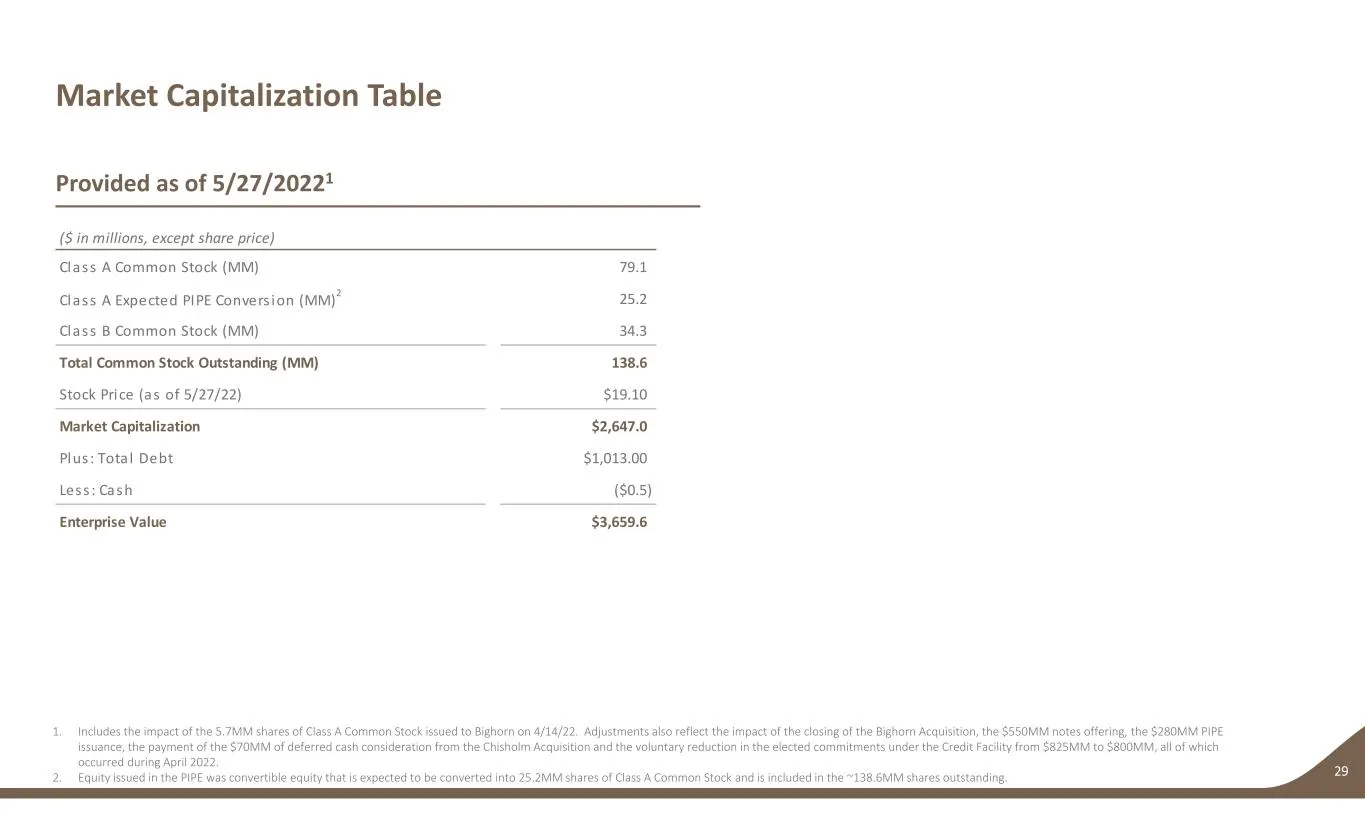
Market Capitalization Table 29 Provided as of 5/27/20221 1. Includes the impact of the 5.7MM shares of Class A Common Stock issued to Bighorn on 4/14/22. Adjustments also reflect the impact of the closing of the Bighorn Acquisition, the $550MM notes offering, the $280MM PIPE issuance, the payment of
Slide 30: Notes and Supplemental Information
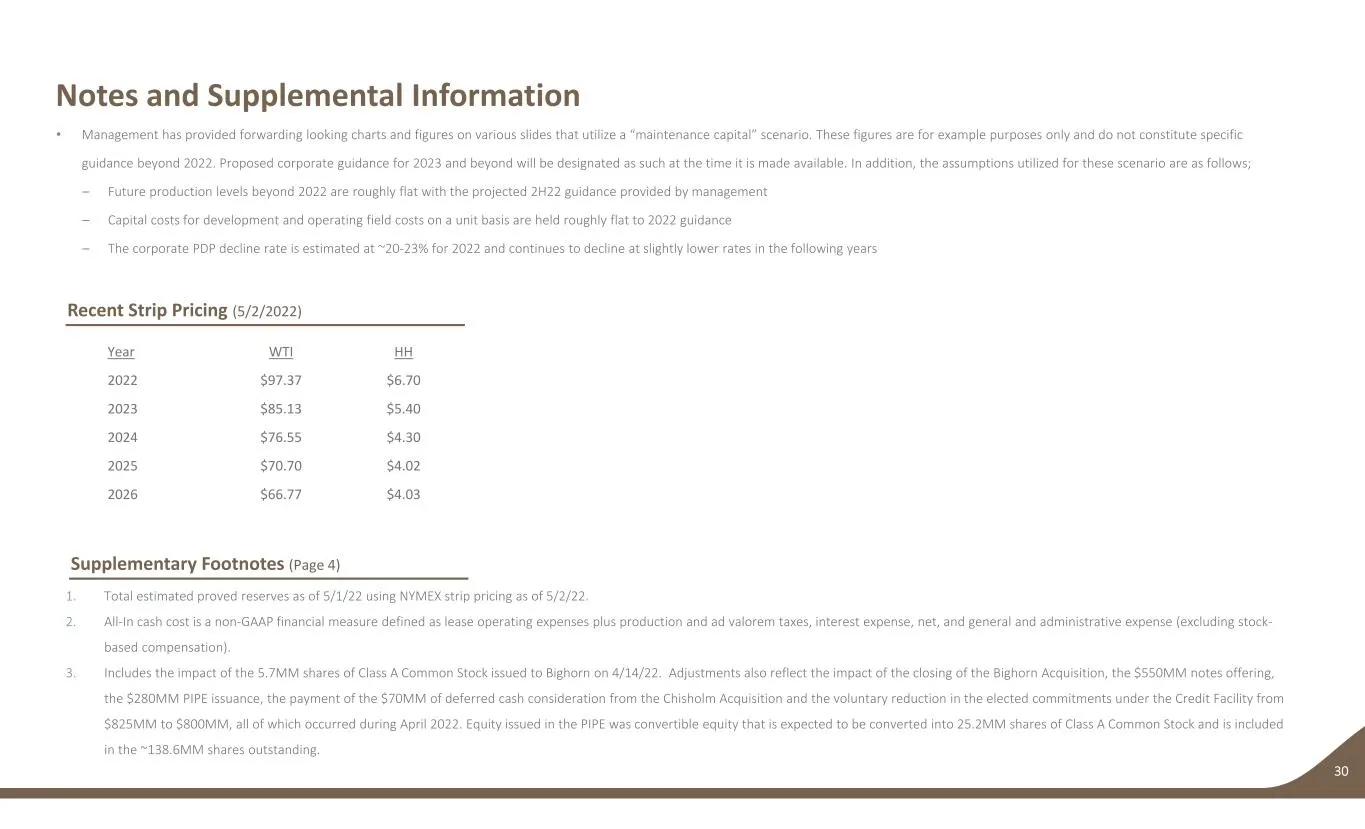
Notes and Supplemental Information 30 Recent Strip Pricing (5/2/2022) Year WTI HH 2022 $97.37 $6.70 2023 $85.13 $5.40 2024 $76.55 $4.30 2025 $70.70 $4.02 2026 $66.77 $4.03 • Management has provided forwarding looking charts and figures on various slides that utilize a “maintenance capital” scenario.
Source: SEC EDGAR · 8-K filed Jun 2, 2022
More decks from Earthstone Energy Inc
 Merger or Acquisition (August 2023)20 slides · Aug 23, 2023
 EnerCom Denver 202332 slides · Aug 14, 2023
 Q2 2023 Earnings Presentation25 slides · Aug 2, 2023
 Investor Presentation (June 2023)29 slides · Jun 20, 2023
 Merger or Acquisition (June 2023)16 slides · Jun 16, 2023
 Q1 2023 Earnings Presentation33 slides · May 3, 2023