AUB Group Limited · ASX:AUB
AUB — H1 2020 Earnings Presentation
29 slides from AUB's earnings presentation, Feb 25, 2020
Slide 1: 1H20 Results Investor Presentation
. 1H20 Results Investor Presentation 25 February 2020 Mike Emmett CEO and Managing Director Mark Shanahan CFO © 2020 AUB Group Limited
Slide 2: Key Messages
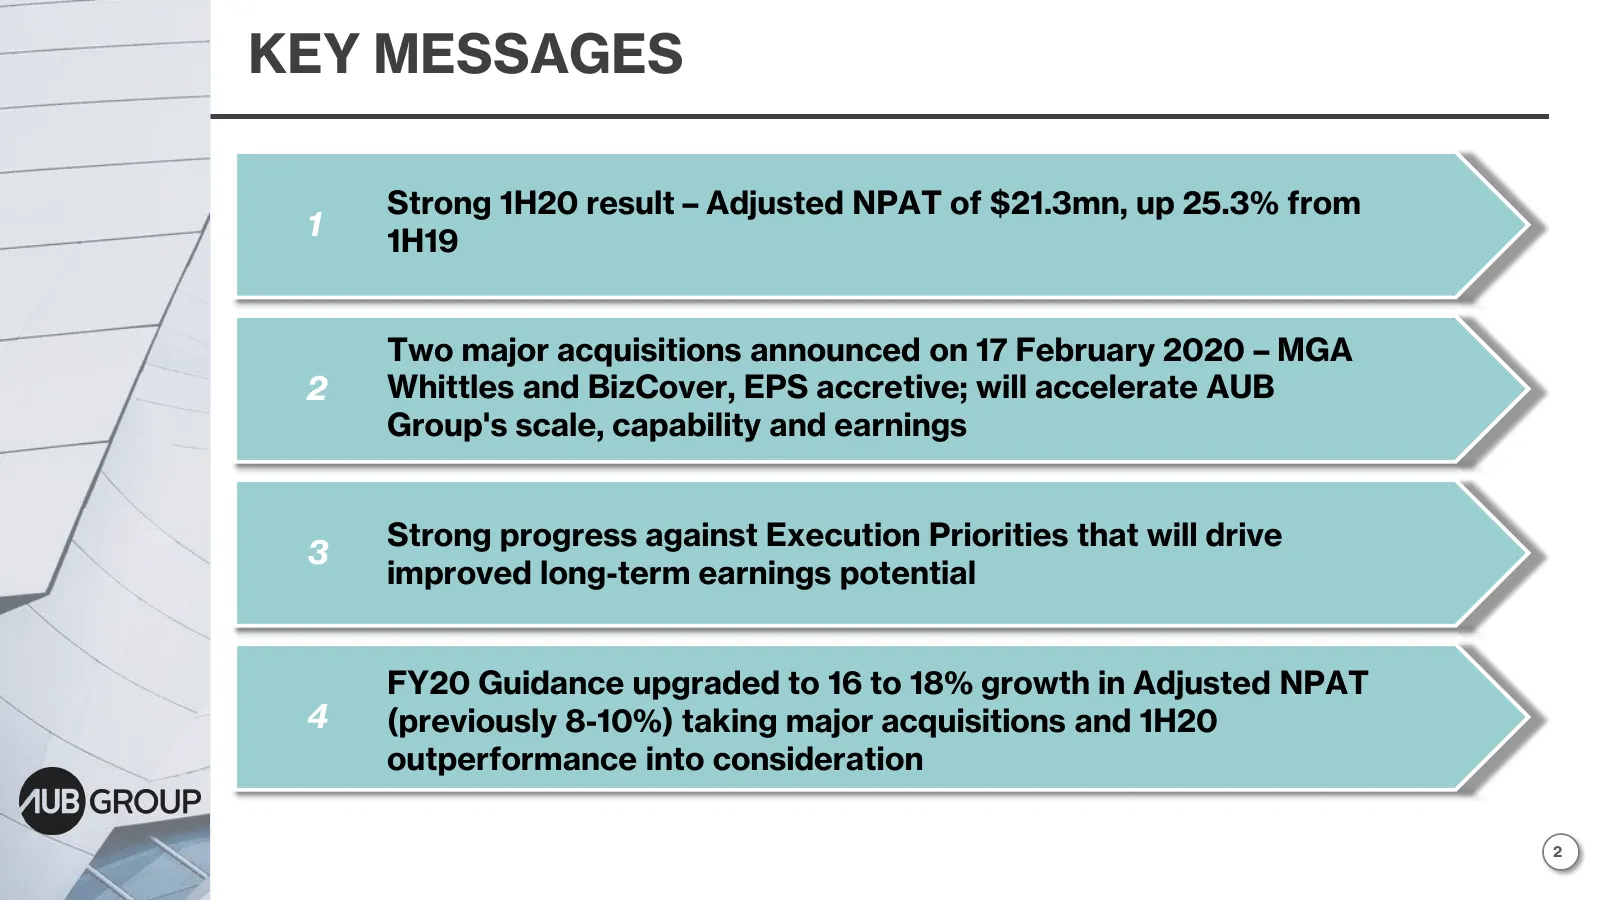
KEY MESSAGES Strong 1H20 result – Adjusted NPAT of $21.3mn, up 25.3% from 1 1H19 Two major acquisitions announced on 17 February 2020 – MGA 2 Whittles and BizCover, EPS accretive; will accelerate AUB Group's scale, capability and earnings Strong progress against Execution Priorities that will drive
Slide 3: A. 1H20 Results Overview
1H20 Results Presentation . A. 1H20 Results Overview © 2020 AUB Group Limited
Slide 4: 1H20 Group Performance
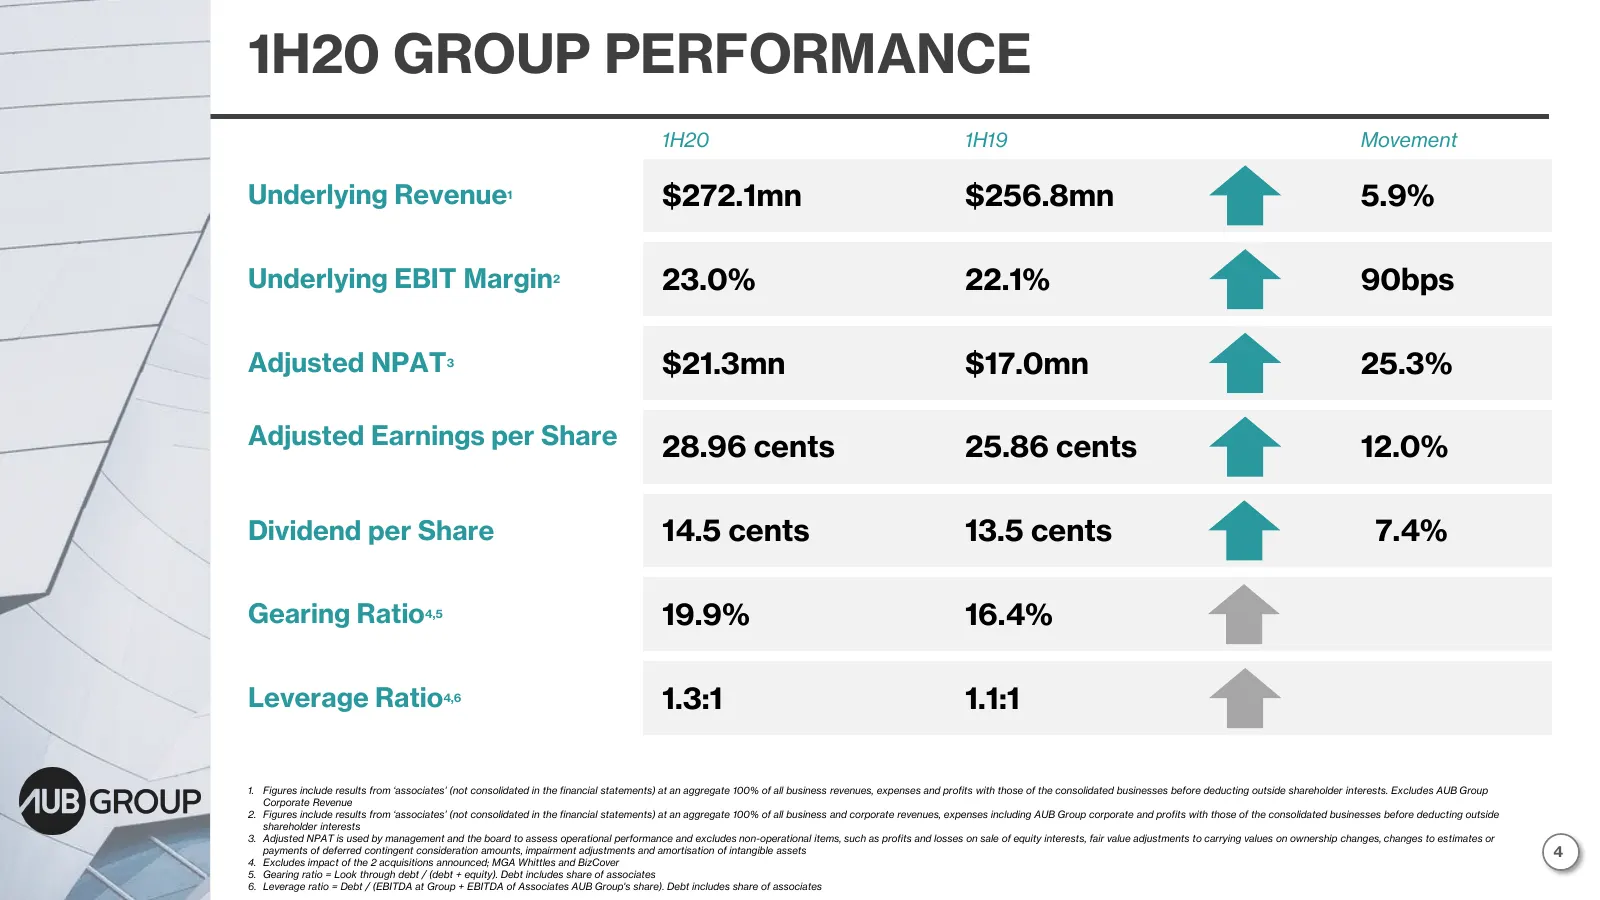
1H20 GROUP PERFORMANCE 1H20 1H19 Movement Underlying Revenue1 $272.1mn $256.8mn 5.9% Underlying EBIT Margin2 23.0% 22.1% 90bps Adjusted NPAT3 $21.3mn $17.0mn 25.3% Adjusted Earnings per Share 28.96 cents 25.86 cents 12.0% Dividend per Share 14.5 cents 13.5 cents 7.4% Gearing Ratio4,5 19.9% 16.4% Lev
Slide 5: 1H20 Performance Breakdown
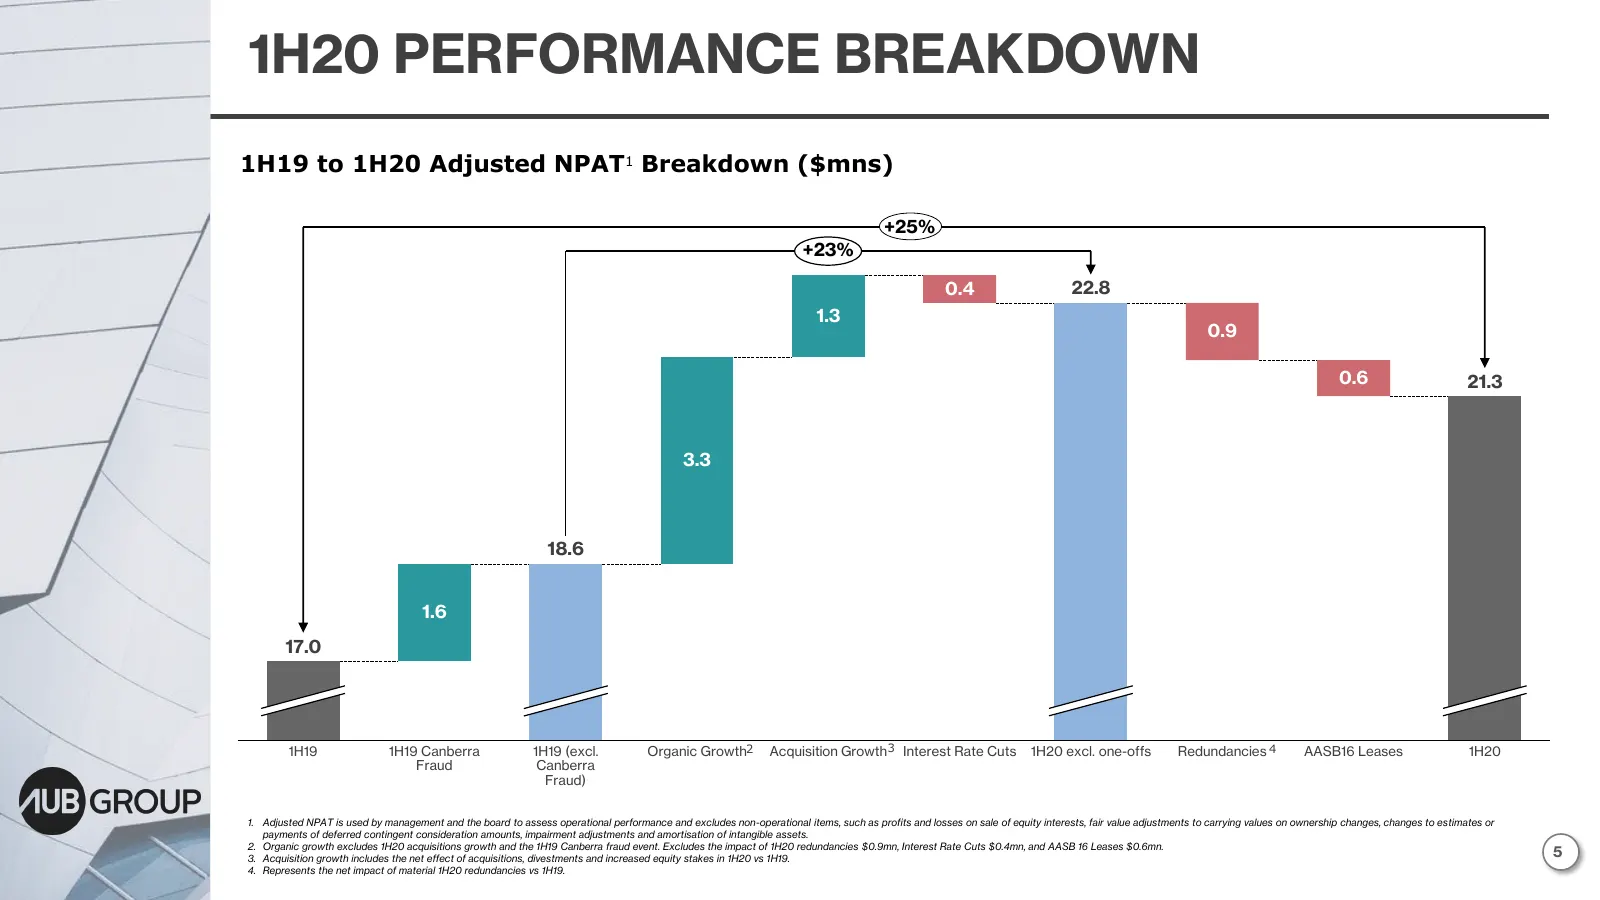
1H20 PERFORMANCE BREAKDOWN 1H19 to 1H20 Adjusted NPAT1 Breakdown ($mns) +25% +23% 0.4 22.8 1.3 0.9 0.6 21.3 3.3 18.6 1.6 17.0 1H19 1H19 Canberra 1H19 (excl. Organic Growth2 Acquisition Growth3 Interest Rate Cuts 1H20 excl. one-offs Redundancies 4 AASB16 Leases 1H20 Fraud Canberra Fraud) 1. Adjusted
Slide 6: 1H20 Divisional Performance
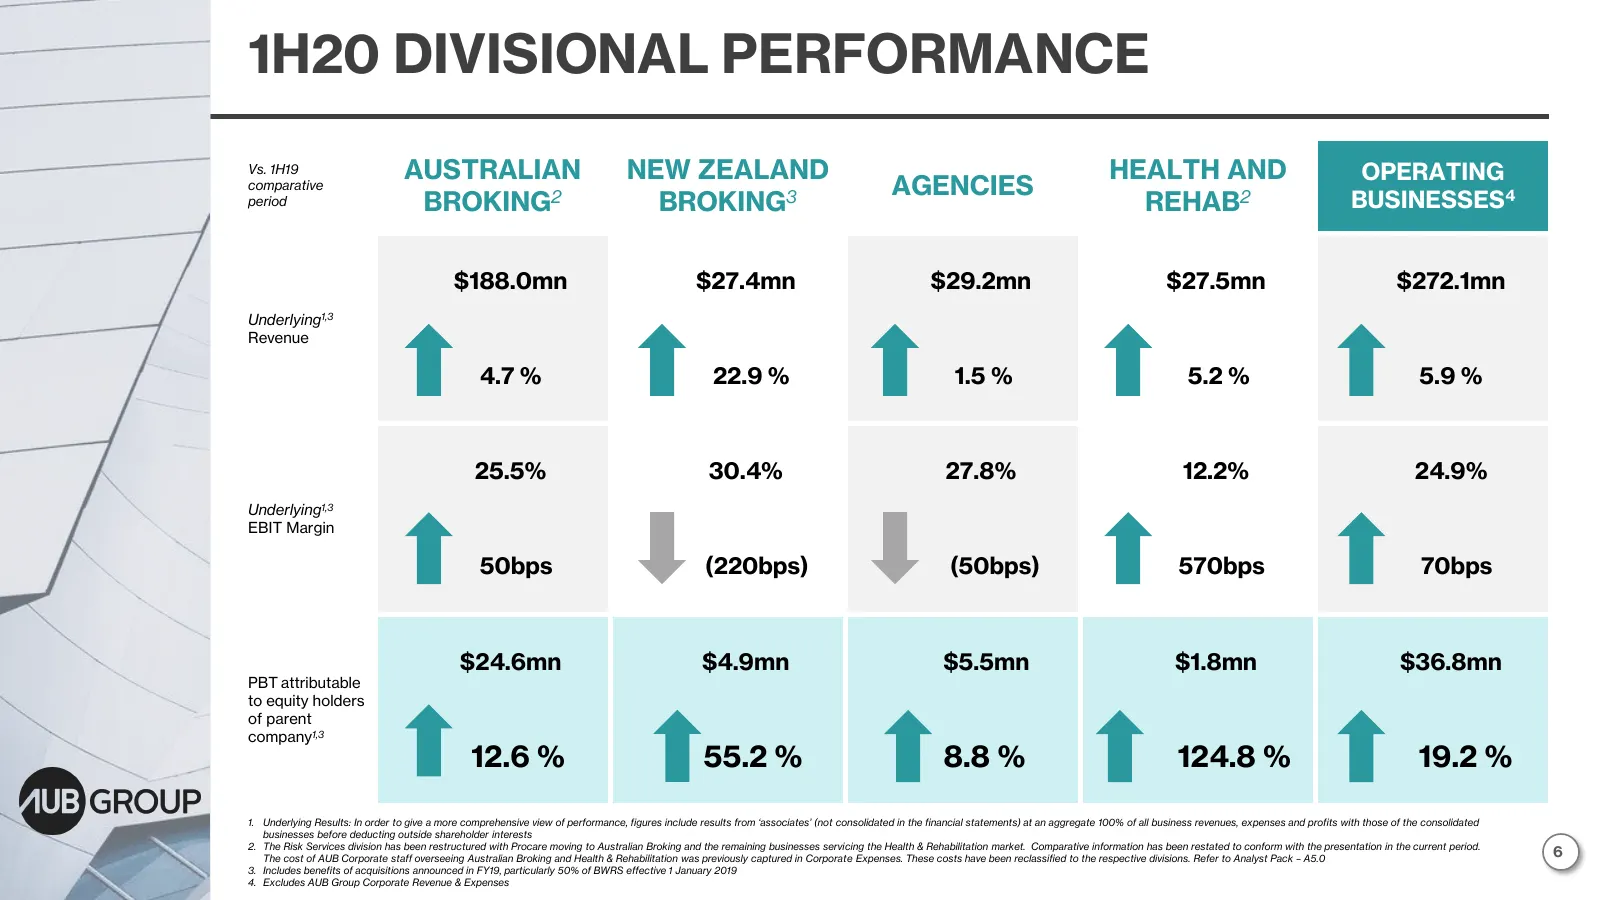
1H20 DIVISIONAL PERFORMANCE Vs. 1H19 AUSTRALIAN NEW ZEALAND HEALTH AND OPERATING comparative AGENCIES period BROKING2 BROKING3 REHAB2 BUSINESSES4 $188.0mn $27.4mn $29.2mn $27.5mn $272.1mn Underlying1,3 Revenue 4.7 % 22.9 % 1.5 % 5.2 % 5.9 % 25.5% 30.4% 27.8% 12.2% 24.9% Underlying1,3 EBIT Margin 50b
Slide 7: Australian Broking – 1H20
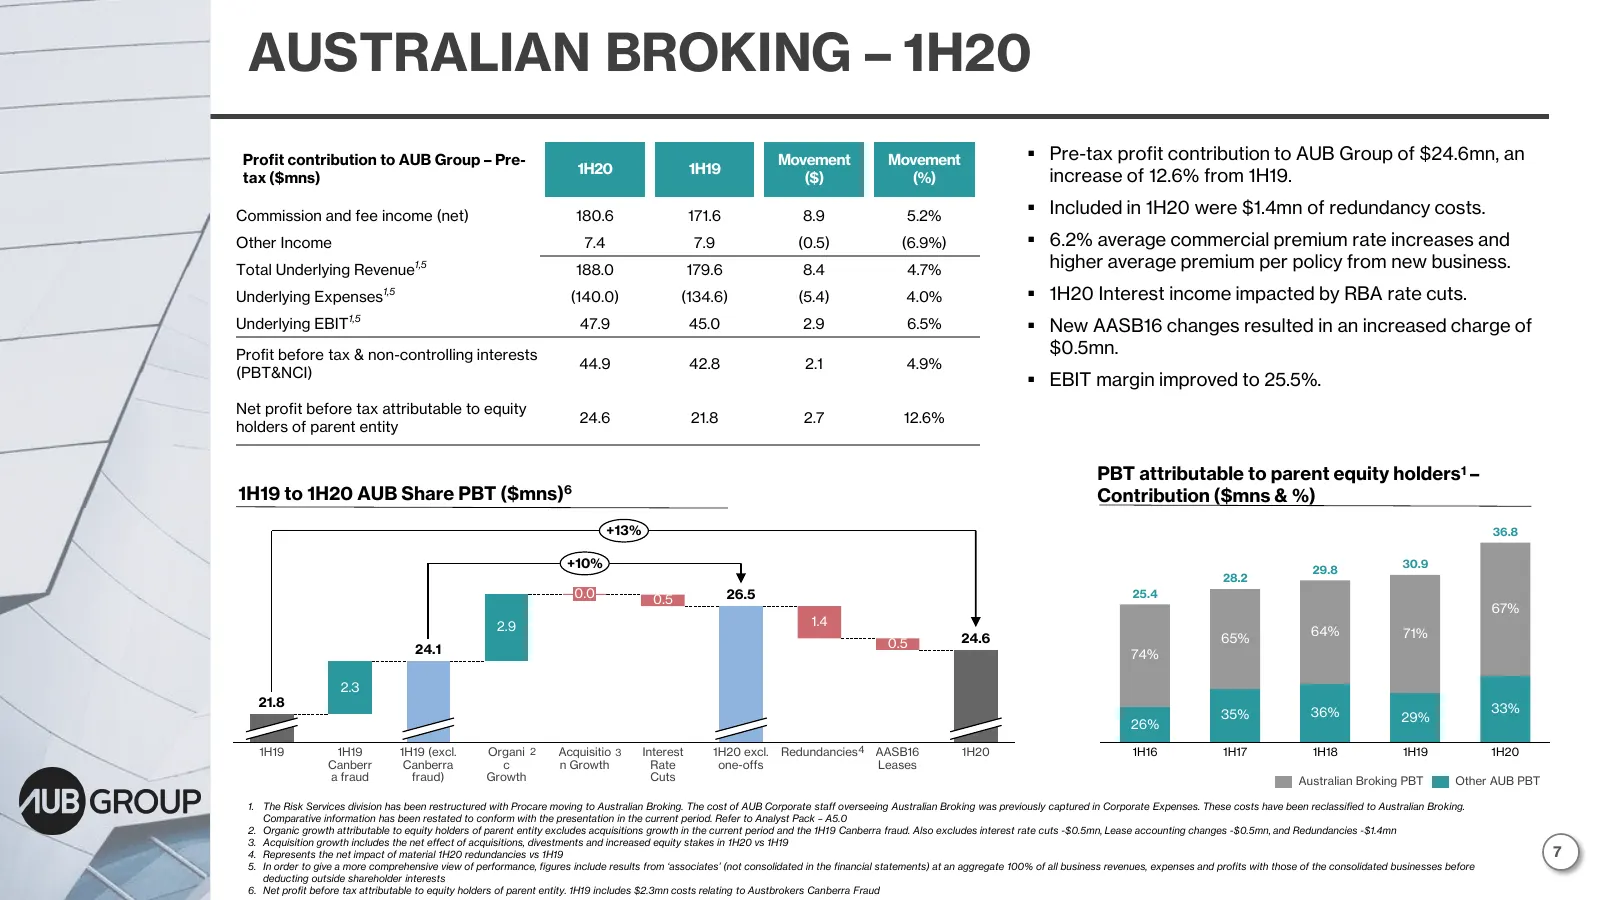
AUSTRALIAN BROKING – 1H20 Profit contribution to AUB Group – Pre- Movement Movement ▪ Pre-tax profit contribution to AUB Group of $24.6mn, an 1H20 1H19 tax ($mns) ($) (%) increase of 12.6% from 1H19. Commission and fee income (net) 180.6 171.6 8.9 5.2% ▪ Included in 1H20 were $1.4mn of redundancy co
Slide 8: New Zealand Broking – 1H20
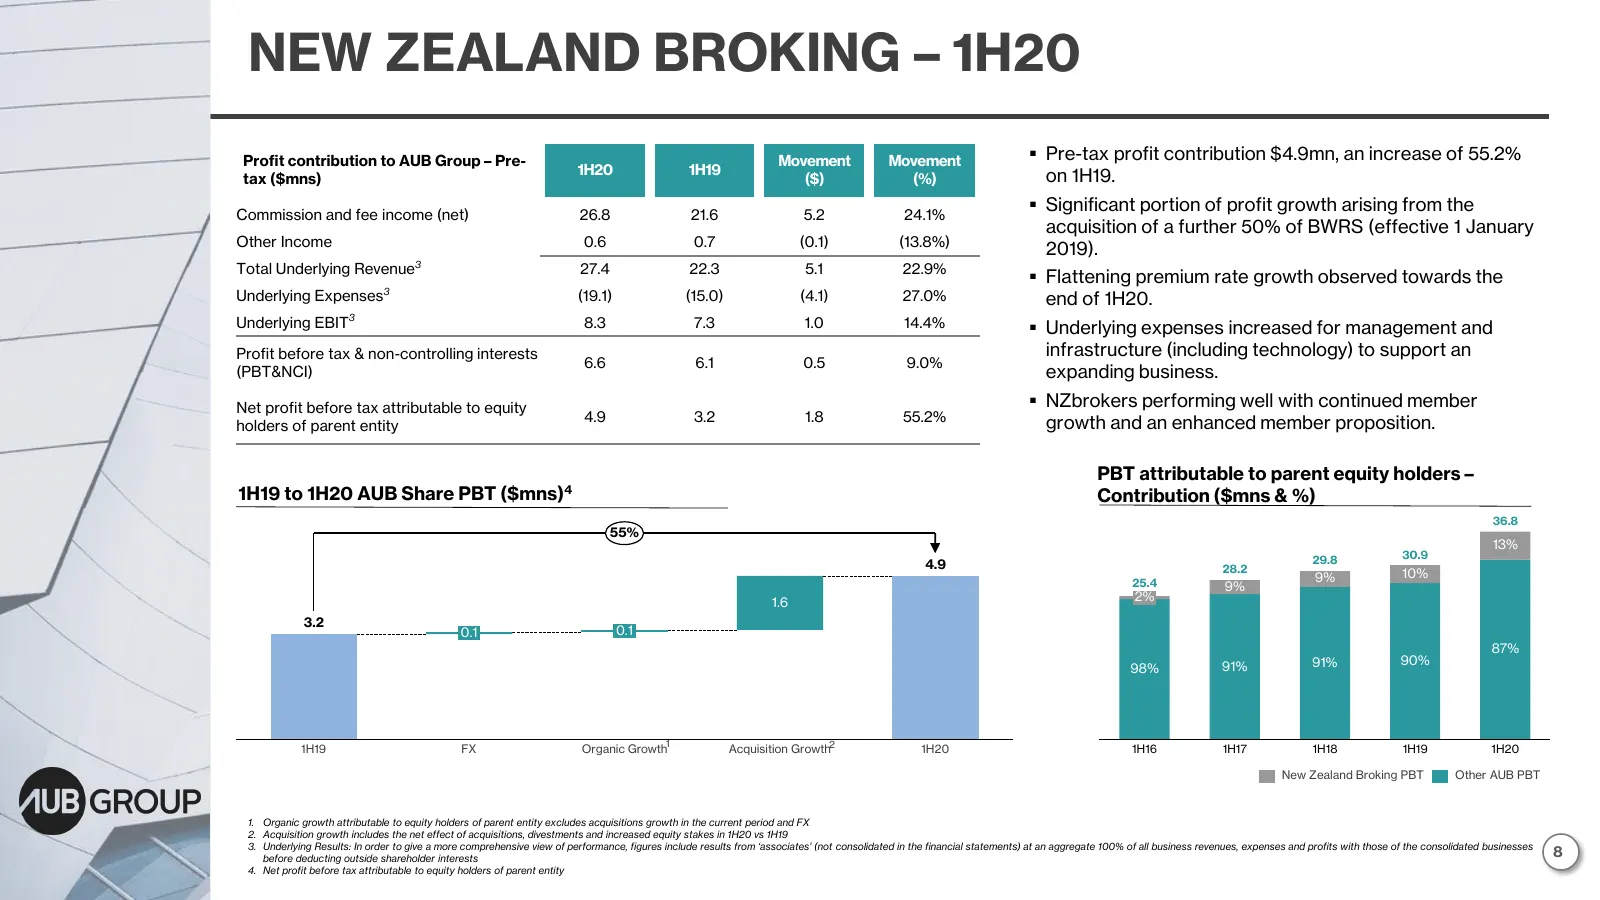
NEW ZEALAND BROKING – 1H20 Profit contribution to AUB Group – Pre- Movement Movement ▪ Pre-tax profit contribution $4.9mn, an increase of 55.2% 1H20 1H19 on 1H19. tax ($mns) ($) (%) ▪ Significant portion of profit growth arising from the Commission and fee income (net) 26.8 21.6 5.2 24.1% acquisitio
Slide 9: Agencies – 1H20
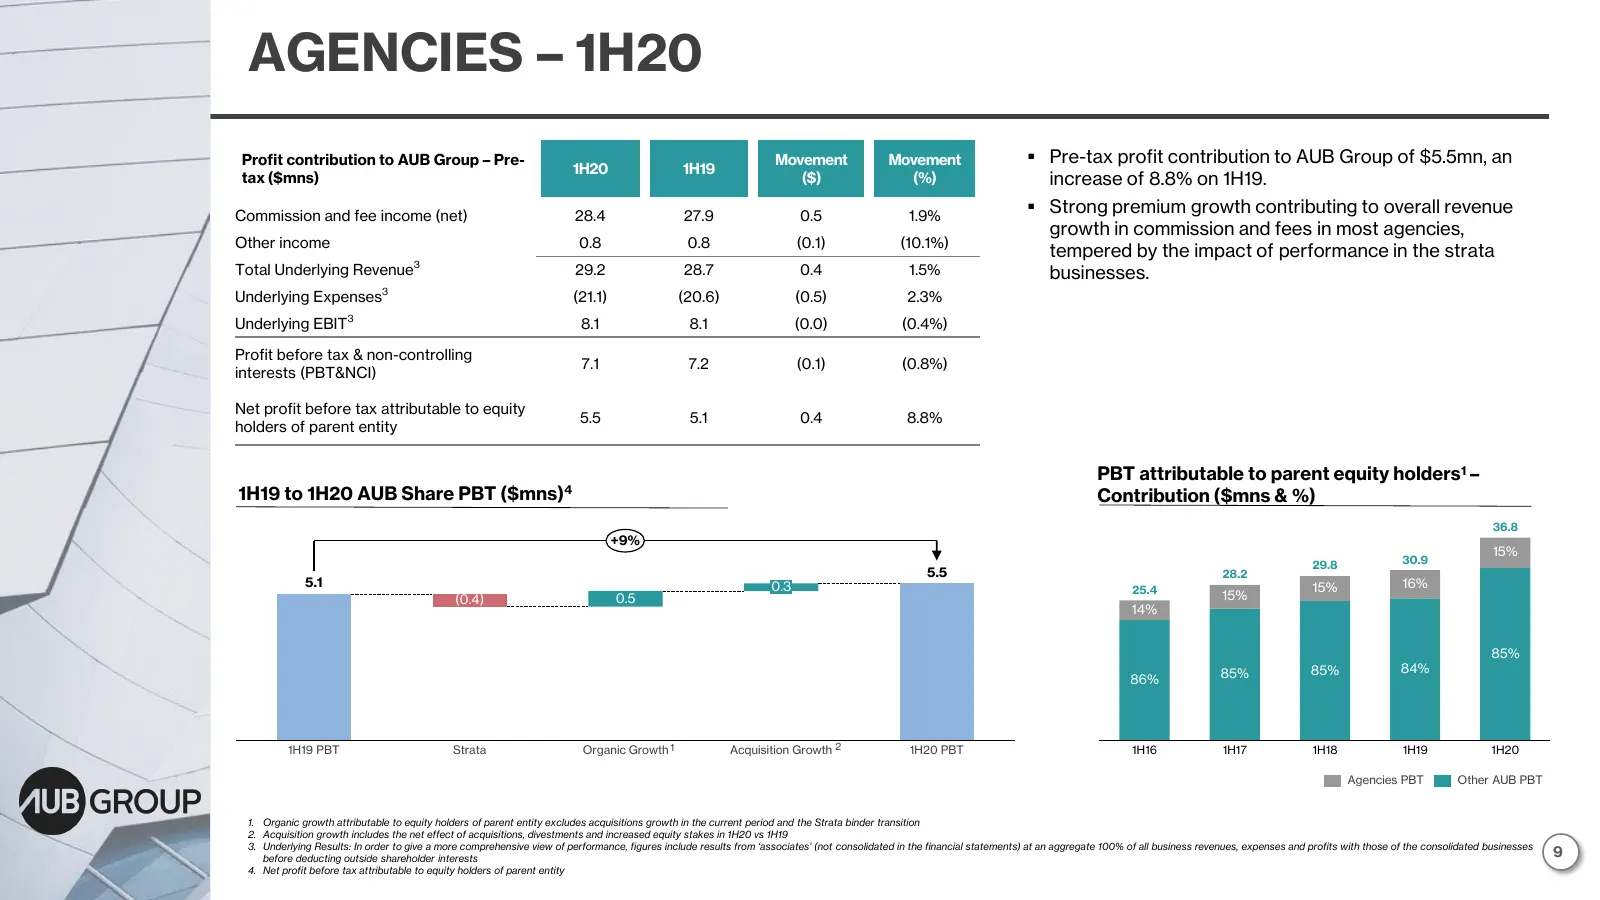
AGENCIES – 1H20 Profit contribution to AUB Group – Pre- Movement Movement ▪ Pre-tax profit contribution to AUB Group of $5.5mn, an 1H20 1H19 tax ($mns) ($) (%) increase of 8.8% on 1H19. Commission and fee income (net) 28.4 27.9 0.5 1.9% ▪ Strong premium growth contributing to overall revenue growth
Slide 10: Health and Rehabilitation – 1H20
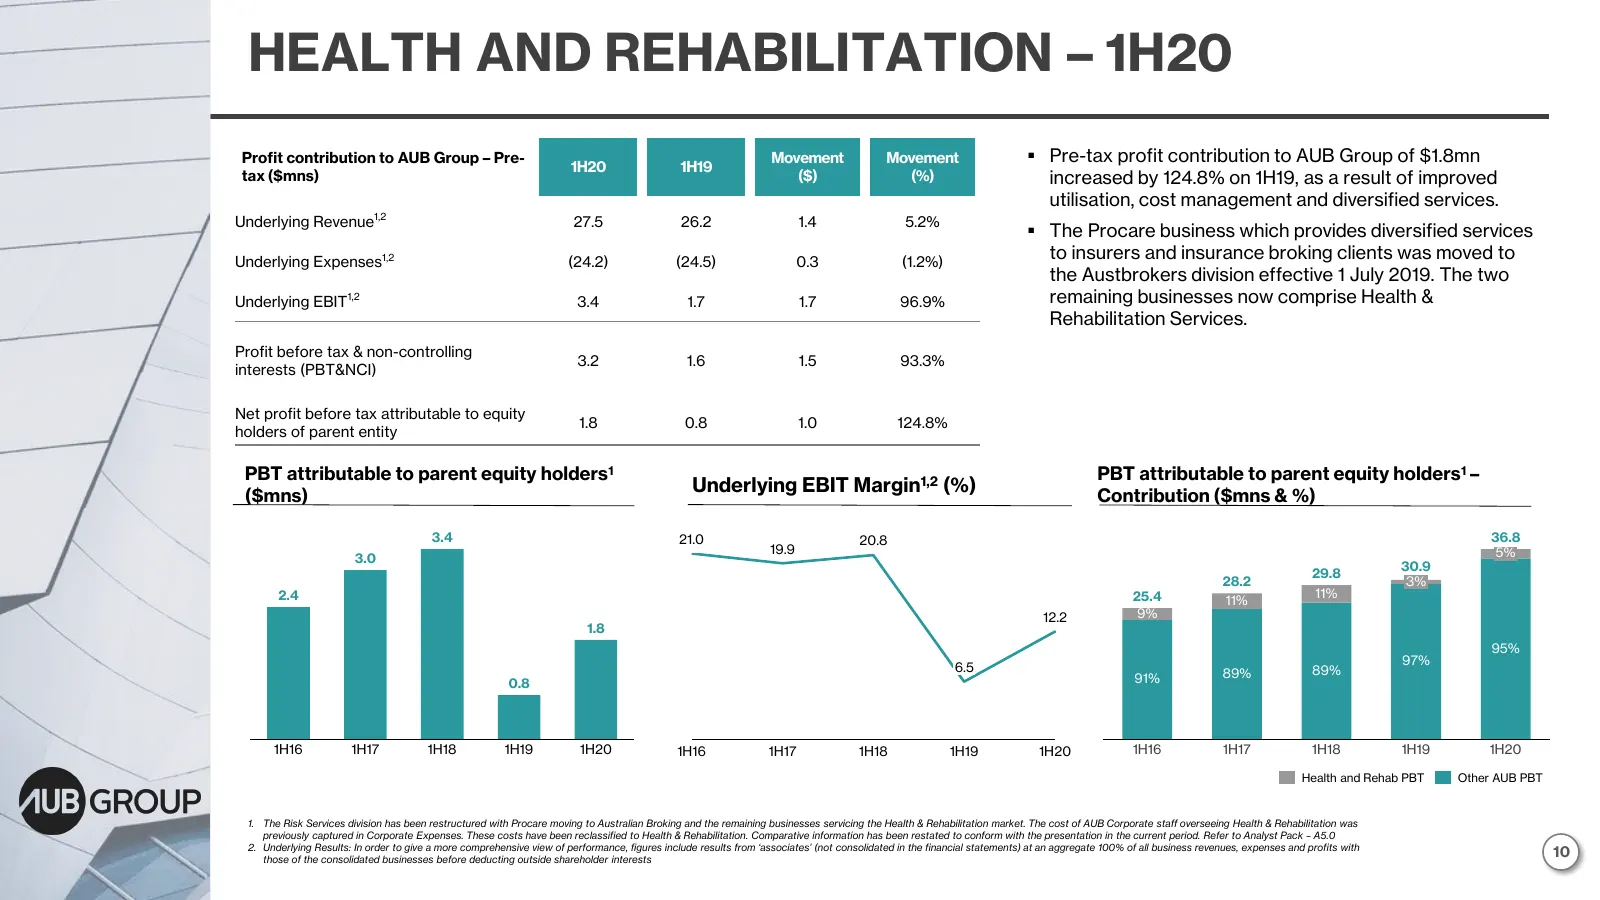
HEALTH AND REHABILITATION – 1H20 Profit contribution to AUB Group – Pre- Movement Movement ▪ Pre-tax profit contribution to AUB Group of $1.8mn 1H20 1H19 tax ($mns) ($) (%) increased by 124.8% on 1H19, as a result of improved utilisation, cost management and diversified services. Underlying Revenue1
Slide 11: Strong Balance Sheet and Capital Position
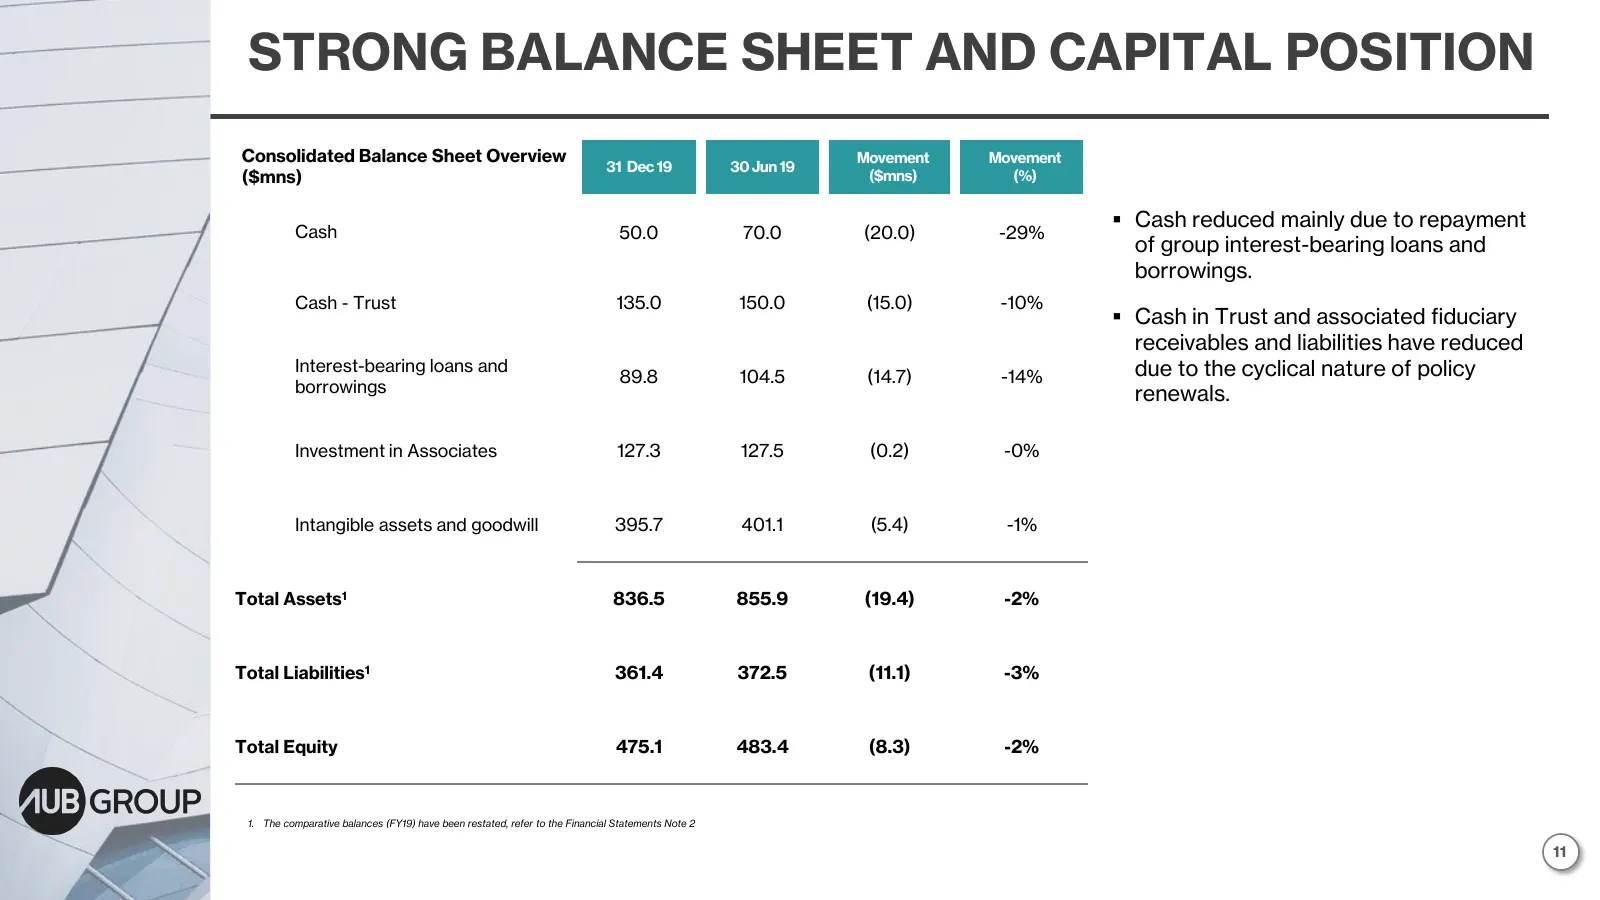
STRONG BALANCE SHEET AND CAPITAL POSITION Consolidated Balance Sheet Overview Movement Movement 31 Dec 19 30 Jun 19 ($mns) ($mns) (%) ▪ Cash reduced mainly due to repayment Cash 50.0 70.0 (20.0) -29% of group interest-bearing loans and borrowings. Cash - Trust 135.0 150.0 (15.0) -10% ▪ Cash in Trust
Slide 12: Group Debt
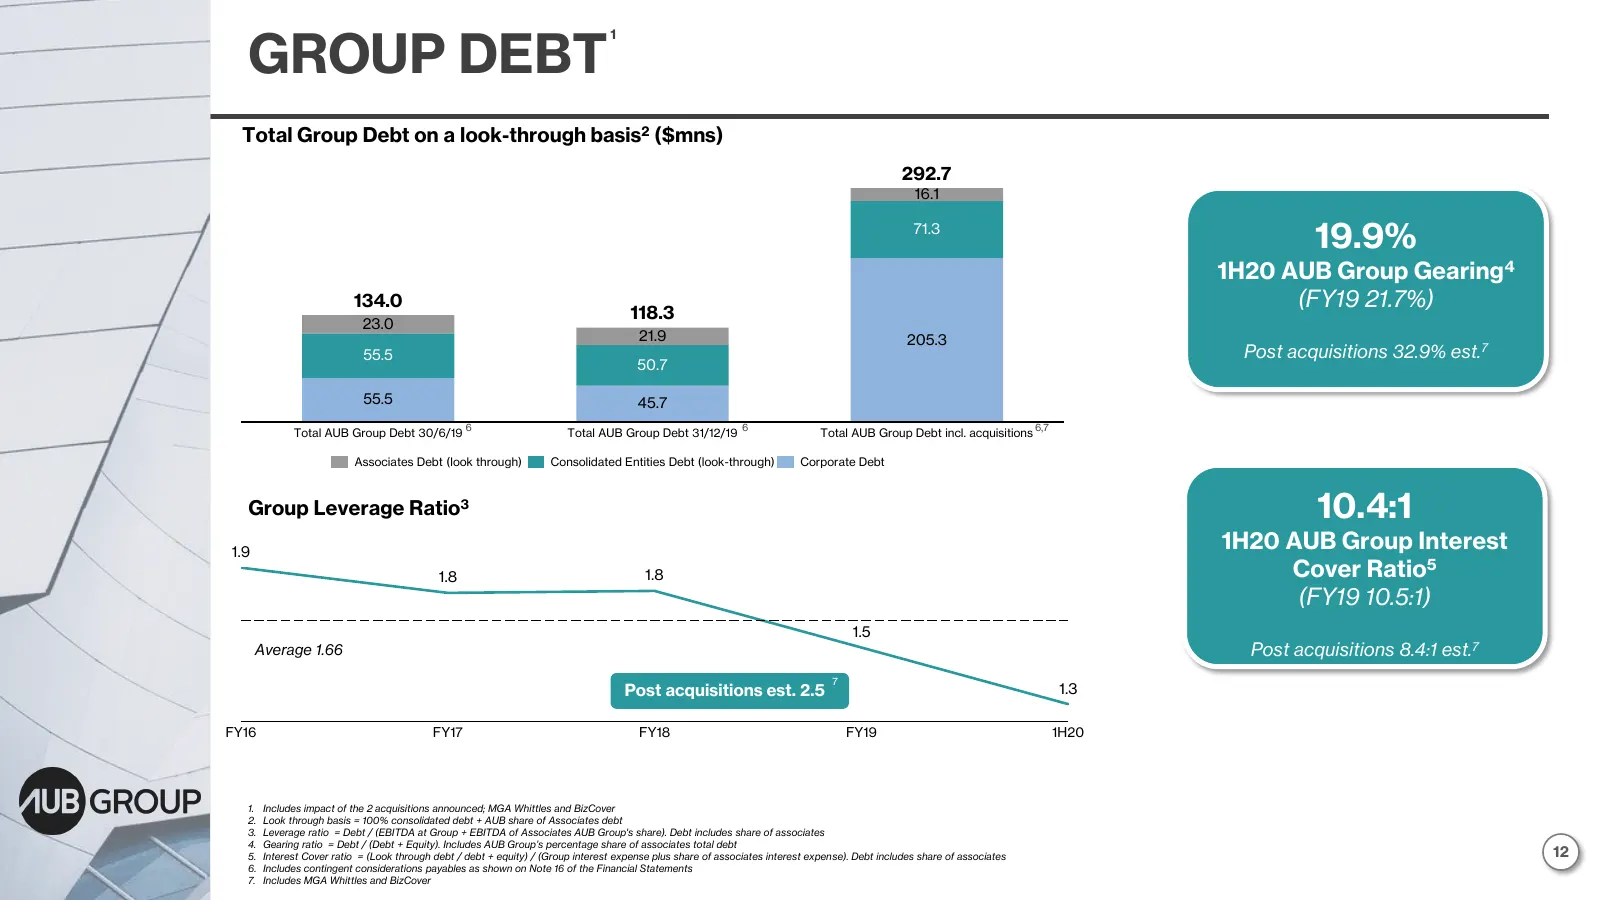
GROUP DEBT 1 Total Group Debt on a look-through basis2 ($mns) 292.7 16.1 71.3 19.9% 1H20 AUB Group Gearing4 134.0 (FY19 21.7%) 118.3 23.0 21.9 205.3 55.5 Post acquisitions 32.9% est.7 50.7 7 55.5 45.7 6 6 Total AUB Group Debt 30/6/19 Total AUB Group Debt 31/12/19 Total AUB Group Debt incl. acquisiti

Slide 13: B. Major Acquisitions
1H20 Results Presentation . B. Major Acquisitions © 2020 AUB Group Limited
Slide 14: MGA Whittles – Transaction Summary
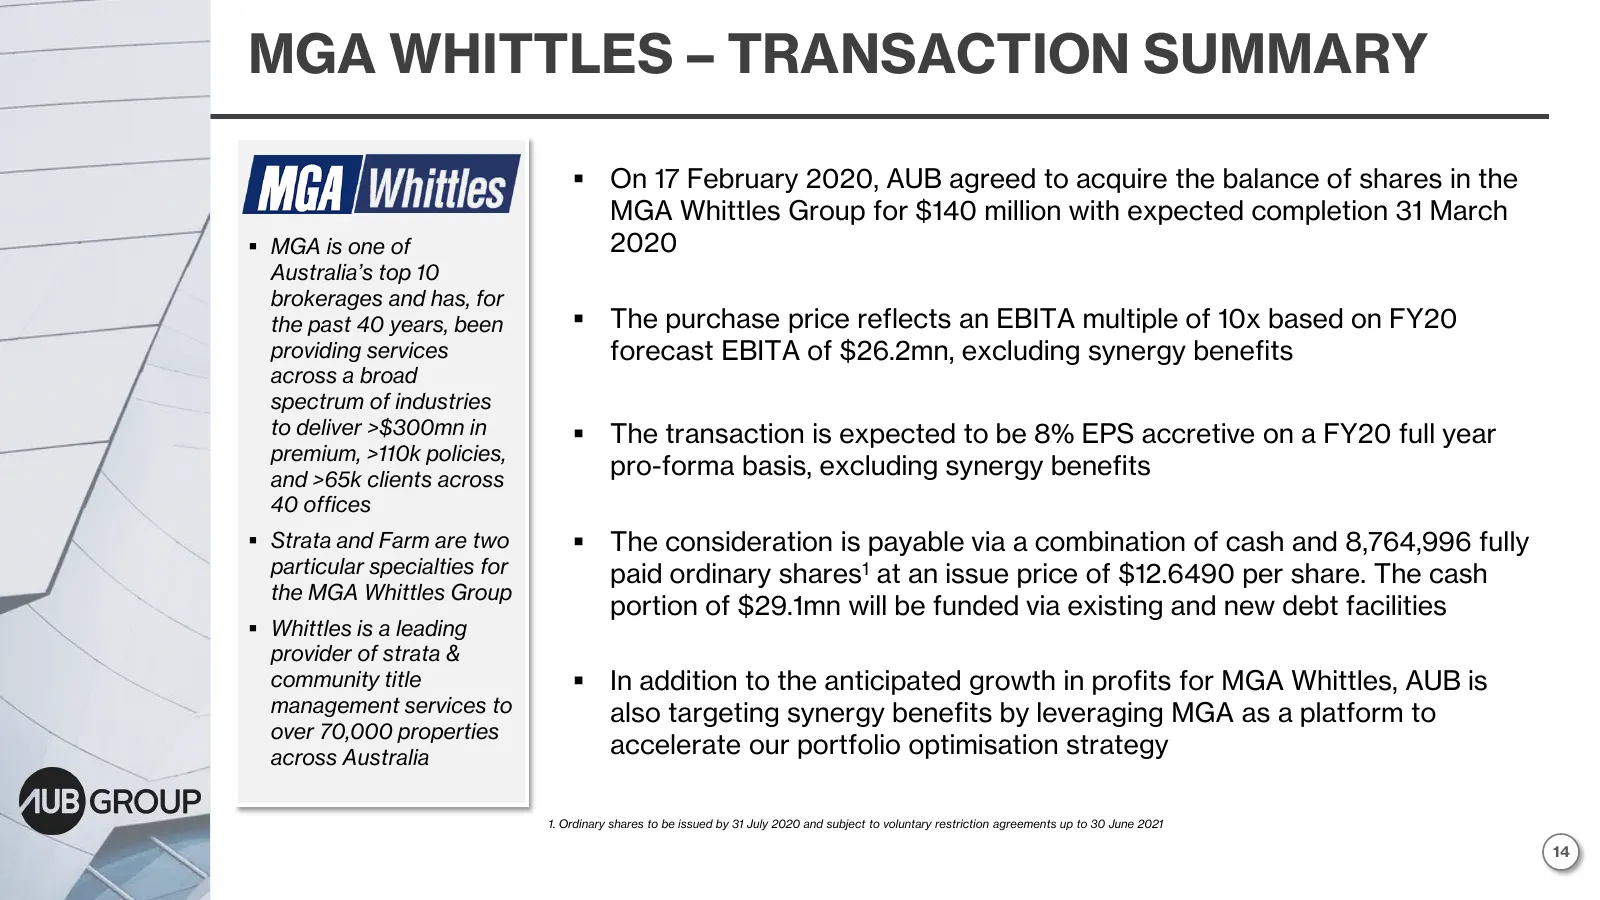
MGA WHITTLES – TRANSACTION SUMMARY ▪ On 17 February 2020, AUB agreed to acquire the balance of shares in the MGA Whittles Group for $140 million with expected completion 31 March ▪ MGA is one of 2020 Australia’s top 10 brokerages and has, for the past 40 years, been ▪ The purchase price reflects an
Slide 15: MGA Whittles – Business Overview
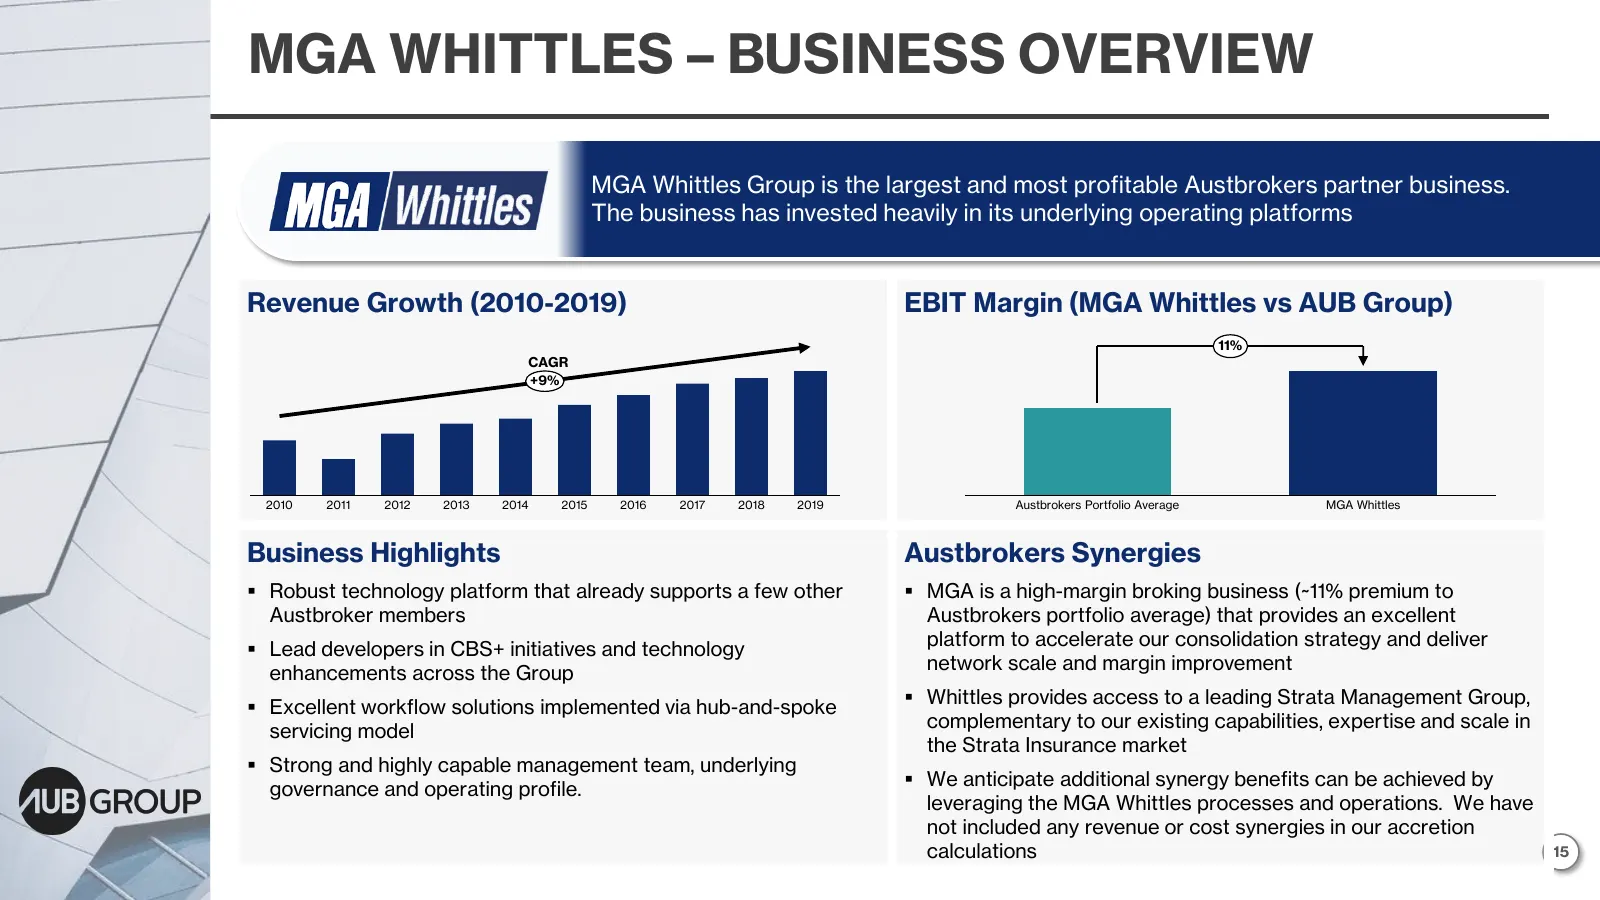
MGA WHITTLES – BUSINESS OVERVIEW MGA Whittles Group is the largest and most profitable Austbrokers partner business. The business has invested heavily in its underlying operating platforms Revenue Growth (2010-2019) EBIT Margin (MGA Whittles vs AUB Group) 11% CAGR +9% 2010 2011 2012 2013 2014 2015 2
Slide 16: BizCover – Transaction Summary
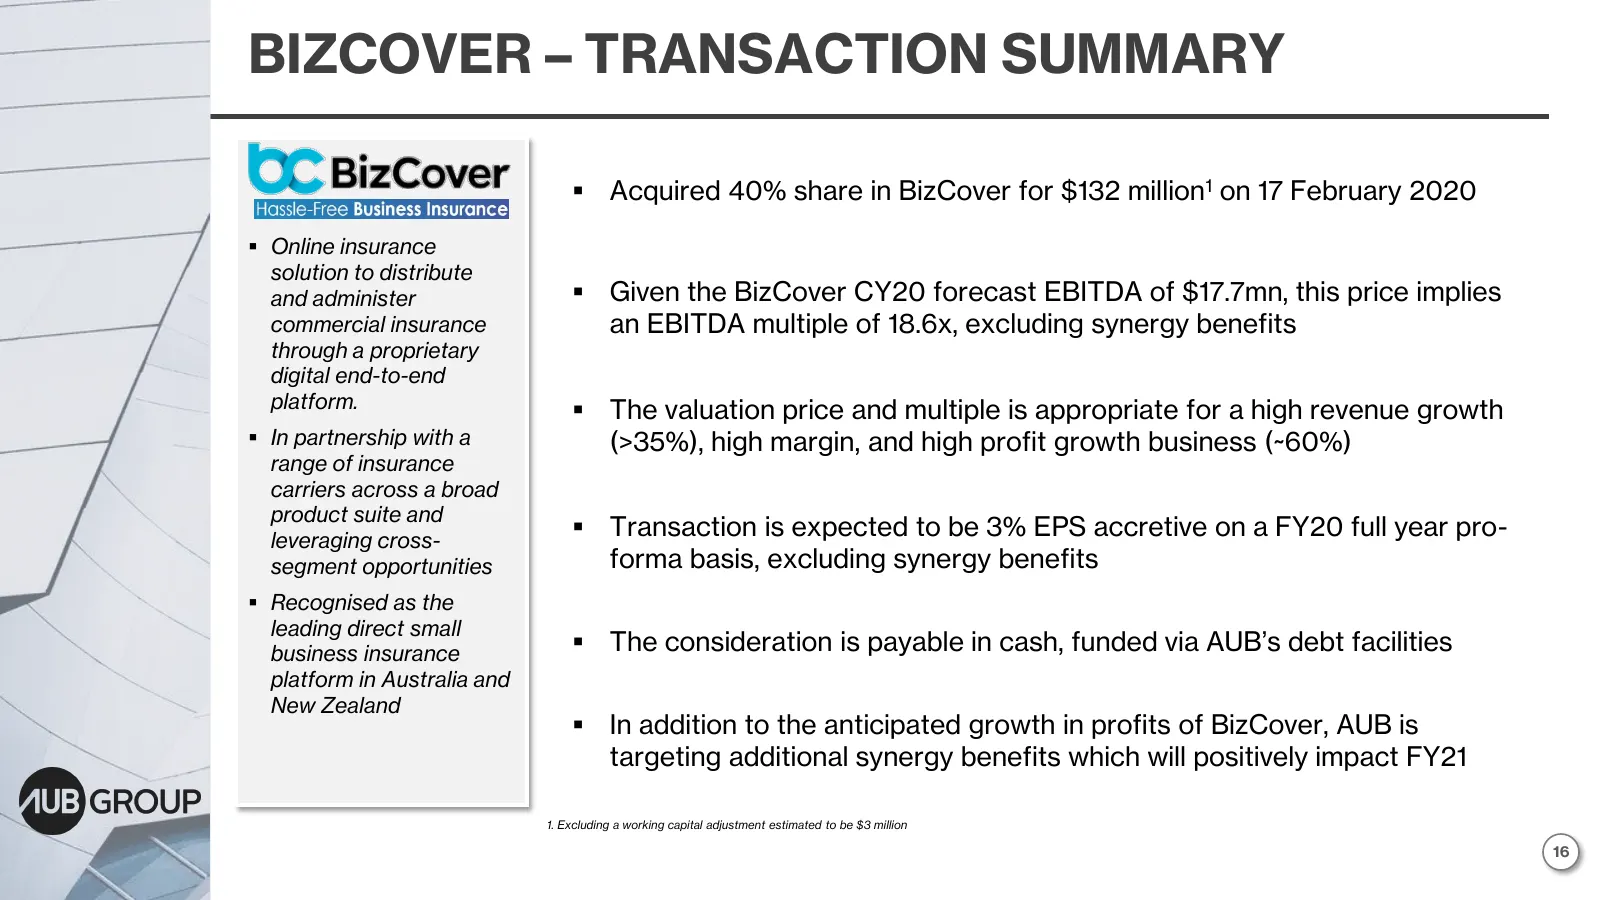
BIZCOVER – TRANSACTION SUMMARY ▪ Acquired 40% share in BizCover for $132 million1 on 17 February 2020 ▪ Online insurance solution to distribute and administer ▪ Given the BizCover CY20 forecast EBITDA of $17.7mn, this price implies commercial insurance an EBITDA multiple of 18.6x, excluding synergy
Slide 17: BizCover – Business Overview
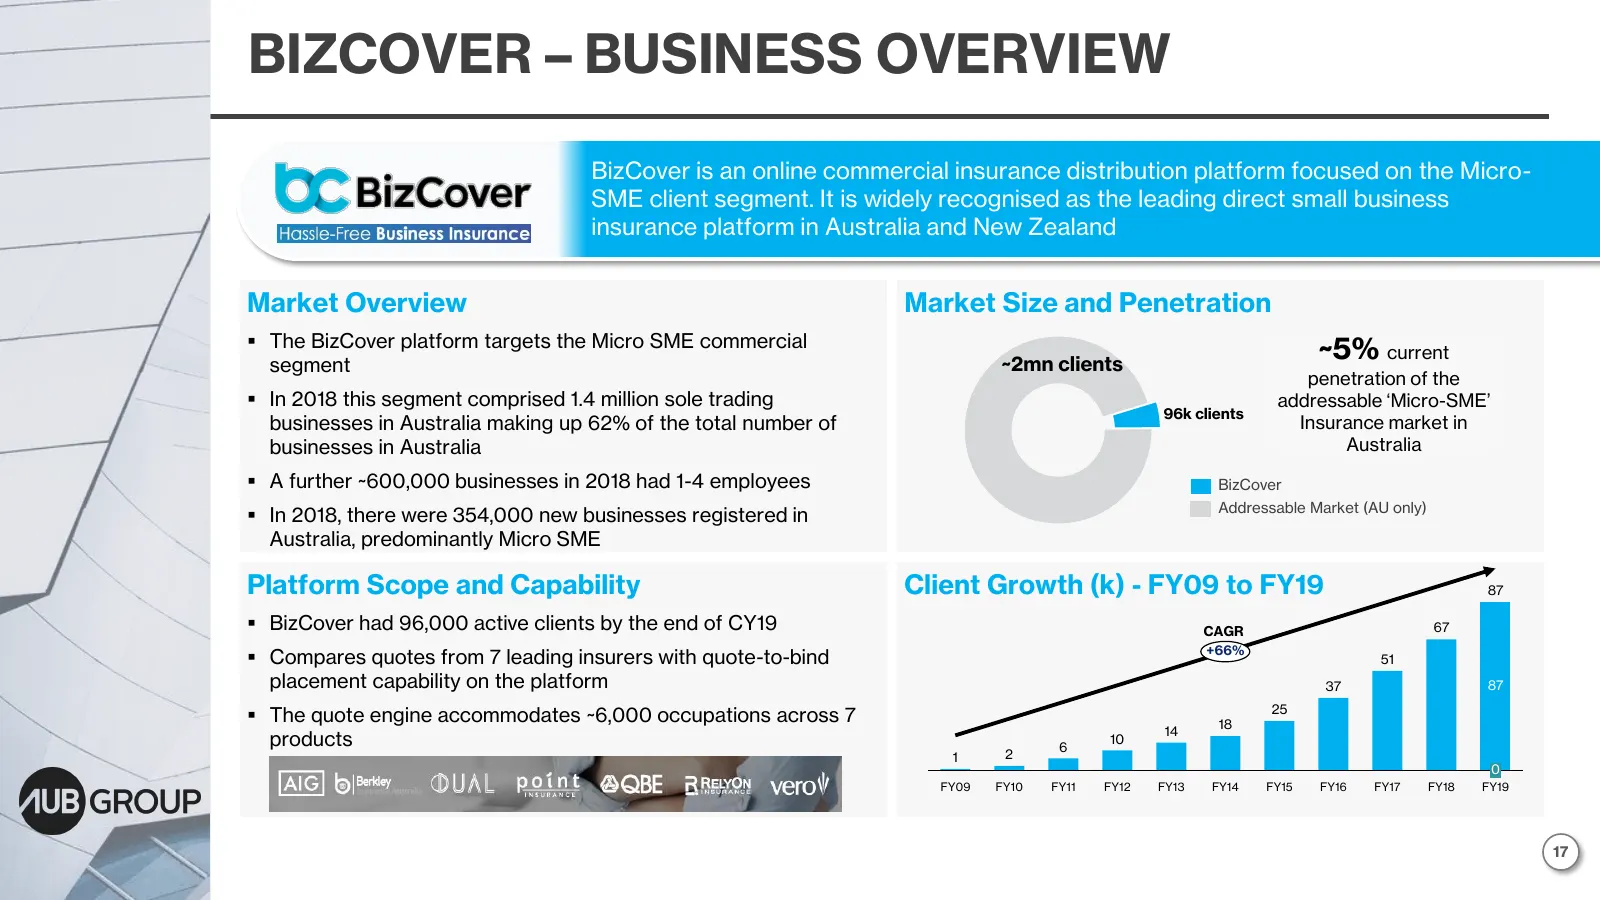
BIZCOVER – BUSINESS OVERVIEW BizCover is an online commercial insurance distribution platform focused on the Micro- SME client segment. It is widely recognised as the leading direct small business insurance platform in Australia and New Zealand Market Overview Market Size and Penetration ▪ The BizCo
Slide 18: BizCover – Strategic Rationale
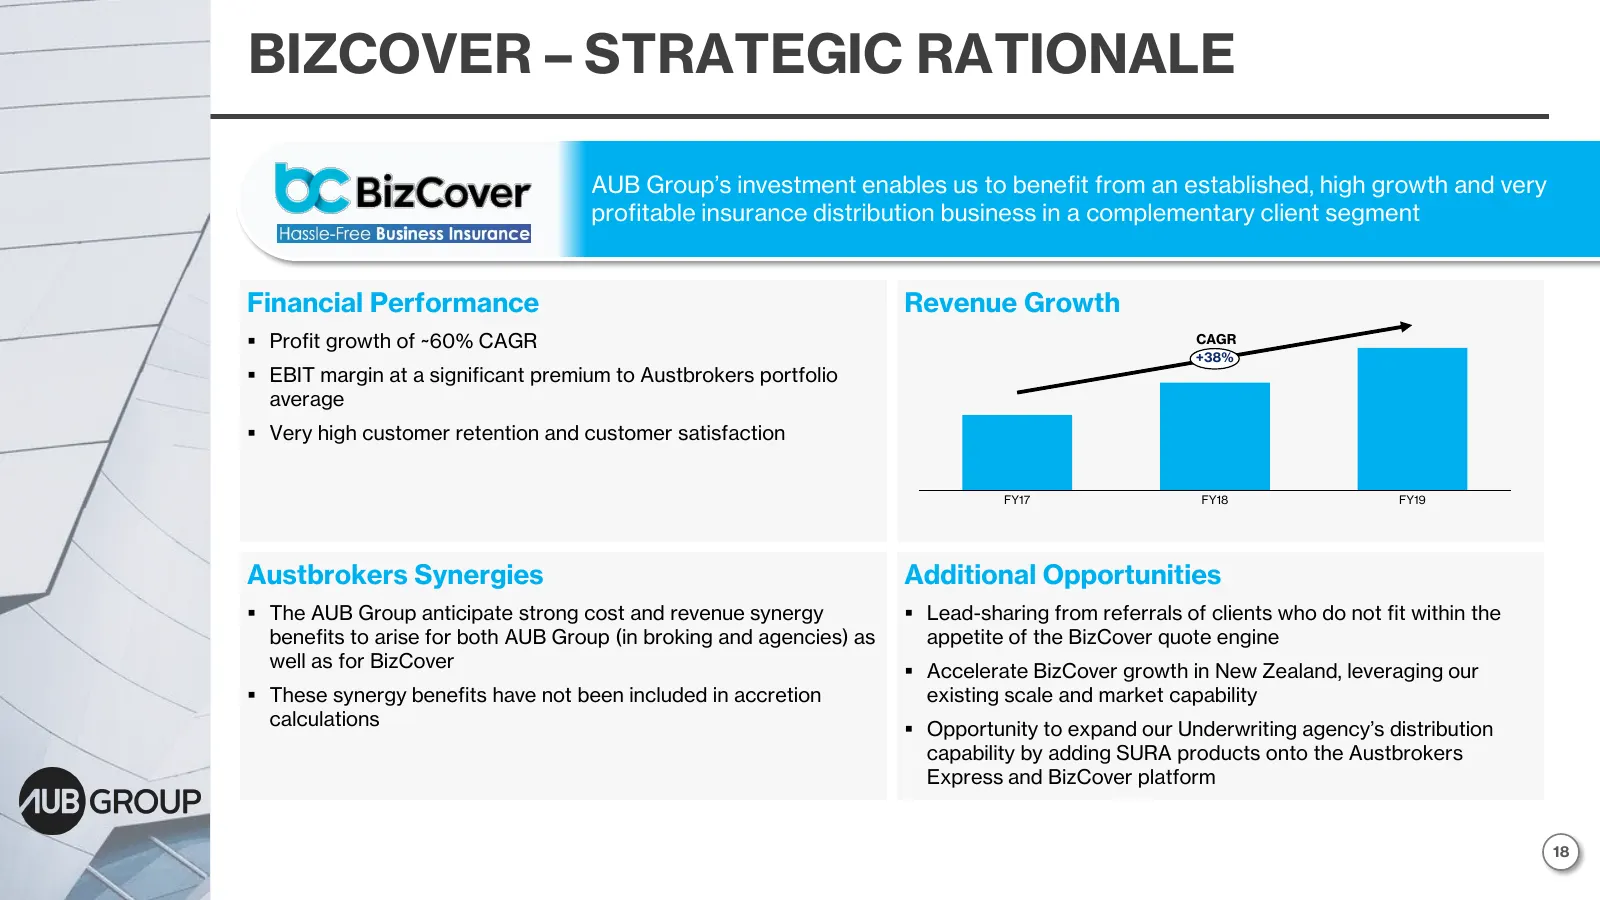
BIZCOVER – STRATEGIC RATIONALE AUB Group’s investment enables us to benefit from an established, high growth and very profitable insurance distribution business in a complementary client segment Financial Performance Revenue Growth ▪ Profit growth of ~60% CAGR CAGR +38% ▪ EBIT margin at a significan

Slide 19: C. Update on Execution Priorities
1H20 Results Presentation . C. Update on Execution Priorities © 2020 AUB Group Limited
Slide 20: Execution Priorities Update
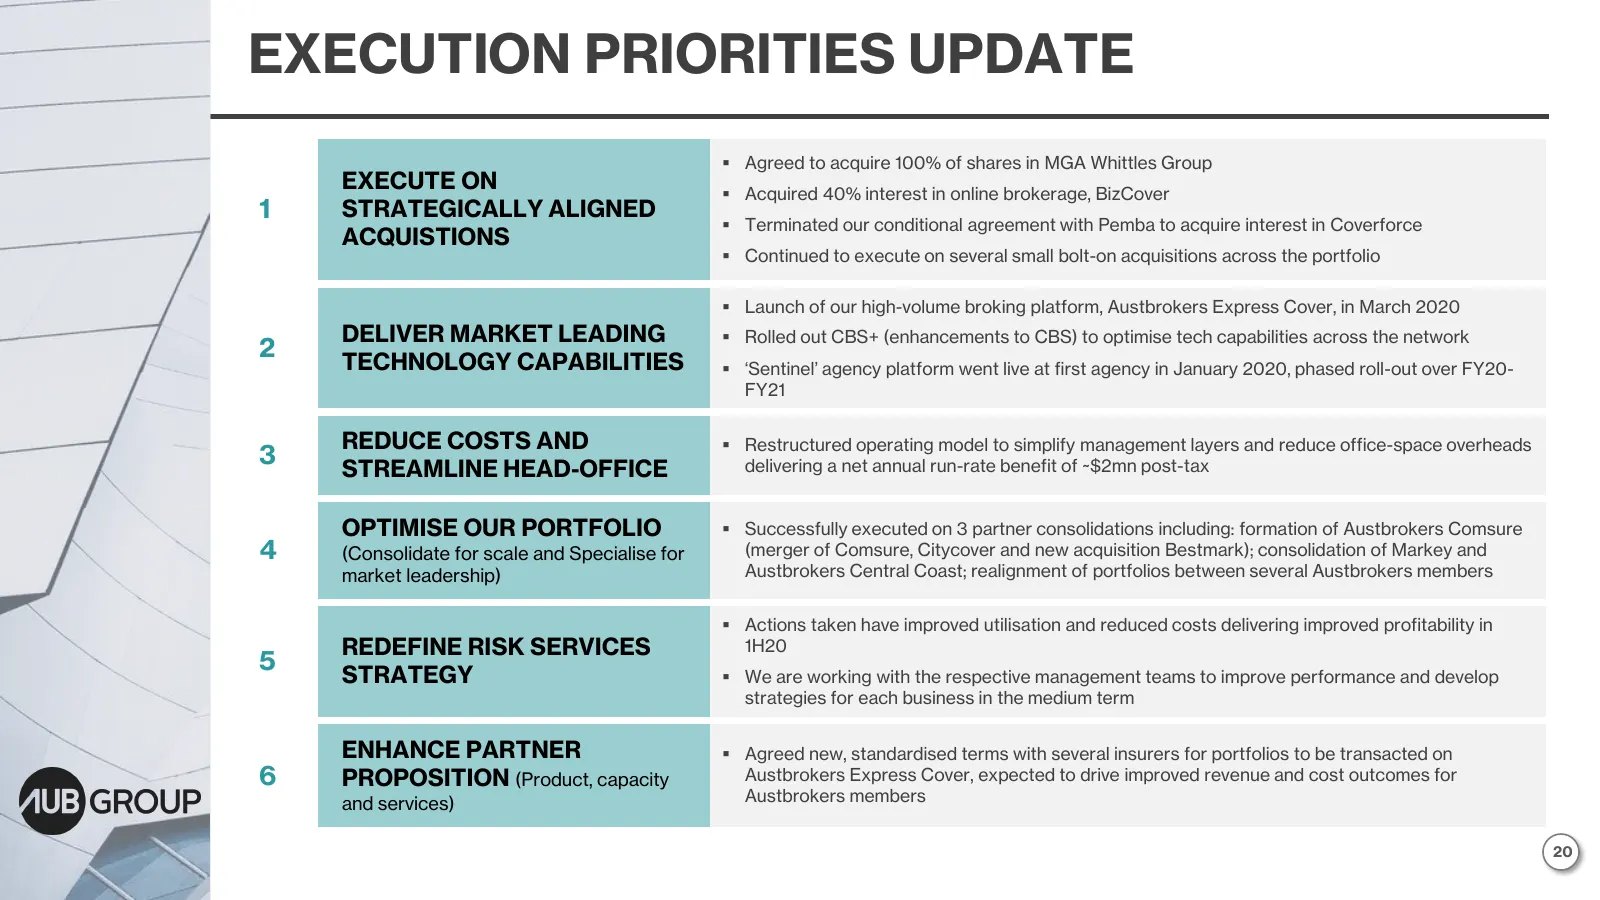
EXECUTION PRIORITIES UPDATE ▪ Agreed to acquire 100% of shares in MGA Whittles Group EXECUTE ON ▪ Acquired 40% interest in online brokerage, BizCover 1 STRATEGICALLY ALIGNED ▪ Terminated our conditional agreement with Pemba to acquire interest in Coverforce ACQUISTIONS ▪ Continued to execute on seve
Slide 21: Q4FY20 Launch: Austbrokers Express Cover
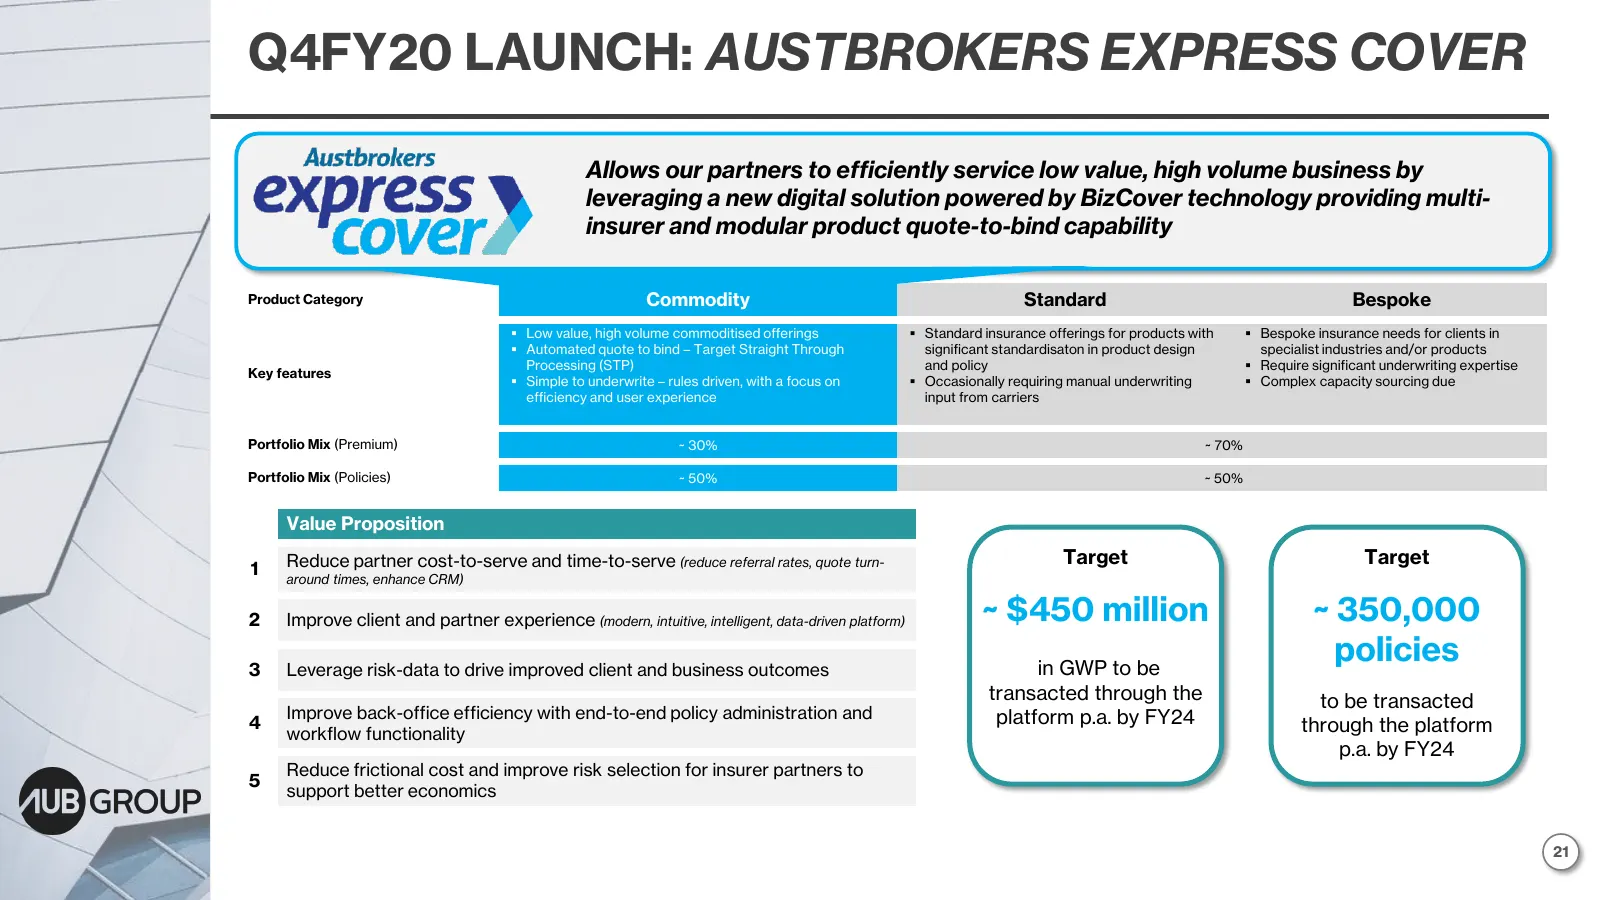
Q4FY20 LAUNCH: AUSTBROKERS EXPRESS COVER Allows our partners to efficiently service low value, high volume business by leveraging a new digital solution powered by BizCover technology providing multi- insurer and modular product quote-to-bind capability Product Category Commodity Standard Bespoke ▪

Slide 22: D. FY20 Guidance
1H20 Results Presentation . D. FY20 Guidance © 2020 AUB Group Limited
Slide 23: FY20 Guidance Upgraded
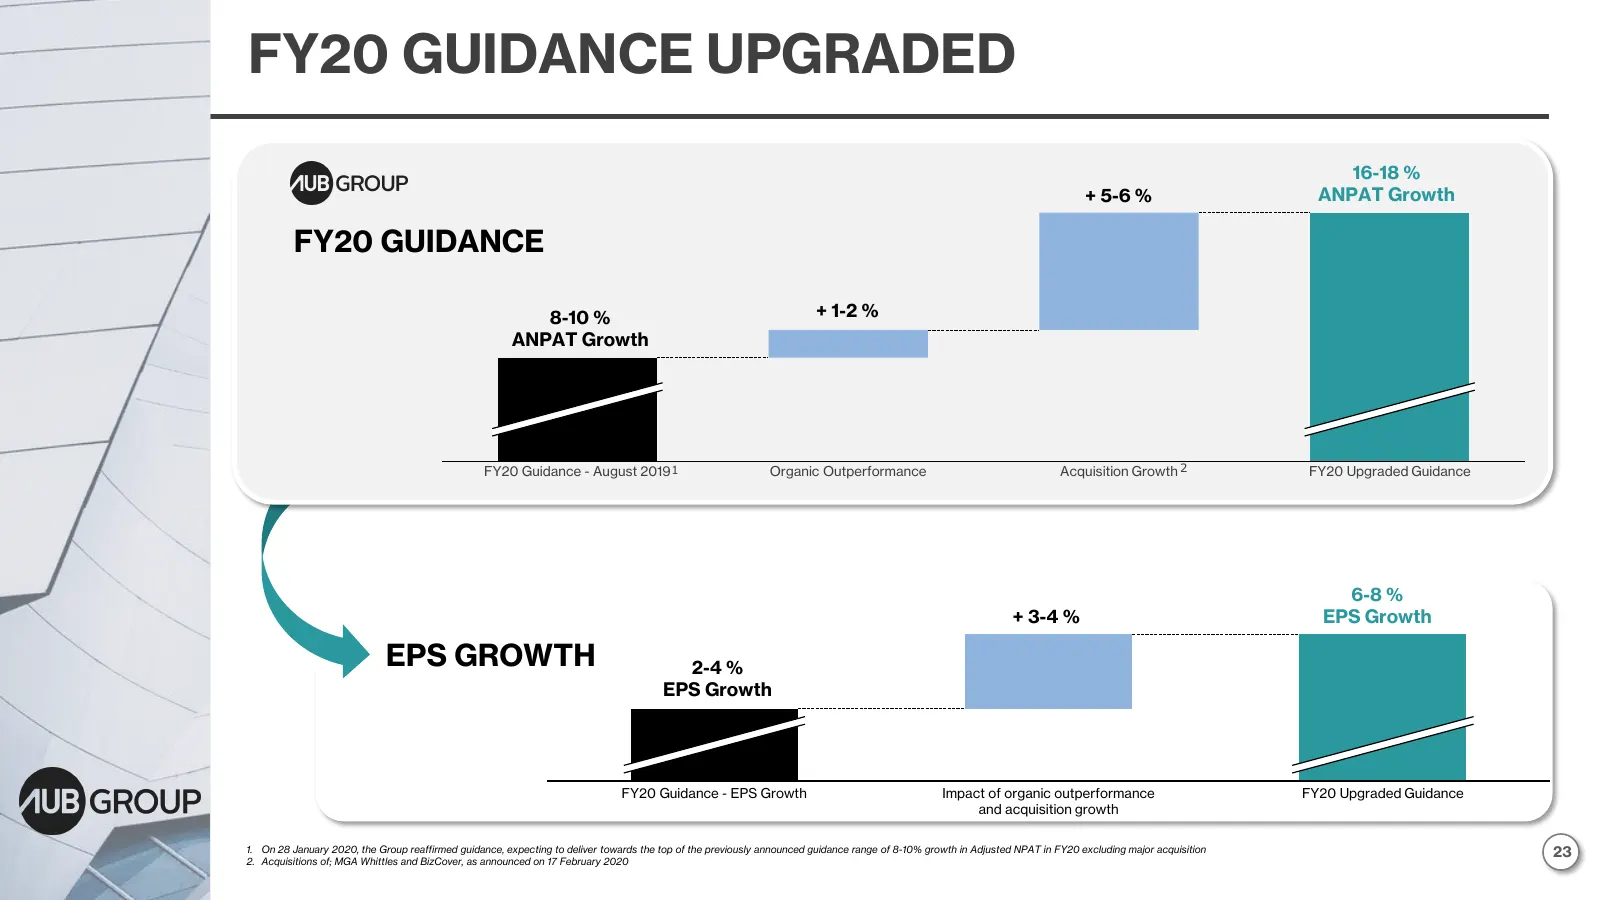
FY20 GUIDANCE UPGRADED 16-18 % + 5-6 % ANPAT Growth FY20 GUIDANCE 8-10 % + 1-2 % ANPAT Growth FY20 Guidance - August 2019 1 Organic Outperformance Acquisition Growth 2 FY20 Upgraded Guidance 6-8 % + 3-4 % EPS Growth EPS GROWTH 2-4 % EPS Growth FY20 Guidance - EPS Growth Impact of organic outperforma
Slide 24: FY20 Guidance Overview
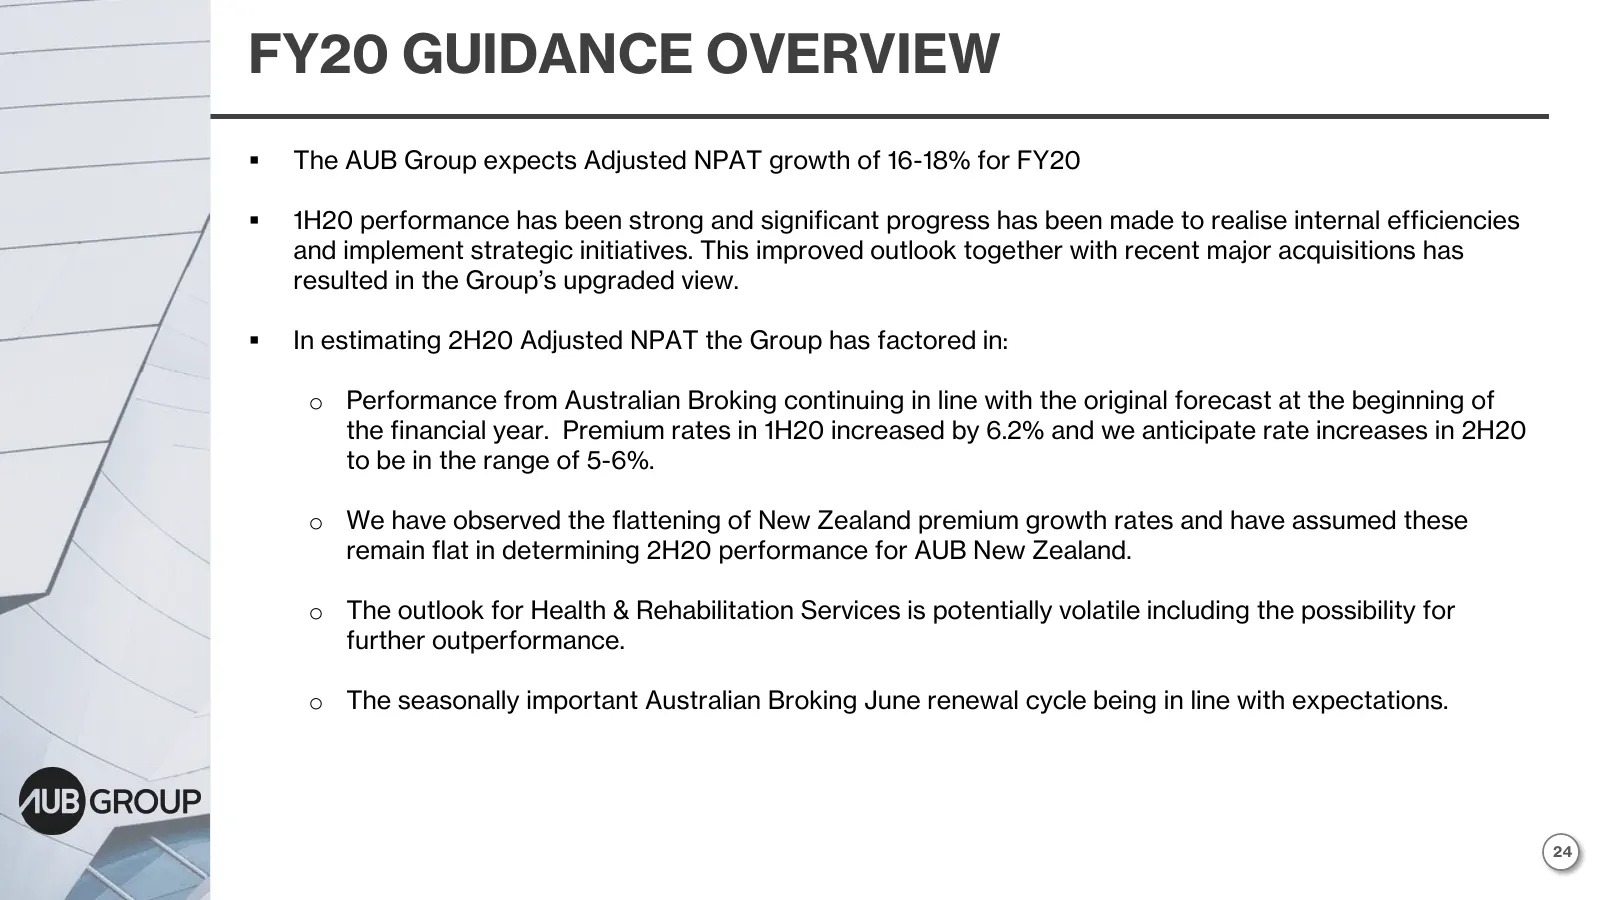
FY20 GUIDANCE OVERVIEW ▪ The AUB Group expects Adjusted NPAT growth of 16-18% for FY20 ▪ 1H20 performance has been strong and significant progress has been made to realise internal efficiencies and implement strategic initiatives. This improved outlook together with recent major acquisitions has res
Slide 25: E. Closing
1H20 Results Presentation . E. Closing © 2020 AUB Group Limited
Slide 26: Enhancing AUB Group's Earnings Potential
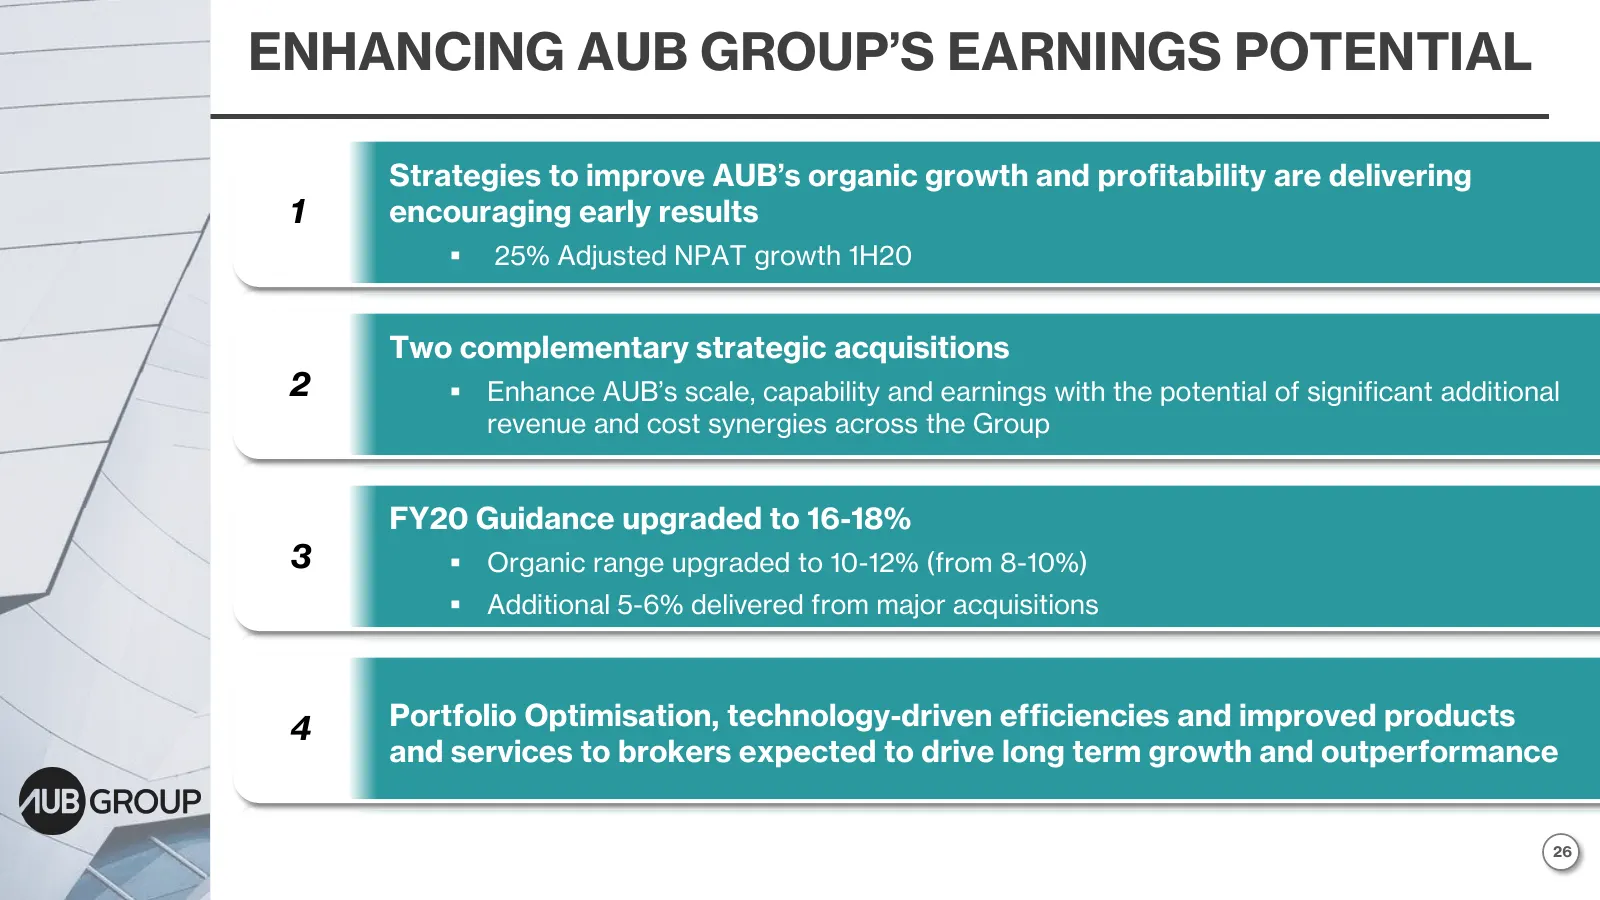
ENHANCING AUB GROUP’S EARNINGS POTENTIAL Strategies to improve AUB’s organic growth and profitability are delivering 1 encouraging early results ▪ 25% Adjusted NPAT growth 1H20 Two complementary strategic acquisitions 2 ▪ Enhance AUB’s scale, capability and earnings with the potential of significant

Slide 27: Questions
Questions Mike Emmett CEO and Managing Director Mark Shanahan CFO © 2020 AUB Group Limited

Slide 28: Thank You
Thank You © 2020 AUB Group Limited
Slide 29: Notice
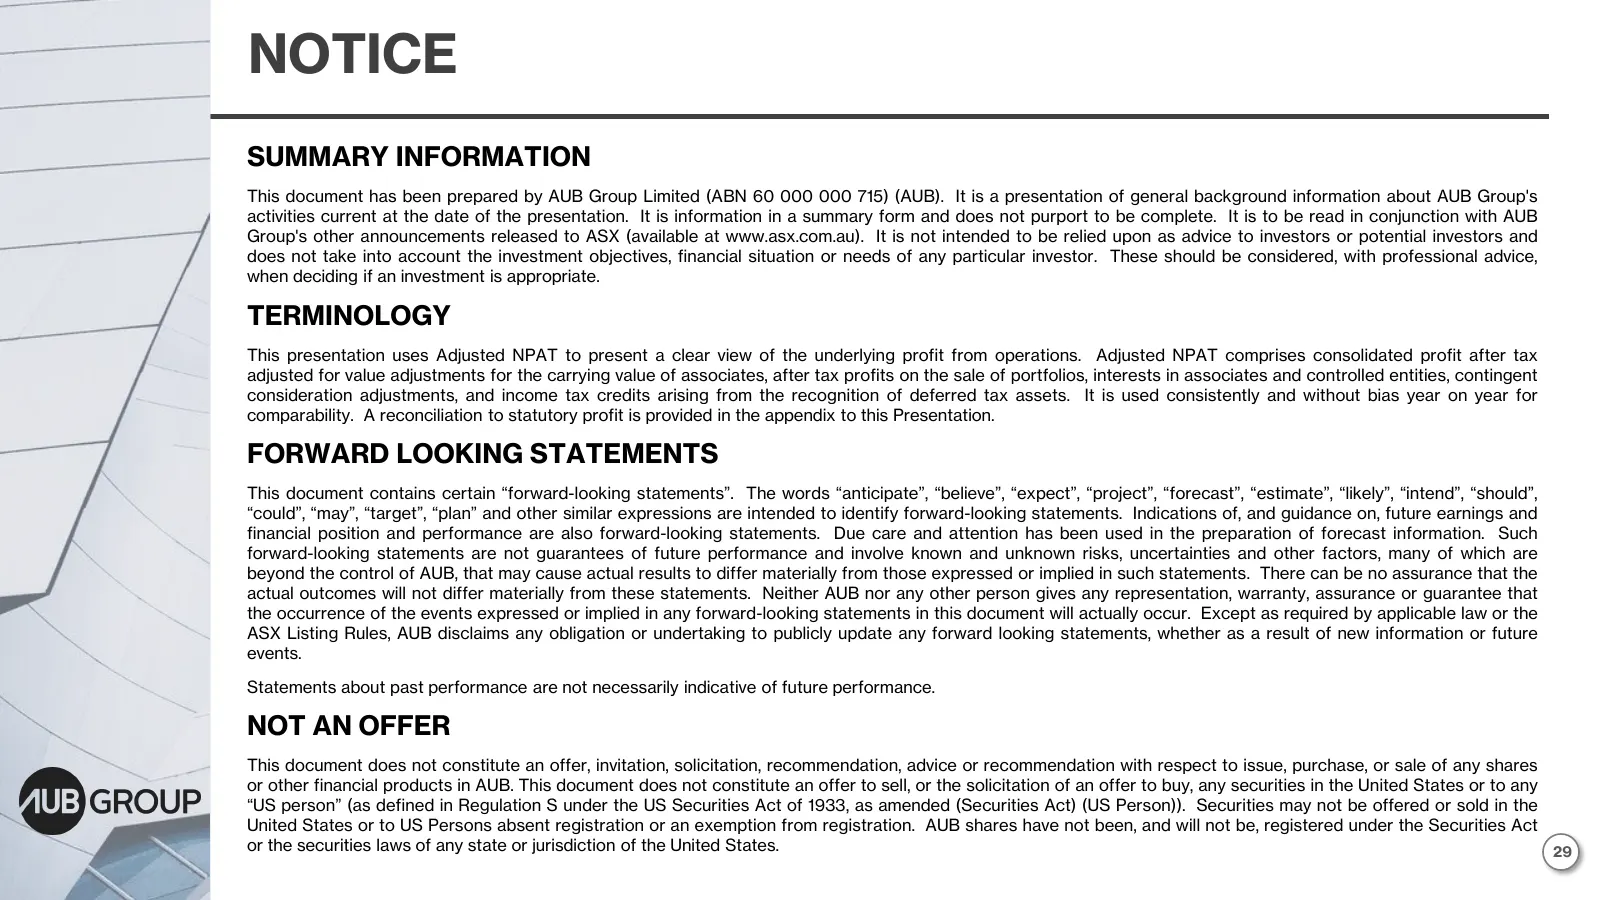
NOTICE SUMMARY INFORMATION This document has been prepared by AUB Group Limited (ABN 60 000 000 715) (AUB). It is a presentation of general background information about AUB Group's activities current at the date of the presentation. It is information in a summary form and does not purport to be comp
Source: Internet Archive copy of aubgroup.com.au
More decks from AUB Group Limited
 Shareholder Meeting (November 2026)11 slides · Nov 12, 2026
 FY2026 Earnings Presentation59 slides · Aug 25, 2026
 H1 2026 Earnings Presentation45 slides · Feb 24, 2026
 Investor Presentation (February 2026)46 slides · Feb 24, 2026
 Merger or Acquisition (January 2026)49 slides · Jan 27, 2026
 Shareholder Meeting (November 2025)14 slides · Nov 13, 2025