Volex plc · LSE:VLX
Volex — H1 2002/03 Earnings Presentation
42 slides from Volex's earnings presentation, November 2002

Slide 1: Interim Results 6 months to September 2002
Volex Group p.l.c. Interim Results 6 months to September 2002
Slide 2: Briefing Agenda
Briefing Agenda 1. Introduction Dom Molloy Chairman 2. First Half Overview John Corcoran Chief Executive 3. Financial Results Ken Hooper Group Finance Director 4. The Future John Corcoran Chief Executive 2 Interim Results 2002/2003 Volex Group plc November 2002
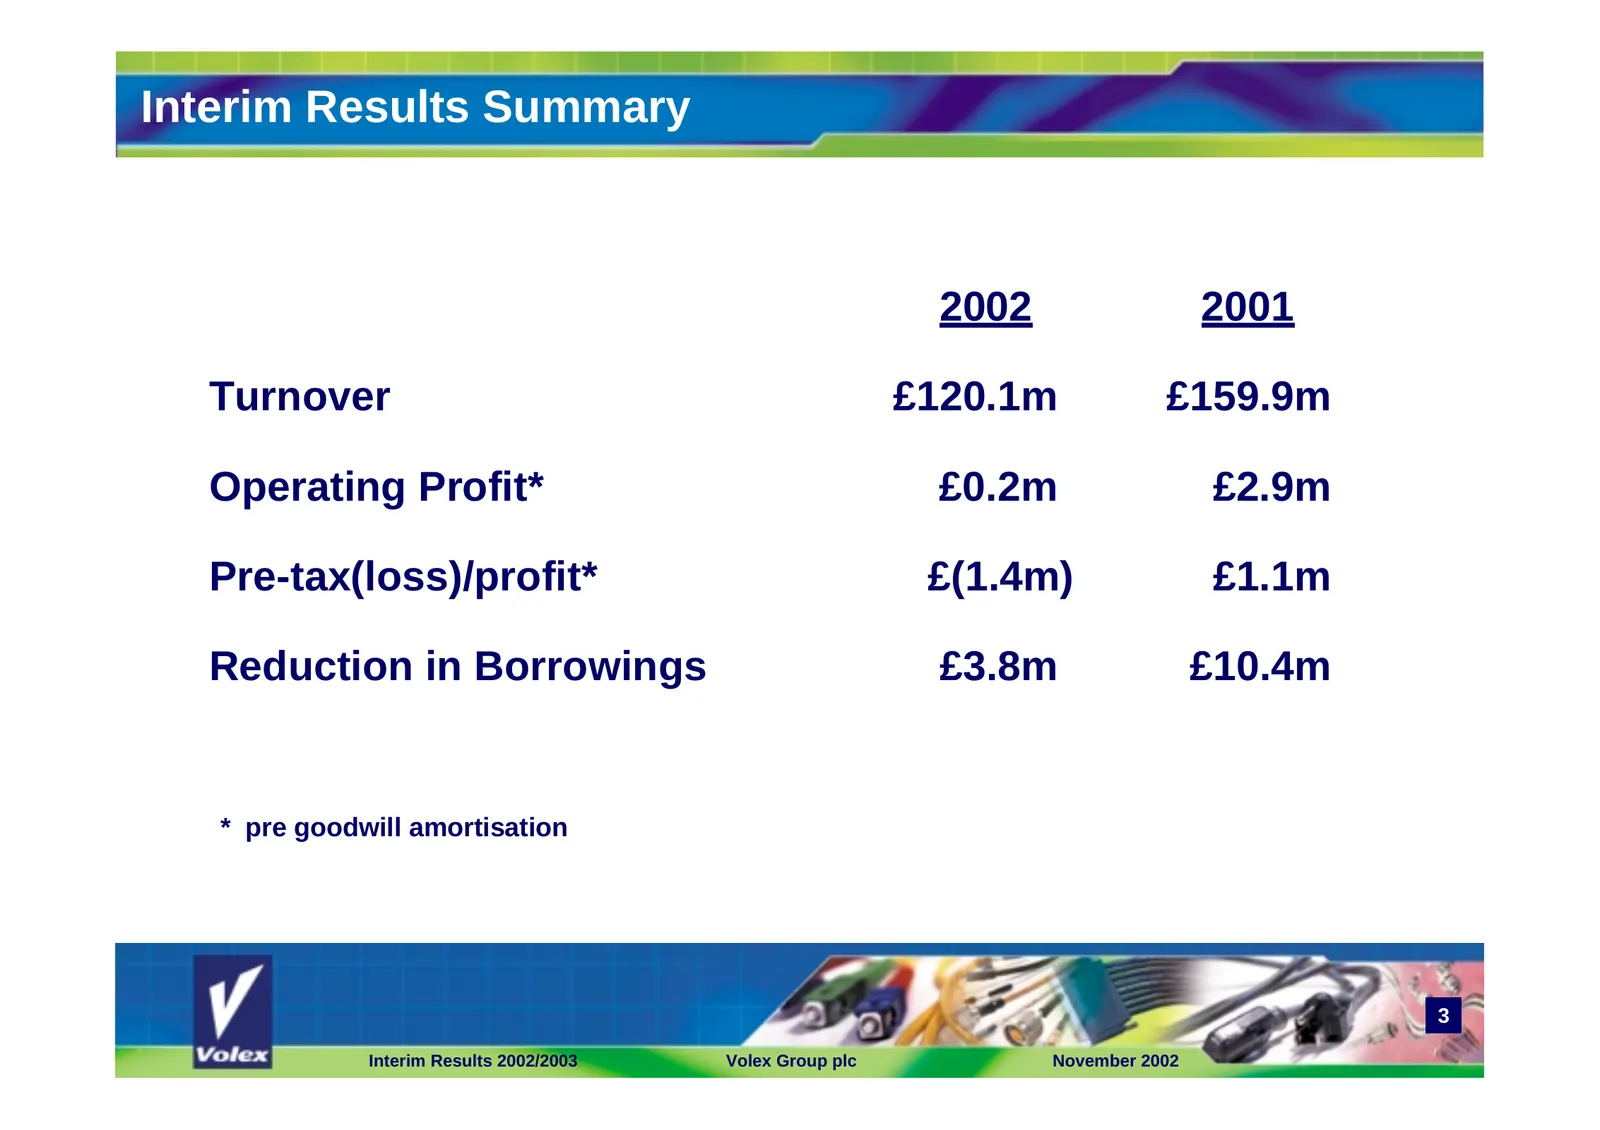
Slide 3: Interim Results Summary
Interim Results Summary 2002 2001 Turnover £120.1m £159.9m Operating Profit* £0.2m £2.9m Pre-tax(loss)/profit* £(1.4m) £1.1m Reduction in Borrowings £3.8m £10.4m * pre goodwill amortisation 3 Interim Results 2002/2003 Volex Group plc November 2002
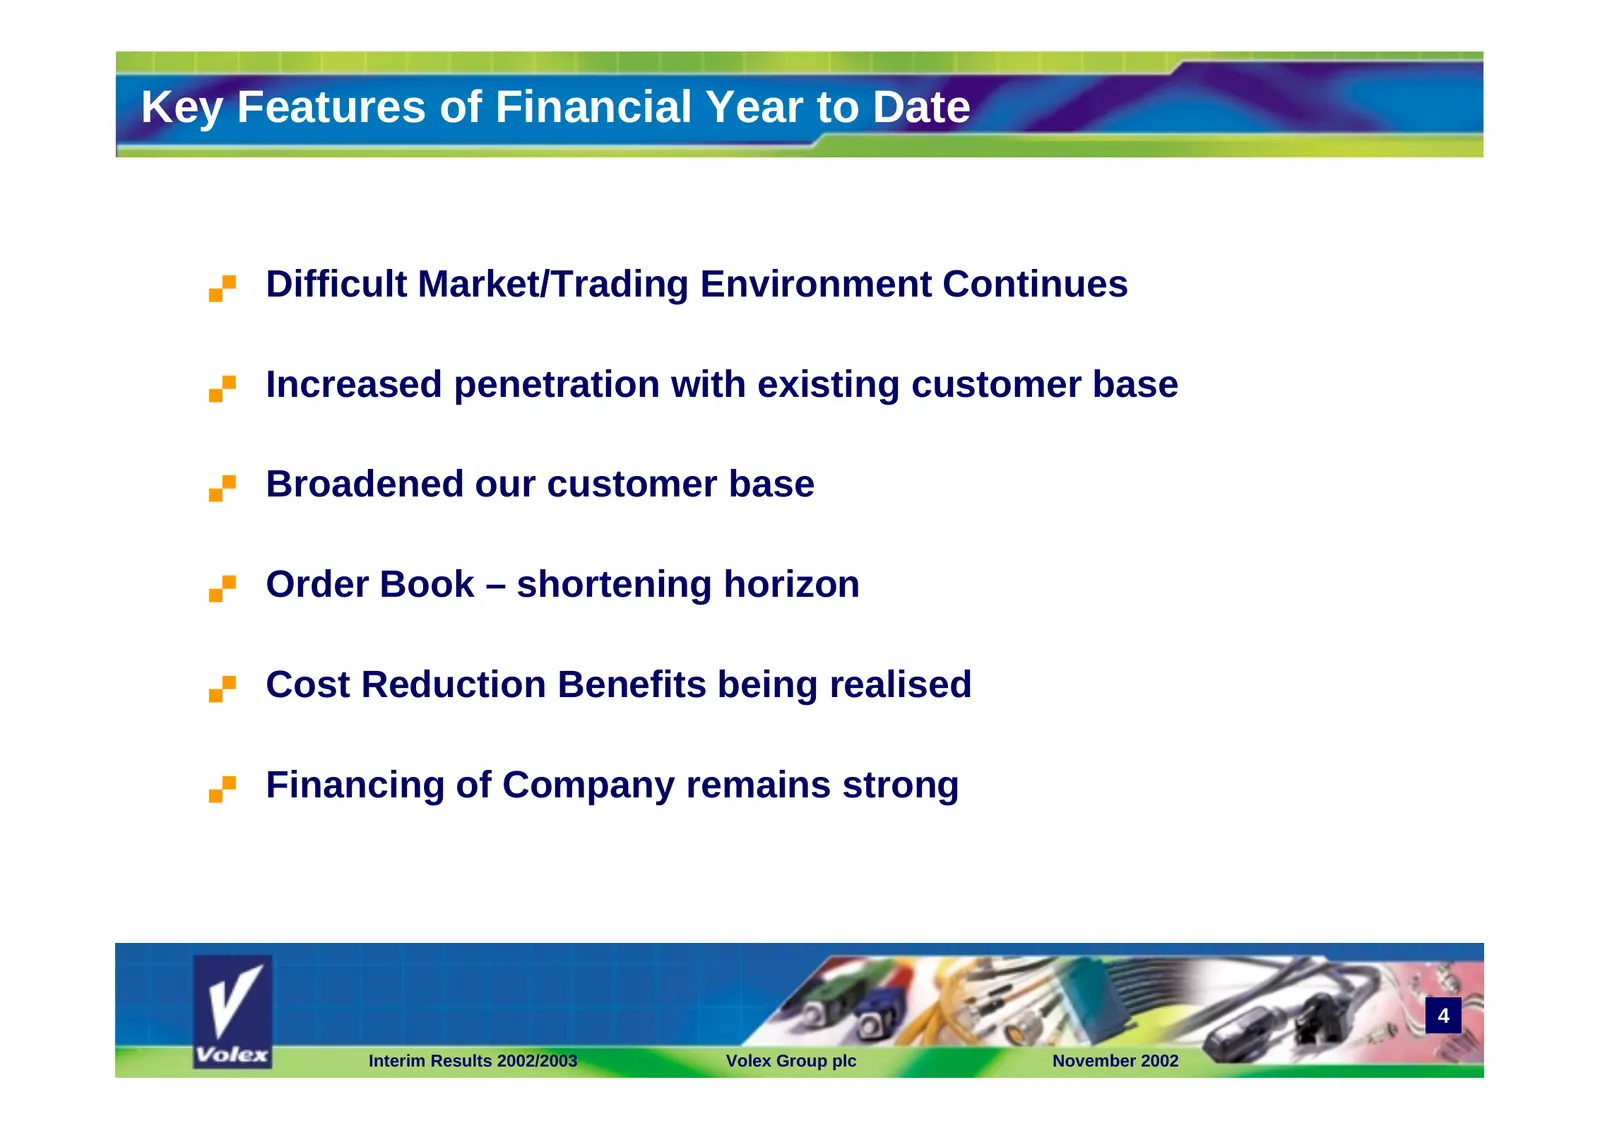
Slide 4: Key Features of Financial Year to Date
Key Features of Financial Year to Date ! Difficult Market/Trading Environment Continues ! Increased penetration with existing customer base ! Broadened our customer base ! Order Book – shortening horizon ! Cost Reduction Benefits being realised ! Financing of Company remains strong 4 Interim Results
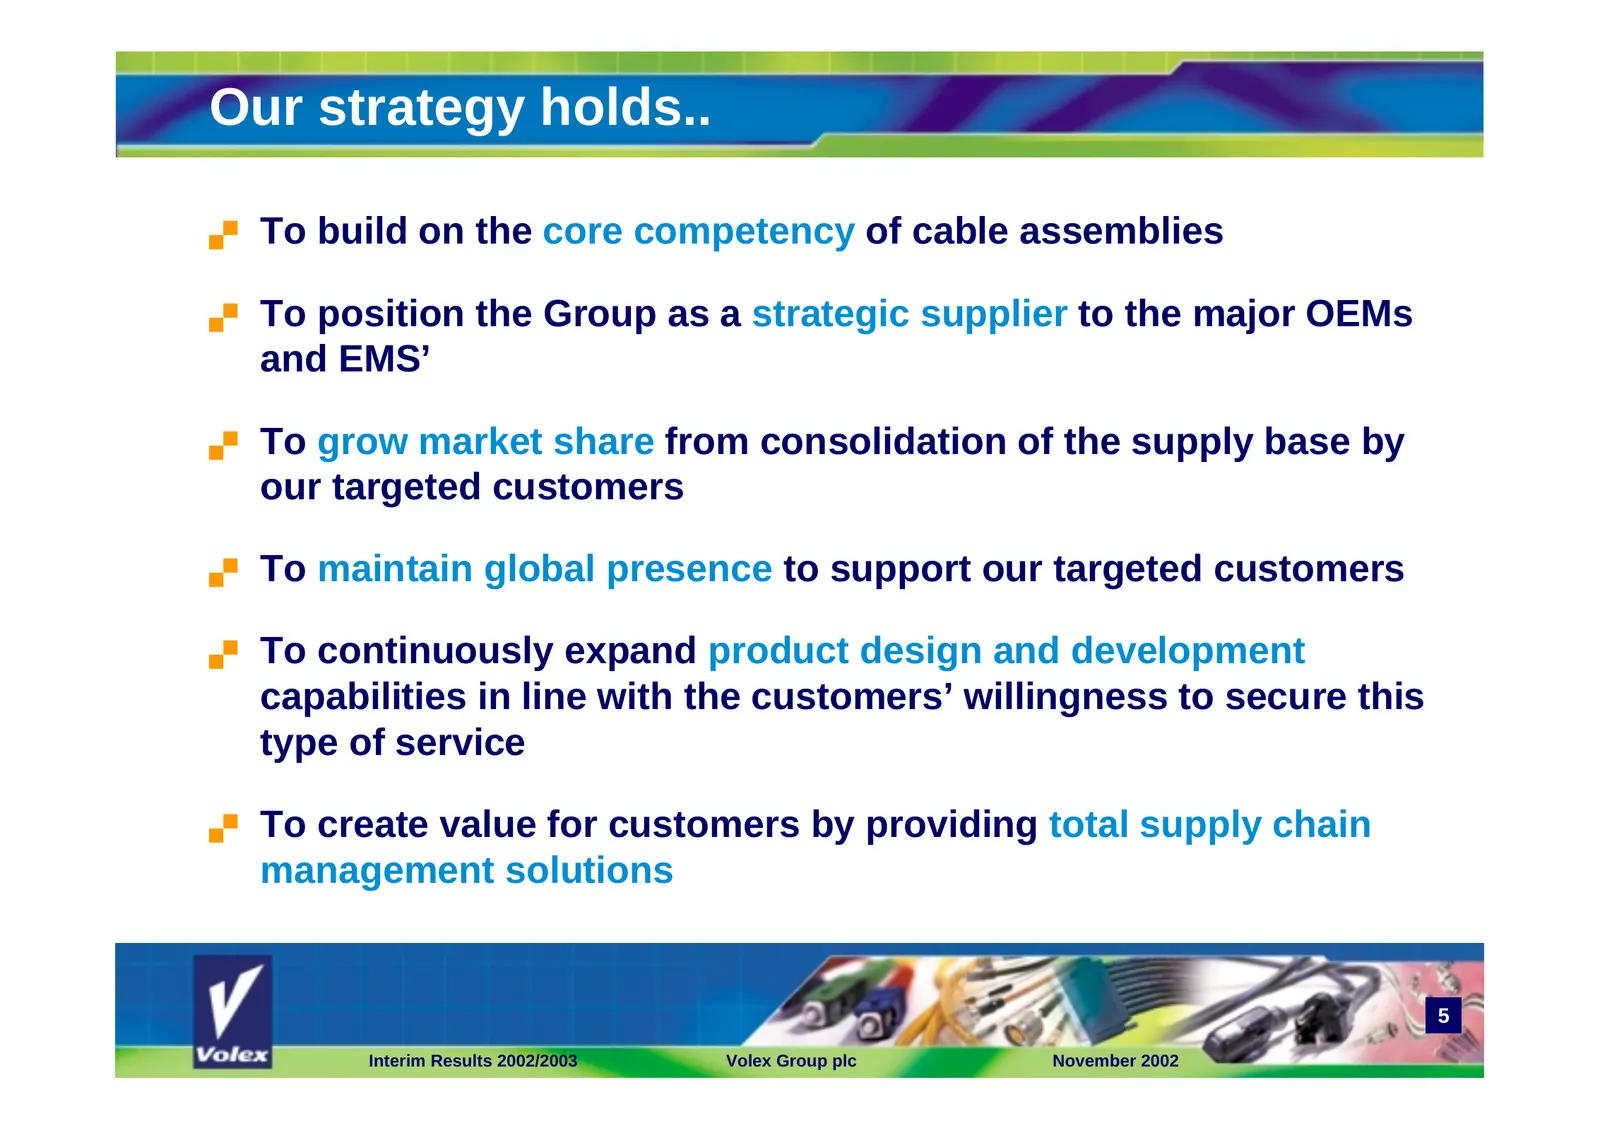
Slide 5: Our strategy holds..
Our strategy holds.. ! To build on the core competency of cable assemblies ! To position the Group as a strategic supplier to the major OEMs and EMS’ ! To grow market share from consolidation of the supply base by our targeted customers ! To maintain global presence to support our targeted customers
Slide 6: The Strategy is Delivering Growth
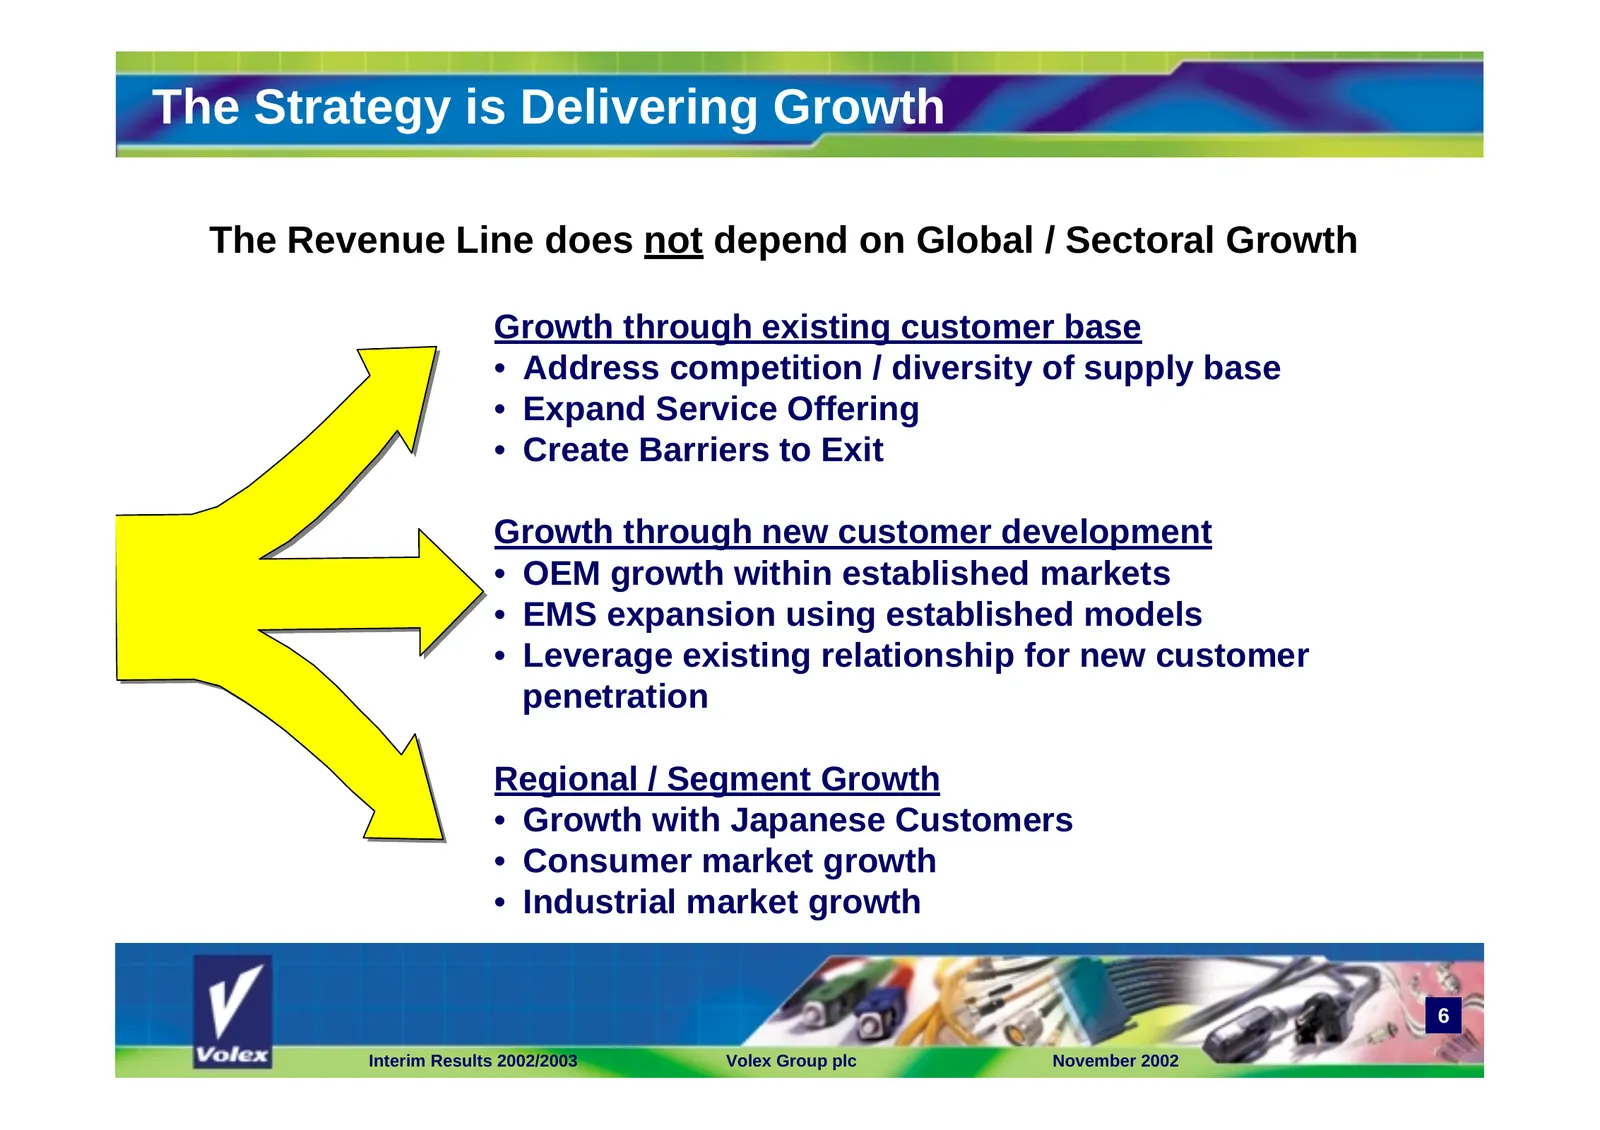
The Strategy is Delivering Growth The Revenue Line does not depend on Global / Sectoral Growth Growth through existing customer base • Address competition / diversity of supply base • Expand Service Offering • Create Barriers to Exit Growth through new customer development • OEM growth within establ
Slide 7: General Market Conditions
General Market Conditions ! Communications Market still depressed – Carrier / Operator Spending restricted and cautious – Further decreases in demand expected at 10-15% – Wireline segment remains weak, some improvement (marginal) expected in Wireless ! Consumer Markets Stable – Spending remains resi
Slide 8: General Market Conditions…contd
General Market Conditions…contd ! Consolidation of customer base continues – OEM / EMS customer base merging and partnering – OEM / EMS migrating to lower cost locations ! Rationalisation of supply base continues – Regional players are being phased out – Global strategic alliances driven with Global
Slide 9: Analysis by Segment / Customer
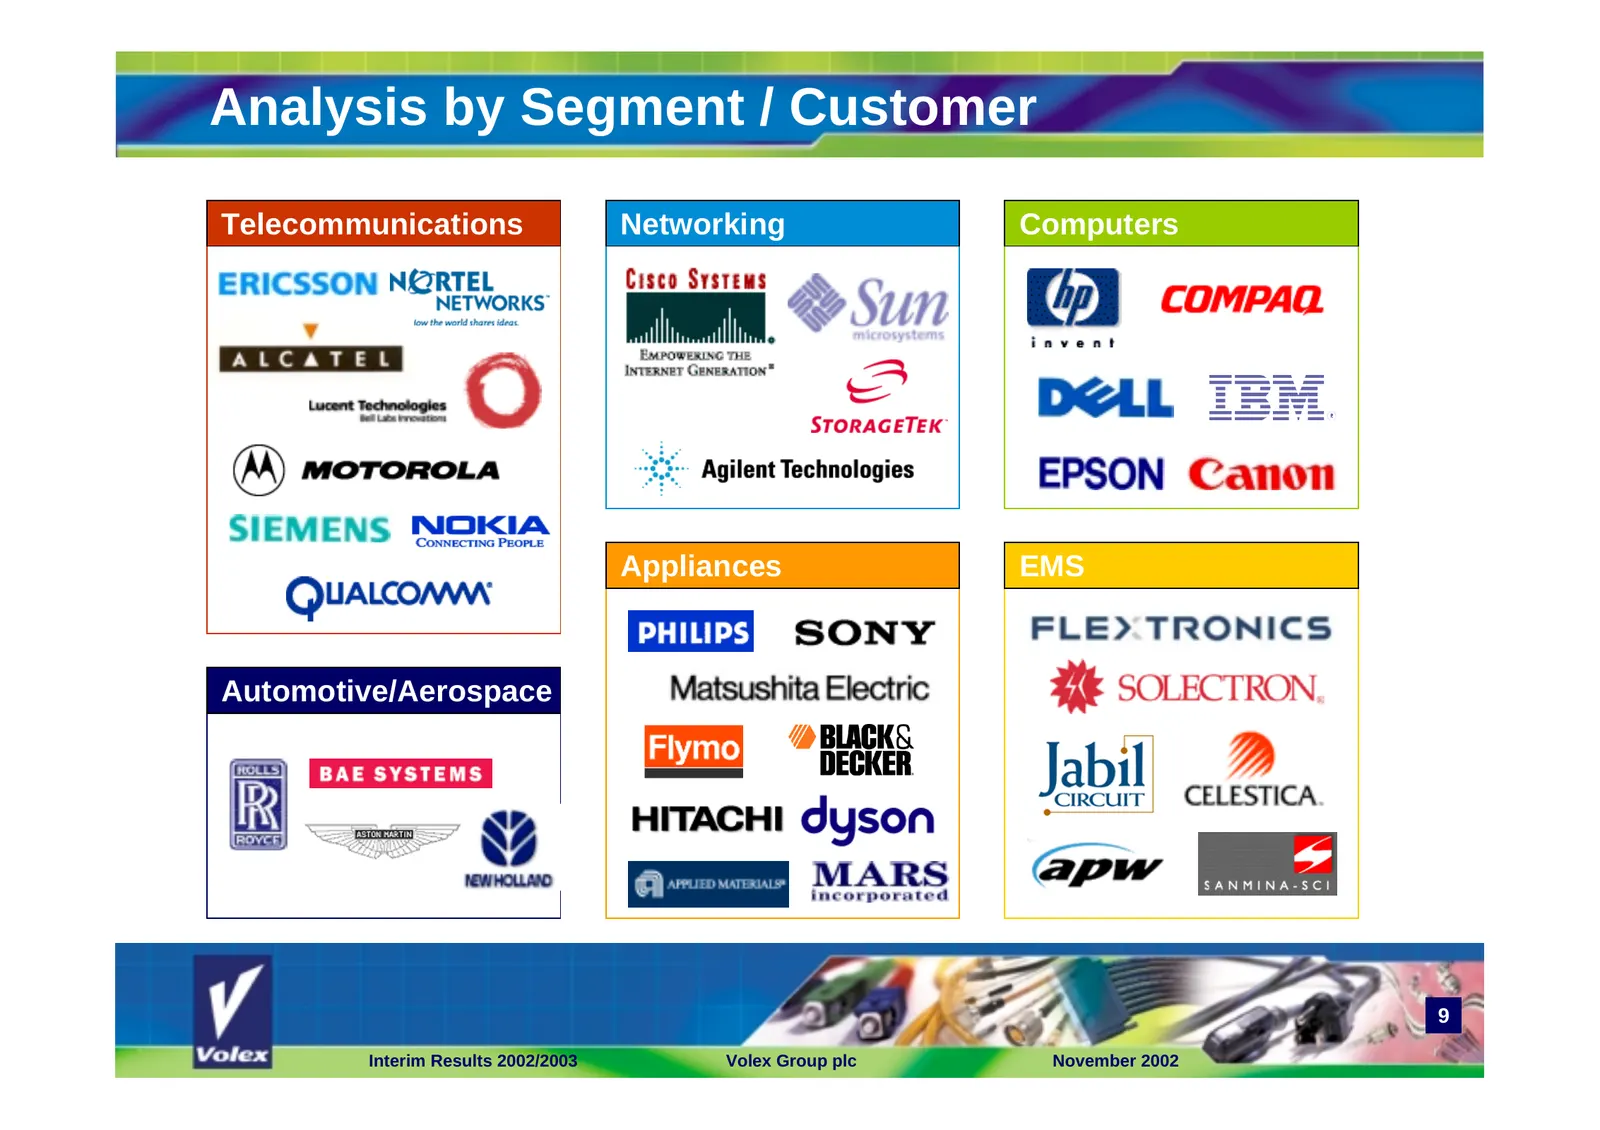
Analysis by Segment / Customer Telecommunications Networking Computers Appliances EMS Automotive/Aerospace 9 Interim Results 2002/2003 Volex Group plc November 2002
Slide 10: Data / Telecommunications / Networking
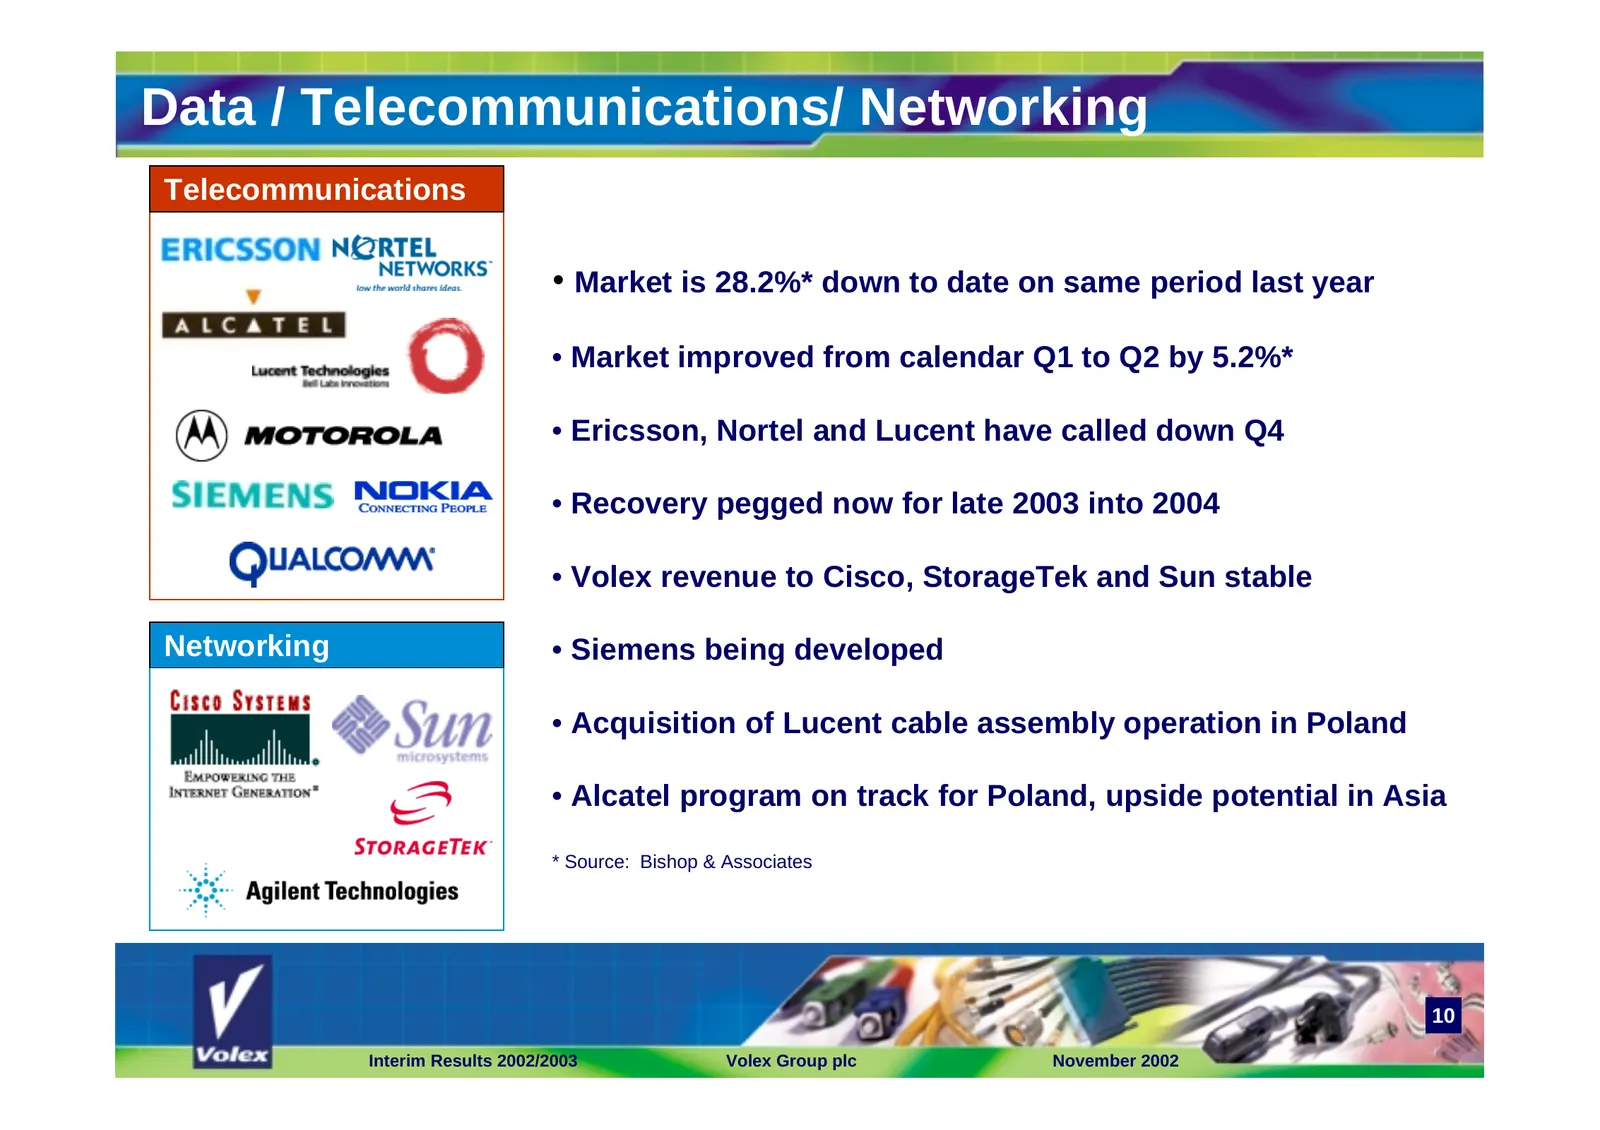
Data / Telecommunications/ Networking Telecommunications • Market is 28.2%* down to date on same period last year • Market improved from calendar Q1 to Q2 by 5.2%* • Ericsson, Nortel and Lucent have called down Q4 • Recovery pegged now for late 2003 into 2004 • Volex revenue to Cisco, StorageTek and
Slide 11: Computer and Consumer
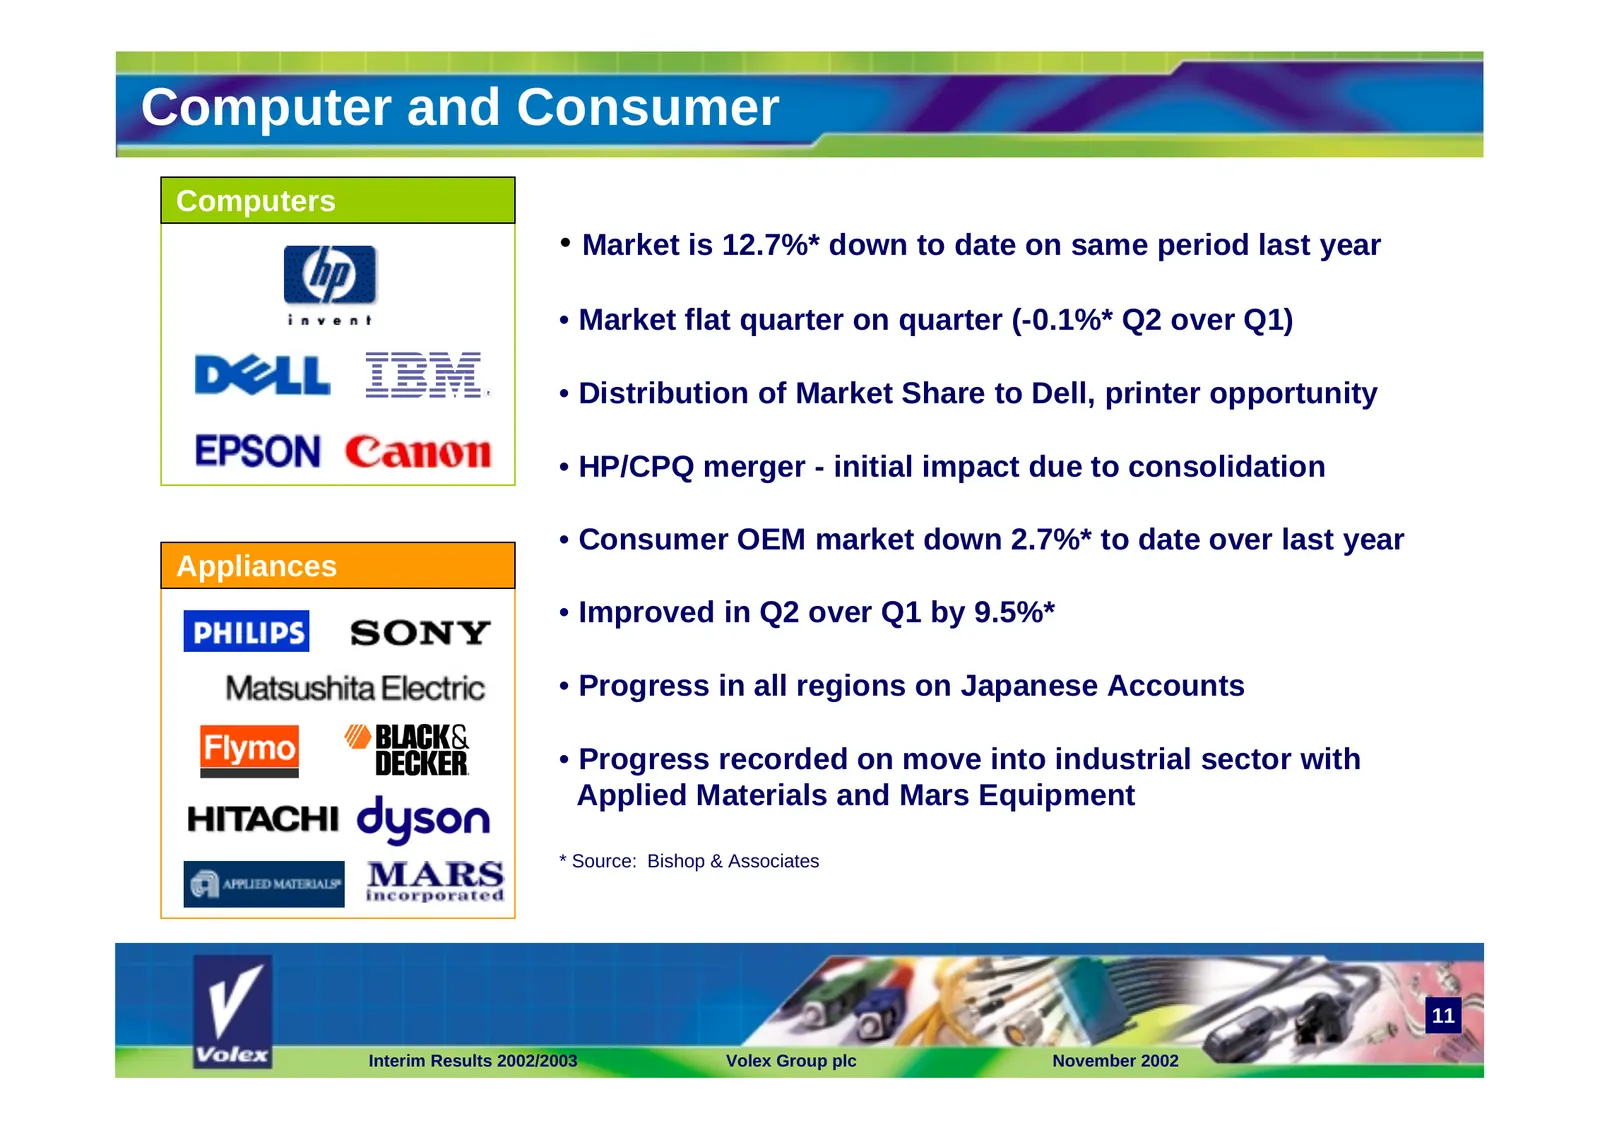
Computer and Consumer Computers • Market is 12.7%* down to date on same period last year • Market flat quarter on quarter (-0.1%* Q2 over Q1) • Distribution of Market Share to Dell, printer opportunity • HP/CPQ merger - initial impact due to consolidation • Consumer OEM market down 2.7%* to date ove
Slide 12: EMS / Aerospace
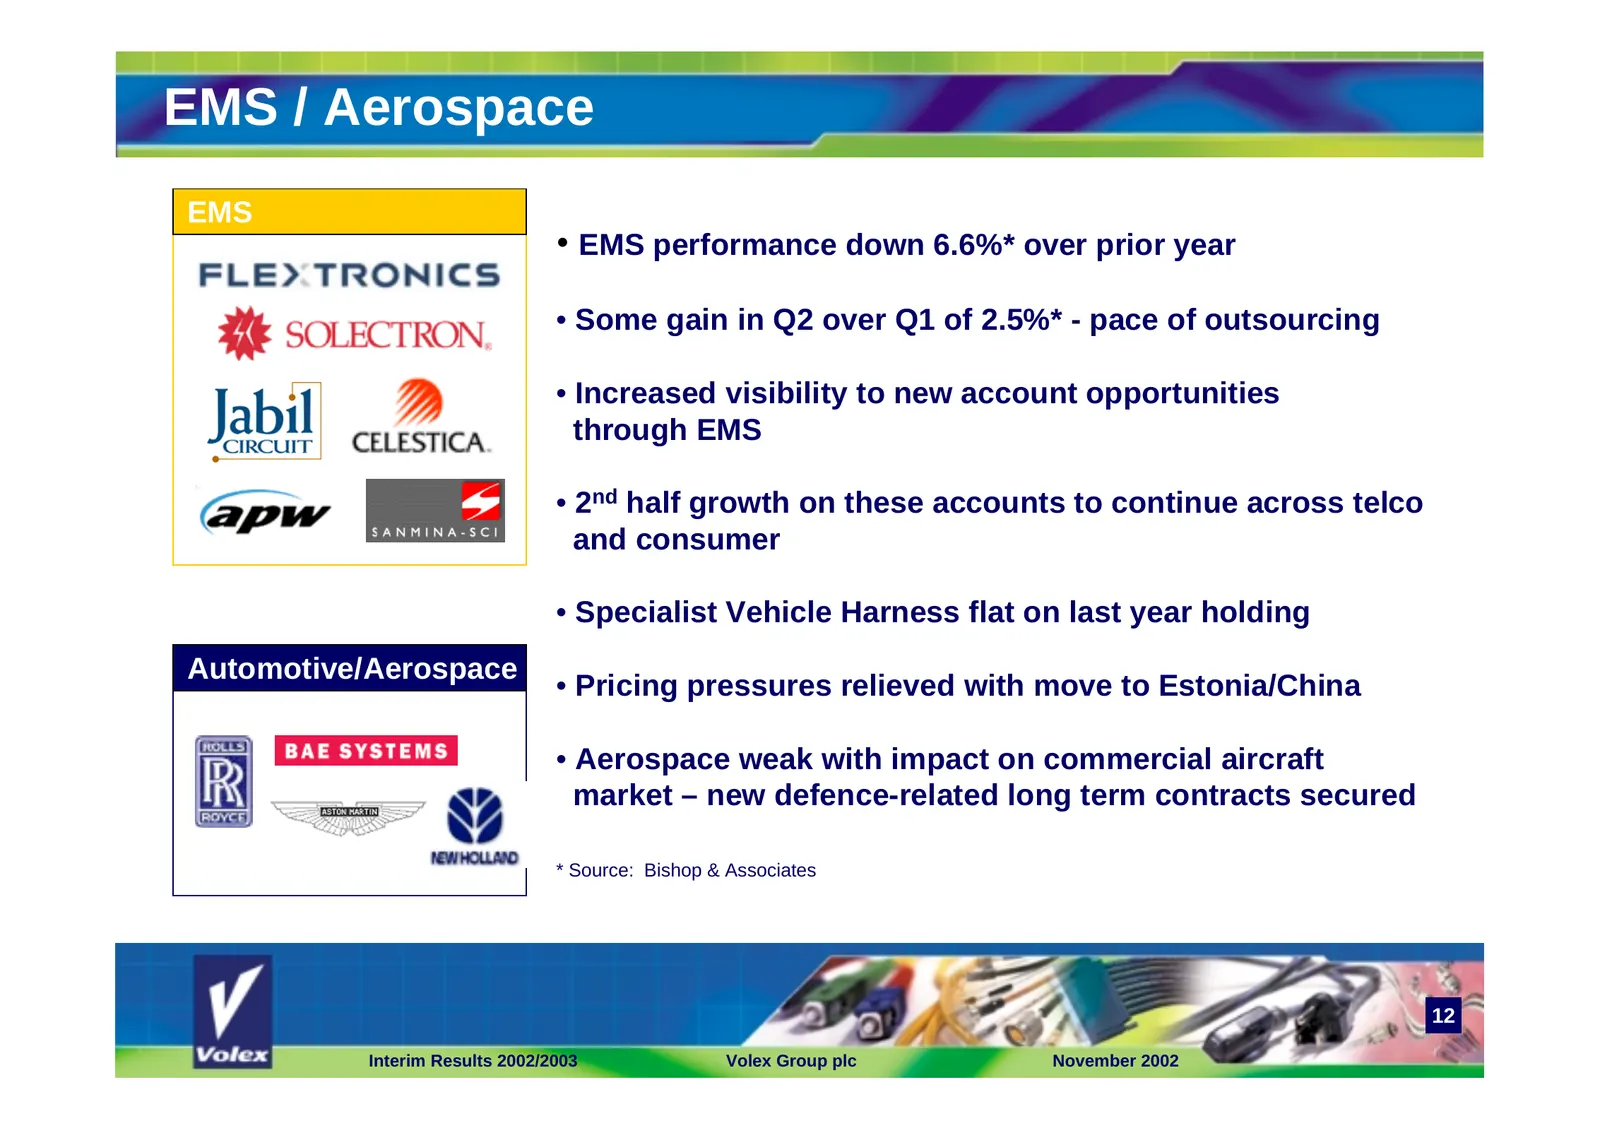
EMS / Aerospace EMS • EMS performance down 6.6%* over prior year • Some gain in Q2 over Q1 of 2.5%* - pace of outsourcing • Increased visibility to new account opportunities through EMS • 2nd half growth on these accounts to continue across telco and consumer • Specialist Vehicle Harness flat on las
Slide 13: Group Sales by Product
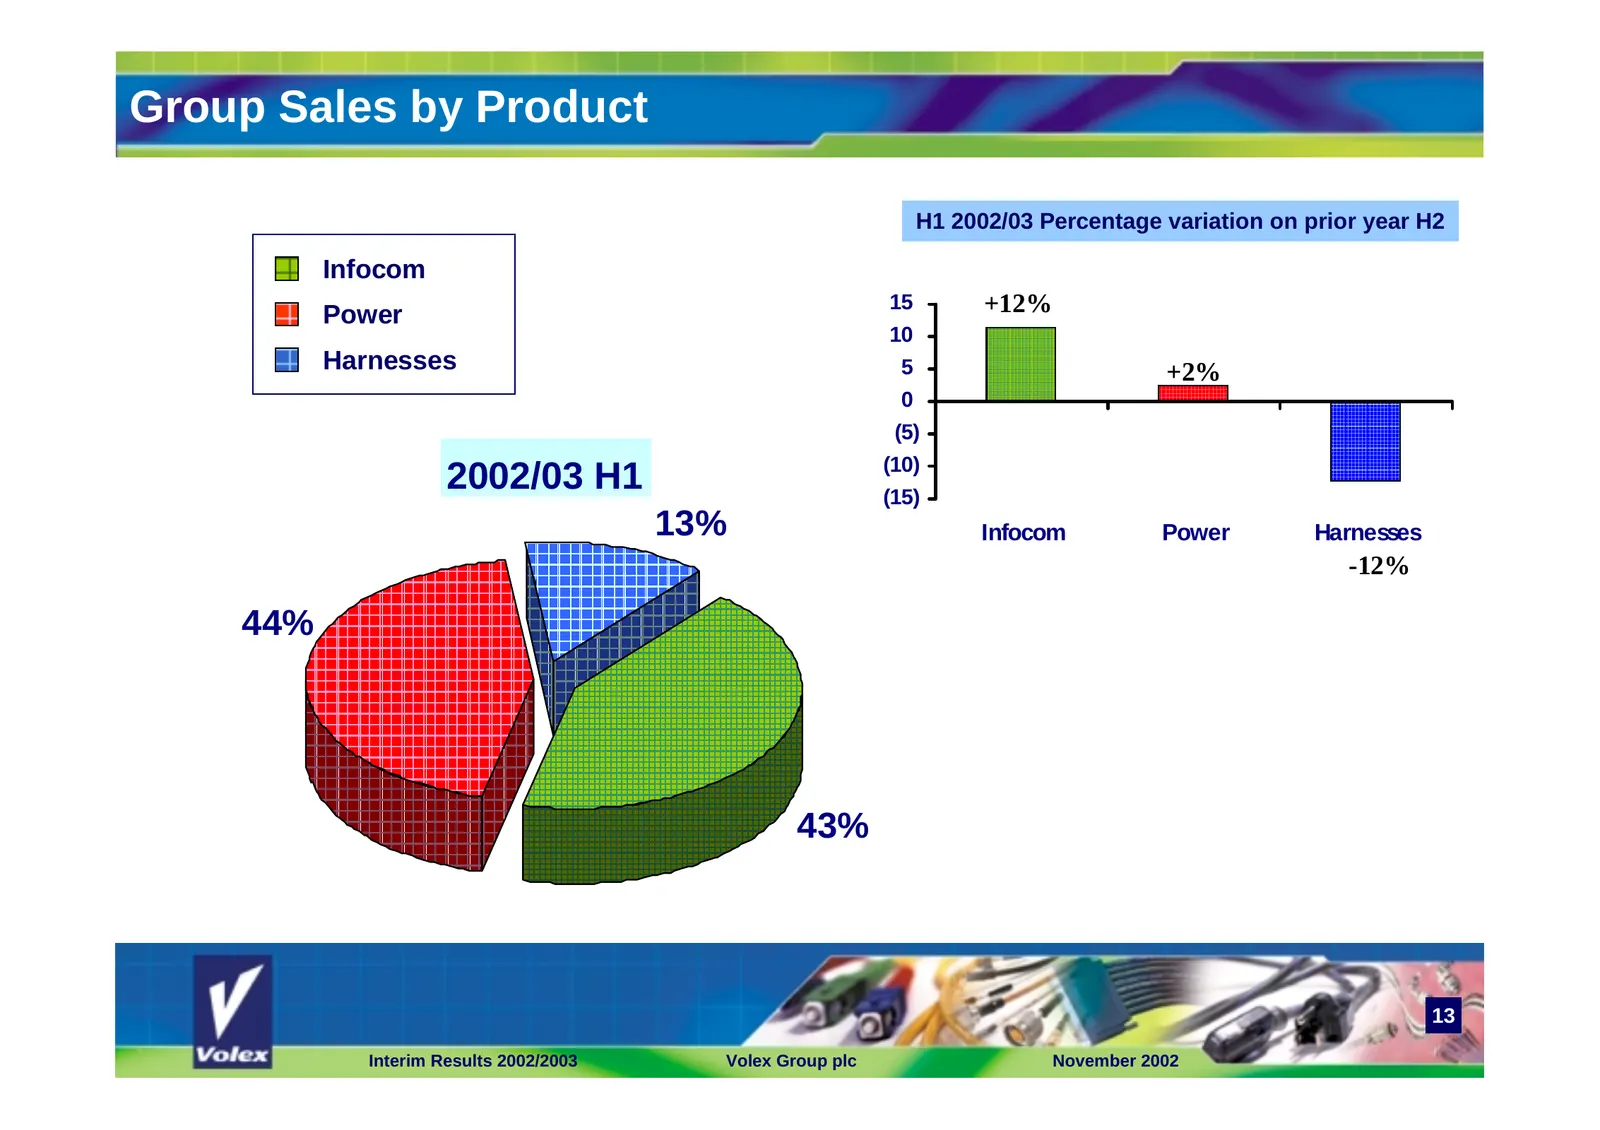
Group Sales by Product H1 2002/03 Percentage variation on prior year H2 Infocom 15 +12% Power 10 Harnesses 5 +2% 0 (5) (10) 2002/03 H1 (15) 13% Infocom Power Harnesses -12% 44% 43% 13 Interim Results 2002/2003 Volex Group plc November 2002
Slide 14: Group Sales by End Market
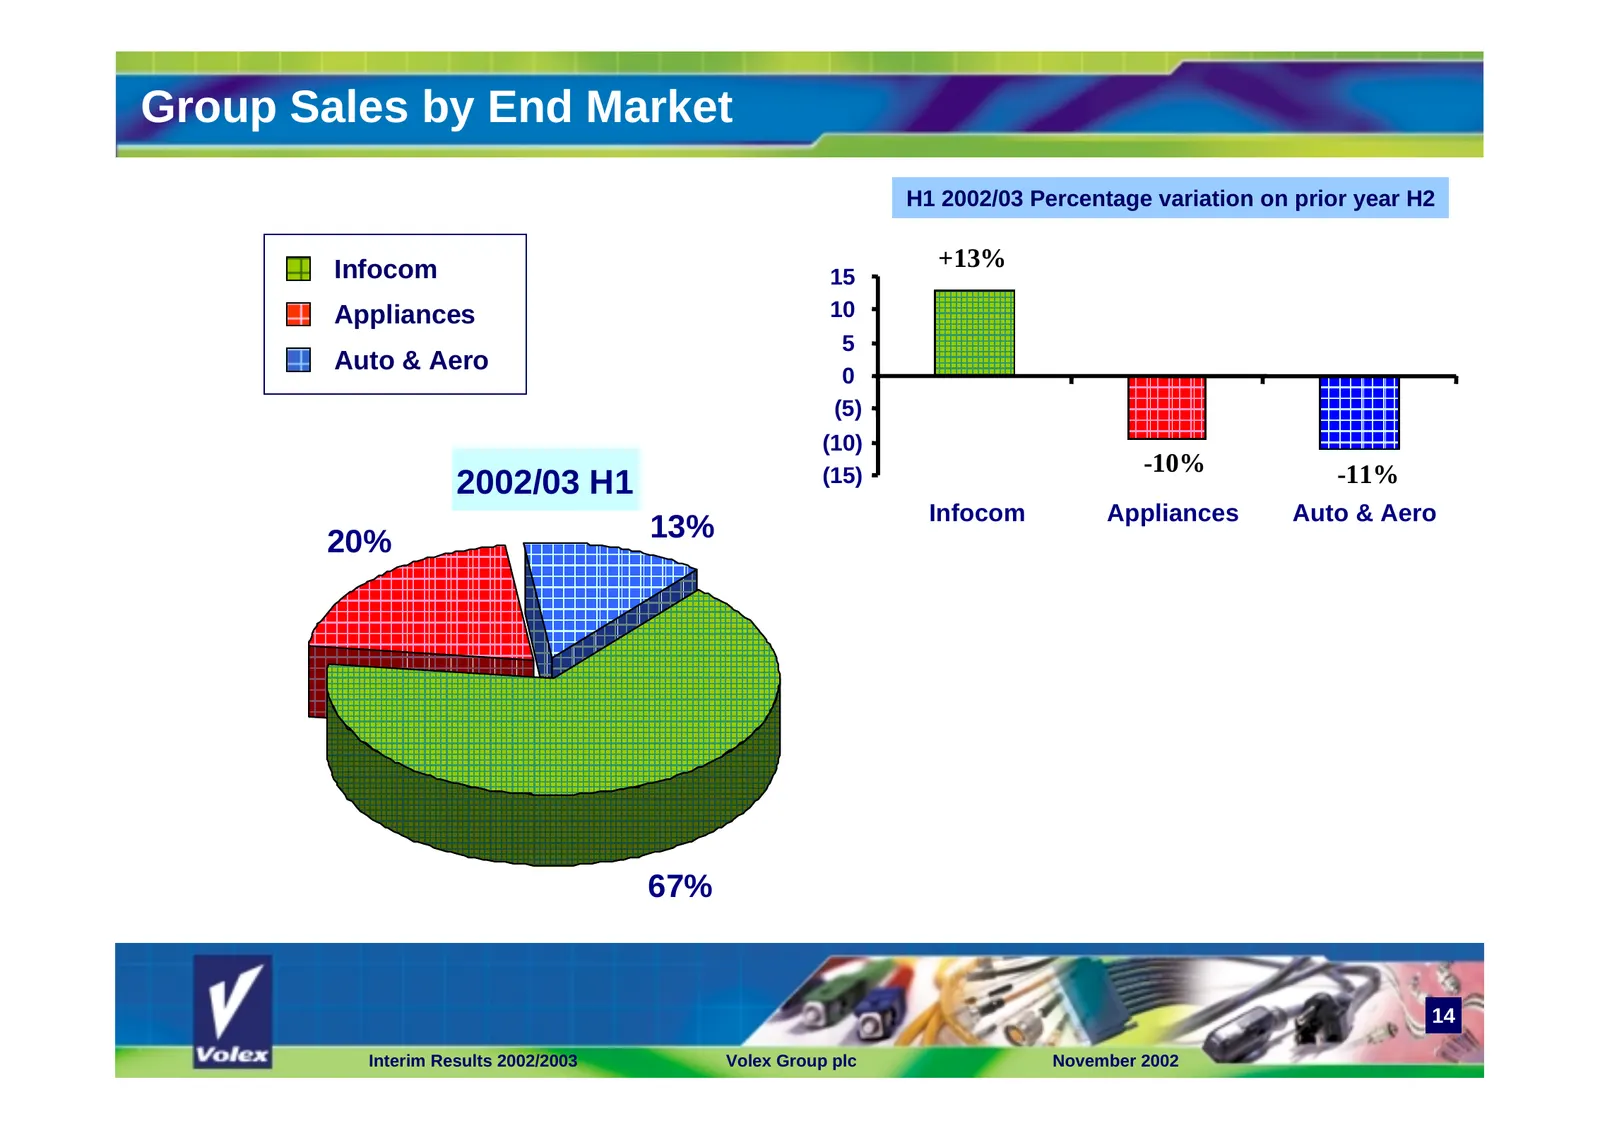
Group Sales by End Market H1 2002/03 Percentage variation on prior year H2 Infocom +13% 15 Appliances 10 5 Auto & Aero 0 (5) (10) (15) -10% -11% 2002/03 H1 Infocom Appliances Auto & Aero 20% 13% 67% 14 Interim Results 2002/2003 Volex Group plc November 2002
Slide 15: Group Sales by Destination
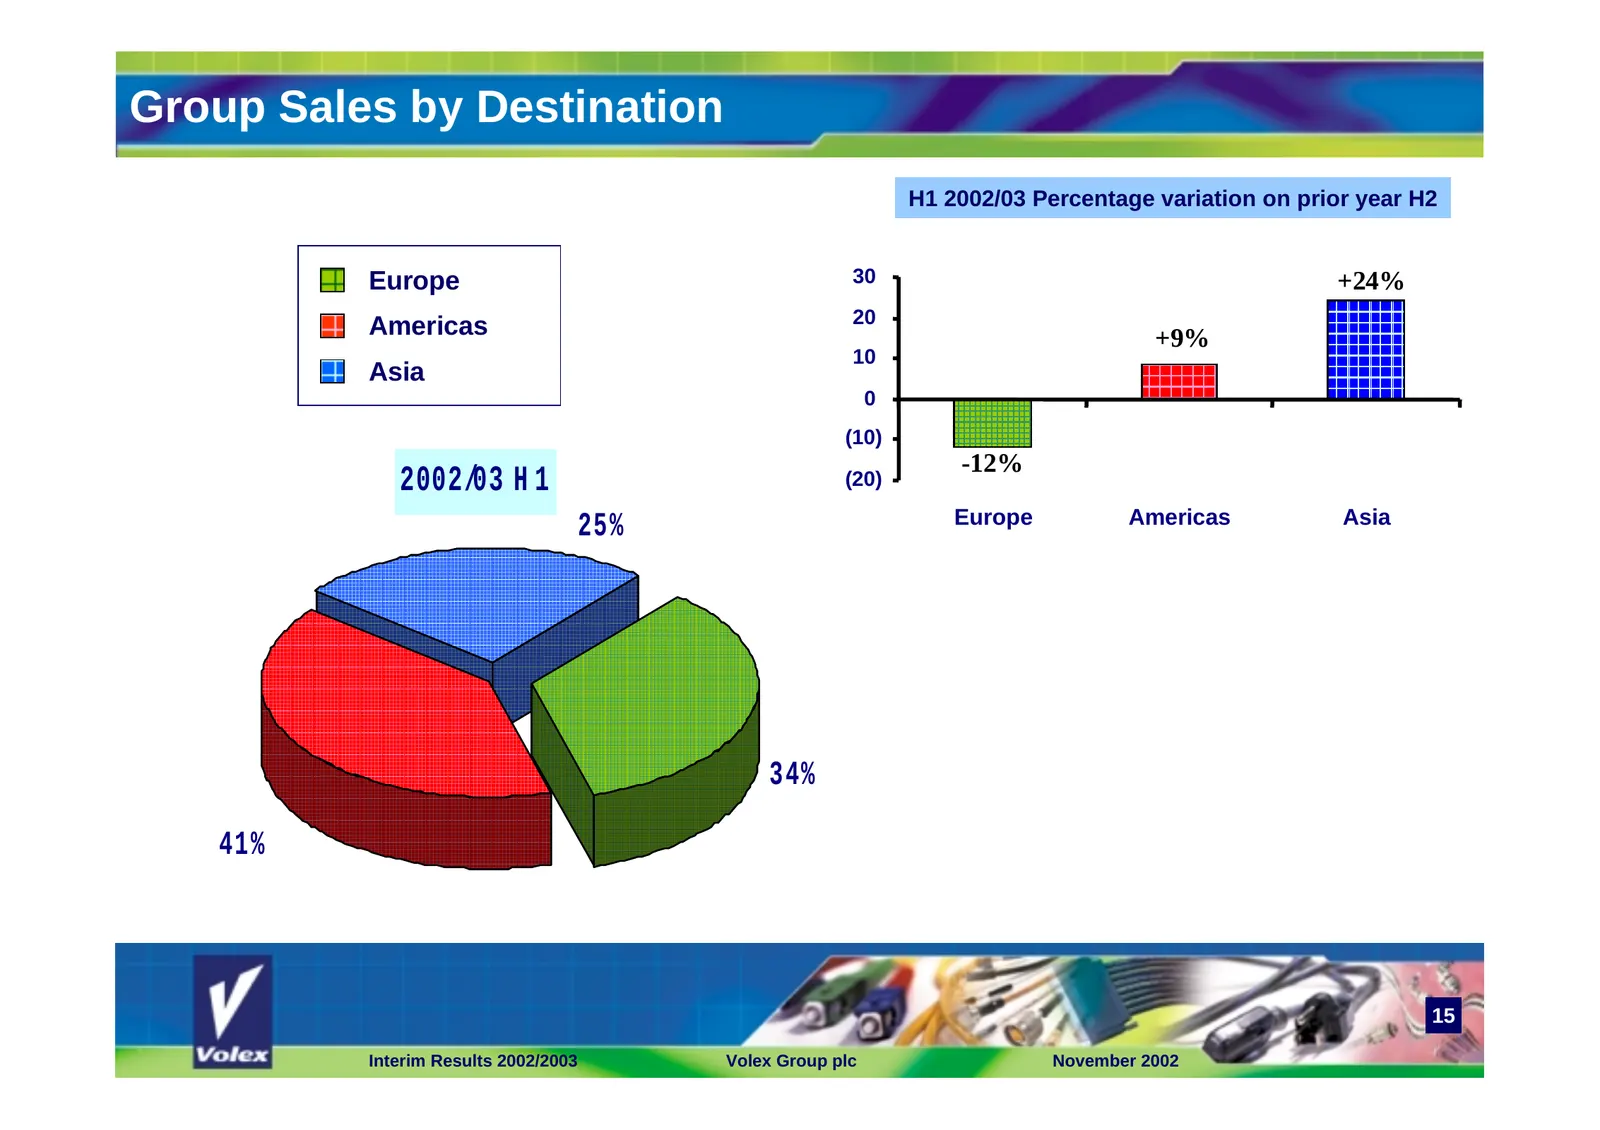
Group Sales by Destination H1 2002/03 Percentage variation on prior year H2 Europe 30 +24% 20 Americas +9% 10 Asia 0 (10) -12% 2002/03 H 1 (20) 25% Europe Americas Asia 34% 41% 15 Interim Results 2002/2003 Volex Group plc November 2002

Slide 16: Global Operations
Volex Group p.l.c. Global Operations
Slide 17: Volex in the Americas
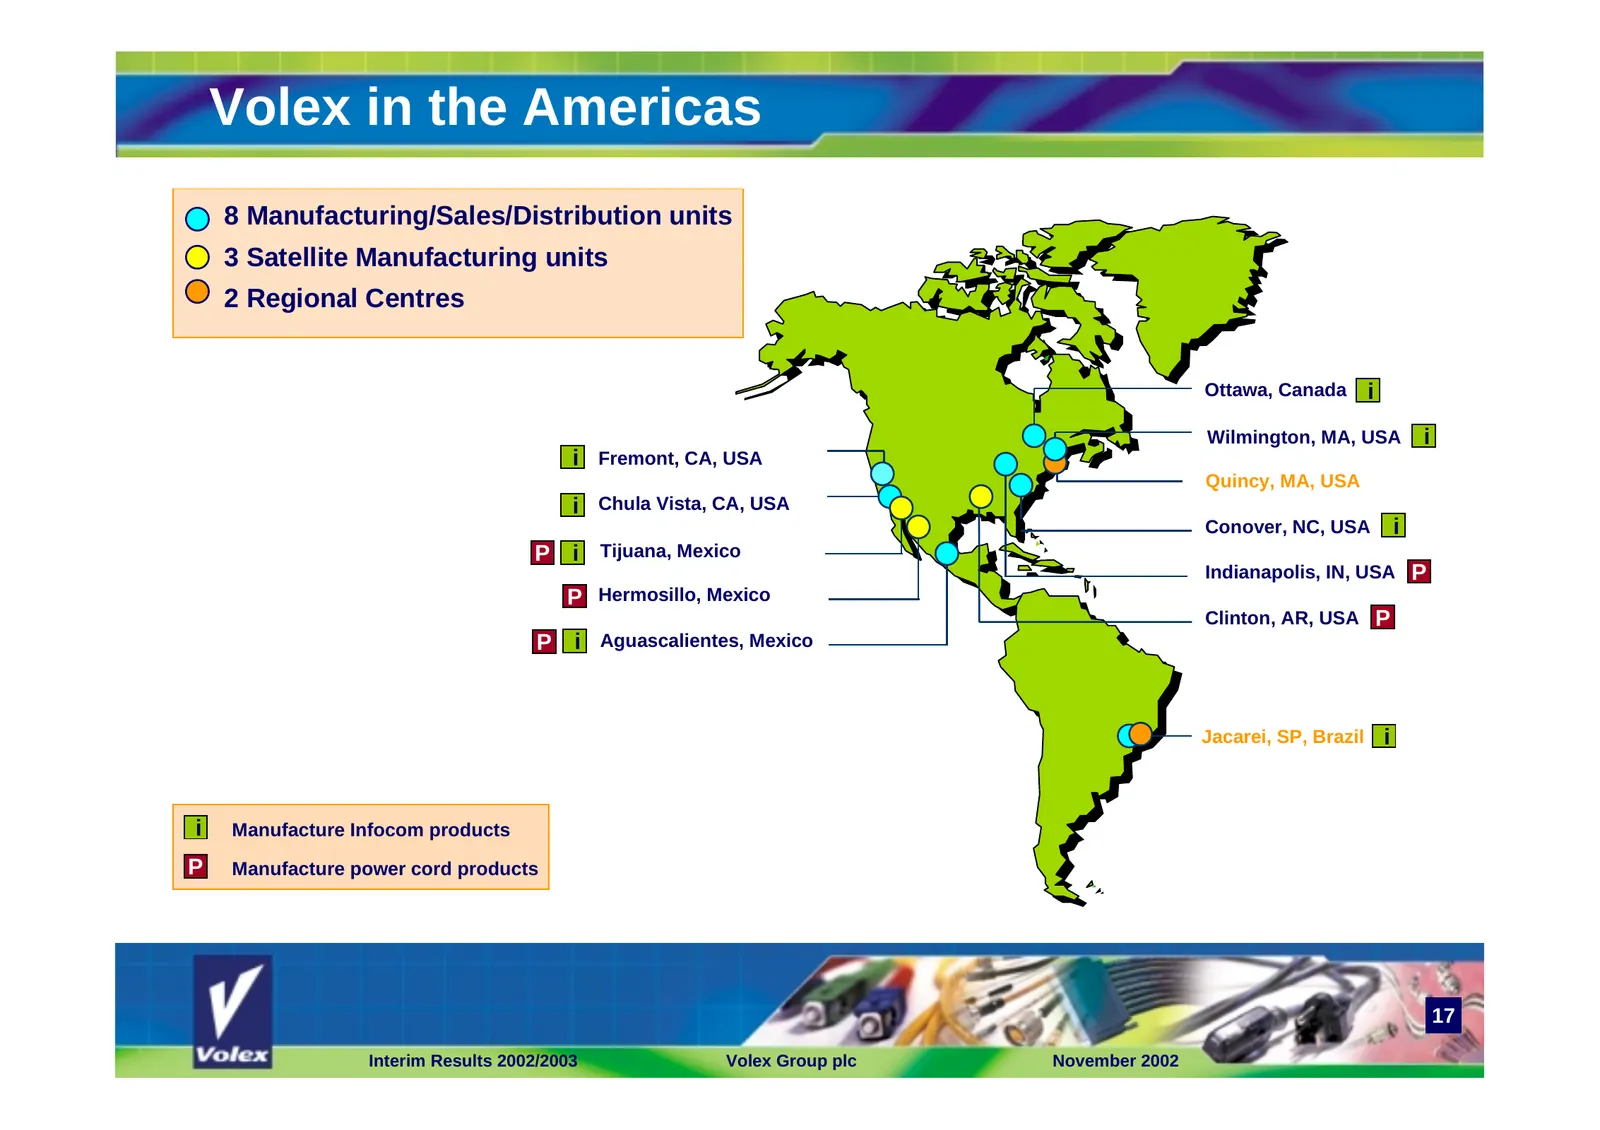
Volex in the Americas 8 Manufacturing/Sales/Distribution units 3 Satellite Manufacturing units 2 Regional Centres Ottawa, Canada i Wilmington, MA, USA i i Fremont, CA, USA Quincy, MA, USA i Chula Vista, CA, USA Conover, NC, USA i P i Tijuana, Mexico Indianapolis, IN, USA P P Hermosillo, Mexico Clint
Slide 18: Volex in the Americas
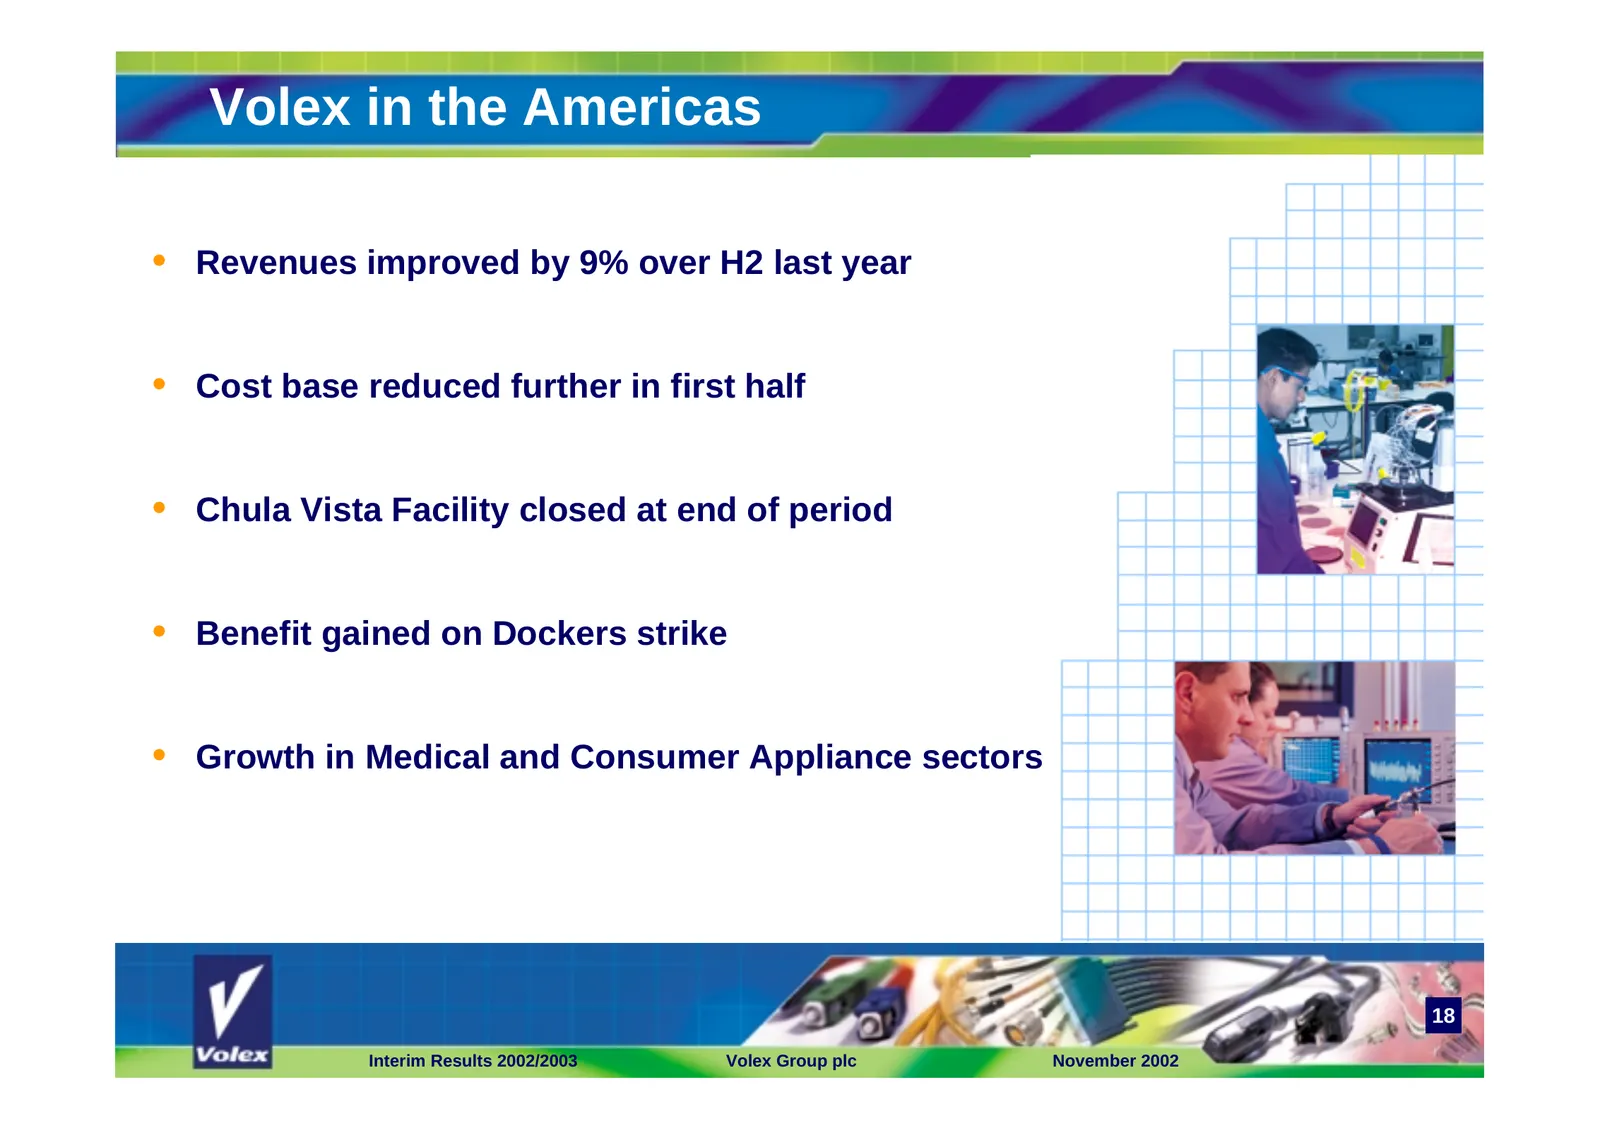
Volex in the Americas • Revenues improved by 9% over H2 last year • Cost base reduced further in first half • Chula Vista Facility closed at end of period • Benefit gained on Dockers strike • Growth in Medical and Consumer Appliance sectors 18 Interim Results 2002/2003 Volex Group plc November 2002
Slide 19: Volex in Asia
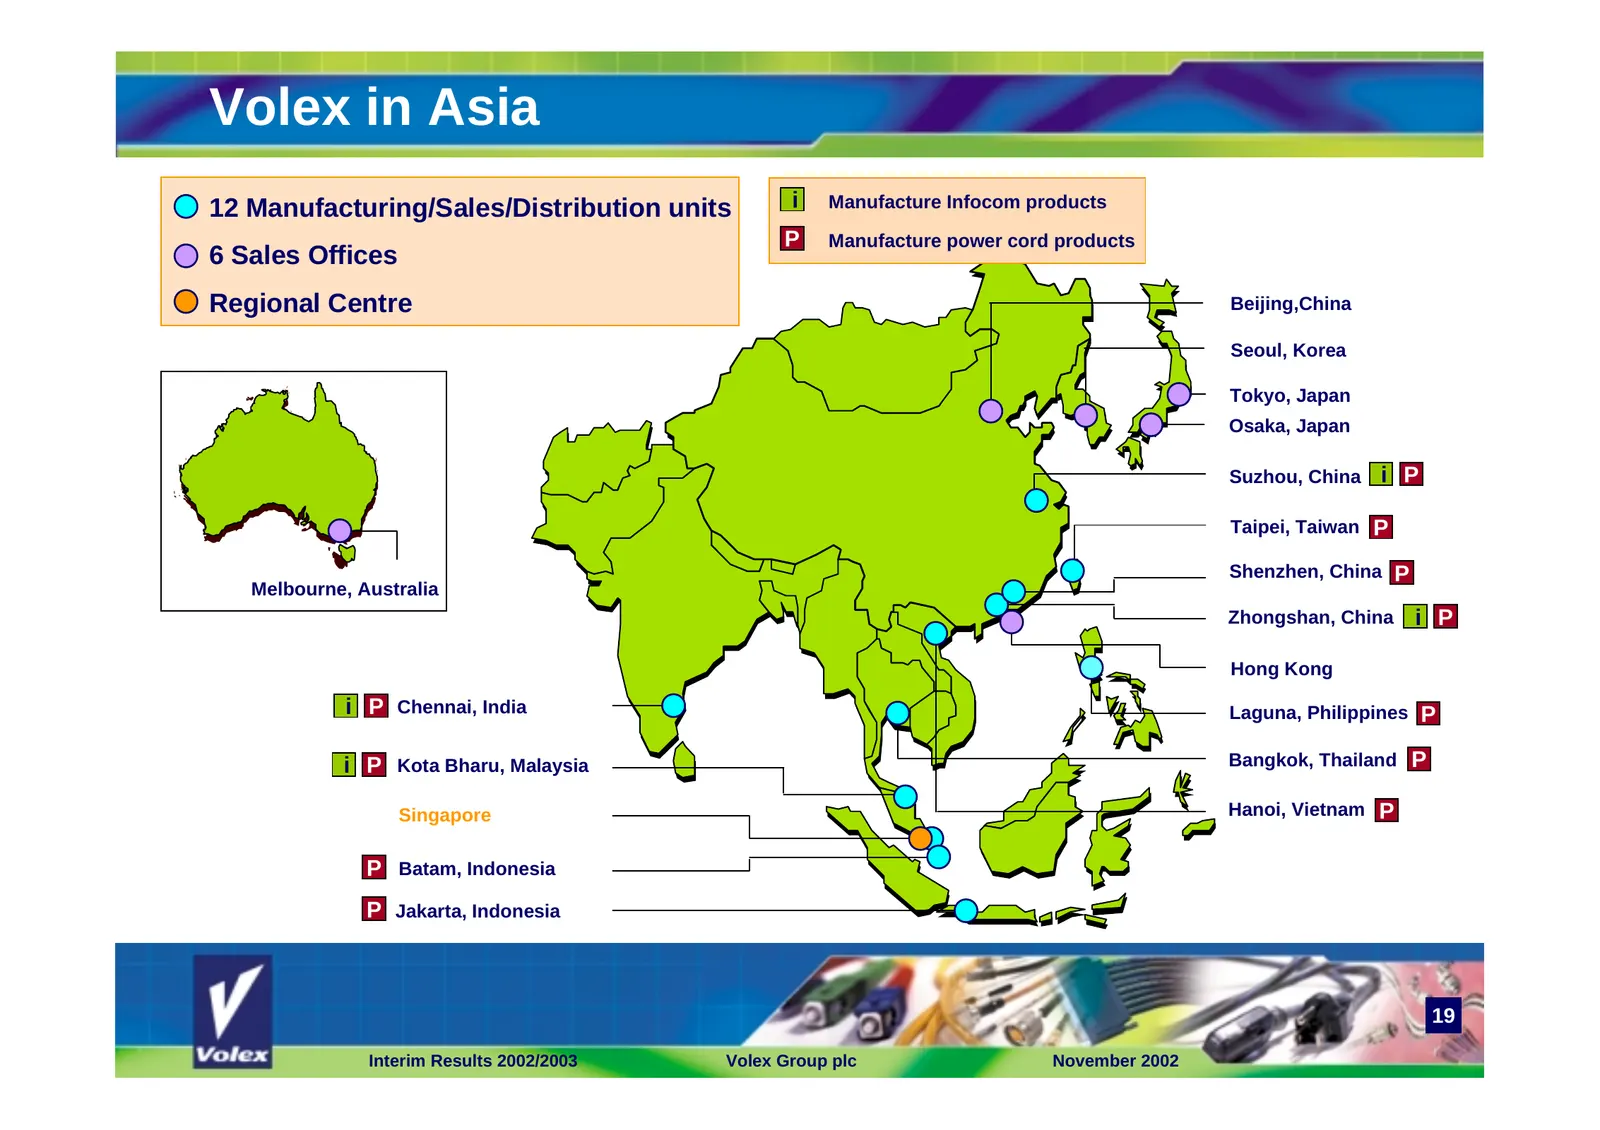
Volex in Asia 12 Manufacturing/Sales/Distribution units i Manufacture Infocom products P Manufacture power cord products 6 Sales Offices Regional Centre Beijing,China Seoul, Korea Tokyo, Japan Osaka, Japan Suzhou, China i P Taipei, Taiwan P Shenzhen, China P Melbourne, Australia Zhongshan, China i P
Slide 20: Volex in Asia
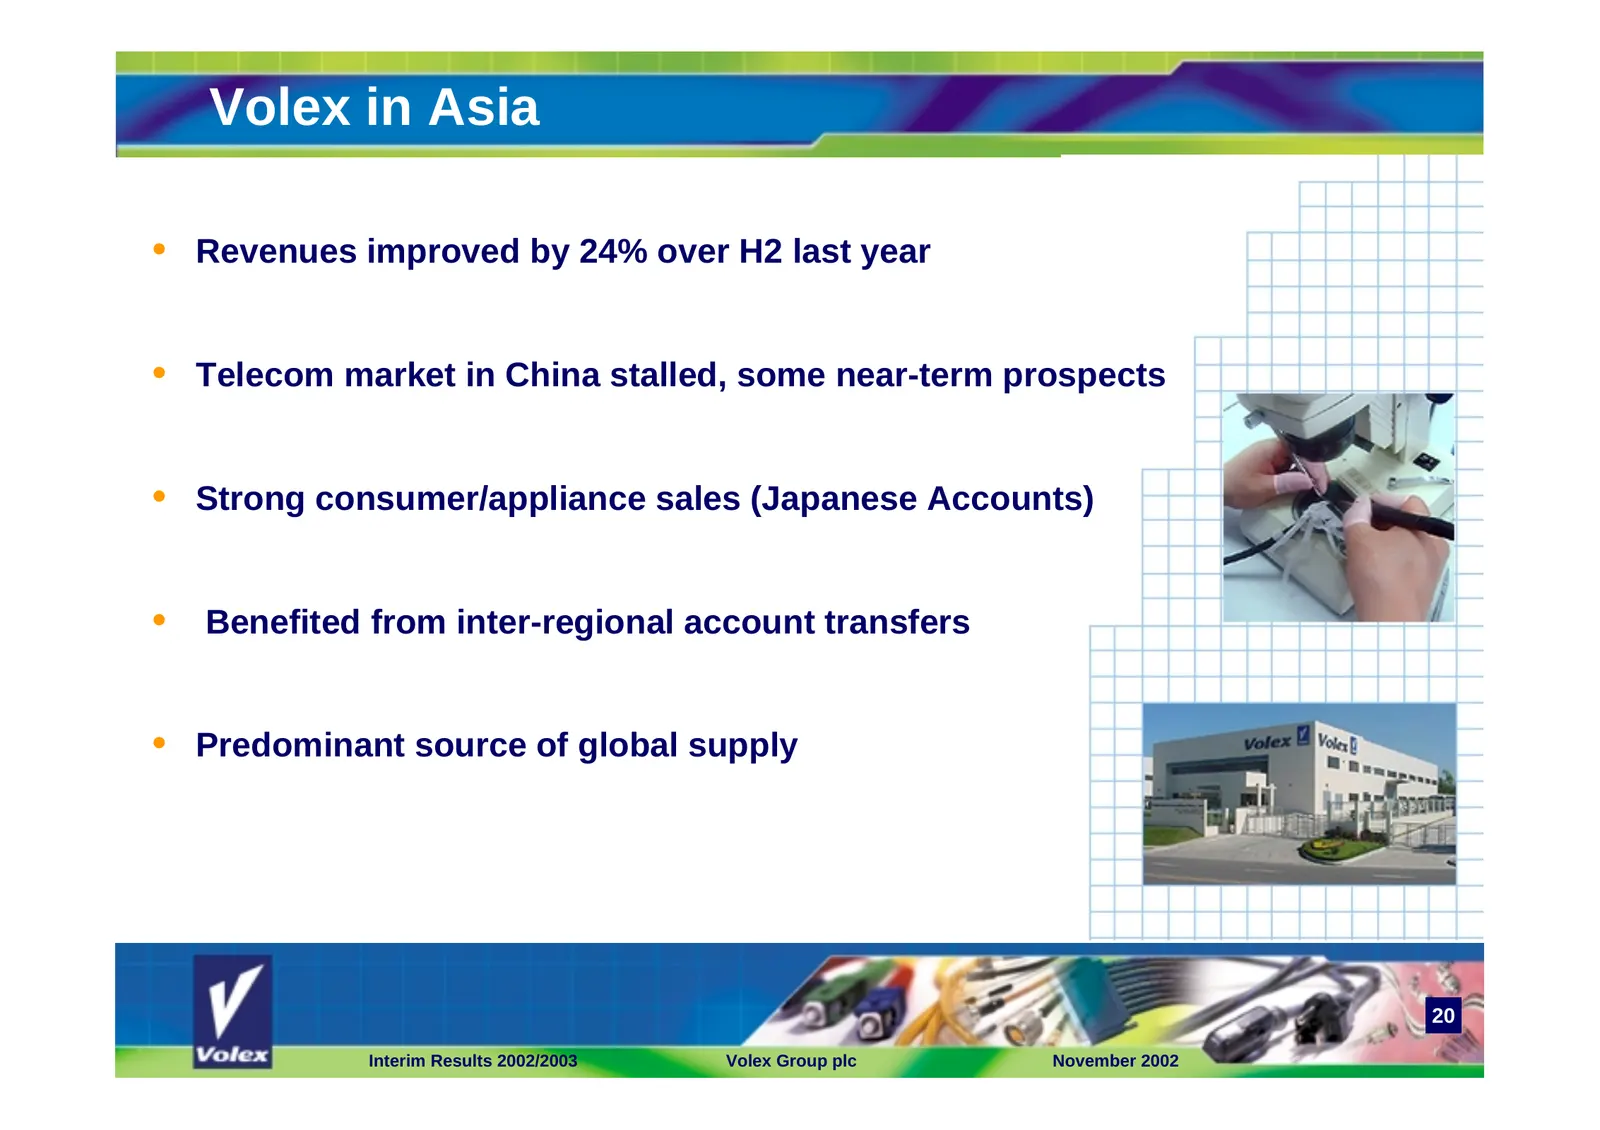
Volex in Asia • Revenues improved by 24% over H2 last year • Telecom market in China stalled, some near-term prospects • Strong consumer/appliance sales (Japanese Accounts) • Benefited from inter-regional account transfers • Predominant source of global supply 20 Interim Results 2002/2003 Volex Grou
Slide 21: Volex in Europe
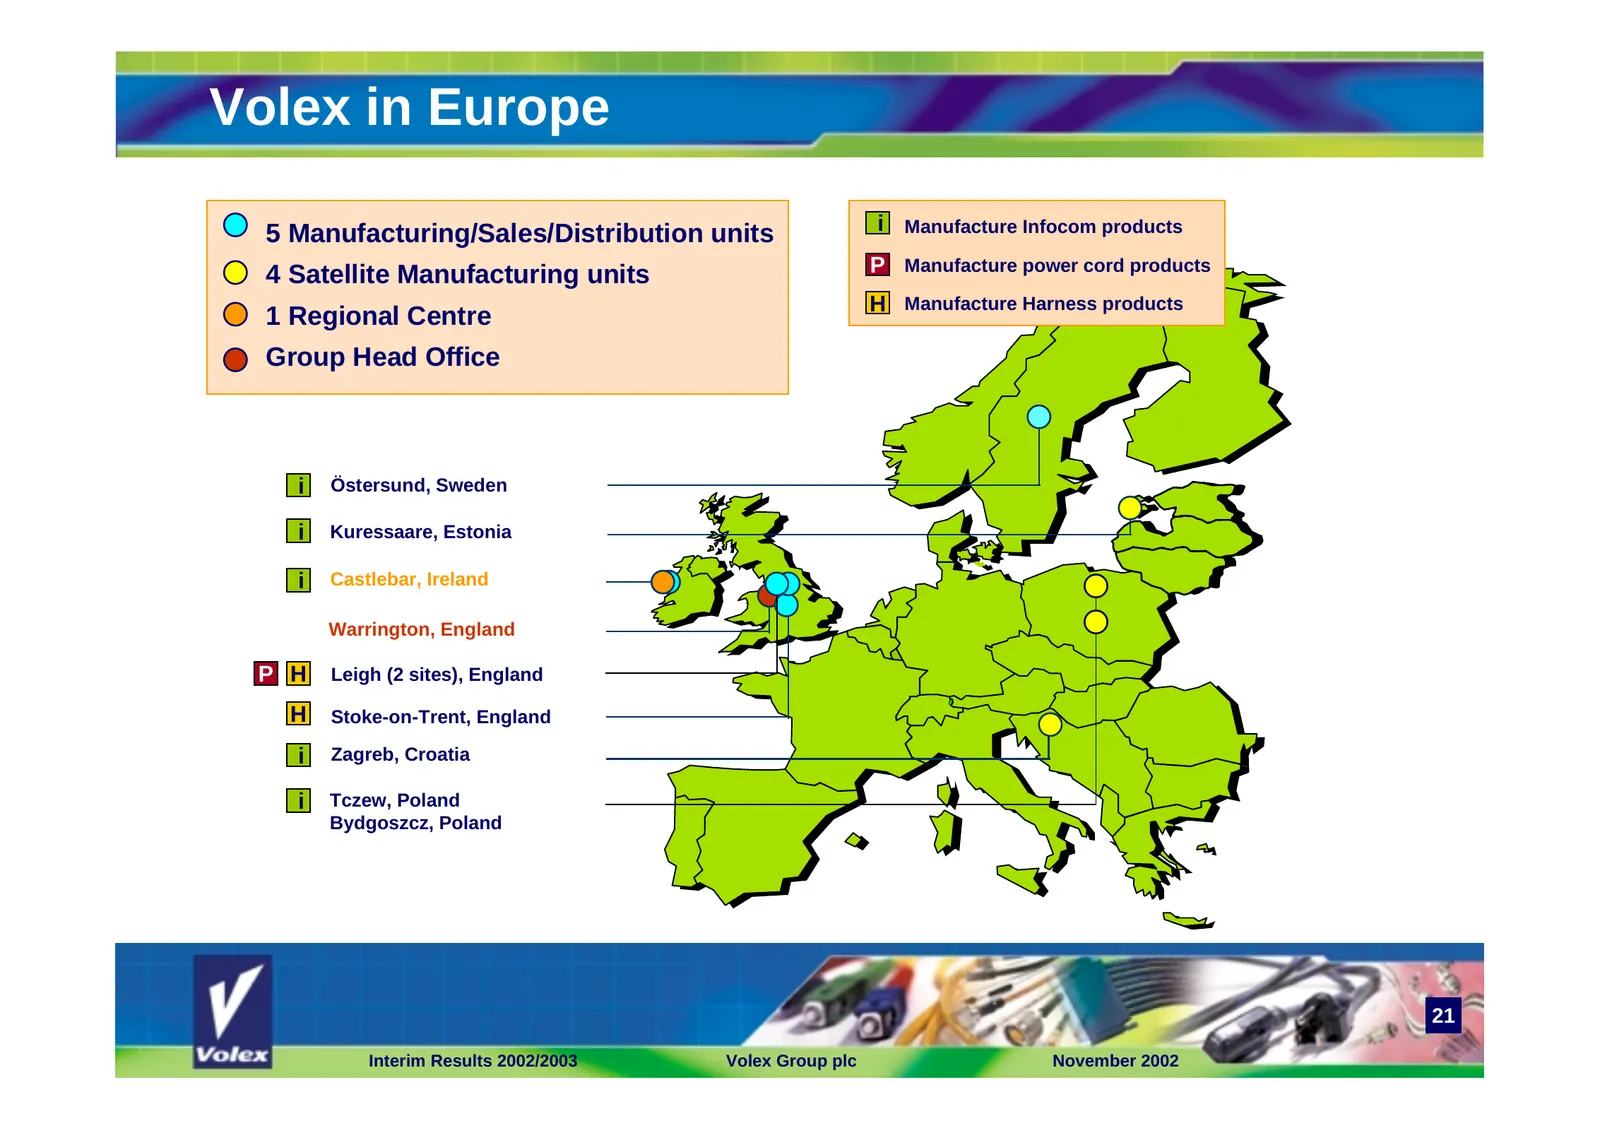
Volex in Europe 5 Manufacturing/Sales/Distribution units i Manufacture Infocom products 4 Satellite Manufacturing units P Manufacture power cord products H Manufacture Harness products 1 Regional Centre Group Head Office i Östersund, Sweden i Kuressaare, Estonia i Castlebar, Ireland Warrington, Engl
Slide 22: Volex in Europe
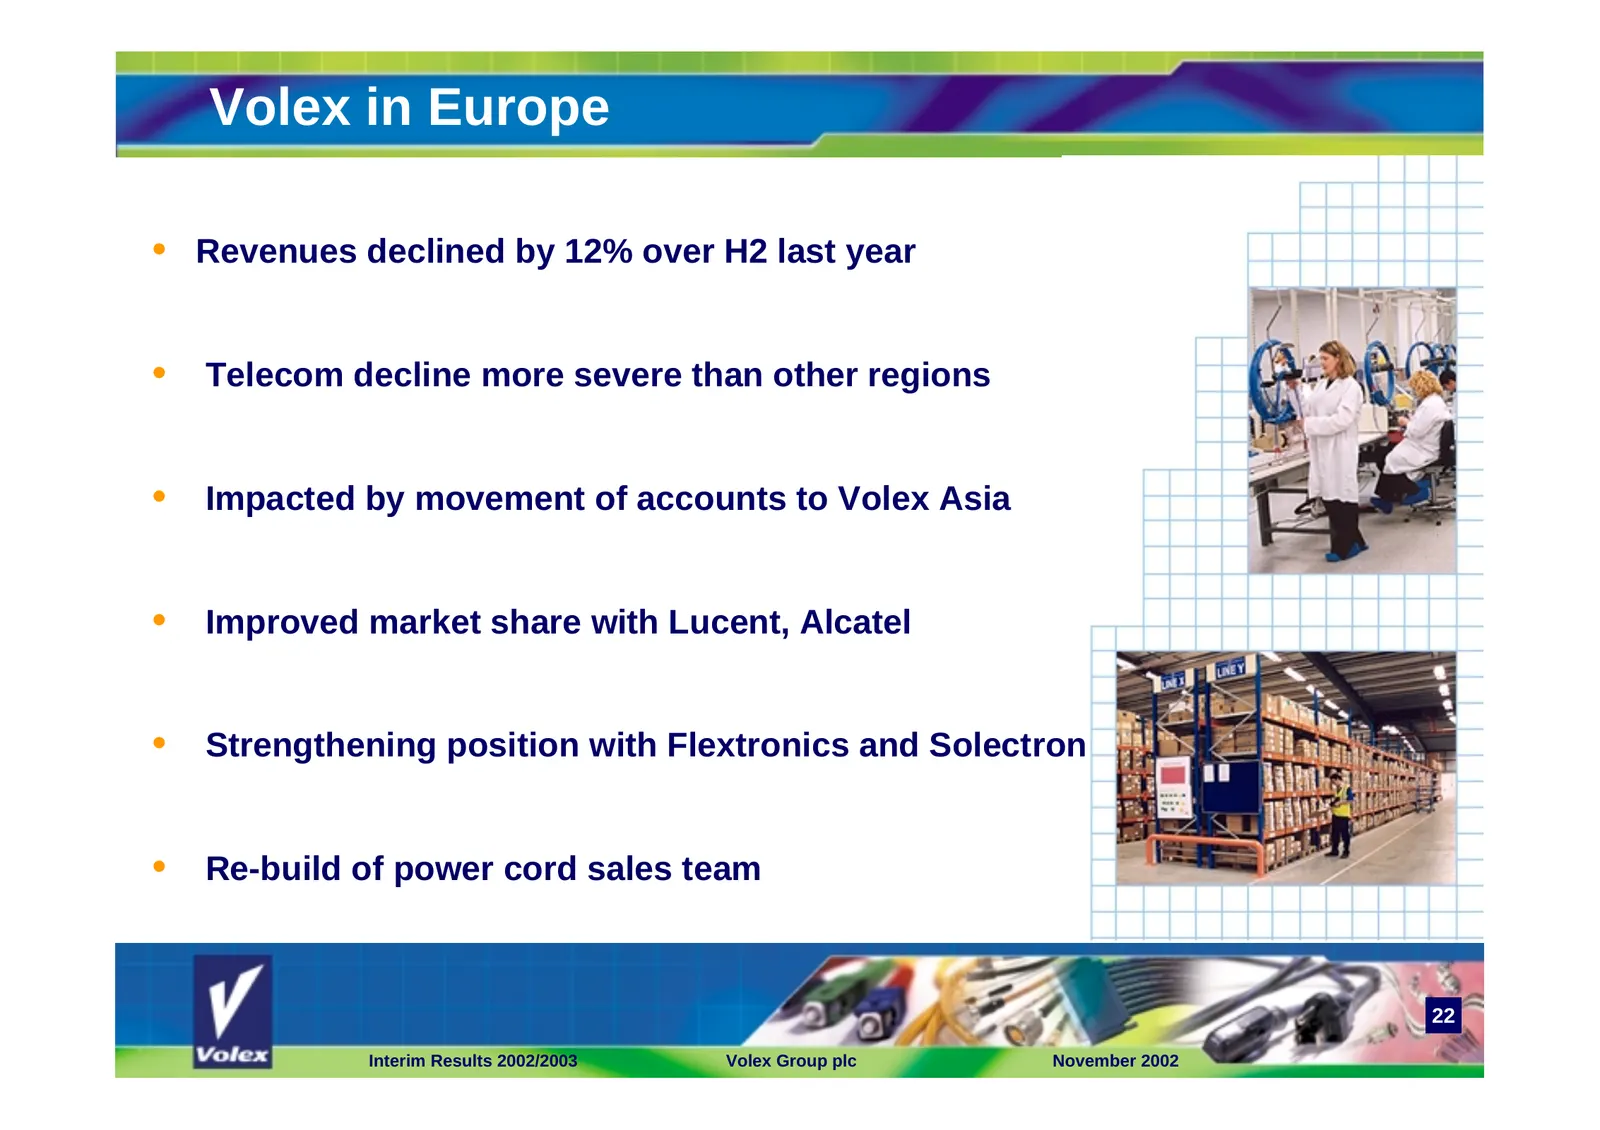
Volex in Europe • Revenues declined by 12% over H2 last year • Telecom decline more severe than other regions • Impacted by movement of accounts to Volex Asia • Improved market share with Lucent, Alcatel • Strengthening position with Flextronics and Solectron • Re-build of power cord sales team 22 I

Slide 23: Financial Overview
Volex Group p.l.c. Financial Overview
Slide 24: 2002/03 Half Year Results
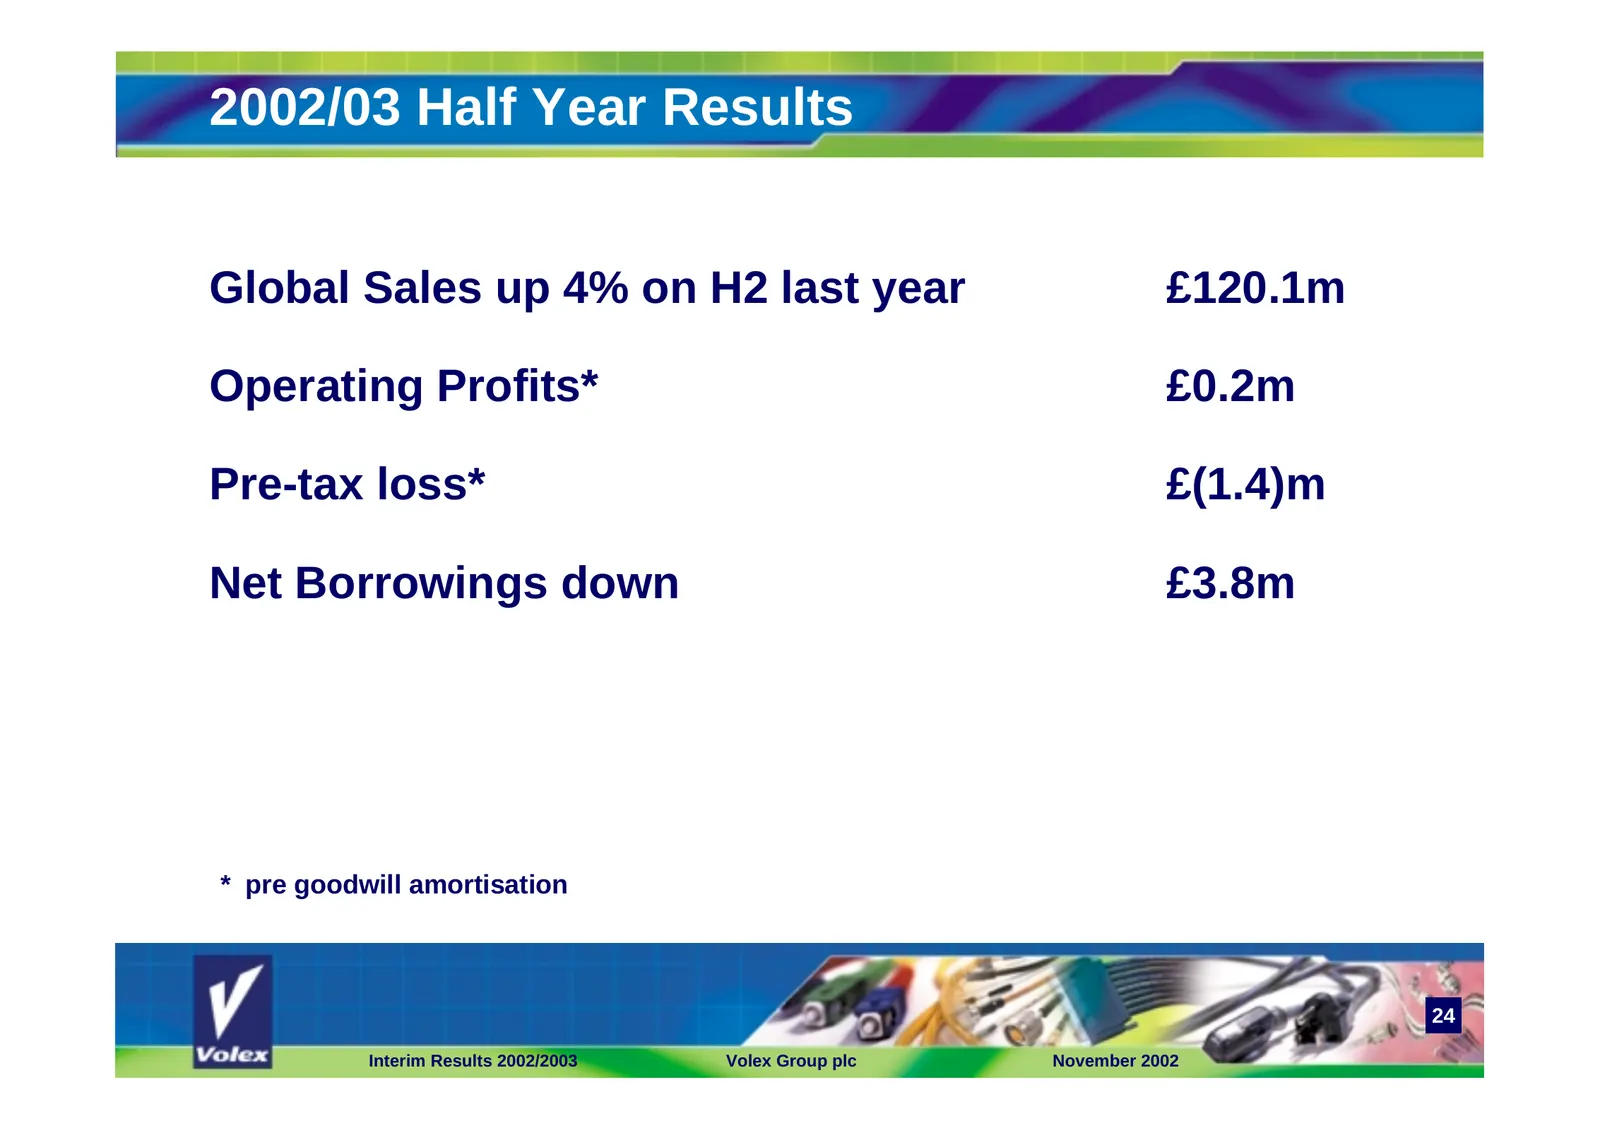
2002/03 Half Year Results Global Sales up 4% on H2 last year £120.1m Operating Profits* £0.2m Pre-tax loss* £(1.4)m Net Borrowings down £3.8m * pre goodwill amortisation 24 Interim Results 2002/2003 Volex Group plc November 2002
Slide 25: Turnover
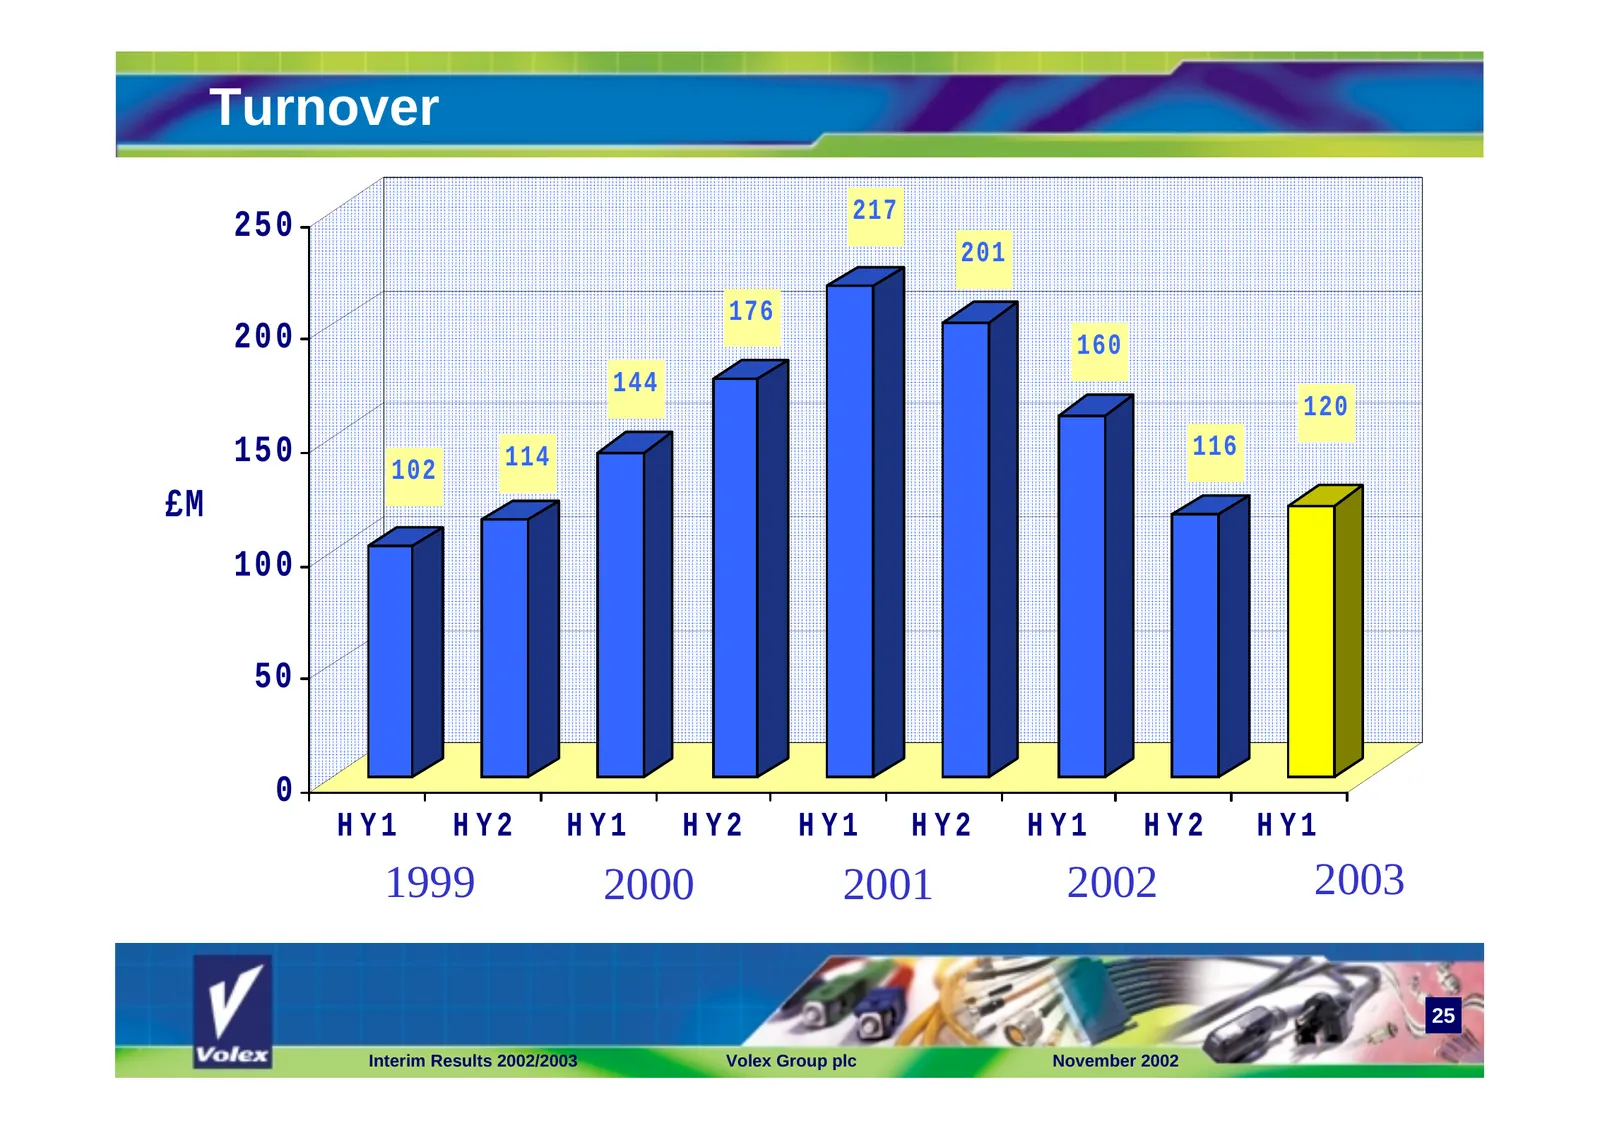
Turnover 217 250 201 176 200 160 144 120 150 114 116 102 £M 100 50 0 H Y1 H Y2 H Y1 H Y2 H Y1 H Y2 H Y1 H Y2 H Y1 1999 2000 2001 2002 2003 25 Interim Results 2002/2003 Volex Group plc November 2002
Slide 26: Sales and Operating Profits
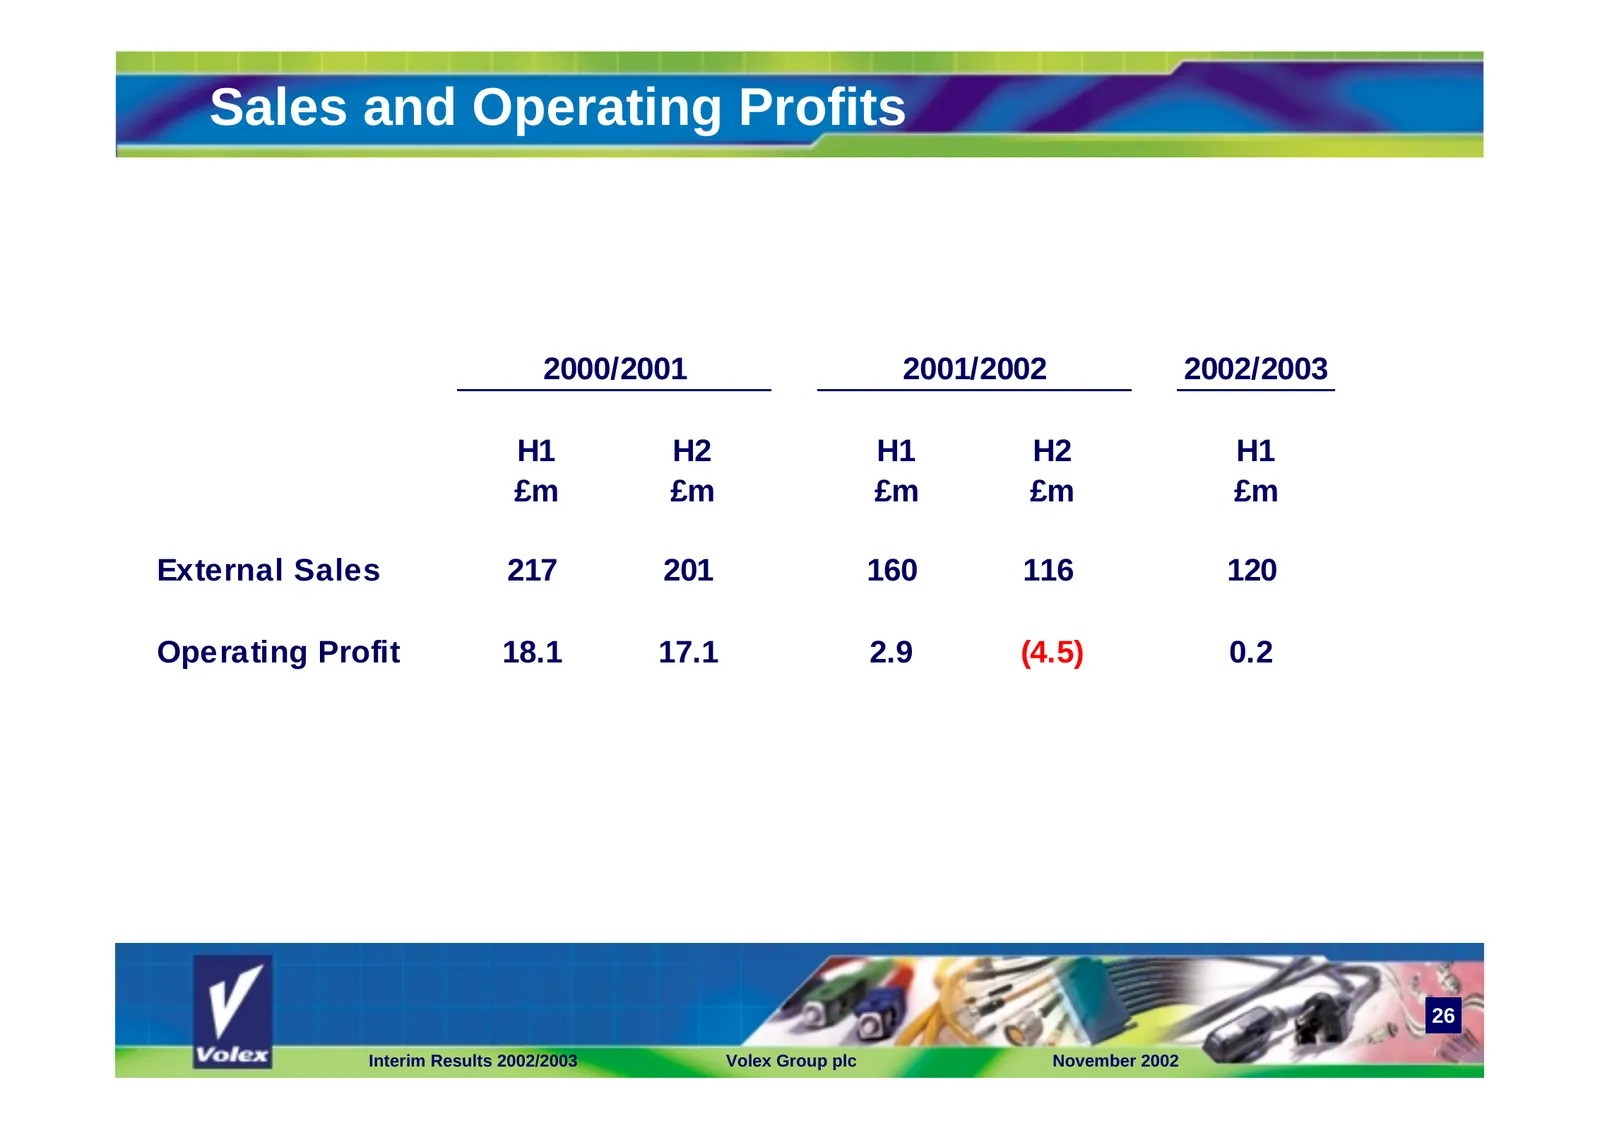
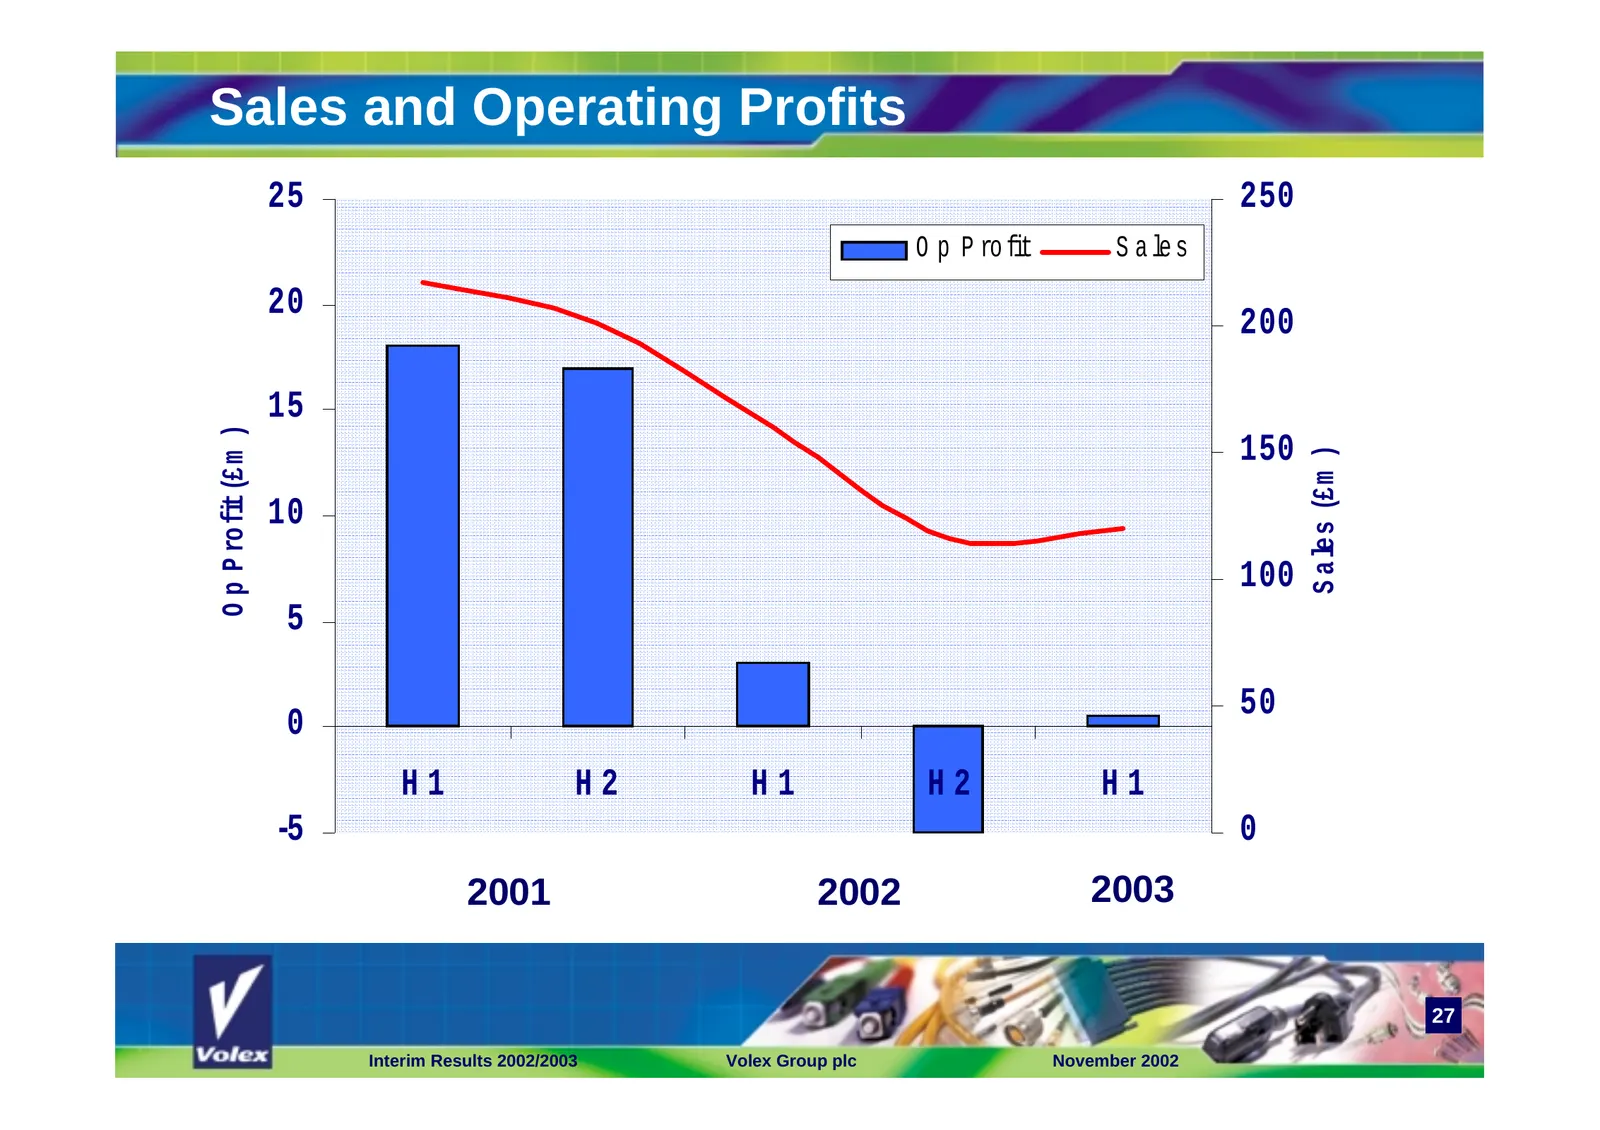
Sales and Operating Profits 2000/2001 2001/2002 2002/2003 H1 H2 H1 H2 H1 £m £m £m £m £m External Sales 217 201 160 116 120 Operating Profit 18.1 17.1 2.9 (4.5) 0.2 26 Interim Results 2002/2003 Volex Group plc November 2002
Slide 27: Sales and Operating Profits
Sales and Operating Profits 25 250 O p P ro fit S a le s 20 200 15 O p P ro fit (£m ) 150 S ales (£m ) 10 100 5 50 0 H1 H2 H1 H2 H1 -5 0 2001 2002 2003 27 Interim Results 2002/2003 Volex Group plc November 2002
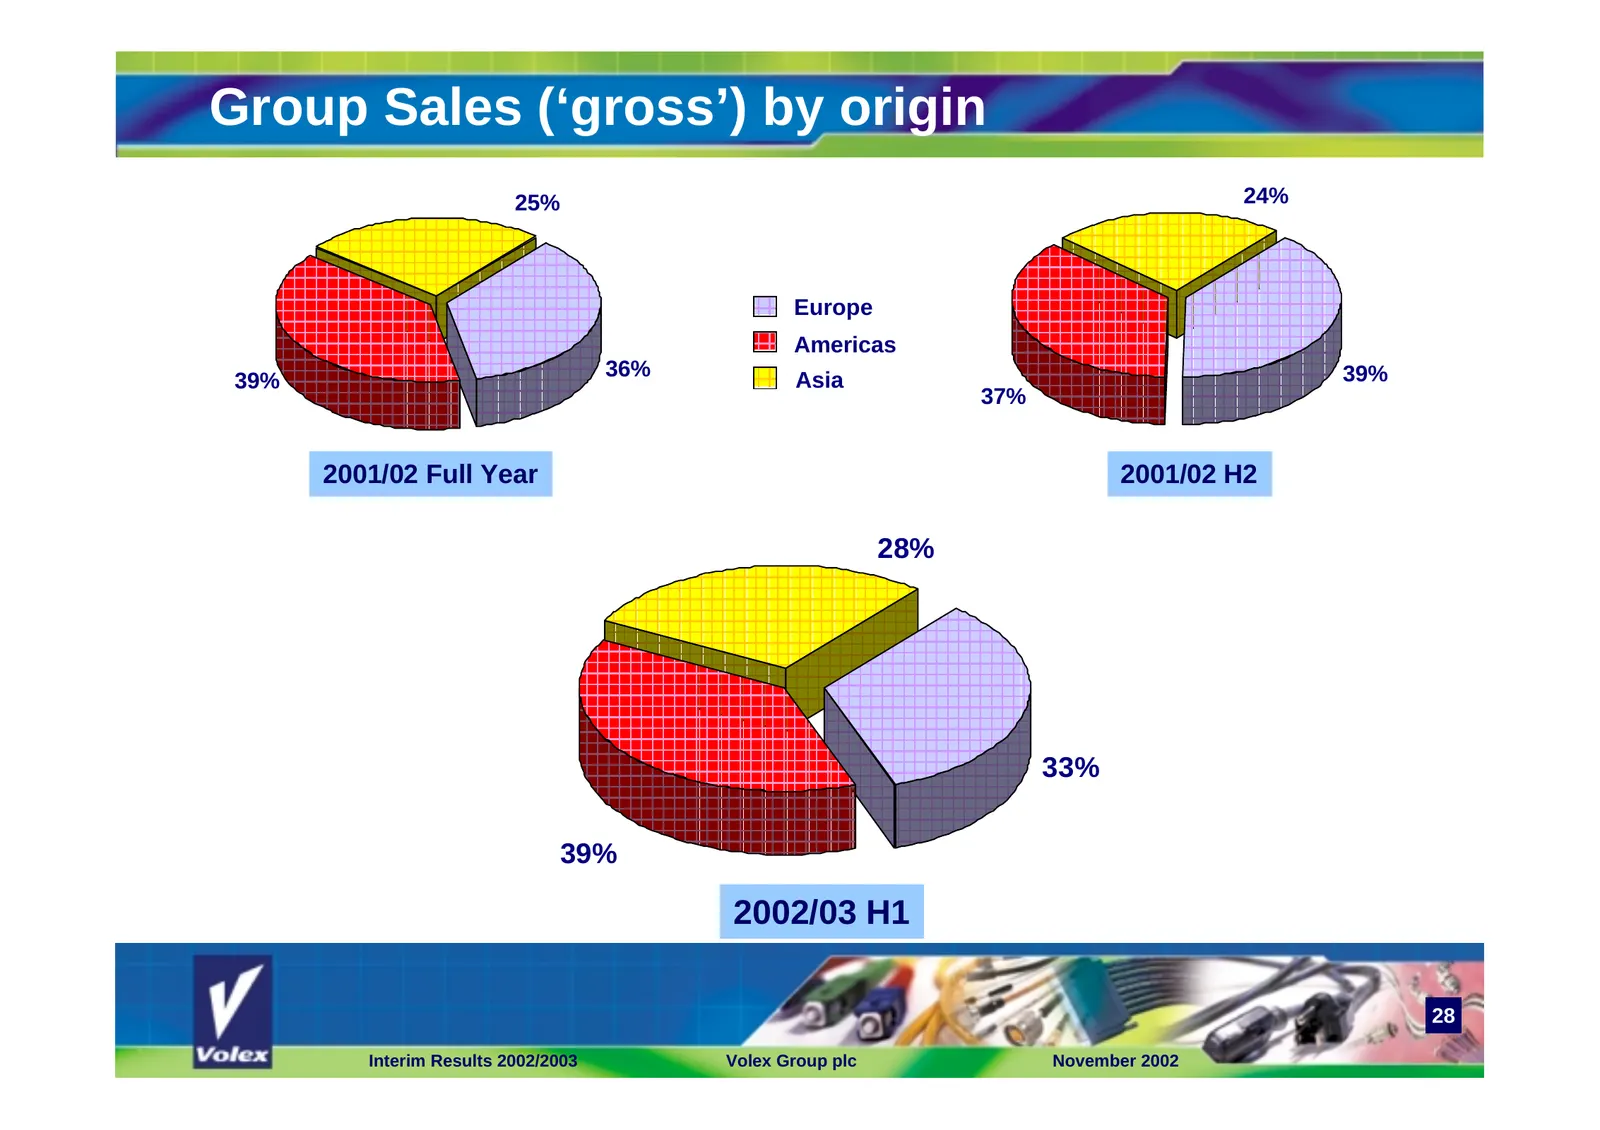
Slide 28: Group Sales (‘gross’) by origin
Group Sales (‘gross’) by origin 25% 24% Europe Americas 36% 39% 39% Asia 37% 2001/02 Full Year 2001/02 H2 28% 33% 39% 2002/03 H1 28 Interim Results 2002/2003 Volex Group plc November 2002
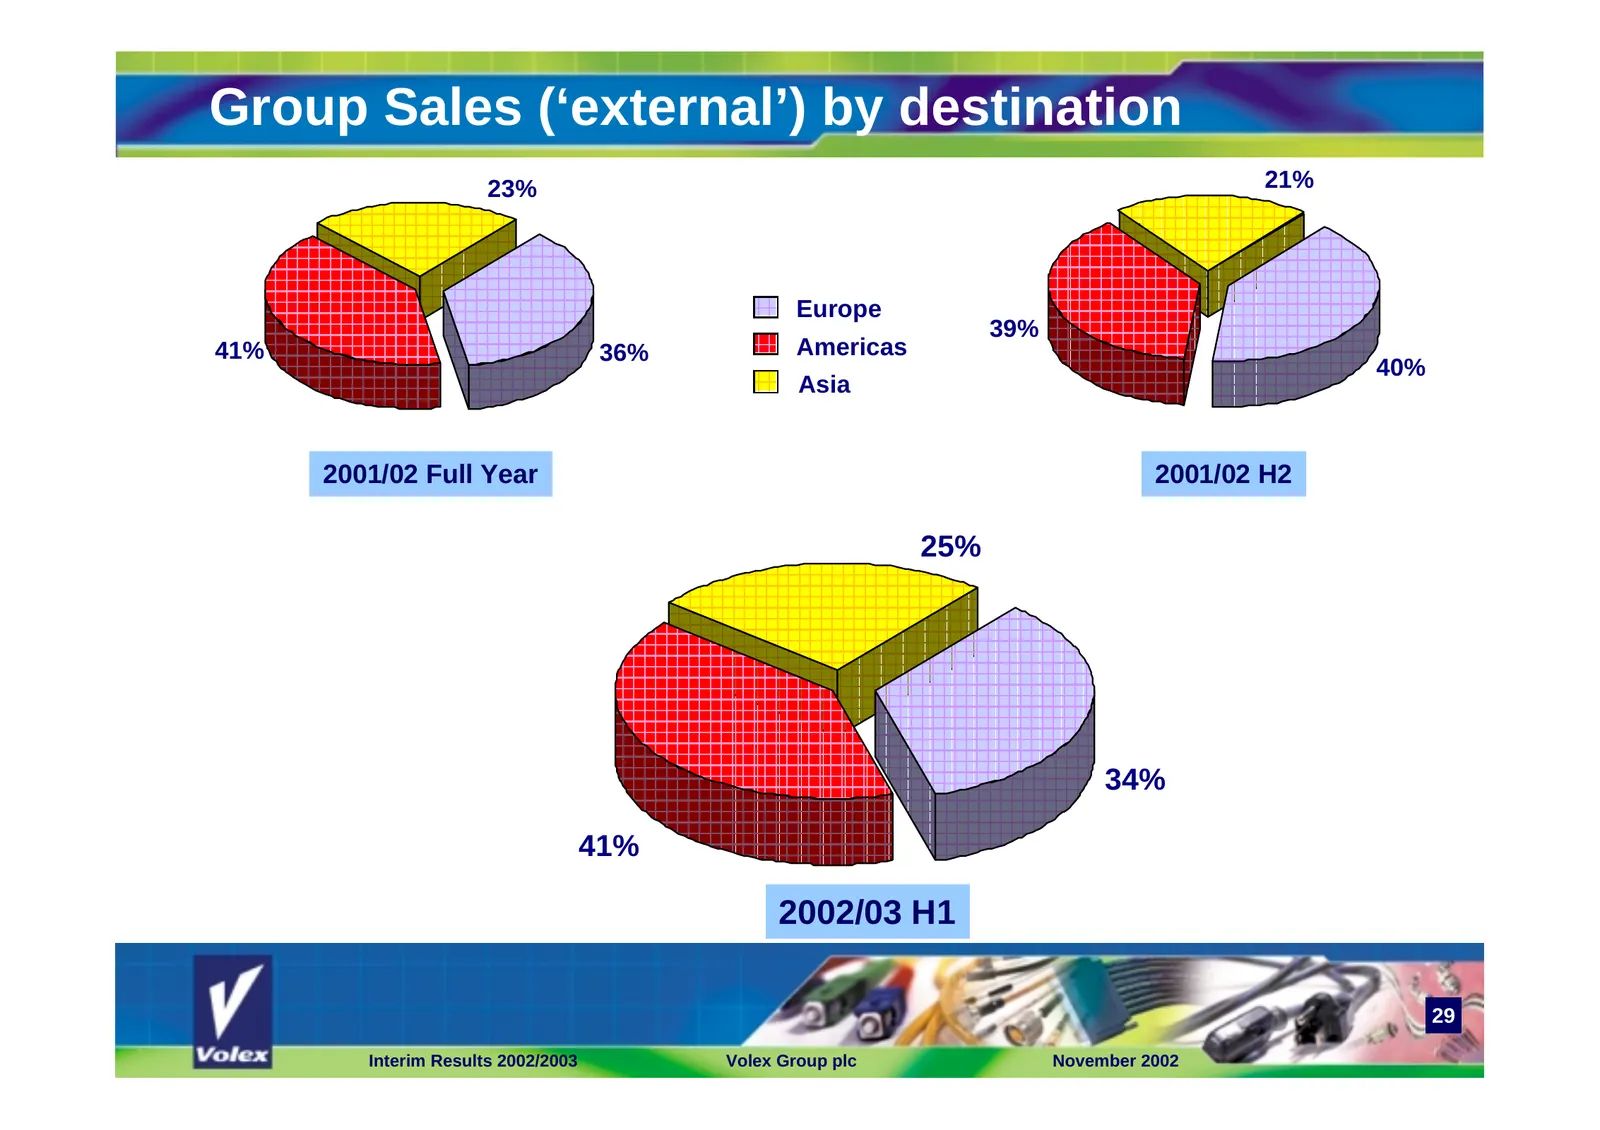
Slide 29: Group Sales (‘external’) by destination
Group Sales (‘external’) by destination 23% 21% Europe 39% 41% 36% Americas 40% Asia 2001/02 Full Year 2001/02 H2 25% 34% 41% 2002/03 H1 29 Interim Results 2002/2003 Volex Group plc November 2002
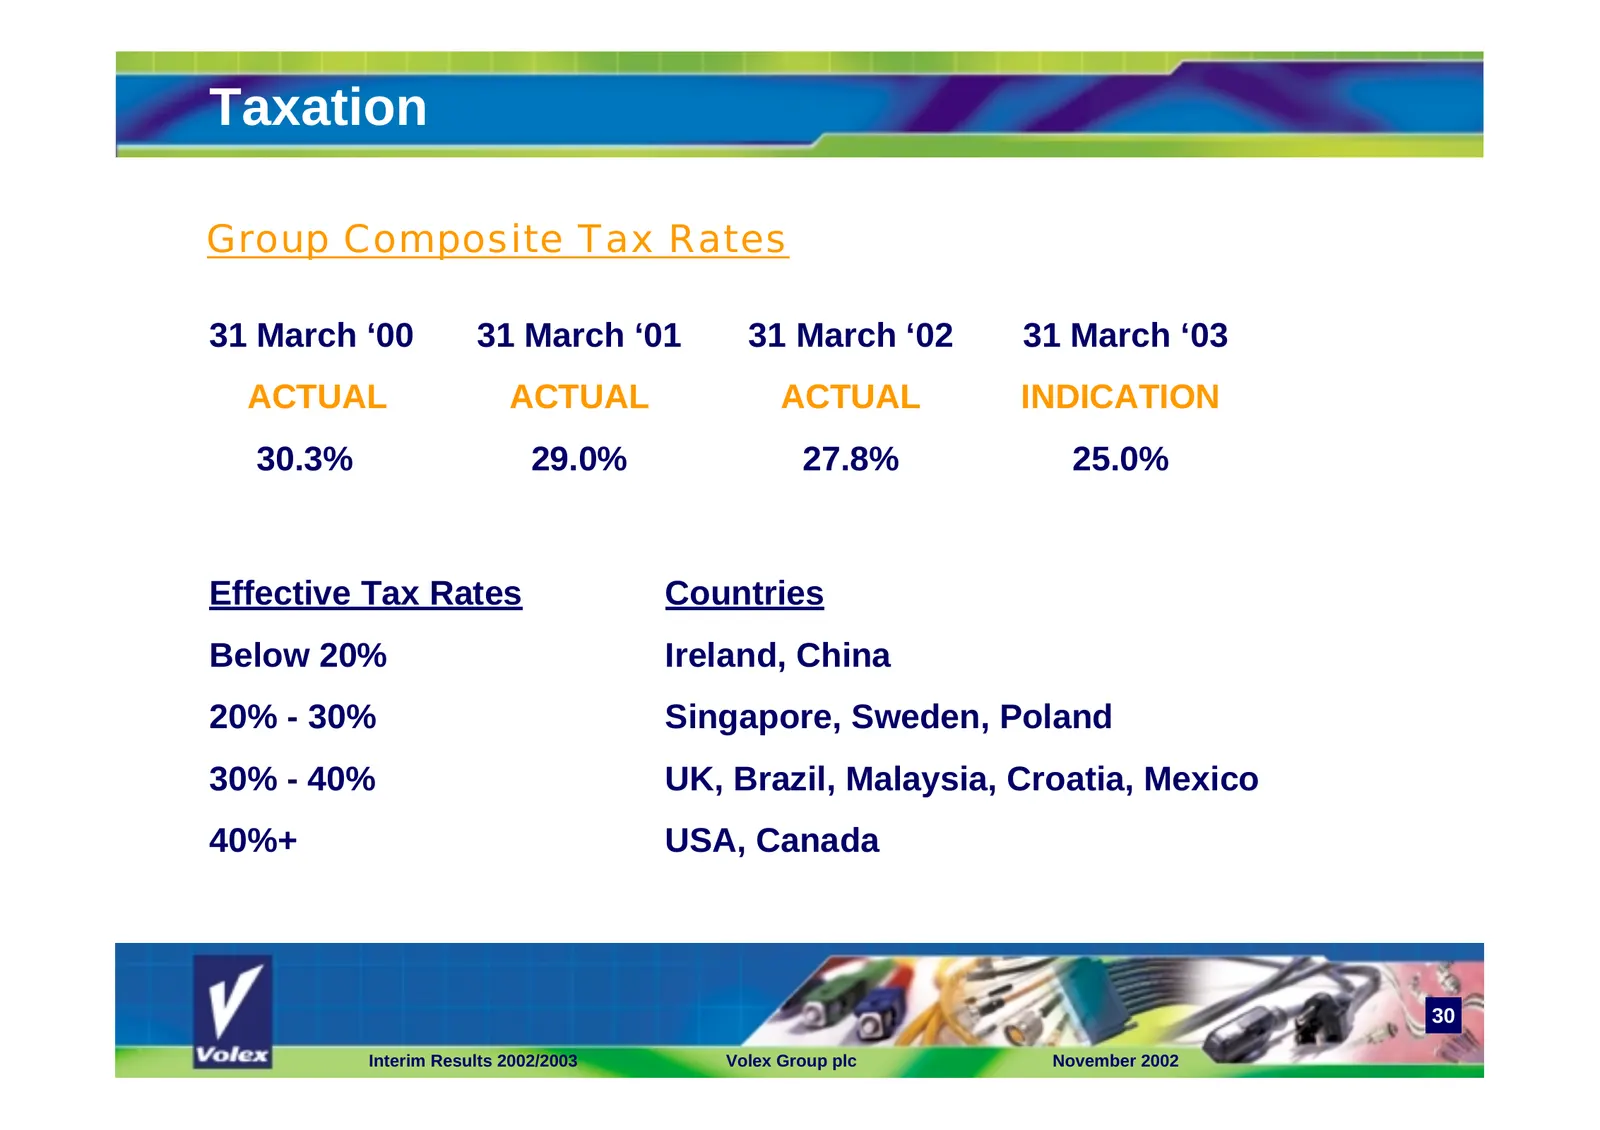
Slide 30: Taxation
Taxation Group Composite Tax Rates 31 March ‘00 31 March ‘01 31 March ‘02 31 March ‘03 ACTUAL ACTUAL ACTUAL INDICATION 30.3% 29.0% 27.8% 25.0% Effective Tax Rates Countries Below 20% Ireland, China 20% - 30% Singapore, Sweden, Poland 30% - 40% UK, Brazil, Malaysia, Croatia, Mexico 40%+ USA, Canada 3
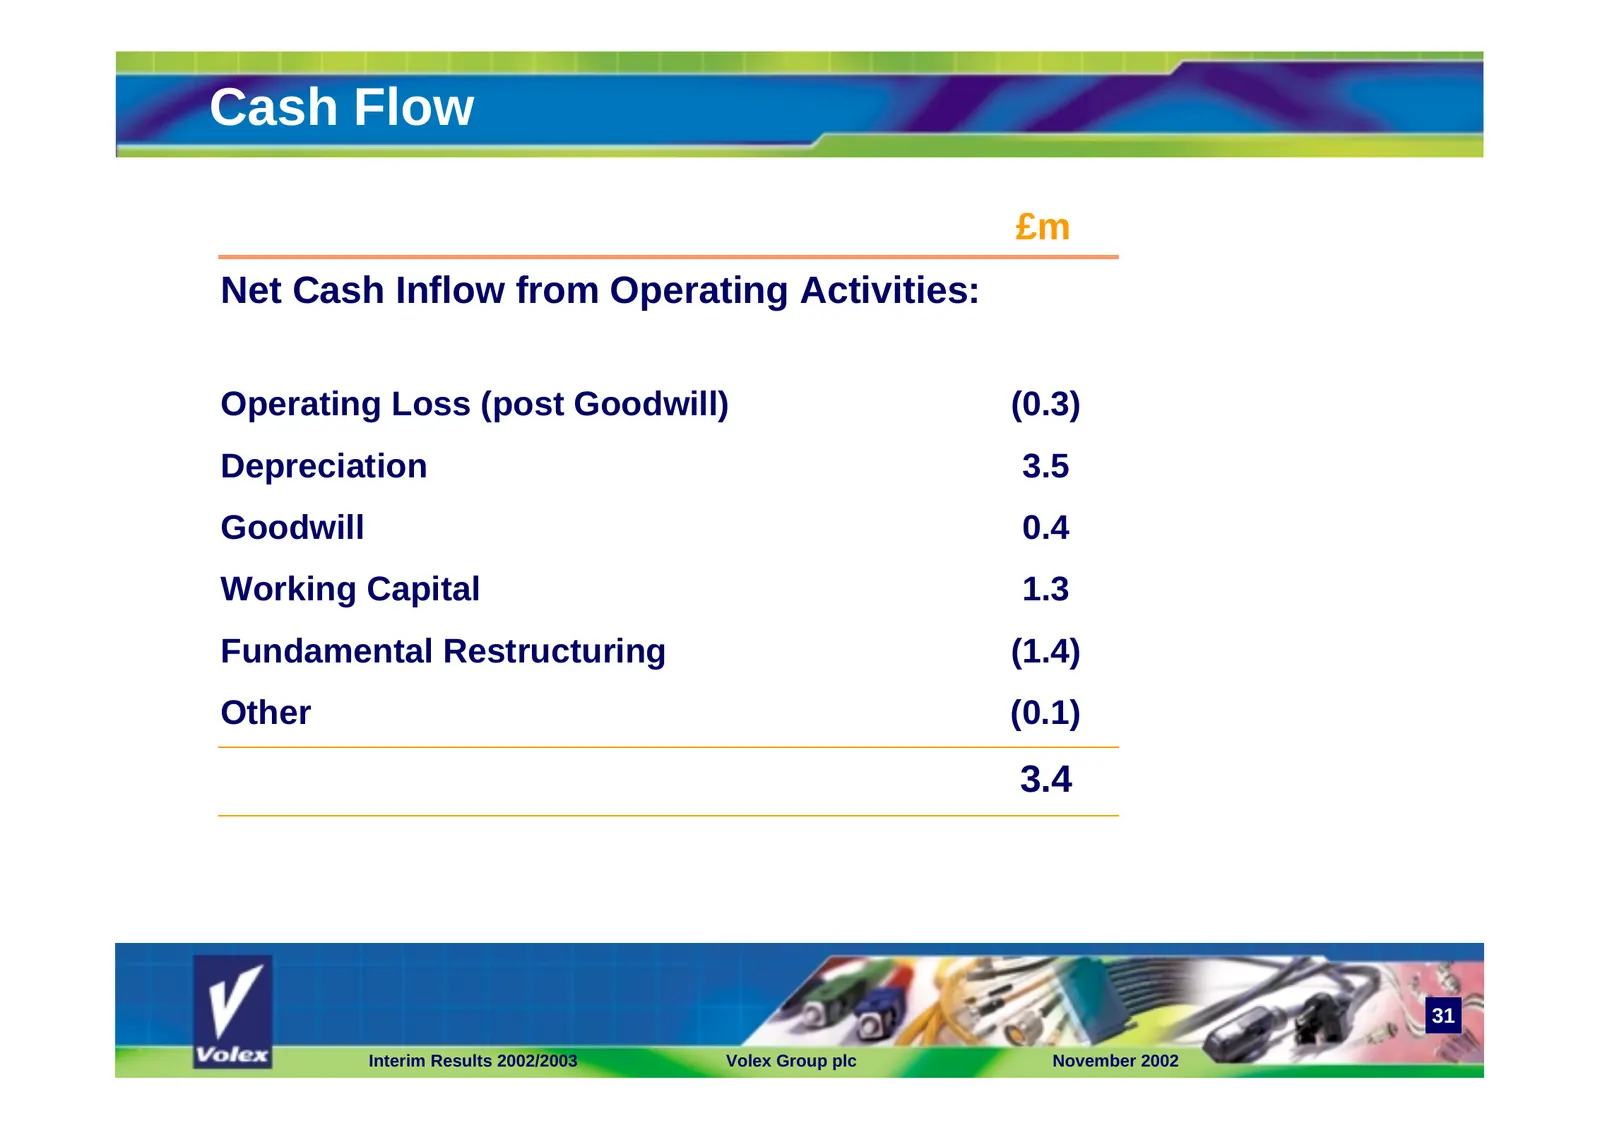
Slide 31: Cash Flow
Cash Flow £m Net Cash Inflow from Operating Activities: Operating Loss (post Goodwill) (0.3) Depreciation 3.5 Goodwill 0.4 Working Capital 1.3 Fundamental Restructuring (1.4) Other (0.1) 3.4 31 Interim Results 2002/2003 Volex Group plc November 2002
Slide 32: Cash Flow continued
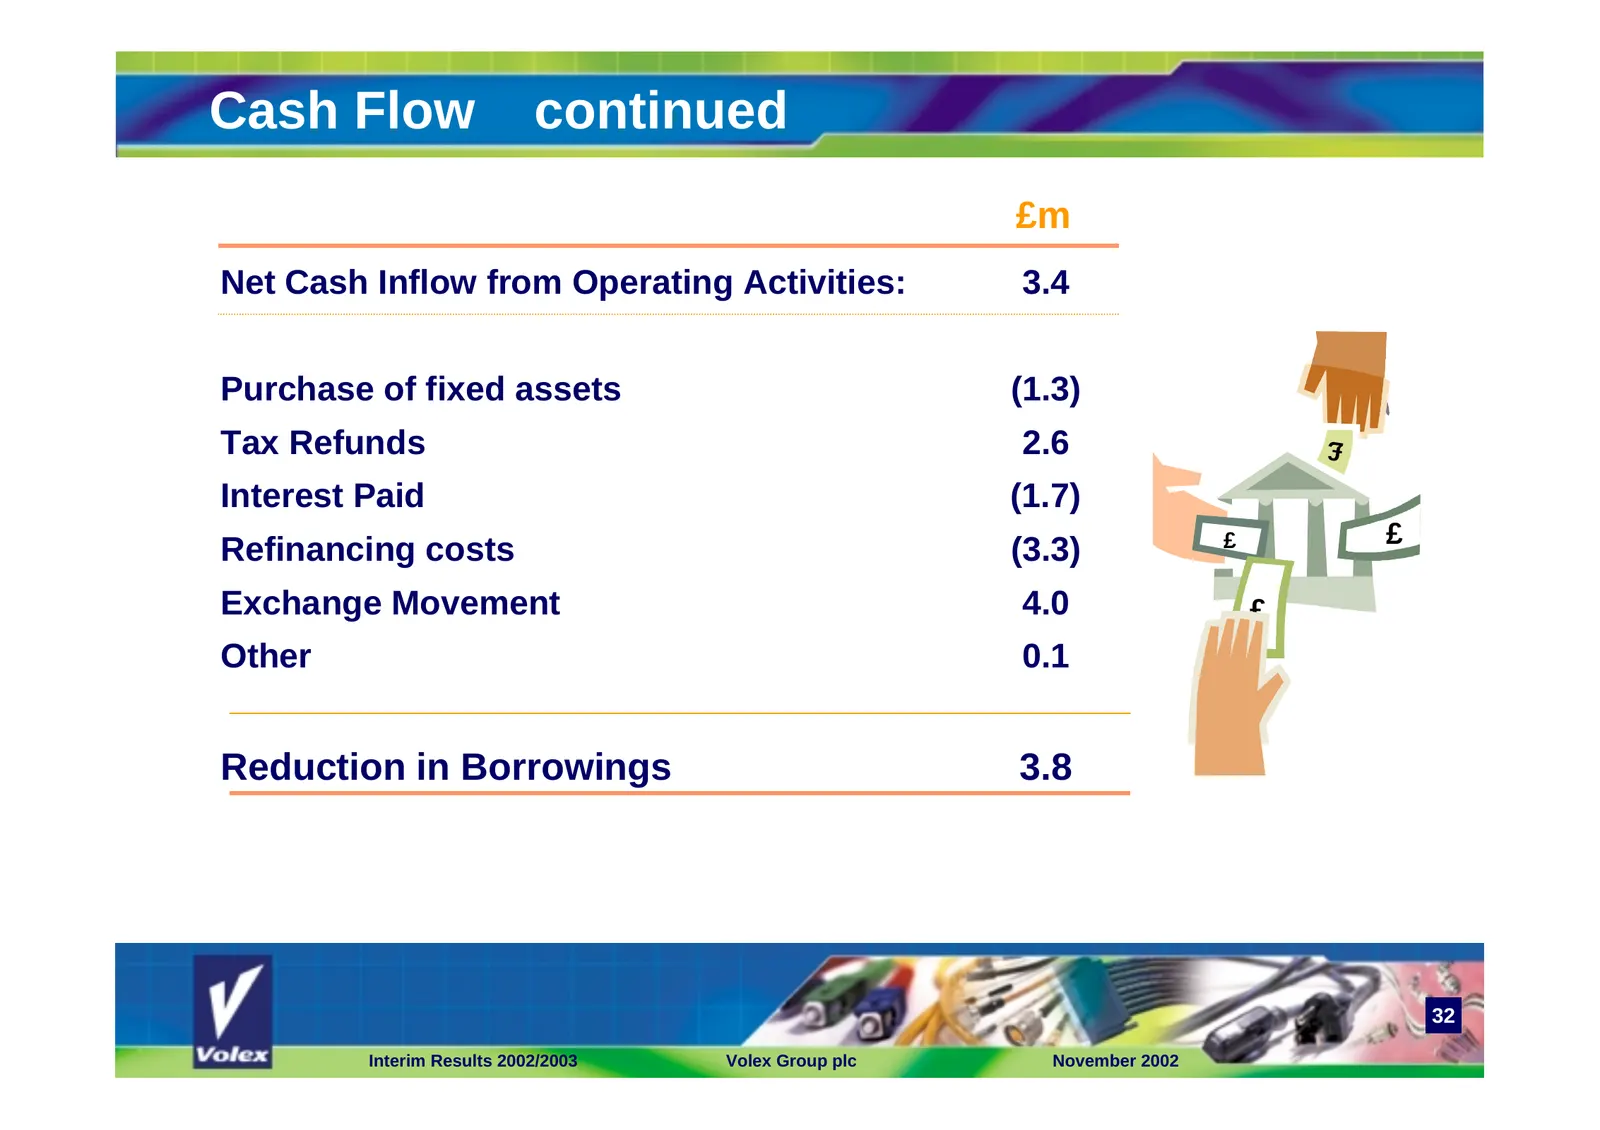
Cash Flow continued £m Net Cash Inflow from Operating Activities: 3.4 Purchase of fixed assets (1.3) Tax Refunds 2.6 £ Interest Paid (1.7) £ £ Refinancing costs (3.3) Exchange Movement 4.0 £ Other 0.1 Reduction in Borrowings 3.8 32 Interim Results 2002/2003 Volex Group plc November 2002
Slide 33: Borrowings/Deposits
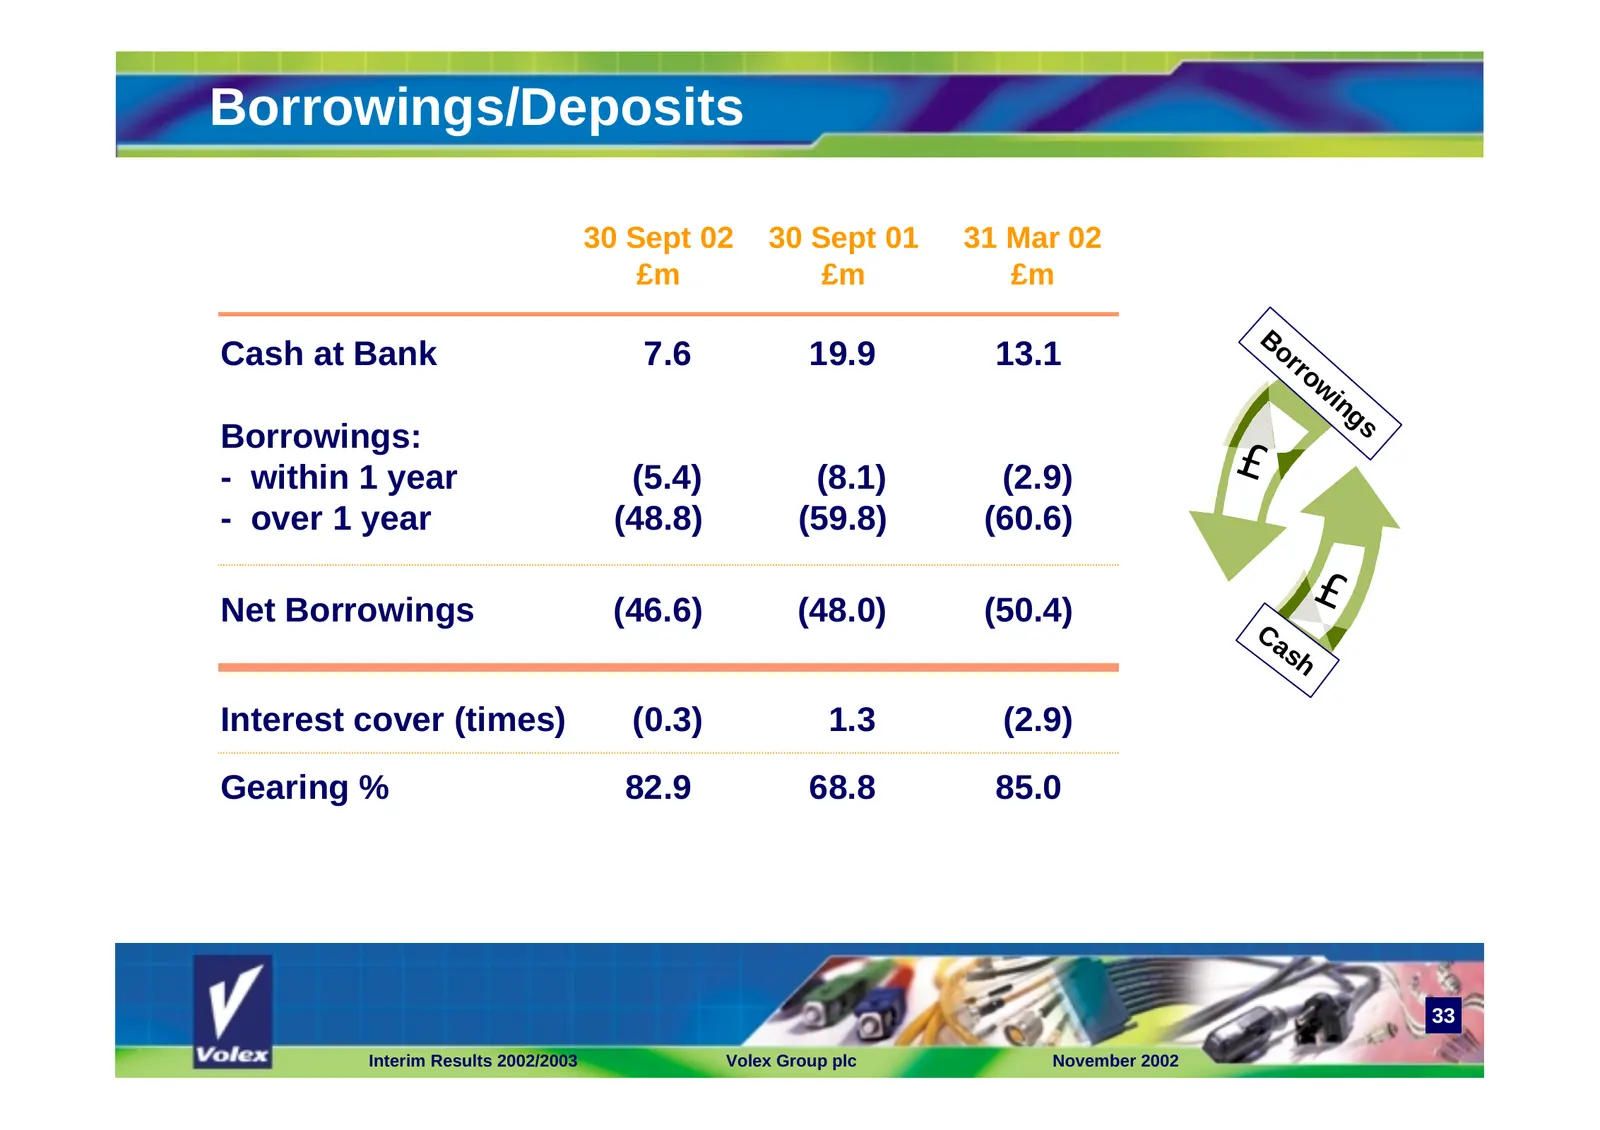
Borrowings/Deposits 30 Sept 02 30 Sept 01 31 Mar 02 £m £m £m Bo Cash at Bank 7.6 19.9 13.1 rr ow in gs £ Borrowings: - within 1 year (5.4) (8.1) (2.9) - over 1 year (48.8) (59.8) (60.6) Net Borrowings (46.6) (48.0) (50.4) £ Ca sh Interest cover (times) (0.3) 1.3 (2.9) Gearing % 82.9 68.8 85.0 33 Int
Slide 34: Bank Covenants
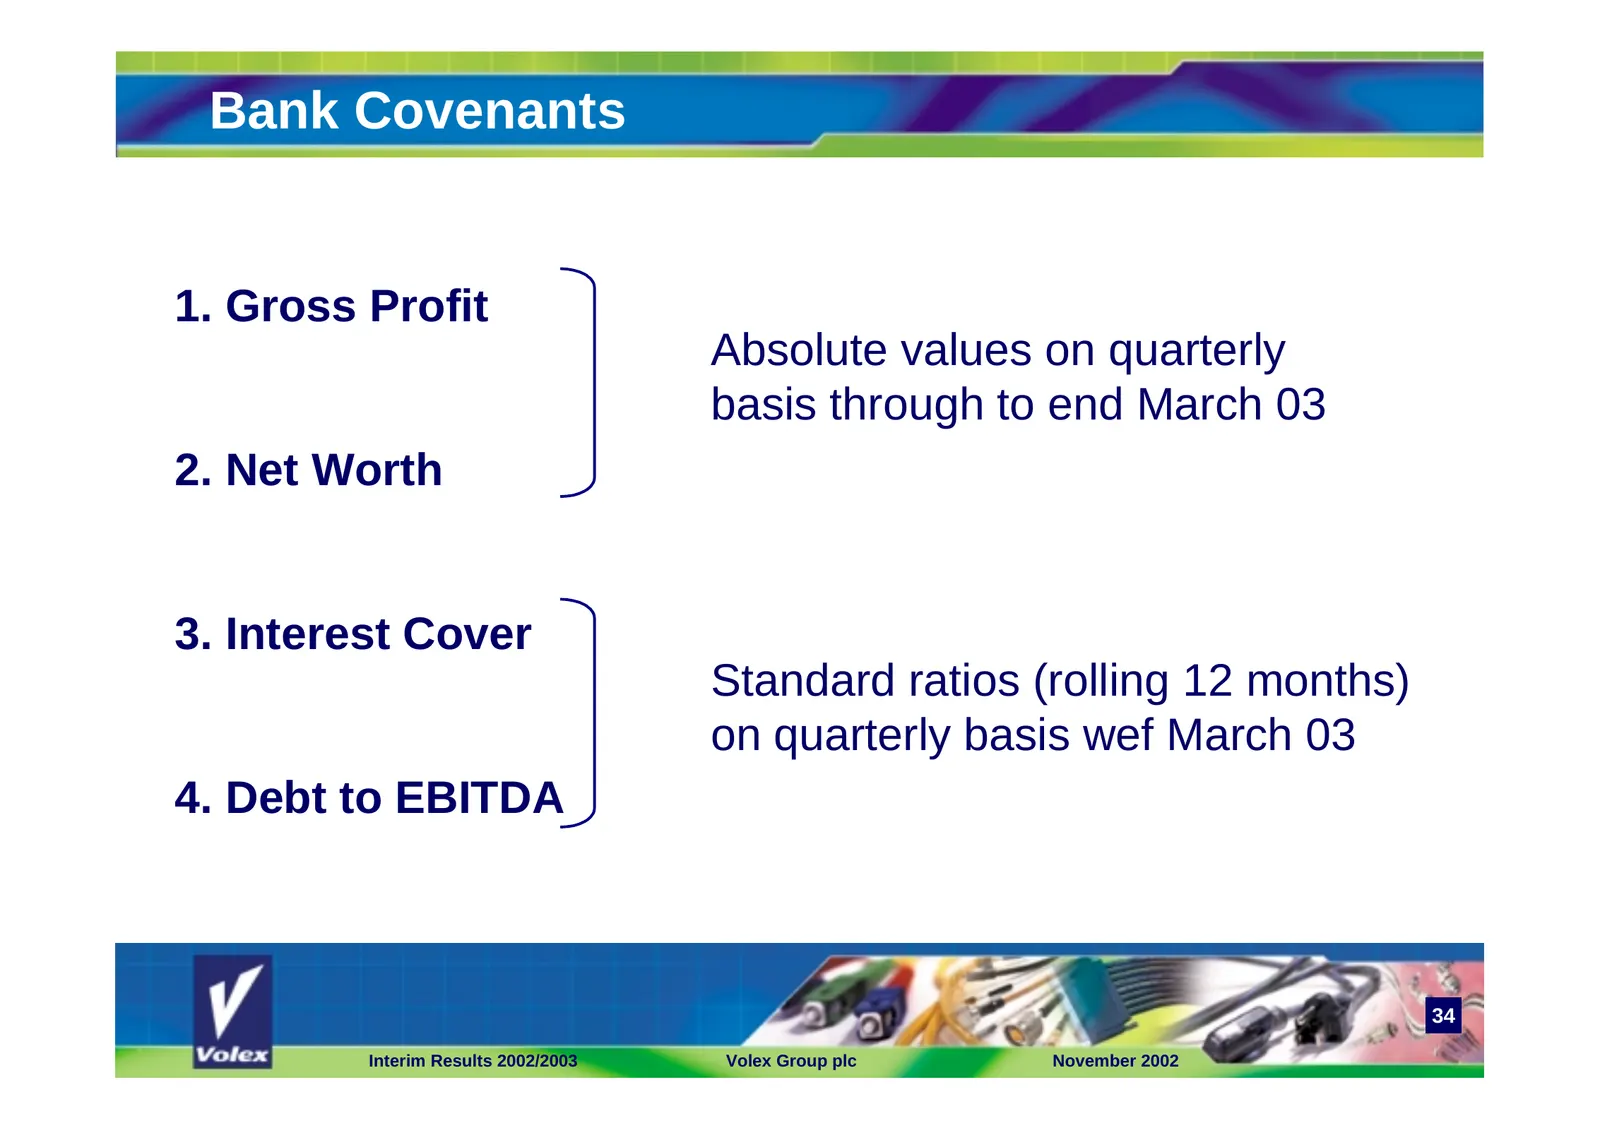
Bank Covenants 1. Gross Profit Absolute values on quarterly basis through to end March 03 2. Net Worth 3. Interest Cover Standard ratios (rolling 12 months) on quarterly basis wef March 03 4. Debt to EBITDA 34 Interim Results 2002/2003 Volex Group plc November 2002
Slide 35: Group Capital Expenditure
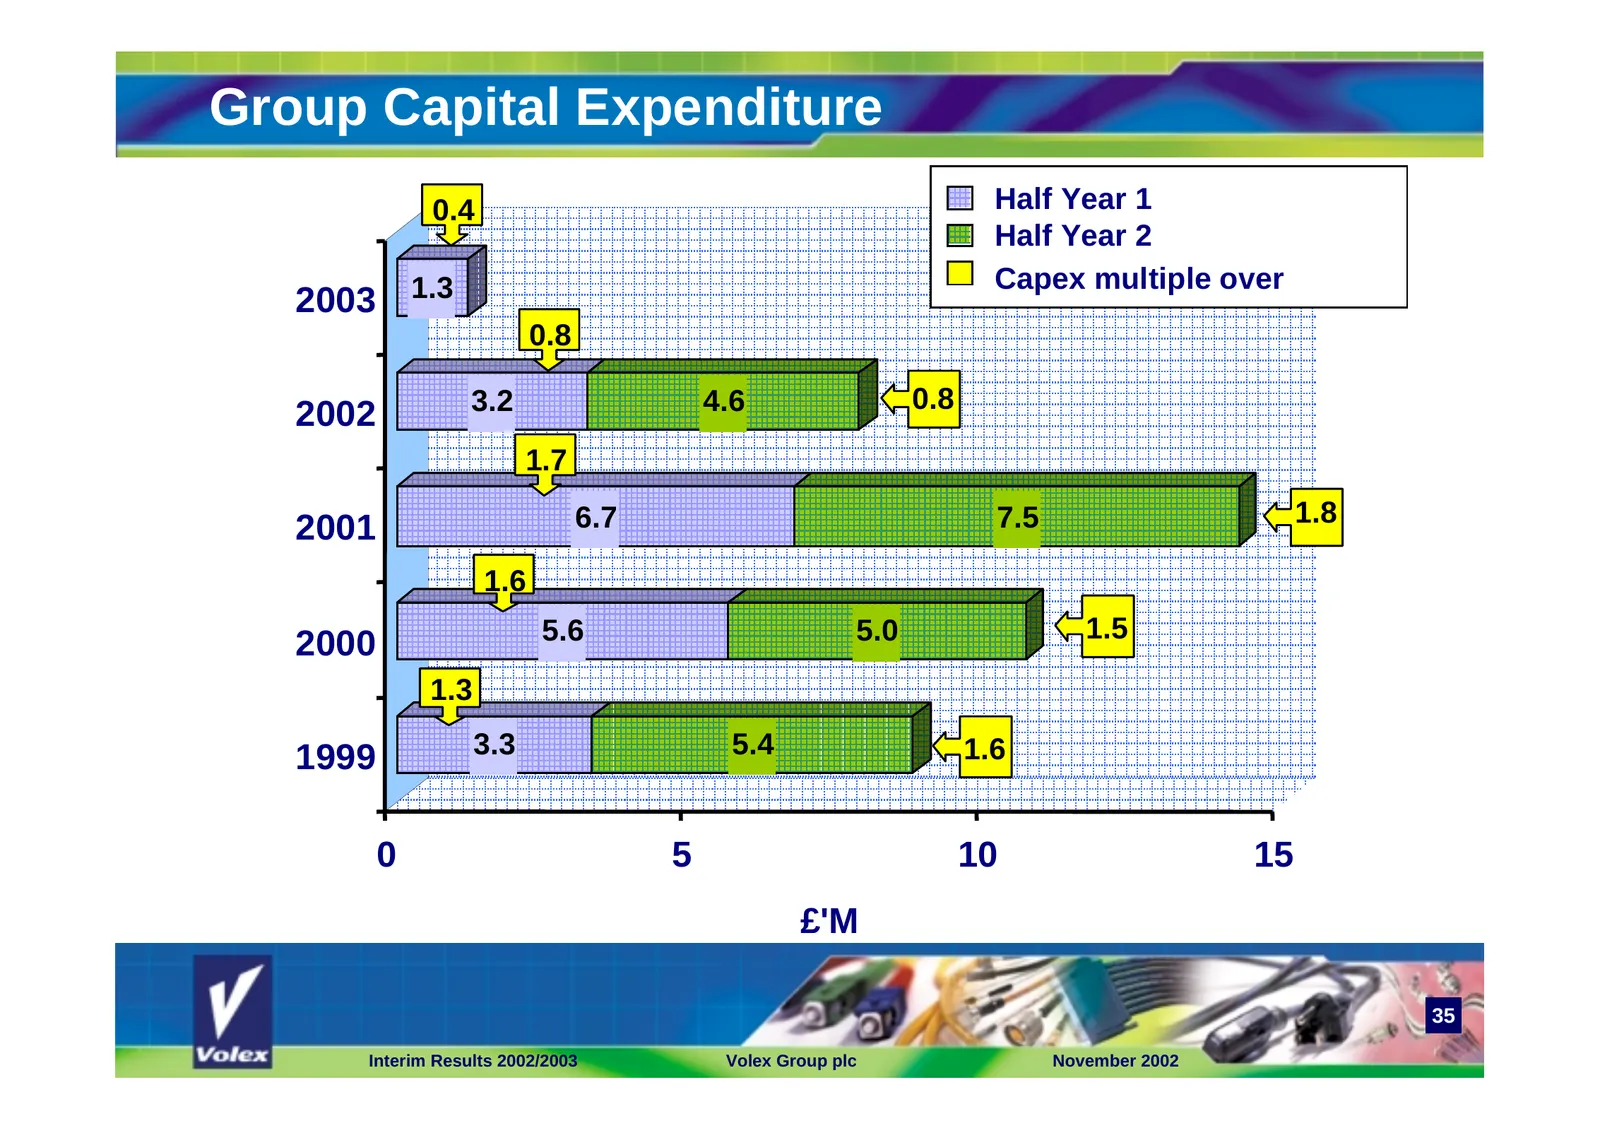
Group Capital Expenditure 0.4 Half Year 1 Half Year 2 Capex multiple over 2003 1.3 0.8 3.2 4.6 0.8 2002 1.7 6.7 7.5 1.8 2001 1.6 5.6 5.0 1.5 2000 1.3 1999 3.3 5.4 1.6 0 5 10 15 £'M 35 Interim Results 2002/2003 Volex Group plc November 2002

Slide 36: The Future
Volex Group p.l.c. The Future
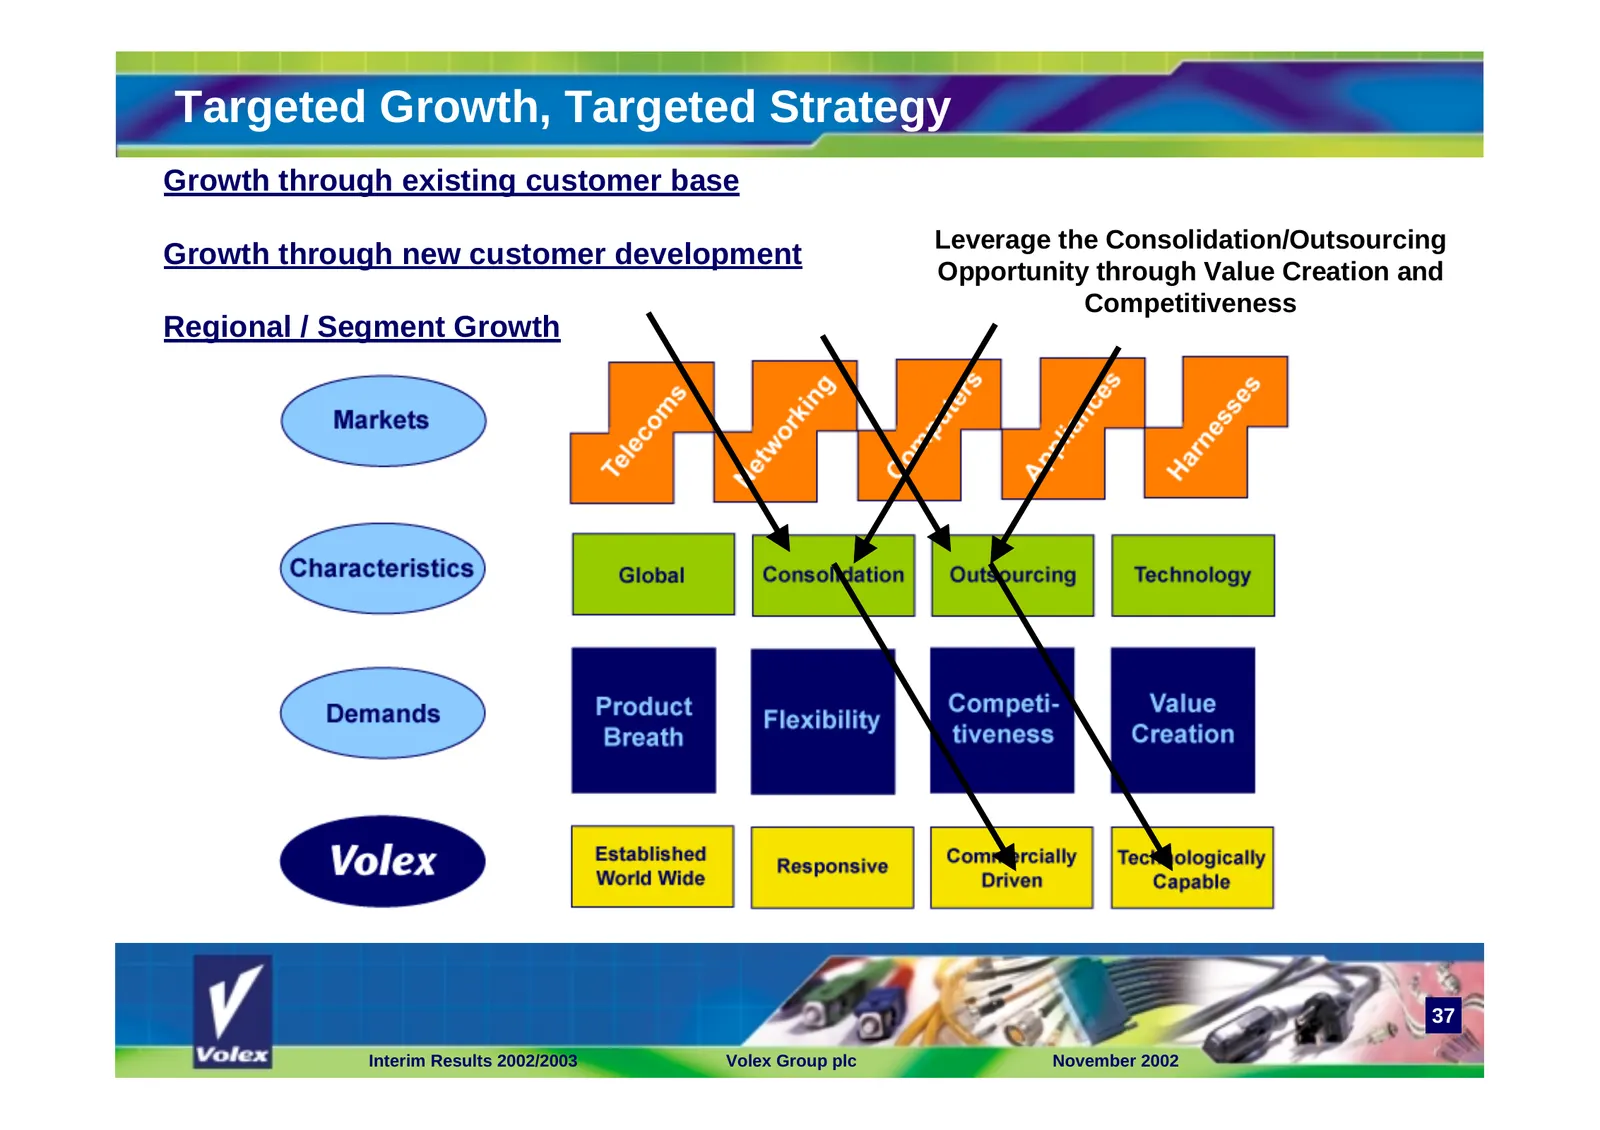
Slide 37: Targeted Growth, Targeted Strategy
Targeted Growth, Targeted Strategy Growth through existing customer base Leverage the Consolidation/Outsourcing Growth through new customer development Opportunity through Value Creation and Competitiveness Regional / Segment Growth 37 Interim Results 2002/2003 Volex Group plc November 2002
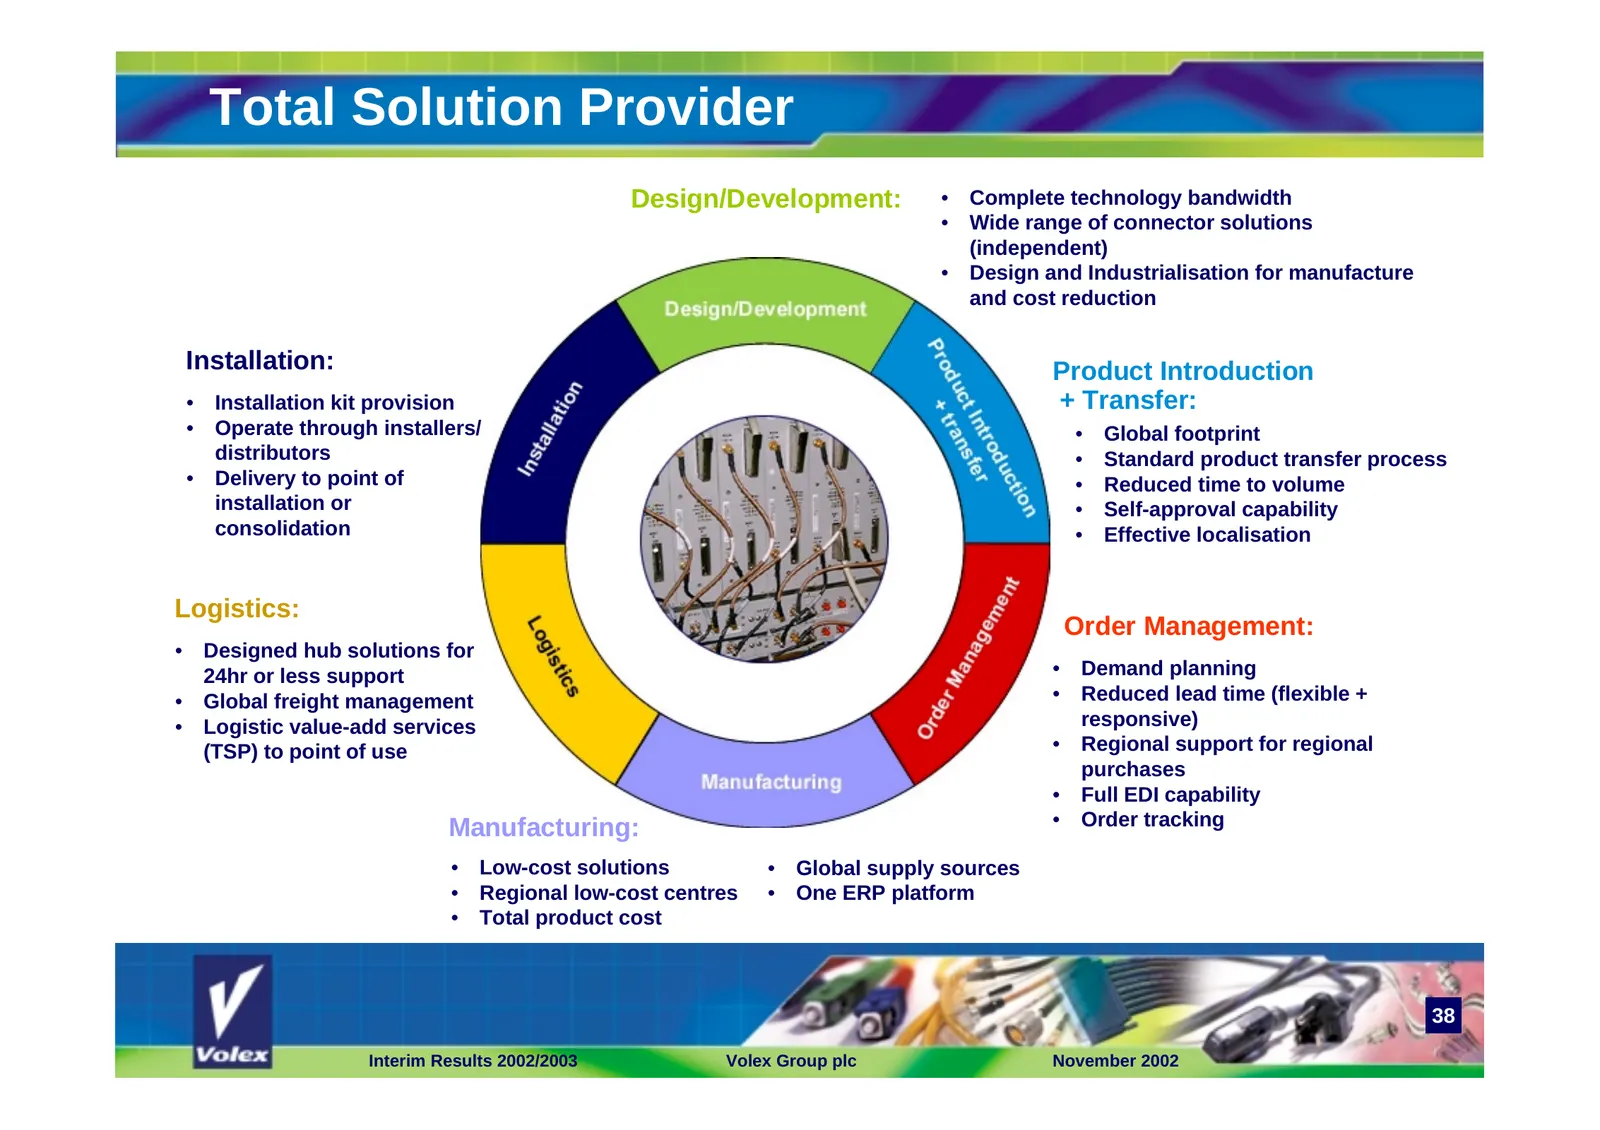
Slide 38: Total Solution Provider
Total Solution Provider Design/Development: • Complete technology bandwidth • Wide range of connector solutions (independent) • Design and Industrialisation for manufacture and cost reduction Installation: Product Introduction • Installation kit provision + Transfer: • Operate through installers/ •
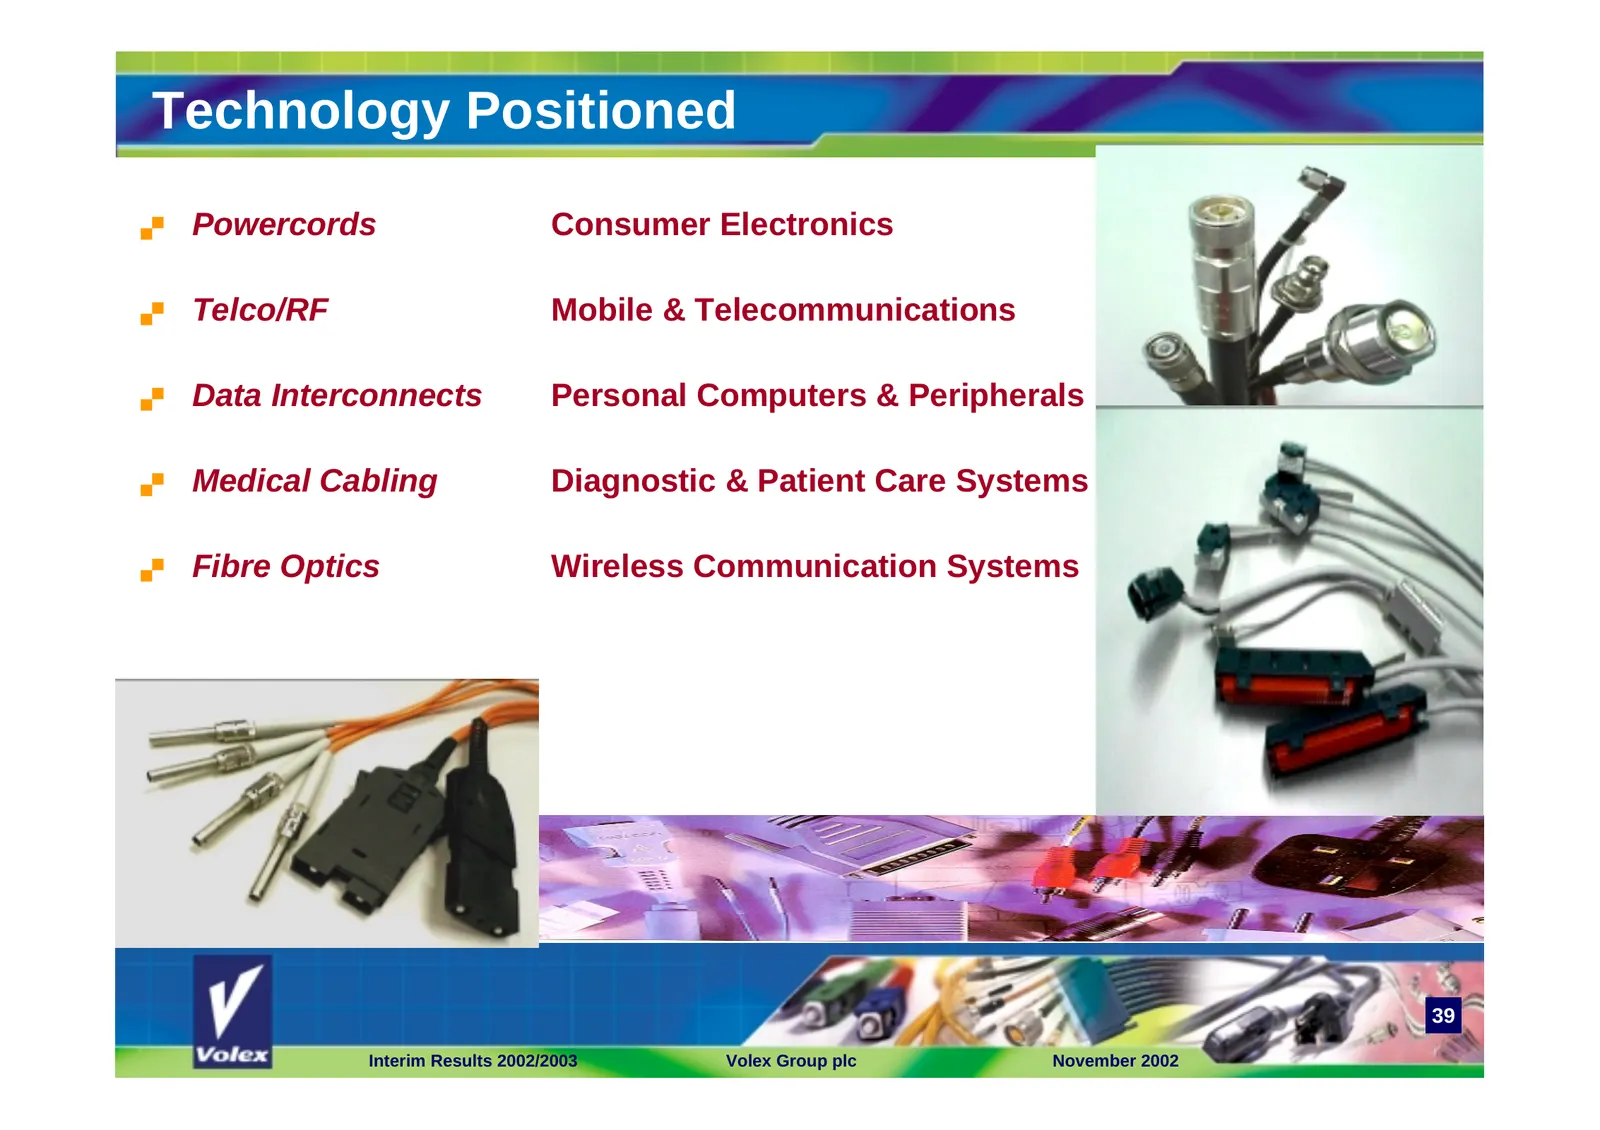
Slide 39: Technology Positioned
Technology Positioned ! Powercords Consumer Electronics ! Telco/RF Mobile & Telecommunications ! Data Interconnects Personal Computers & Peripherals ! Medical Cabling Diagnostic & Patient Care Systems ! Fibre Optics Wireless Communication Systems 39 Interim Results 2002/2003 Volex Group plc November
Slide 40: Risks and Opportunities
Risks and Opportunities ! Structural changes within customer base Volex has managed through initial phases and now covers the ‘Top Five’ EMS Providers– We are gaining share through exposure to EMS opportunities ! Price pressures remain Volex has taken action to correct cost base, AVL control - freed
Slide 41: The Future
The Future ! Deliver 2nd half growth on H1 revenue performance ! Improved gross and operating margins ! Continued debt reduction ! Strategy for growth achieved through increased market share ! Satisfactory growth and profitability 41 Interim Results 2002/2003 Volex Group plc November 2002

Slide 42: Questions
Volex Group p.l.c. Questions
Source: Internet Archive copy of volex.com
More decks from Volex plc
 H1 FY2027 Earnings Presentation29 slides · Nov 12, 2026
 FY2026 Earnings Presentation34 slides · June 2026
 Investor Day (April 2026)67 slides · April 2026
 H1 FY2026 Earnings Presentation29 slides · Nov 12, 2025
 FY2025 Earnings Presentation38 slides · Jun 26, 2025
 H1 2025 Earnings Presentation26 slides · Nov 15, 2024