Quest Resource Holding Corporation · NASDAQ:QRHC
Quest Resource — Investor Presentation (August 2022)
21 slides from Quest Resource's investor presentation, August 2022
Slide 1: Investor Presentation
I N V E S T O R P R E S E N TAT I O N Quest Resource Holding Corporation (NASDAQ: QRHC) NATIONAL PROVIDER OF WASTE & RECYCLING SOLUTIONS AUGUST © 2022 Quest Resource Holding Corporation. Copying, publication or redistribution outside of Quest is strictly prohibited.
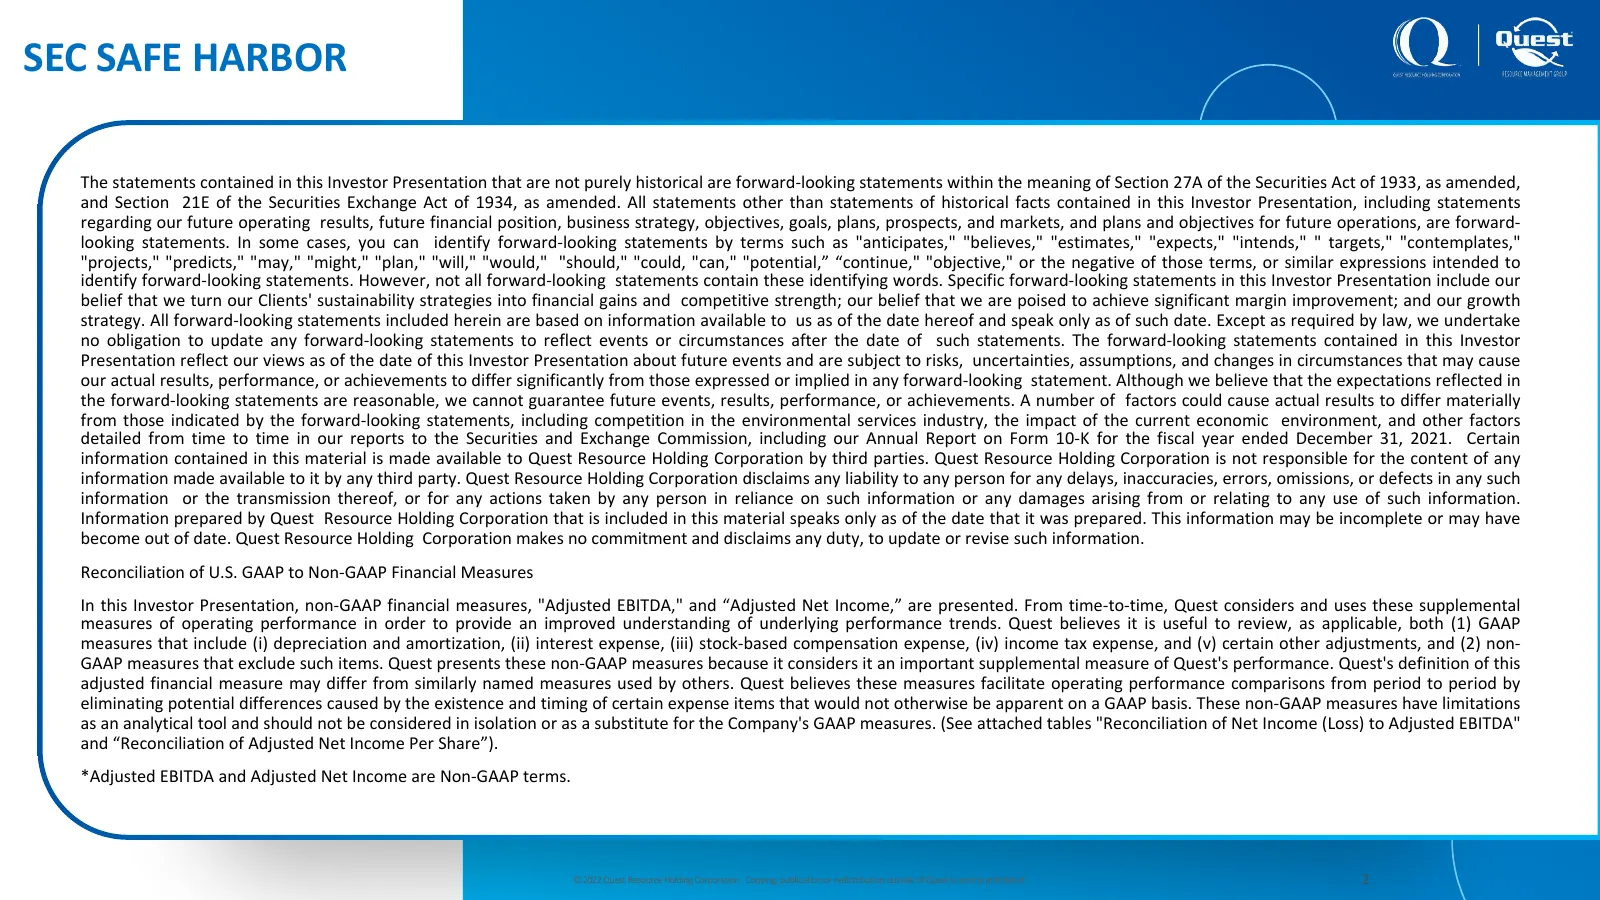
Slide 2: SEC Safe Harbor
SEC SAFE HARBOR The statements contained in this Investor Presentation that are not purely historical are forward-looking statements within the meaning of Section 27A of the Securities Act of 1933, as amended, and Section 21E of the Securities Exchange Act of 1934, as amended. All statements other t
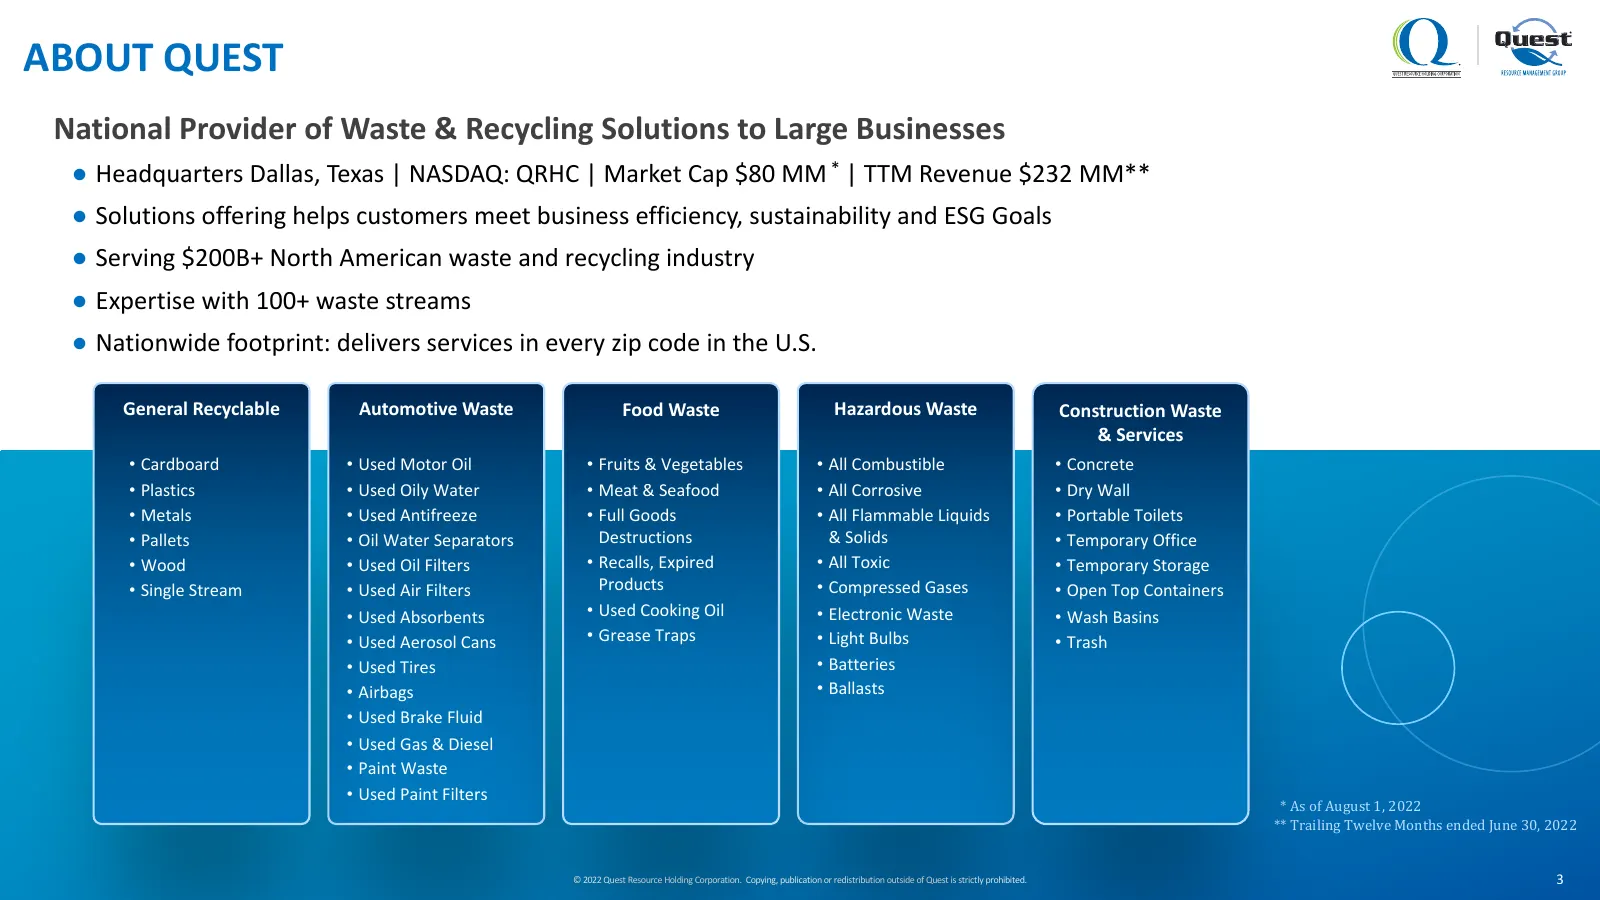
Slide 3: About Quest
ABOUT QUEST National Provider of Waste & Recycling Solutions to Large Businesses ● Headquarters Dallas, Texas | NASDAQ: QRHC | Market Cap $80 MM * | TTM Revenue $232 MM** ● Solutions offering helps customers meet business efficiency, sustainability and ESG Goals ● Serving $200B+ North American waste
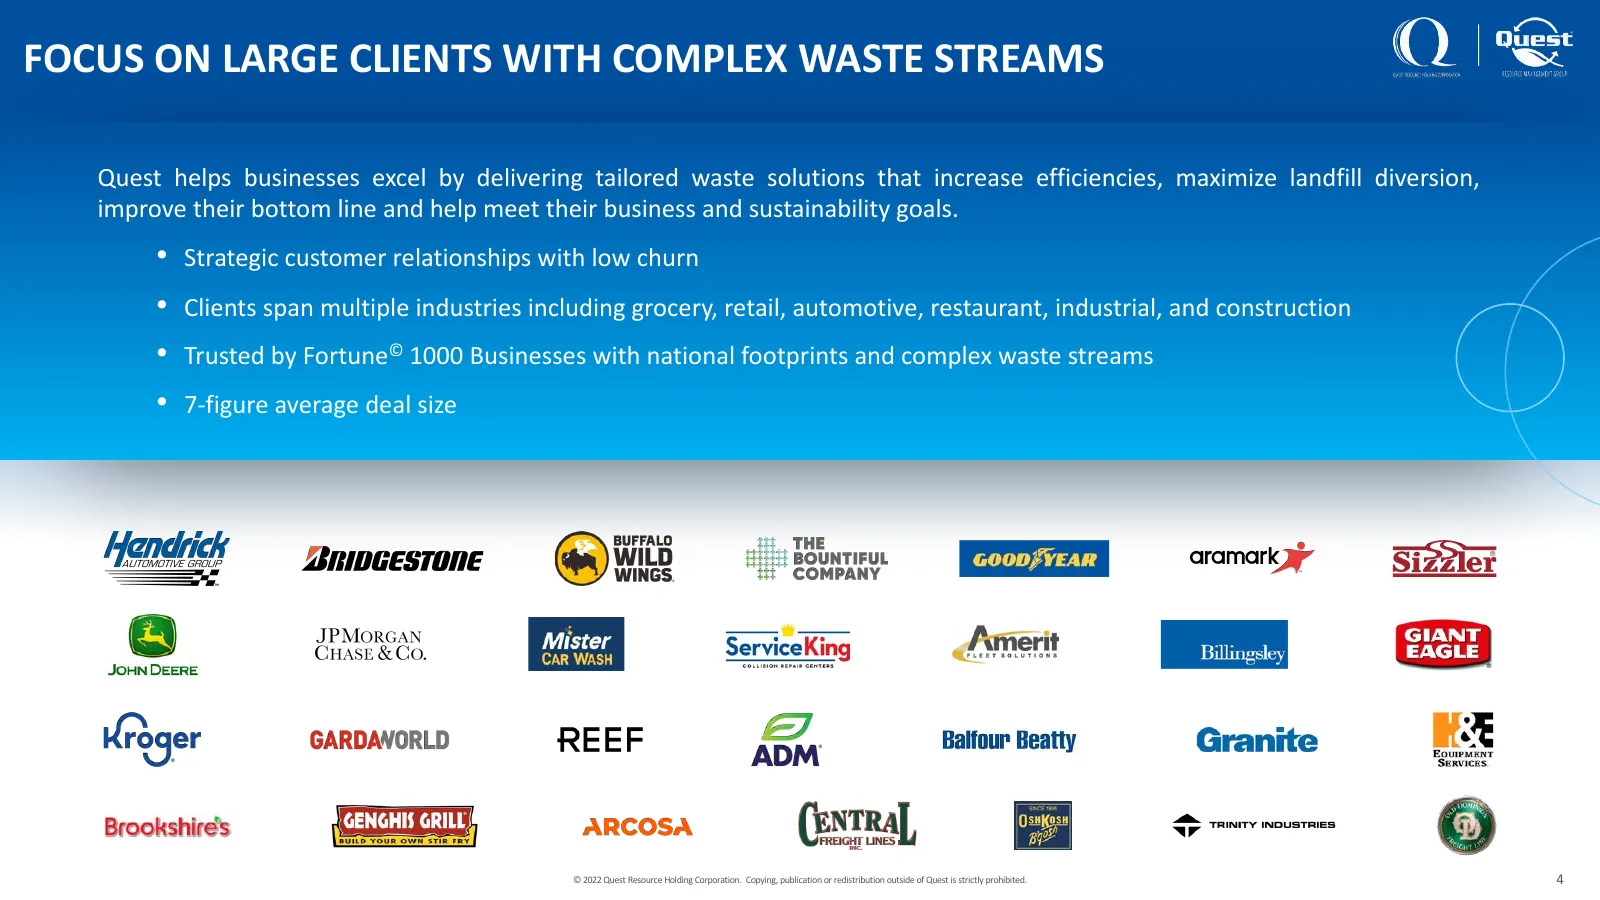
Slide 4: Focus on Large Clients with Complex Waste Streams
FOCUS ON LARGE CLIENTS WITH COMPLEX WASTE STREAMS Quest helps businesses excel by delivering tailored waste solutions that increase efficiencies, maximize landfill diversion, improve their bottom line and help meet their business and sustainability goals. • Strategic customer relationships with low
Slide 5: Business Transformation
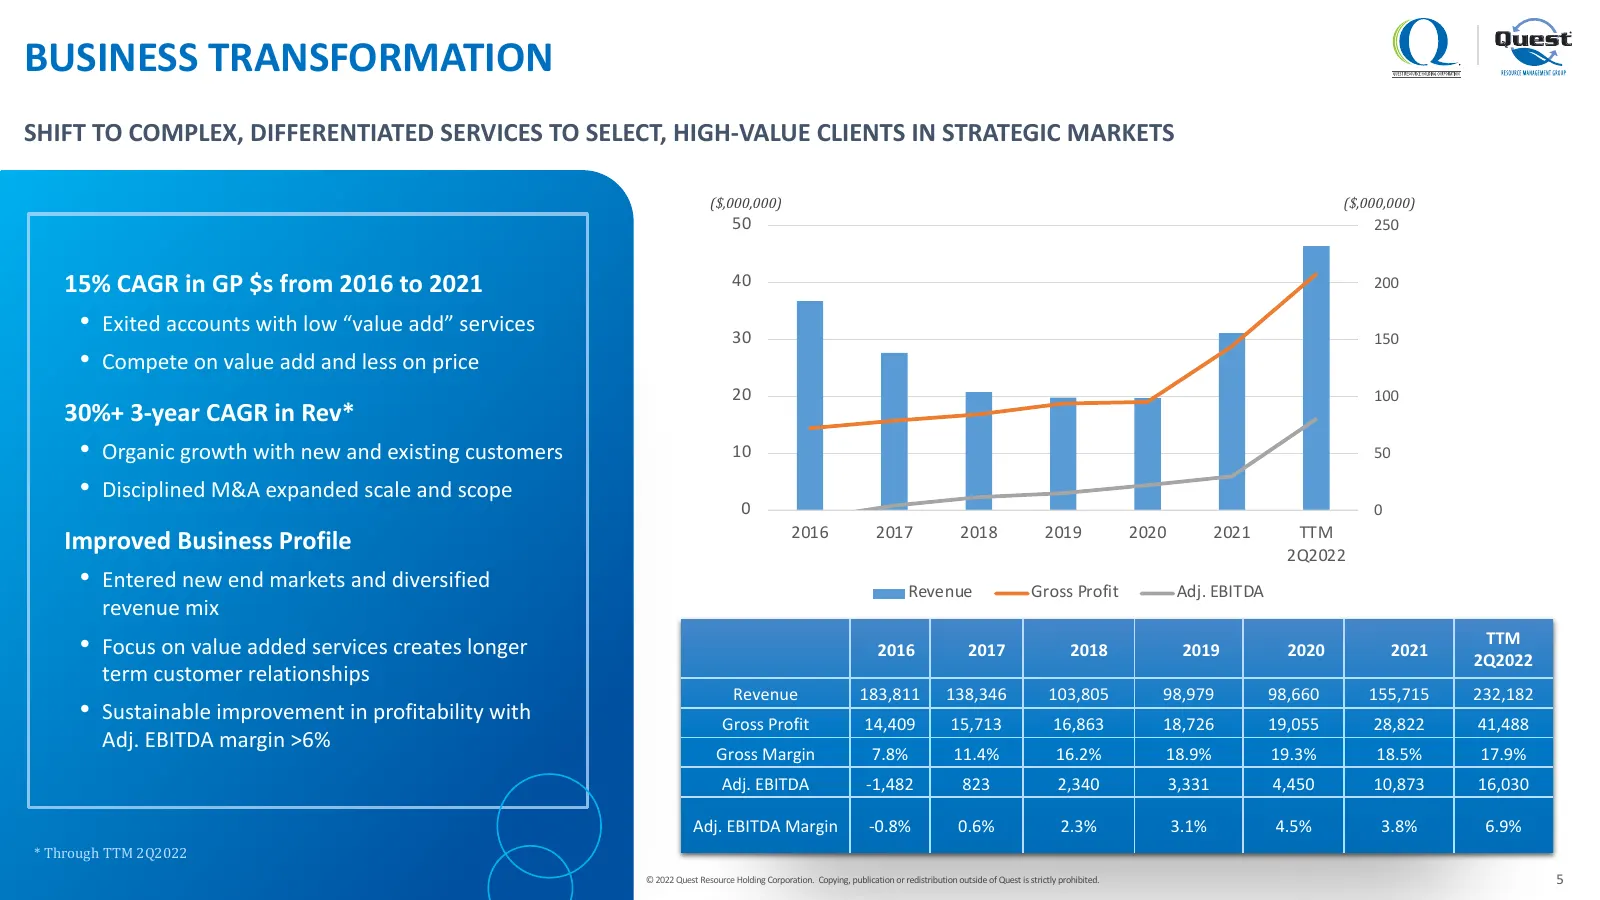
BUSINESS TRANSFORMATION SHIFT TO COMPLEX, DIFFERENTIATED SERVICES TO SELECT, HIGH-VALUE CLIENTS IN STRATEGIC MARKETS ($,000,000) ($,000,000) 50 250 15% CAGR in GP $s from 2016 to 2021 40 200 • Exited accounts with low “value add” services 30 150 • Compete on value add and less on price 20 100 30%+ 3
Slide 6: Strong Financial Performance Across Diverse Economic Conditions
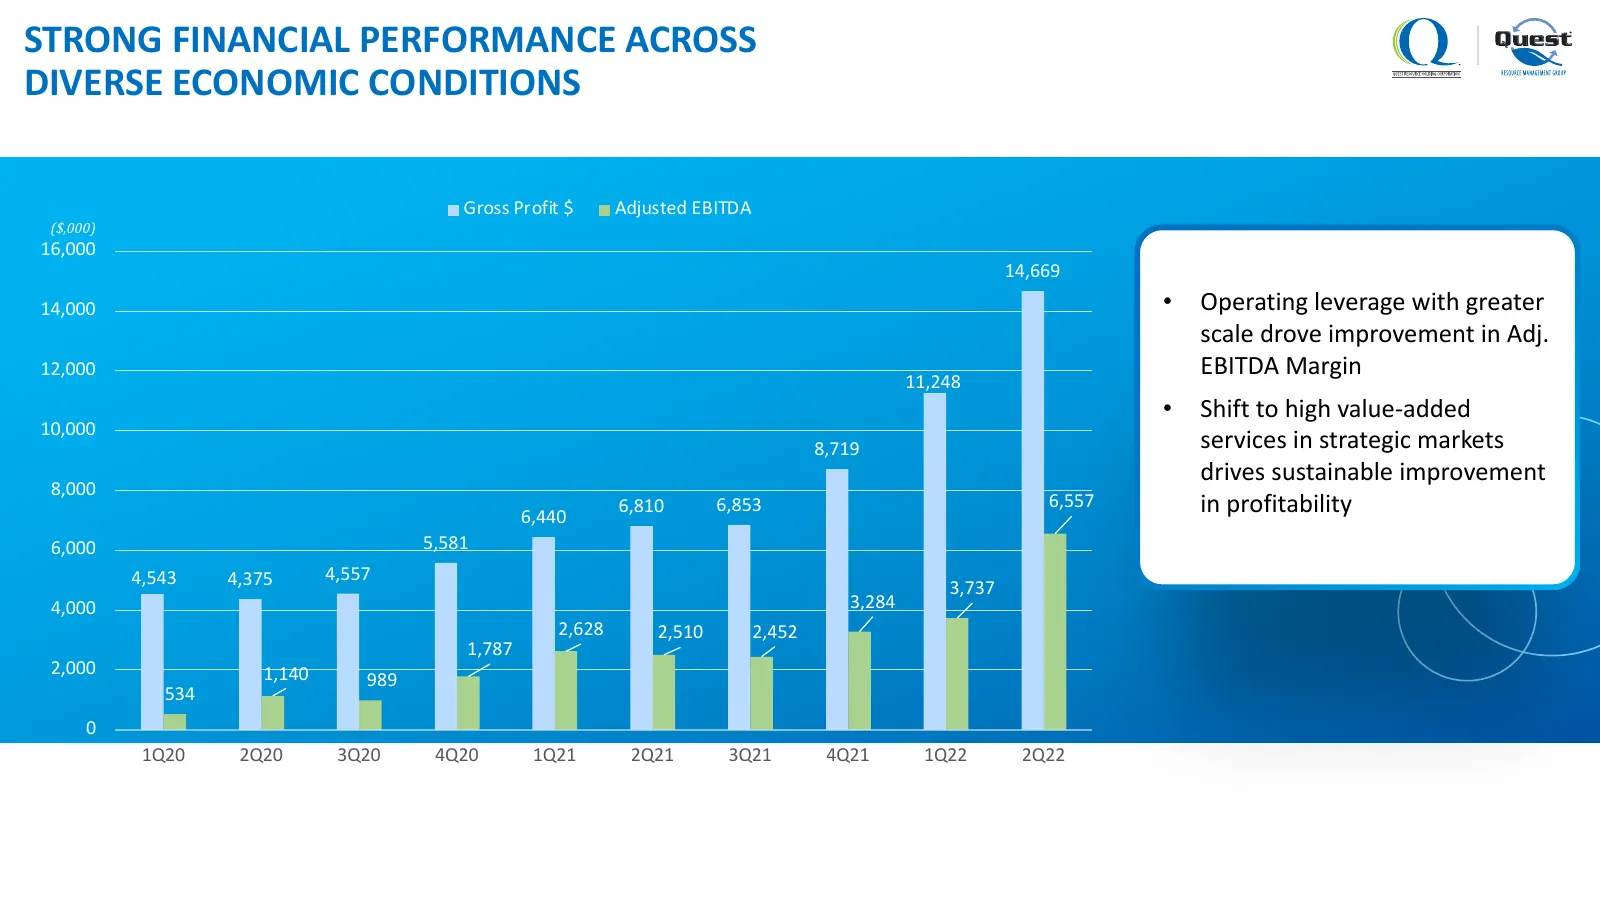
STRONG FINANCIAL PERFORMANCE ACROSS DIVERSE ECONOMIC CONDITIONS Gross Profit $ Adjusted EBITDA ($,000) 16,000 14,669 14,000 • Operating leverage with greater scale drove improvement in Adj. 12,000 EBITDA Margin 11,248 • Shift to high value-added 10,000 8,719 services in strategic markets drives sust
Slide 7: Key Problems in Waste and Recycling Quest Solves
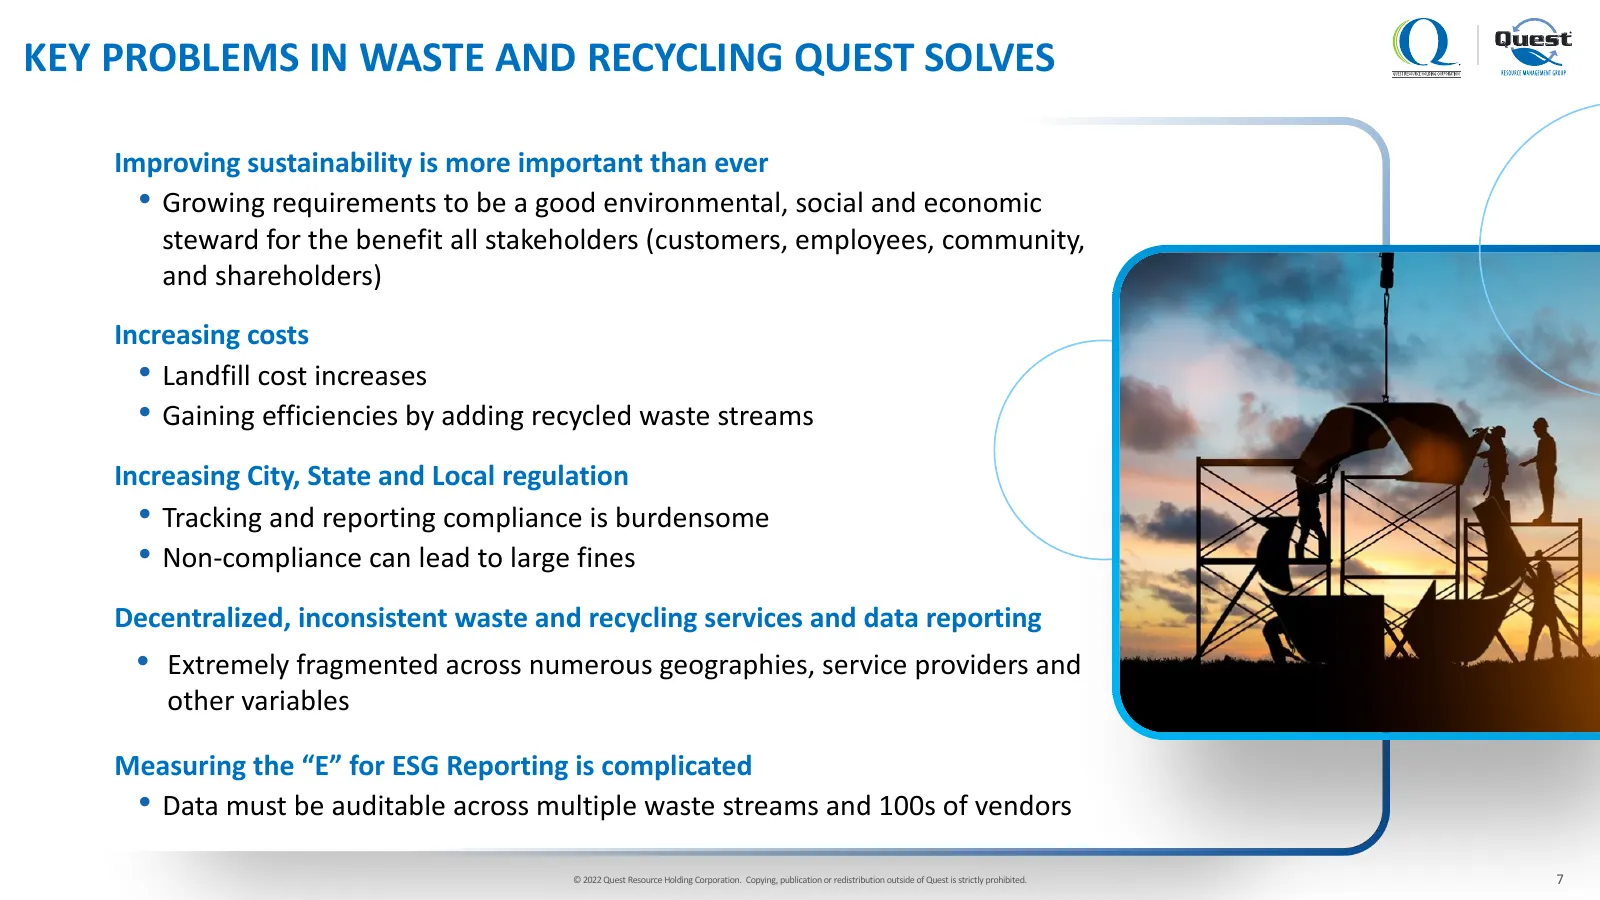
KEY PROBLEMS IN WASTE AND RECYCLING QUEST SOLVES Improving sustainability is more important than ever • Growing requirements to be a good environmental, social and economic steward for the benefit all stakeholders (customers, employees, community, and shareholders) Increasing costs • Landfill cost i
Slide 8: What Does Quest Do?
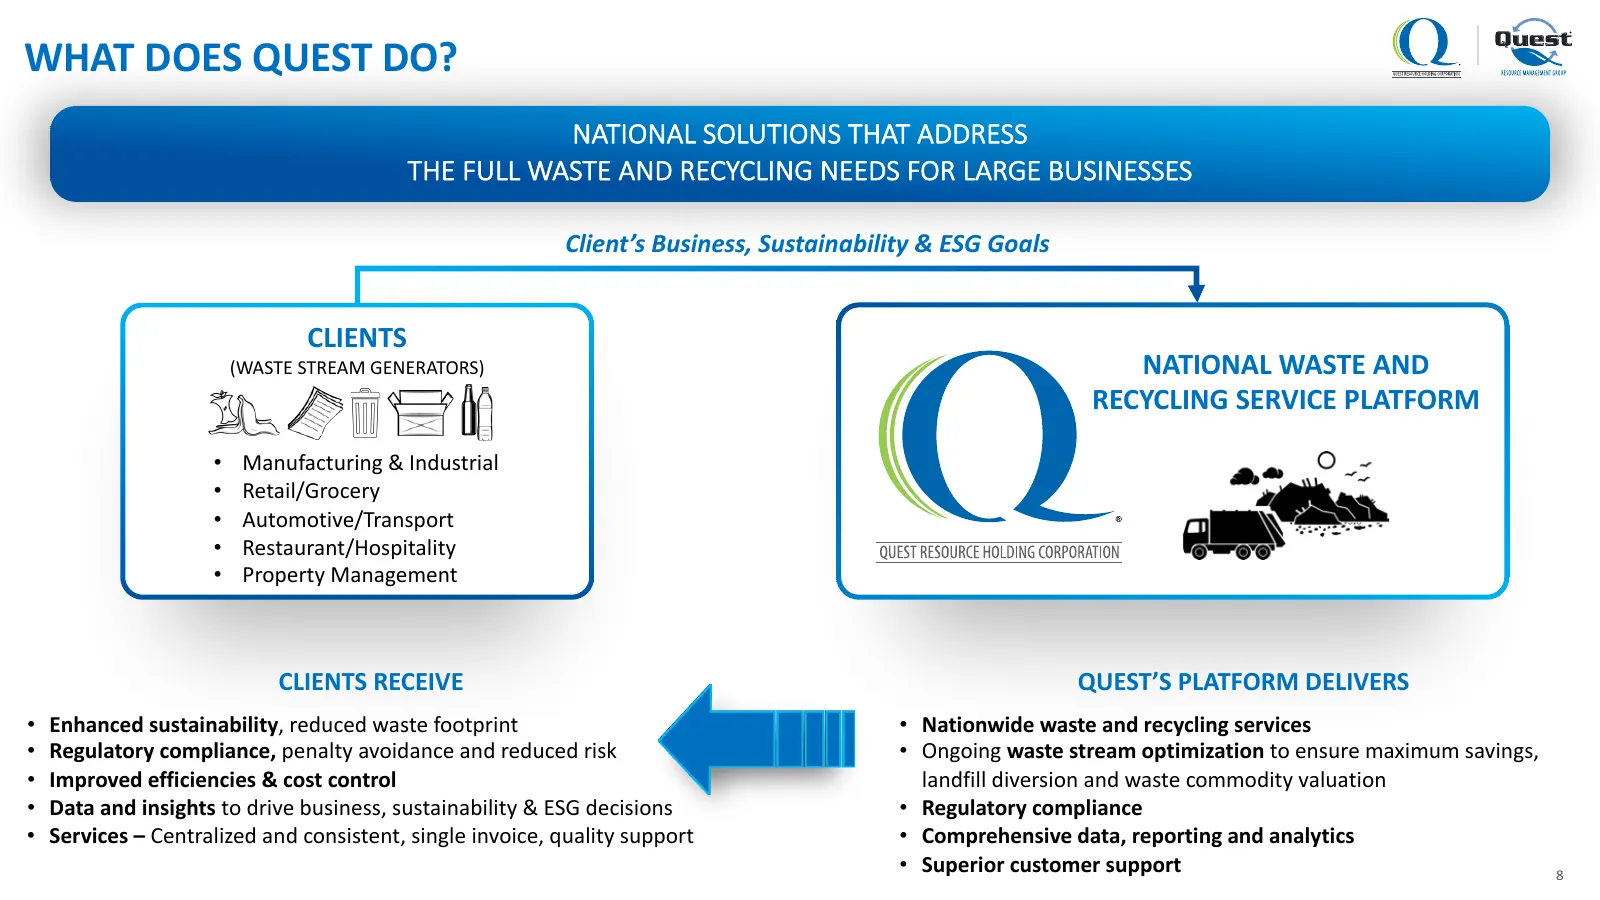
WHAT DOES QUEST DO? NATIONAL SOLUTIONS THAT ADDRESS THE FULL WASTE AND RECYCLING NEEDS FOR LARGE BUSINESSES Client’s Business, Sustainability & ESG Goals CLIENTS (WASTE STREAM GENERATORS) NATIONAL WASTE AND RECYCLING SERVICE PLATFORM • Manufacturing & Industrial • Retail/Grocery • Automotive/Transpo
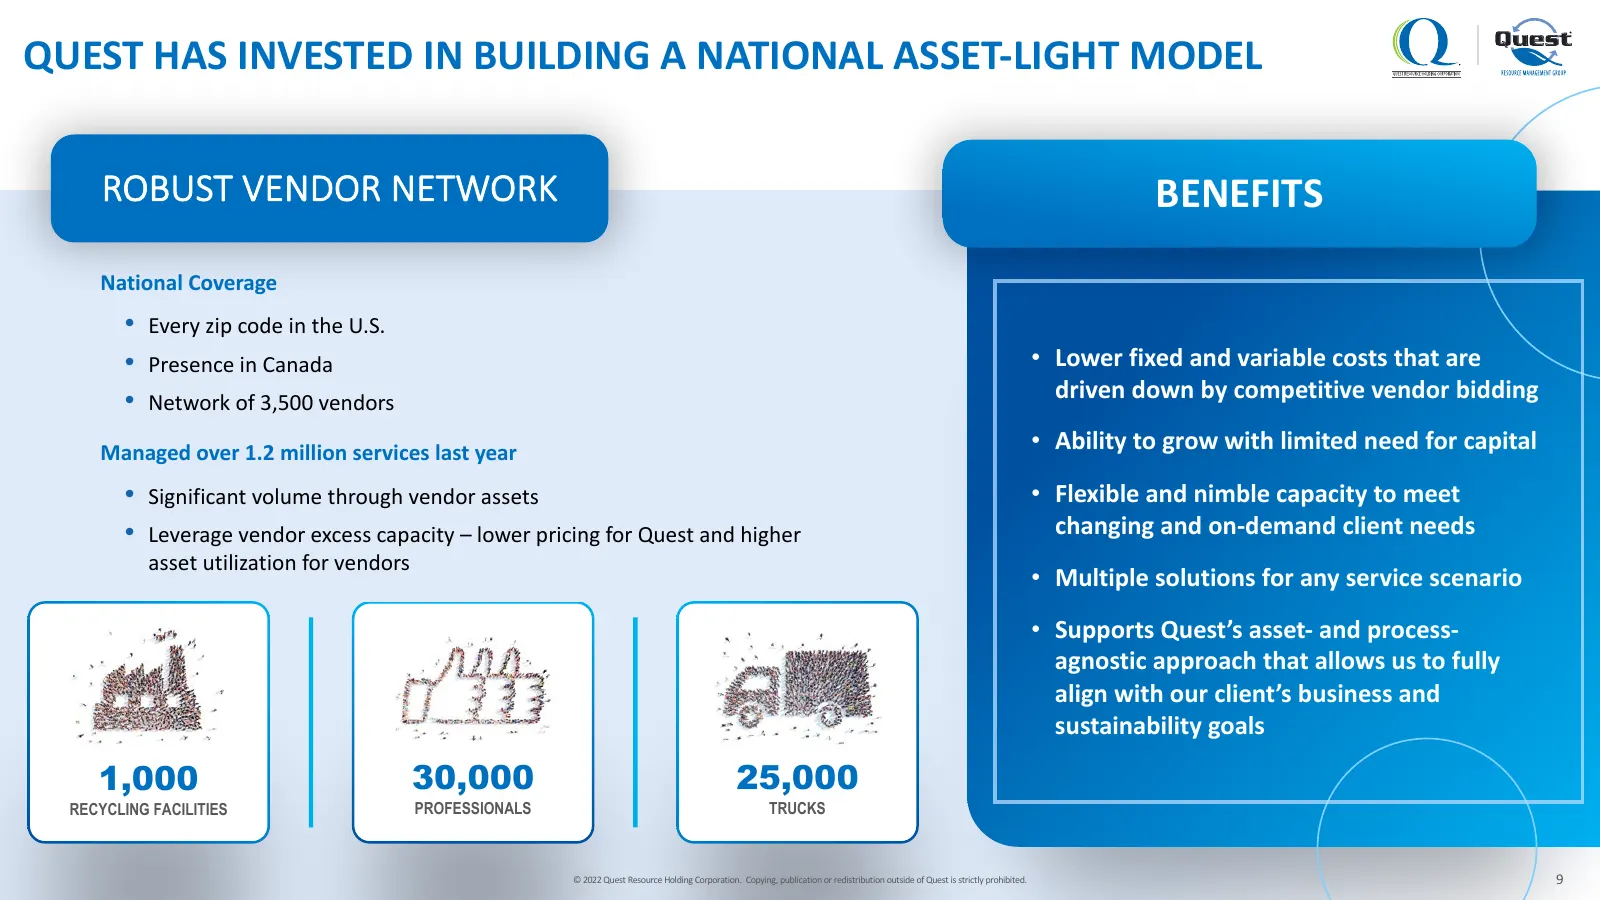
Slide 9: National Asset-Light Model: Robust Vendor Network Benefits
QUEST HAS INVESTED IN BUILDING A NATIONAL ASSET-LIGHT MODEL ROBUST VENDOR NETWORK BENEFITS National Coverage • Every zip code in the U.S. • Presence in Canada • Lower fixed and variable costs that are • Network of 3,500 vendors driven down by competitive vendor bidding Managed over 1.2 million servi
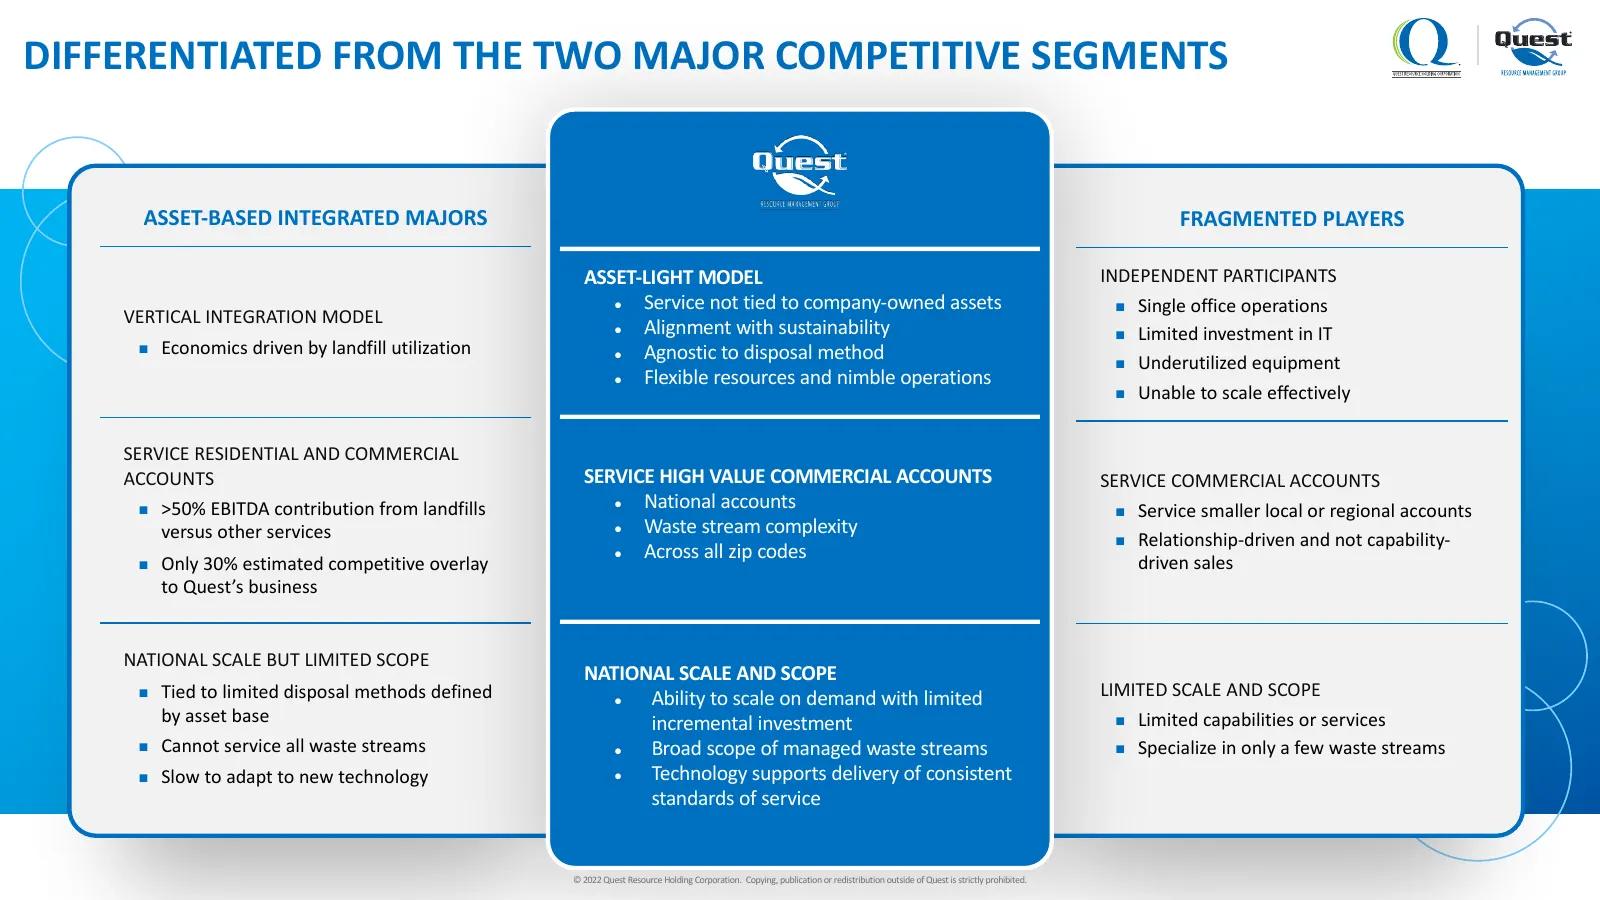
Slide 10: Differentiated from the Two Major Competitive Segments
DIFFERENTIATED FROM THE TWO MAJOR COMPETITIVE SEGMENTS ASSET-BASED INTEGRATED MAJORS FRAGMENTED PLAYERS ASSET-LIGHT MODEL INDEPENDENT PARTICIPANTS ● Service not tied to company-owned assets n Single office operations VERTICAL INTEGRATION MODEL ● Alignment with sustainability n Limited investment in
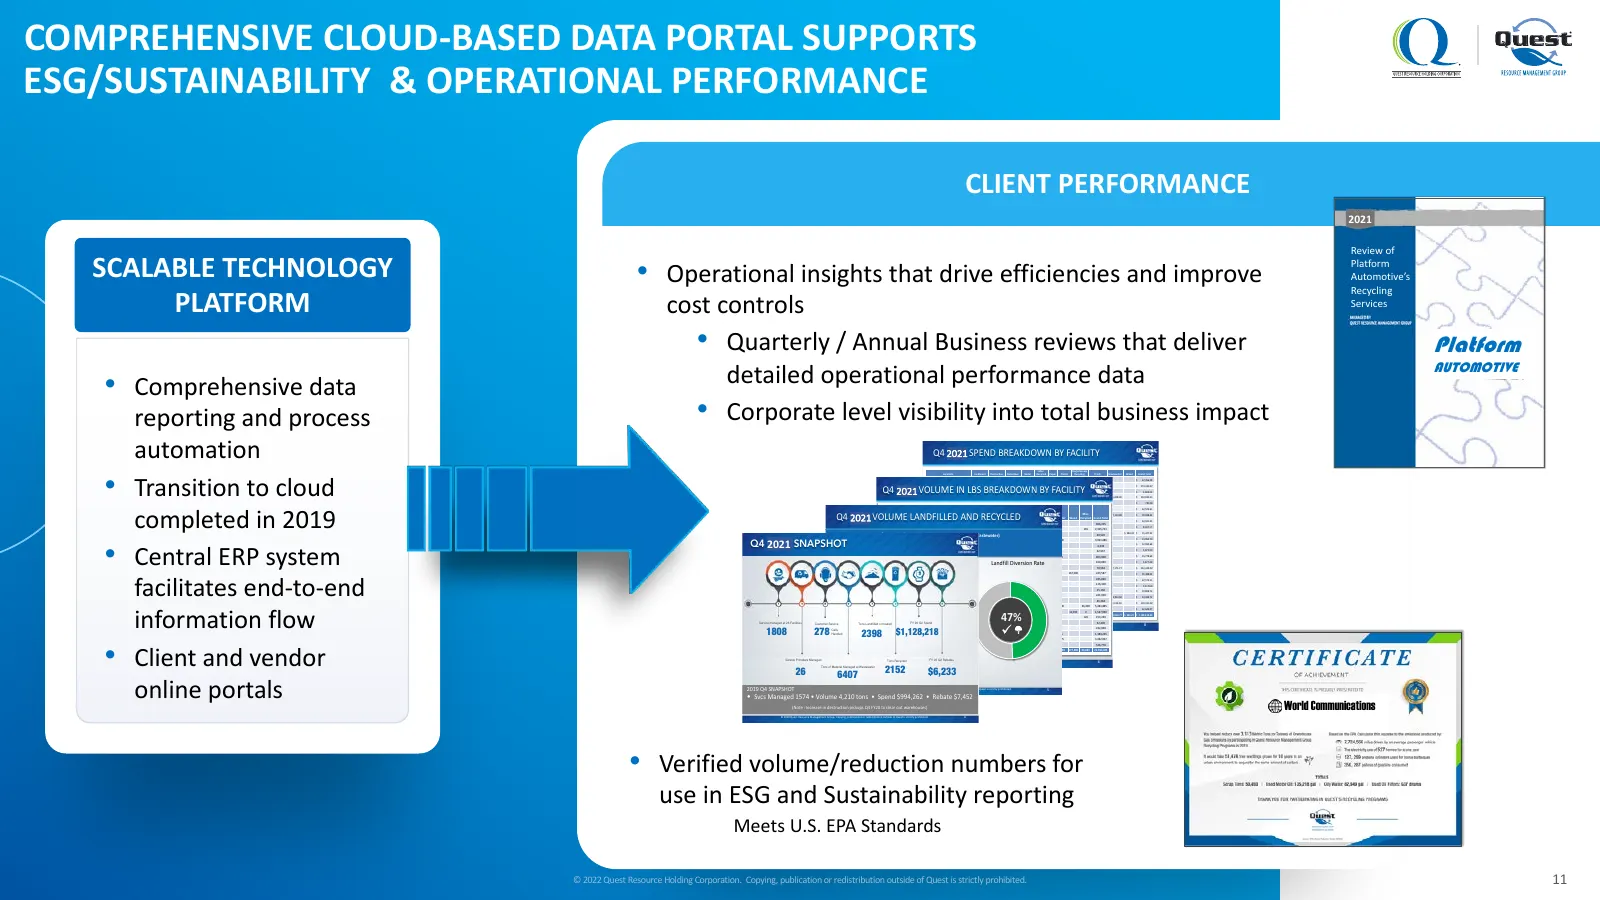
Slide 11: Comprehensive Cloud-Based Data Portal Supports ESG/Sustainability
COMPREHENSIVE CLOUD-BASED DATA PORTAL SUPPORTS ESG/SUSTAINABILITY & OPERATIONAL PERFORMANCE CLIENT PERFORMANCE 2021 2019 Review of SCALABLE TECHNOLOGY • Operational insights that drive efficiencies and improve Platform Automotive’s Recycling PLATFORM cost controls Services • Quarterly / Annual Busin
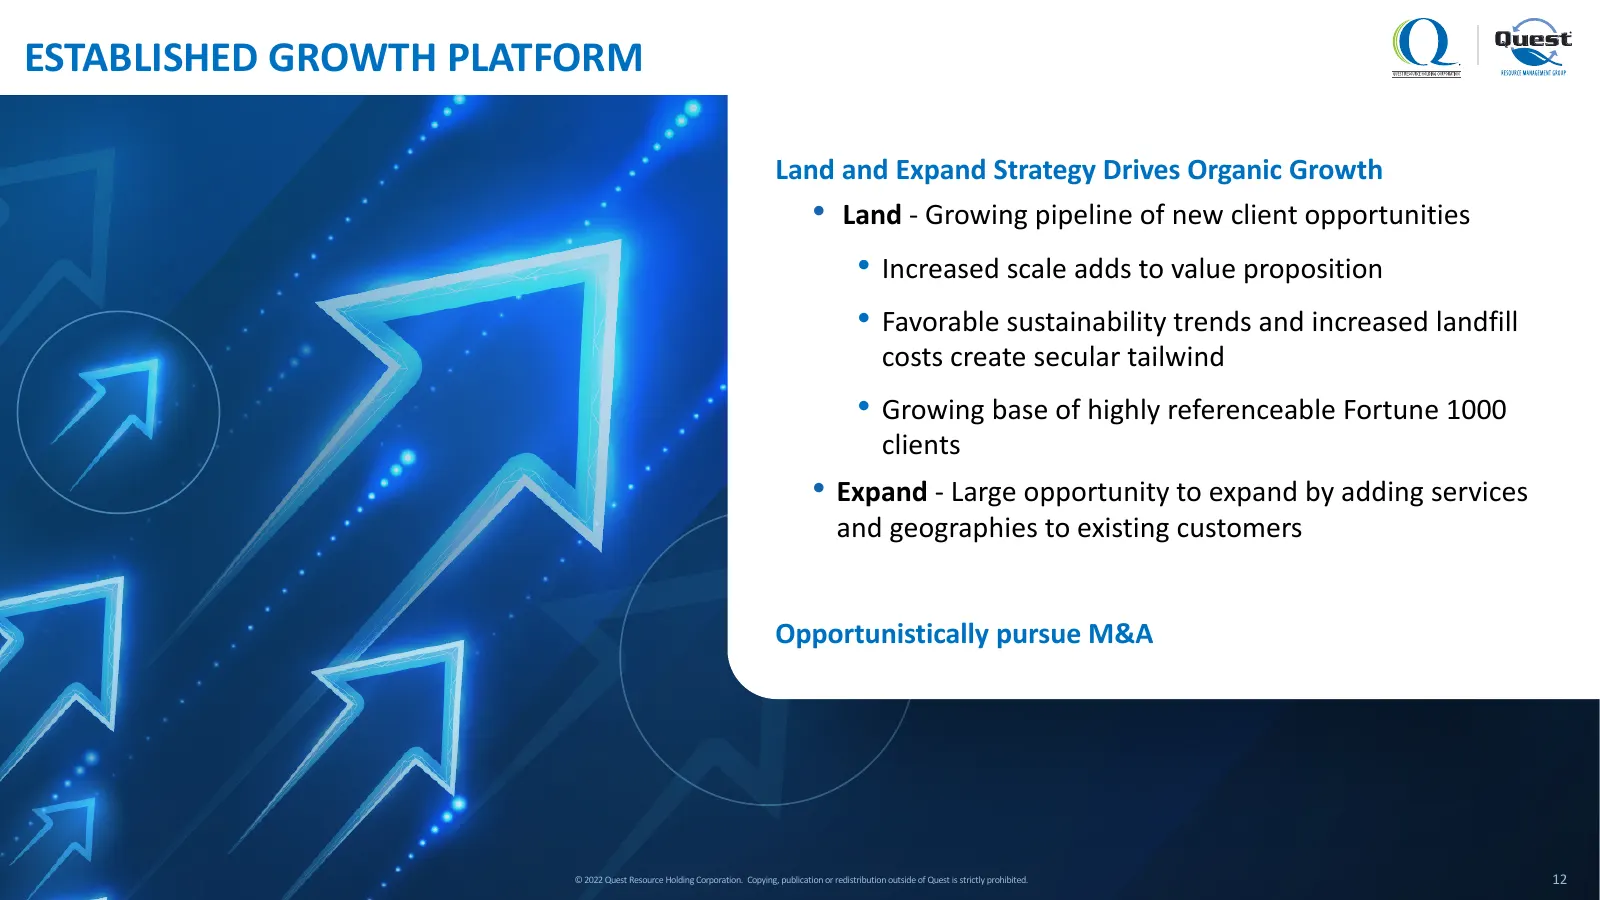
Slide 12: Established Growth Platform
ESTABLISHED GROWTH PLATFORM Land and Expand Strategy Drives Organic Growth • Land - Growing pipeline of new client opportunities • Increased scale adds to value proposition • Favorable sustainability trends and increased landfill costs create secular tailwind • Growing base of highly referenceable F
Slide 13: Focused M&A Strategy
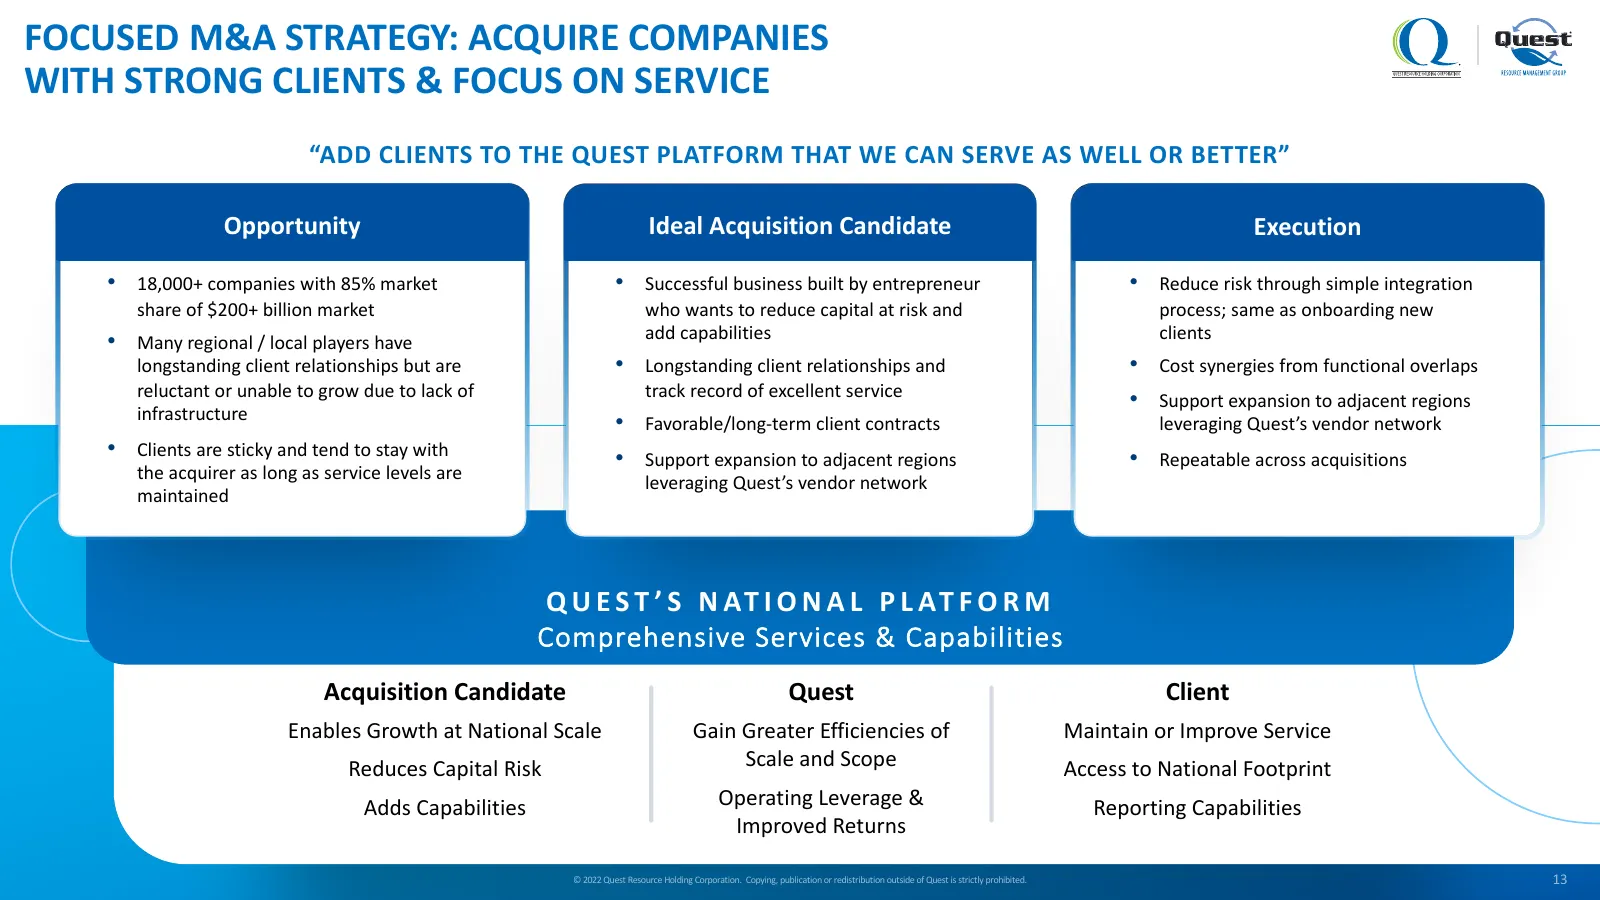
FOCUSED M&A STRATEGY: ACQUIRE COMPANIES WITH STRONG CLIENTS & FOCUS ON SERVICE “ADD CLIENTS TO THE QUEST PLATFORM THAT WE CAN SERVE AS WELL OR BETTER” Opportunity Ideal Acquisition Candidate Execution • 18,000+ companies with 85% market • Successful business built by entrepreneur • Reduce risk throu
Slide 14: Summary - Stable, Scalable with Attractive Industry Dynamics
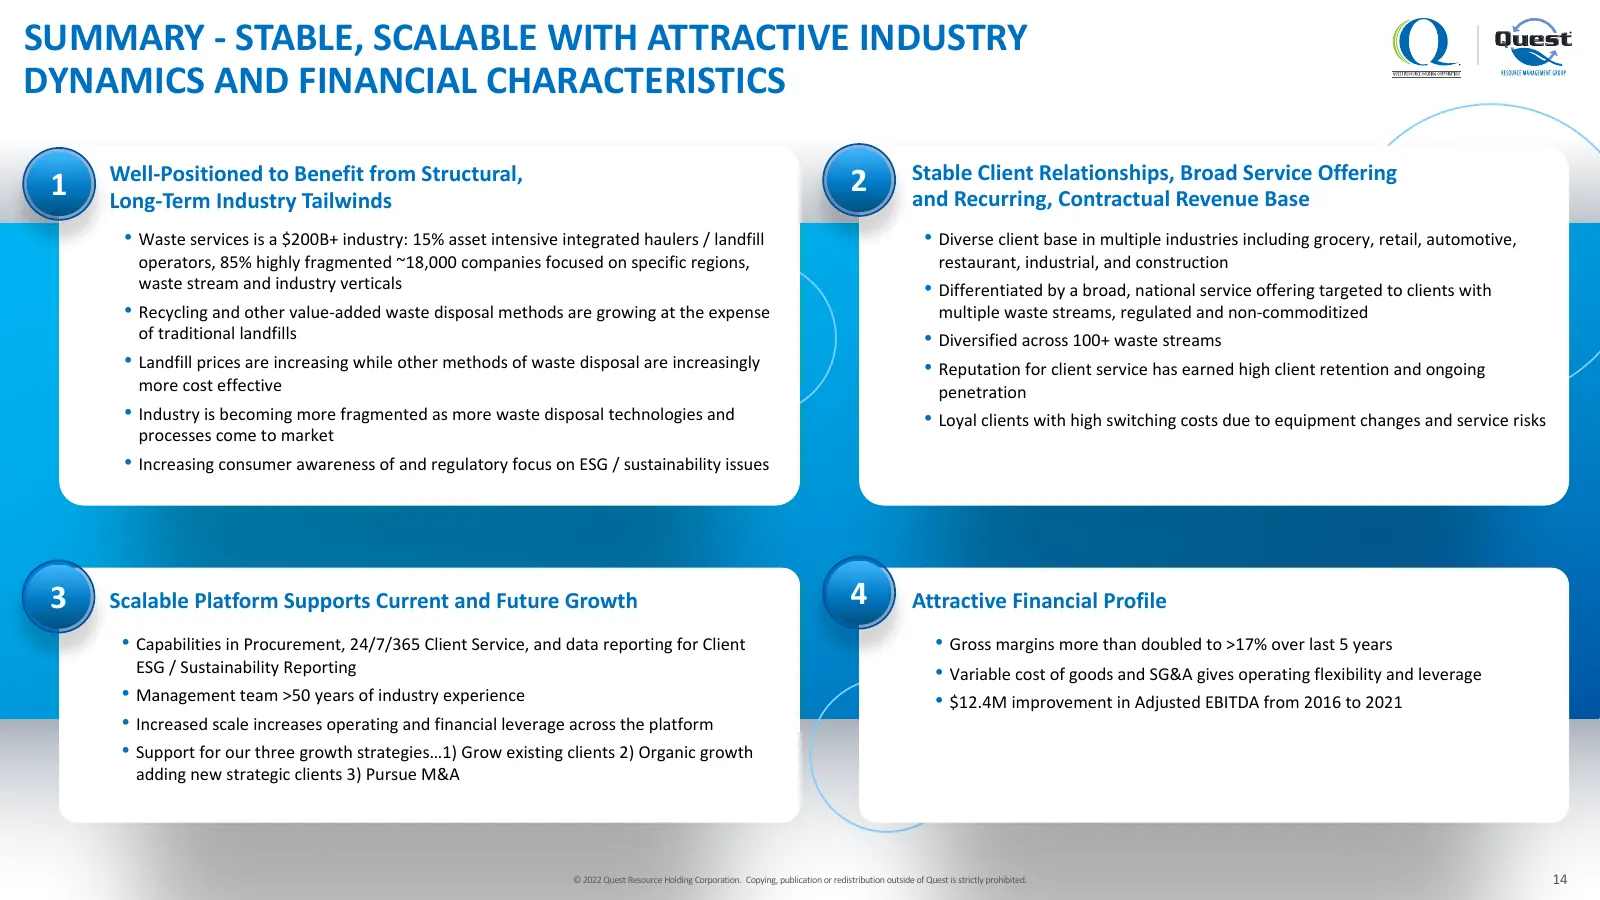
SUMMARY - STABLE, SCALABLE WITH ATTRACTIVE INDUSTRY DYNAMICS AND FINANCIAL CHARACTERISTICS Well-Positioned to Benefit from Structural, 2 Stable Client Relationships, Broad Service Offering 1 Long-Term Industry Tailwinds and Recurring, Contractual Revenue Base • Waste services is a $200B+ industry: 1
Slide 15: Appendix
APPENDIX © 2022 Quest Resource Holding Corporation. Copying, publication or redistribution outside of Quest is strictly prohibited.
Slide 16: Client Results
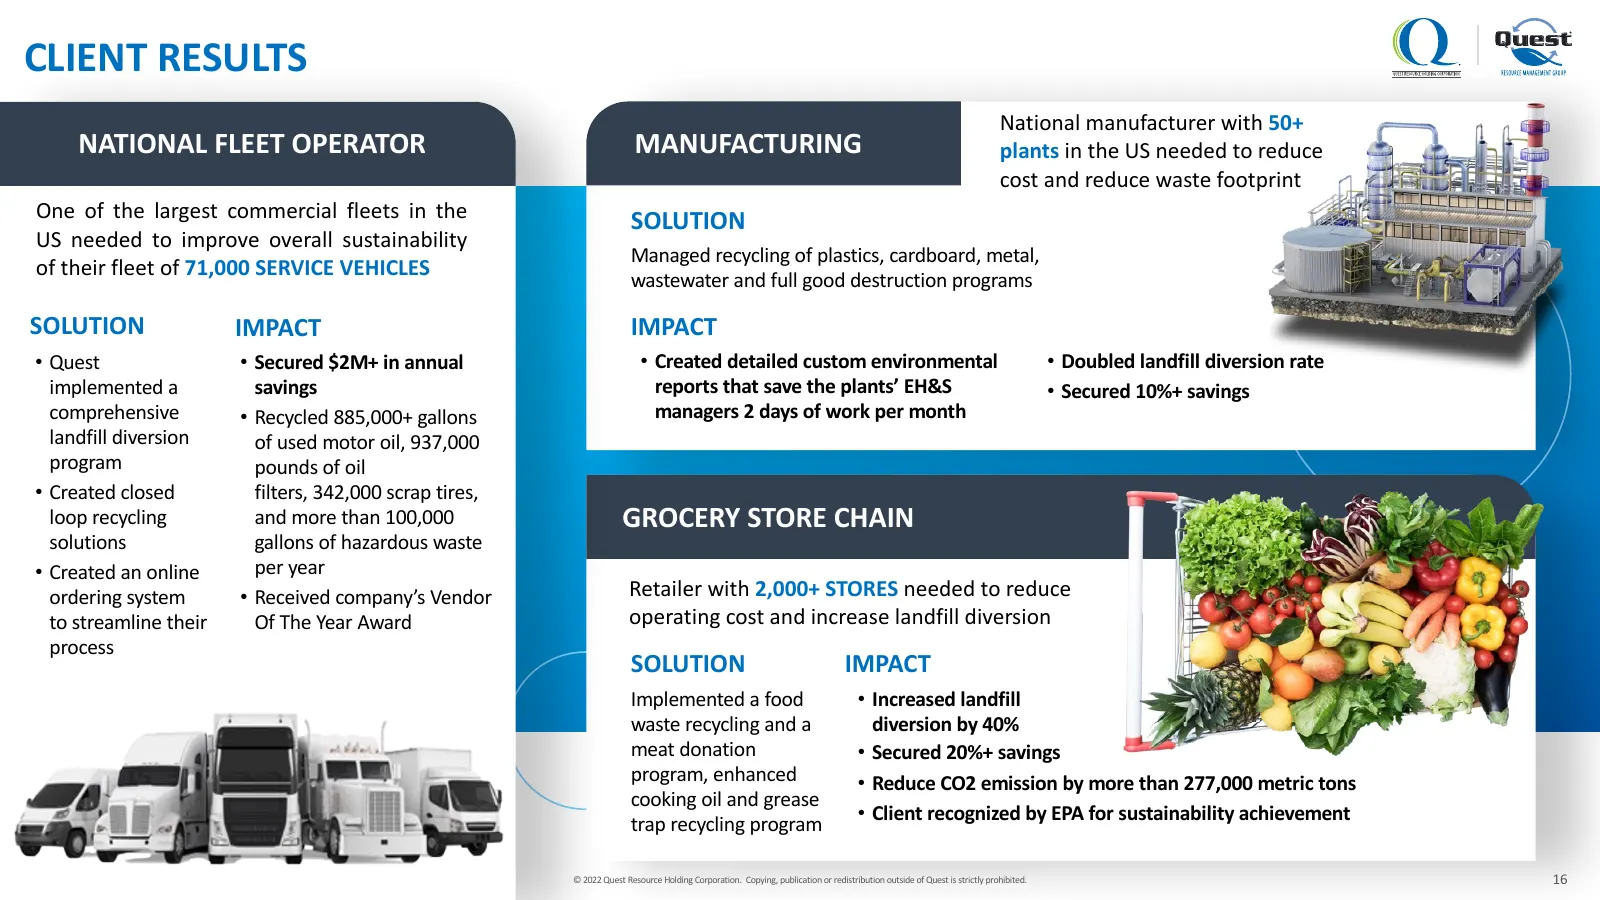
CLIENT RESULTS National manufacturer with 50+ NATIONAL FLEET OPERATOR MANUFACTURING plants in the US needed to reduce cost and reduce waste footprint One of the largest commercial fleets in the SOLUTION US needed to improve overall sustainability Managed recycling of plastics, cardboard, metal, of t
Slide 17: Experienced Management Team
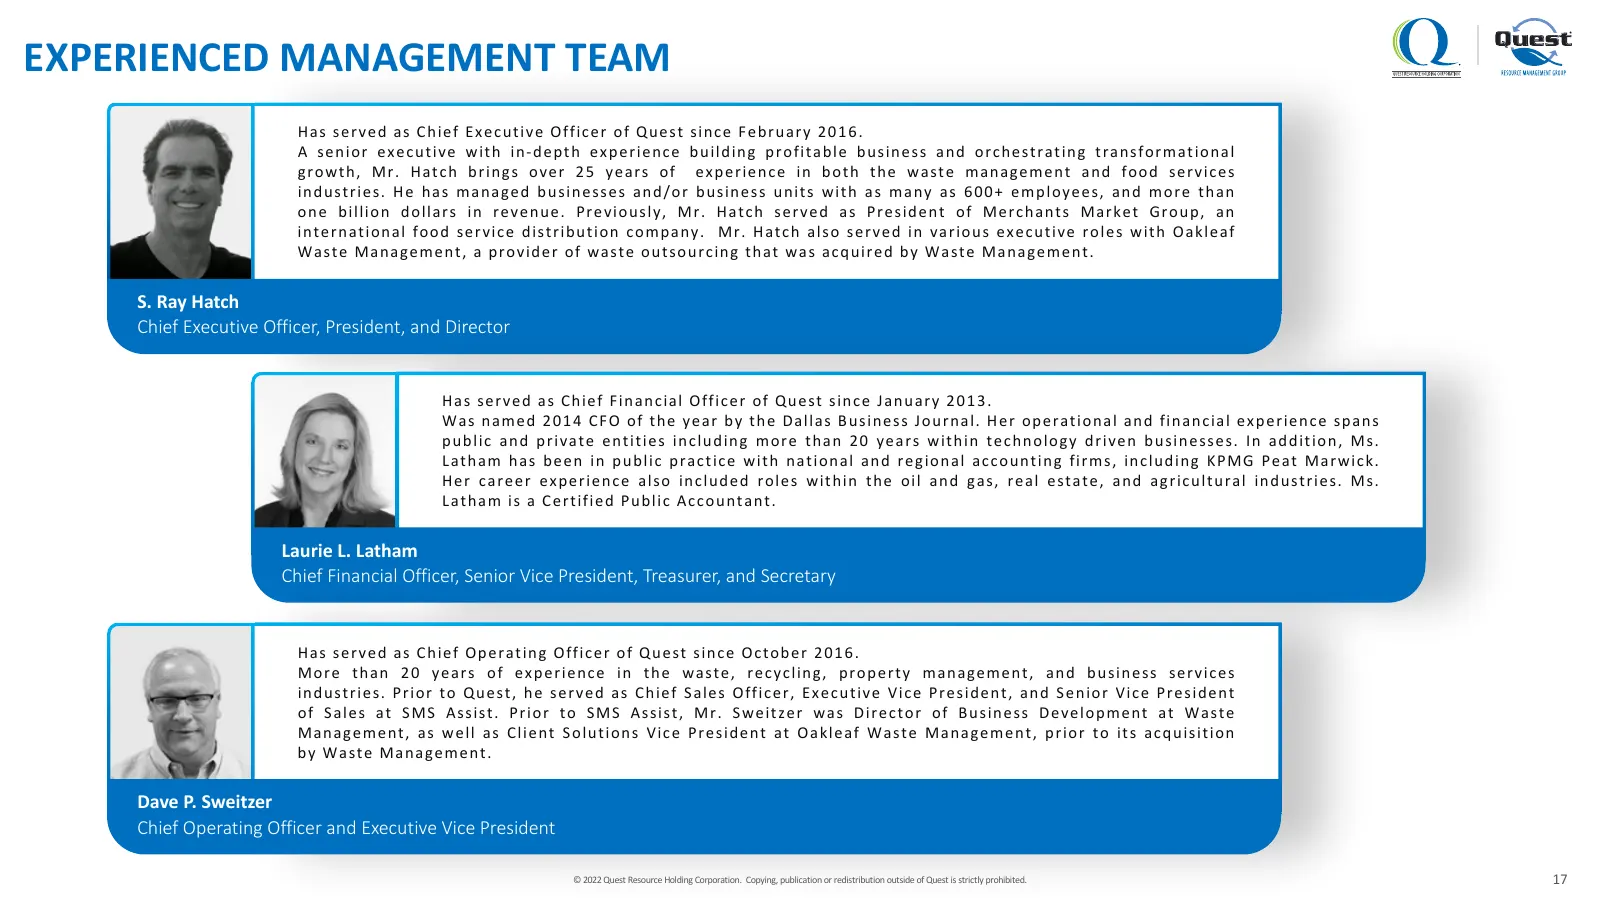
EXPERIENCED MANAGEMENT TEAM H as se r ve d as C hie f Ex e c u t ive O ffic e r of Q ue st sin c e F e br uar y 2 0 1 6 . A se n ior e x e c ut ive wit h in-de pt h e x pe r ie nc e building pr ofit able busine ss and or c he st r at ing t r ansfor m at ional g r owt h, Mr . H at c h br ing s ove r
Slide 18: Reconciliation of U.S. GAAP to Non-GAAP Financial Measures
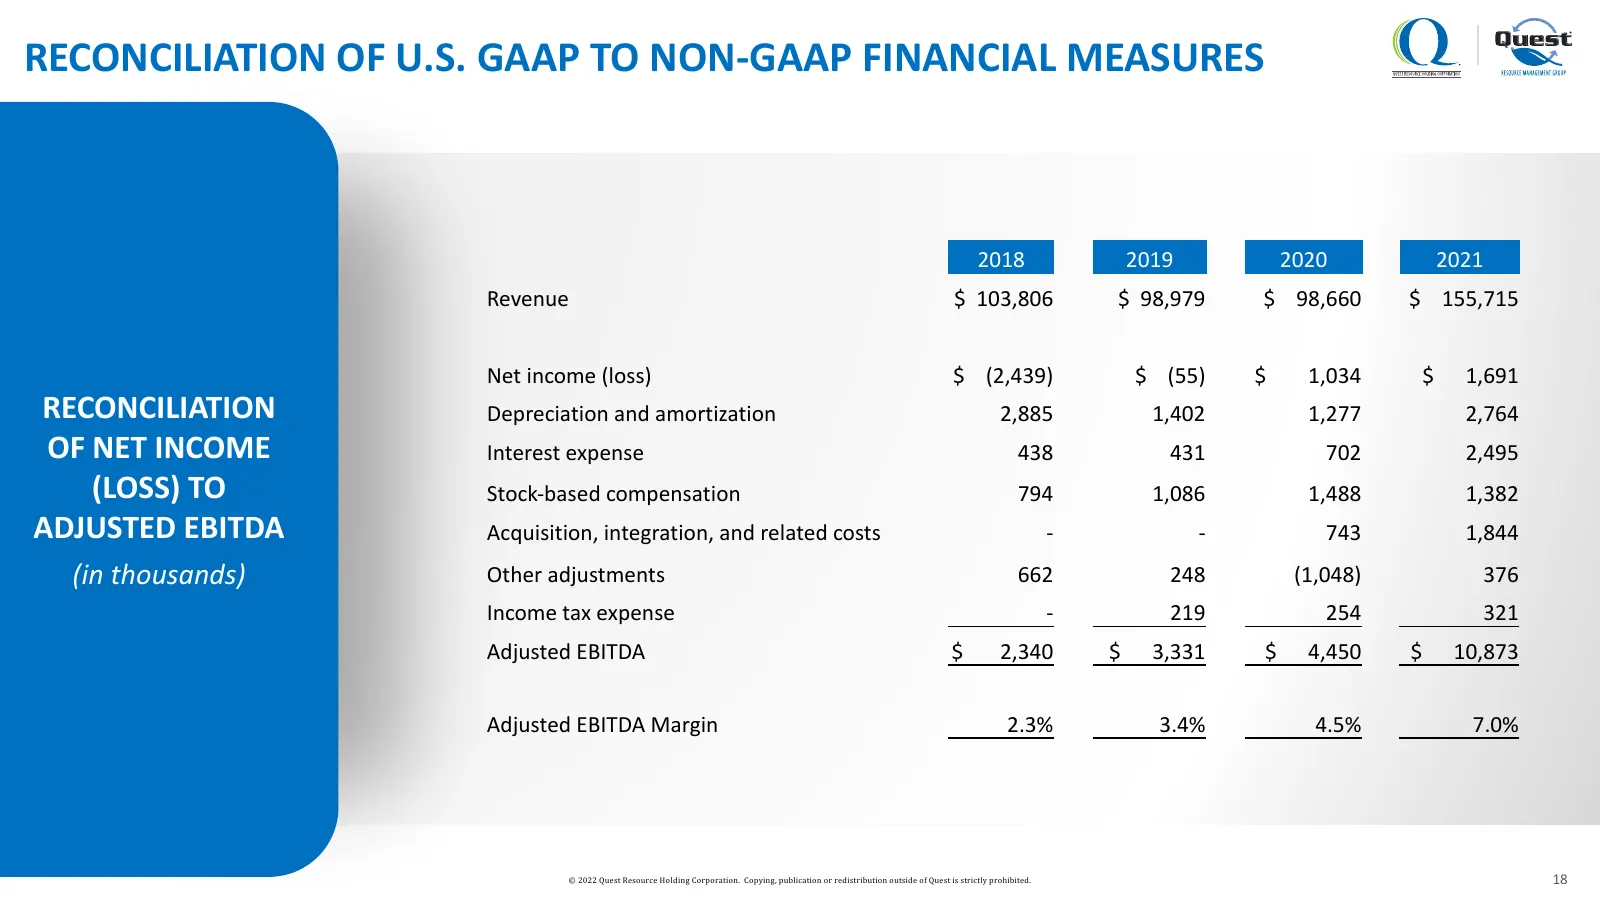
RECONCILIATION OF U.S. GAAP TO NON-GAAP FINANCIAL MEASURES 2018 2019 2020 2021 Revenue $ 103,806 $ 98,979 $ 98,660 $ 155,715 Net income (loss) $ (2,439) $ (55) $ 1,034 $ 1,691 RECONCILIATION Depreciation and amortization 2,885 1,402 1,277 2,764 OF NET INCOME Interest expense 438 431 702 2,495 (LOSS)
Slide 19: Reconciliation of U.S. GAAP to Non-GAAP Financial Measures
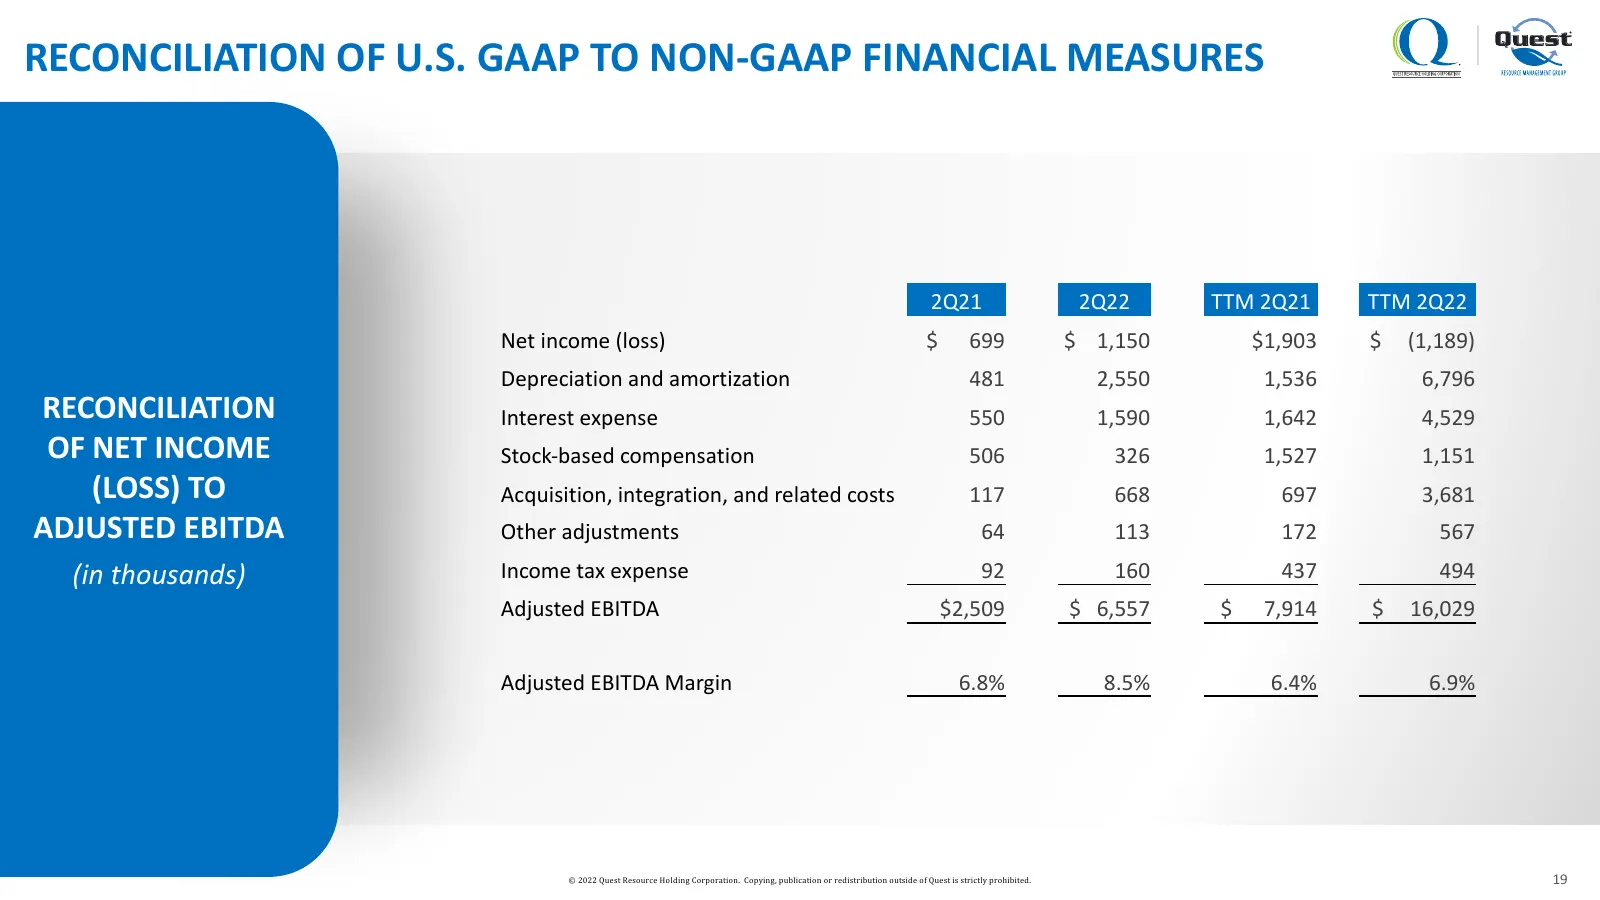
RECONCILIATION OF U.S. GAAP TO NON-GAAP FINANCIAL MEASURES 2Q21 2Q22 TTM 2Q21 TTM 2Q22 Net income (loss) $ 699 $ 1,150 $1,903 $ (1,189) Depreciation and amortization 481 2,550 1,536 6,796 RECONCILIATION Interest expense 550 1,590 1,642 4,529 OF NET INCOME Stock-based compensation 506 326 1,527 1,151
Slide 20: Reconciliation of U.S. GAAP to Non-GAAP Financial Measures
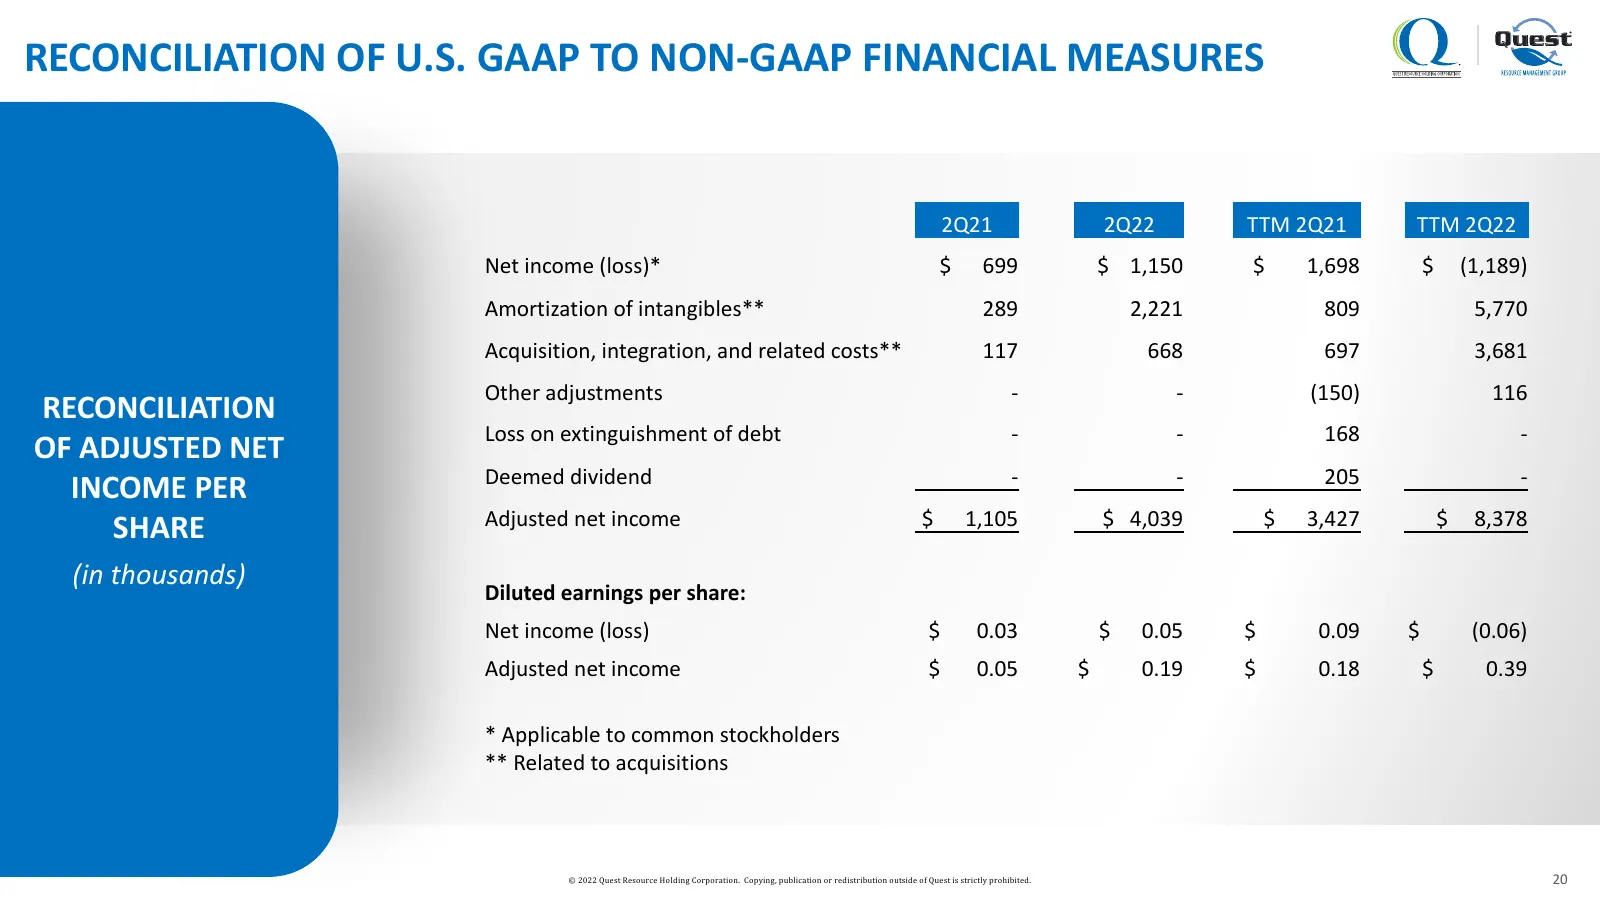
RECONCILIATION OF U.S. GAAP TO NON-GAAP FINANCIAL MEASURES 2Q21 2Q22 TTM 2Q21 TTM 2Q22 Net income (loss)* $ 699 $ 1,150 $ 1,698 $ (1,189) Amortization of intangibles** 289 2,221 809 5,770 Acquisition, integration, and related costs** 117 668 697 3,681 Other adjustments - - (150) 116 RECONCILIATION L
Slide 21: Ray Hatch, Laurie Latham, Dave Sweitzer
RAY HATCH Chief Executive Officer LAURIE LATHAM Chief Financial Officer DAVE SWEITZER Chief Operations Officer 3481 Plano Pkwy. The Colony, TX 75056 877.321.1811 www.QuestRMG.com © 2022 Quest Resource Holding Corporation. Copying, publication or redistribution outside of Quest is strictly prohibited
Source: Internet Archive copy of s29.q4cdn.com
More decks from Quest Resource Holding Corporation
 Investor Presentation (May 2026)22 slides · May 2026
 Q4 2025 Earnings Presentation22 slides · Mar 12, 2026
 Investor Presentation (November 2025)20 slides · November 2025
 Investor Presentation (August 2025)20 slides · August 2025
 Q1 2025 Earnings Presentation20 slides · May 12, 2025
 Q4 2024 Earnings Presentation20 slides · Mar 12, 2025