RIO2 Limited · TSX:RIO
RIO2 — Investor Presentation (November 2026)
31 slides from RIO2's investor presentation, November 2026
Slide 1: Building a Leading Latin American Miner
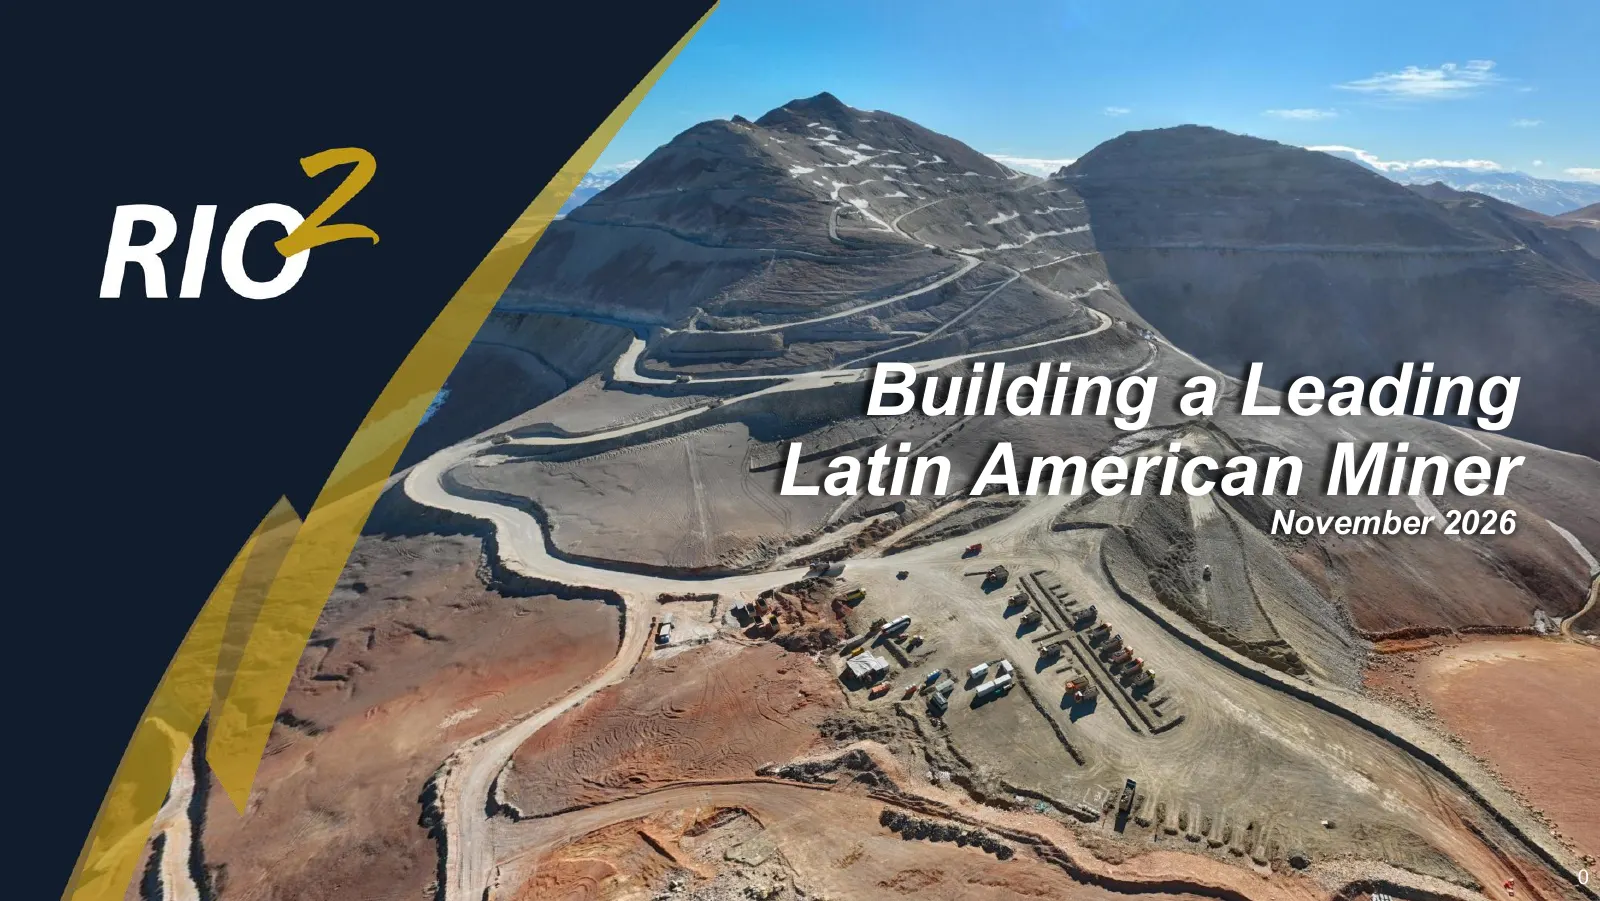
Building a Leading Latin American Miner November 2026 0
Slide 2: Reader Advisory
Reader Advisory Cautionary Statement Regarding Forward-Looking Statements This presentation contains certain information that may constitute “forward-looking information” and “forward-looking statements” within the meaning of applicable securities laws. All statements other than statements which are
Slide 3: Company Snapshot
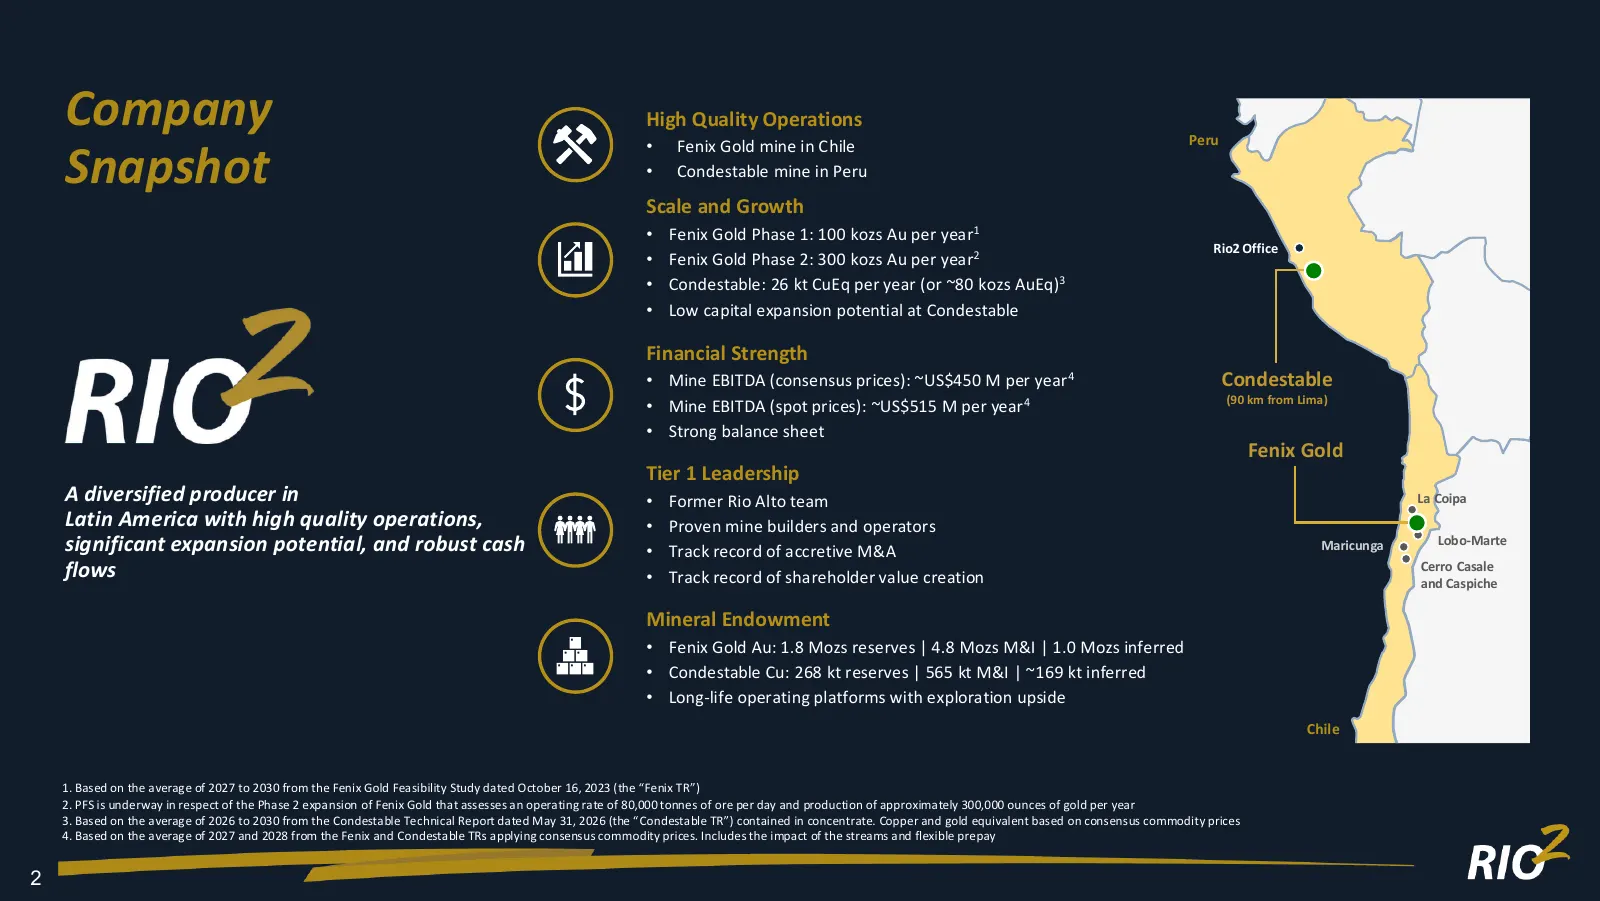
Company High Quality Operations Peru • Fenix Gold mine in Chile Snapshot • Condestable mine in Peru Scale and Growth • Fenix Gold Phase 1: 100 kozs Au per year1 Rio2 Office • Fenix Gold Phase 2: 300 kozs Au per year2 • Condestable: 26 kt CuEq per year (or ~80 kozs AuEq)3 • Low capital expansion pote
Slide 4: The Team
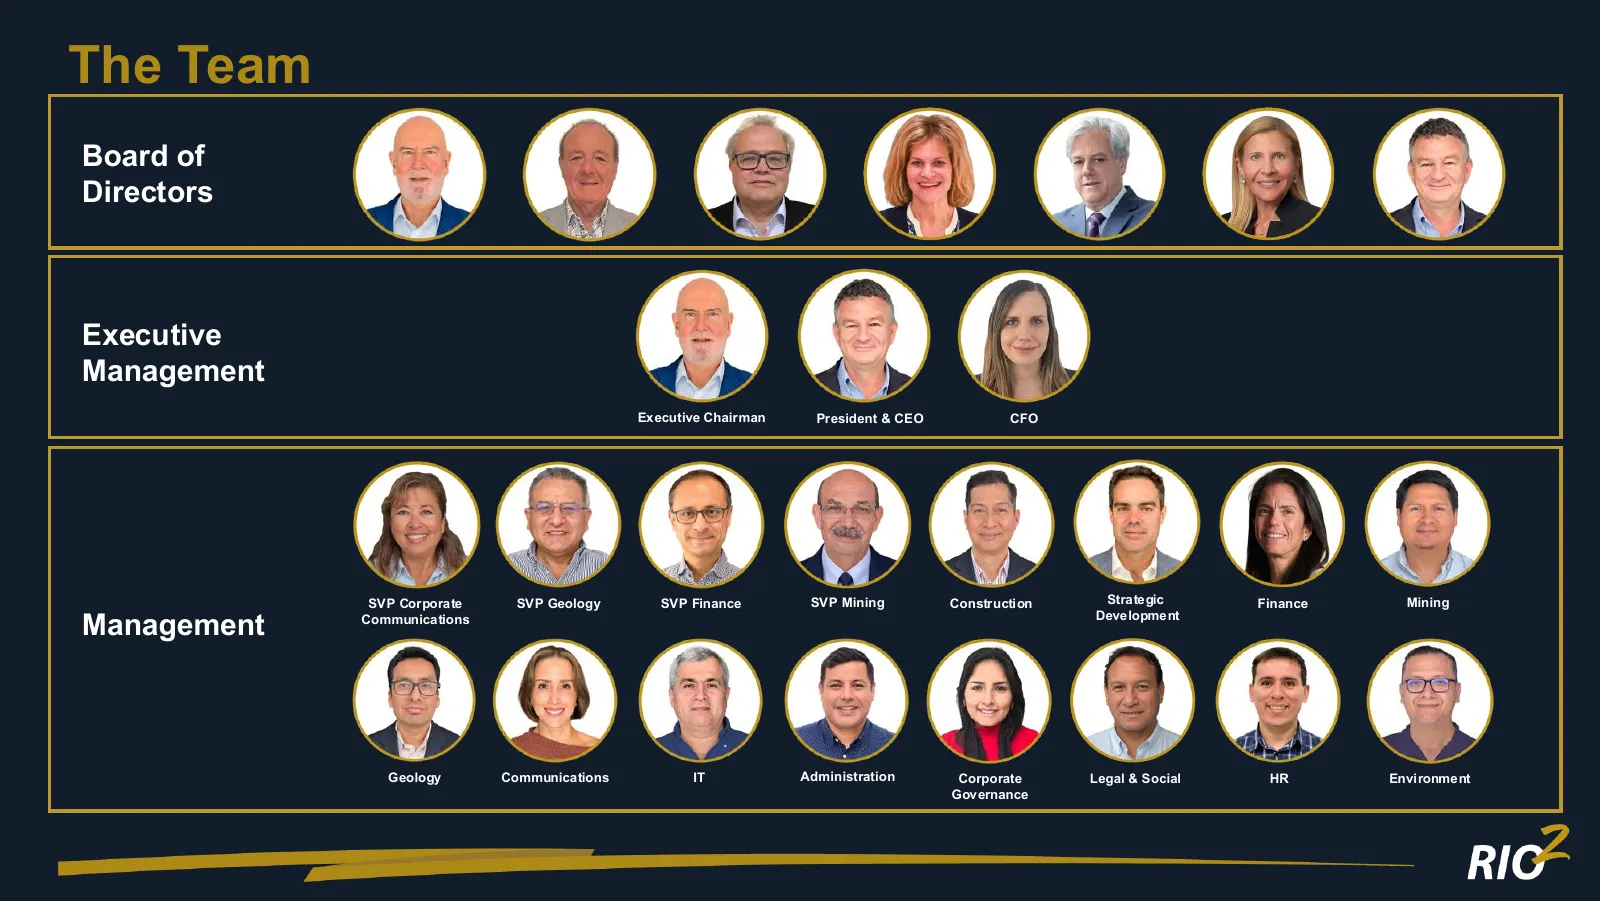
The Team Board of Directors Executive Management Executive Chairman President & CEO CFO SVP Corporate SVP Geology SVP Finance SVP Mining Construction Strategic Finance Mining Development Management Communications Geology Communications IT Administration Corporate Legal & Social HR Environment Govern
Slide 5: Q3 2026 Highlights
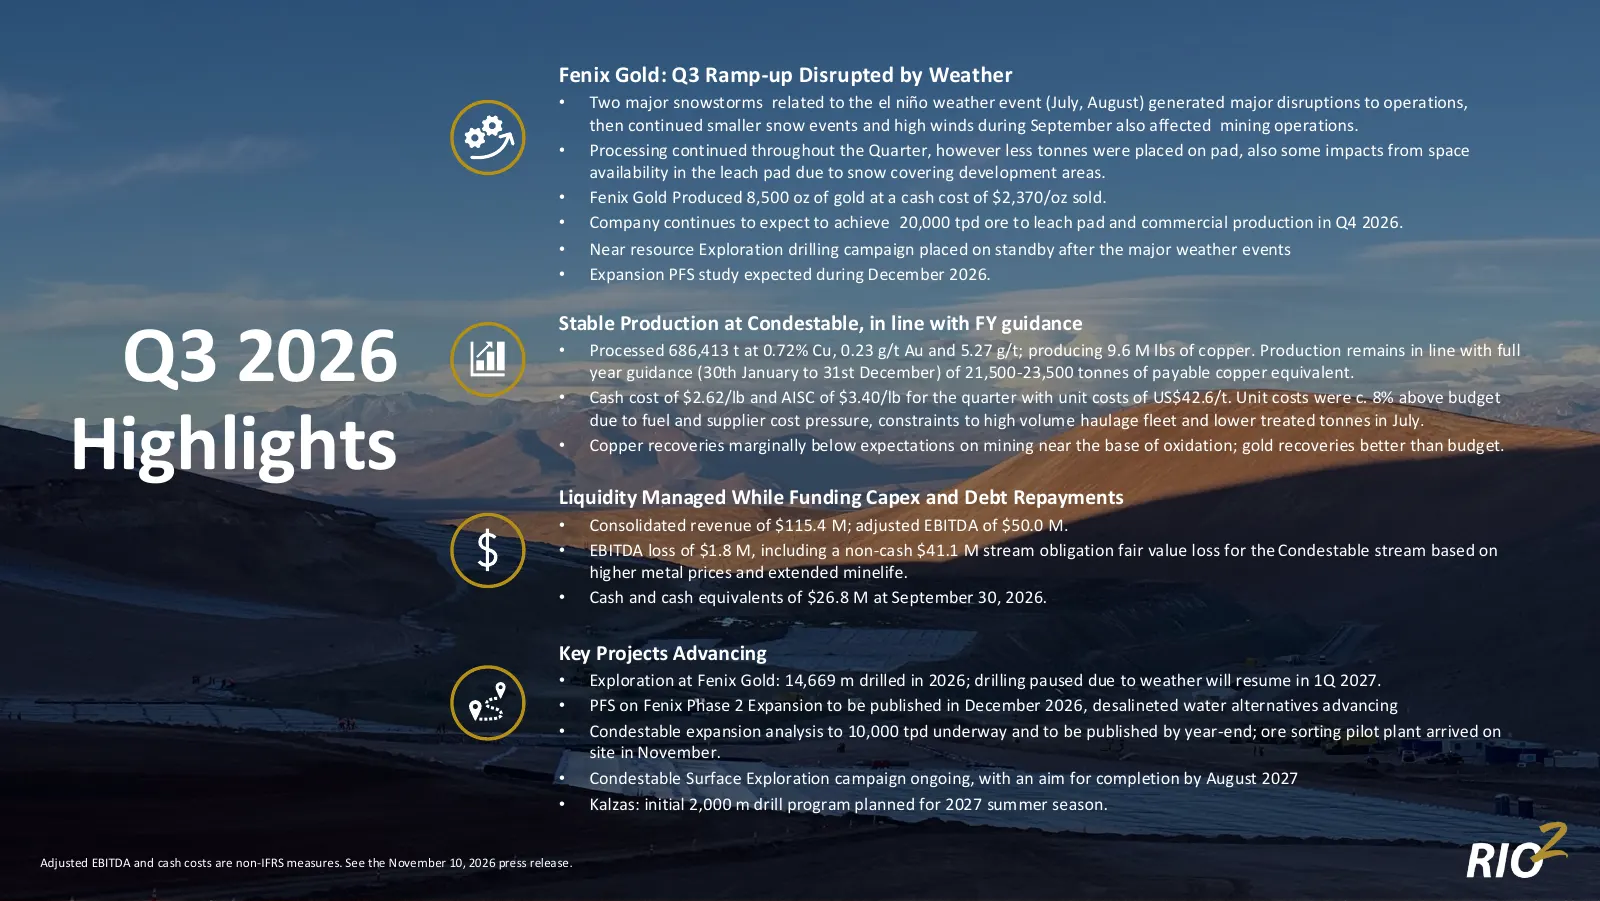
Fenix Gold: Q3 Ramp-up Disrupted by Weather • Two major snowstorms related to the el niño weather event (July, August) generated major disruptions to operations, then continued smaller snow events and high winds during September also affected mining operations. • Processing continued throughout the
Slide 6: Corporate Snapshot
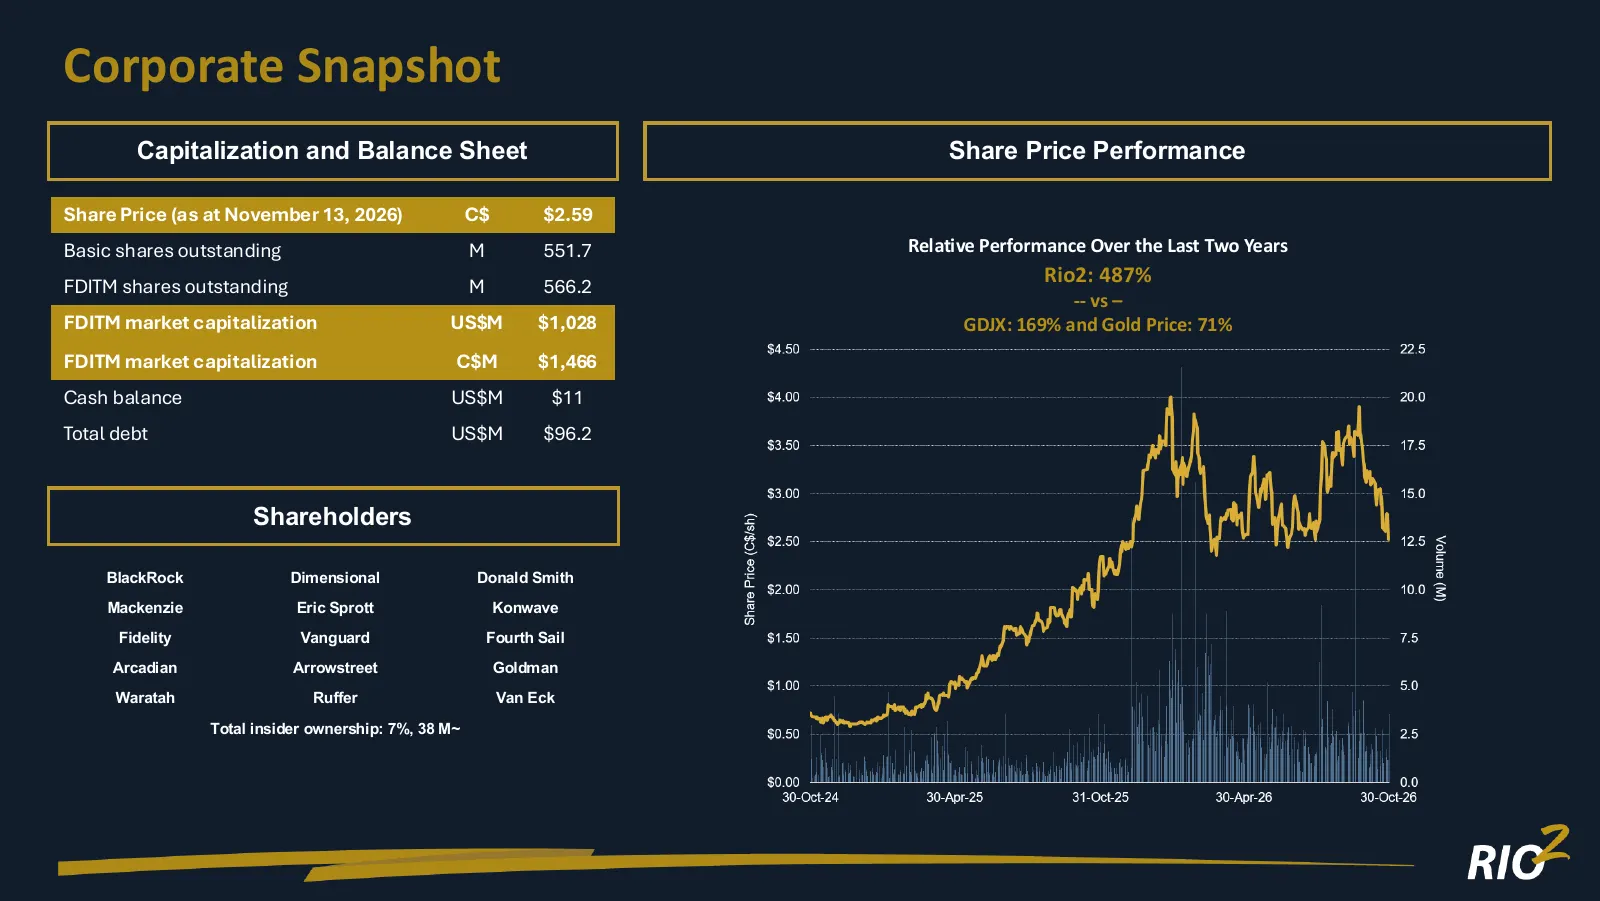
Corporate Snapshot Capitalization and Balance Sheet Share Price Performance Share Price (as at November 13, 2026) C$ $2.59 Basic shares outstanding M 551.7 Relative Performance Over the Last Two Years Rio2: 487% FDITM shares outstanding M 566.2 -- vs – FDITM market capitalization US$M $1,028 GDJX: 1
Slide 7: Q3 Monthly Production
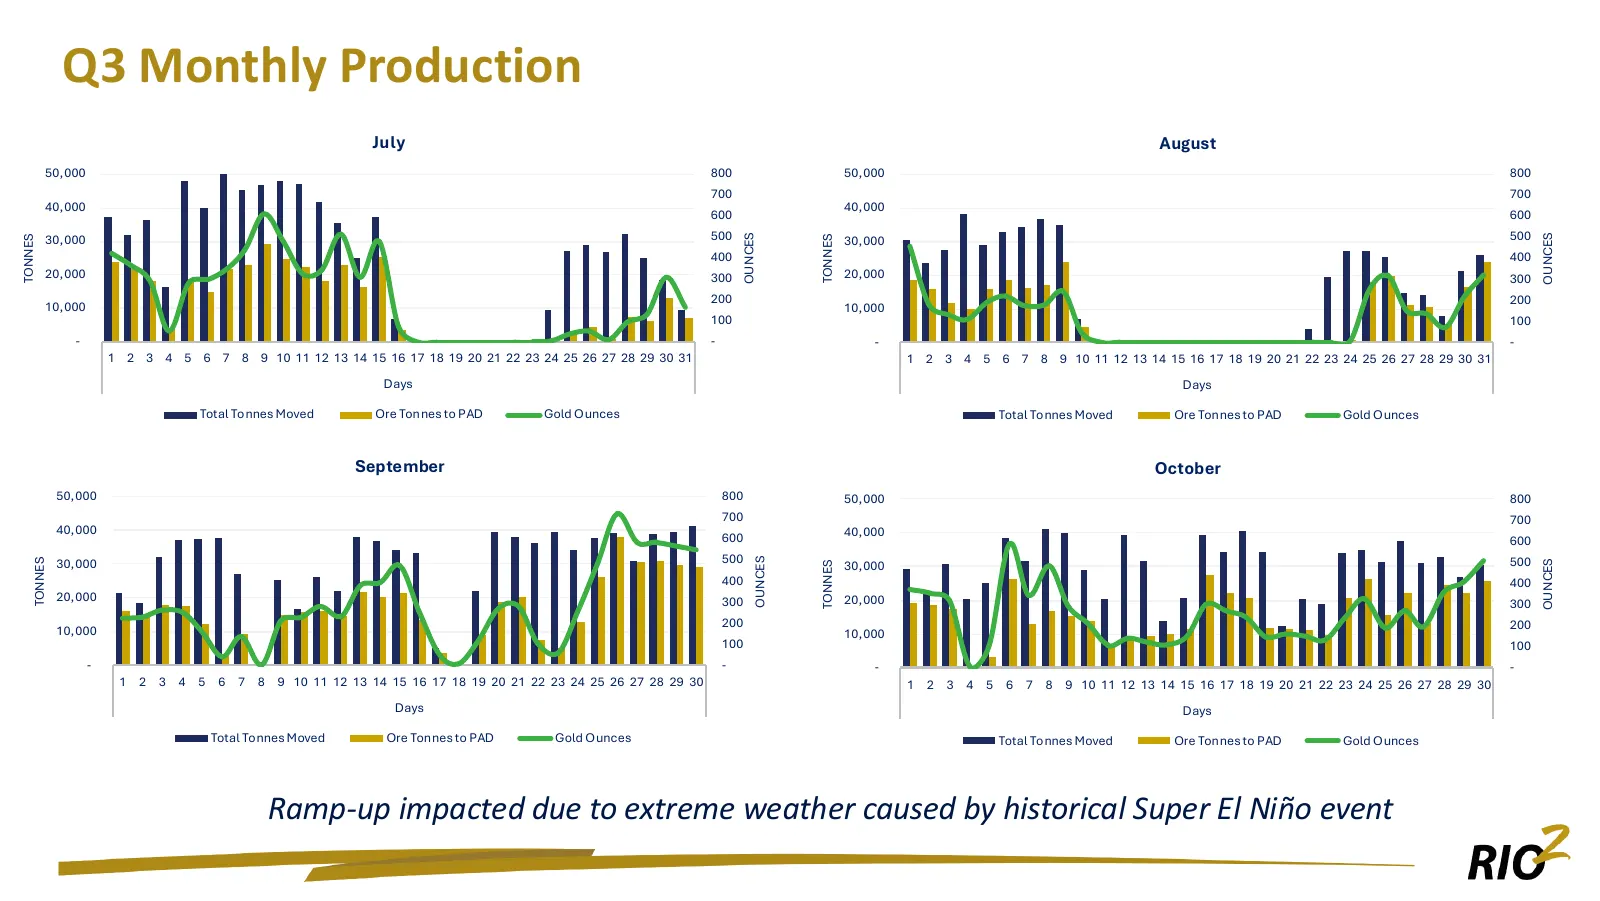
Q3 Monthly Production July August 50,000 800 50,000 800 700 700 40,000 40,000 600 600 30,000 500 30,000 500 OUNCES OUNCES TONNES TONNES 400 400 20,000 300 20,000 300 200 200 10,000 10,000 100 100 - - - - 1 2 3 4 5 6 7 8 9 10 11 12 13 14 15 16 17 18 19 20 21 22 23 24 25 26 27 28 29 30 31 1 2 3 4 5 6
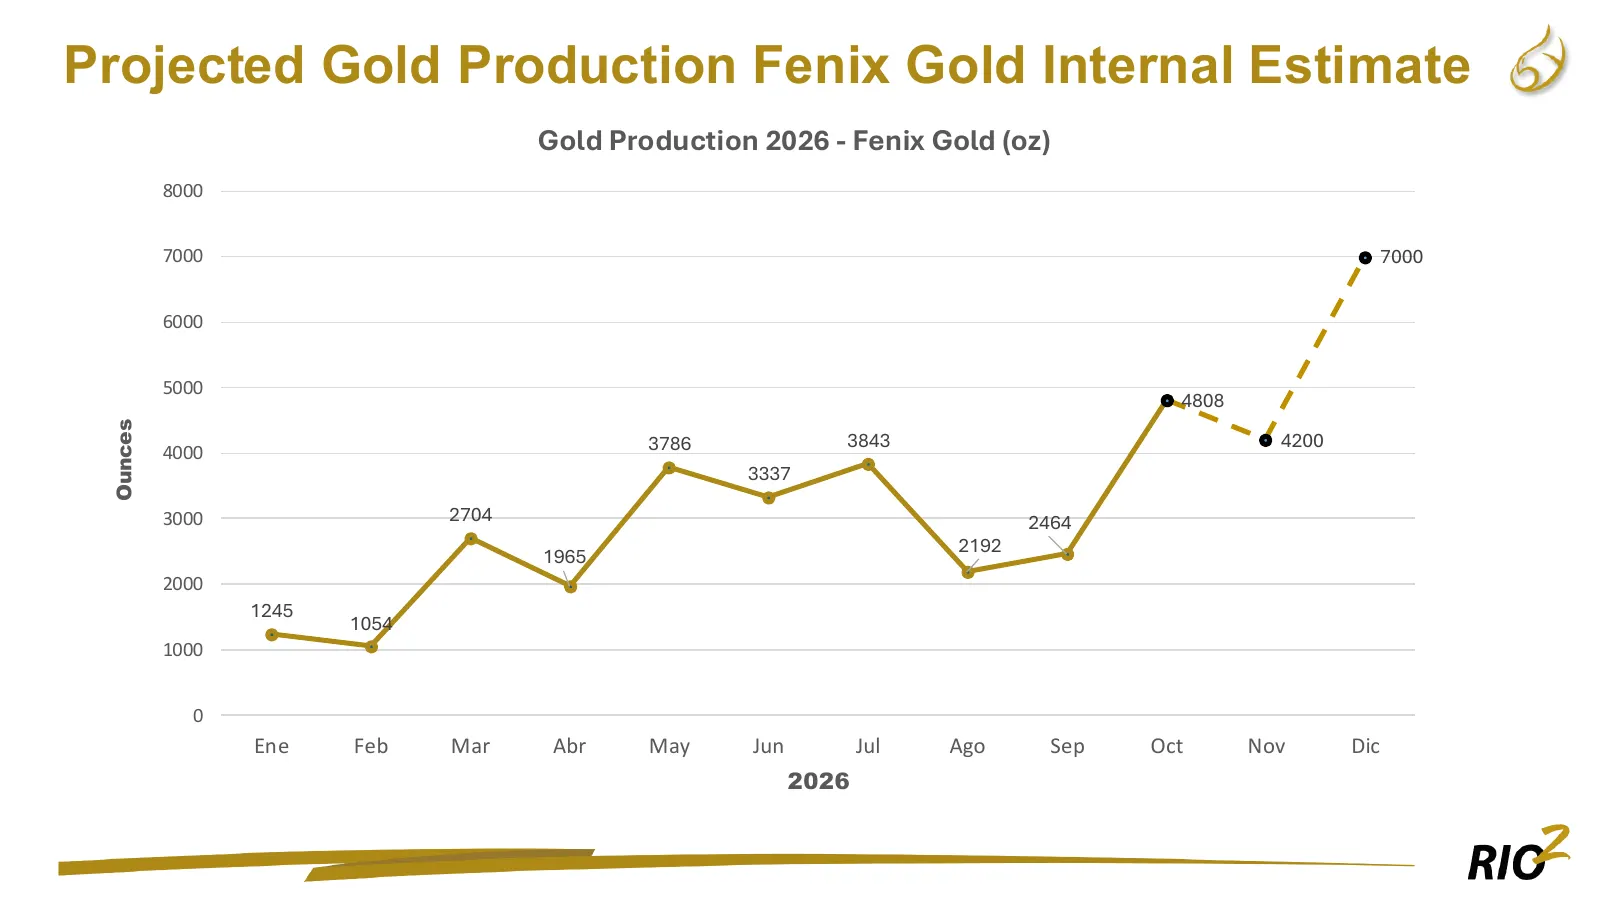
Slide 8: Projected Gold Production Fenix Gold
Projected Gold Production Fenix Gold Internal Estimate Gold Production 2026 - Fenix Gold (oz) 8000 7000 7000 6000 5000 4808 Ounces 3786 3843 4200 4000 3337 3000 2704 2464 2192 1965 2000 1245 1054 1000 0 Ene Feb Mar Abr May Jun Jul Ago Sep Oct Nov Dic 2026
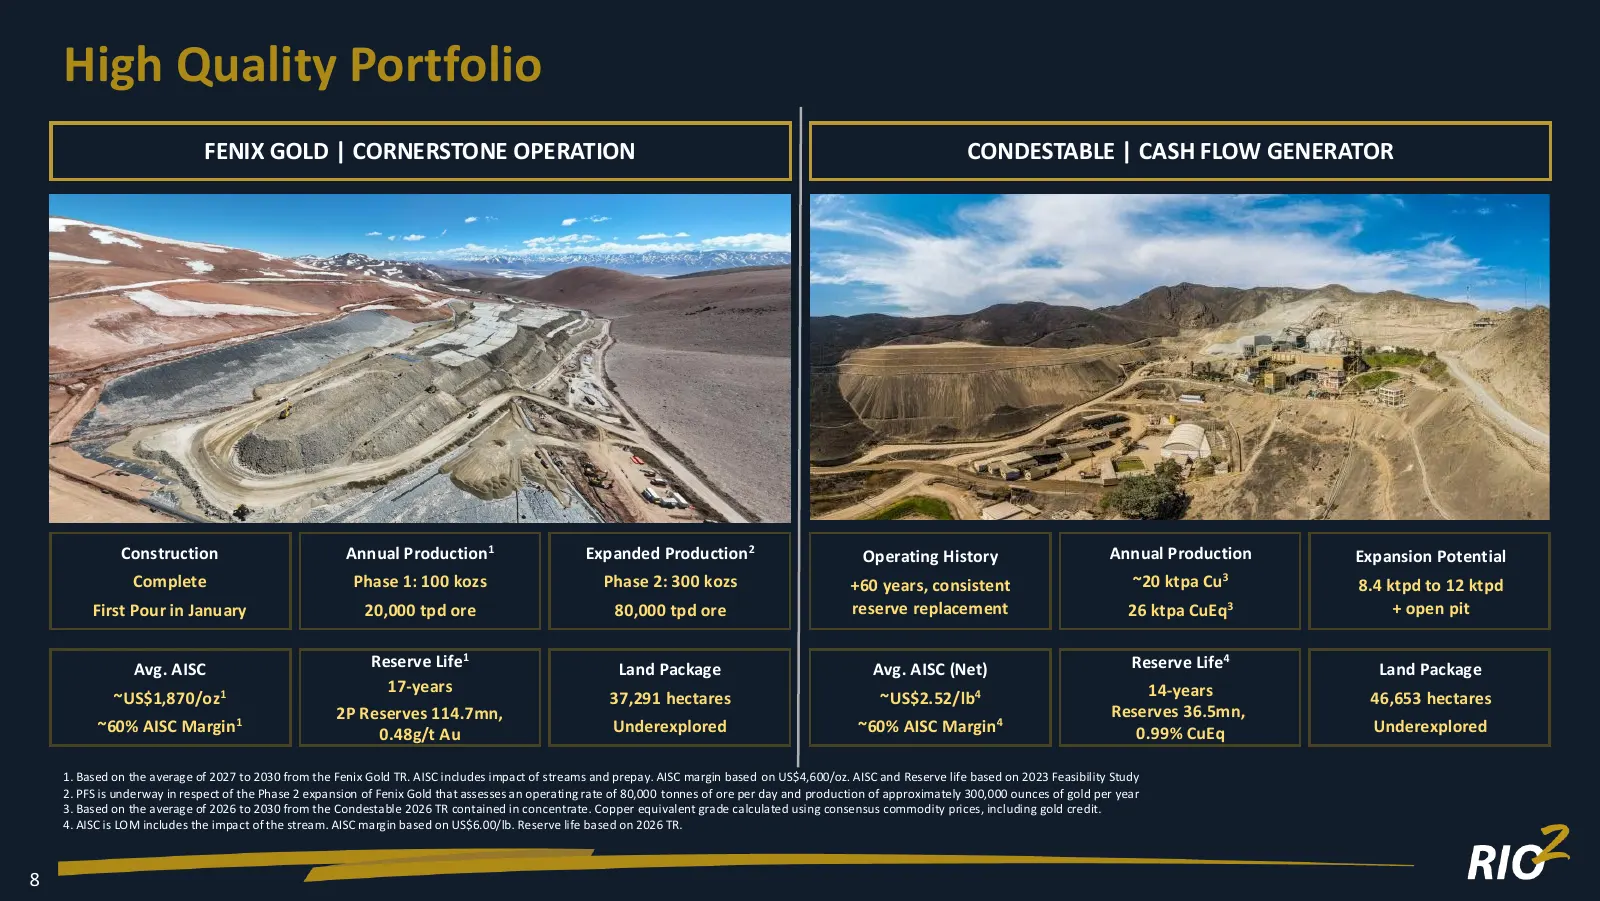
Slide 9: High Quality Portfolio
High Quality Portfolio FENIX GOLD | CORNERSTONE OPERATION CONDESTABLE | CASH FLOW GENERATOR Construction Annual Production1 Expanded Production 2 Operating History Annual Production Expansion Potential Complete Phase 1: 100 kozs Phase 2: 300 kozs +60 years, consistent ~20 ktpa Cu3 8.4 ktpd to 12 ktp
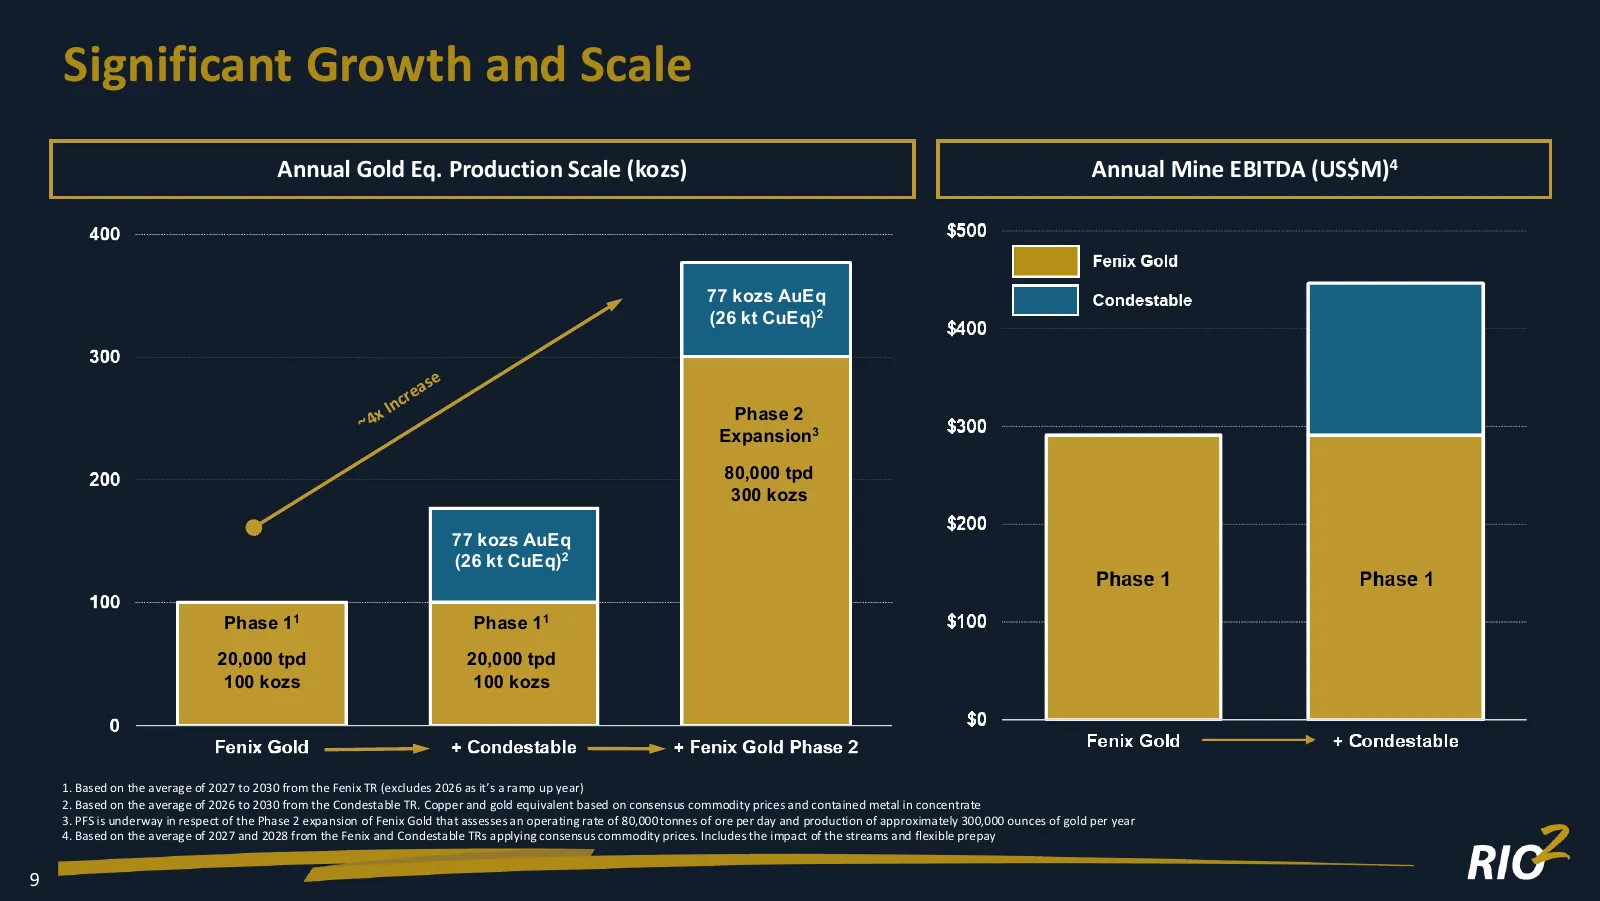
Slide 10: Significant Growth and Scale
Significant Growth and Scale Annual Gold Eq. Production Scale (kozs) Annual Mine EBITDA (US$M)4 77 kozs AuEq (26 kt CuEq)2 Phase 2 Expansion3 80,000 tpd 300 kozs 77 kozs AuEq (26 kt CuEq)2 Phase 1 1 Phase 1 1 20,000 tpd 20,000 tpd 100 kozs 100 kozs 1. Based on the average of 2027 to 2030 from the Fe
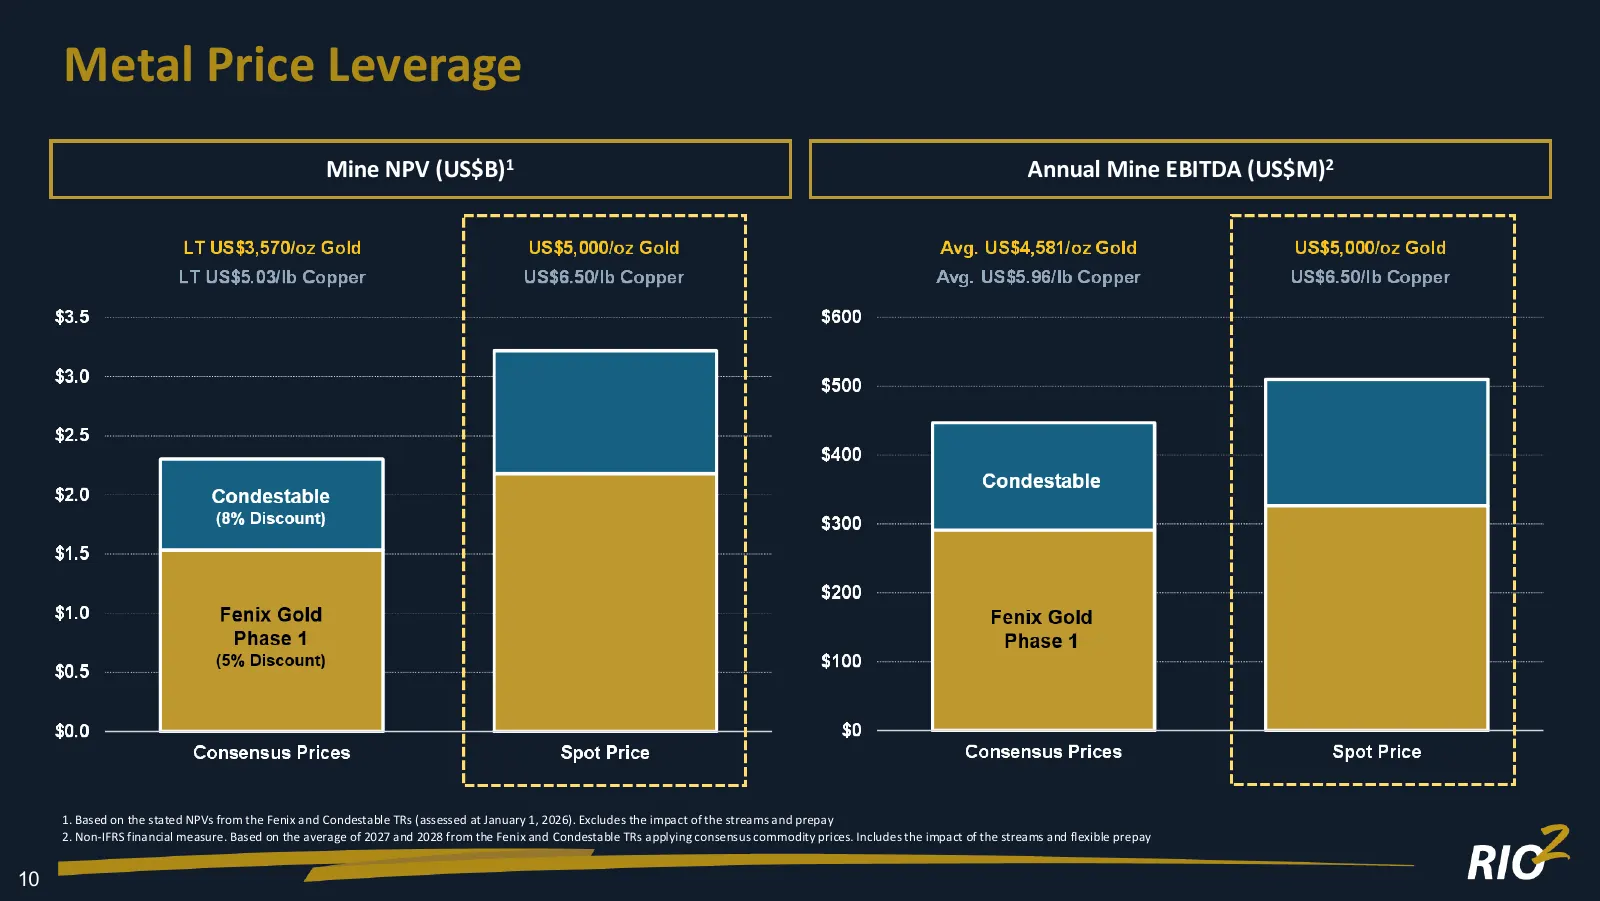
Slide 11: Metal Price Leverage
Metal Price Leverage Mine NPV (US$B)1 Annual Mine EBITDA (US$M)2 1. Based on the stated NPVs from the Fenix and Condestable TRs (assessed at January 1, 2026). Excludes the impact of the streams and prepay 2. Non-IFRS financial measure. Based on the average of 2027 and 2028 from the Fenix and Condest
Slide 12: The Growth Plan
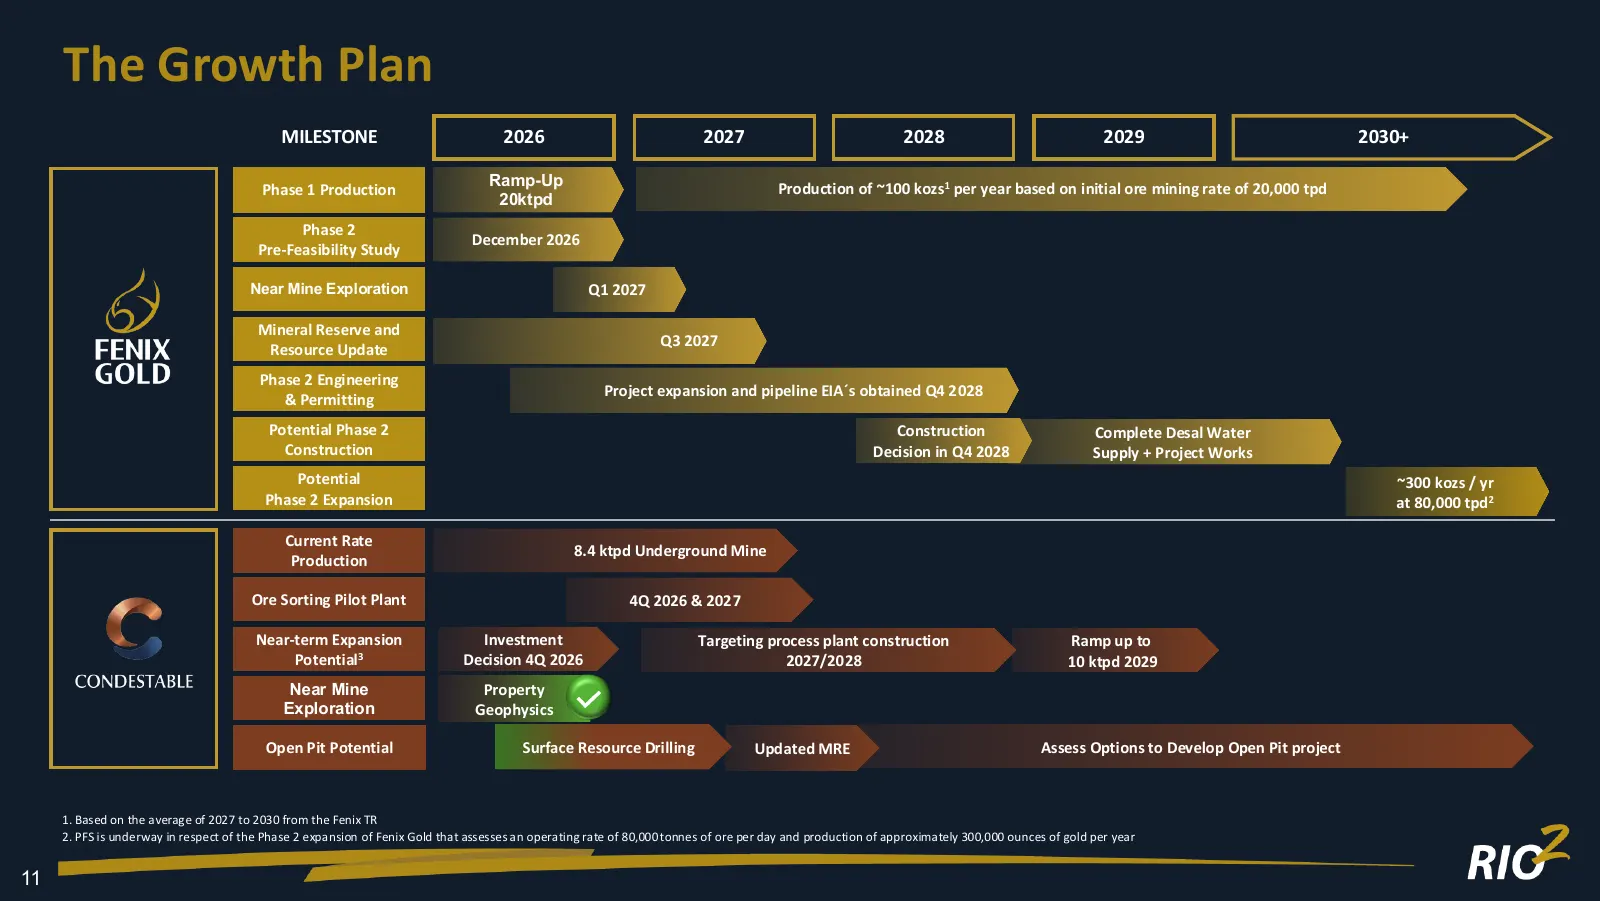
The Growth Plan MILESTONE 2026 2027 2028 2029 2030+ Ramp-Up Production of ~100 kozs1 per year based on initial ore mining rate of 20,000 tpd Phase 1 Production 20ktpd Phase 2 December 2026 Pre-Feasibility Study Near Mine Exploration Q1 2027 Mineral Reserve and Q3 2027 Resource Update Phase 2 Enginee
Slide 13: 12
12
Slide 14: The Newest Gold Mine in Chile
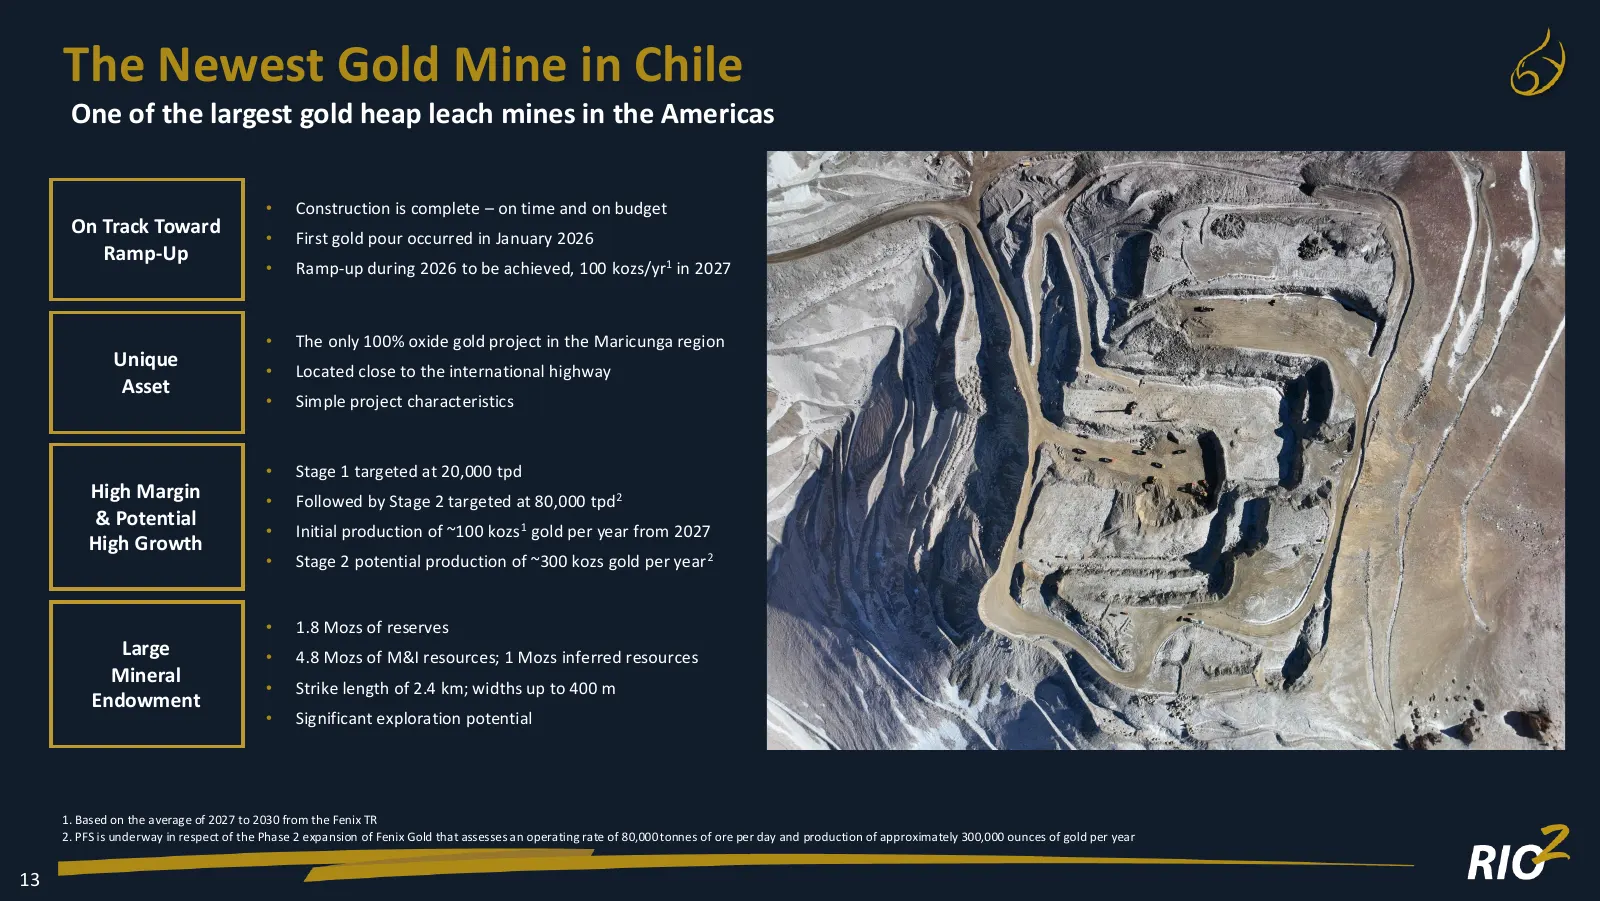
The Newest Gold Mine in Chile One of the largest gold heap leach mines in the Americas • Construction is complete – on time and on budget On Track Toward • First gold pour occurred in January 2026 Ramp-Up • Ramp-up during 2026 to be achieved, 100 kozs/yr1 in 2027 • The only 100% oxide gold project i
Slide 15: Massive Outcropping Oxide Orebody
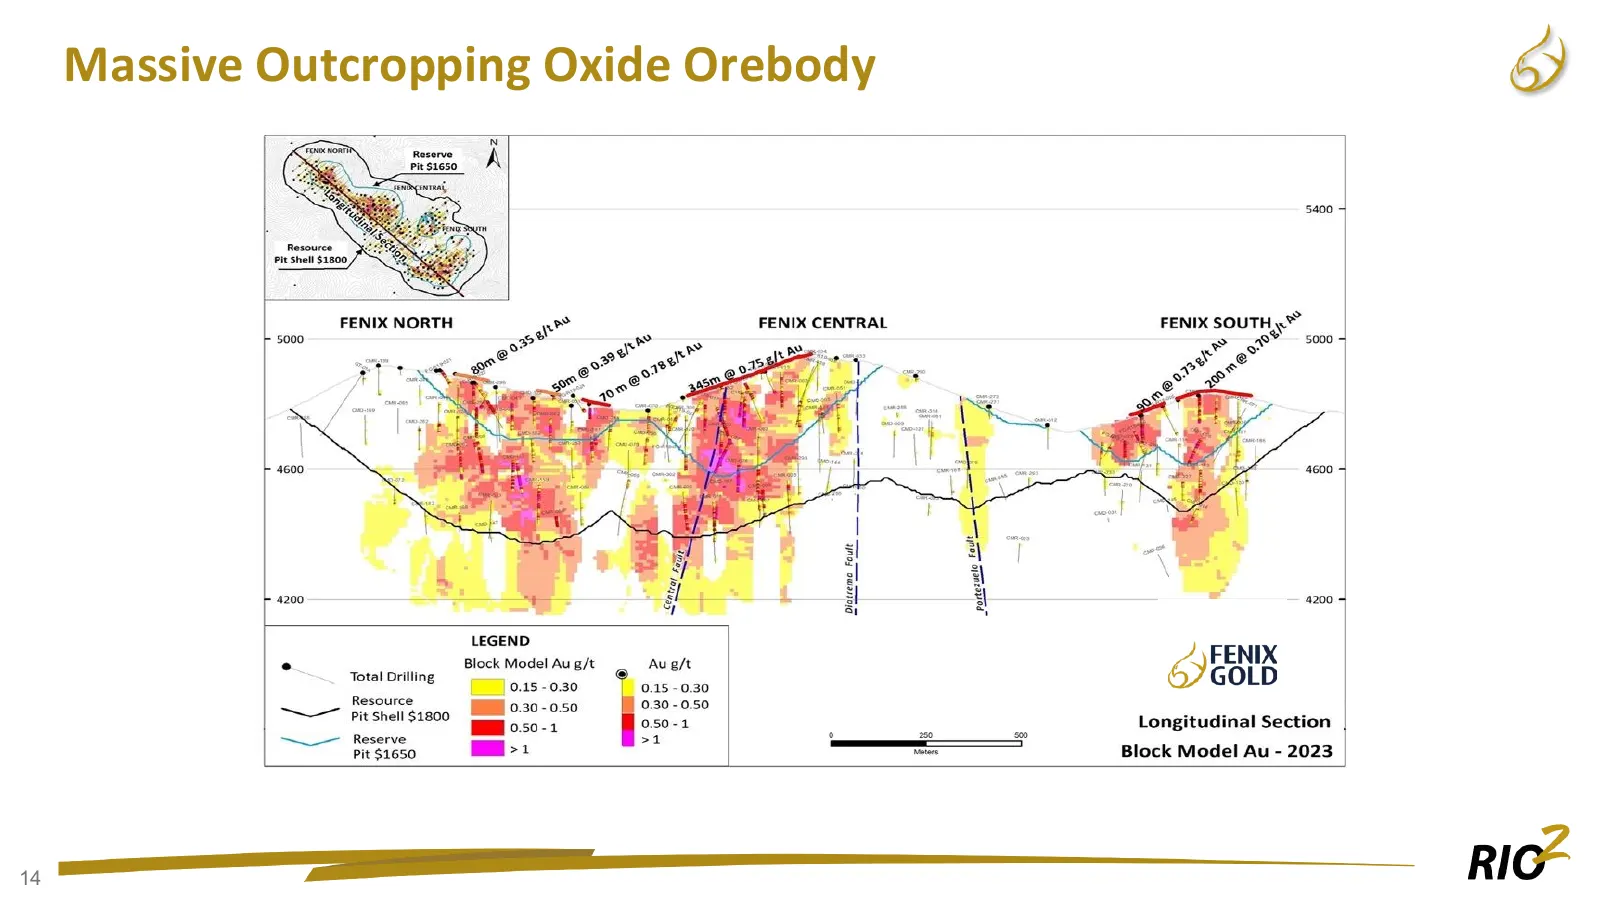
Massive Outcropping Oxide Orebody 14
Slide 16: Resource Growth Potential
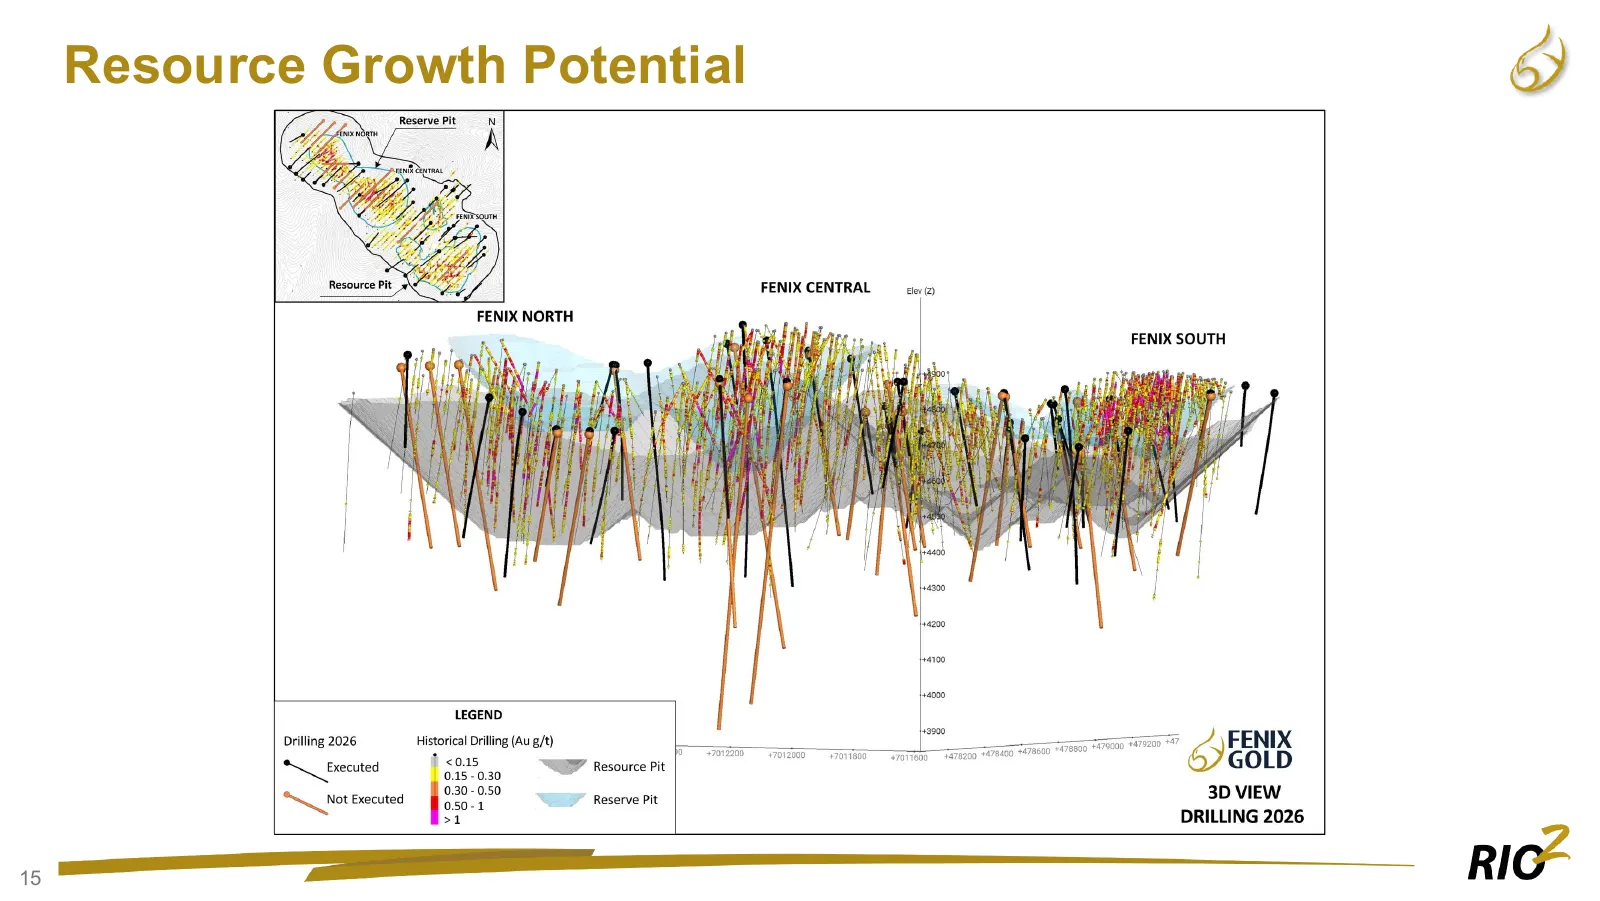
Resource Growth Potential CONCEPTUAL DRILLING TARGETS 15
Slide 17: Phase 2 Water Supply
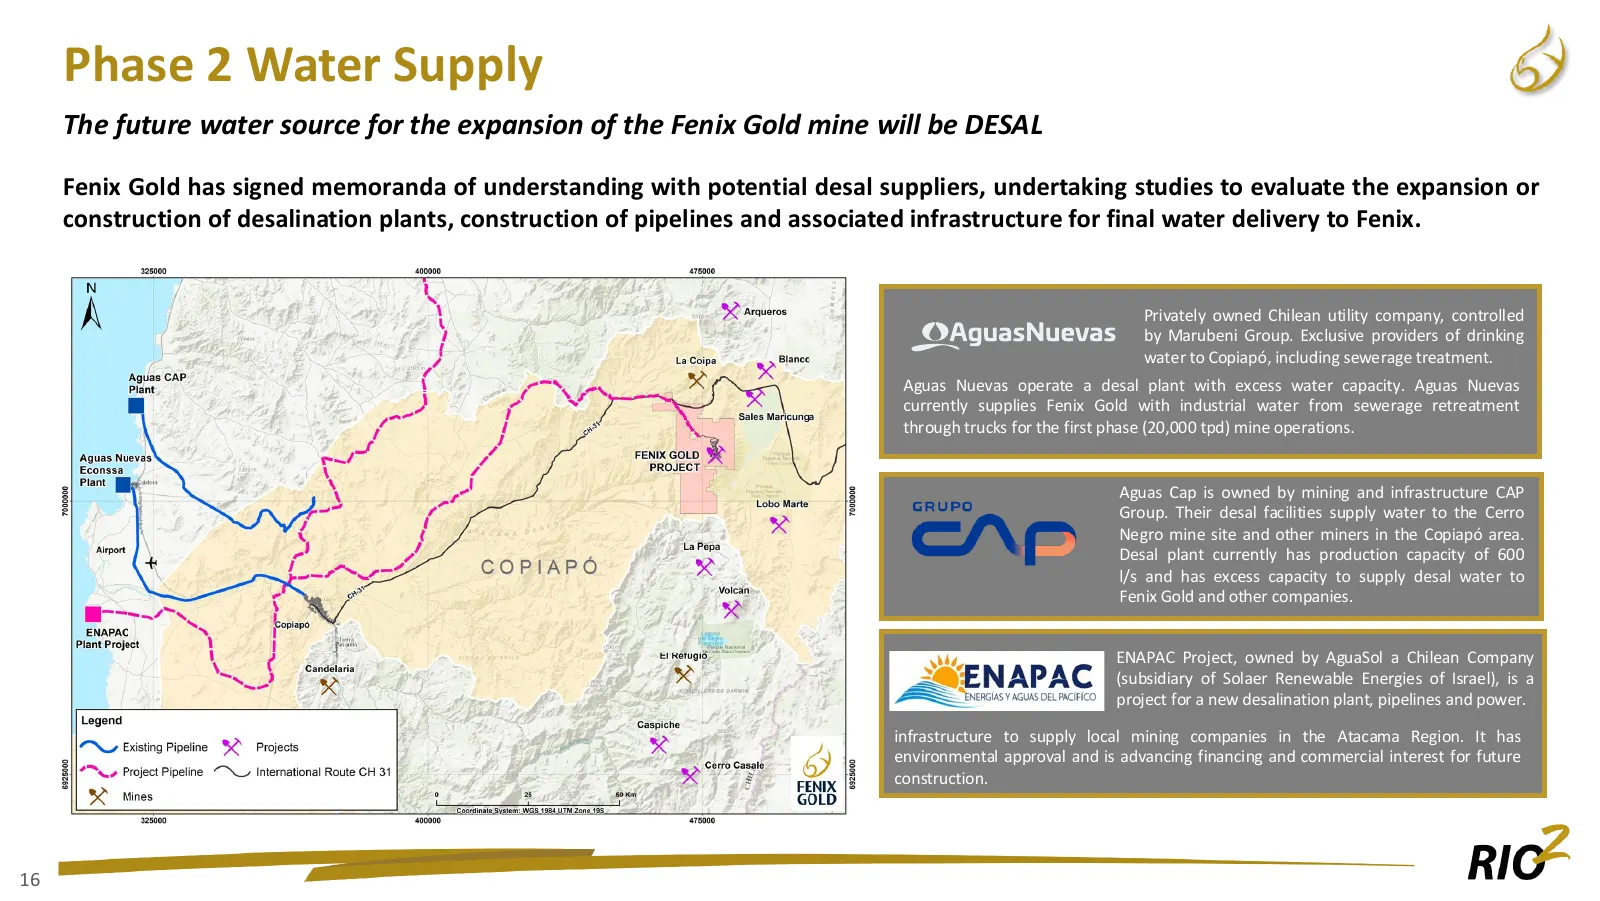
Phase 2 Water Supply The future water source for the expansion of the Fenix Gold mine will be DESAL Fenix Gold has signed memoranda of understanding with potential desal suppliers, undertaking studies to evaluate the expansion or construction of desalination plants, construction of pipelines and ass
Slide 18: Condestable
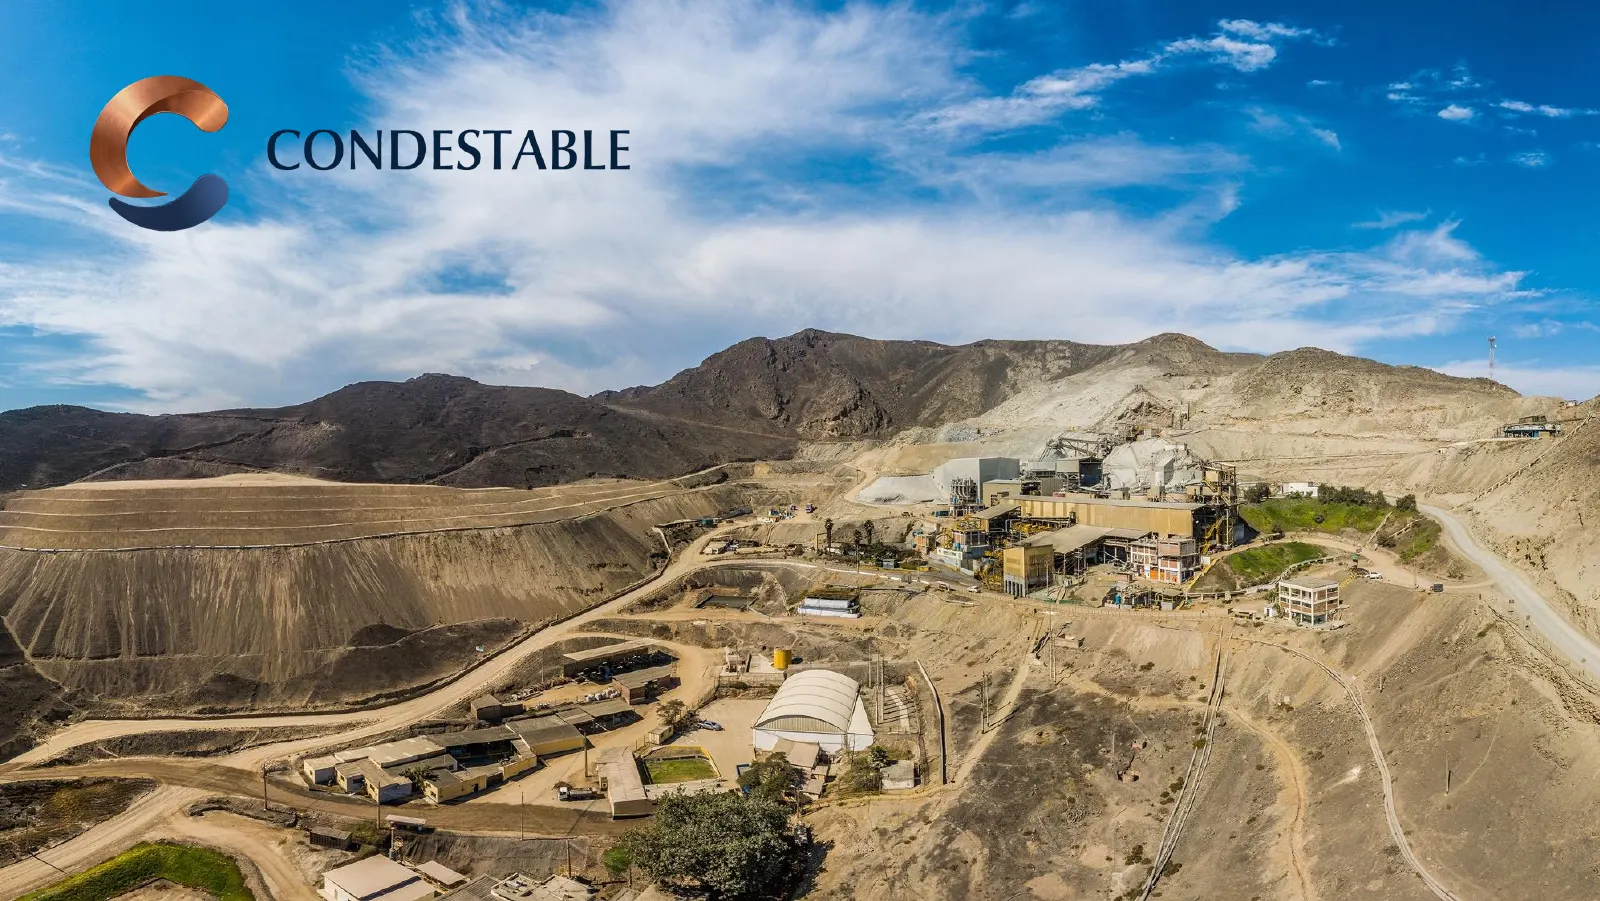
DESTABLE
Slide 19: A Solid Operation with Upside
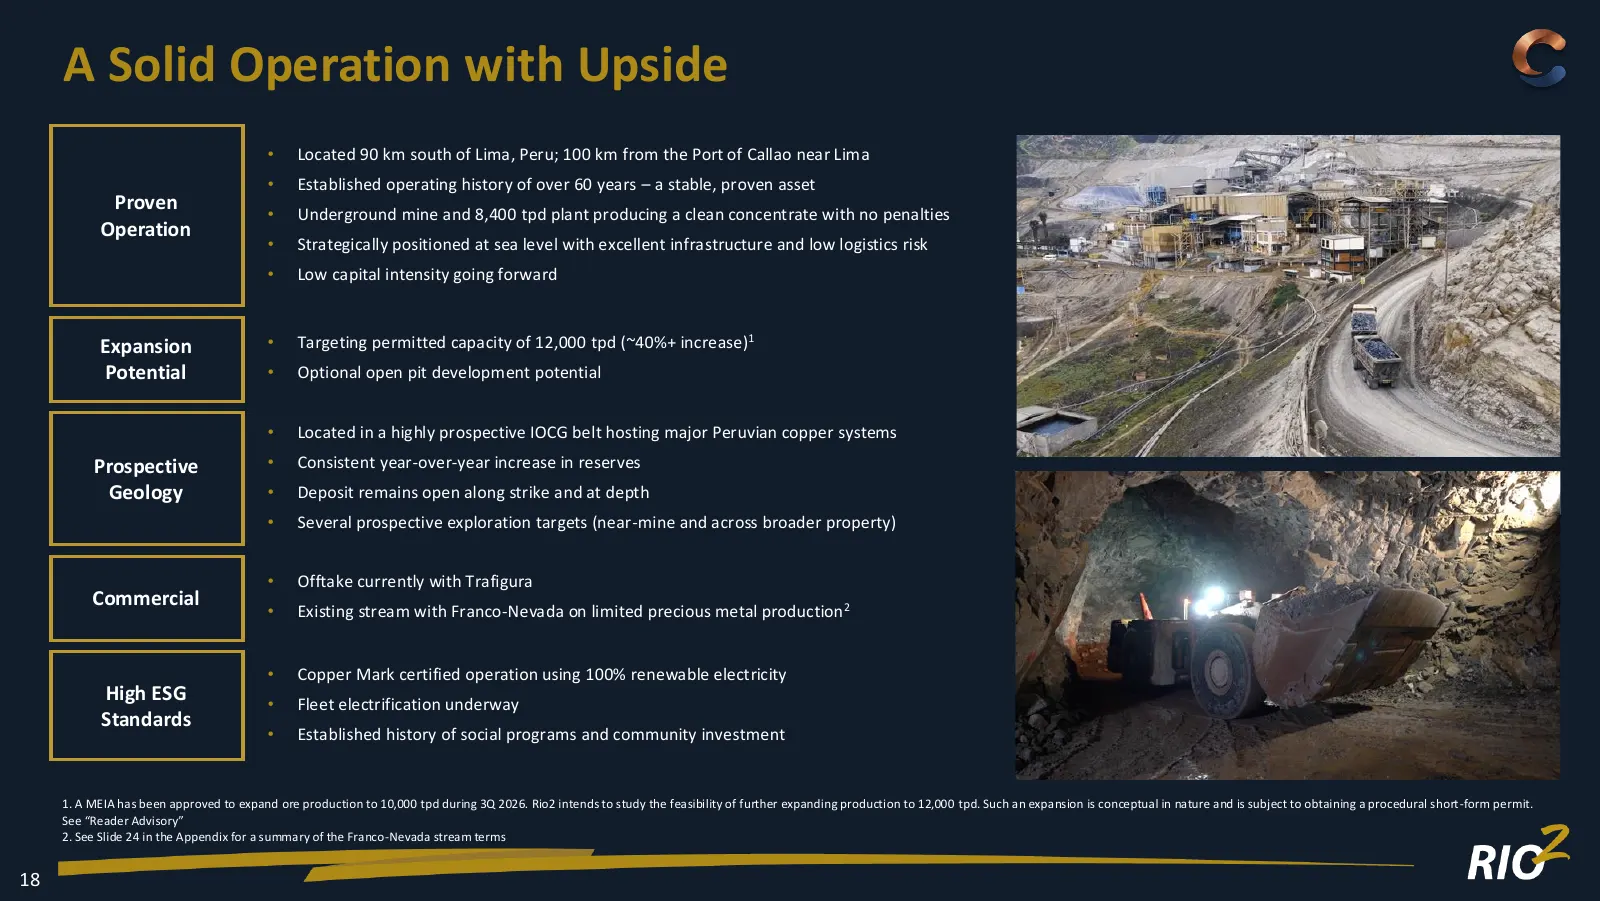
A Solid Operation with Upside • Located 90 km south of Lima, Peru; 100 km from the Port of Callao near Lima • Established operating history of over 60 years – a stable, proven asset Proven • Underground mine and 8,400 tpd plant producing a clean concentrate with no penalties Operation • Strategicall
Slide 20: Condestable Photos: Site Overview
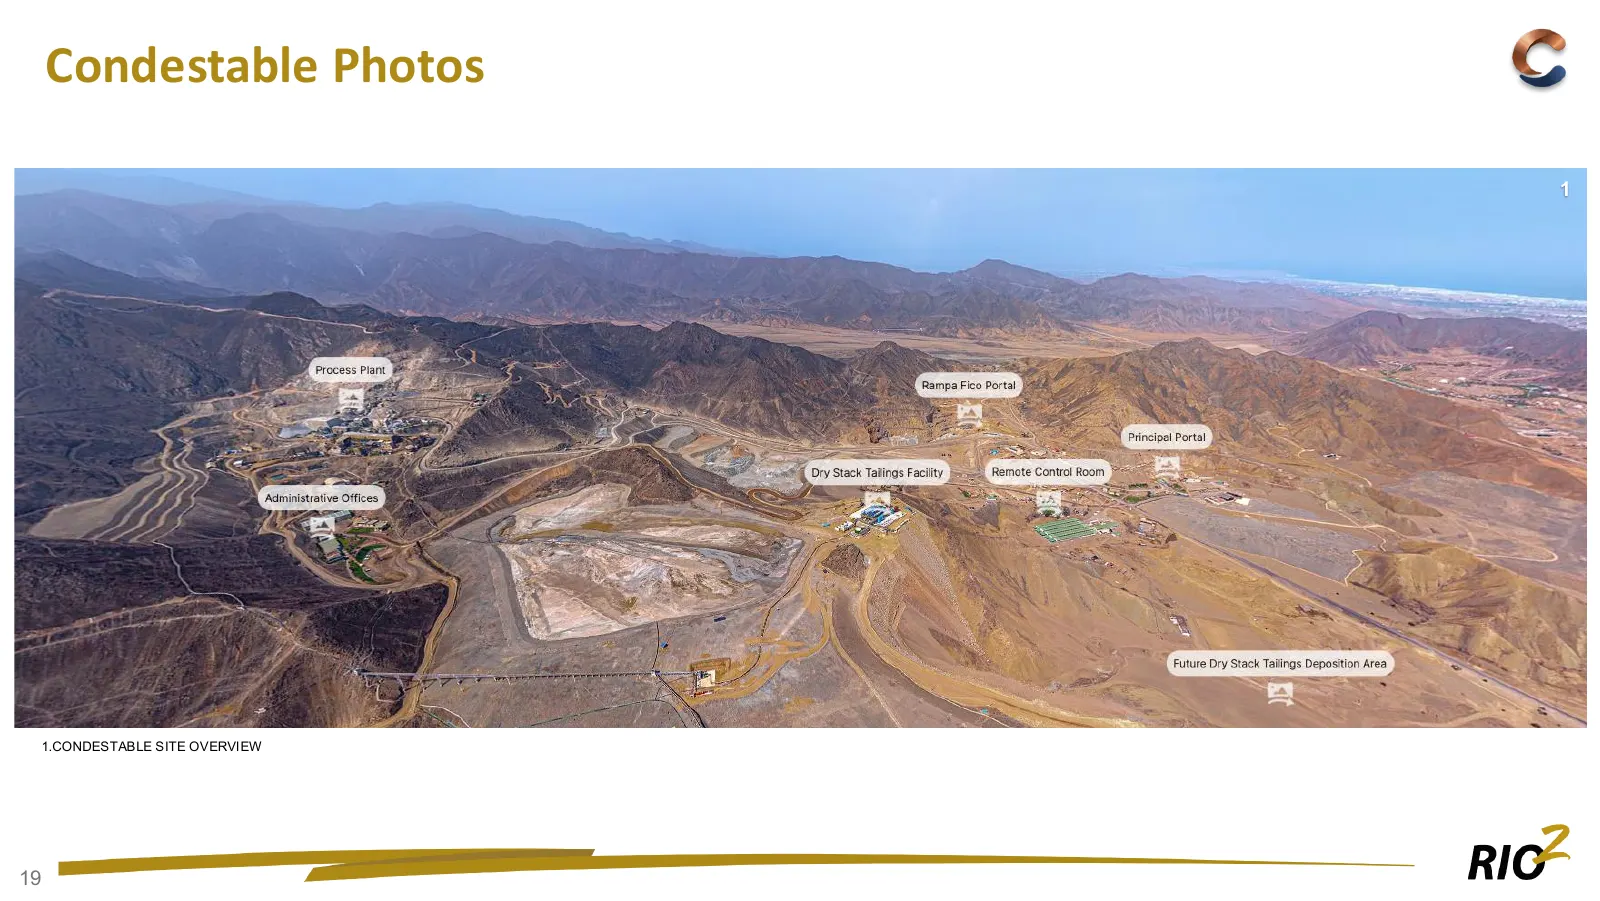
Condestable Photos 1 1.CONDESTABLE SITE OVERVIEW 19
Slide 21: Condestable Photos: Process Plant
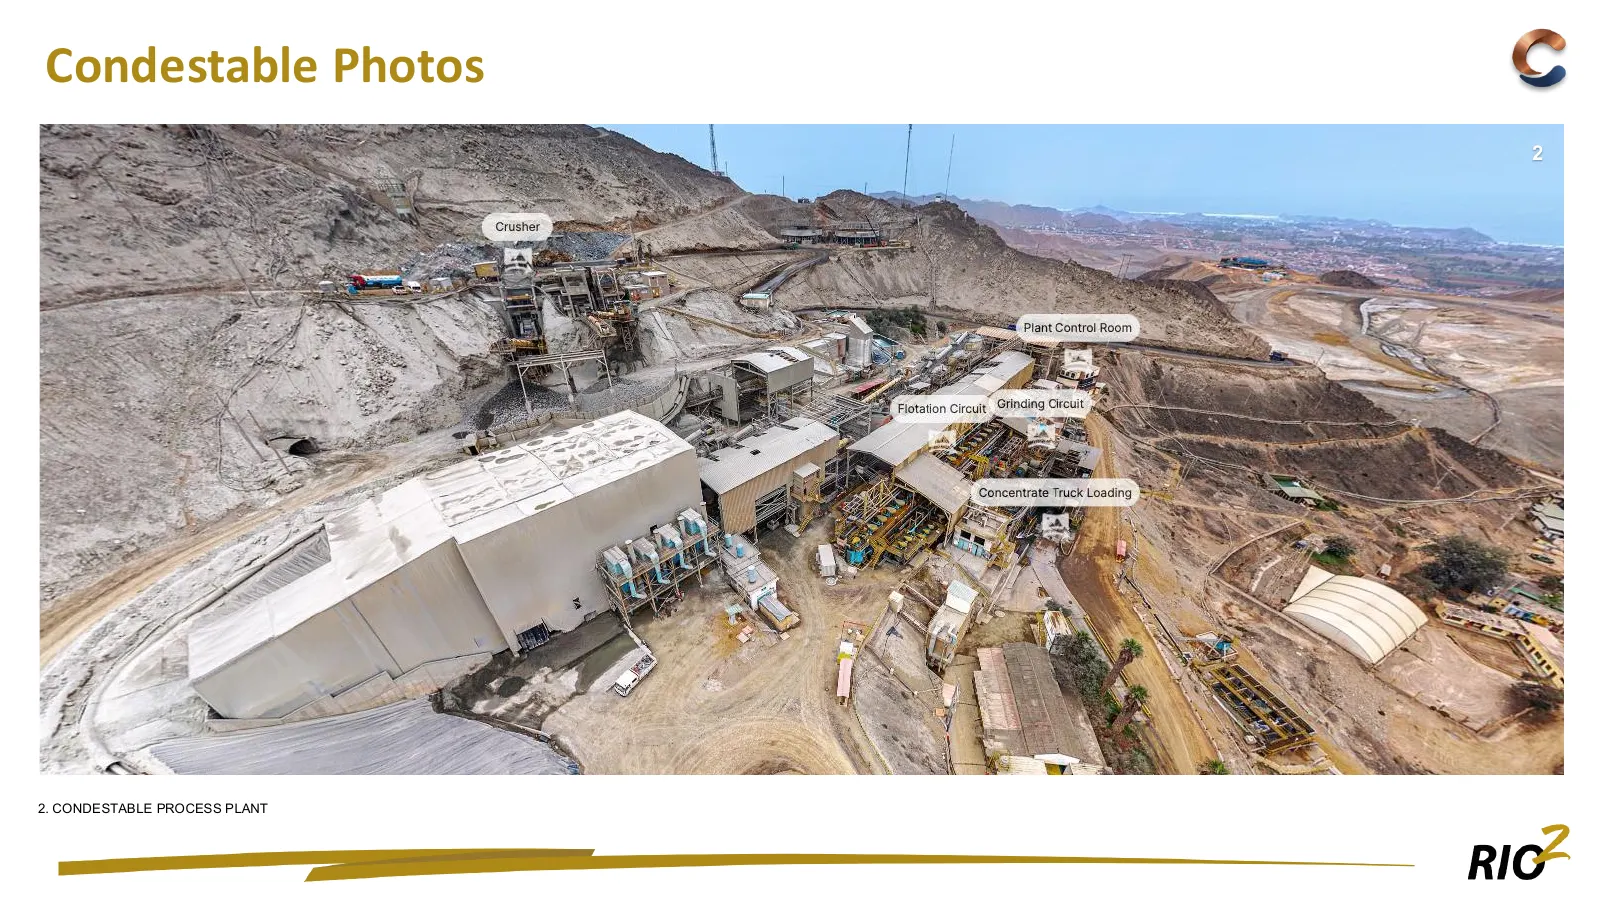
Condestable Photos 2 2. CONDESTABLE PROCESS PLANT
Slide 22: Condestable Photos
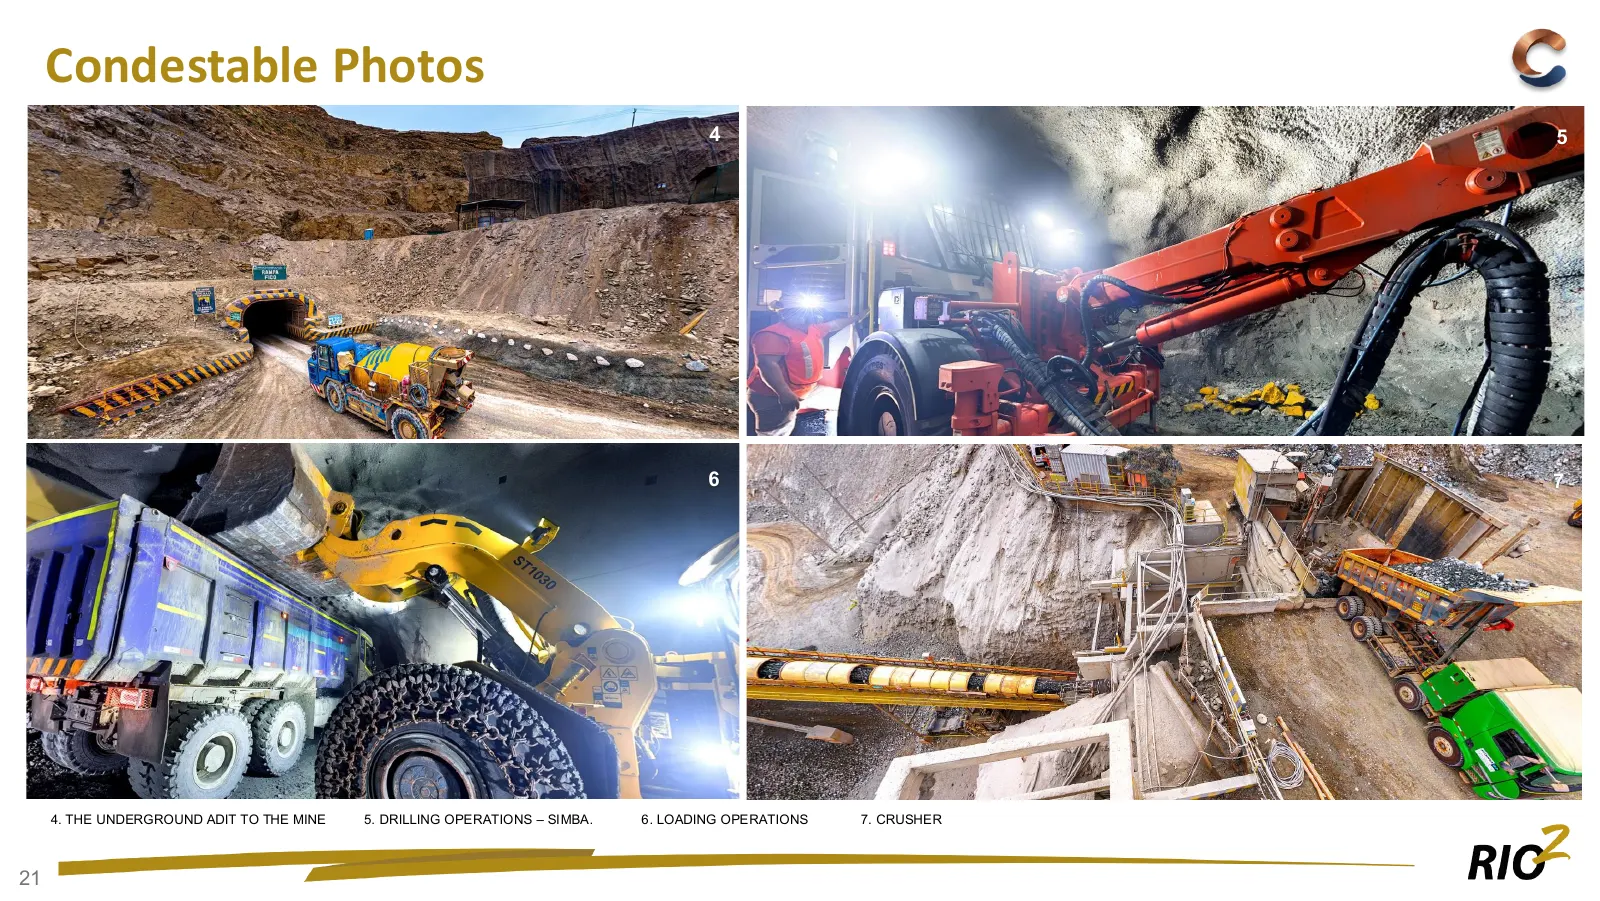
Condestable Photos 4 5 6 7 4. THE UNDERGROUND ADIT TO THE MINE 5. DRILLING OPERATIONS – SIMBA. 6. LOADING OPERATIONS 7. CRUSHER 21
Slide 23: Deposits and Depth Potential
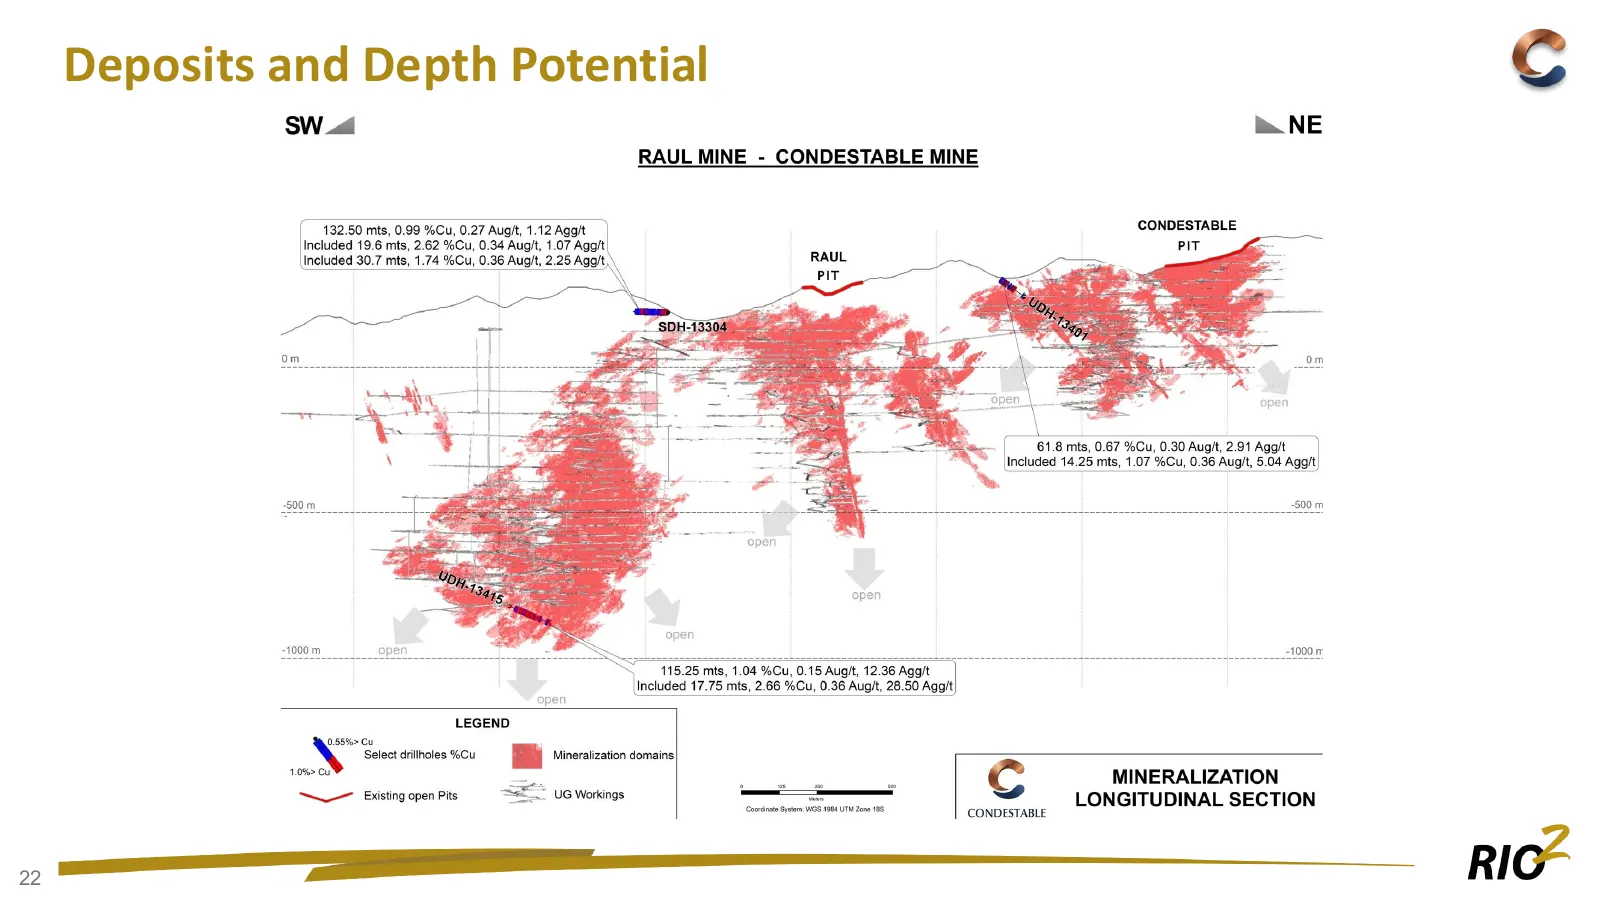
Deposits and Depth Potential 22
Slide 24: Base Operating Scale and Expansion Potential
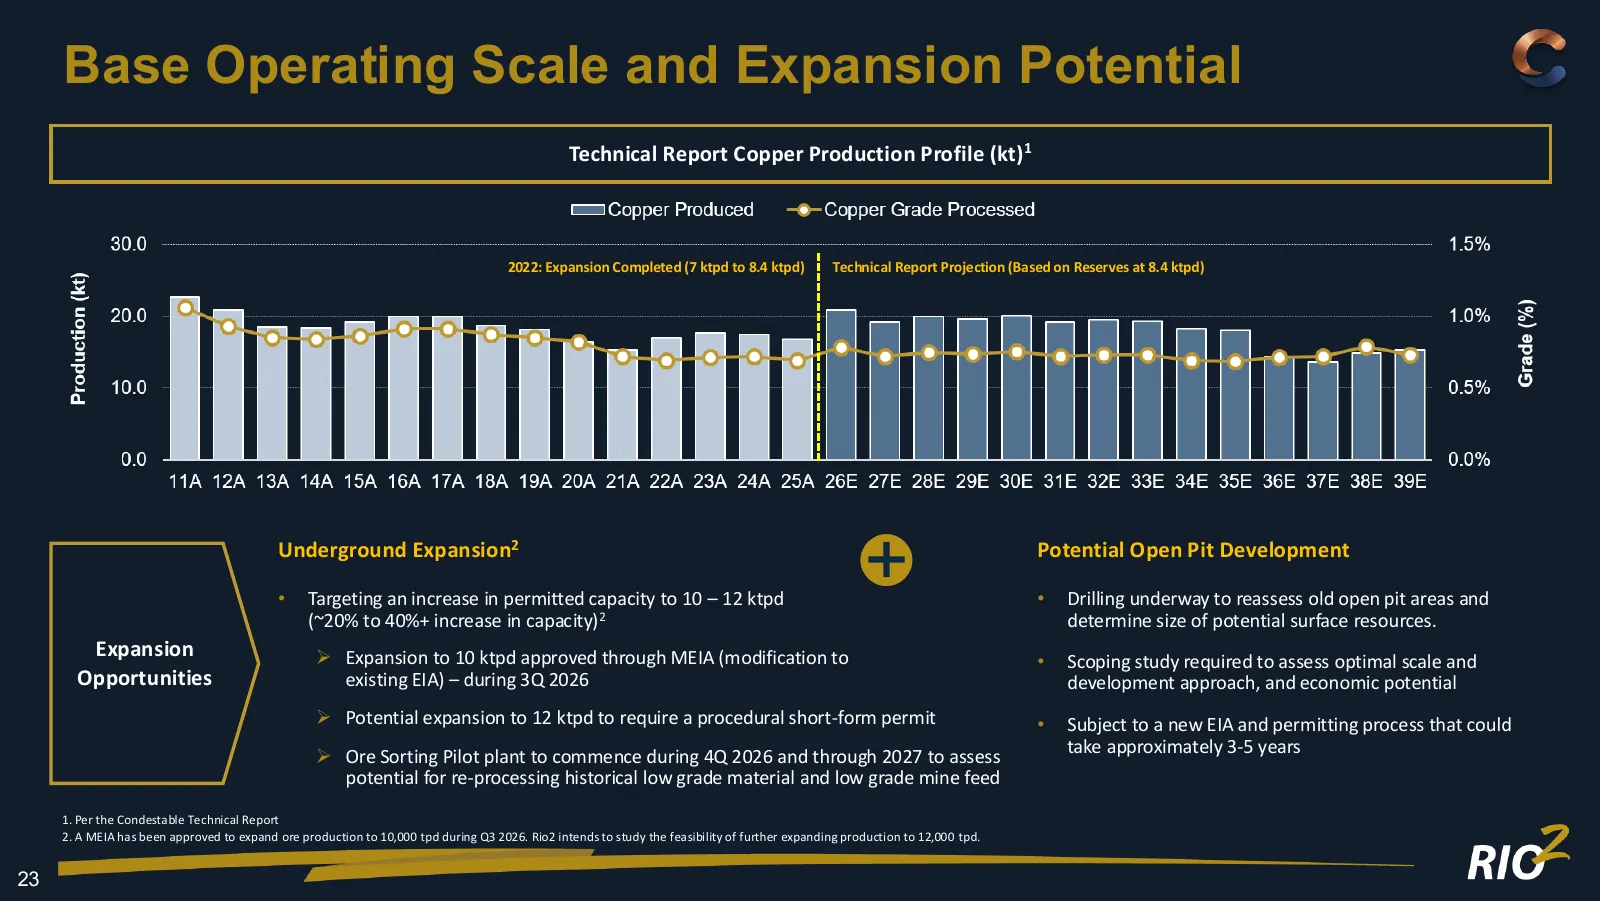
Base Operating Scale and Expansion Potential Technical Report Copper Production Profile (kt) 1 2022: Expansion Completed (7 ktpd to 8.4 ktpd) Technical Report Projection (Based on Reserves at 8.4 ktpd) Underground Expansion2 Potential Open Pit Development • Targeting an increase in permitted capacit
Slide 25: Exploration Potential
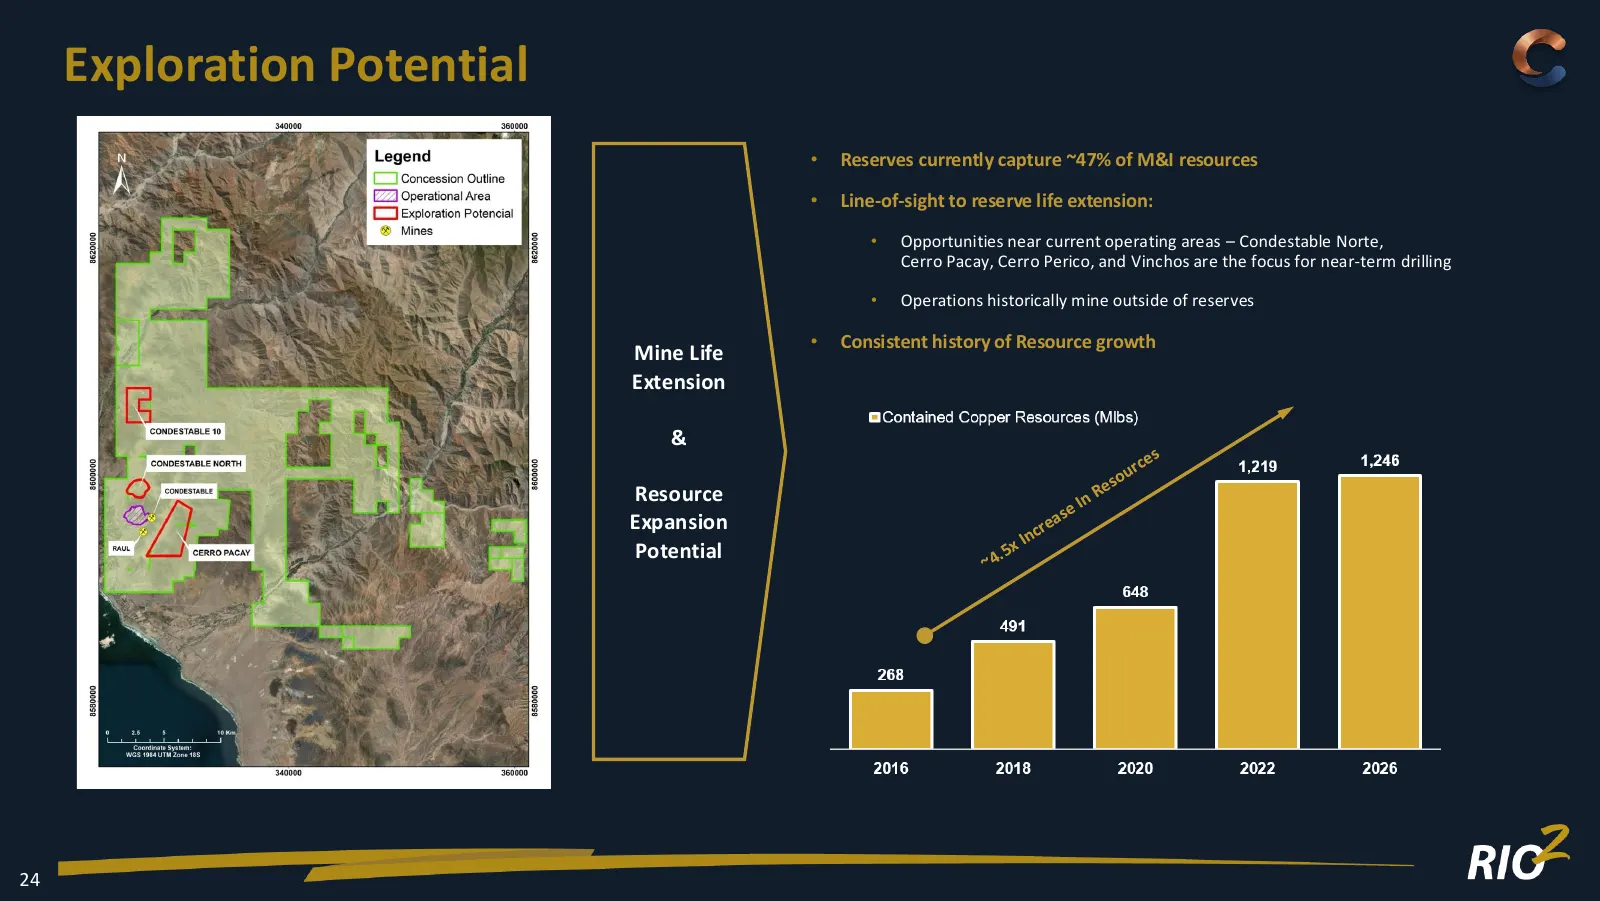
Exploration Potential • Reserves currently capture ~47% of M&I resources • Line-of-sight to reserve life extension: • Opportunities near current operating areas – Condestable Norte, Cerro Pacay, Cerro Perico, and Vinchos are the focus for near-term drilling • Operations historically mine outside of
Slide 26: Kalzas Tungsten Project - Yukon
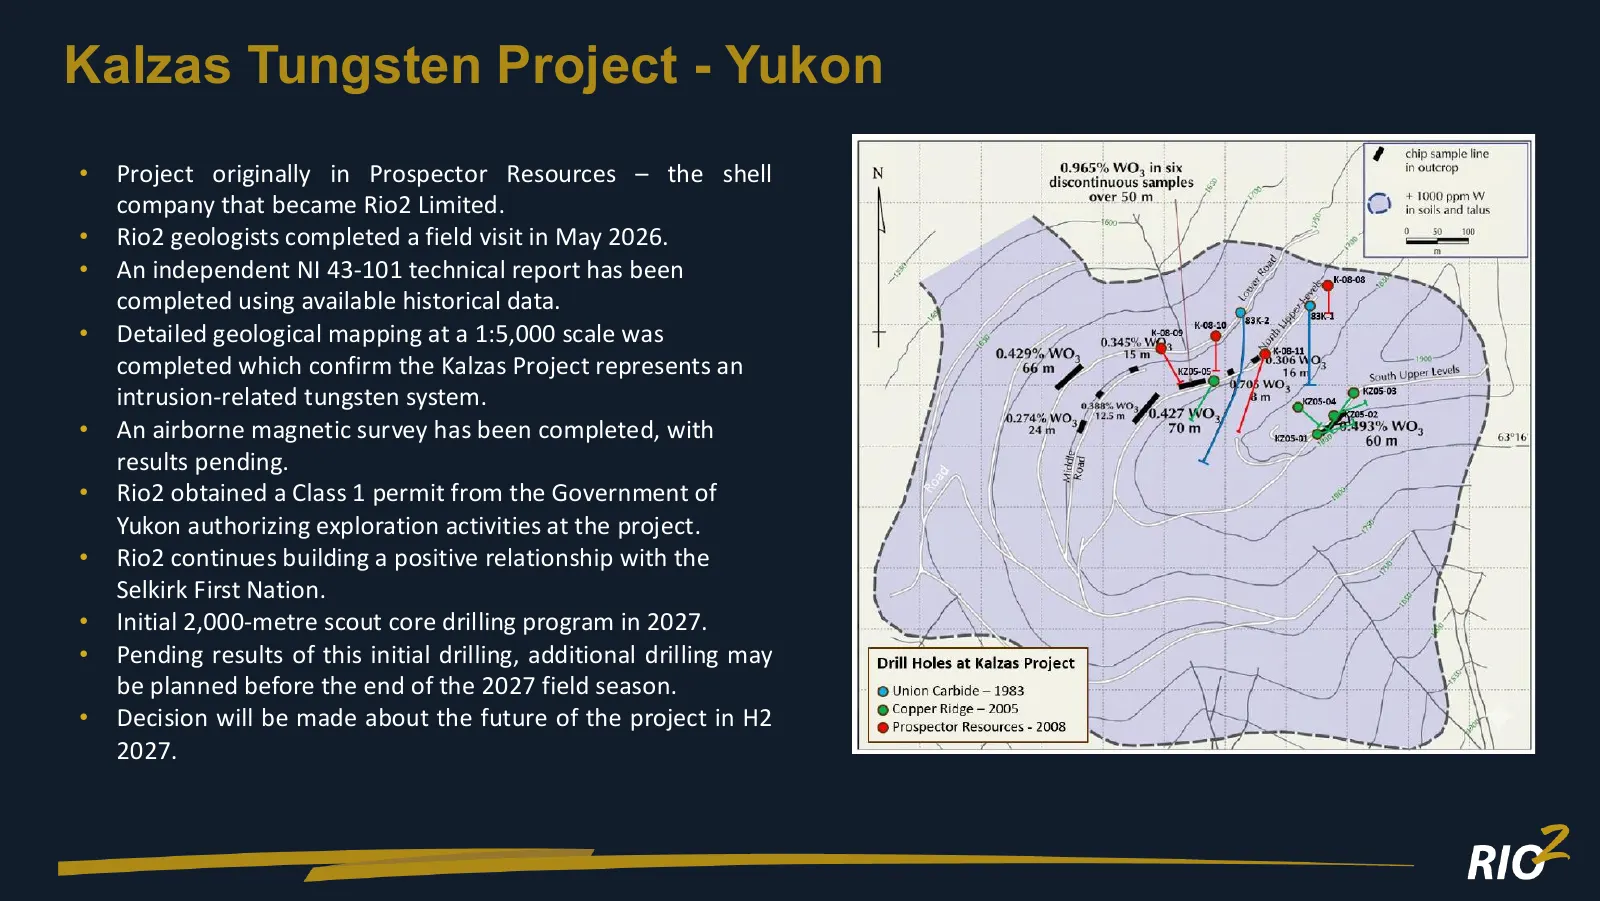
Kalzas Tungsten Project - Yukon • Project originally in Prospector Resources – the shell company that became Rio2 Limited. • Rio2 geologists completed a field visit in May 2026. • An independent NI 43-101 technical report has been completed using available historical data. • Detailed geological mapp

Slide 27: www.rio2.com
TSX: RIO | OTCQX: RIOFF | BVL: RIO www.rio2.com 26
Slide 28: Appendix
Appendix RIO~
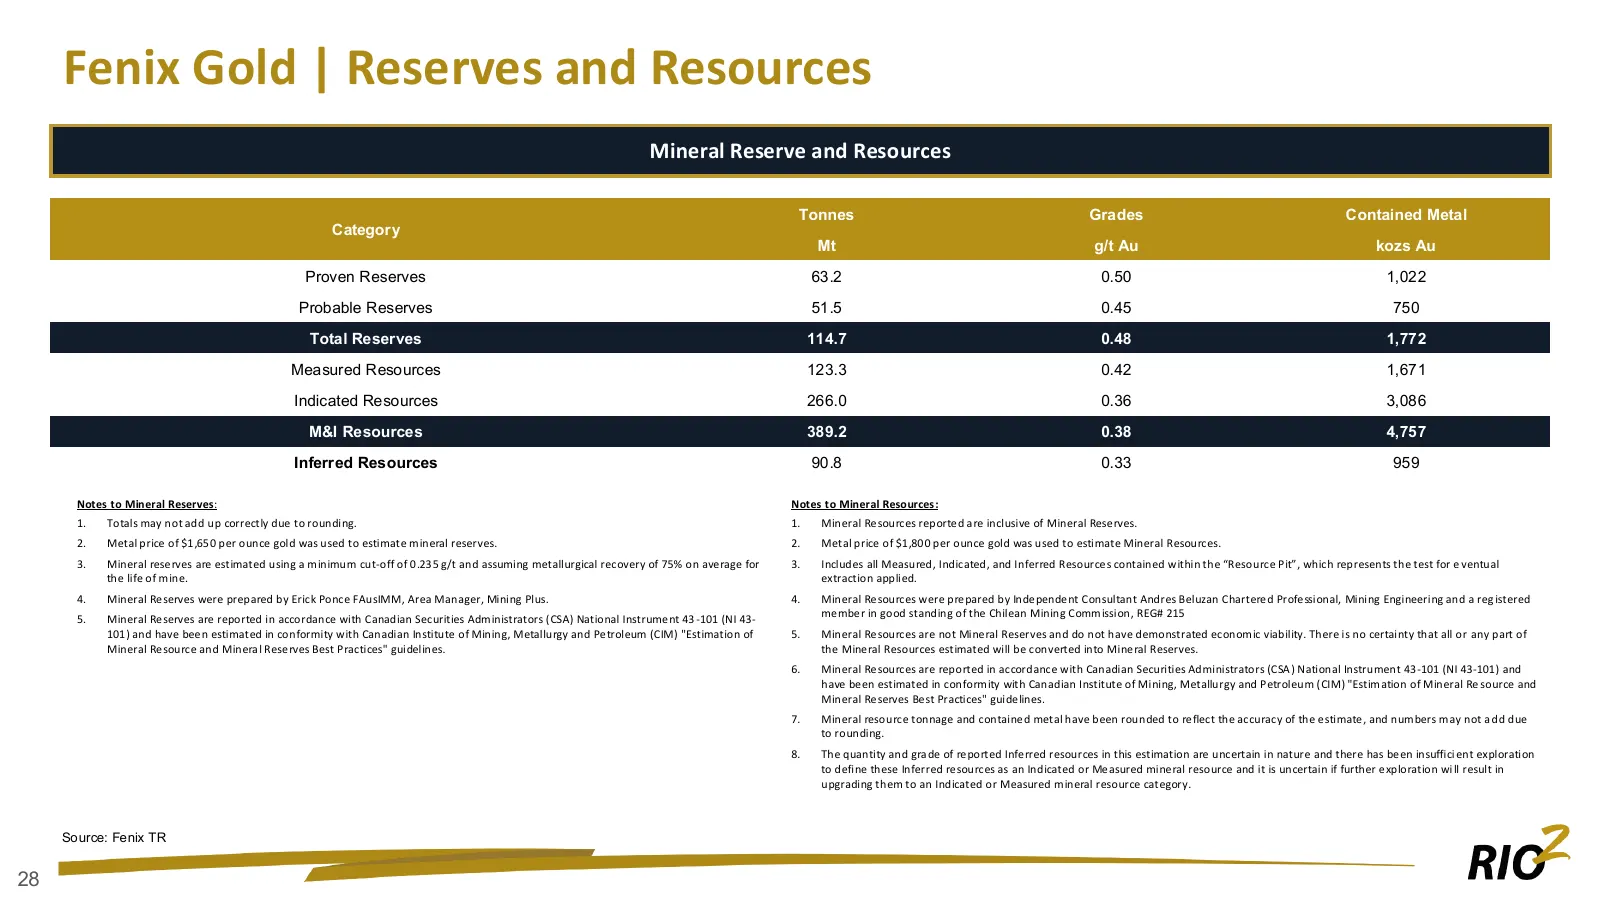
Slide 29: Fenix Gold | Reserves and Resources
Fenix Gold | Reserves and Resources Mineral Reserve and Resources Tonnes Grades Contained Metal Category Mt g/t Au kozs Au Proven Reserves 63.2 0.50 1,022 Probable Reserves 51.5 0.45 750 Total Reserves 114.7 0.48 1,772 Measured Resources 123.3 0.42 1,671 Indicated Resources 266.0 0.36 3,086 M&I Reso
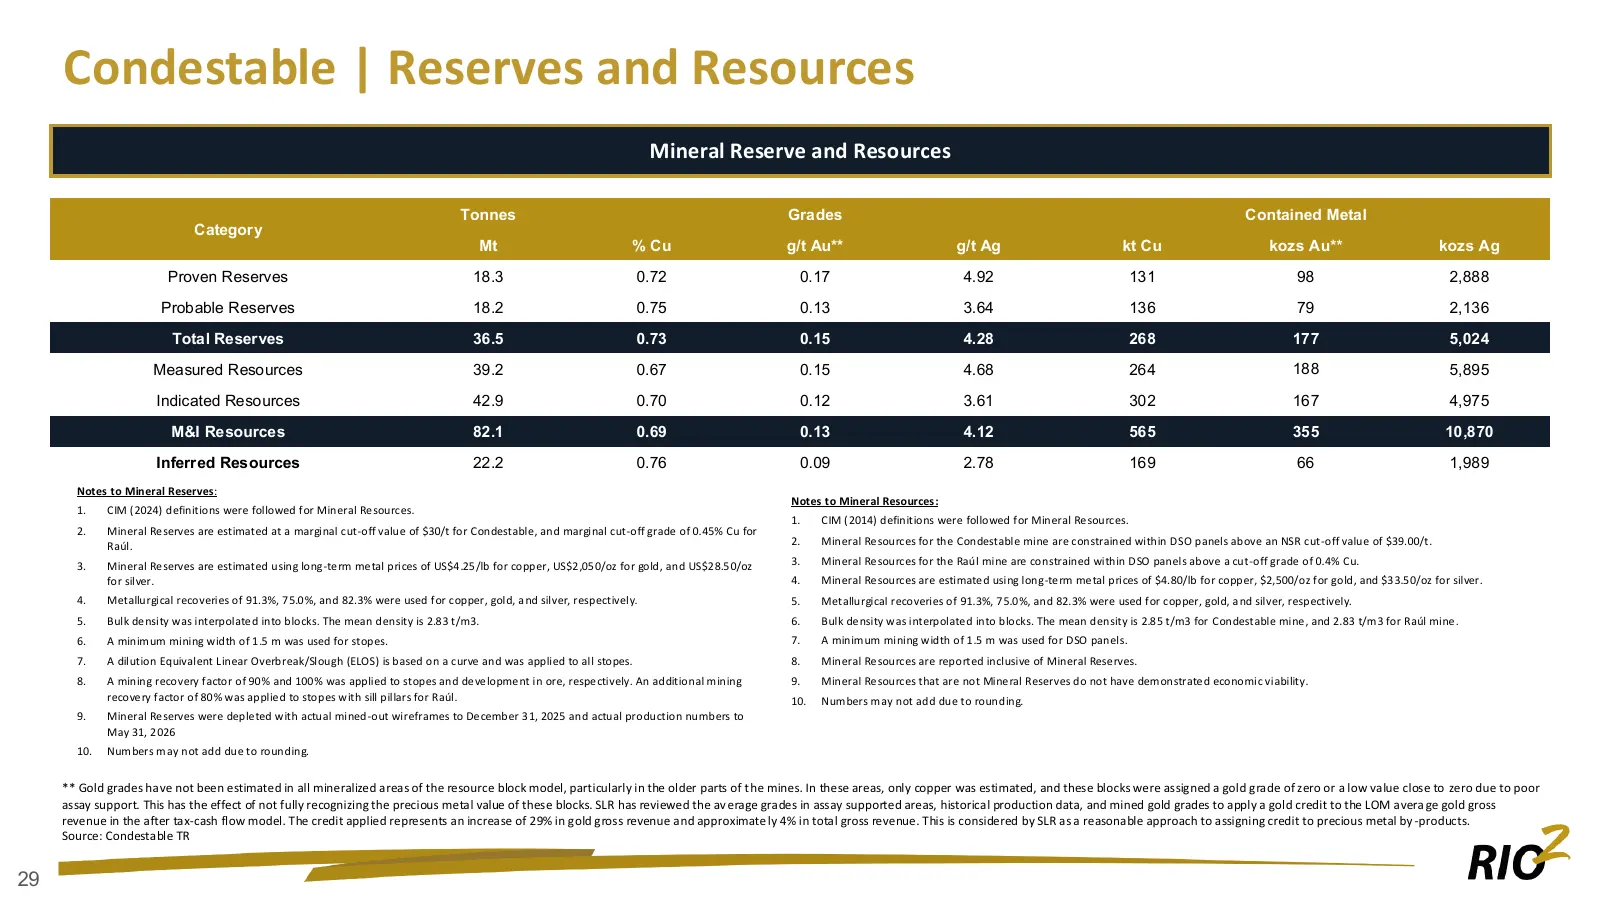
Slide 30: Condestable | Reserves and Resources
Condestable | Reserves and Resources Mineral Reserve and Resources Tonnes Grades Contained Metal Category Mt % Cu g/t Au** g/t Ag kt Cu kozs Au** kozs Ag Proven Reserves 18.3 0.72 0.17 4.92 131 98 2,888 Probable Reserves 18.2 0.75 0.13 3.64 136 79 2,136 Total Reserves 36.5 0.73 0.15 4.28 268 177 5,0
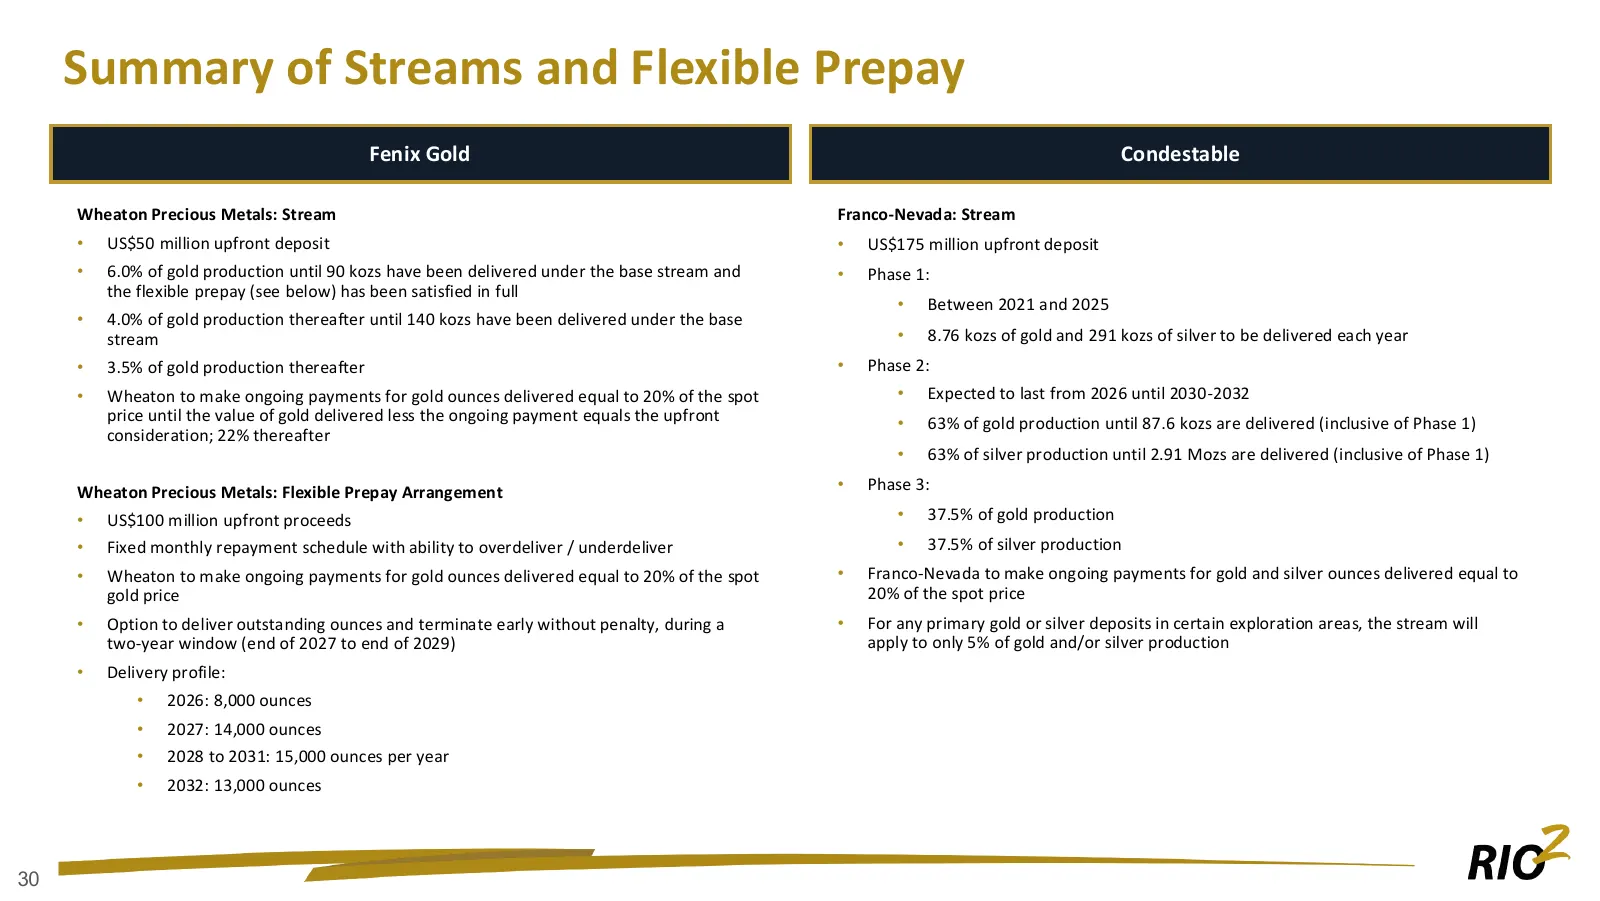
Slide 31: Summary of Streams and Flexible Prepay
Summary of Streams and Flexible Prepay Fenix Gold Condestable Wheaton Precious Metals: Stream Franco-Nevada: Stream • US$50 million upfront deposit • US$175 million upfront deposit • 6.0% of gold production until 90 kozs have been delivered under the base stream and • Phase 1: the flexible prepay (s
Source: company website