Health Net — Investor Day (February 2011)
76 slides from Health Net's investor day presentation, Feb 17, 2011

Slide 1: Health Net, Inc. 2011 Investor Day
Health Net, Inc. Health Net, Inc. 2011 Investor Day 2011 Investor Day February 17, 2011 Exhibit 99.1

Slide 2: Cautionary Statement
Cautionary Statement All statements in this presentation, other than statements of historical information provided herein, including but not limited to the guidance for future periods included herein and the assumptions and underlying such projections, may be deemed to be forward-looking statements

Slide 3: Non-GAAP Measures
Non-GAAP Measures These presentations include quarterly and full year income statement measurements that are not calculated and presented in accordance with Generally Accepted Accounting Principles. Audience participants should refer to the financial table included in the Appendix to the presentatio

Slide 4: Agenda
Agenda 8.30 a.m. – 9.00 a.m. Welcoming Remarks Angie McCabe, Vice President, Investor Relations Introduction and Strategic Overview Jay Gellert, President and Chief Executive Officer 9.00 a.m. – 10.00 a.m. Commercial Growth and Margin Expansion Steven Sell, President, Western Region Health Plan Unde

Slide 5: Health Net, Inc. 2011 Investor Day
Health Net, Inc. Health Net, Inc. 2011 Investor Day 2011 Investor Day

Slide 6: Strategic Overview
Strategic Overview Strategic Overview Jay Gellert President and Chief Executive Officer

Slide 7: Emerging Environment
Emerging Environment Emerging Environment Economy is driving change Federal and state budget pressures will affect health care Future implementation of Affordable Care Act remains to be defined Diverse book of businesses where value differentiation is key

Slide 8: Our Strategy To Date
Our Strategy To Date Our Strategy To Date Build value-based products Diverse book of businesses – Risk and fee – Medicaid, Medicare, TRICARE and commercial Deemphasize volatile segments – e.g., individual Invest in G&A efficiencies Dispose of weak assets Strengthen balance sheet

Slide 9: 2011 Key Milestones
2011 Key Milestones 2011 Key Milestones Stronger risk membership TRICARE to ASO Maintain low G&A ratio Expand commercial margins Continue to add new products Use cash for benefit of shareholders

Slide 10: Future Opportunities
Future Opportunities Future Opportunities Broadening commercial business Rebound in Medicare Medicaid expansion Department of Defense options G&A leverage Balance sheet flexibility

Slide 11: Health Net, Inc. 2011 Investor Day
Health Net, Inc. Health Net, Inc. 2011 Investor Day 2011 Investor Day

Slide 12: Commercial Growth and Margin Expansion
Commercial Growth Commercial Growth and Margin Expansion and Margin Expansion Steven Sell President, Western Region Health Plan

Slide 13: Commercial: Positioned for Growth
Commercial: Positioned for Growth Commercial: Positioned for Growth Economy is driving HMO demand Health Net has a strong and sustainable HMO market position Tailored products and networks drive growth Margin expansion opportunities

Slide 14: Economy Driving Demand
Economy Driving Demand Market research shows customers looking for: – Affordable solutions – Convenient access – Clear and simple choices Consumer-directed health plans (CDHP) show some stress – Among highest premium increases HMO value proposition: “back to the future” – Affordable premiums – Prima

Slide 15: Health Care Reform Favors Managed Care
Health Care Reform Health Care Reform Favors Managed Care Favors Managed Care PPO benefit advantages being reduced – Elimination of annual and lifetime limits in 2011 – Zero copay preventive care in 2011 – Deductible caps coming in 2014 Traditional ASO vs. risk – Risk still best value in California
Slide 16: Health Net: Strong HMO Market Share
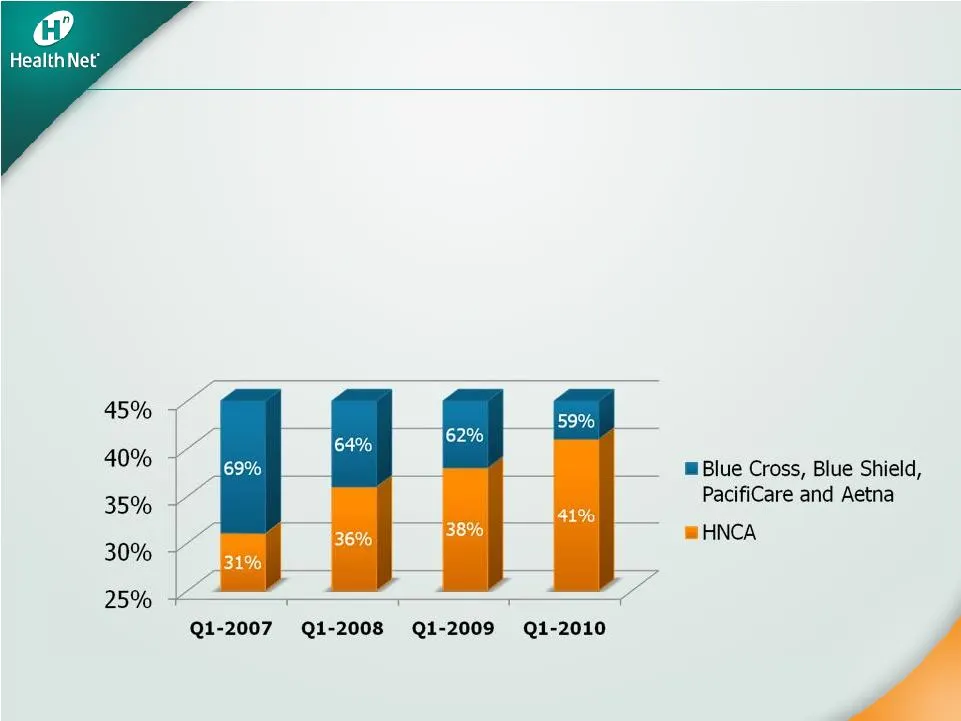
Health Net: Health Net: Strong HMO Market Share Strong HMO Market Share Dominant network HMO player in California market Steady market share growth over the last four years Small group market share increase: 31 percent to 41 percent in the past four years Source: Data from Department of Managed Heal
Slide 17: The Power of Capitation
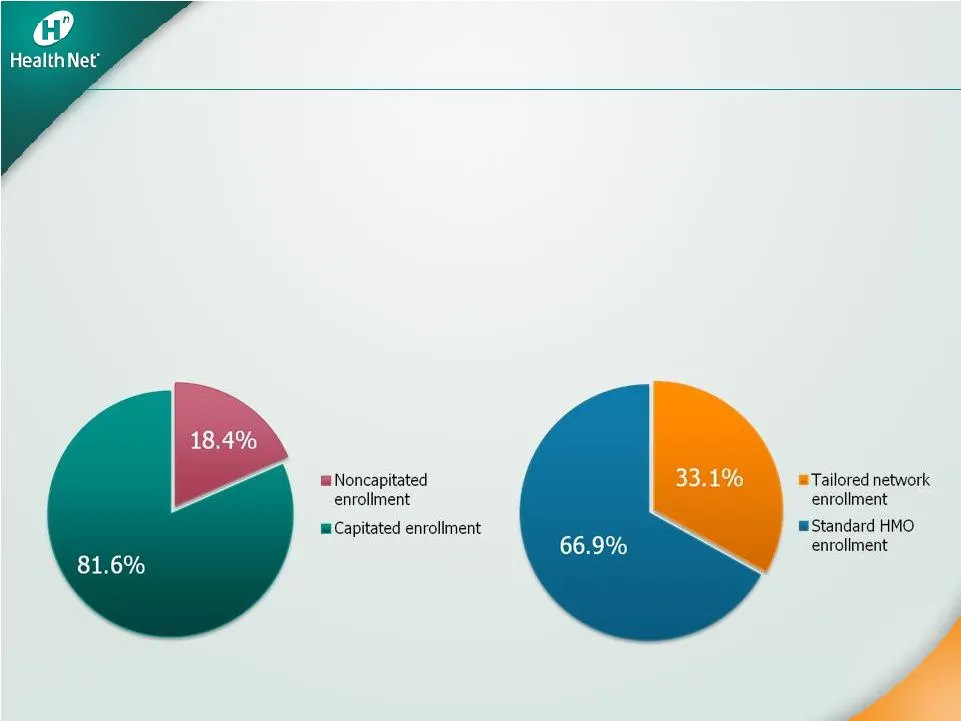
The Power of Capitation The Power of Capitation Focuses providers on cost management and commercial growth Stabilizes trends and makes them more predictable Reduces administrative costs as claims processing is delegated Source: Based on Health Net internal data as of December 31, 2010. More than 80
Slide 18: Strong and Evolving Tailored Networks
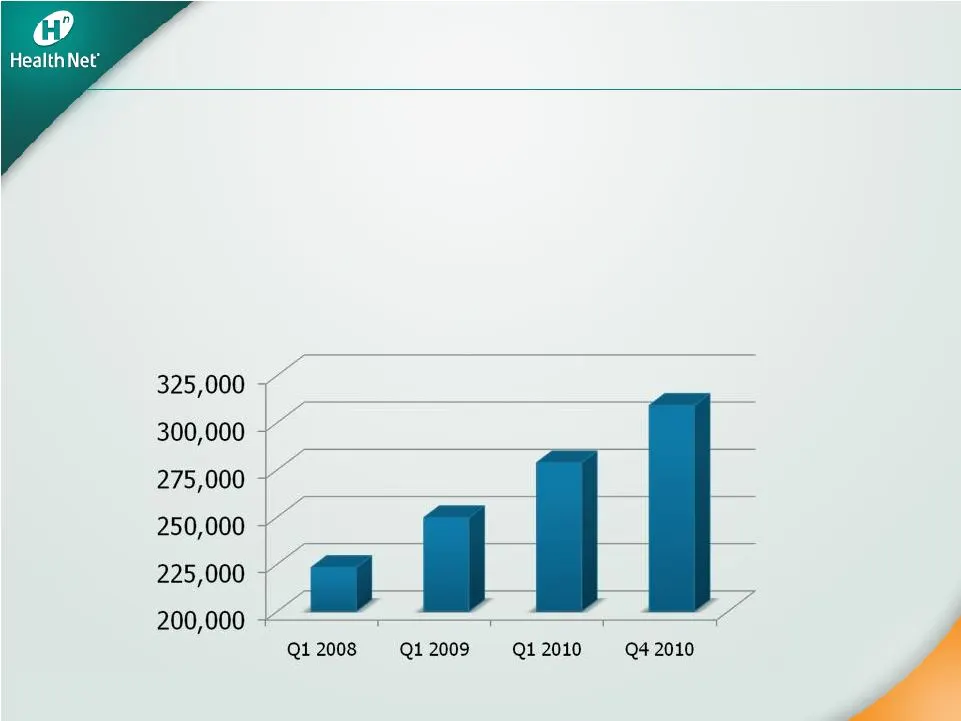
Drives volume to “high value” providers (low cost/high quality) Employer premiums up to 30 percent lower Offers comprehensive coverage Increased interest in new geographies and segments Strong and Evolving Tailored Networks Strong and Evolving Tailored Networks Source: Based on Health Net internal d

Slide 19: How Tailored Network Products Work
How Tailored Network Products Work How Tailored Network Products Work Foundation is traditional HMO capitated networks – Broad physician panel in group or IPA – Includes wide range of institutional options – Comprehensive benefits with low copays Tailored networks – Include cost-effective provider g

Slide 20: Growth with Margin Expansion
Growth with Margin Expansion Growth with Margin Expansion Strategically changing mix – Segment: small group and mid-market – Product: tailored network products – Geographic: Southern California vs. Northern California Targeted sales and improved retention Disciplined underwriting and pricing Continu

Slide 21: Well Positioned for Growth
Well Positioned for Growth Well Positioned for Growth Growing market share in California Product solutions meeting market demand – Opportunities to apply solutions to Arizona and Oregon Margin expansion driven by: – Improved product and segment mix – Consistent underwriting and pricing discipline Pr

Slide 22: Health Net, Inc. 2011 Investor Day
Health Net, Inc. Health Net, Inc. 2011 Investor Day 2011 Investor Day

Slide 23: Underwriting and Actuarial Review
Underwriting and Underwriting and Actuarial Review Actuarial Review Richard T. Hall, FSA, MAAA Chief Actuarial Officer

Slide 24: A New Commercial Environment
A New Commercial Environment A New Commercial Environment Underwriting and pricing discipline Return to HMO plans / pressure on less managed plans Regulatory pressure and individual market issues Providers seeking commercial share to offset growing cost shift 2011 pricing assumptions and outlook

Slide 25: Underwriting and Pricing Discipline
Underwriting and Pricing Discipline Underwriting and Pricing Discipline Rigorous planning process – Analyze membership – Identify best gross margin opportunities – Sensitivity analyses Targeted geographies, segments and products where we have a clear competitive advantage Enhanced sales and underwri

Slide 26: 2010 Results Affirm Strategy
2010 Results Affirm Strategy 2010 Results Affirm Strategy Targeted pricing to improve mix in large group – MCR of renewing groups in California was better than canceled groups by 100 basis points in 2010 – Implemented processes to achieve an improved retention rate From 81 percent in 2010 to 91 perc

Slide 27: Return to HMO
Return to HMO Return to HMO Demonstrable premium differential for equivalent benefits ASO vs. risk: California experience Growing out-of-pocket limits not sustainable for members and providers Health care reform and economy limit ability to shift costs to employees

Slide 28: Premium Differentials
Premium Differentials Premium Differentials Traditional HMO vs. PPO – HMO is 30 percent less – Example: Los Angeles County – HMO – $30 copay / $2,000 out-of-pocket maximum – PPO – $30 copay in-network / $500 deductible / $2,000 out-of-pocket maximum Tailored network 10 percent to 25 percent less tha

Slide 29: Regulatory Pressure and Individual Market Issues
Regulatory Pressure Regulatory Pressure and Individual Market Issues and Individual Market Issues Cautious approach to individual market Emerging regulatory environment External focus on rate increases Preparing for implementation of exchanges

Slide 30: Changing the Provider-Payor Paradigm
Changing the Provider-Payor Changing the Provider-Payor Paradigm Paradigm Market driving to integrated approach Health Net offers value to providers – People and relationships – True local presence – Business model – All segment focus – Providers seeking to retain and build commercial market share J

Slide 31: 2011 Commercial Pricing Assumptions
2011 Commercial Pricing Assumptions 2011 Commercial Pricing Assumptions 2010 physician and institutional utilization moderated from 2009 2011 pricing assumes upward pressure on physician and institutional utilization 2011 unit cost trends expected to be lower than 2010 trends 2011 pharmacy cost incr

Slide 32: Beyond 2011
Beyond 2011 Beyond 2011 Sectoral – not cyclical – changes in market – Driven by health care reform and economy Trends remain moderate by historical standards – Growing impact of tailored network plans and focus on affordability Steadily growing influence of capitated systems Institutional providers

Slide 33: Health Net, Inc. 2011 Investor Day
Health Net, Inc. Health Net, Inc. 2011 Investor Day 2011 Investor Day

Slide 34: Medicare and State Programs
Medicare and Medicare and State Programs State Programs Scott Kelly Chief Government Programs Officer

Slide 35: Solid Medicare Outlook
Solid Medicare Outlook Solid Medicare Outlook Balance Medicare Advantage revenue, benefits/premiums and costs to ensure: – Stable margins – Continued competitive product offerings Continued focus on capitated networks Enhance strategic provider partnerships in coordination with commercial business P

Slide 36: Medicare Advantage: 2011
Medicare Advantage: 2011 Medicare Advantage: 2011 Building from solid 2010 January enrollment results better than initial expectations Total revenues PMPM expected to be up 1.5 percent – Member premiums up 3.4 percent PMPM Expect MCR to be flat year-over-year – Health care cost stability – Benefit c

Slide 37: Medicare Part D
Medicare Part D Medicare Part D 2010 margins maintained by favorable prescription drug performance and unit costs 2011 enrollment expected to decline 14 percent to 16 percent compared with 2010 Guiding to breakeven 2011 performance due to effects of CMS sanctions

Slide 38: CMS Sanctions
CMS Sanctions CMS Sanctions What Happened? CMS identified issues in HNT’s Part D program What’s Next? Corrective actions are in process Plan to review corrective actions with CMS in second quarter of 2011 Broader compliance initiatives in place to ensure appropriate administration of government busi

Slide 39: Medicare Advantage Provider Networks
Medicare Advantage Medicare Advantage Provider Networks Provider Networks Nearly 40 percent of health care costs capitated – Over 50 percent in California market – More than 135 provider groups in 21 counties Mostly percent of premium contracts Collaboration with organized health systems to reduce t
Slide 40: State Health Programs
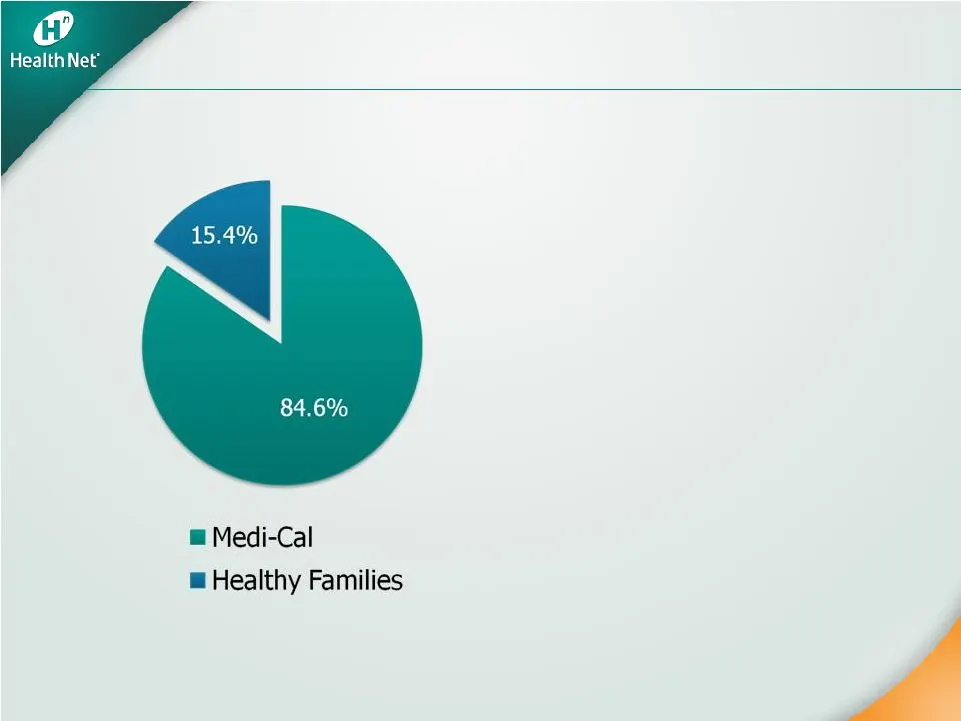
State Health Programs State Health Programs Potential for growth – Health care reform – Seniors and Persons with Disabilities (SPD) – New counties Total State Program Revenues

Slide 41: Medi-Cal Position
Medi-Cal Position Medi-Cal Position 753,700 members at year-end 2010, an increase of 7 percent year-over-year Second largest Medi-Cal plan in California – 58 percent of membership in Los Angeles County – 34 percent in Central Valley Market share stable at over 24 percent Remain the highest ranking M

Slide 42: 2011 Medi-Cal Outlook
2011 Medi-Cal Outlook 2011 Medi-Cal Outlook Expect 6 percent membership growth Maintain stable financial performance – Rate environment understood Key strategic position for health care reform SPD program offers potential significant growth opportunity

Slide 43: Healthy Families
Healthy Families Healthy Families 145,800 members at year-end 2010, a decrease of 4.7 percent year-over-year – Market share remains flat as general statewide enrollment declines 2011 program outlook – Expect 6 percent membership decline – Margin stable

Slide 44: State Programs Provider Networks
State Programs Provider Networks State Programs Provider Networks 80 percent of State Programs enrollment linked to capitated provider groups Over 45 percent of health care costs under capitated arrangements – 75 percent of physician costs – 27 percent of hospital costs Noncapitated hospital rates o

Slide 45: Stable Government Programs
Stable Government Programs Stable Government Programs Margin stability in long-standing Medicare Advantage network-model markets – Predictable cost structure – Solid membership retention Medi-Cal: prepare for growth of SPDs and health care reform expansion 2011 focus on strong operational and regula

Slide 46: Health Net, Inc. 2011 Investor Day
Health Net, Inc. Health Net, Inc. 2011 Investor Day 2011 Investor Day

Slide 47: Federal Services
Federal Services Federal Services Steve Tough President, Government Programs

Slide 48: Government Contracts Highlights
Government Contracts Highlights Government Contracts Highlights New TRICARE contract begins April 1, 2011 ASO, fee-based, five-year contract Improves company balance between risk and fee-based businesses Opens door to new opportunities as Department of Defense (DoD) faces budget pressures

Slide 49: 2011: A Transition Year
2011: A Transition Year 2011: A Transition Year Contract financial structure changes from cost plus risk sharing to cost plus incentive – New contract accounted for as ASO 2011 includes ¼ year of current contract, ¾ year of new contract, plus current contract phase-out revenues and expenses – Expect

Slide 50: Current Contract to New Contract: Incentive and Risk Changes
Current Contract to New Contract: Current Contract to New Contract: Incentive and Risk Changes Incentive and Risk Changes Fixed-dollar underwriting fee Administrative efficiencies under a fixed administrative budget Underwriting incentives – network discount, network usage and national cost trend –

Slide 51: Growth Opportunities
Growth Opportunities Growth Opportunities Military & Family Life Consultant (MFLC) program success – Apply MFLC model to other federal customers DoD efforts under way – budget challenges create potential opportunities – Extend services to National Guard and Reservists – Managed solutions for TRICARE

Slide 52: Key Takeaways
Key Takeaways Key Takeaways Well positioned to continue leadership role with DoD and VA Transition to new contract on track Wide range of behavioral health opportunities – Build on MFLC success Continue to expand VA and state administrative footprint

Slide 53: Health Net, Inc. 2011 Investor Day
Health Net, Inc. Health Net, Inc. 2011 Investor Day 2011 Investor Day

Slide 54: Operations Review
Operations Review Operations Review Jay Gellert President and Chief Executive Officer Juanell Hefner Chief Customer Services Officer

Slide 55: Operations Strategy and Stranded Costs
Operations Strategy Operations Strategy and Stranded Costs and Stranded Costs Announced a three-year effort to restructure operations in 2007 Built around these goals: Optimize outsourcing Eliminate operations and system inefficiencies Enhance scalability Improve competitive platform Reduce “strande

Slide 56: G&A Expense Reductions
G&A Expense Reductions G&A Expense Reductions Invested $145 million after tax in G&A expense reduction activities over the last three years (i.e., severance, asset impairment, etc.) Without these investments, Western Region G&A would have been higher by approximately $100 million pretax in 2010 Achi

Slide 57: Northeast Wind-down and Overhead Reductions Operations Strategy
Northeast Wind-down and Overhead Reductions Operations Strategy Northeast Wind-down and Overhead Reductions Operations Strategy Infrastructure outsourcing Application outsourcing Business process outsourcing Management restructuring Operational efficiencies Vendor management Wind-down of NE operatio

Slide 58: Improved Operations
Improved Operations Improved Operations Operations are better integrated – More consistent procedures – Greater flexibility to use staff and resources efficiently – Improved performance management Have realized benefits from business process outsourcing of noncustomer facing functions – Scalability

Slide 59: Improved Operational Performance
Improved Operational Performance Improved Operational Performance Claims – Accuracy – Claims turnaround time Call center performance – First call resolution Enrollment and eligibility performance – Enrollment accuracy – Enrollment timeliness – Eligibility accuracy All key operational metrics have im

Slide 60: Positioned for the Future
Positioned for the Future Improved speed to market – Outsourcing allows for rapid capacity ramp-up to support growth – Can leverage vendor expertise and resources to create new and expanded operational capabilities Technology infrastructure now positioned to support future performance and growth – N

Slide 61: Key Takeaways
Key Takeaways Key Takeaways Further G&A reductions will contribute to margin improvement Operations positioned to support long-term growth G&A positioned to offset minimum MCR requirements Eliminating stranded costs associated with Northeast business and new TRICARE contract Improved operations enha

Slide 62: Health Net, Inc. 2011 Investor Day
Health Net, Inc. Health Net, Inc. 2011 Investor Day 2011 Investor Day

Slide 63: Financial Review
Financial Review Financial Review Joseph C. Capezza Chief Financial Officer

Slide 64: 2010 Results vs. Original Guidance
Original Guidance Actual Year-end membership Commercial: -1% to -2% Medicaid: +5% to +6% Medicare Advantage: -2% to -3% PDP: +1% to +2% -4.4% +5.1% -2.2% -7.2% Consolidated revenues $13 billion to $13.5 billion $13.6 billion Commercial premium yields (a) ~ 8.3% to 8.8% (Western Region 2009: ~$316 PM

Slide 65: A Solid 2010 Sets Stage for 2011
A Solid 2010 Sets Stage for 2011 A Solid 2010 Sets Stage for 2011 Strong year: met or exceeded key commitments Commercial margin expansion – 2010 gross margin increased 13 percent to $47 per member per month (PMPM) Commercial enrollment stabilized in the second half of 2010 Strong cash: operating ca
Slide 66: Stronger Balance Sheet
2010 2009 Stronger Balance Sheet Stronger Balance Sheet Current ratio 1.70 1.68 Adjusted days claims payable * 57.2 54.2 Debt-to-total capital ratio 19% 26% Tangible net equity per share $11 $10 Risk-based capital >400% >400% *See Appendix for a reconciliation of this metric to the comparable GAAP f

Slide 67: Northeast Transaction Net Cash
Northeast Transaction Net Cash Northeast Transaction Net Cash $377 million $63 million $80 million to $100 million Total $520 million to $540 million Original Guidance $490 million to $610 million

Slide 68: 2011 Earnings Guidance
2011 Earnings Guidance 2011 Earnings Guidance Year-end membership (a) Medicaid: +6% to +7% Medicare Advantage (d) : -15% to -17% Total Western Region Operations medical membership: +2% to +3% PDP (d) : -14% to -16% Consolidated revenues (b)(d) $12.0 to $12.5 billion Commercial premium yields (a) ~ 7

Slide 69: 2011 Cash at Parent
2011 Cash at Parent 2011 Cash at Parent Beginning cash (12/31/10) $204 Sources of cash Net cash flow from subsidiaries NE proceeds $225 - $235 $80 - $100 Uses of cash Share repurchases through 1/31/11 Other corporate uses $34 ~$85 Ending cash * (12/31/11) ~$390 - $420 *Excludes the impact of any fut

Slide 70: HNT: On Track
HNT: On Track HNT: On Track Continued commercial gross margin expansion Commercial membership growth Seamless transition to new TRICARE contract Continued strong cash flow performance – Opportunities for further capital deployment

Slide 71: Appendix
Appendix Appendix

Slide 72: Disclosures Regarding Non-GAAP Financial Information
Disclosures Regarding Disclosures Regarding Non-GAAP Financial Information Non-GAAP Financial Information Q4 2010 Q3 2010 Q4 2009 FY 2010 FY 2009 (1)Reserve for Claims and Other Settlements $942.0 $904.4 $951.7 $942.0 $951.7 Less: Reserve for Claims and Other Settlements for Divested Businesses - -

Slide 73: Health Net, Inc. 2011 Investor Day
Health Net, Inc. Health Net, Inc. 2011 Investor Day 2011 Investor Day

Slide 74: Closing Remarks
Closing Remarks Closing Remarks Jay Gellert President and Chief Executive Officer

Slide 75: HNT: Building Shareholder Value
HNT: Building Shareholder Value HNT: Building Shareholder Value Strategic response to changing environment Diverse book of stable businesses Opportunities for growth and further gross margin and G&A improvements Financial flexibility

Slide 76: Health Net, Inc. 2011 Investor Day
Health Net, Inc. Health Net, Inc. 2011 Investor Day 2011 Investor Day
Source: SEC EDGAR · 8-K filed Feb 17, 2011
More decks from Health Net Inc
 Q2 2015 Earnings Presentation25 slides · Sep 23, 2015
 SPAC Merger (July 2015)18 slides · Jul 15, 2015
 SPAC Merger (July 2015)18 slides · Jul 14, 2015
 Merger or Acquisition (July 2015)13 slides · Jul 2, 2015
 Investor Day (February 2012)74 slides · Feb 16, 2012
 30th Annual J.P. Morgan Healthcare Conference (January 2012)13 slides · Jan 9, 2012