X Financial · NYSE:XYF
X Financial — Q2 2023 Earnings Presentation
22 slides from X Financial's earnings presentation, Aug 29, 2023
Slide 1: X Financial 2023 Q2 Earnings Results Presentation
X Financial(NYSE: XYF) 2023 Q2 Earnings Results Presentation
Slide 2: Disclaimer
Disclaimer • This presentation has been prepared by X Financial (the “Company”) solely for information purpose and has not been independently verified. No representations, warranties or undertakings, express or implied, are made by the Company or any of its affiliates, advisers, or representatives o
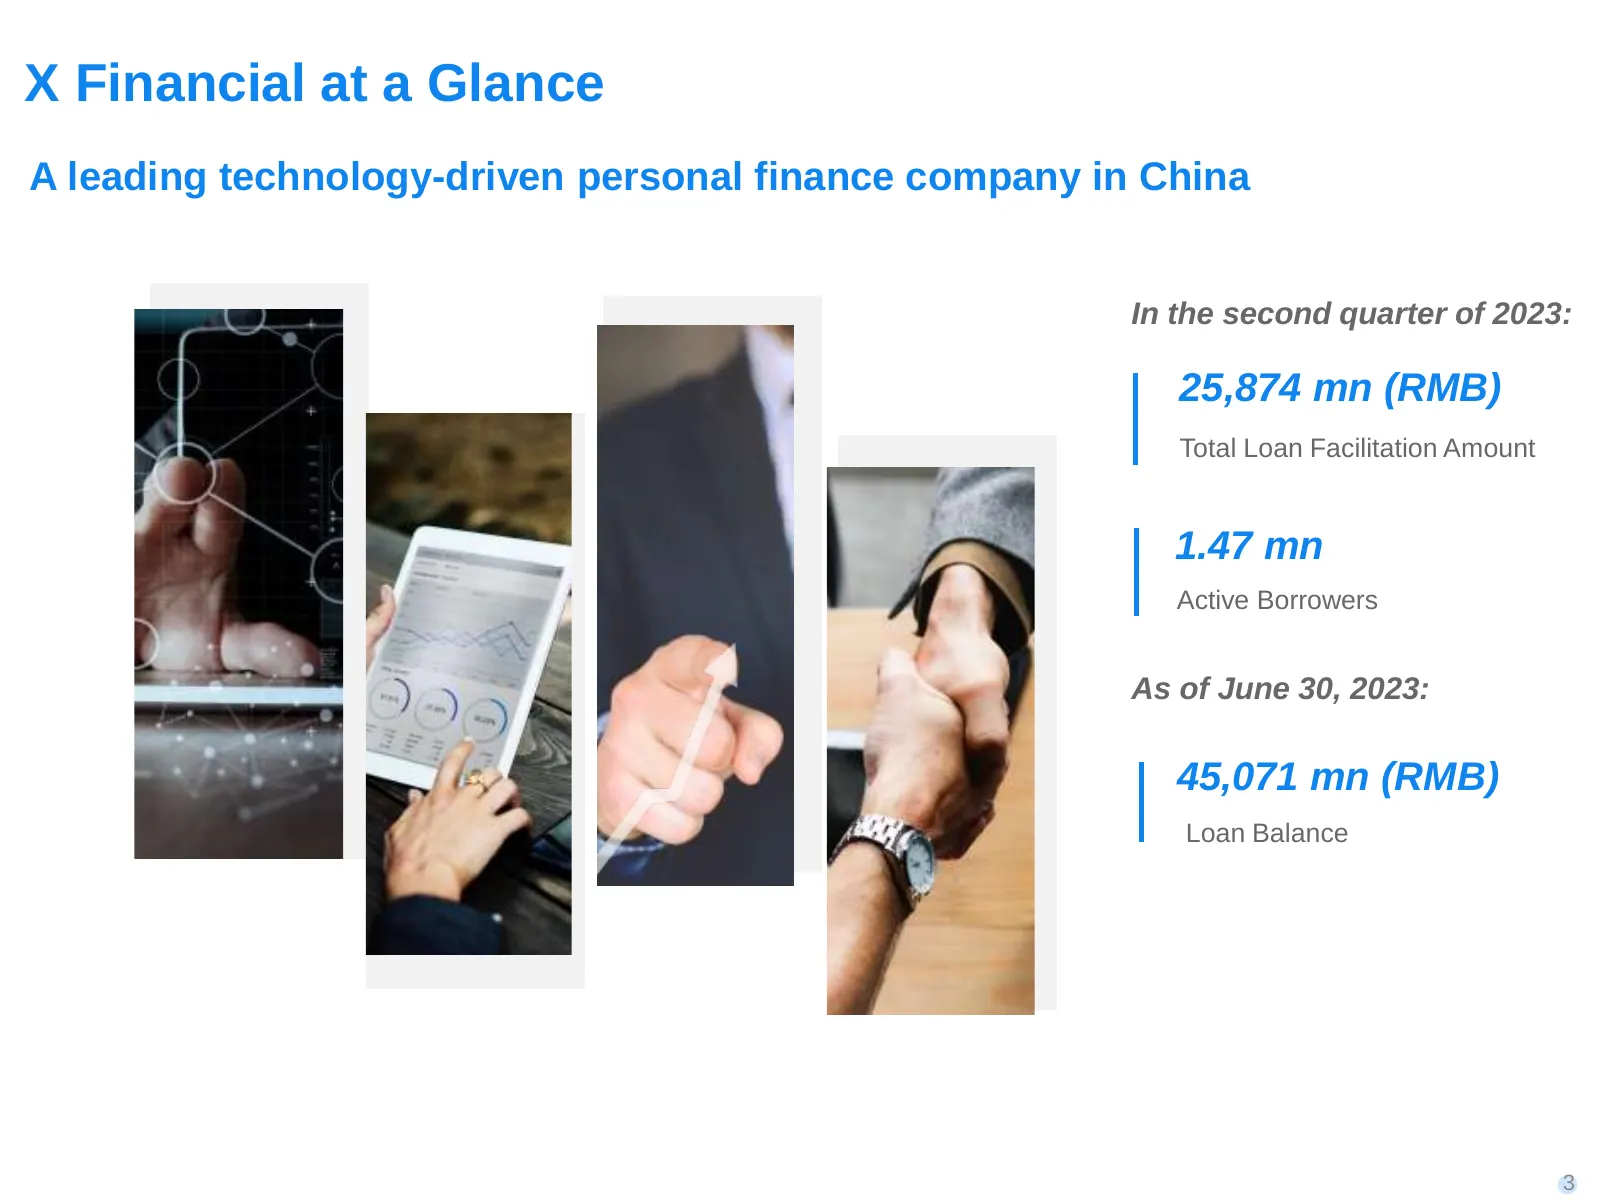
Slide 3: X Financial at a Glance
X Financial at a Glance A leading technology-driven personal finance company in China In the second quarter of 2023: 25,874 mn (RMB) Total Loan Facilitation Amount 1.47 mn Active Borrowers As of June 30, 2023: 45,071 mn (RMB) Loan Balance Underserved Prime Borrowers Diversified Investor & Customer B
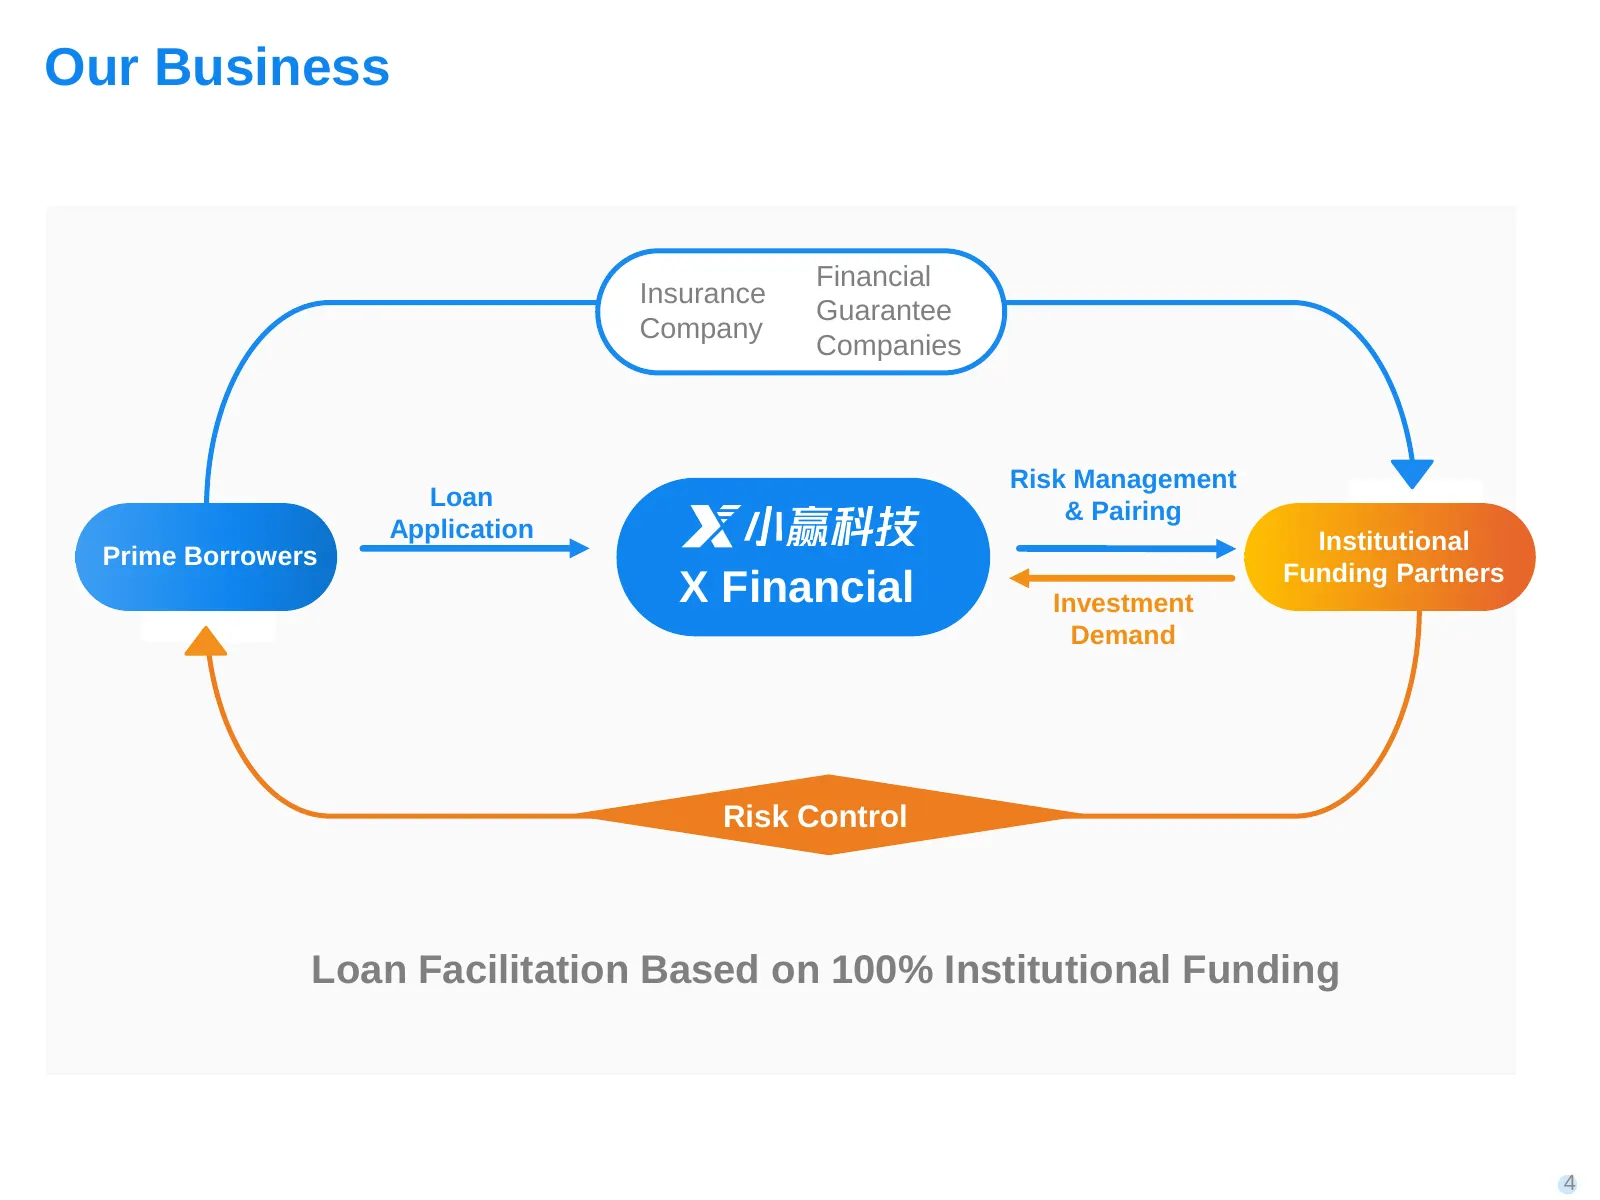
Slide 4: Our Business
Our Business Financial Insurance Guarantee Company Companies Risk Management Loan & Pairing Application Institutional Prime Borrowers Funding Partners X Financial Investment Demand Risk Control Loan Facilitation Based on 100% Institutional Funding 4
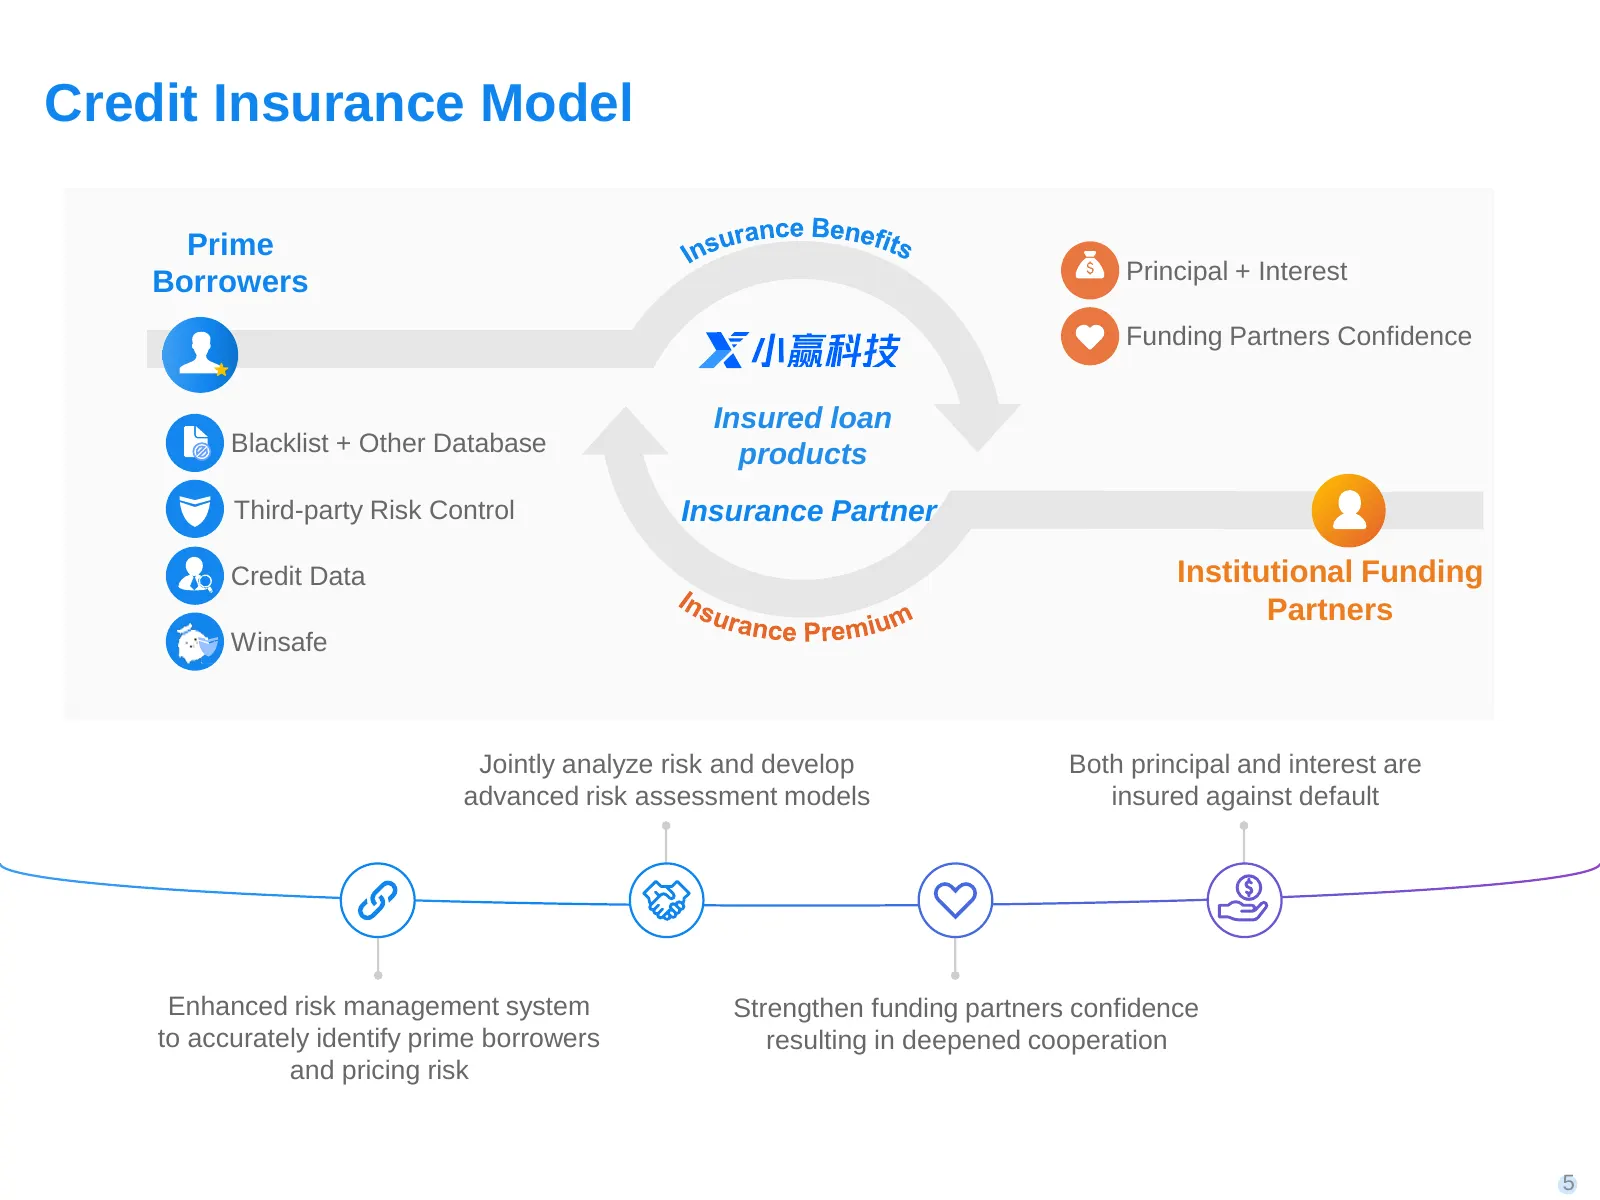
Slide 5: Credit Insurance Model
Credit Insurance Model Prime urance Benefits Ins Borrowers Principal + Interest Funding Partners Confidence Insured loan Blacklist + Other Database products Third-party Risk Control Insurance Partner Credit Data Institutional Funding In s u ra n Partners Winsafe ce Pre m i u m Jointly analyze risk a
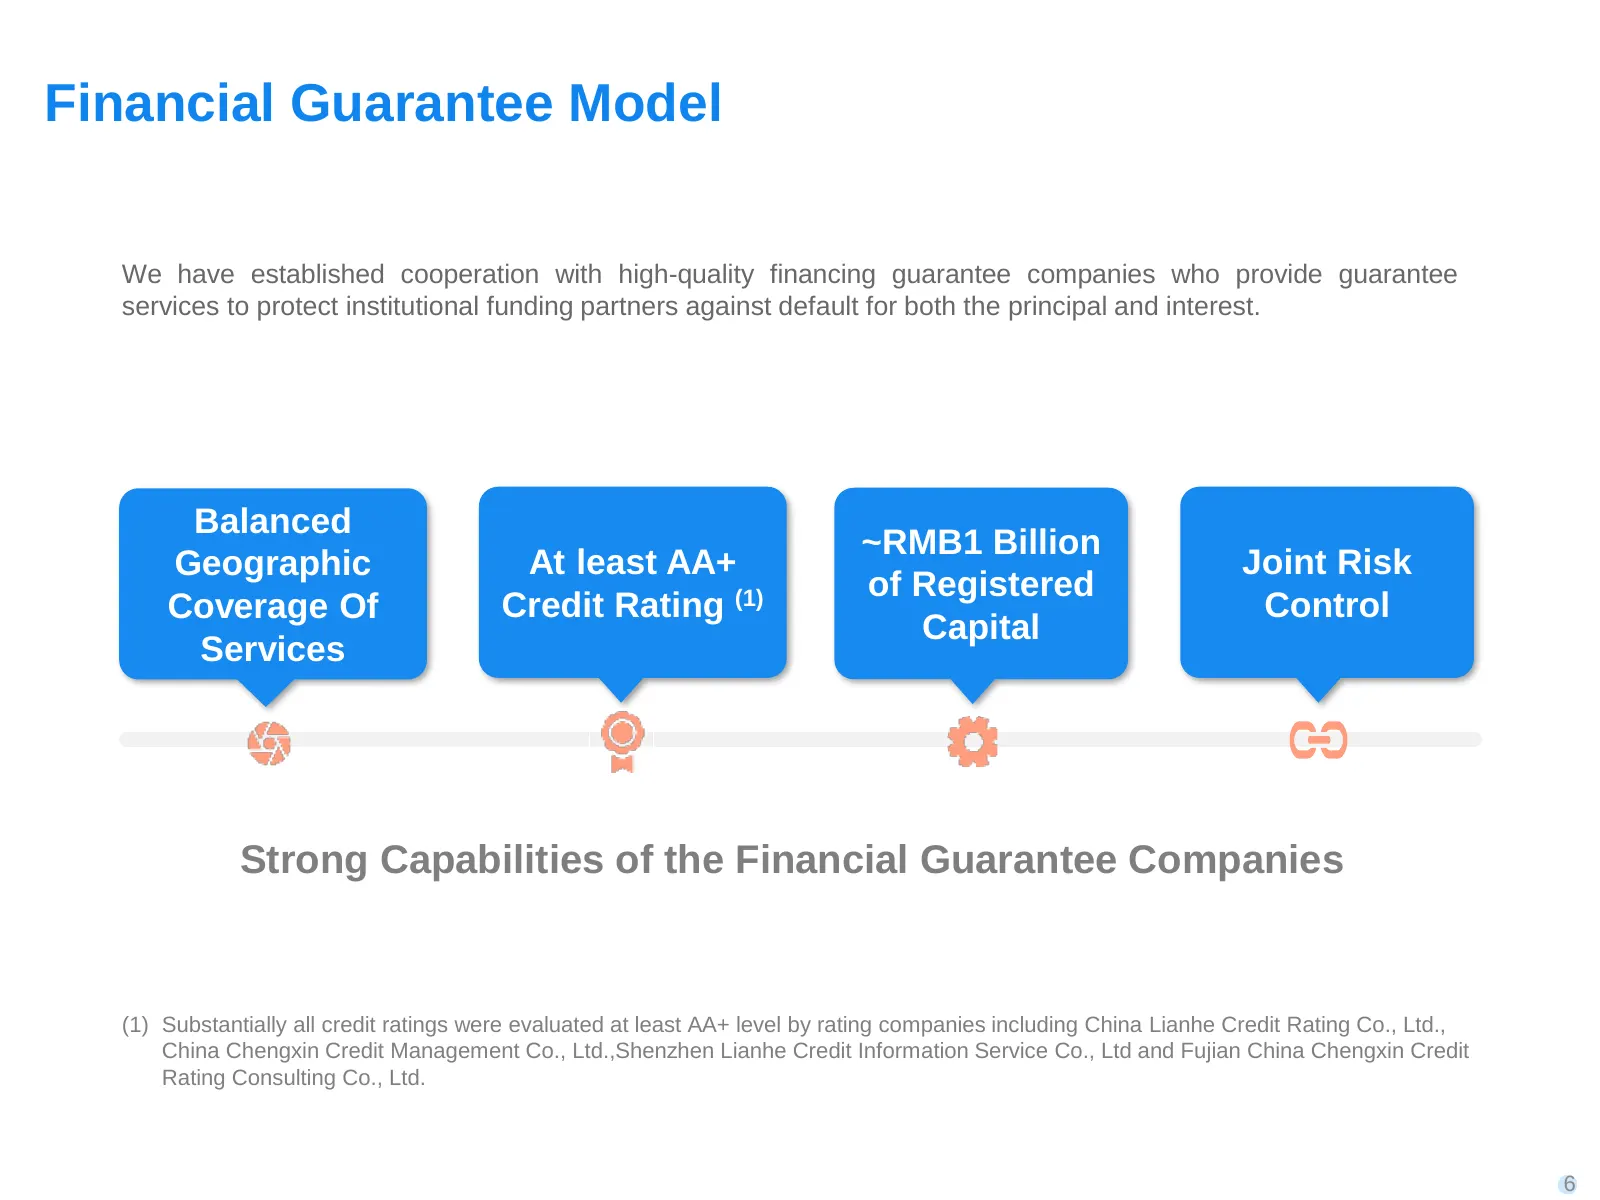
Slide 6: Financial Guarantee Model
Financial Guarantee Model We have established cooperation with high-quality financing guarantee companies who provide guarantee services to protect institutional funding partners against default for both the principal and interest. Balanced ~RMB1 Billion Geographic At least AA+ Joint Risk of Registe
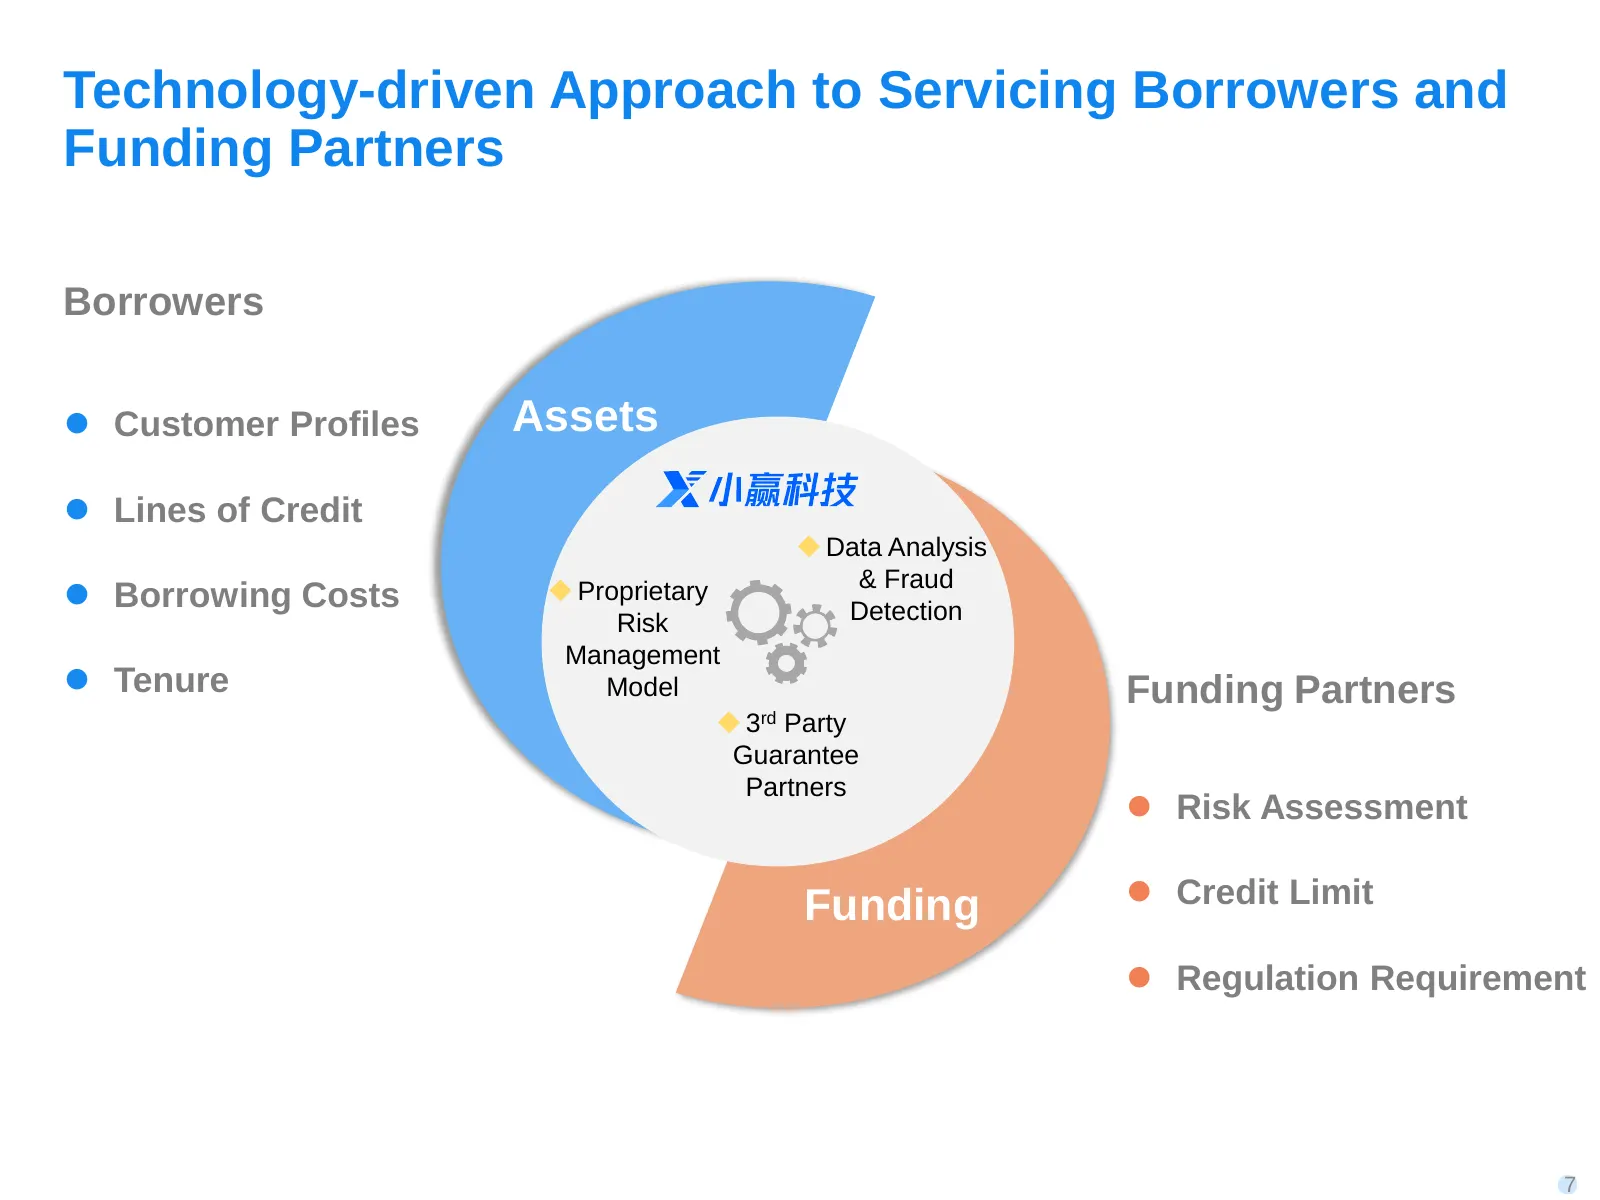
Slide 7: Technology-driven Approach to Servicing Borrowers and Funding Partners
Technology-driven Approach to Servicing Borrowers and Funding Partners Borrowers ⚫ Customer Profiles Assets ⚫ Lines of Credit ◆ Data Analysis & Fraud ⚫ Borrowing Costs ◆ Proprietary Detection Risk Management ⚫ Tenure Model Funding Partners ◆ 3rd Party Guarantee Partners ⚫ Risk Assessment Funding ⚫ C
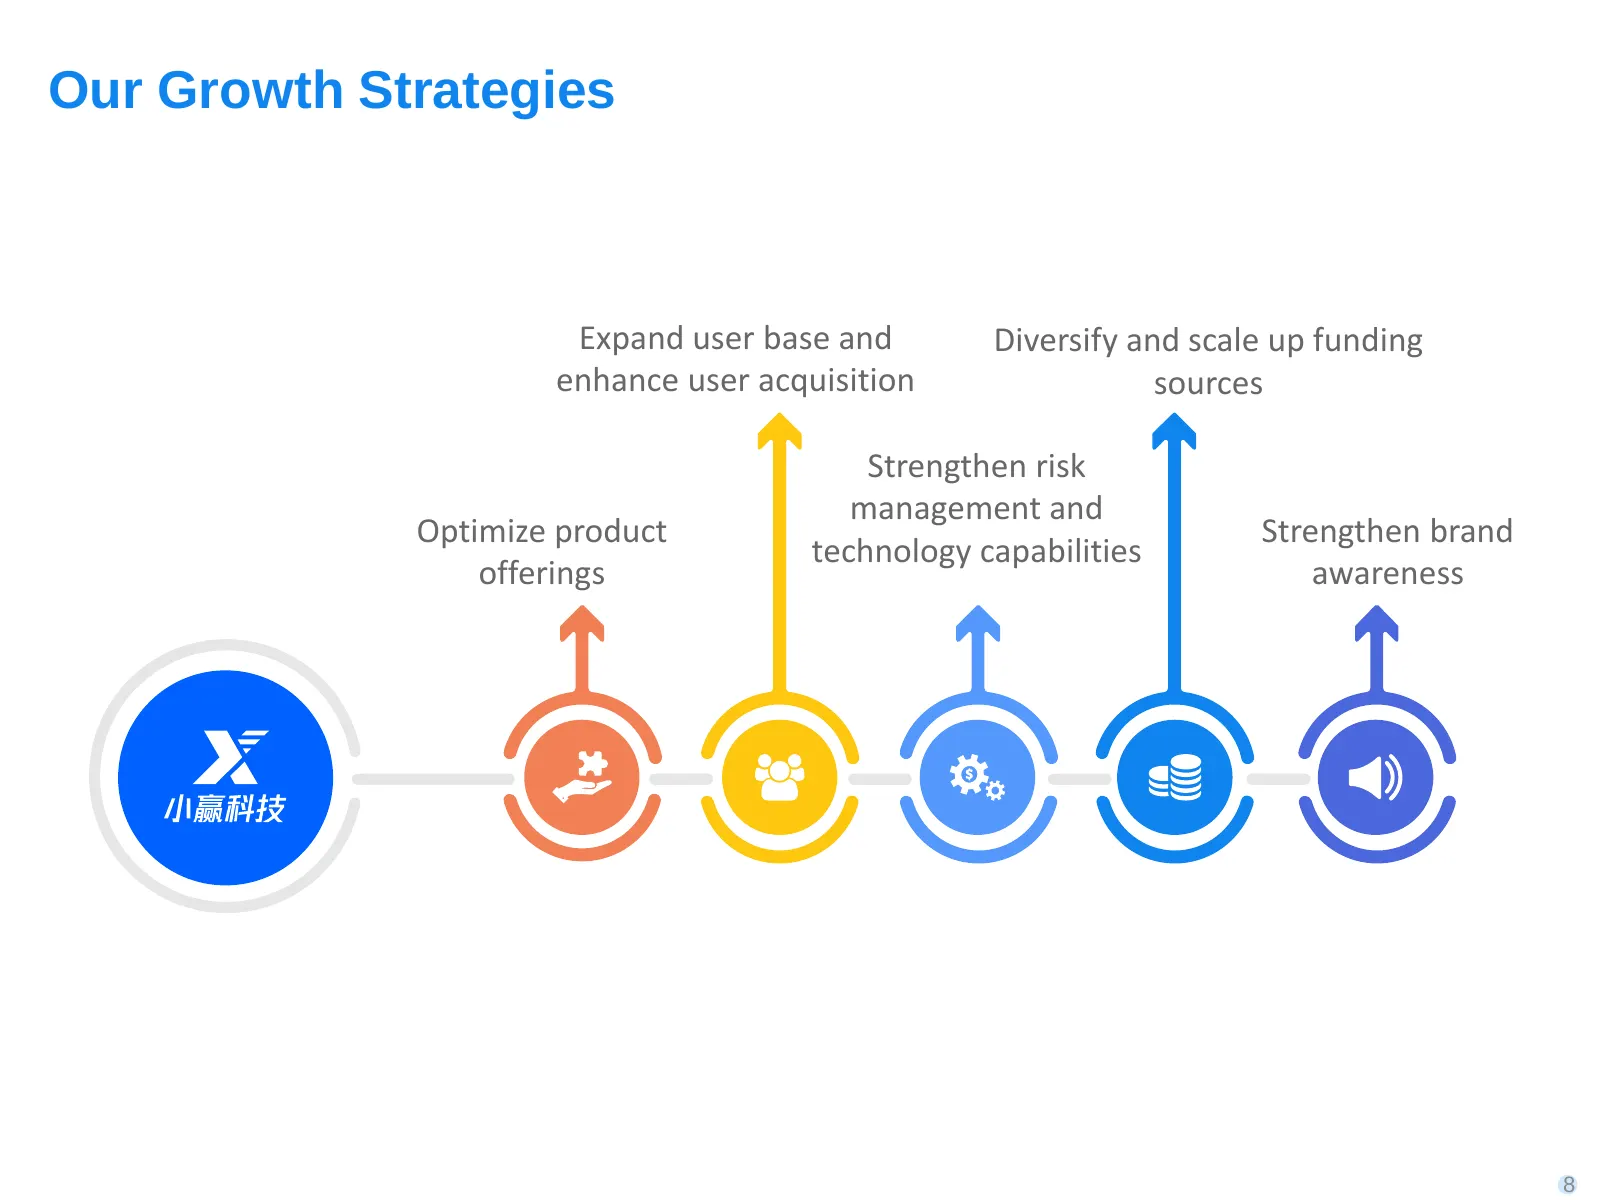
Slide 8: Our Growth Strategies
Our Growth Strategies Expand user base and Diversify and scale up funding enhance user acquisition sources Strengthen risk management and Optimize product Strengthen brand technology capabilities offerings awareness 8
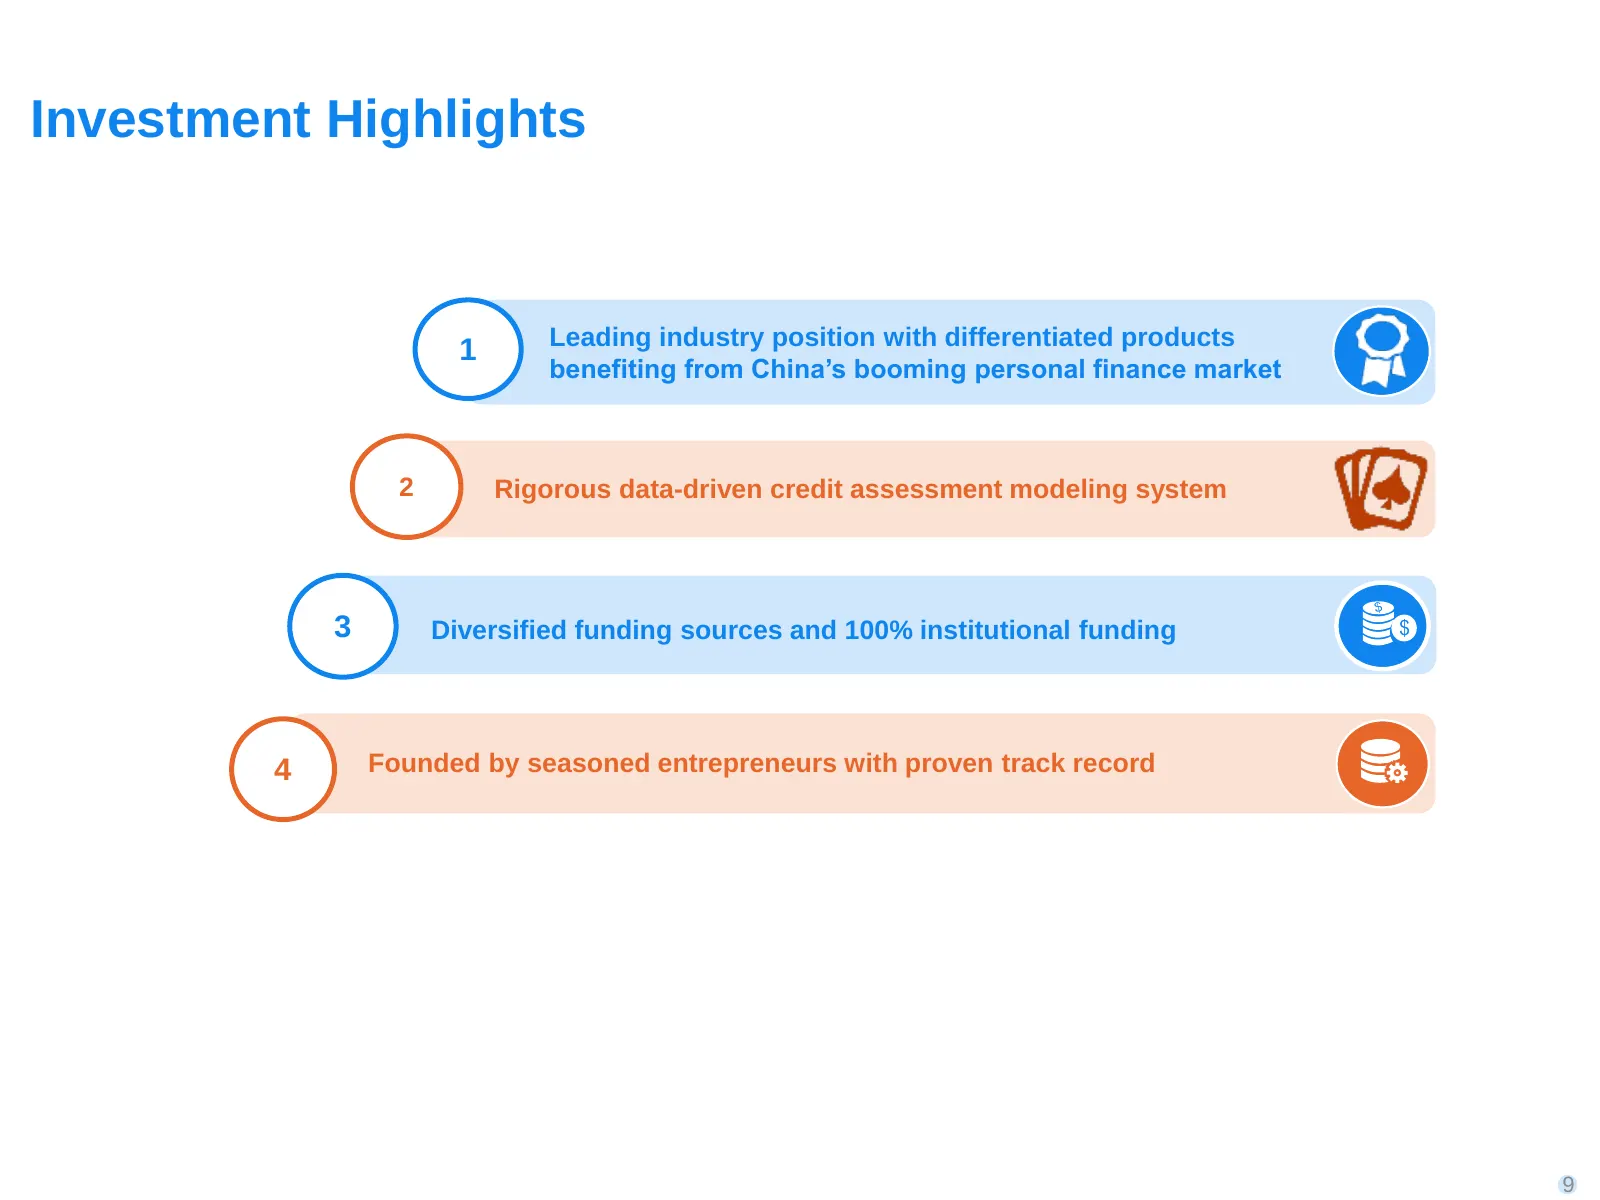
Slide 9: Investment Highlights
Investment Highlights Leading industry position with differentiated products 1 benefiting from China’s booming personal finance market 2 Rigorous data-driven credit assessment modeling system 3 Diversified funding sources and 100% institutional funding 4 Founded by seasoned entrepreneurs with proven
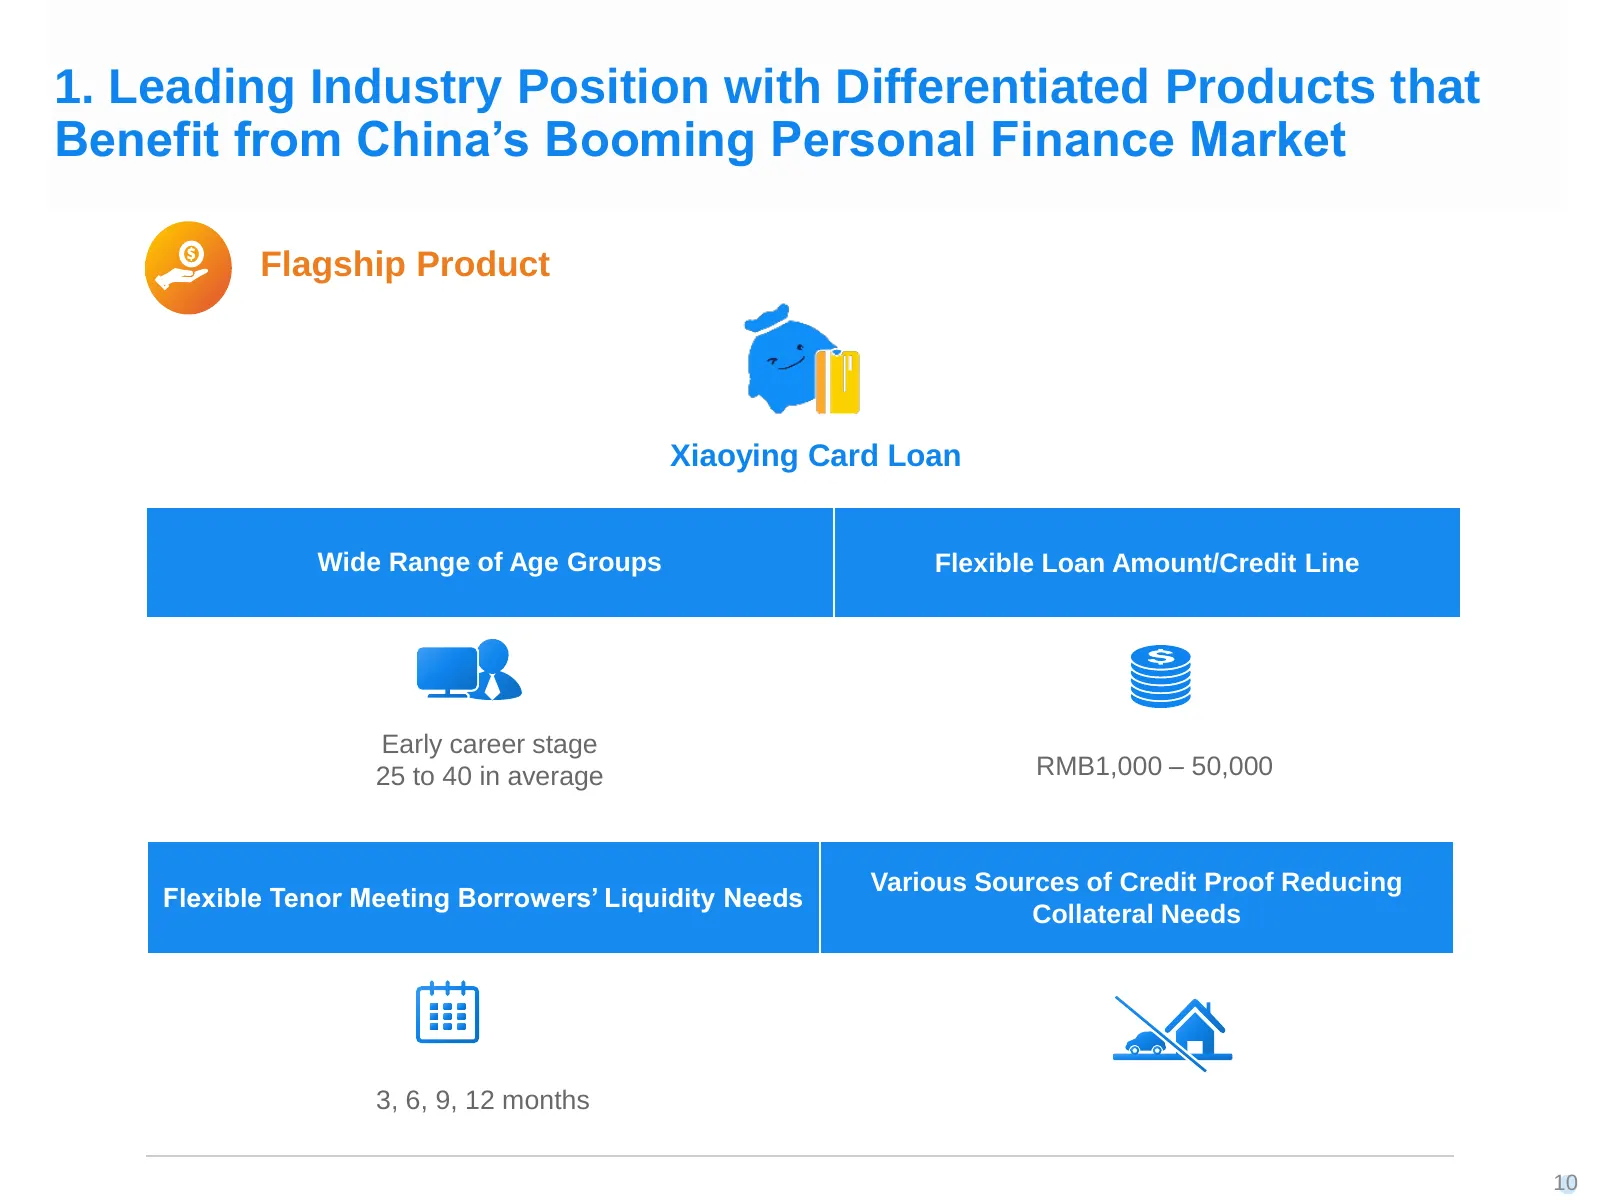
Slide 10: Benefit from China's Booming Personal Finance Market
1. Leading Industry Position with Differentiated Products that Benefit from China’s Booming Personal Finance Market Flagship Product Xiaoying Card Loan Wide Range of Age Groups Flexible Loan Amount/Credit Line Early career stage 25 to 40 in average RMB1,000 – 50,000 Various Sources of Credit Proof R
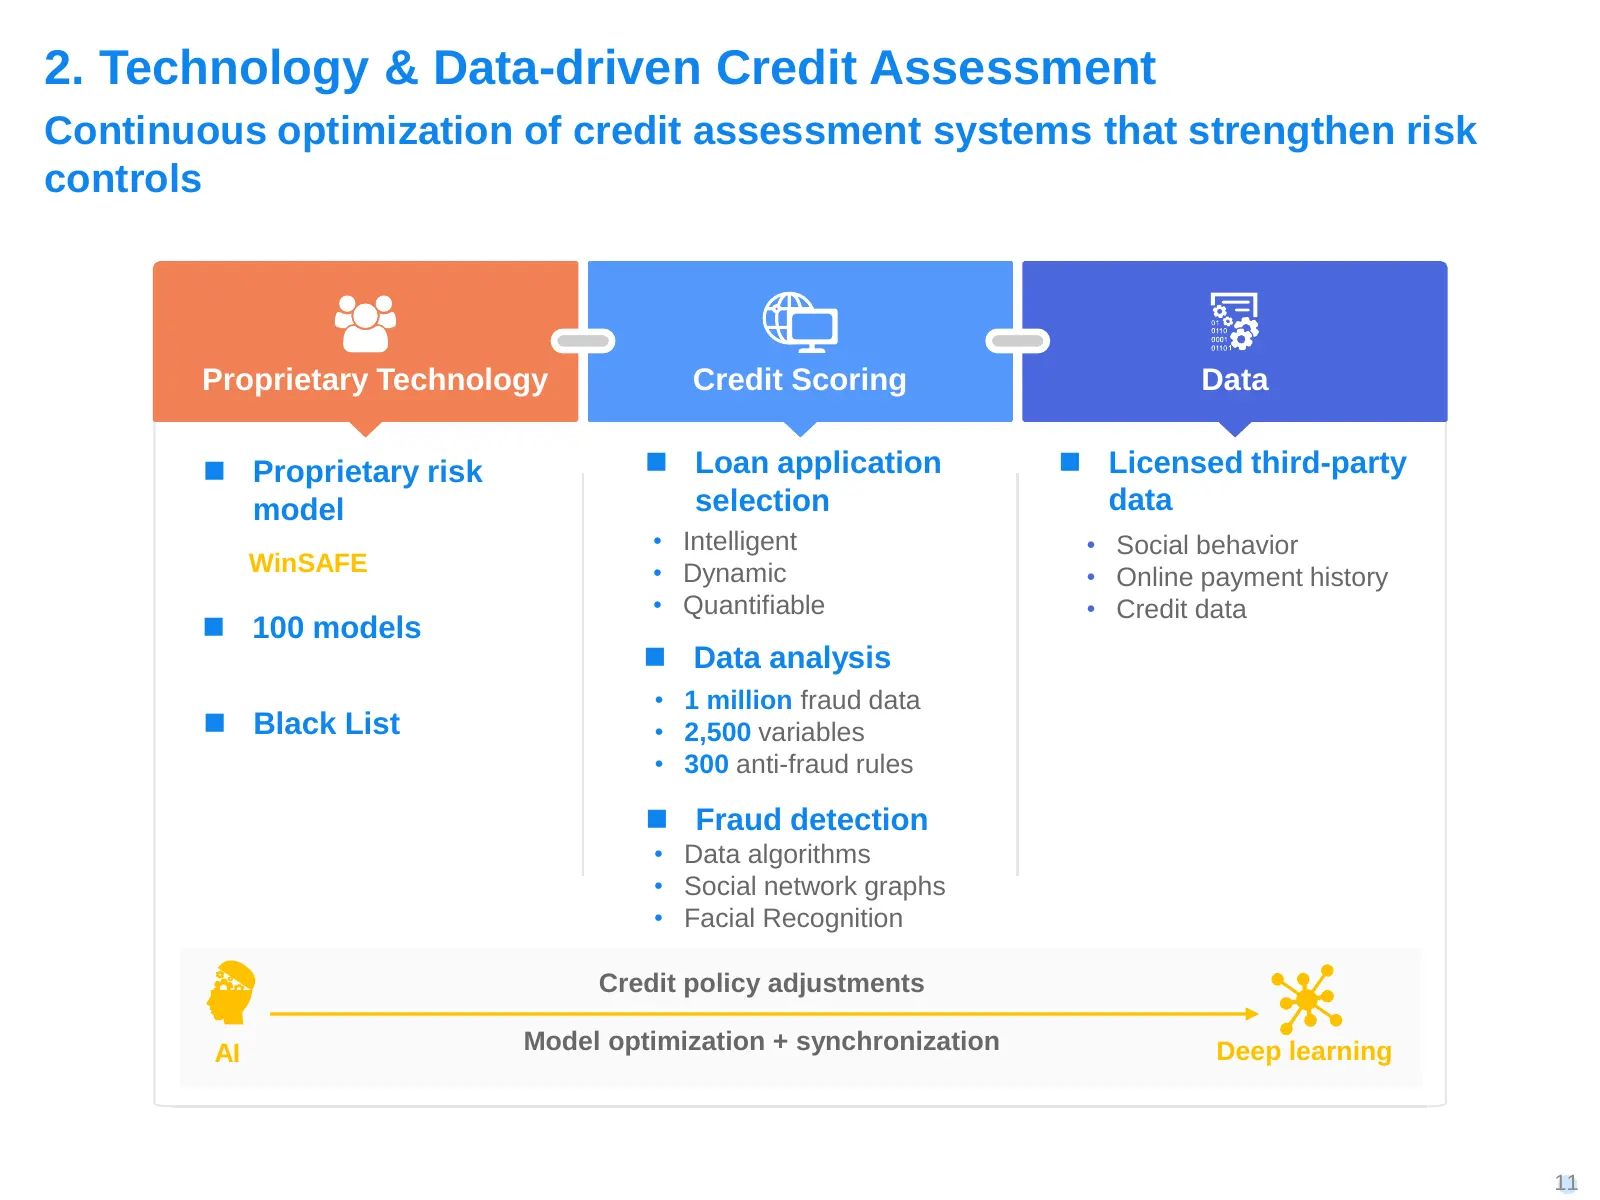
Slide 11: Technology & Data-driven Credit Assessment
2. Technology & Data-driven Credit Assessment Continuous optimization of credit assessment systems that strengthen risk controls Proprietary Technology Credit Scoring Data ◼ Proprietary risk ◼ Loan application ◼ Licensed third-party model selection data • Intelligent • Social behavior WinSAFE • Dyna
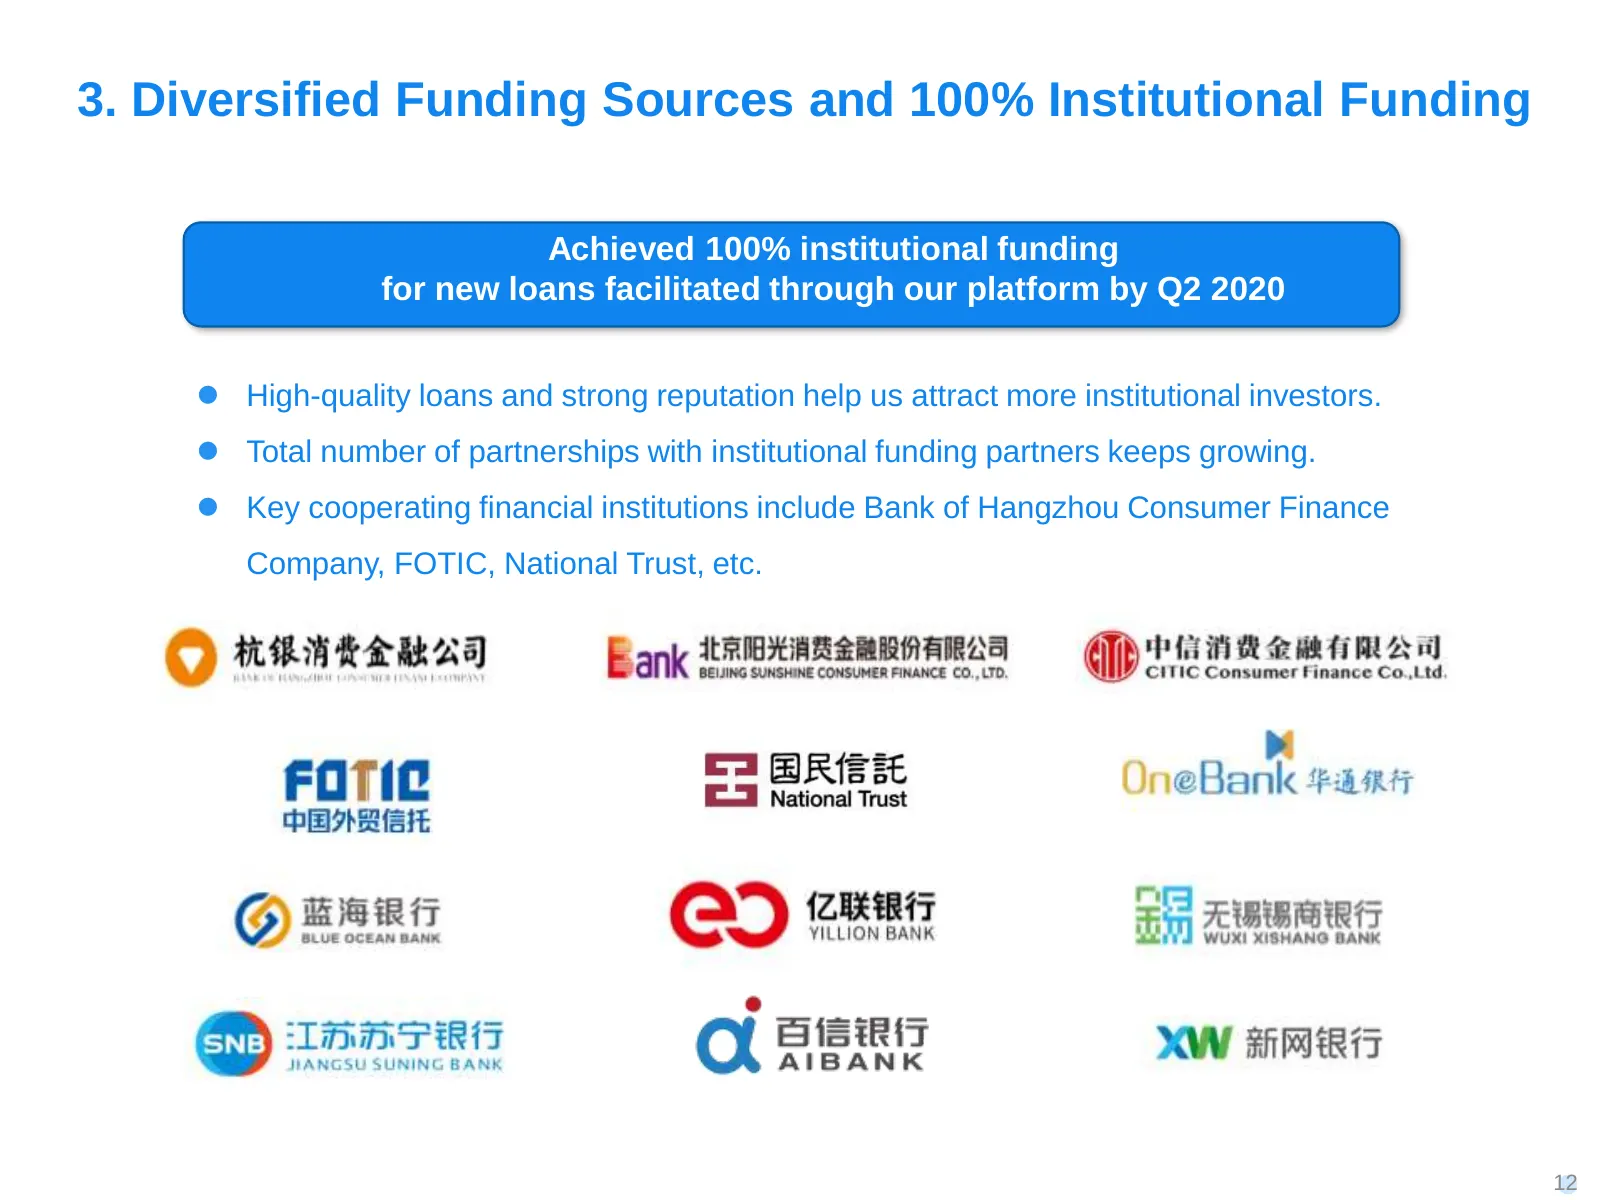
Slide 12: Diversified Funding Sources and 100% Institutional Funding
3. Diversified Funding Sources and 100% Institutional Funding Achieved 100% institutional funding for new loans facilitated through our platform by Q2 2020 ⚫ High-quality loans and strong reputation help us attract more institutional investors. ⚫ Total number of partnerships with institutional fundi
Slide 13: Seasoned Management Team
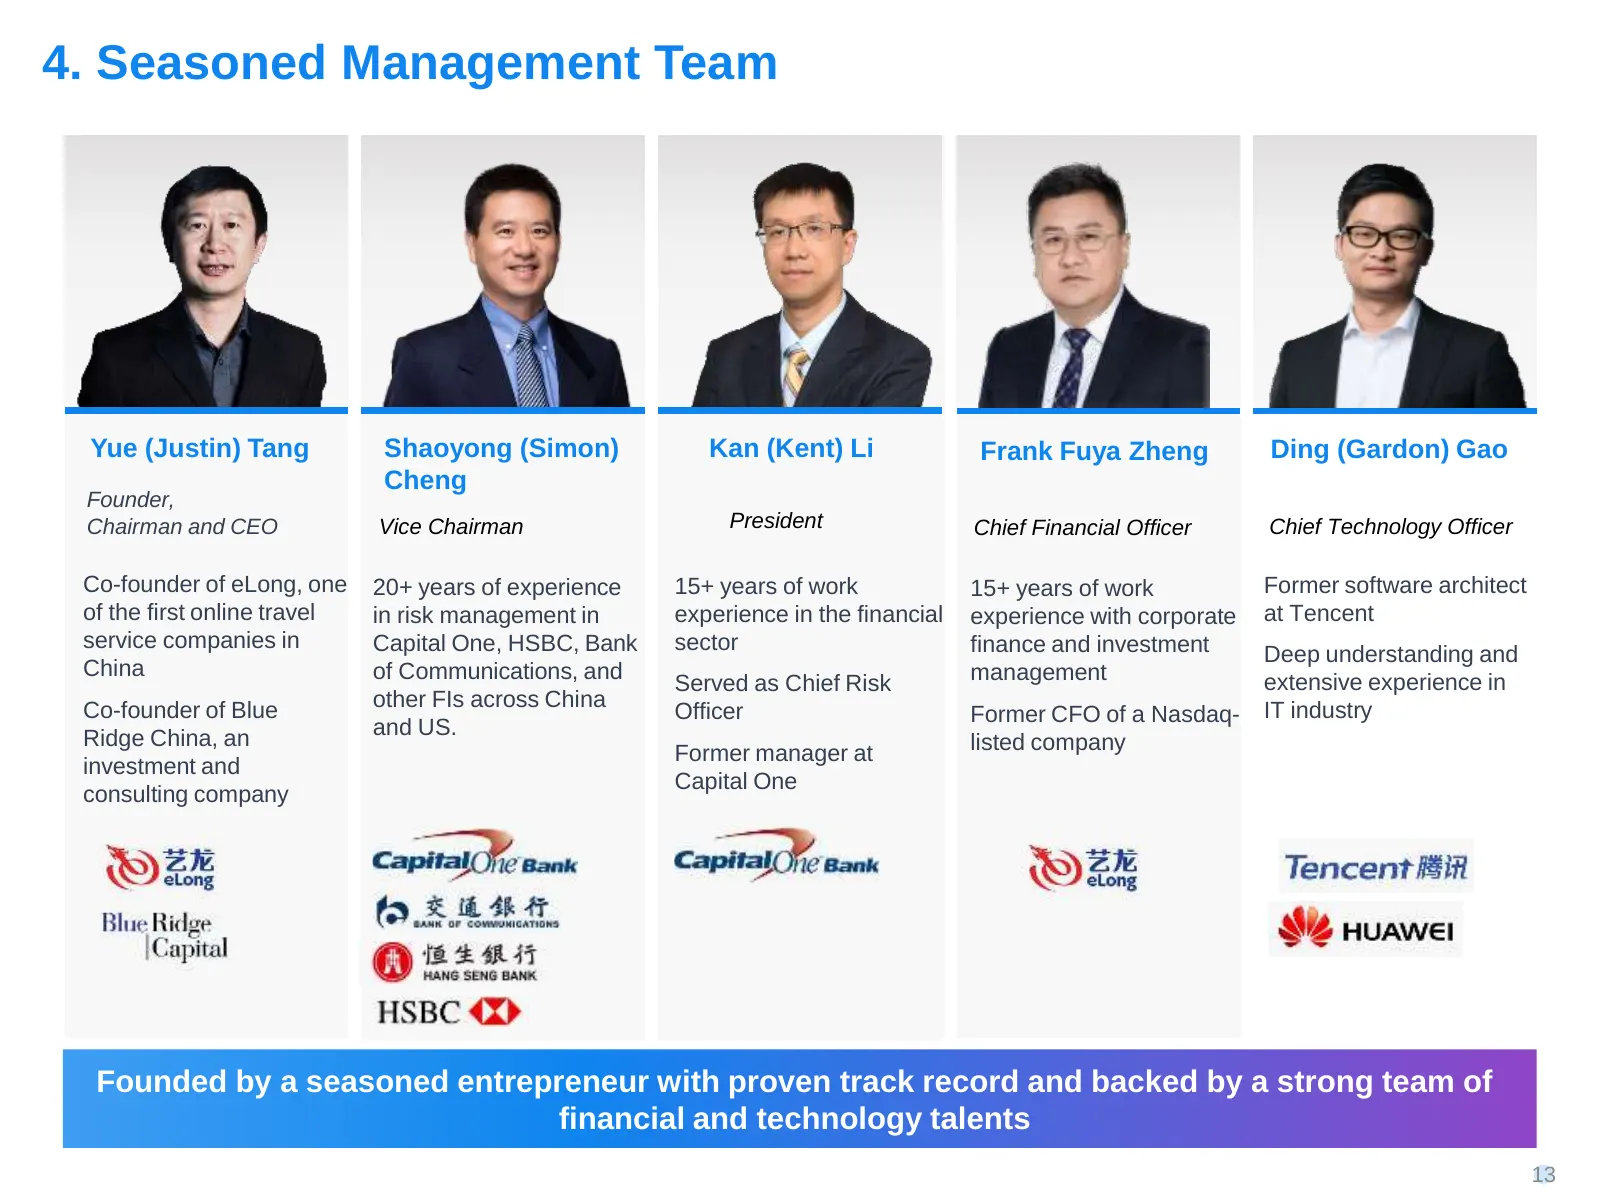
4. Seasoned Management Team Yue (Justin) Tang Shaoyong (Simon) Kan (Kent) Li Frank Fuya Zheng Ding (Gardon) Gao Cheng Founder, Chairman and CEO Vice Chairman President Chief Financial Officer Chief Technology Officer Co-founder of eLong, one 20+ years of experience 15+ years of work 15+ years of wor
Slide 14: Performance of Loan Balance and Loan Facilitation
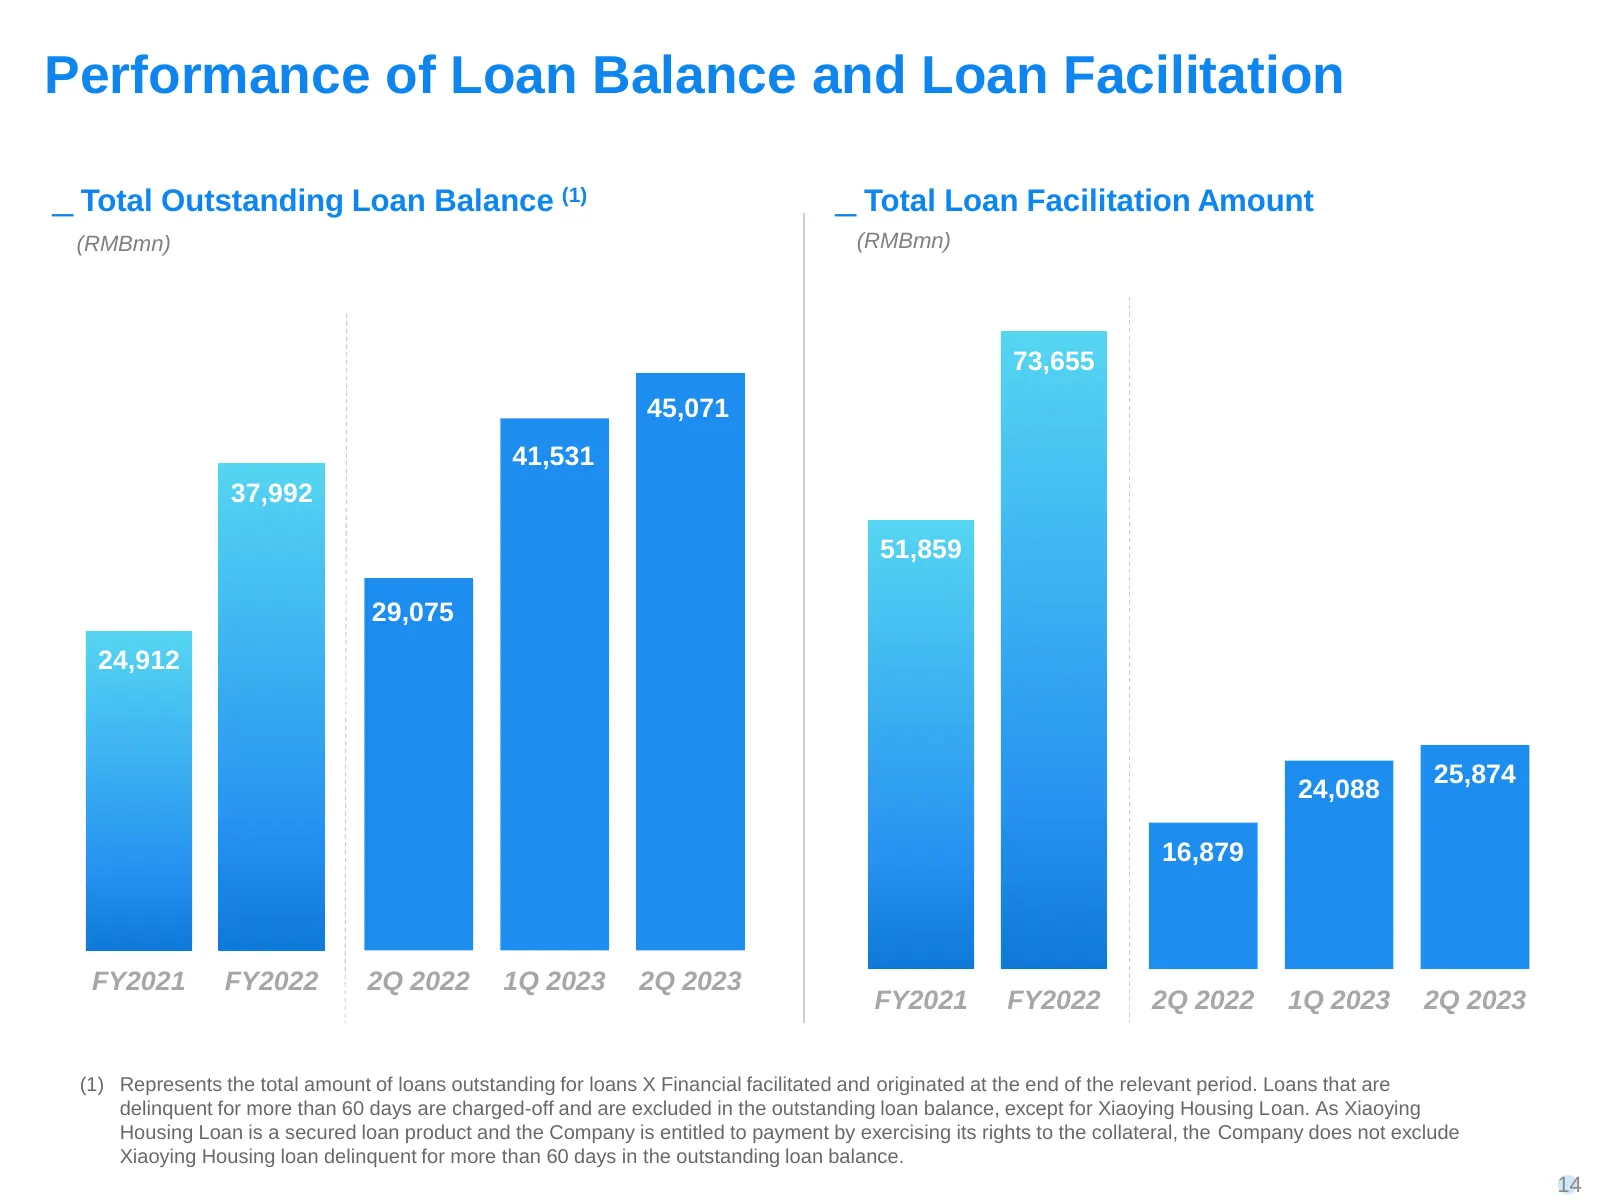
Performance of Loan Balance and Loan Facilitation ͟ Total Outstanding Loan Balance (1) ͟ Total Loan Facilitation Amount (RMBmn) (RMBmn) 73,655 45,071 41,531 37,992 51,859 29,075 24,912 25,874 24,088 16,879 FY2021 FY2022 2Q 2022 1Q 2023 2Q 2023 FY2021 FY2022 2Q 2022 1Q 2023 2Q 2023 (1) Represents the
Slide 15: Revenue and Non-GAAP Adj. Net Income Growth
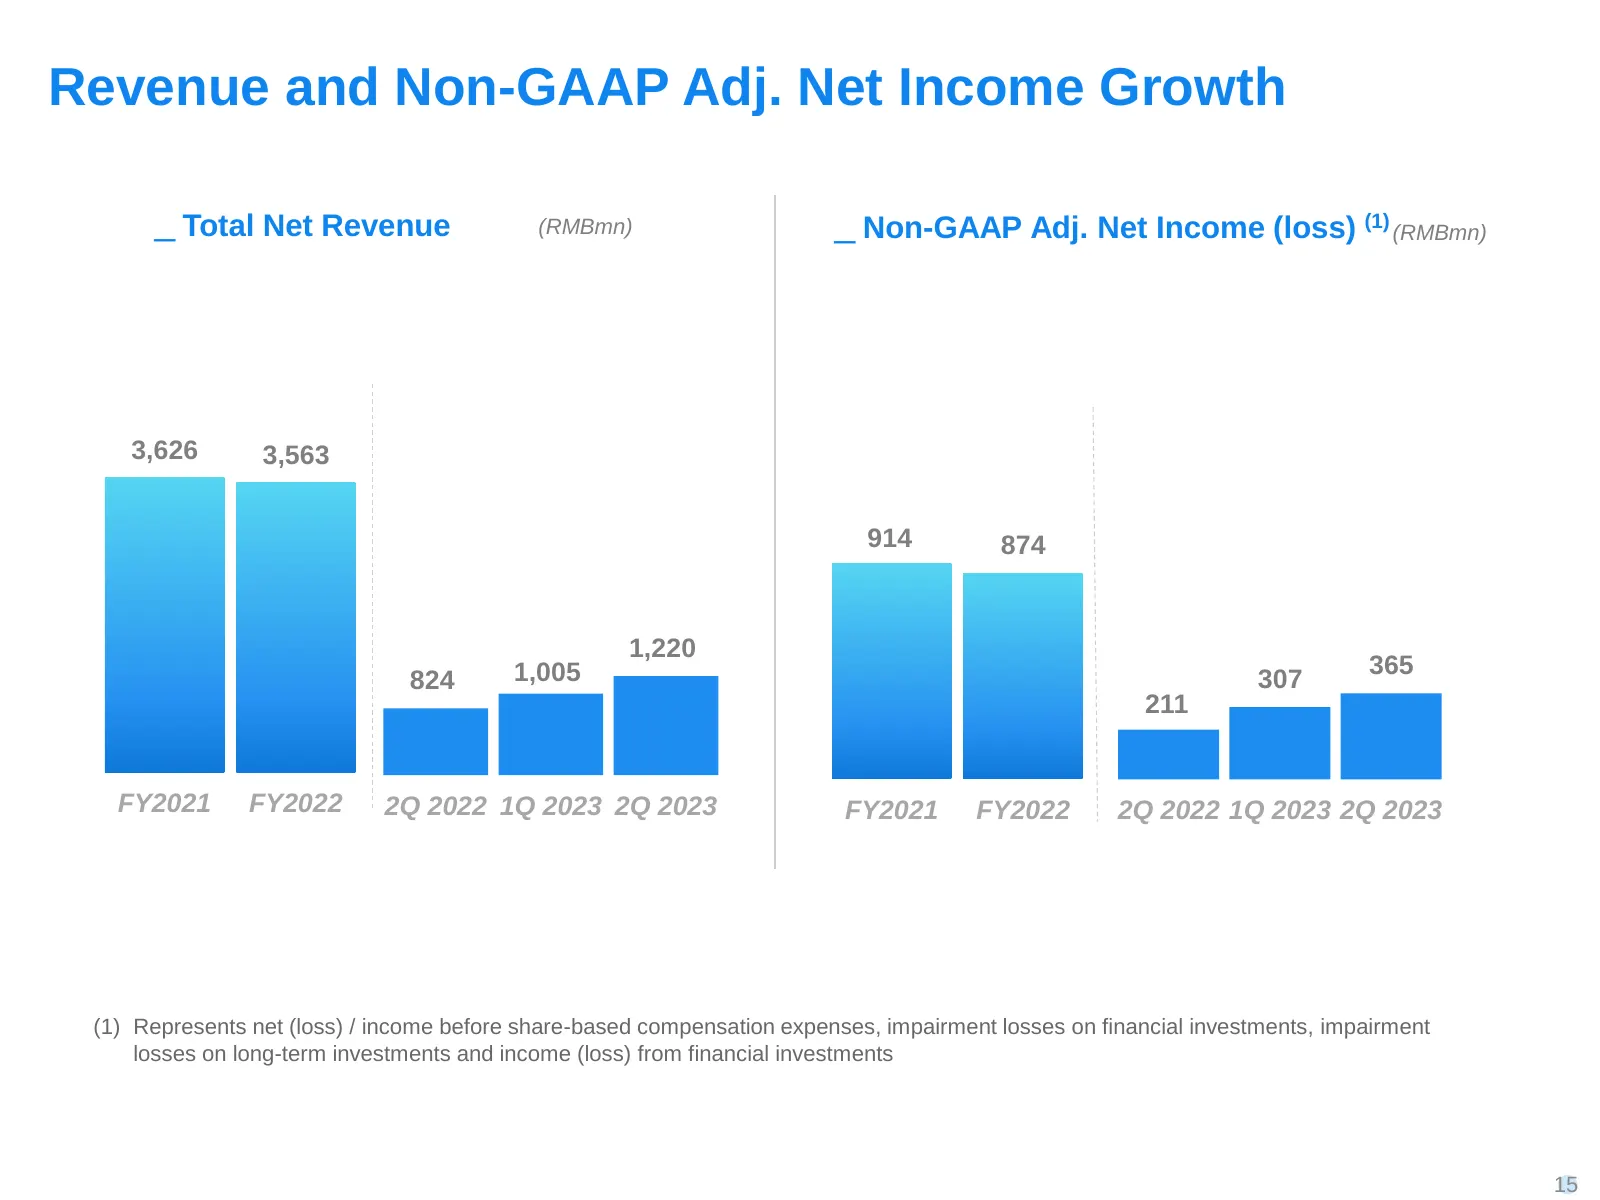
Revenue and Non-GAAP Adj. Net Income Growth ͟ Total Net Revenue (RMBmn) ͟ Non-GAAP Adj. Net Income (loss) (1) (RMBmn) 3,626 3,563 914 874 1,220 1,005 365 824 307 211 FY2021 FY2022 2Q 2022 1Q 2023 2Q 2023 FY2021 FY2022 2Q 2022 1Q 2023 2Q 2023 (1) Represents net (loss) / income before share-based comp
Slide 16: Operational Efficiency
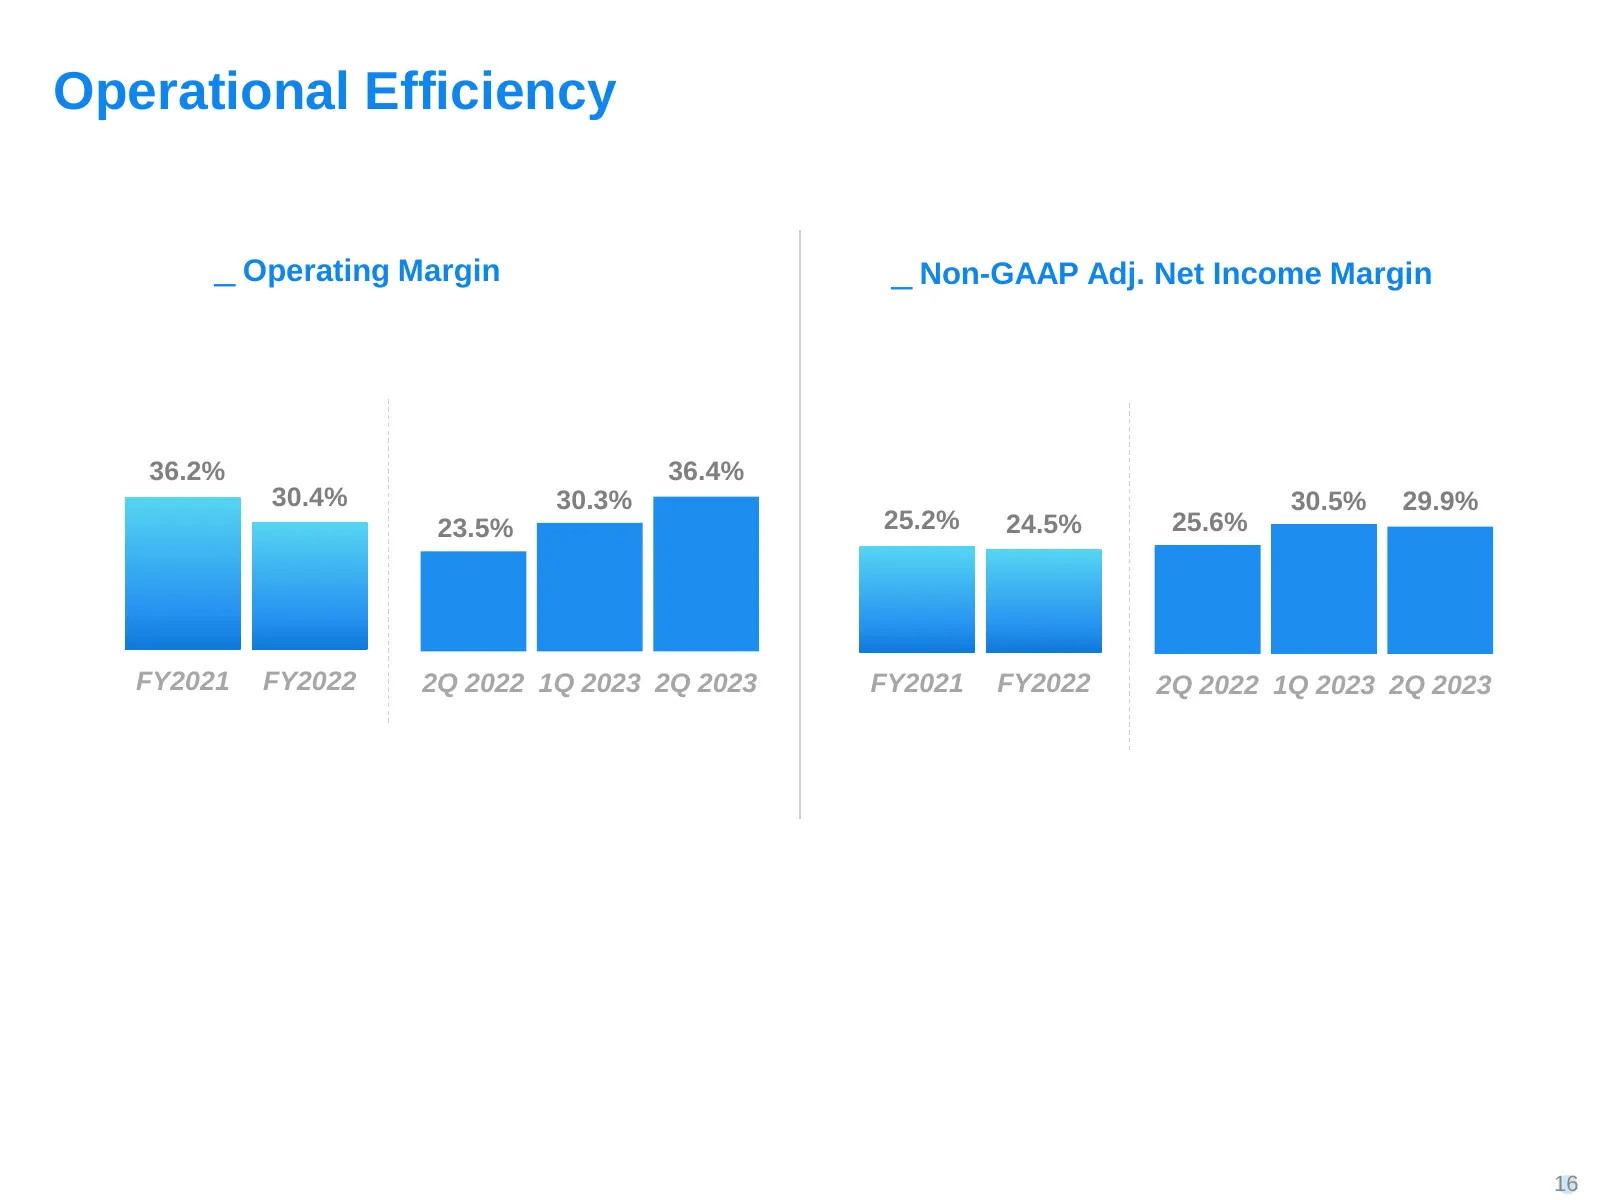
Operational Efficiency ͟ Operating Margin ͟ Non-GAAP Adj. Net Income Margin 36.2% 36.4% 30.4% 30.3% 30.5% 29.9% 23.5% 25.2% 24.5% 25.6% FY2021 FY2022 2Q 2022 1Q 2023 2Q 2023 FY2021 FY2022 2Q 2022 1Q 2023 2Q 2023 16
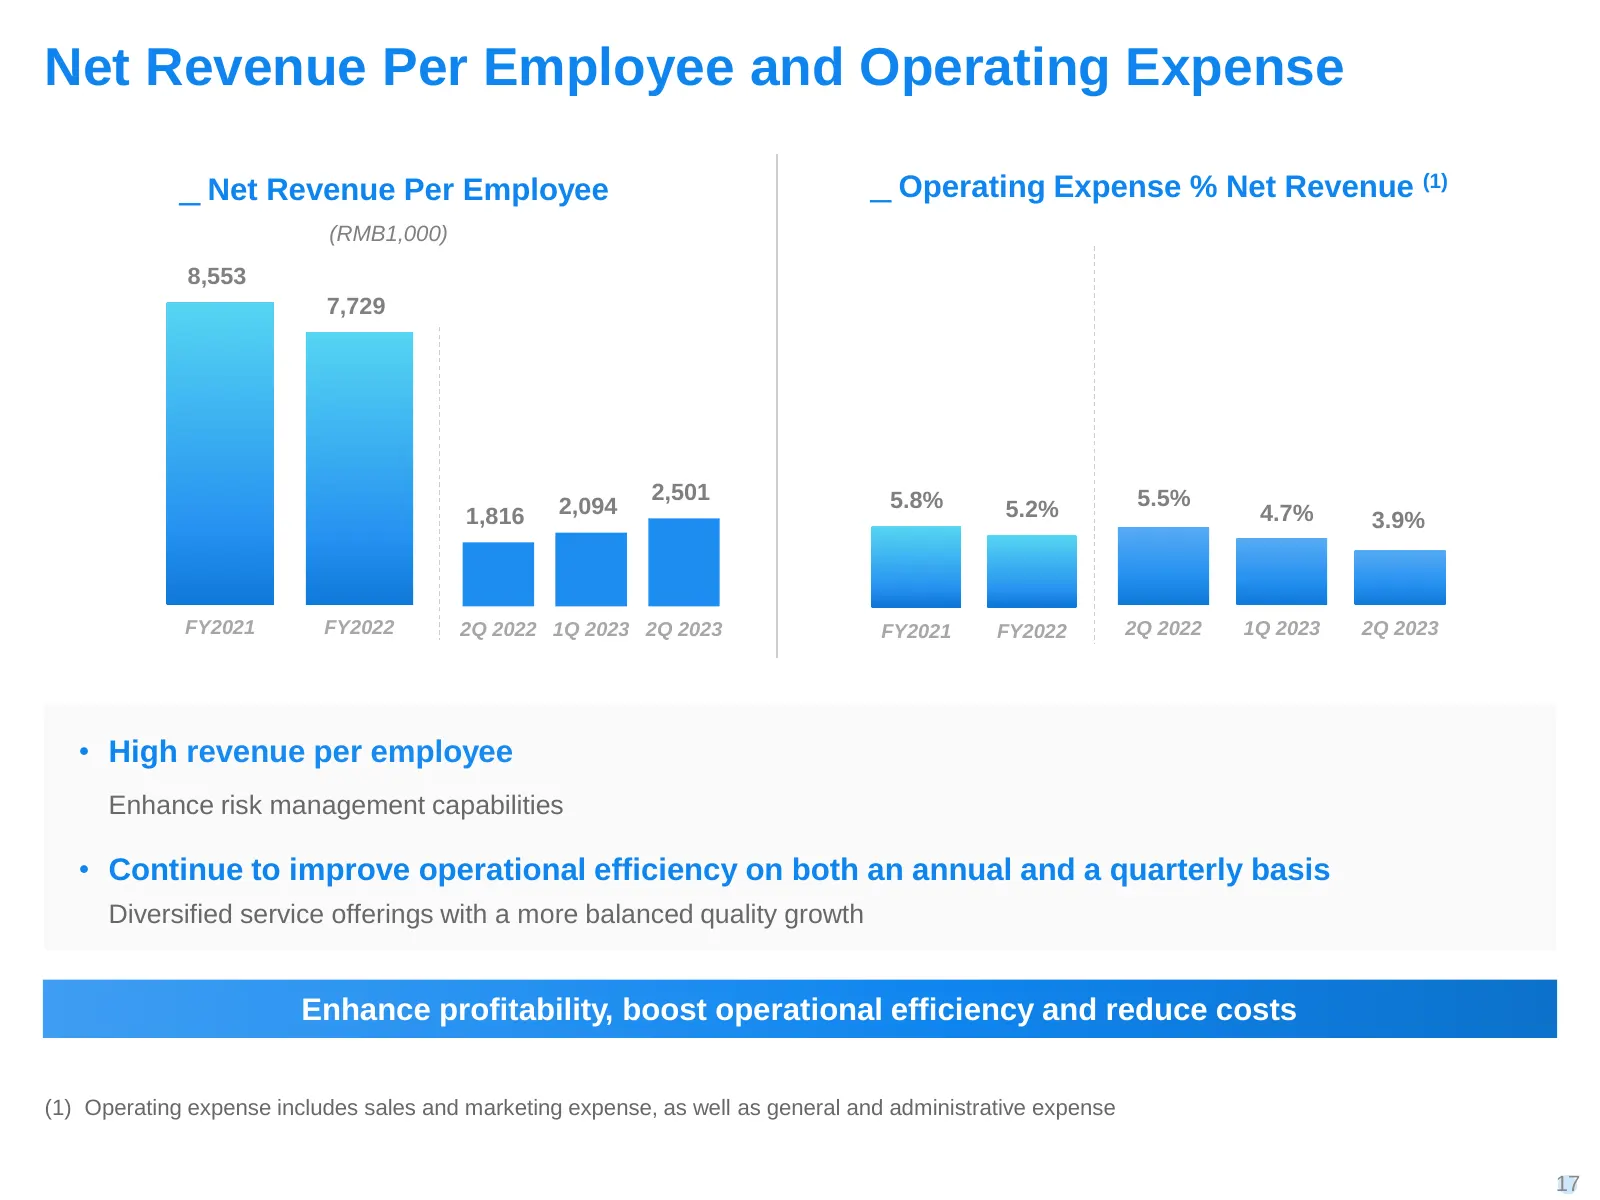
Slide 17: Net Revenue Per Employee and Operating Expense
Net Revenue Per Employee and Operating Expense ͟ Net Revenue Per Employee ͟ Operating Expense % Net Revenue (1) (RMB1,000) 8,553 7,729 2,501 5.8% 5.5% 1,816 2,094 5.2% 4.7% 3.9% FY2021 FY2022 2Q 2022 1Q 2023 2Q 2023 FY2021 FY2022 2Q 2022 1Q 2023 2Q 2023 • High revenue per employee Enhance risk manag
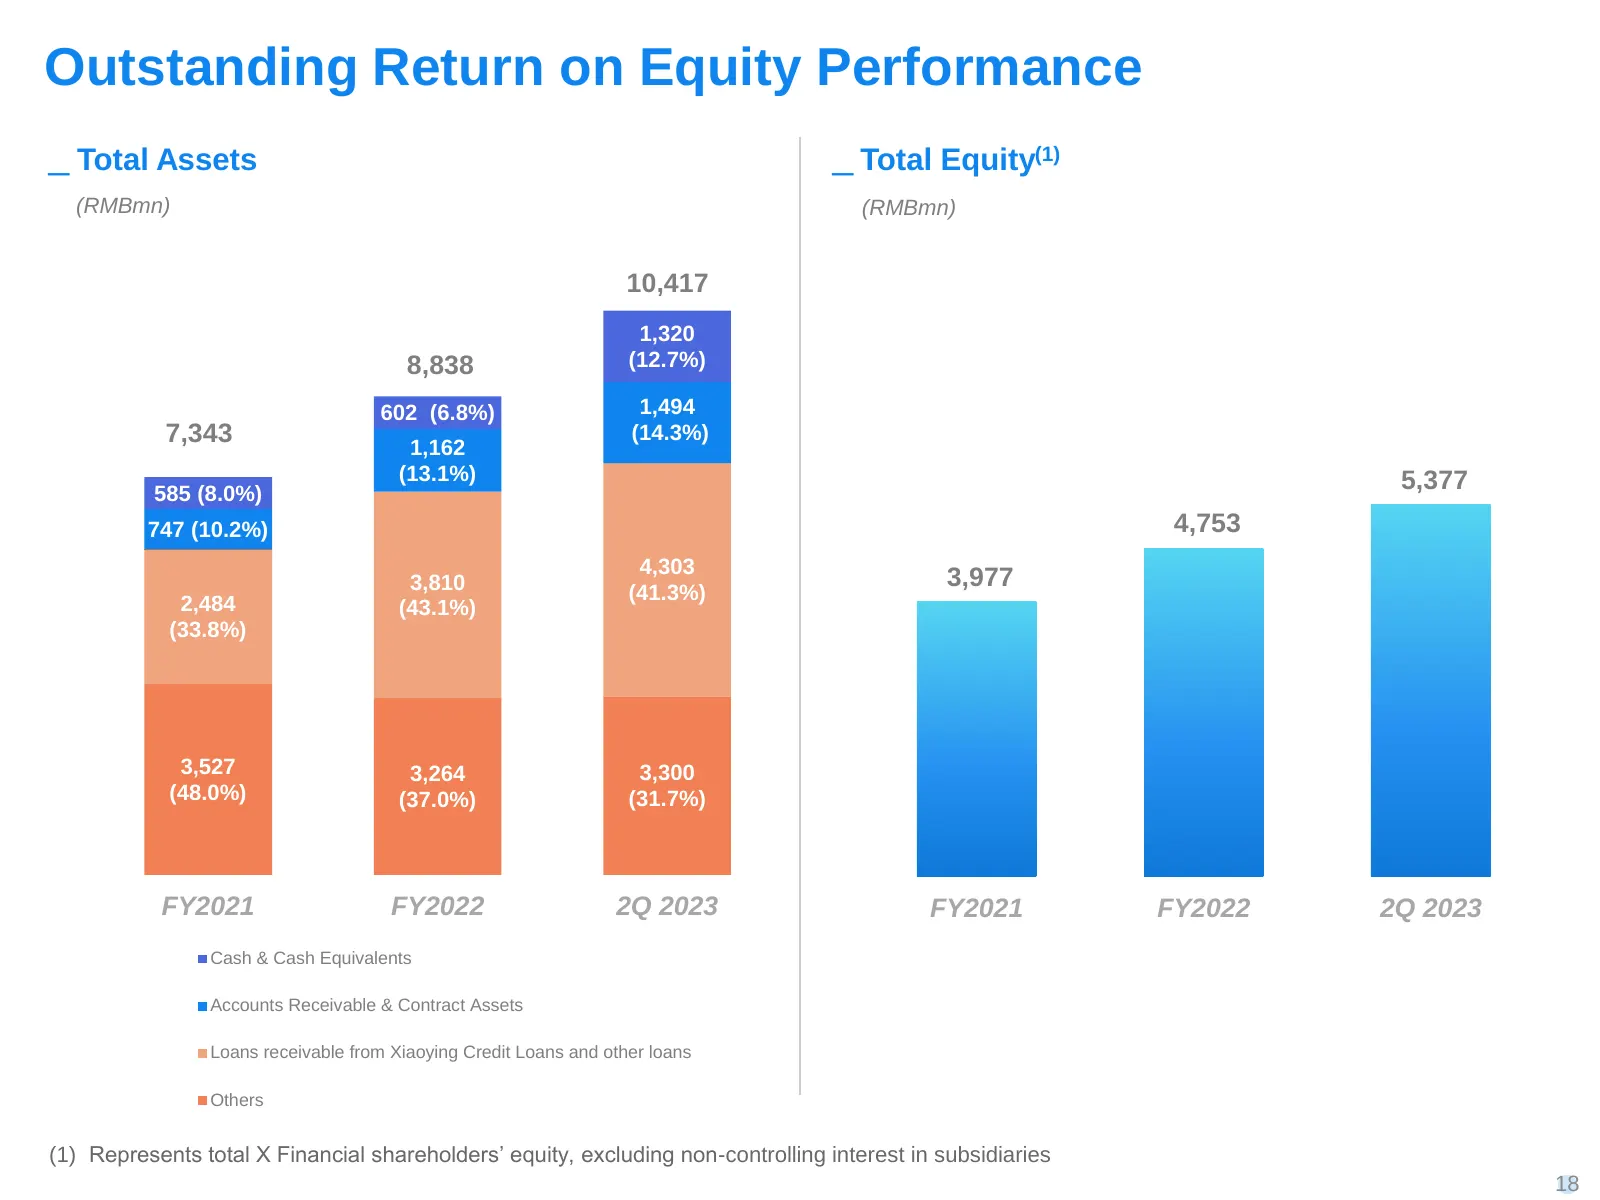
Slide 18: Outstanding Return on Equity Performance
Outstanding Return on Equity Performance ͟ Total Assets ͟ Total Equity(1) (RMBmn) (RMBmn) 10,417 1,320 8,838 (12.7%) 602 (6.8%) 1,494 7,343 1,162 (14.3%) (13.1%) 5,377 585 (8.0%) 747 (10.2%) 4,753 4,303 3,810 3,977 (41.3%) 2,484 (43.1%) (33.8%) 3,527 3,264 3,300 (48.0%) (37.0%) (31.7%) FY2021 FY2022
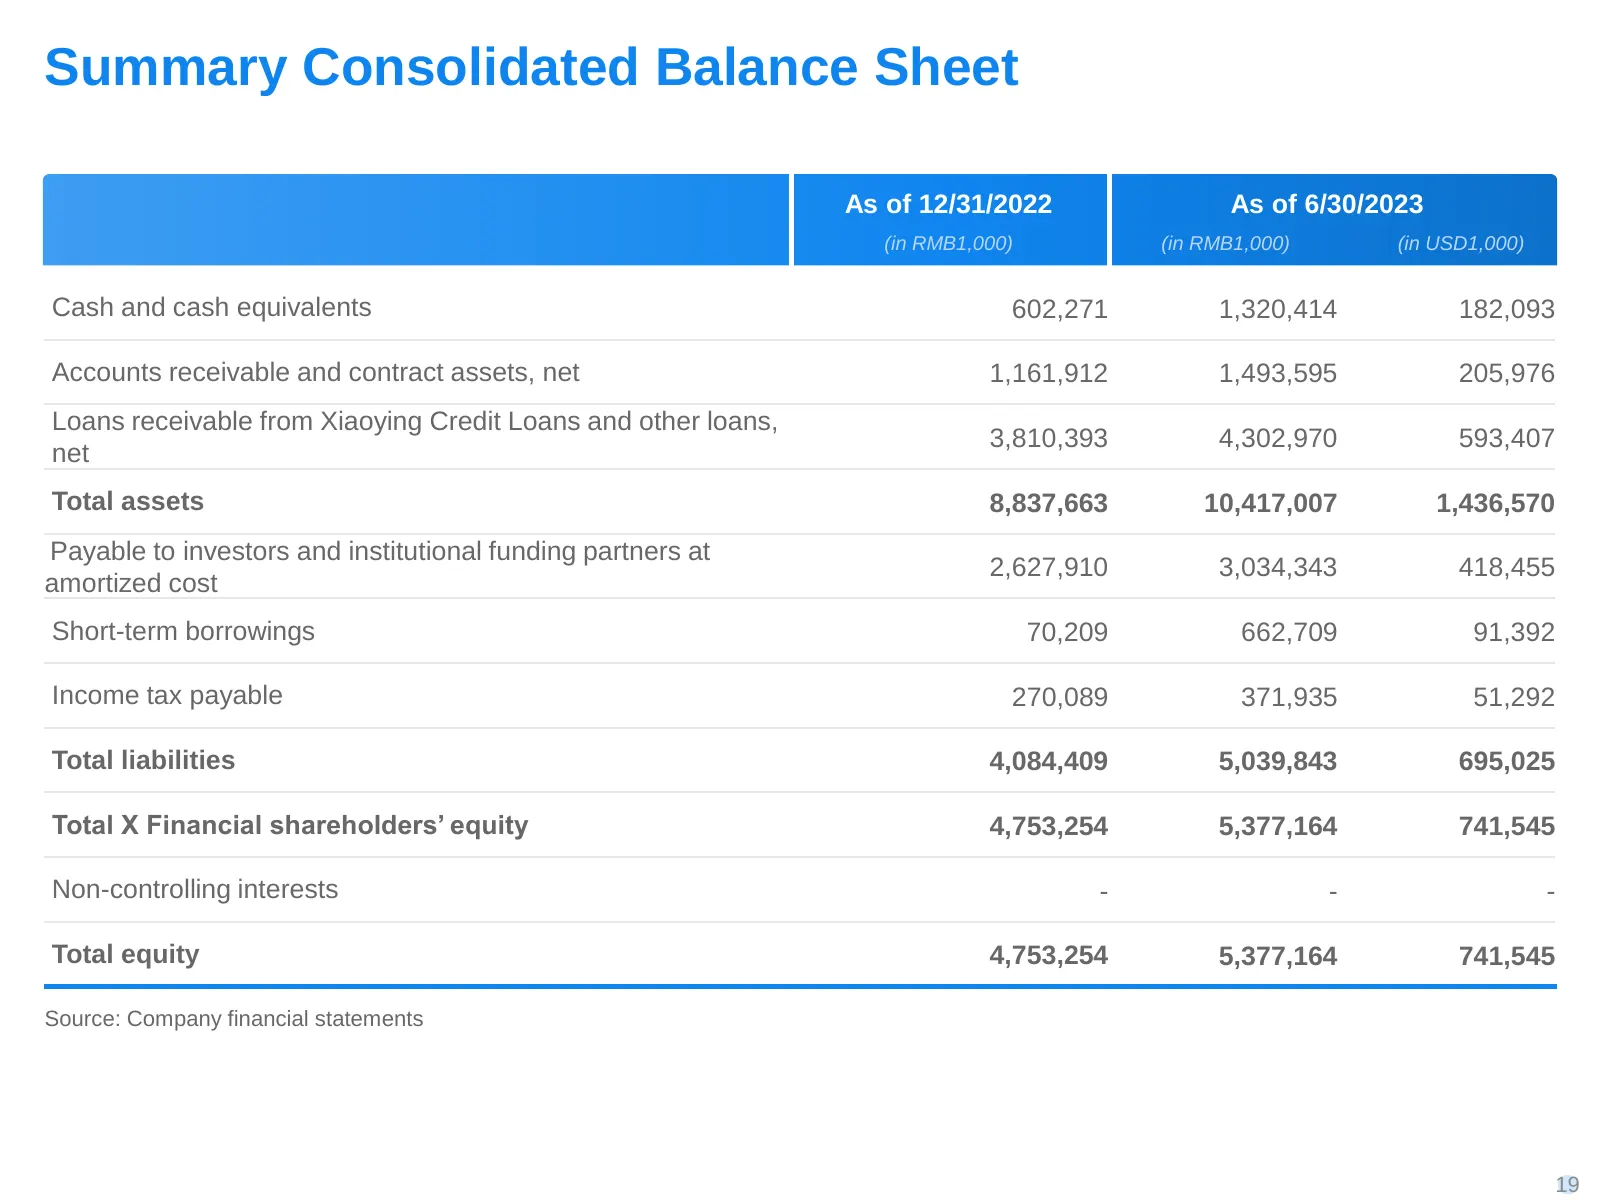
Slide 19: Summary Consolidated Balance Sheet
Summary Consolidated Balance Sheet As of 12/31/2022 As of 6/30/2023 (in RMB1,000) (in RMB1,000) (in USD1,000) Cash and cash equivalents 602,271 1,320,414 182,093 Accounts receivable and contract assets, net 1,161,912 1,493,595 205,976 Loans receivable from Xiaoying Credit Loans and other loans, 3,81
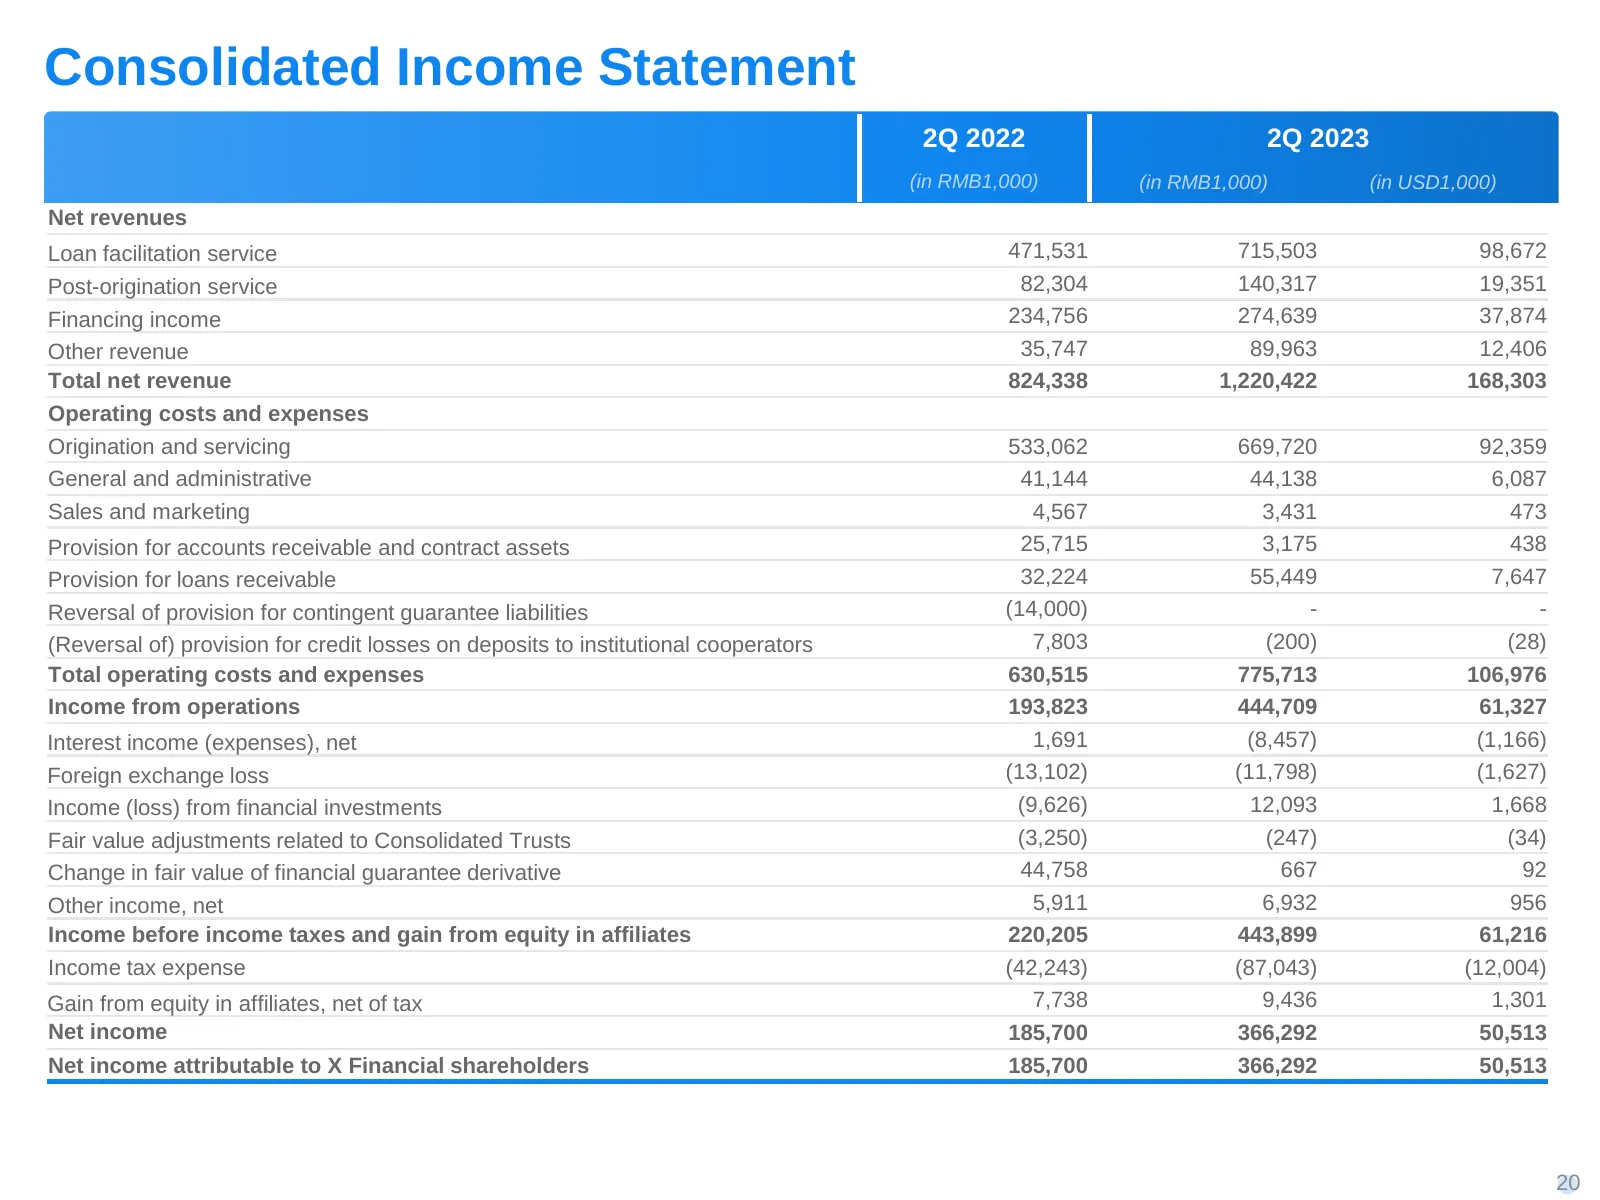
Slide 20: Consolidated Income Statement
Consolidated Income Statement 2Q 2022 2Q 2023 (in RMB1,000) (in RMB1,000) (in USD1,000) Net revenues Loan facilitation service 471,531 715,503 98,672 Post-origination service 82,304 140,317 19,351 Financing income 234,756 274,639 37,874 Other revenue 35,747 89,963 12,406 Total net revenue 824,338 1,
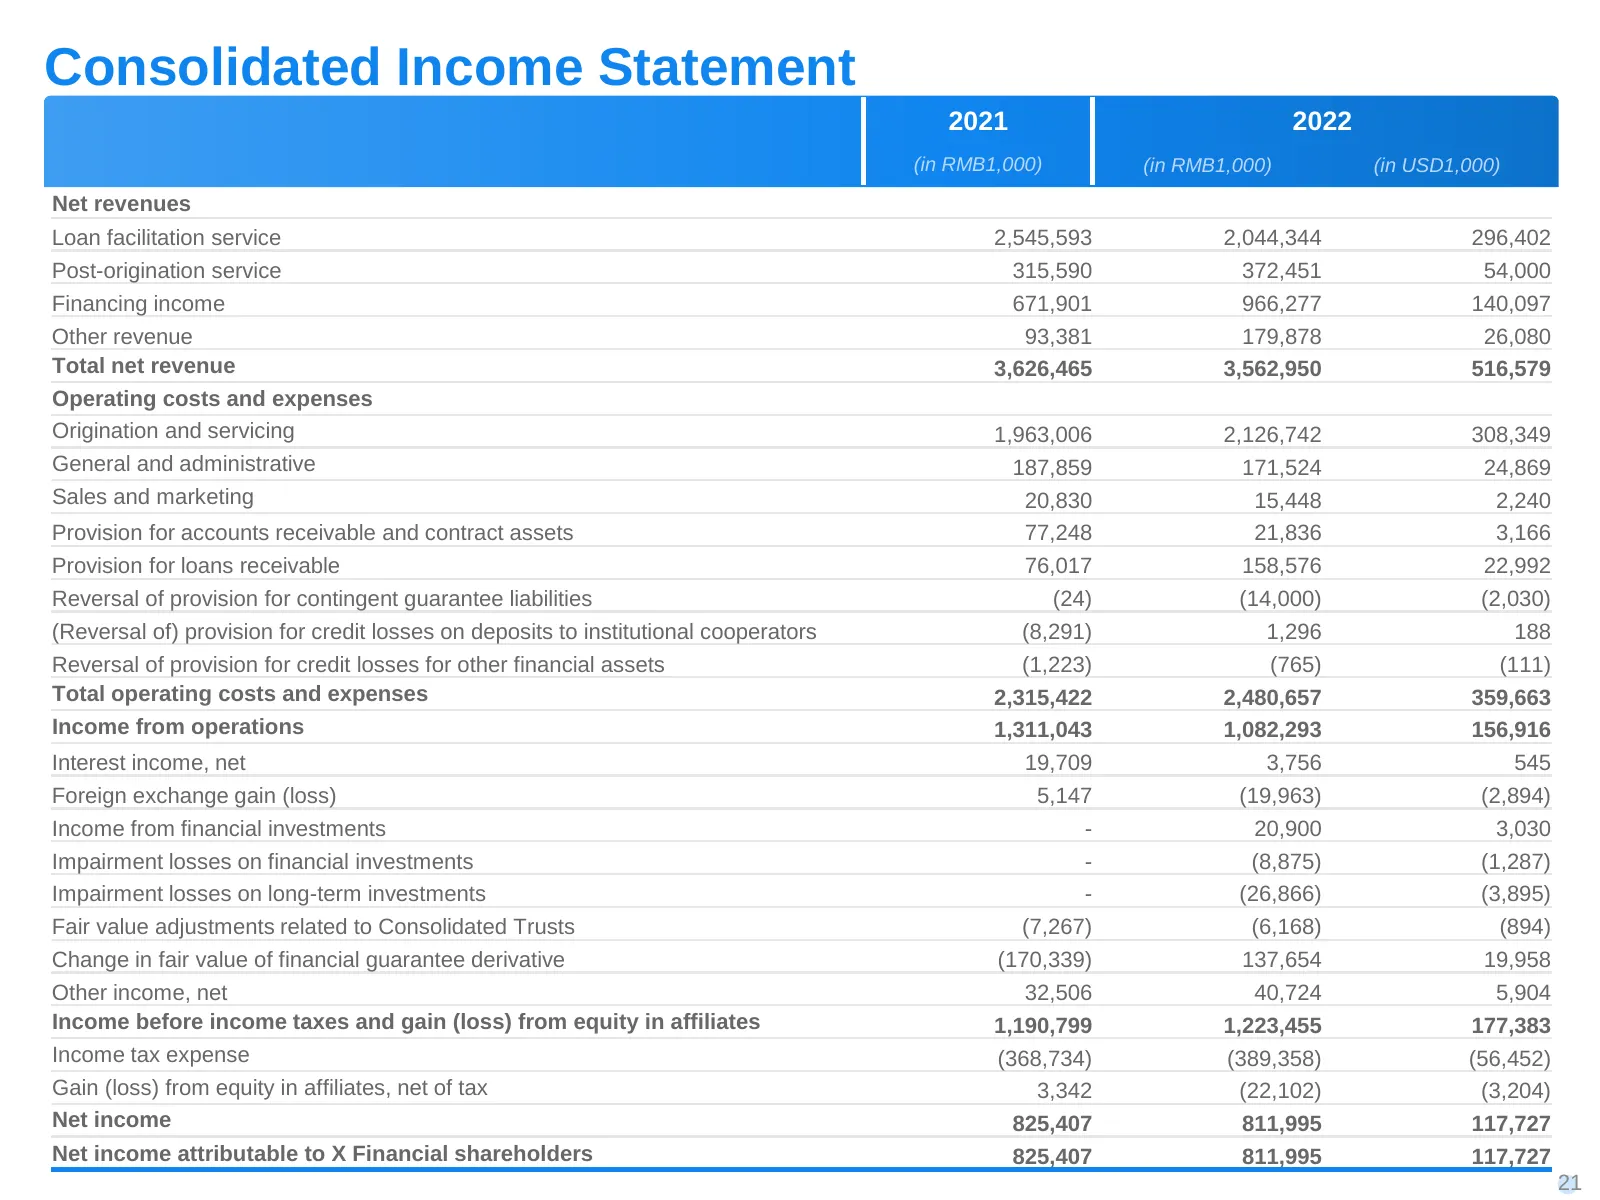
Slide 21: Consolidated Income Statement
Consolidated Income Statement 2021 2022 (in RMB1,000) (in RMB1,000) (in USD1,000) Net revenues Loan facilitation service 2,545,593 2,044,344 296,402 Post-origination service 315,590 372,451 54,000 Financing income 671,901 966,277 140,097 Other revenue 93,381 179,878 26,080 Total net revenue 3,626,46
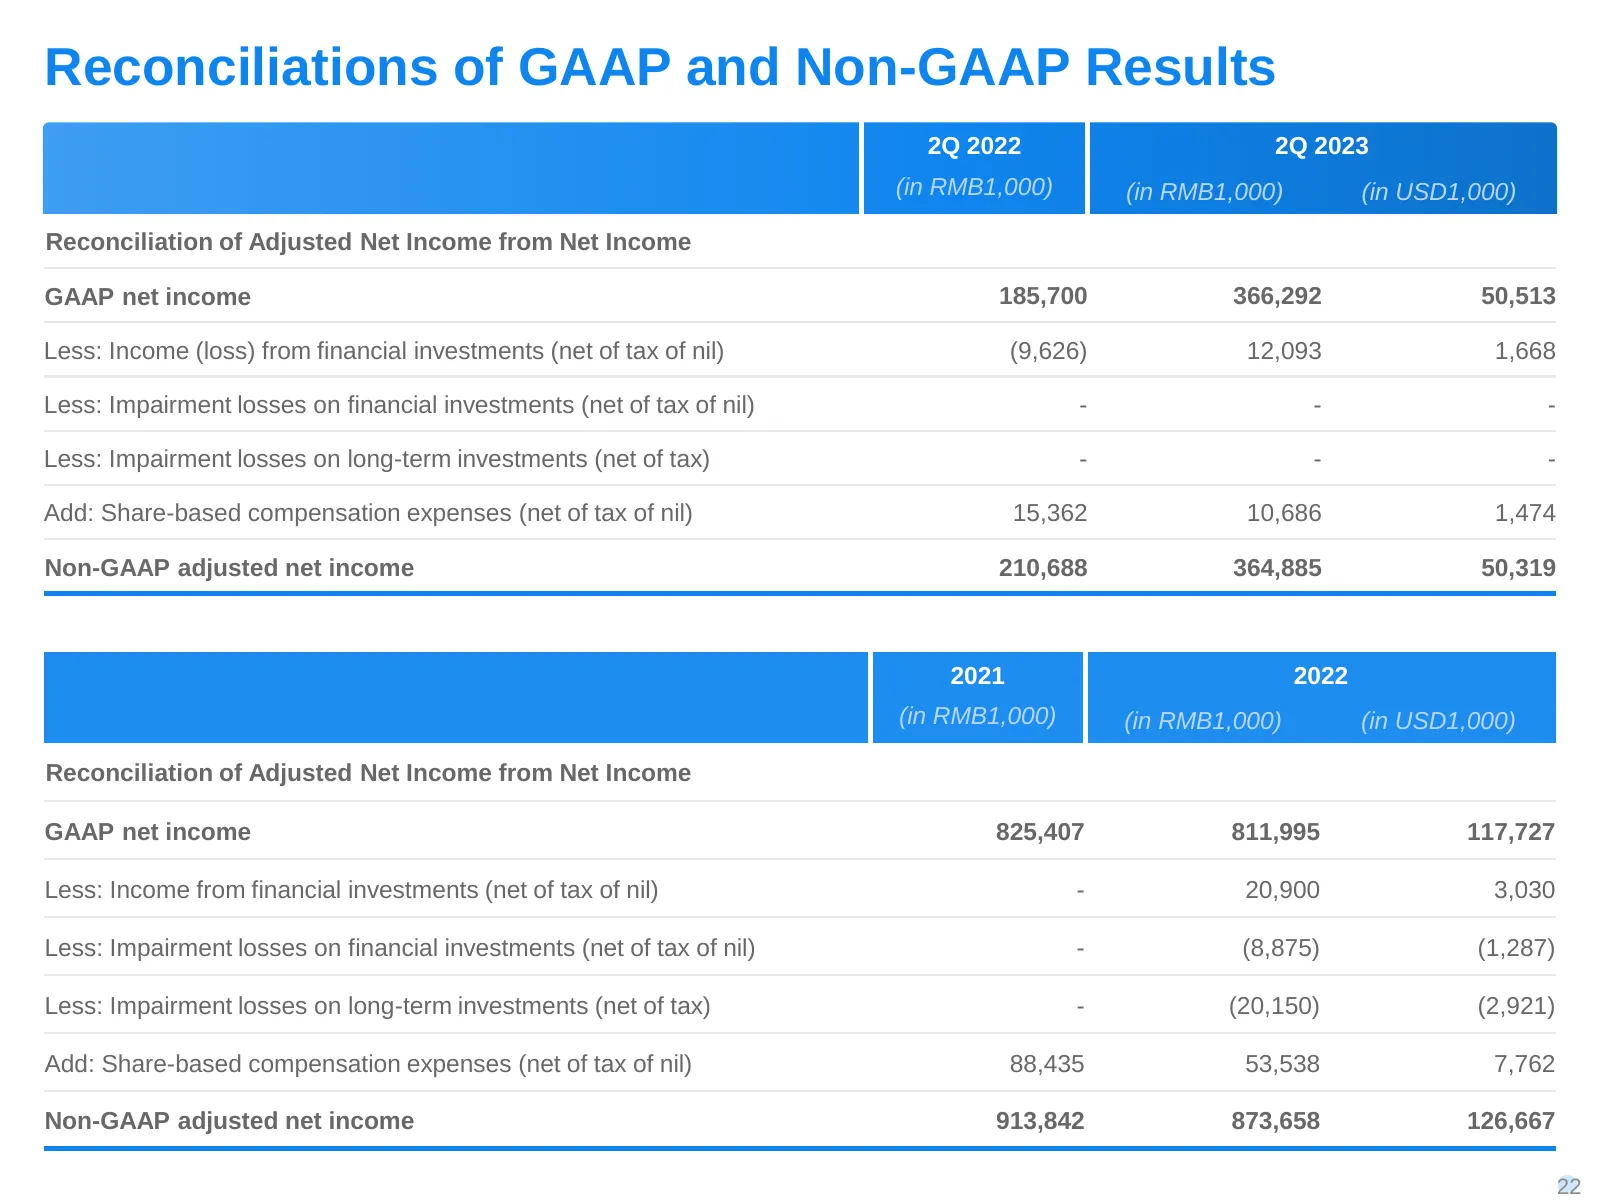
Slide 22: Reconciliations of GAAP and Non-GAAP Results
Reconciliations of GAAP and Non-GAAP Results 2Q 2022 2Q 2023 (in RMB1,000) (in RMB1,000) (in USD1,000) Reconciliation of Adjusted Net Income from Net Income GAAP net income 185,700 366,292 50,513 Less: Income (loss) from financial investments (net of tax of nil) (9,626) 12,093 1,668 Less: Impairment
Source: EarningsCall slides
More decks from X Financial
 Q2 2026 Earnings Presentation19 slides · Aug 24, 2026
 Q1 2026 Earnings Presentation19 slides · May 28, 2026
 Q4 2025 Earnings Presentation20 slides · Mar 26, 2026
 Q3 2025 Earnings Presentation20 slides · November 2025
 Q2 2025 Earnings Presentation20 slides · Aug 19, 2025
 Q4 2024 Earnings Presentation25 slides · May 20, 2025