NexTier Oilfield Solutions Inc
NexTier Oilfield Solutions — Investor Presentation (April 2021)
29 slides from NexTier Oilfield Solutions's investor presentation, Apr 26, 2021
Slide 1: Investor Presentation April 2021
Investor Presentation April 2021
Slide 2: Forward Looking Statements & Disclosures
Forward Looking Statements & Disclosures 2 All statements other than statements of historical facts contained in this presentation and any oral statements made in connection with this presentation, including statements regarding our future operating results and financial position, business strategy
Slide 3: Overview of NexTier
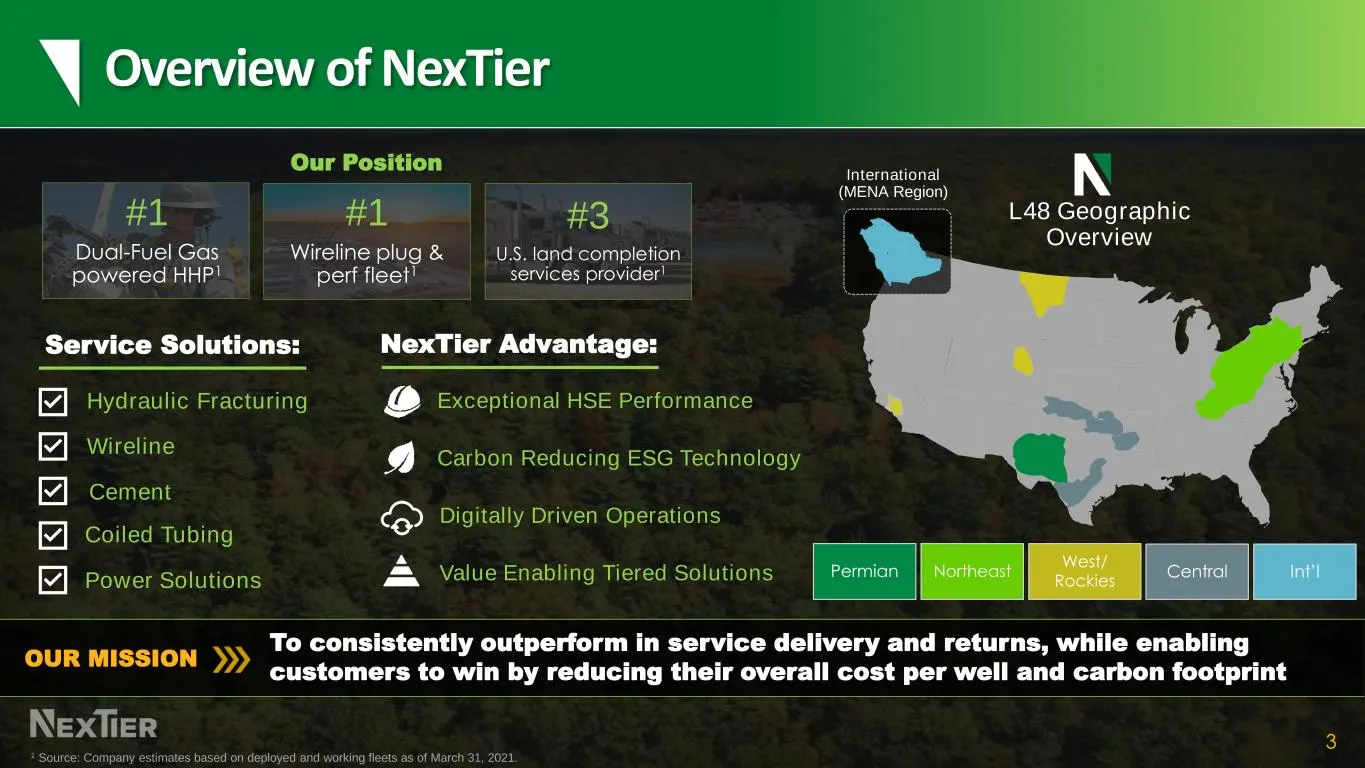
Overview of NexTier 3 #1 Dual-Fuel Gas powered HHP1 #1 Wireline plug & perf fleet1 #3 U.S. land completion services provider1 Our Position L48 Geographic Overview International (MENA Region) 1 Source: Company estimates based on deployed and working fleets as of March 31, 2021. Permian Northeast West
Slide 4: Track Record of M&A Selection, Execution, Integration
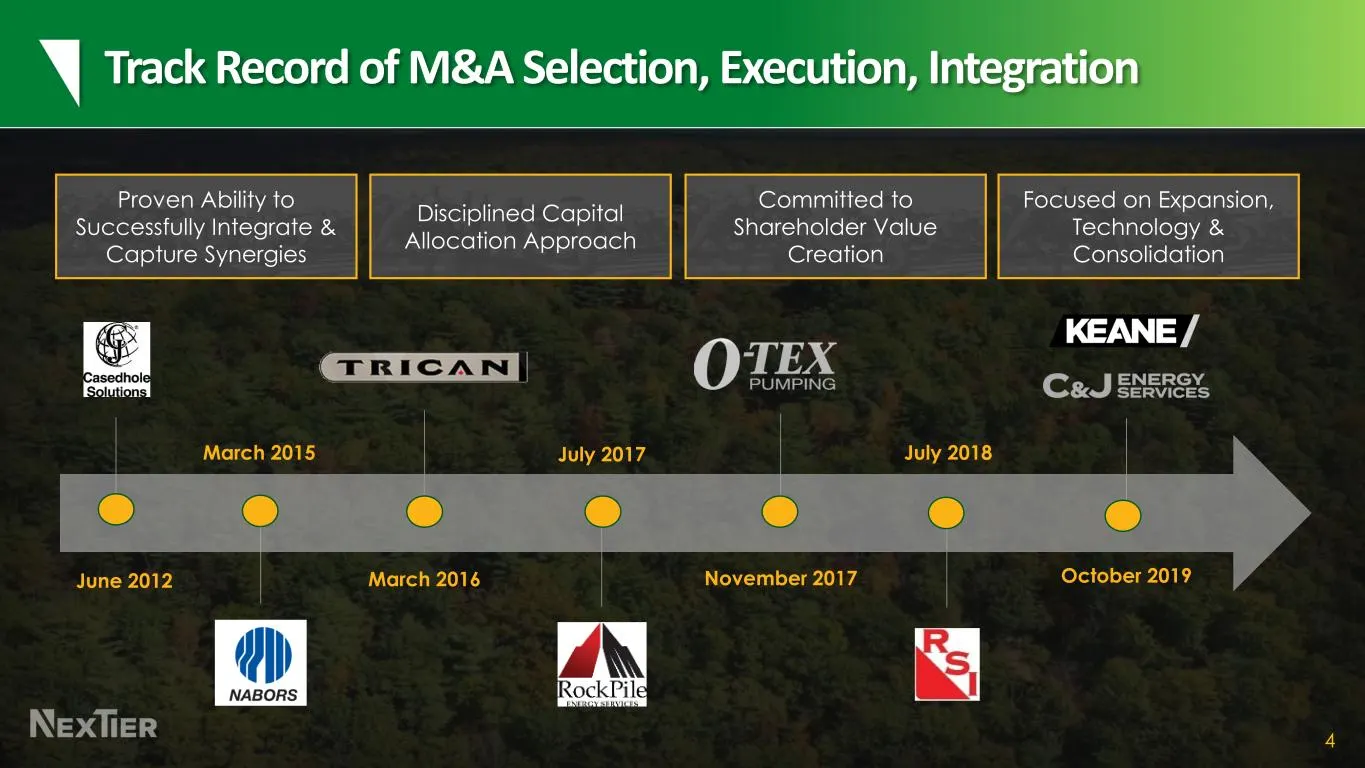
Track Record of M&A Selection, Execution, Integration March 2016 July 2017 November 2017 July 2018 October 2019 Proven Ability to Successfully Integrate & Capture Synergies Disciplined Capital Allocation Approach Committed to Shareholder Value Creation Focused on Expansion, Technology & Consolidatio
Slide 5: Industry Leading Risk Management
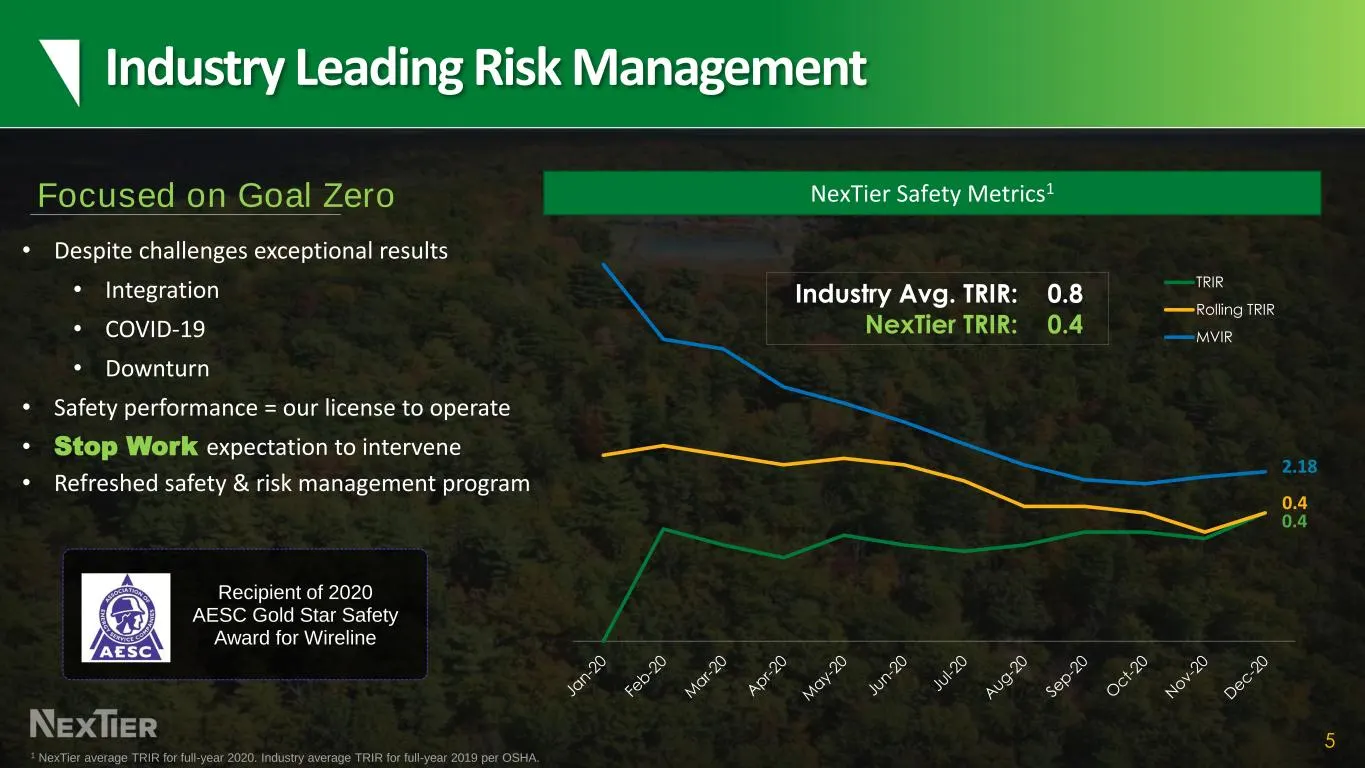
Industry Leading Risk Management 5 NexTier Safety Metrics1 • Despite challenges exceptional results • Integration • COVID-19 • Downturn • Safety performance = our license to operate • Stop Work expectation to intervene • Refreshed safety & risk management program Focused on Goal Zero 1 NexTier avera
Slide 6: Fortified Balance Sheet
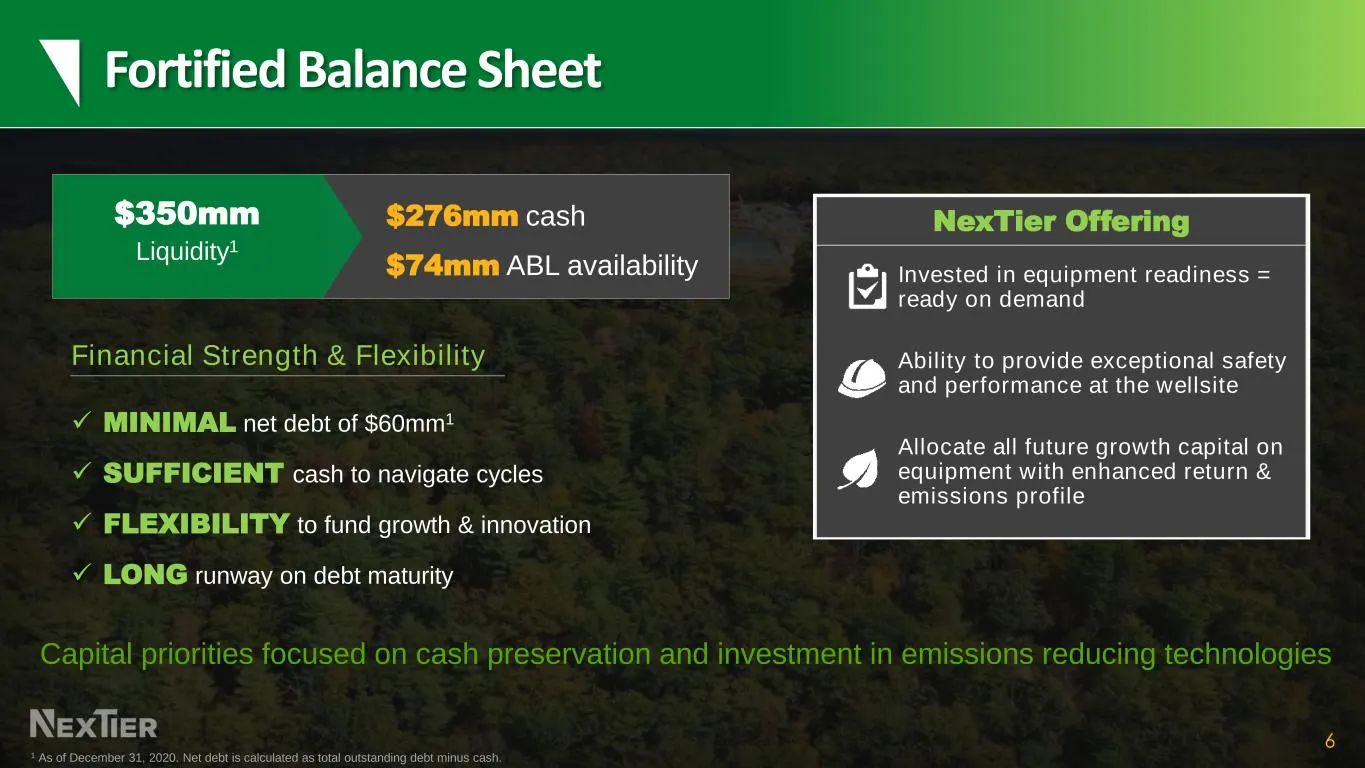
Fortified Balance Sheet ✓ MINIMAL net debt of $60mm1 ✓ SUFFICIENT cash to navigate cycles ✓ FLEXIBILITY to fund growth & innovation ✓ LONG runway on debt maturity Financial Strength & Flexibility ̶ $276mm cash ̶ $74mm ABL availability $350mm Liquidity1 Invested in equipment readiness = ready on dema
Slide 7: Responsible Asset Readiness
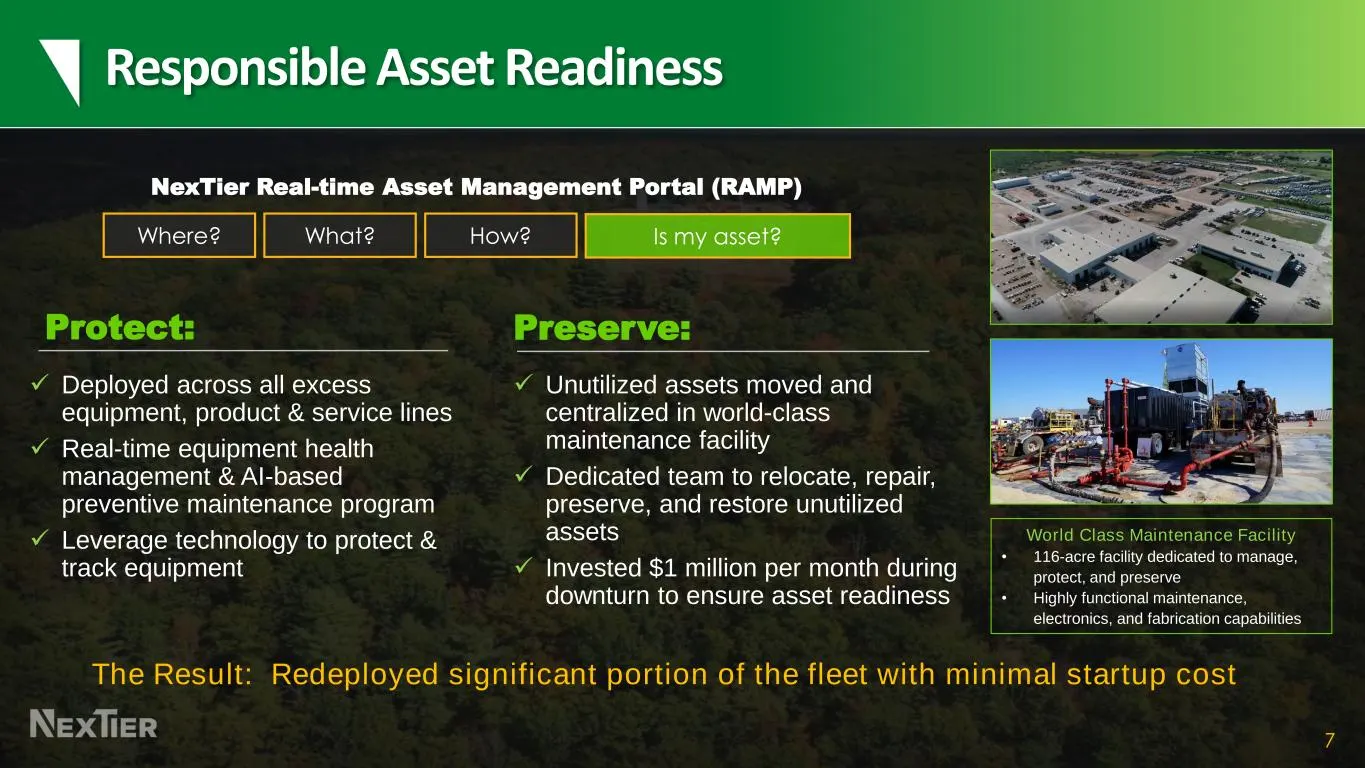
Responsible Asset Readiness ✓ Deployed across all excess equipment, product & service lines ✓ Real-time equipment health management & AI-based preventive maintenance program ✓ Leverage technology to protect & track equipment ✓ Unutilized assets moved and centralized in world-class maintenance facili
Slide 8: The NexTier Advantage
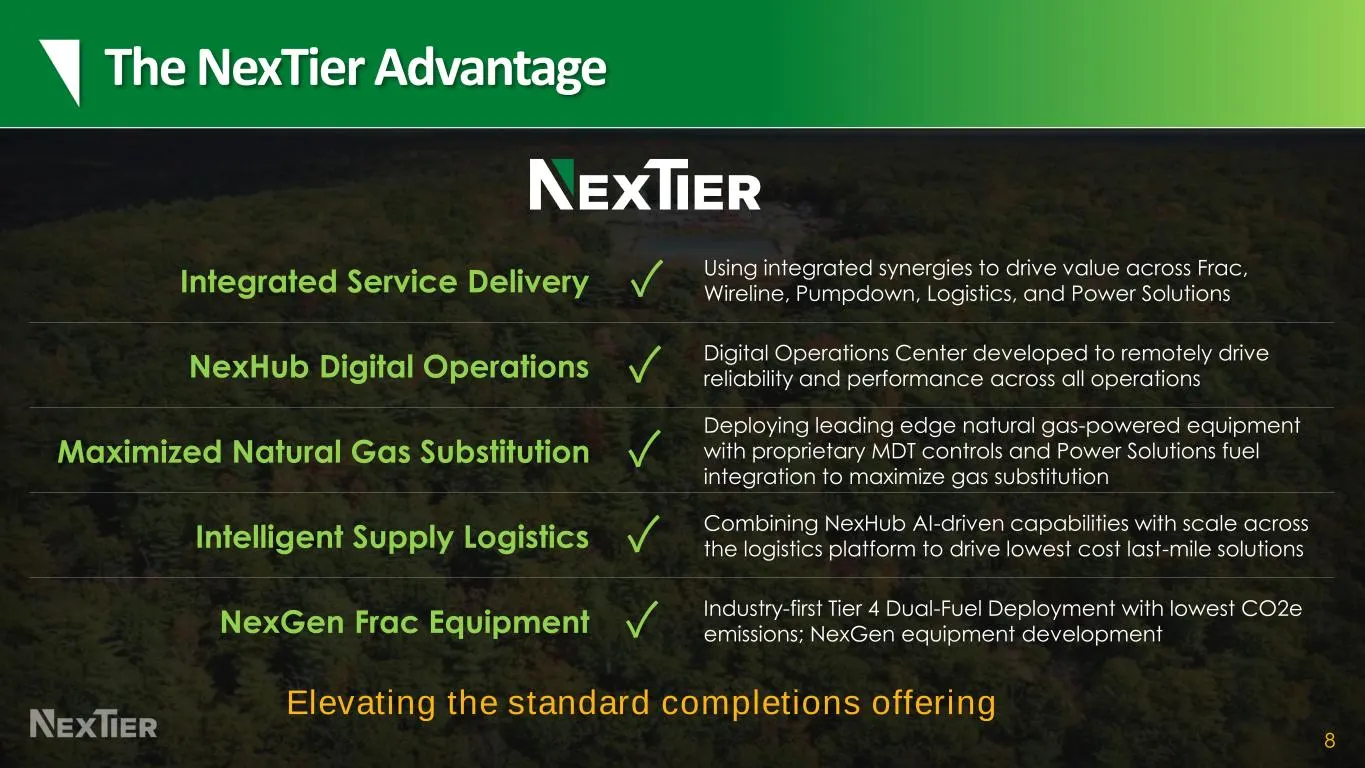
The NexTier Advantage 8 Integrated Service Delivery Using integrated synergies to drive value across Frac, Wireline, Pumpdown, Logistics, and Power Solutions NexHub Digital Operations Digital Operations Center developed to remotely drive reliability and performance across all operations Maximized Na
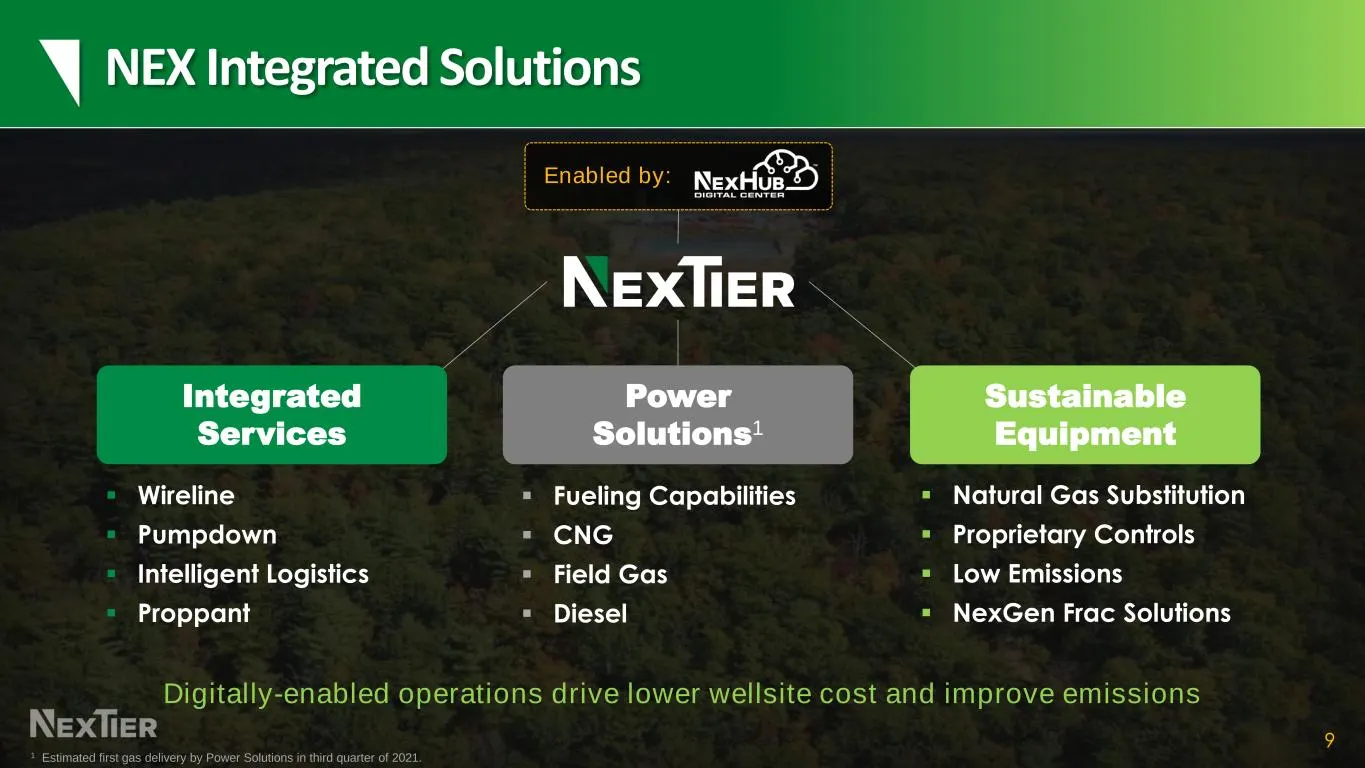
Slide 9: NEX Integrated Solutions
NEX Integrated Solutions 9 Integrated Services Power Solutions1 Sustainable Equipment ▪ Wireline ▪ Pumpdown ▪ Intelligent Logistics ▪ Proppant ▪ Fueling Capabilities ▪ CNG ▪ Field Gas ▪ Diesel ▪ Natural Gas Substitution ▪ Proprietary Controls ▪ Low Emissions ▪ NexGen Frac Solutions Enabled by: Digit
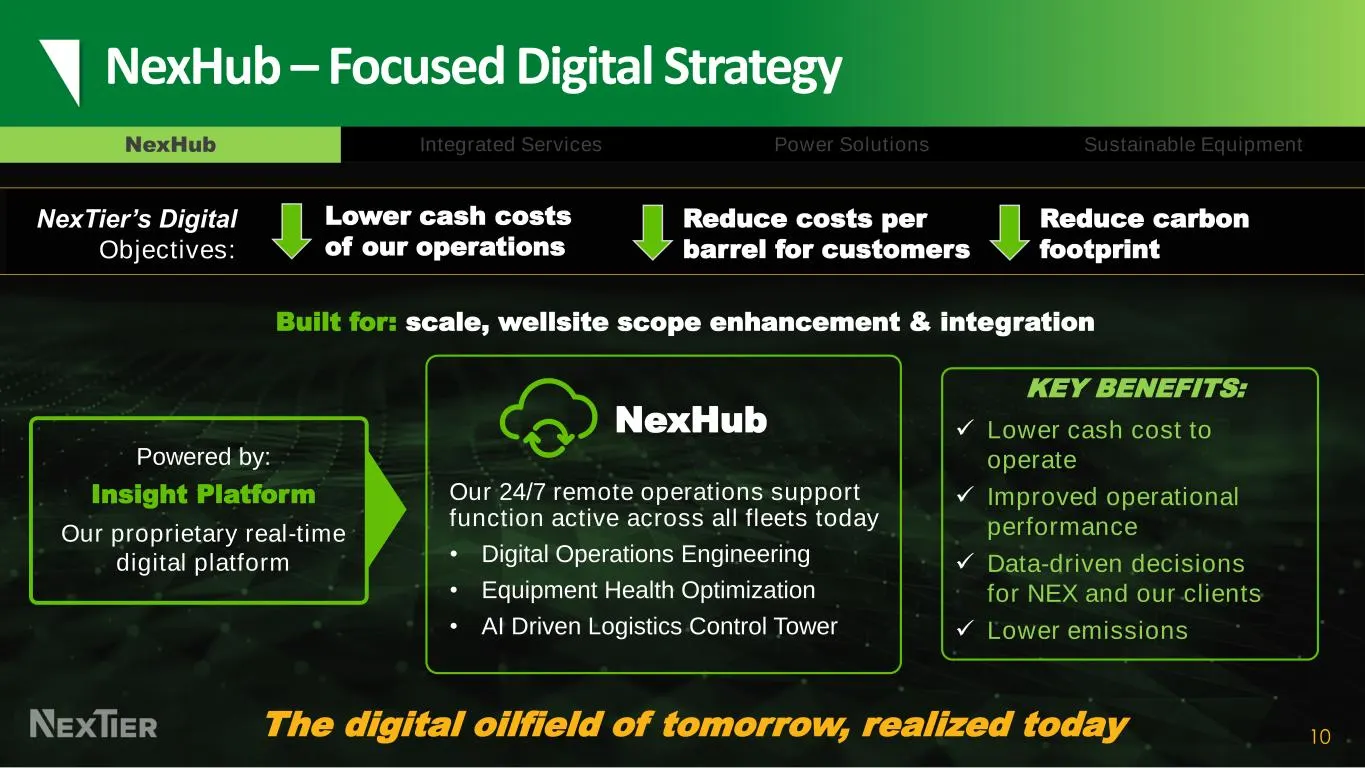
Slide 10: NexHub – Focused Digital Strategy
10 NexHub Sustainable EquipmentPower SolutionsIntegrated Services NexHub Our 24/7 remote operations support function active across all fleets today • Digital Operations Engineering • Equipment Health Optimization • AI Driven Logistics Control Tower Powered by: Insight Platform Our proprietary real-t
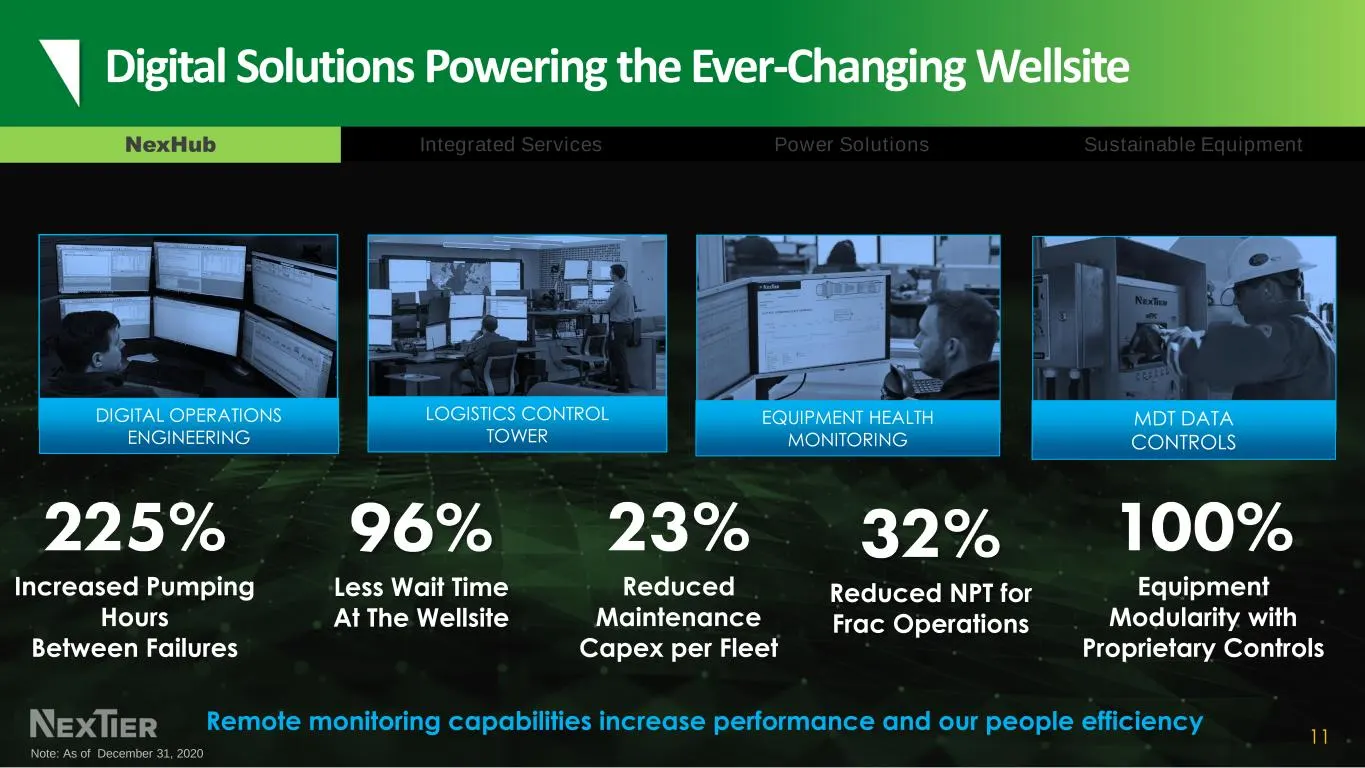
Slide 11: Digital Solutions Powering the Ever-Changing Wellsite
11 Digital Solutions Powering the Ever-Changing Wellsite Reduced NPT for Frac Operations Less Wait Time At The Wellsite Increased Pumping Hours Between Failures DIGITAL OPERATIONS ENGINEERING LOGISTICS CONTROL TOWER EQUIPMENT HEALTH MONITORING MDT DATA CONTROLS Reduced Maintenance Capex per Fleet Eq
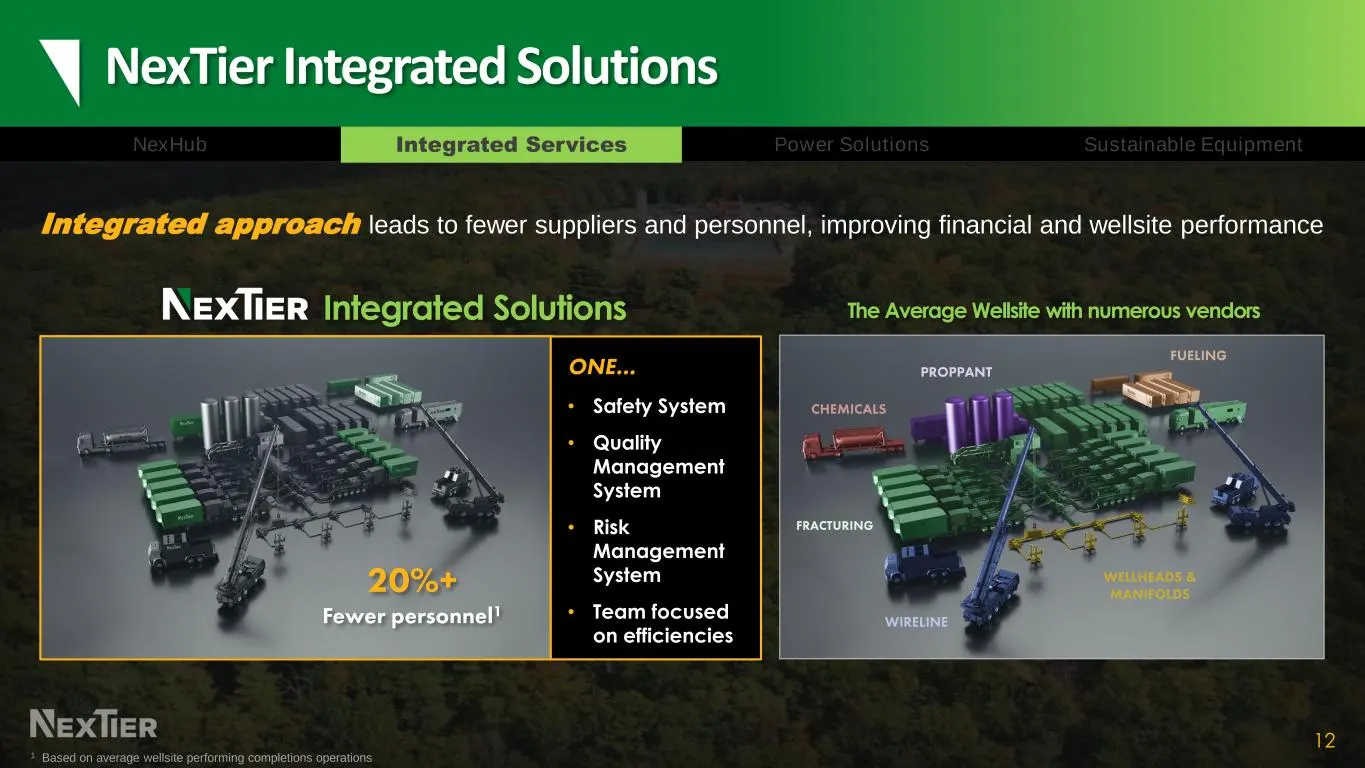
Slide 12: NexTier Integrated Solutions
NexTier Integrated Solutions 12 The Average Wellsite with numerous vendorsIntegrated Solutions • Safety System • Quality Management System • Risk Management System • Team focused on efficiencies 1 Based on average wellsite performing completions operations Integrated approach leads to fewer supplier
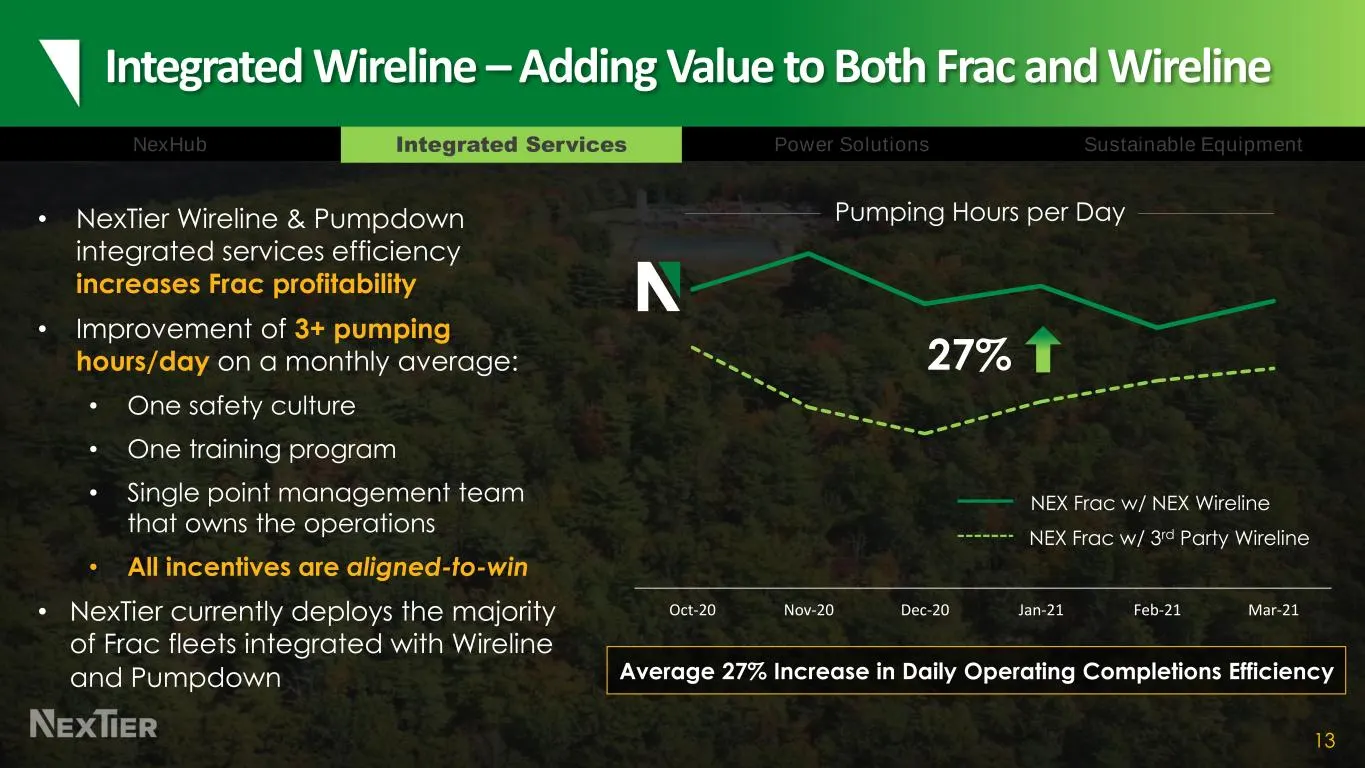
Slide 13: Integrated Wireline – Adding Value to Both Frac and Wireline
Oct-20 Nov-20 Dec-20 Jan-21 Feb-21 Mar-21 Integrated Wireline –Adding Value to Both Frac and Wireline 13 27% Average 27% Increase in Daily Operating Completions Efficiency • NexTier Wireline & Pumpdown integrated services efficiency increases Frac profitability • Improvement of 3+ pumping hours/day
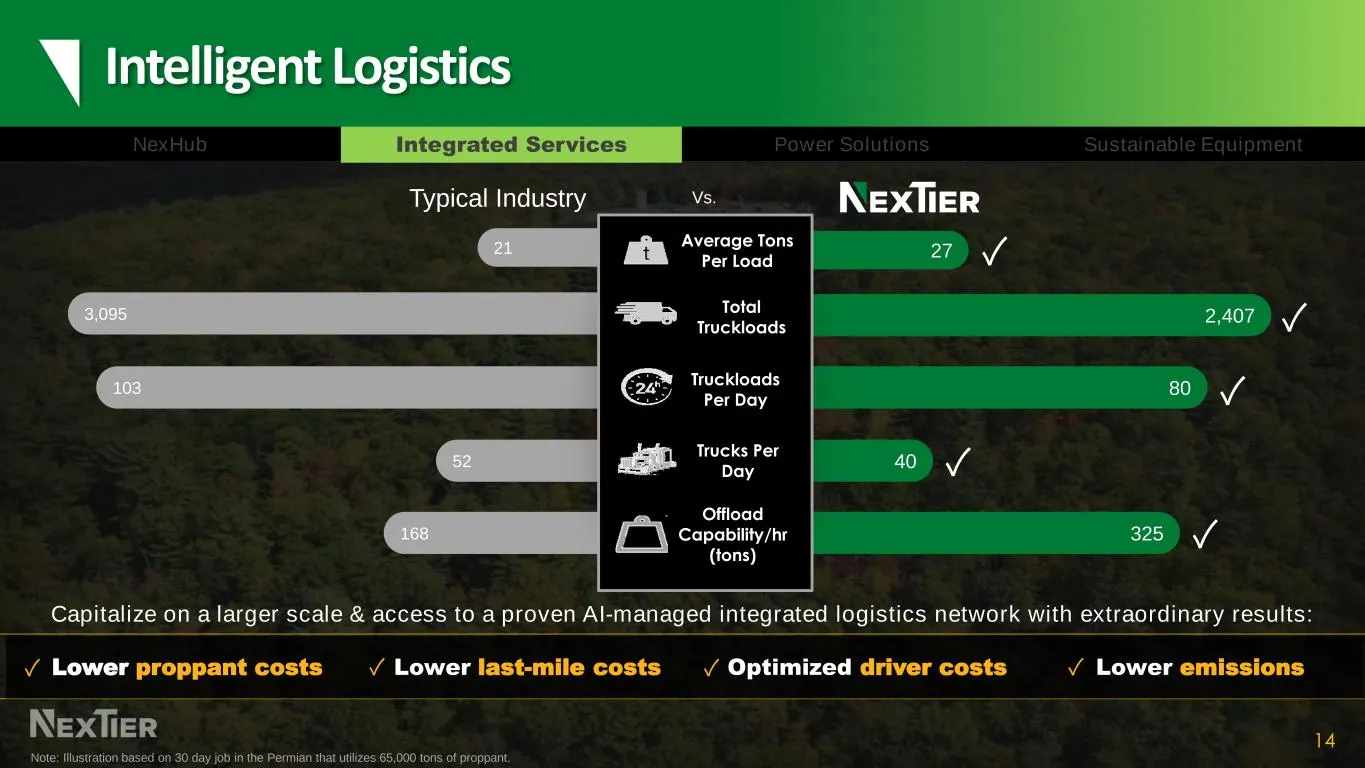
Slide 14: Intelligent Logistics
Intelligent Logistics 14 168 325 52 40 80103 3,095 2,407 21 27 Average Tons Per Load Total Truckloads Trucks Per Day Truckloads Per Day Offload Capability/hr (tons) Typical Industry ✓ ✓ ✓ ✓ ✓ Lower proppant costs Lower last-mile costs Lower emissionsOptimized driver costs✓ ✓ ✓ ✓ Note: Illustration b
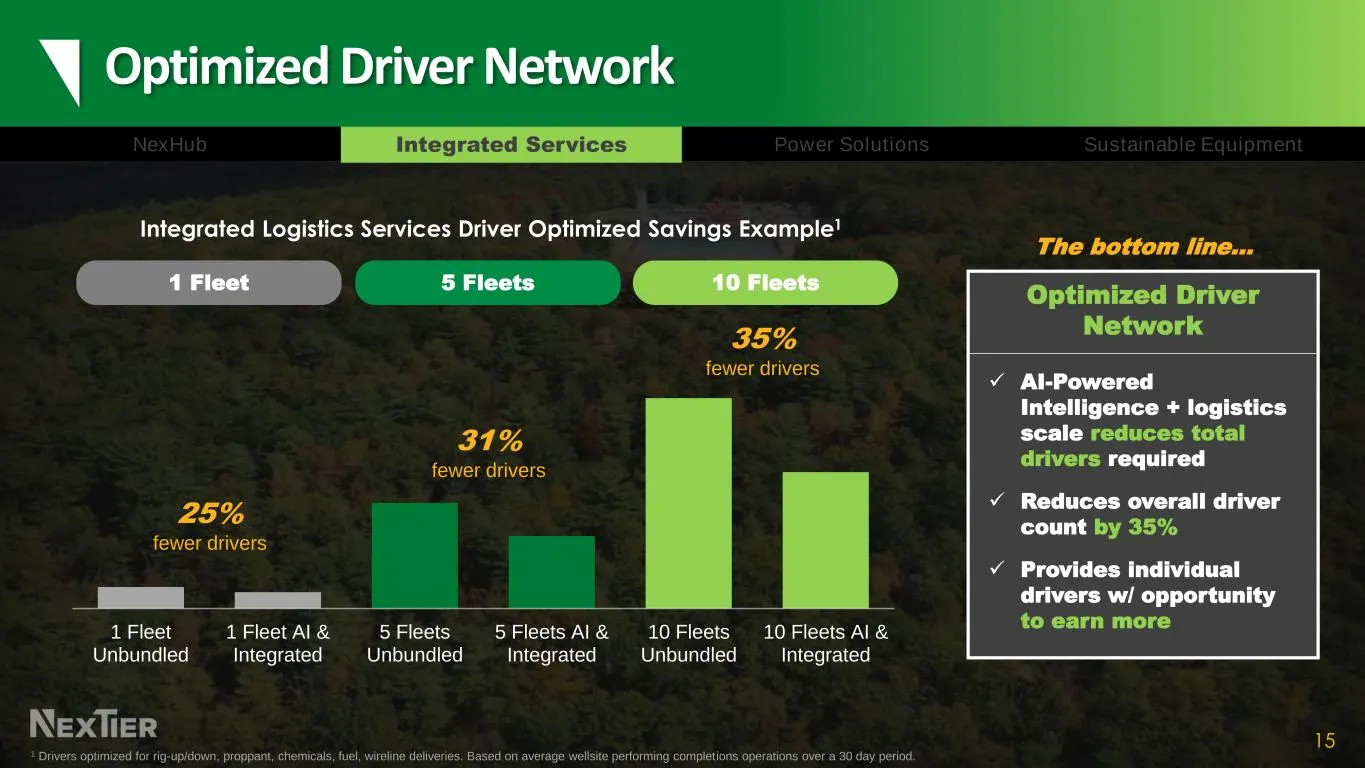
Slide 15: Optimized Driver Network
Optimized Driver Network 15 Optimized Driver Network ✓ AI-Powered Intelligence + logistics scale reduces total drivers required ✓ Reduces overall driver count by 35% ✓ Provides individual drivers w/ opportunity to earn more 1 Fleet Unbundled 1 Fleet AI & Integrated 5 Fleets Unbundled 5 Fleets AI & I
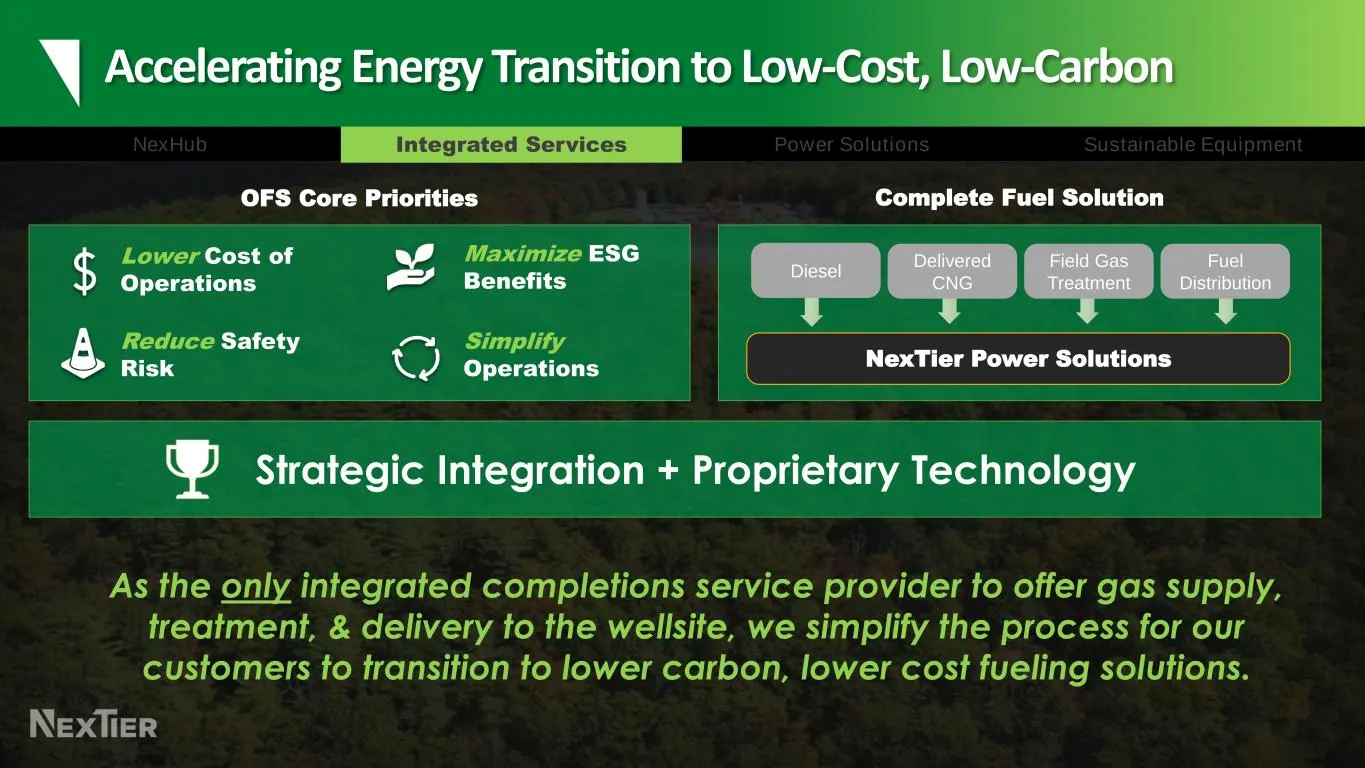
Slide 16: Accelerating Energy Transition to Low-Cost, Low-Carbon
Accelerating Energy Transition to Low-Cost, Low-Carbon Lower Cost of Operations Reduce Safety Risk Maximize ESG Benefits Simplify Operations OFS Core Priorities NexTier Power Solutions Diesel Delivered CNG Field Gas Treatment Fuel Distribution Complete Fuel Solution NexHub Sustainable EquipmentPower
Slide 17: NexTier CNG & Field Gas Treatment Technology
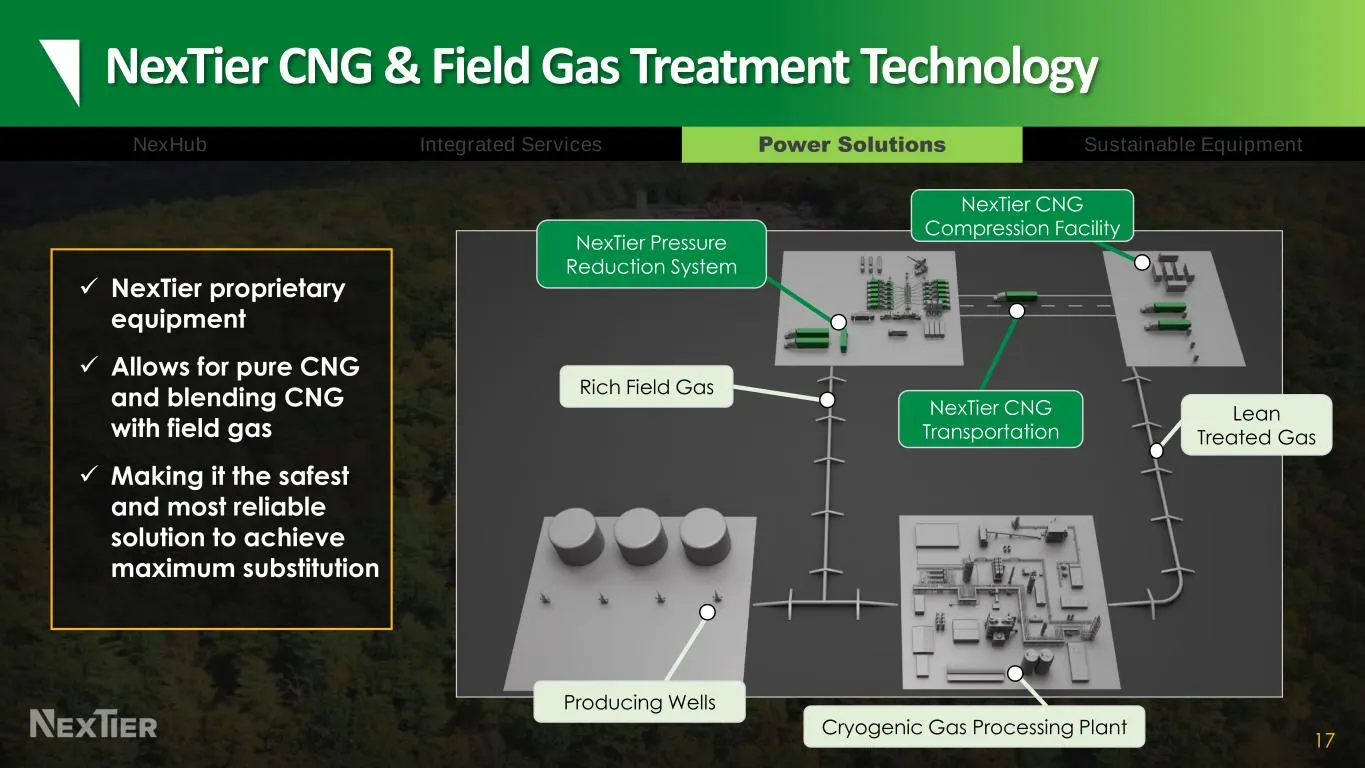
NexTier CNG & Field Gas Treatment Technology 17 ✓ NexTier proprietary equipment ✓ Allows for pure CNG and blending CNG with field gas ✓ Making it the safest and most reliable solution to achieve maximum substitution Lean Treated Gas Cryogenic Gas Processing Plant Producing Wells Rich Field Gas NexTi
Slide 18: Power Solutions Goals Are Aligned With Our Customers
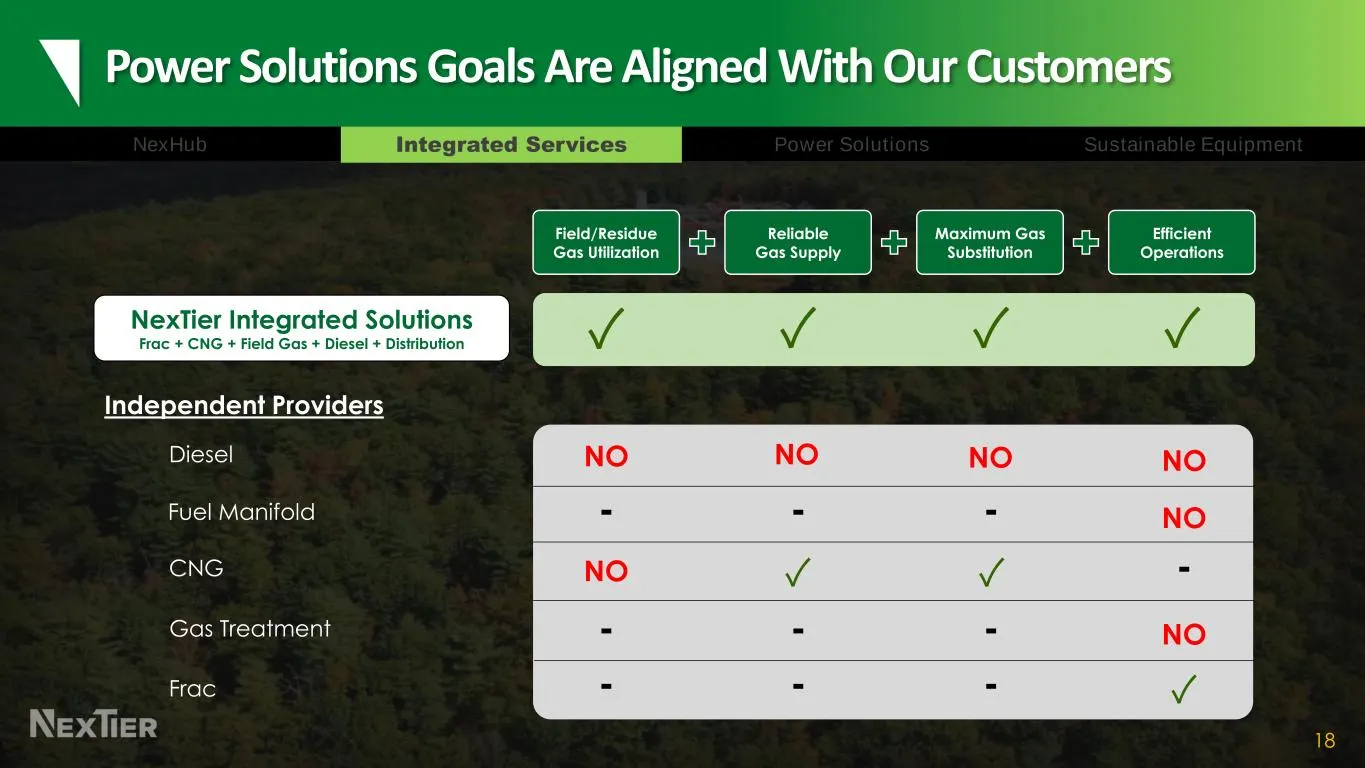
Power Solutions Goals Are Aligned With Our Customers 18 NexHub Sustainable EquipmentPower SolutionsIntegrated Services Independent Providers Reliable Gas Supply Maximum Gas Substitution Field/Residue Gas Utilization Efficient Operations Fuel Manifold - - - NO Gas Treatment - - - NO Frac - - - Diesel
Slide 19: Integrated Power Solutions vs Independent Fuel-Related Vendors
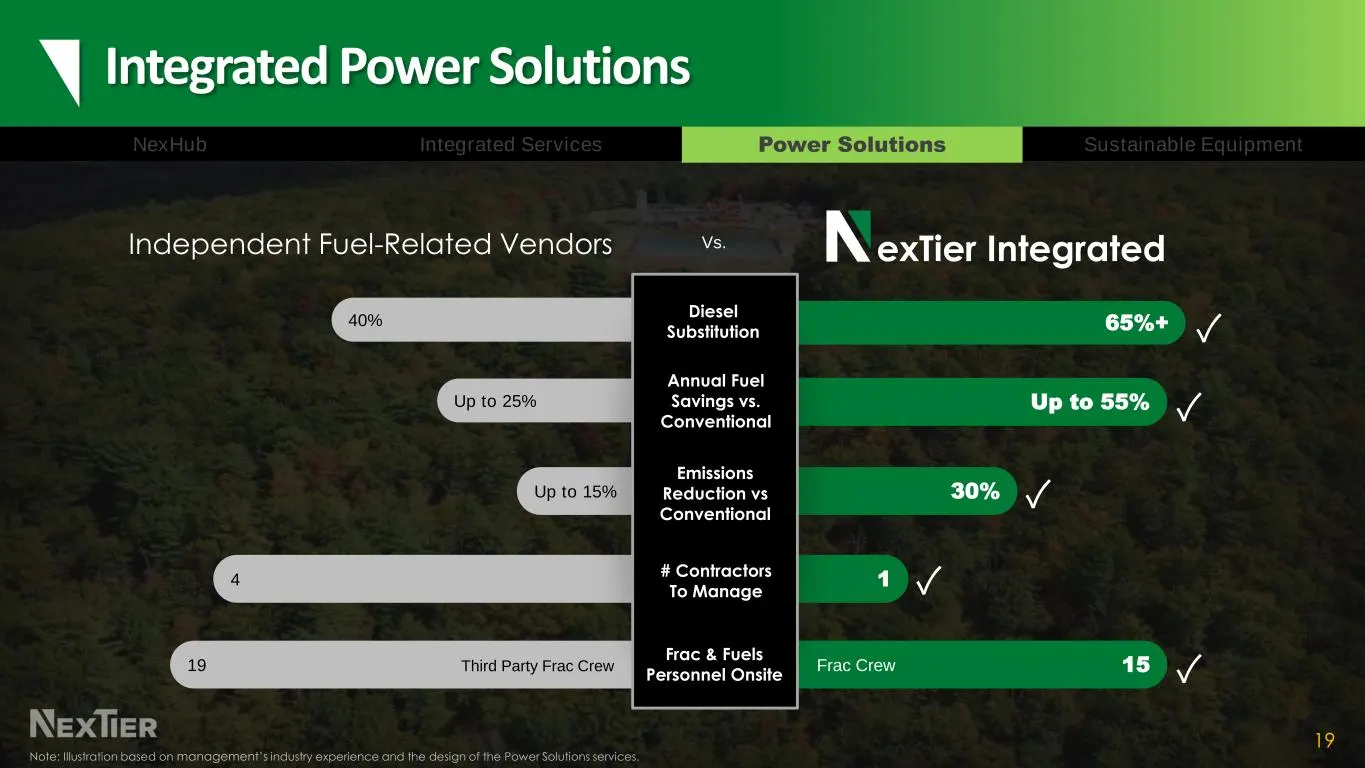
Integrated Power Solutions 19 Independent Fuel-Related Vendors Up to 55% Up to 15% 30% 19 15 14 Up to 25% 40% 65%+ Diesel Substitution Annual Fuel Savings vs. Conventional Frac & Fuels Personnel Onsite # Contractors To Manage Emissions Reduction vs Conventional exTier Integrated Third Party Frac Cre
Slide 20: Demand for Gas-Powered Frac Fleets
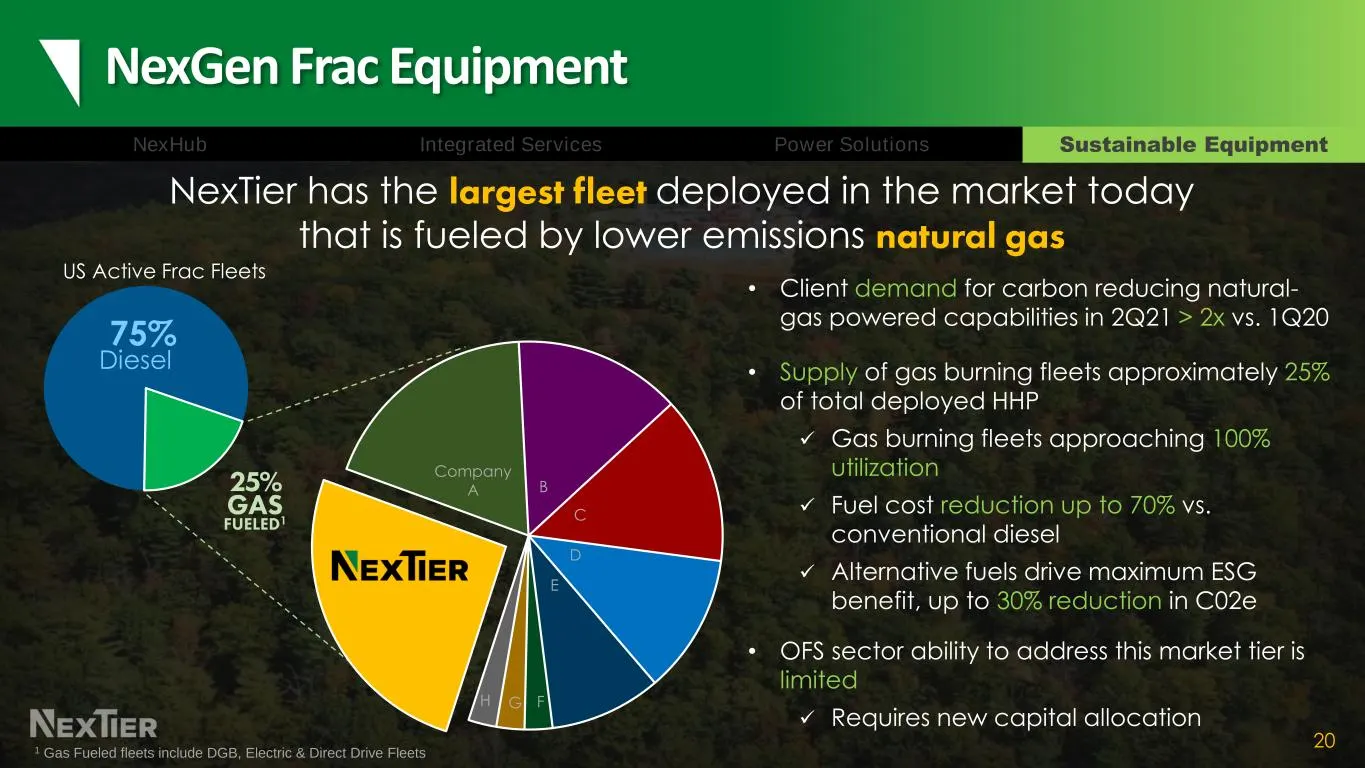
Diesel US Active Frac Fleets NexGen Frac Equipment 20 • Client demand for carbon reducing natural- gas powered capabilities in 2Q21 > 2x vs. 1Q20 • Supply of gas burning fleets approximately 25% of total deployed HHP ✓ Gas burning fleets approaching 100% utilization ✓ Fuel cost reduction up to 70% v
Slide 21: Multiple NexTier NexGen Frac Market Entries
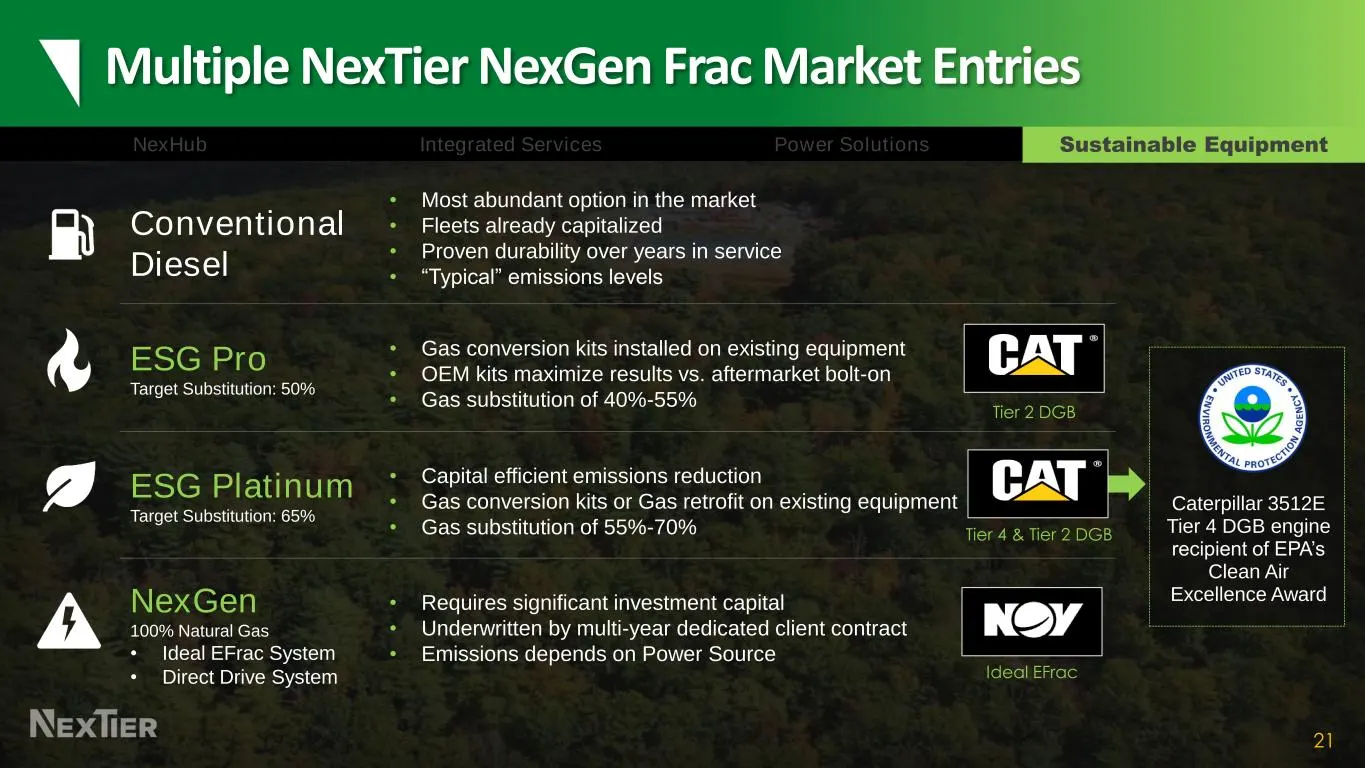
Multiple NexTier NexGen Frac Market Entries 21 Conventional Diesel • Most abundant option in the market • Fleets already capitalized • Proven durability over years in service • “Typical” emissions levels ESG Pro Target Substitution: 50% • Gas conversion kits installed on existing equipment • OEM kit
Slide 22: NexGen Frac Development Strategy
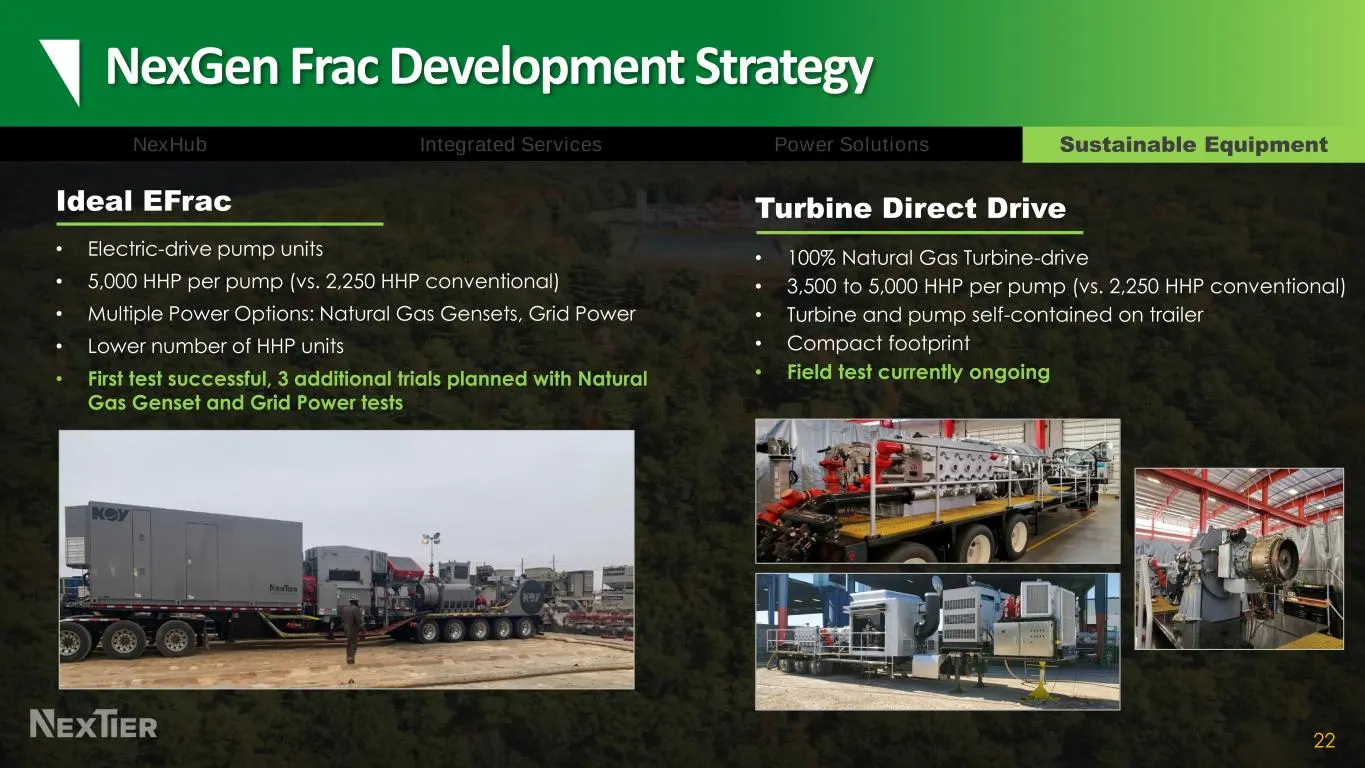
NexGen Frac Development Strategy 22 Turbine Direct Drive • 100% Natural Gas Turbine-drive • 3,500 to 5,000 HHP per pump (vs. 2,250 HHP conventional) • Turbine and pump self-contained on trailer • Compact footprint • Field test currently ongoing Ideal EFrac • Electric-drive pump units • 5,000 HHP per
Slide 23: NEX Differentiation Ambition
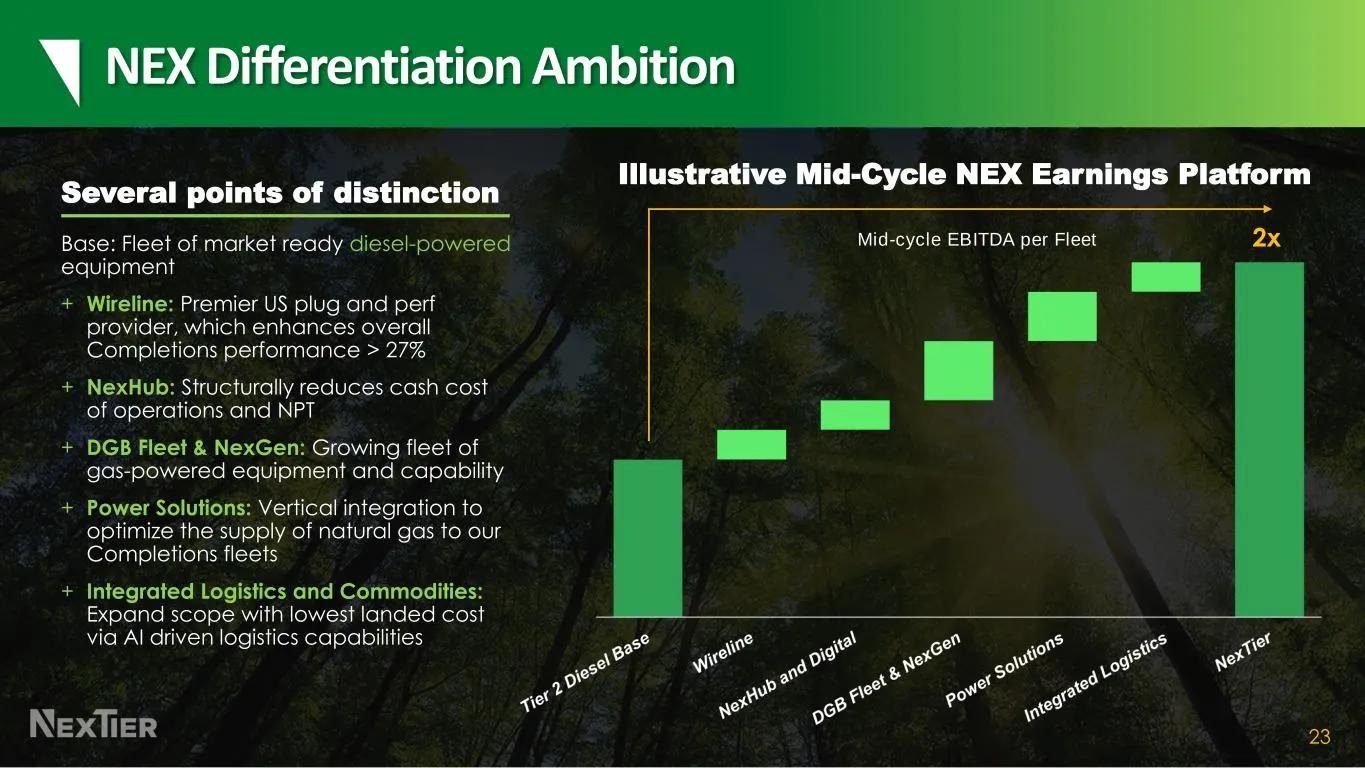
23 NEX Differentiation Ambition 2x Several points of distinction Base: Fleet of market ready diesel-powered equipment + Wireline: Premier US plug and perf provider, which enhances overall Completions performance > 27% + NexHub: Structurally reduces cash cost of operations and NPT + DGB Fleet & NexGe
Slide 24: Compelling Valuation on Earnings Potential
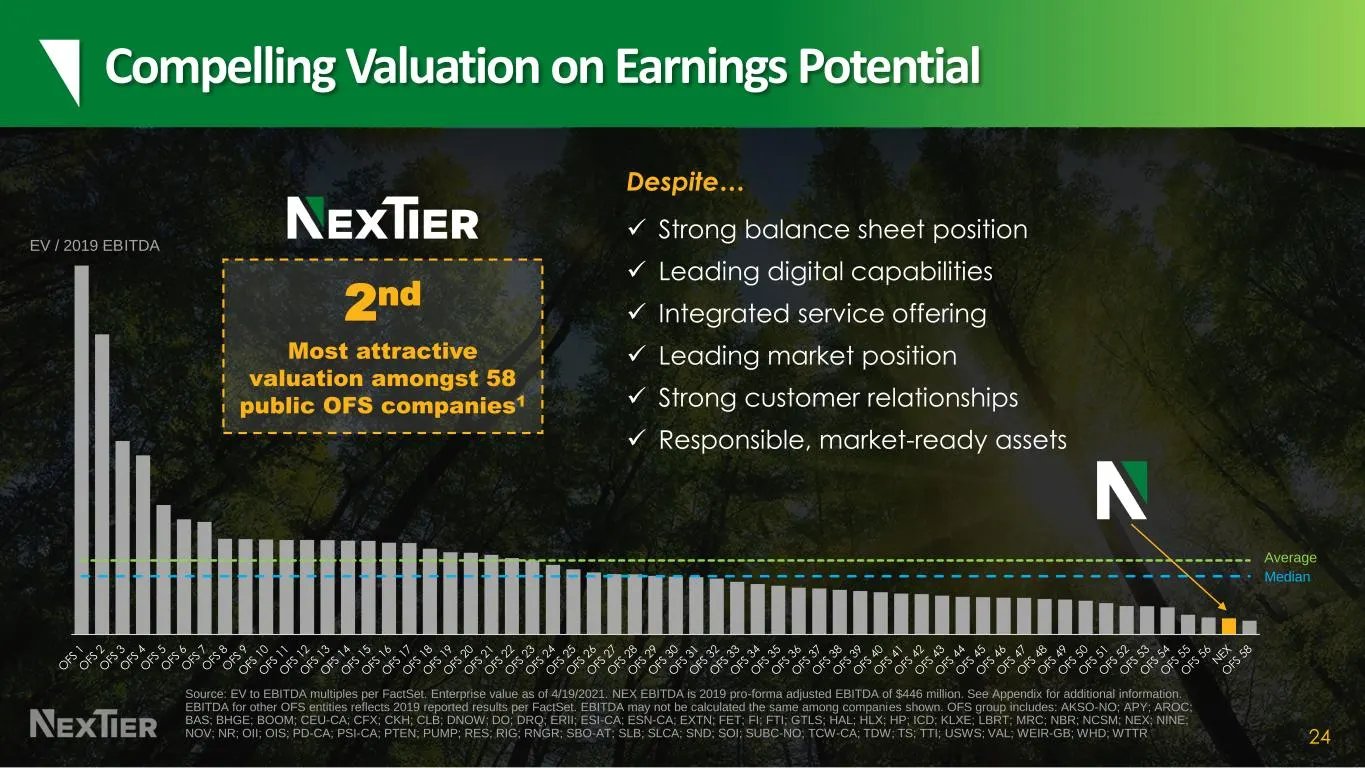
24 Compelling Valuation on Earnings Potential 2nd Most attractive valuation amongst 58 public OFS companies1 Despite… ✓ Strong balance sheet position ✓ Leading digital capabilities ✓ Integrated service offering ✓ Leading market position ✓ Strong customer relationships ✓ Responsible, market-ready ass
Slide 25: The Choice for Low-Cost, Low-Carbon Completions
25 DIGITAL ENABLERS ESG FOCUS INTEGRATED SOLUTIONS The Choice for Low-Cost, Low-Carbon Completions
Slide 26: Appendix
NeEXTIER Appendix
Slide 27: Non-GAAP Reconciliations
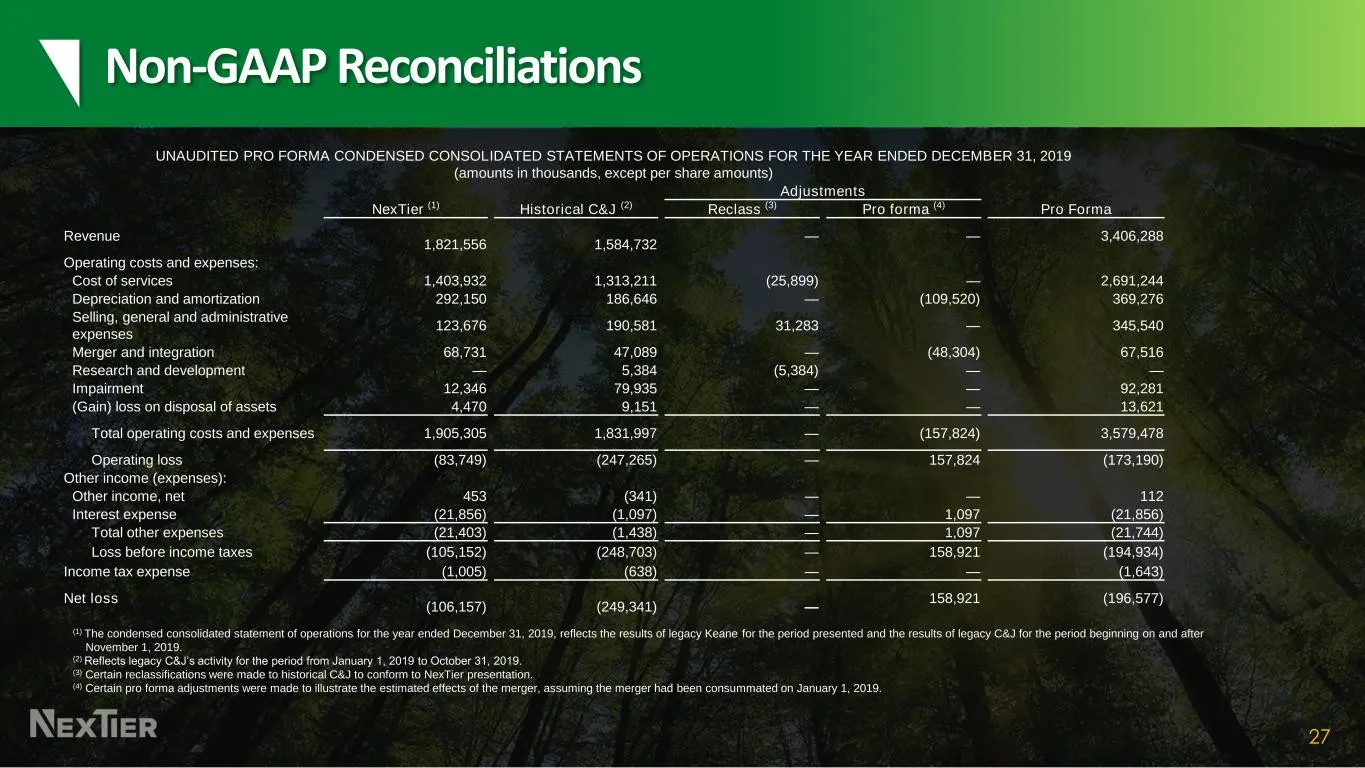
27 Non-GAAP Reconciliations UNAUDITED PRO FORMA CONDENSED CONSOLIDATED STATEMENTS OF OPERATIONS FOR THE YEAR ENDED DECEMBER 31, 2019 (amounts in thousands, except per share amounts) Adjustments NexTier (1) Historical C&J (2) Reclass (3) Pro forma (4) Pro Forma Revenue 1,821,556 1,584,732 — — 3,406,2
Slide 28: Non-GAAP Reconciliations
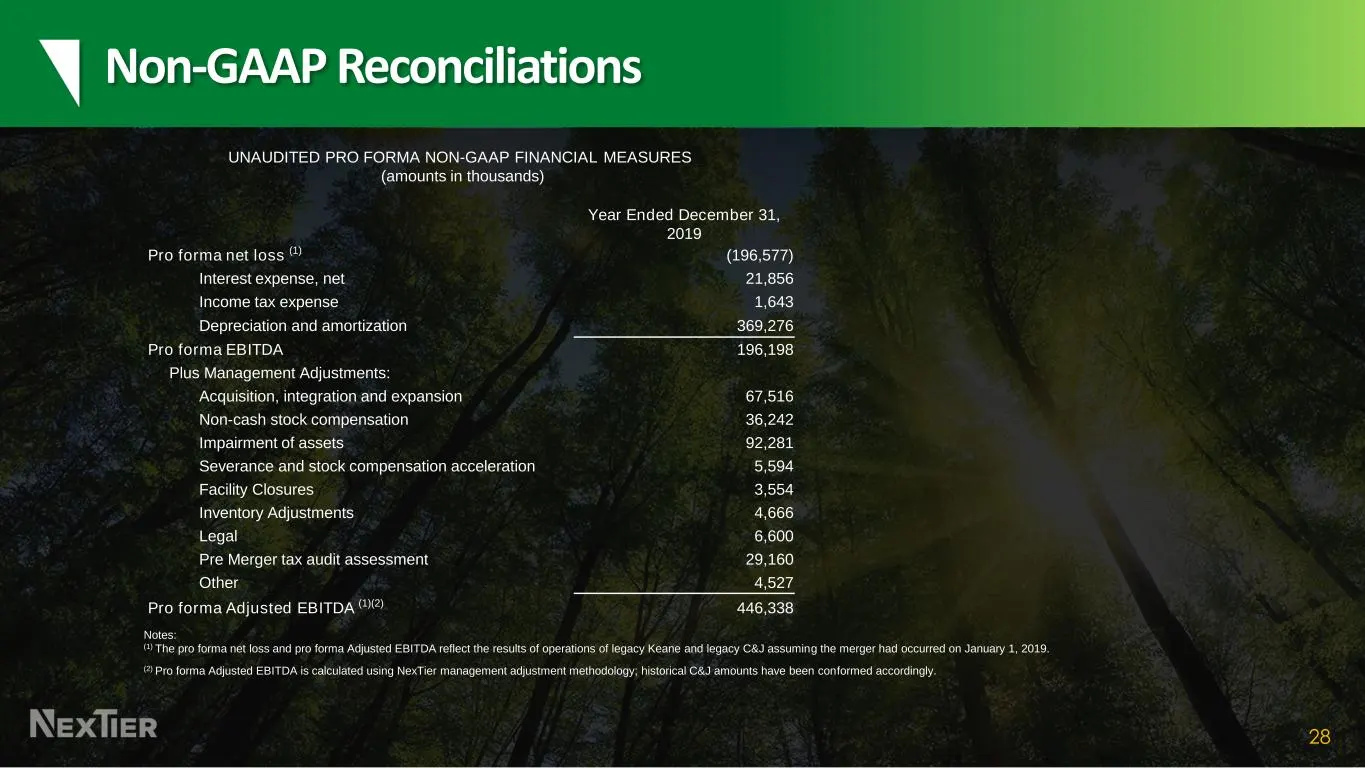
28 Non-GAAP Reconciliations Year Ended December 31, 2019 Pro forma net loss (1) (196,577) Interest expense, net 21,856 Income tax expense 1,643 Depreciation and amortization 369,276 Pro forma EBITDA 196,198 Plus Management Adjustments: Acquisition, integration and expansion 67,516 Non-cash stock com
Slide 29: NexTier
NEXTIER
Source: SEC EDGAR · 8-K filed Apr 26, 2021
More decks from NexTier Oilfield Solutions Inc
 Merger or Acquisition (July 2023)18 slides · Jul 5, 2023
 Merger or Acquisition (June 2023)18 slides · Jun 16, 2023
 Merger or Acquisition (June 2023)23 slides · Jun 15, 2023
 Shareholder Meeting (June 2023)23 slides · Jun 1, 2023
 Investor Presentation (February 2023)26 slides · Feb 15, 2023
 Investor Presentation (October 2022)28 slides · Oct 25, 2022