NexTier Oilfield Solutions Inc
NexTier Oilfield Solutions — Investor Presentation (February 2023)
26 slides from NexTier Oilfield Solutions's investor presentation, Feb 15, 2023
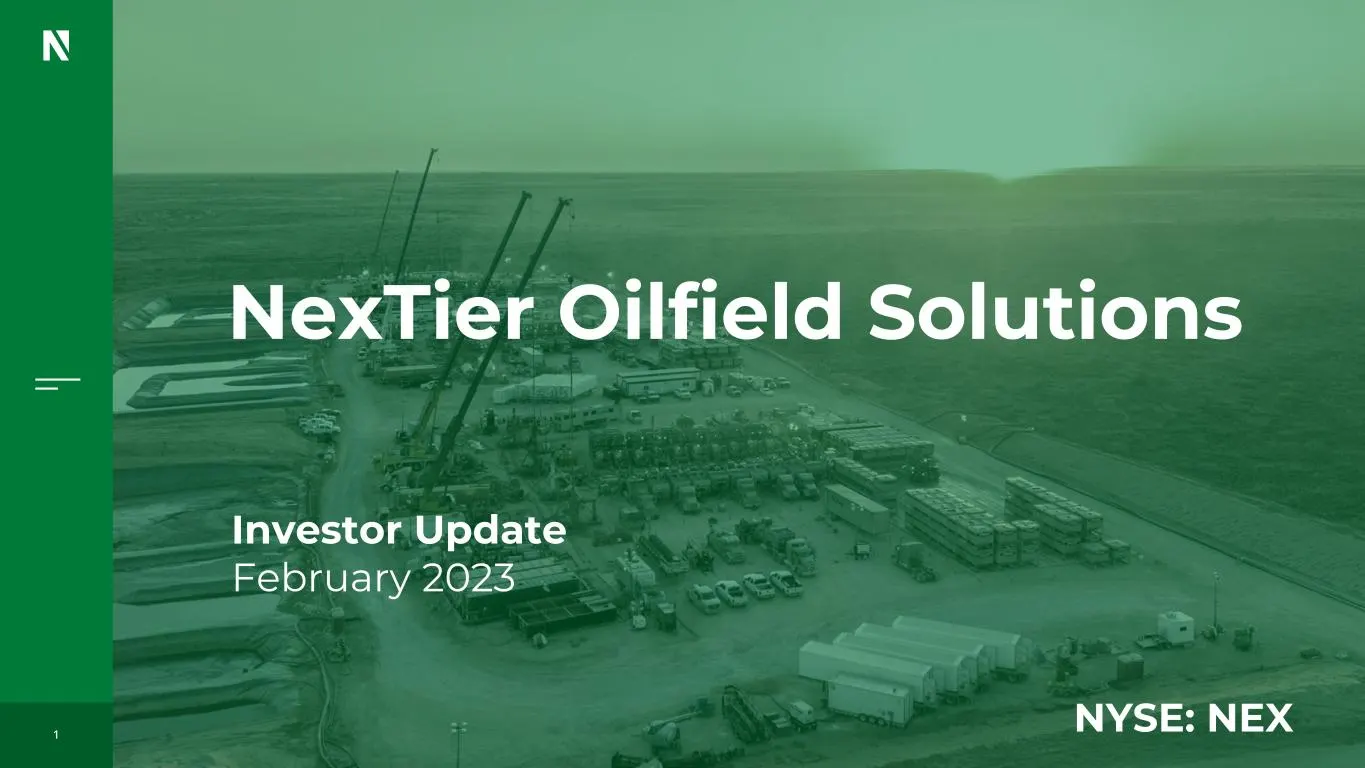
Slide 1: NexTier Oilfield Solutions Investor Update February 2023
vo o d o o 1 NexTier Oilfield Solutions NYSE: NEX Investor Update February 2023
Slide 2: Forward Looking Statements & Disclosures
2 Forward Looking Statements & Disclosures All statements other than statements of historical facts contained in this presentation and any oral statements made in connection with this presentation, including guidance for 2023 and beyond, outlook information (including with respect to the industry in
Slide 3: Non-GAAP Financial Measures
3 Non-GAAP Financial Measures We have included in this presentation and in oral comments made in connection with this presentation certain non-GAAP financial measures. These measurements provide supplemental information which management believes are useful to analysts and investors to evaluate our o
Slide 4: Introduction
4 Introduction
Slide 5: NexTier: Our History
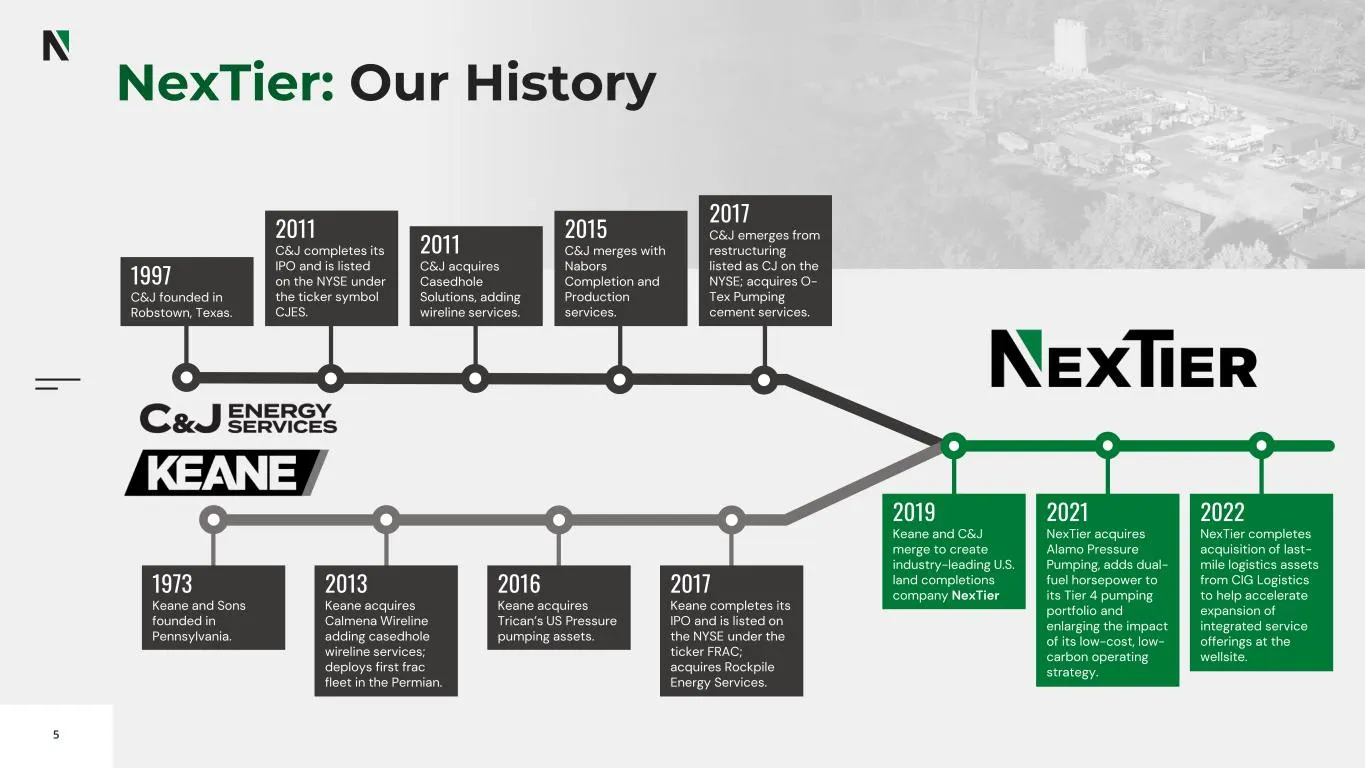
5 NexTier: Our History 1997 C&J founded in Robstown, Texas. 1973 Keane and Sons founded in Pennsylvania. 2011 C&J completes its IPO and is listed on the NYSE under the ticker symbol CJES. 2017 C&J emerges from restructuring listed as CJ on the NYSE; acquires O- Tex Pumping cement services. 2015 C&J
Slide 6: NexTier At a Glance
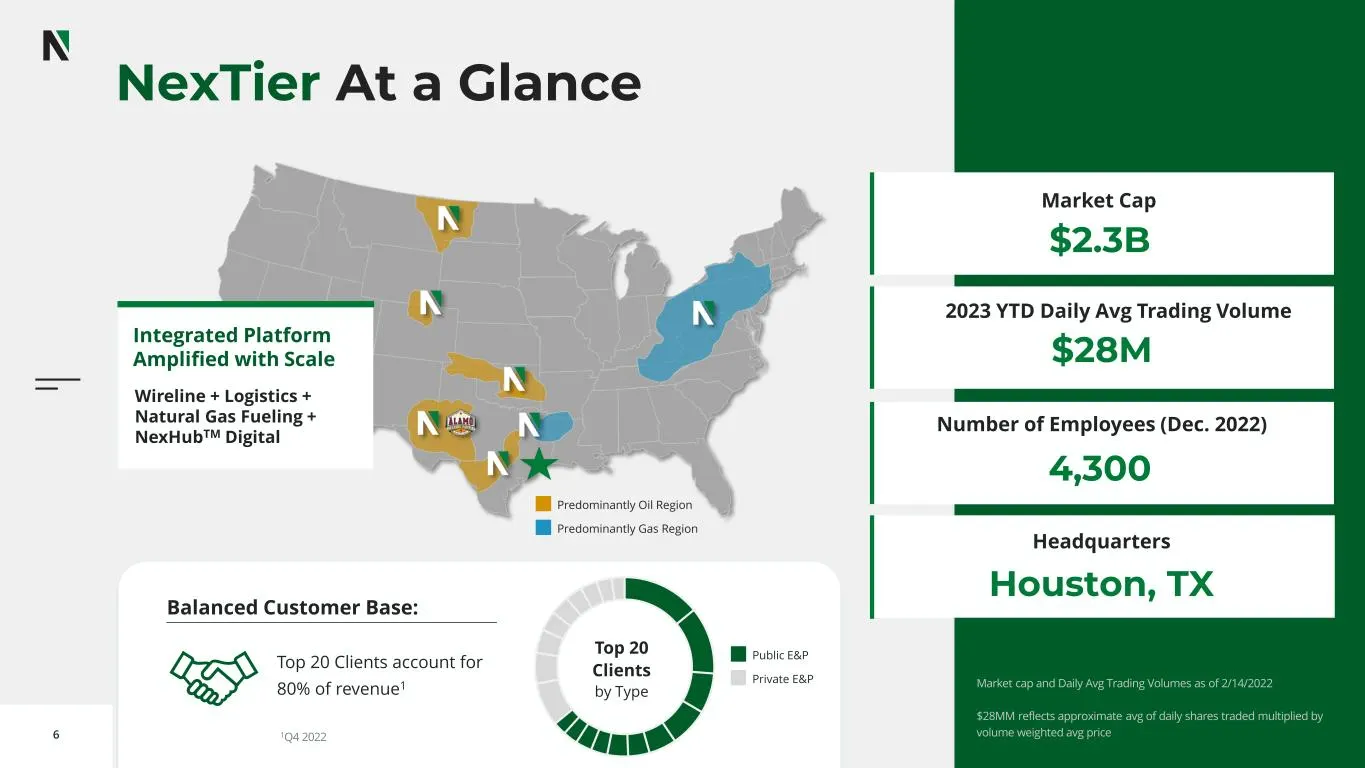
6 NexTier At a Glance Market cap and Daily Avg Trading Volumes as of 2/14/2022 $28MM reflects approximate avg of daily shares traded multiplied by volume weighted avg price $2.3B Market Cap $28M Number of Employees (Dec. 2022) 4,300 2023 YTD Daily Avg Trading Volume Houston, TX Headquarters Predomin
Slide 7: NexTier Delivered Strong Results in 2022
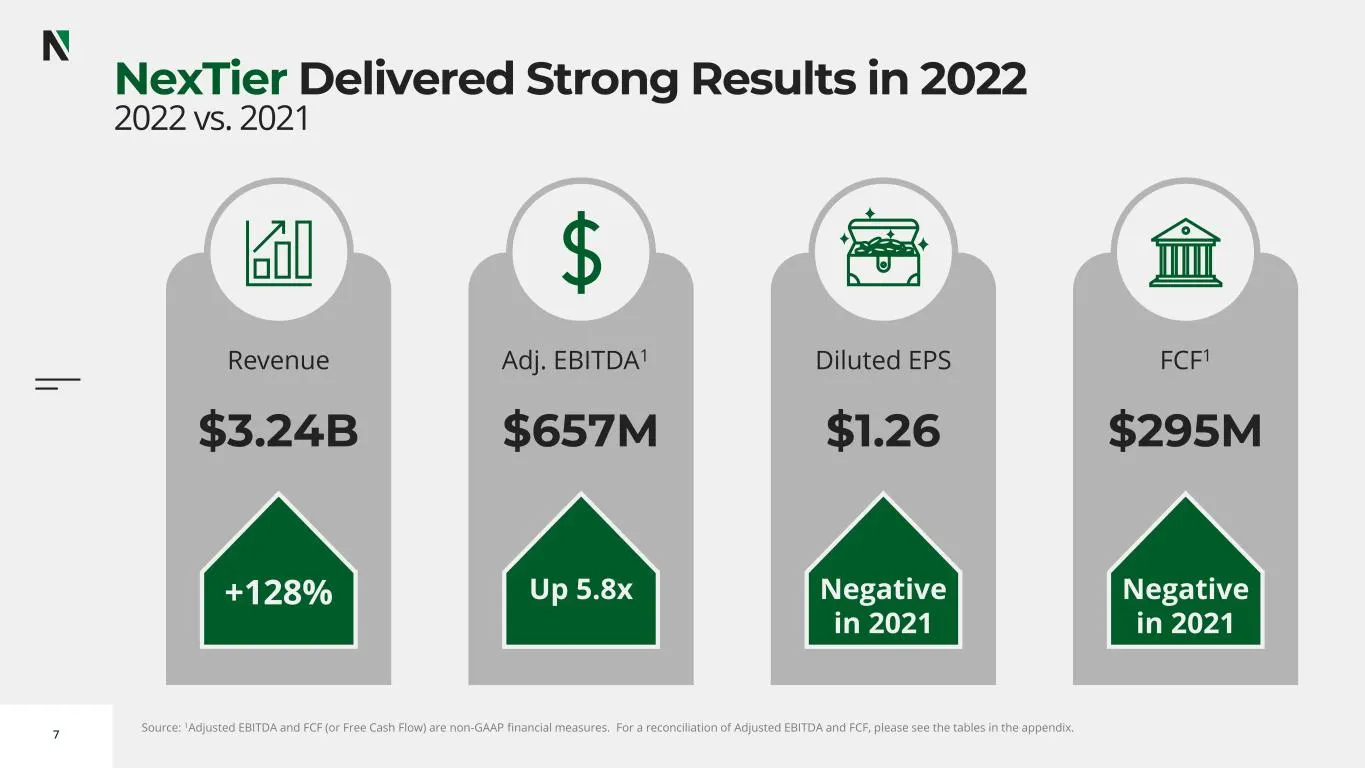
7 NexTier Delivered Strong Results in 2022 2022 vs. 2021 Revenue Adj. EBITDA1 Diluted EPS FCF1 $3.24B $657M $1.26 $295M +128% Negative in 2021 Negative in 2021 Up 5.8x Source: 1Adjusted EBITDA and FCF (or Free Cash Flow) are non-GAAP financial measures. For a reconciliation of Adjusted EBITDA and FC
Slide 8: NexTier Capital Allocation Framework
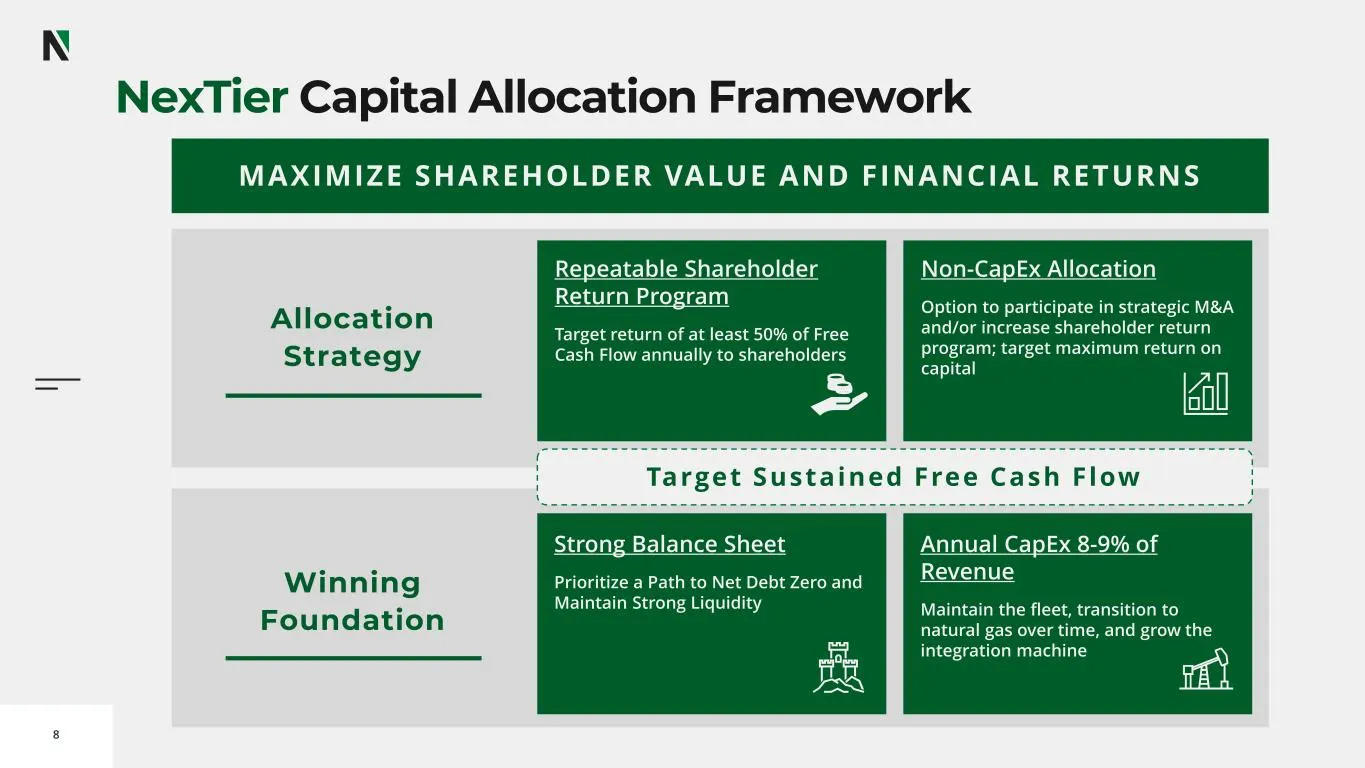
8 NexTier Capital Allocation Framework MAXIMIZE SHAREHOLDER VALUE AND FINANCIAL RETURNS Strong Balance Sheet Prioritize a Path to Net Debt Zero and Maintain Strong Liquidity Annual CapEx 8-9% of Revenue Maintain the fleet, transition to natural gas over time, and grow the integration machine Repeata
Slide 9: Investor Summary
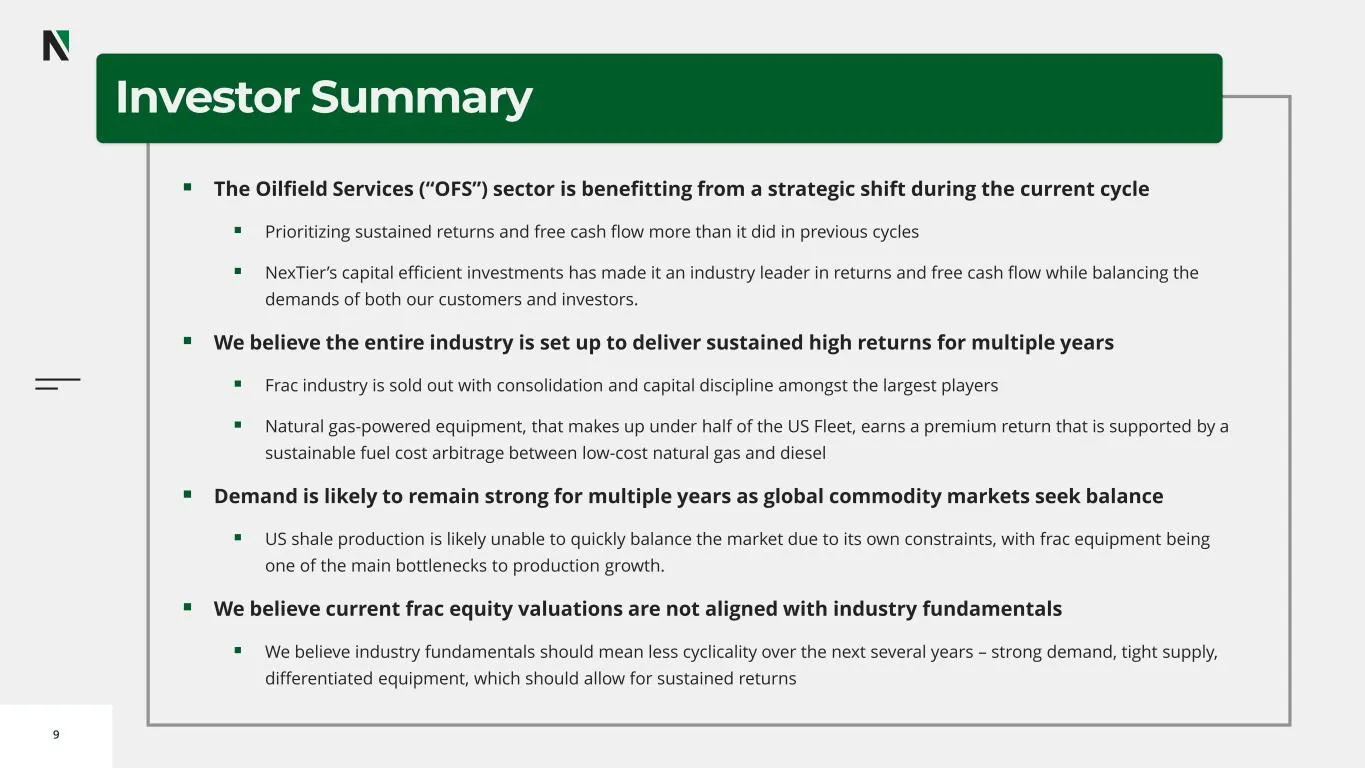
9 Investor Summary ▪ The Oilfield Services (“OFS”) sector is benefitting from a strategic shift during the current cycle ▪ Prioritizing sustained returns and free cash flow more than it did in previous cycles ▪ NexTier’s capital efficient investments has made it an industry leader in returns and fre
Slide 10: Macro Outlook: Expanded Cycle Duration
10 Macro Outlook: Expanded Cycle Duration
Slide 11: Fleet attrition and rebuild cycles tighten supply
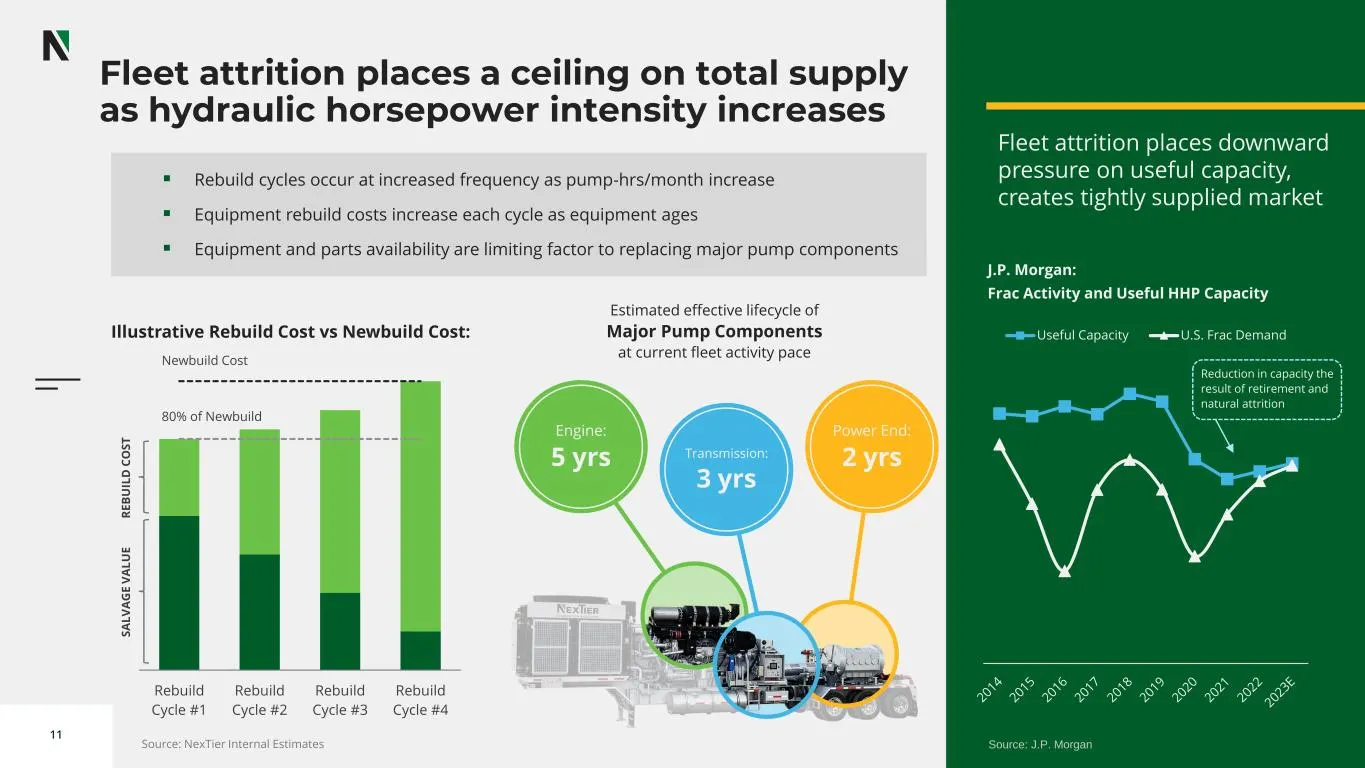
11 ▪ Rebuild cycles occur at increased frequency as pump-hrs/month increase ▪ Equipment rebuild costs increase each cycle as equipment ages ▪ Equipment and parts availability are limiting factor to replacing major pump components Fleet attrition places downward pressure on useful capacity, creates t
Slide 12: U.S. Shale Total Frac Fleet Market Bifurcation
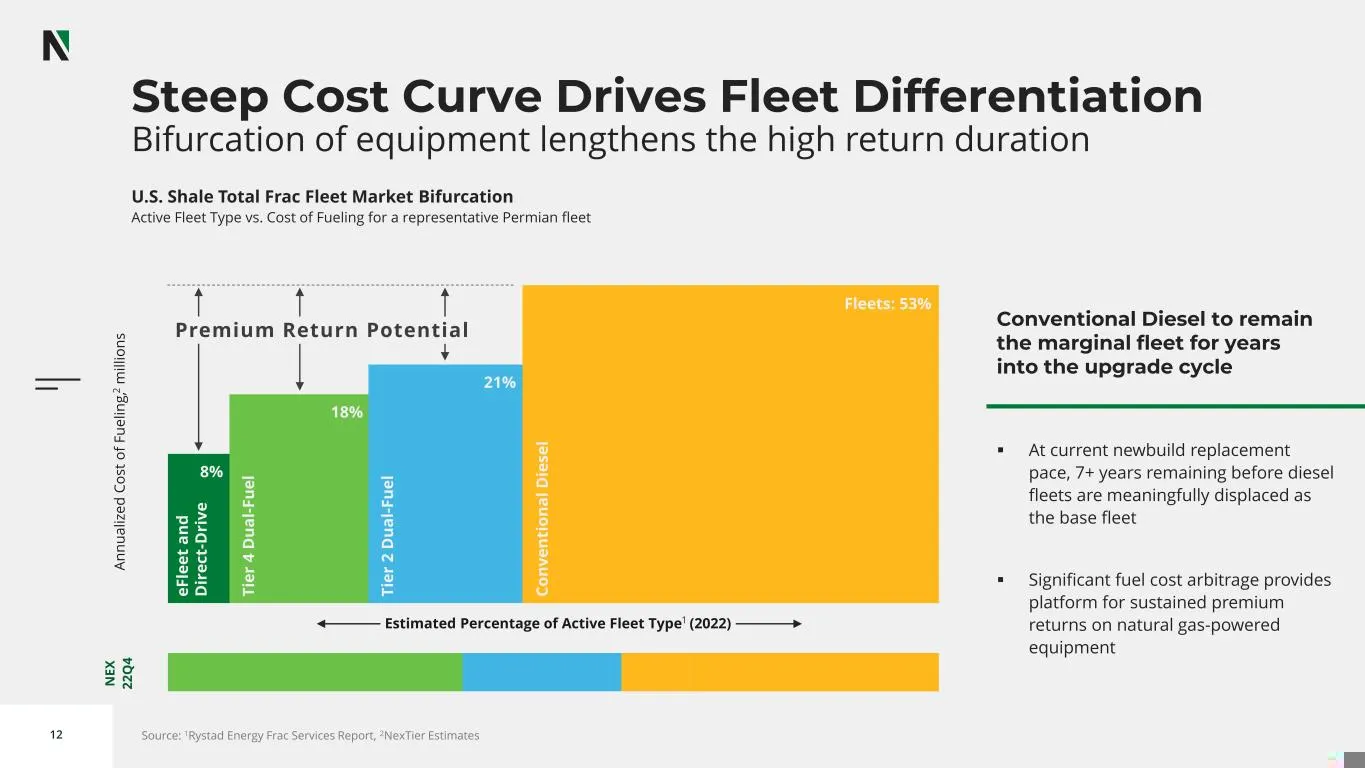
12 U.S. Shale Total Frac Fleet Market Bifurcation Active Fleet Type vs. Cost of Fueling for a representative Permian fleet Steep Cost Curve Drives Fleet Differentiation Bifurcation of equipment lengthens the high return duration Conventional Diesel to remain the marginal fleet for years into the upg
Slide 13: OFS: Take Another Look A Durable Returns Cycle
13 OFS: Take Another Look A Durable Returns Cycle
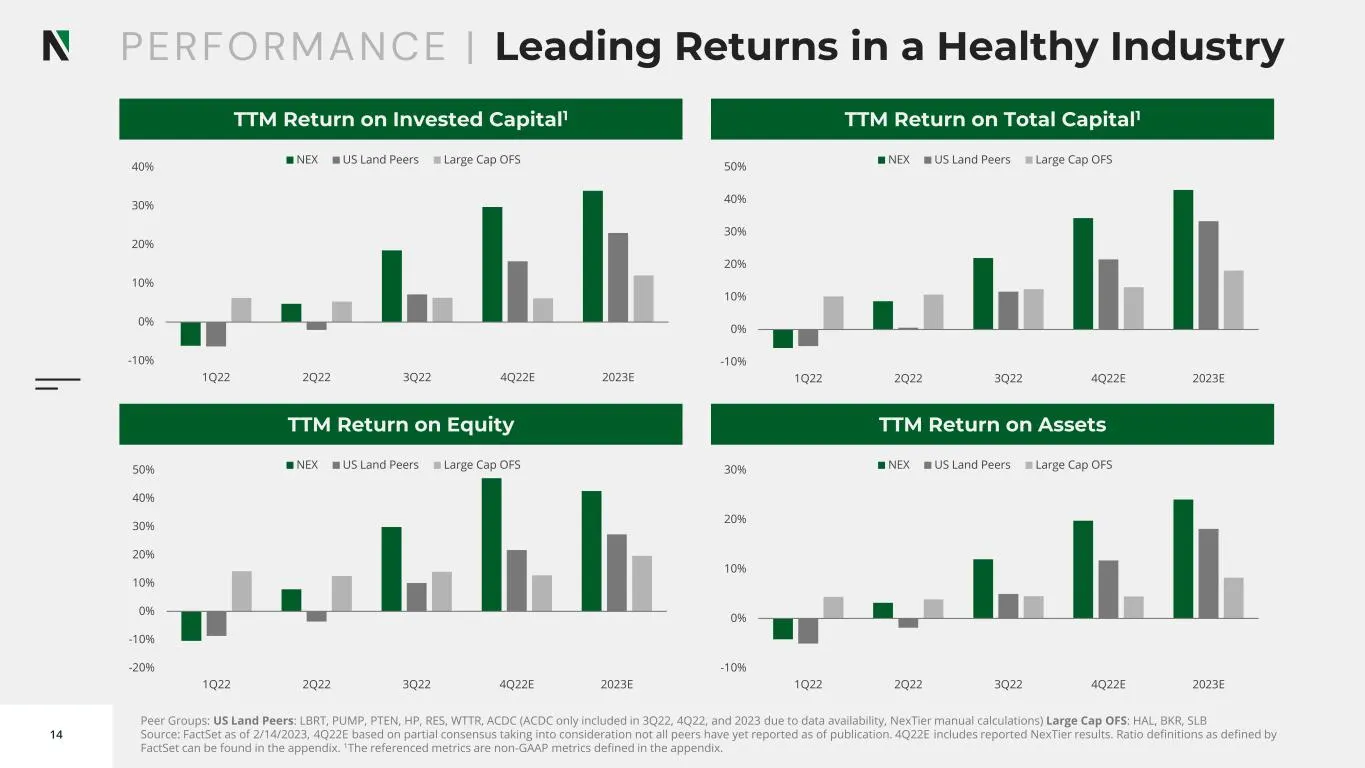
Slide 14: Peer Groups: Leading Returns
14 Peer Groups: US Land Peers: LBRT, PUMP, PTEN, HP, RES, WTTR, ACDC (ACDC only included in 3Q22, 4Q22, and 2023 due to data availability, NexTier manual calculations) Large Cap OFS: HAL, BKR, SLB Source: FactSet as of 2/14/2023, 4Q22E based on partial consensus taking into consideration not all pee
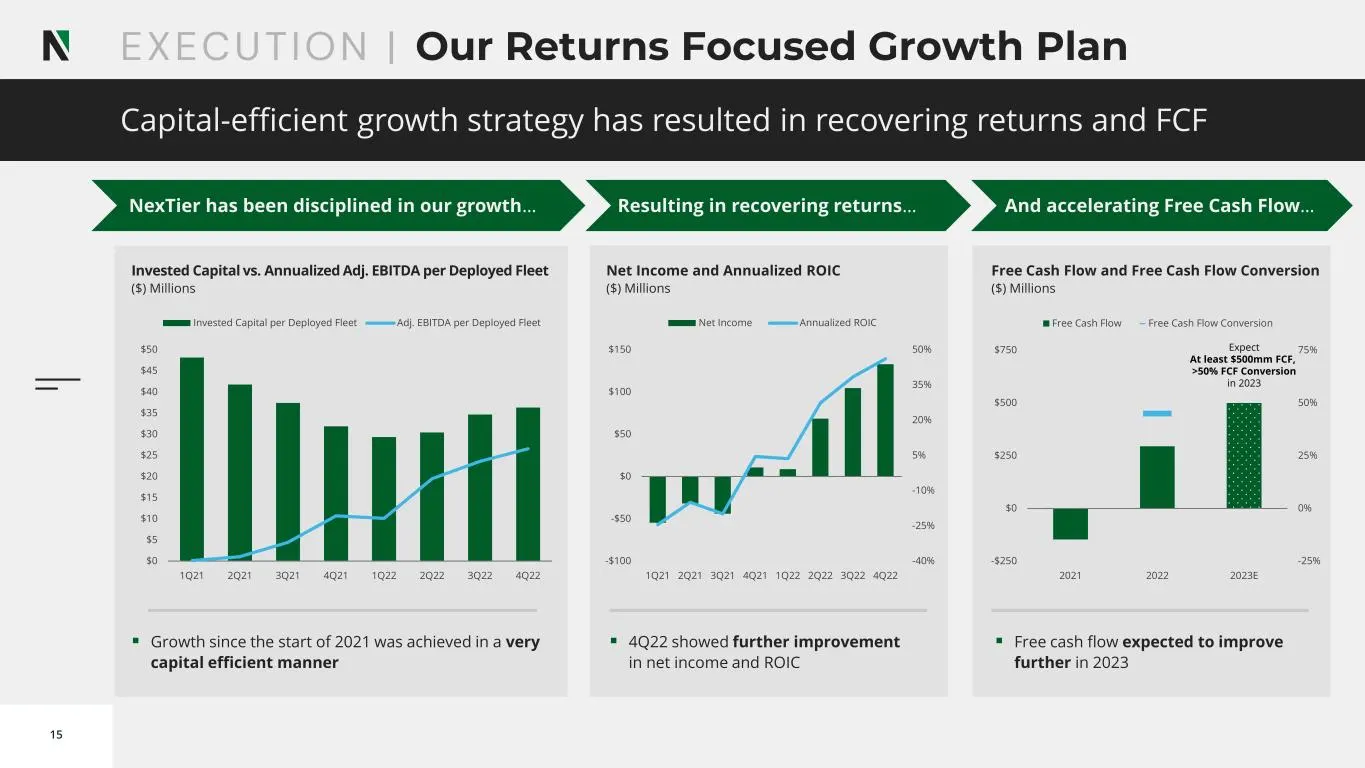
Slide 15: Our Returns Focused Growth Plan
15 ▪ Growth since the start of 2021 was achieved in a very capital efficient manner Invested Capital vs. Annualized Adj. EBITDA per Deployed Fleet ($) Millions ▪ 4Q22 showed further improvement in net income and ROIC Net Income and Annualized ROIC ($) Millions ▪ Free cash flow expected to improve fu
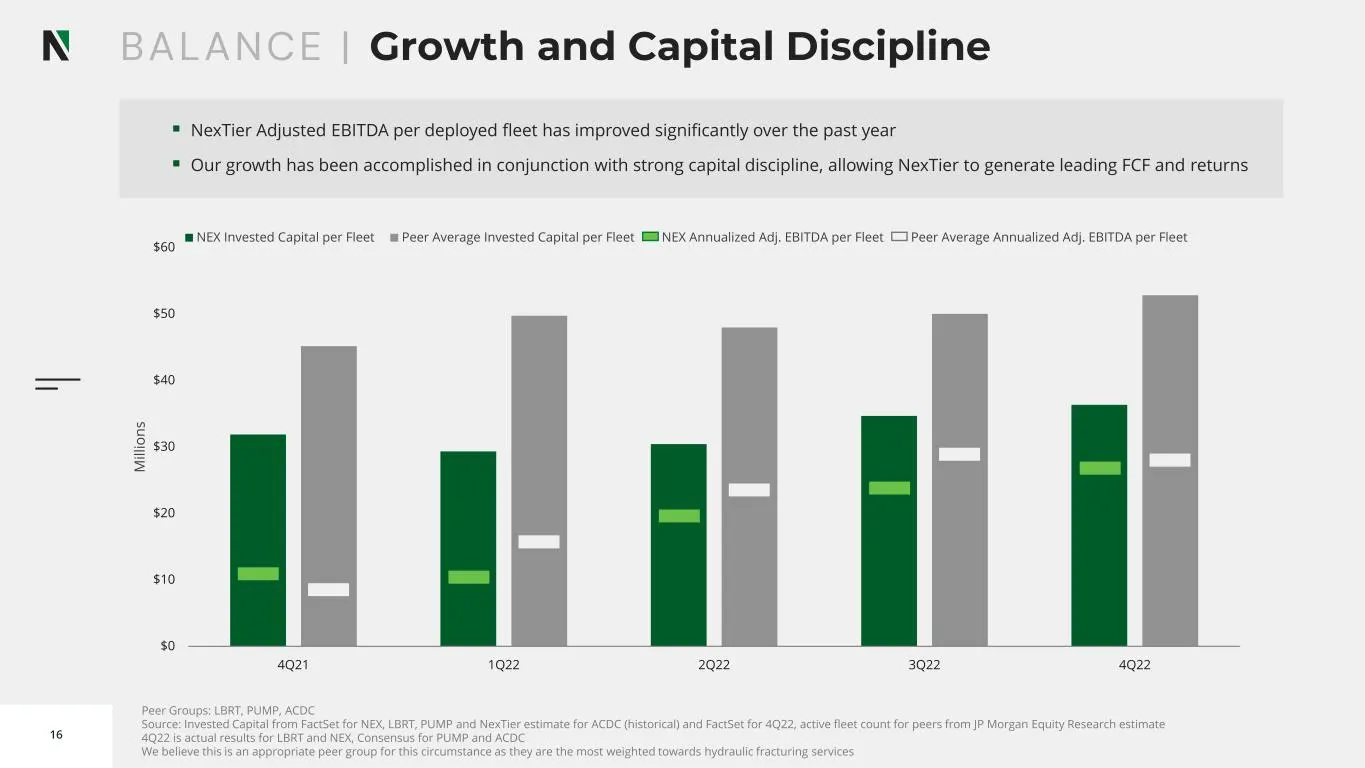
Slide 16: Growth and Capital Discipline
16 $0 $10 $20 $30 $40 $50 $60 4Q21 1Q22 2Q22 3Q22 4Q22 M il li o n s NEX Invested Capital per Fleet Peer Average Invested Capital per Fleet NEX Annualized Adj. EBITDA per Fleet Peer Average Annualized Adj. EBITDA per Fleet Peer Groups: LBRT, PUMP, ACDC Source: Invested Capital from FactSet for NEX,
Slide 17: 2023E Free Cash Flow Yield
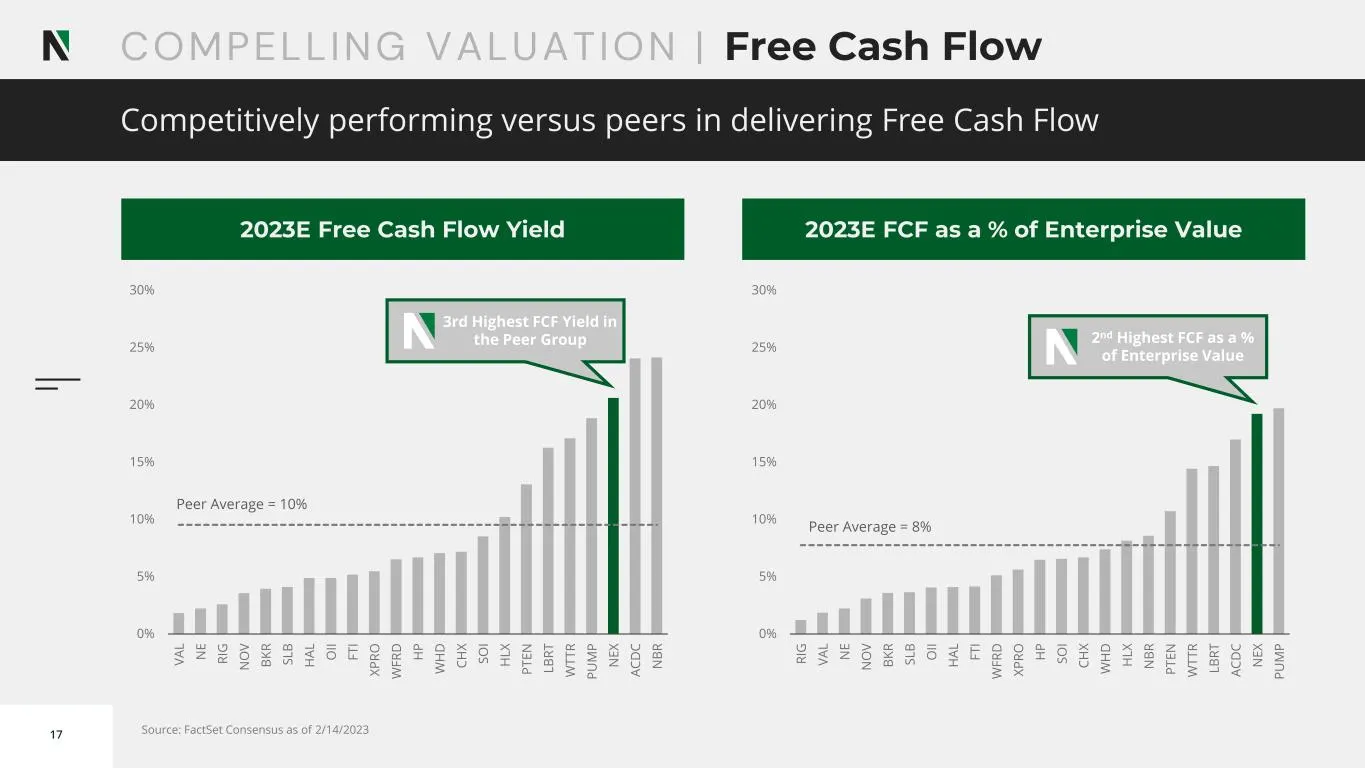
17 2023E Free Cash Flow Yield 2023E FCF as a % of Enterprise Value Peer Average = 10% Peer Average = 8% Source: FactSet Consensus as of 2/14/2023 0% 5% 10% 15% 20% 25% 30% V A L N E R IG N O V B K R S L B H A L O II F T I X P R O W F R D H P W H D C H X S O I H L X P T E N L B R T W T T R P U M P N
Slide 18: Price to Earnings Multiple
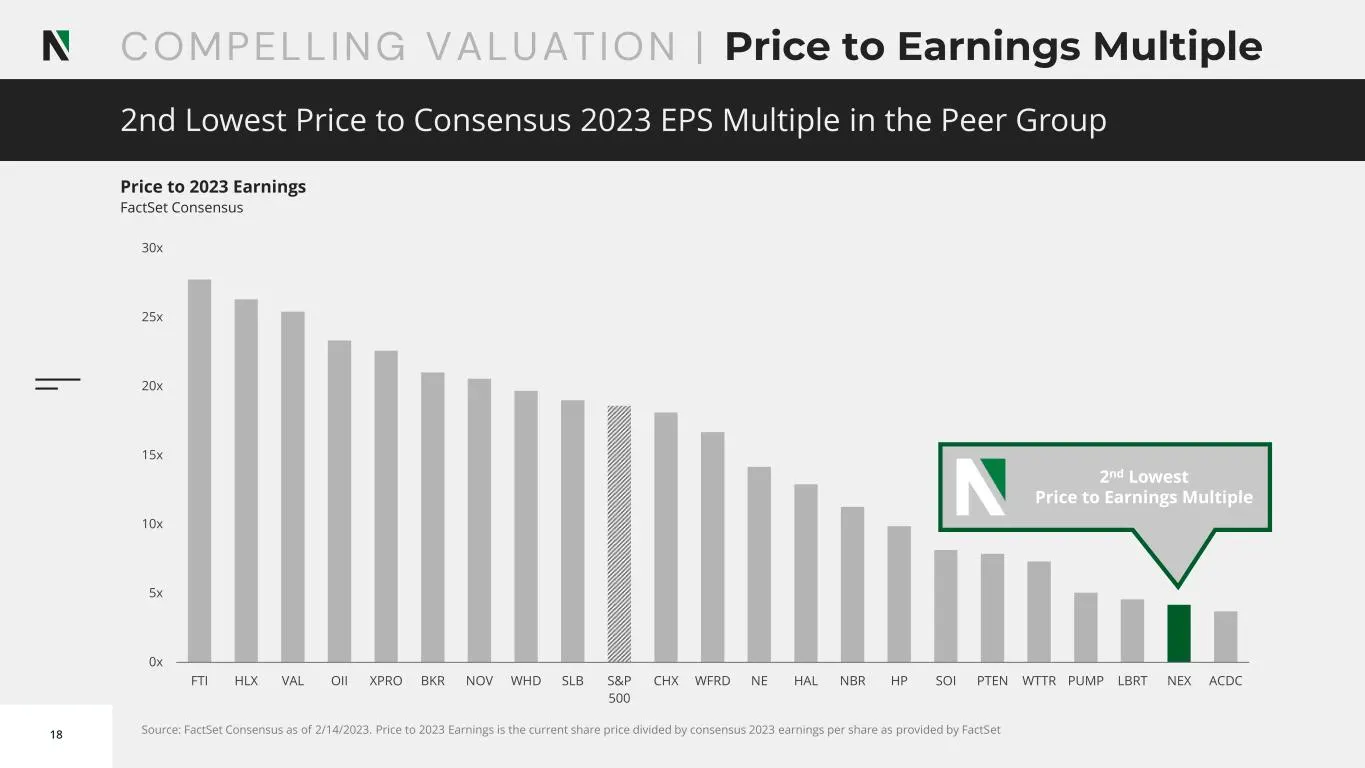
18 Source: FactSet Consensus as of 2/14/2023. Price to 2023 Earnings is the current share price divided by consensus 2023 earnings per share as provided by FactSet 0x 5x 10x 15x 20x 25x 30x FTI HLX VAL OII XPRO BKR NOV WHD SLB S&P 500 CHX WFRD NE HAL NBR HP SOI PTEN WTTR PUMP LBRT NEX ACDC COMPELLIN
Slide 19: The bottom line… Why invest with NexTier?
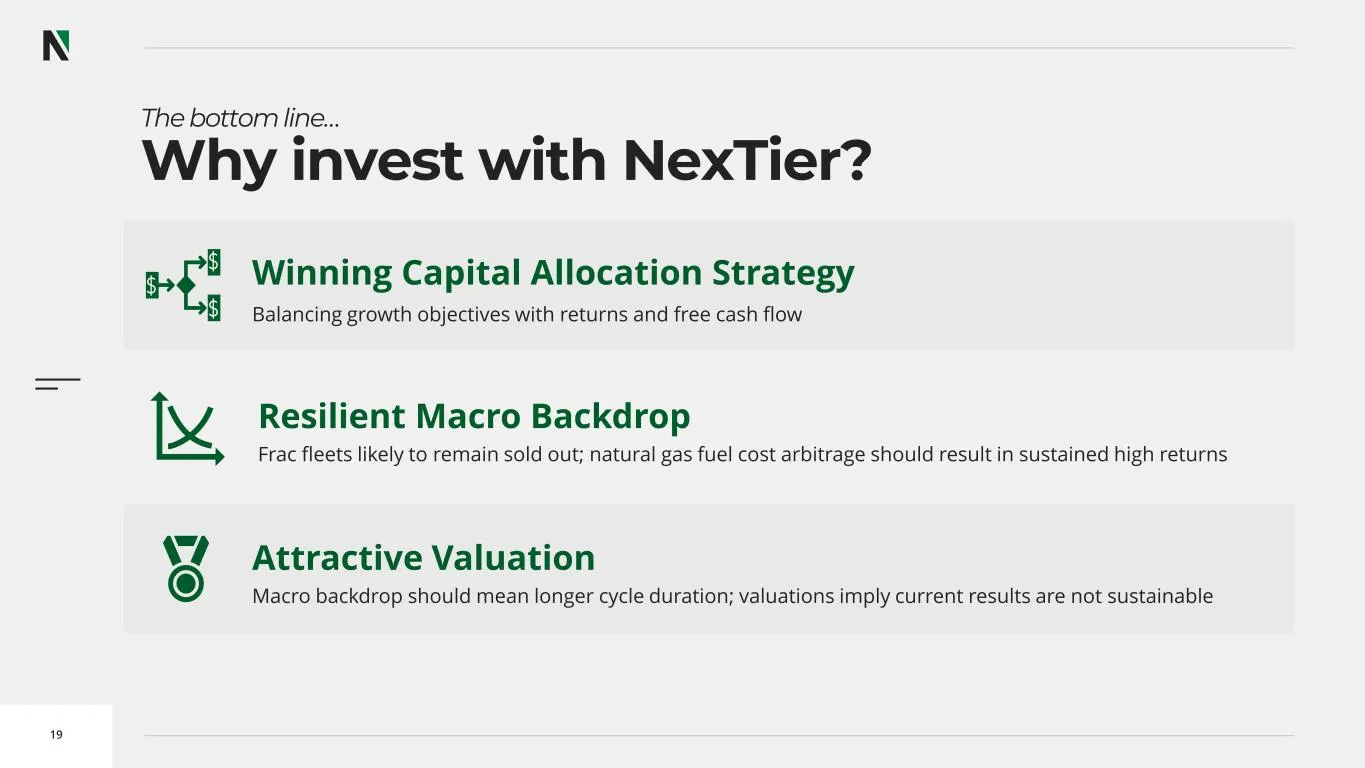
19 The bottom line… Why invest with NexTier? Resilient Macro Backdrop Frac fleets likely to remain sold out; natural gas fuel cost arbitrage should result in sustained high returns Attractive Valuation Macro backdrop should mean longer cycle duration; valuations imply current results are not sustain
Slide 20: Appendix
20 Appendix
Slide 21: Financial Returns Calculation Tables
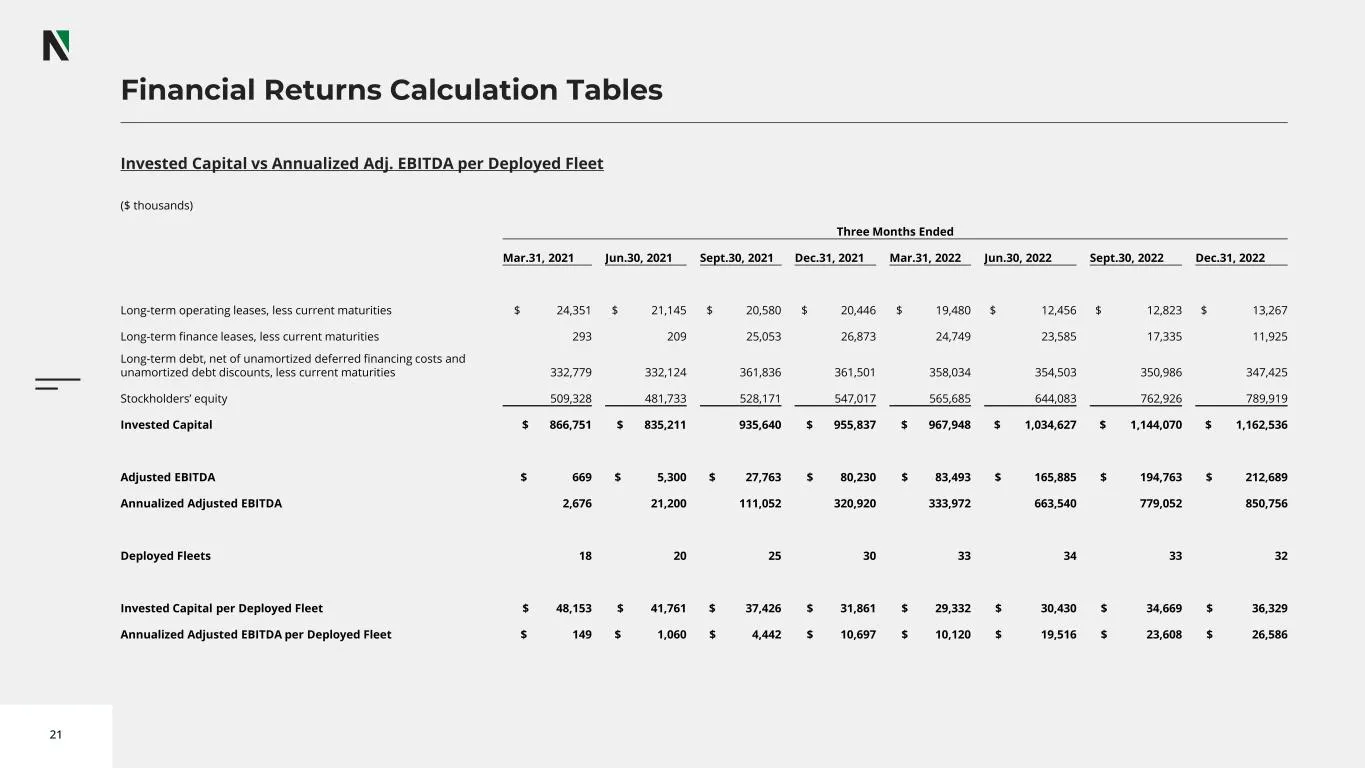
21 Financial Returns Calculation Tables Invested Capital vs Annualized Adj. EBITDA per Deployed Fleet ($ thousands) Three Months Ended Mar.31, 2021 Jun.30, 2021 Sept.30, 2021 Dec.31, 2021 Mar.31, 2022 Jun.30, 2022 Sept.30, 2022 Dec.31, 2022 Long-term operating leases, less current maturities $ 24,35
Slide 22: Financial Returns Calculation Tables
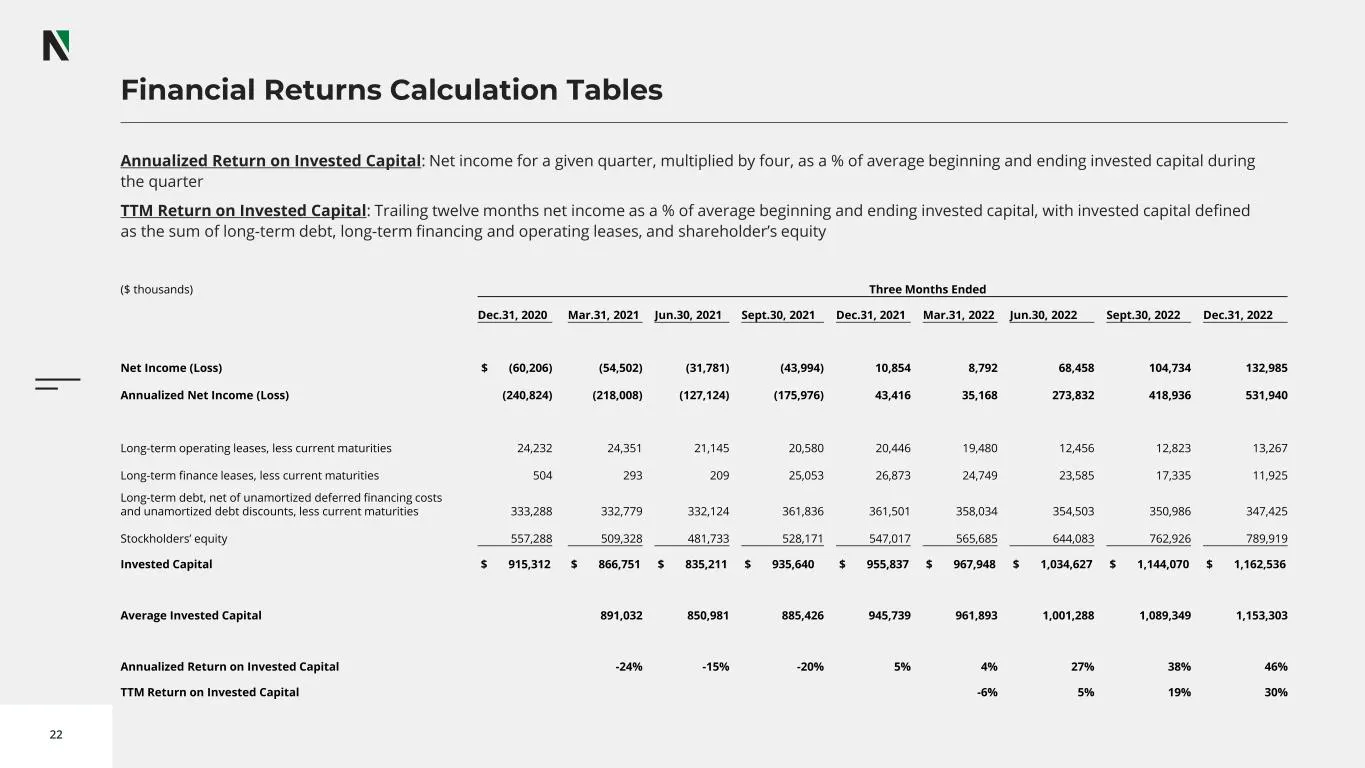
22 Financial Returns Calculation Tables Annualized Return on Invested Capital: Net income for a given quarter, multiplied by four, as a % of average beginning and ending invested capital during the quarter TTM Return on Invested Capital: Trailing twelve months net income as a % of average beginning
Slide 23: Financial Returns Calculation Tables
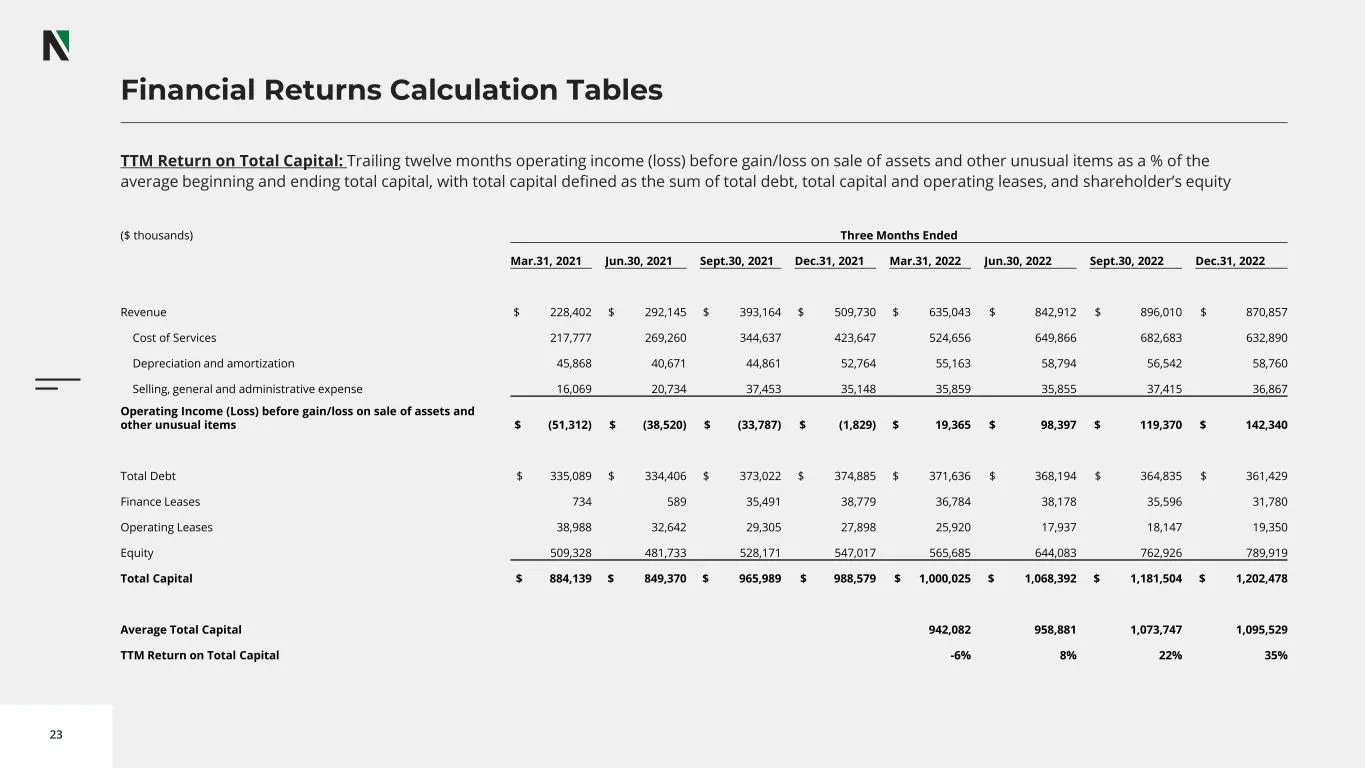
23 Financial Returns Calculation Tables TTM Return on Total Capital: Trailing twelve months operating income (loss) before gain/loss on sale of assets and other unusual items as a % of the average beginning and ending total capital, with total capital defined as the sum of total debt, total capital
Slide 24: Financial Returns Calculation Tables
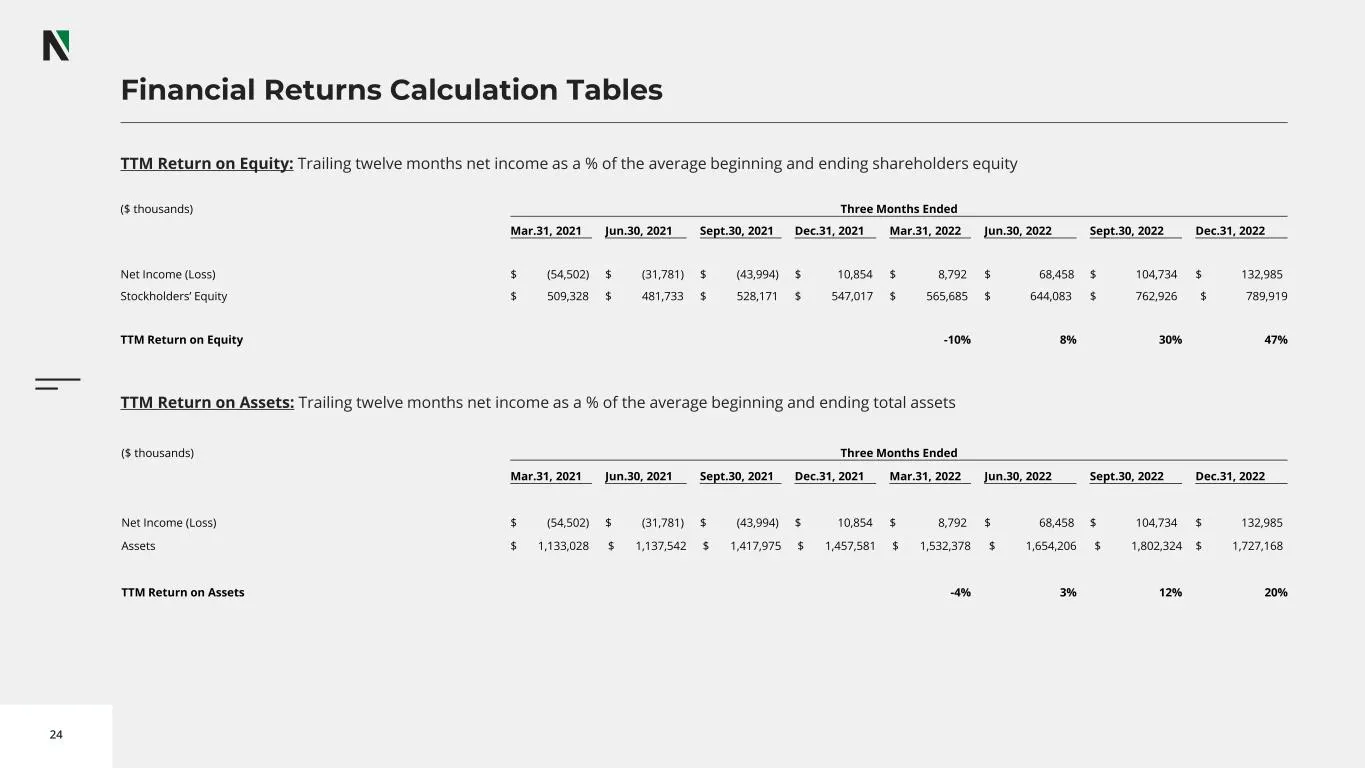
24 Financial Returns Calculation Tables TTM Return on Equity: Trailing twelve months net income as a % of the average beginning and ending shareholders equity TTM Return on Assets: Trailing twelve months net income as a % of the average beginning and ending total assets ($ thousands) Three Months En
Slide 25: Reconciliation and Calculation of Non-GAAP Financial Measurements
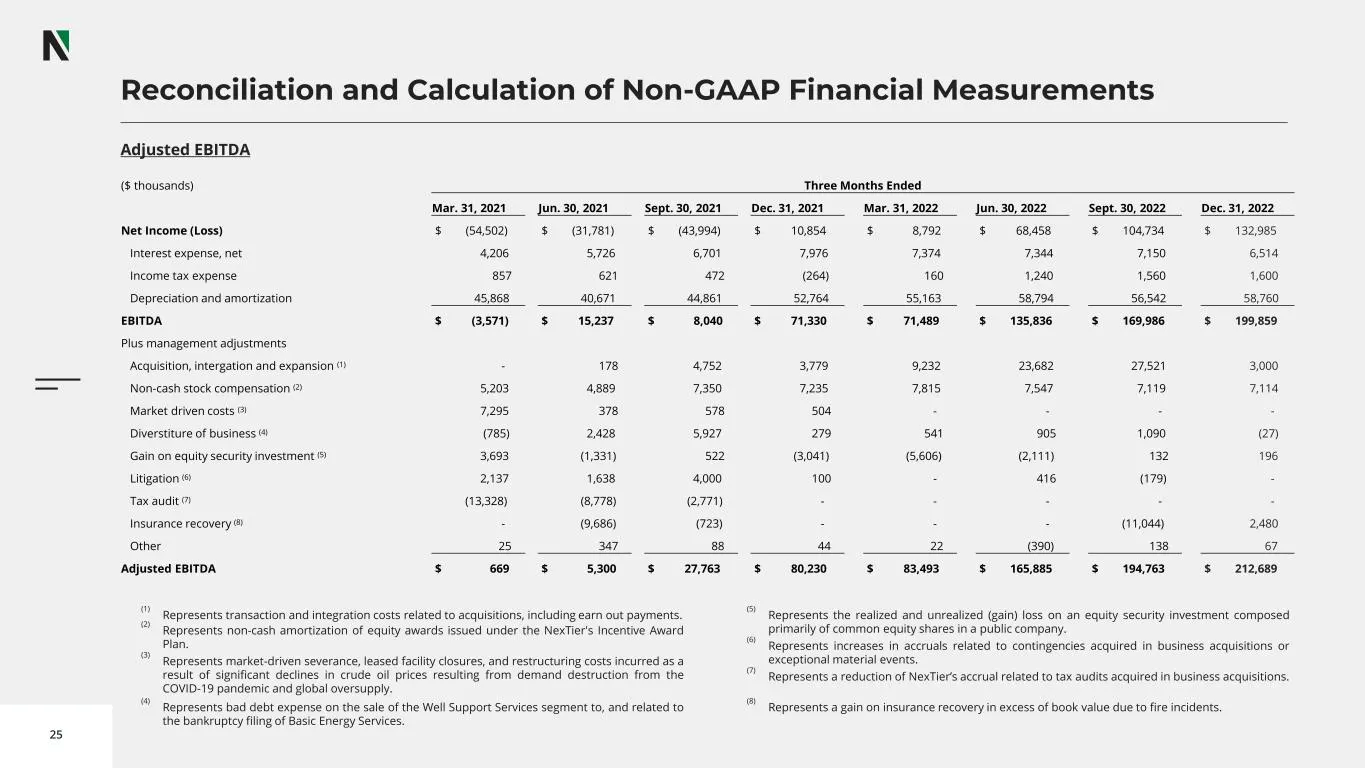
25 Reconciliation and Calculation of Non-GAAP Financial Measurements (1) Represents transaction and integration costs related to acquisitions, including earn out payments. (2) Represents non-cash amortization of equity awards issued under the NexTier's Incentive Award Plan. (3) Represents market-dri
Slide 26: Reconciliation and Calculation of Non-GAAP Financial Measurements
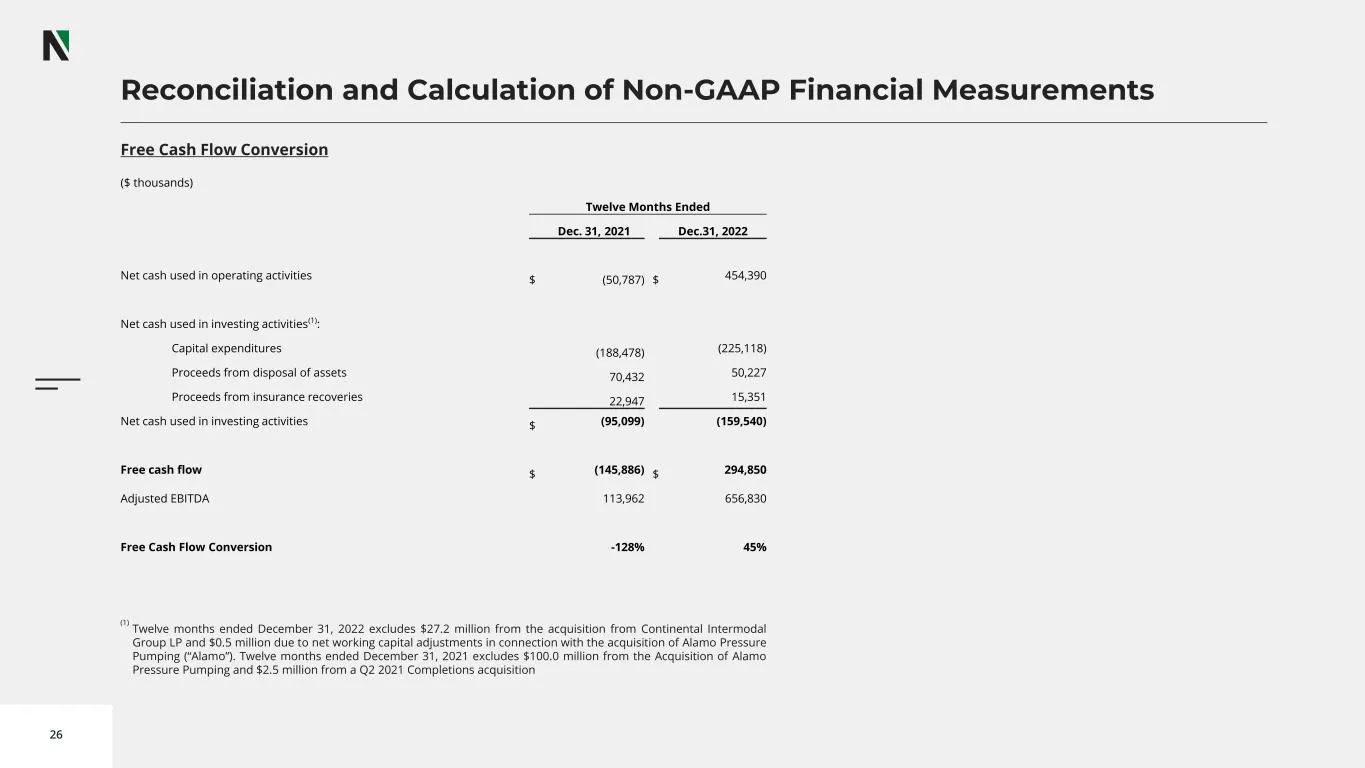
26 Reconciliation and Calculation of Non-GAAP Financial Measurements Free Cash Flow Conversion ($ thousands) Twelve Months Ended Dec. 31, 2021 Dec.31, 2022 Net cash used in operating activities $ (50,787) $ 454,390 Net cash used in investing activities(1): Capital expenditures (188,478) (225,118) Pr
Source: SEC EDGAR · 8-K filed Feb 15, 2023
More decks from NexTier Oilfield Solutions Inc
 Merger or Acquisition (July 2023)18 slides · Jul 5, 2023
 Merger or Acquisition (June 2023)18 slides · Jun 16, 2023
 Merger or Acquisition (June 2023)23 slides · Jun 15, 2023
 Shareholder Meeting (June 2023)23 slides · Jun 1, 2023
 Investor Presentation (October 2022)28 slides · Oct 25, 2022
 Merger or Acquisition (August 2022)21 slides · Aug 3, 2022