Southern States Bancshares Inc
Southern States Bancshares — Q3 2023 Earnings Presentation
20 slides from Southern States Bancshares's earnings presentation, Oct 24, 2023
Slide 1: Q3 2023 Investor Presentation
Q3 2023 Investor Presentation October 23, 2023
Slide 2: Important Notices and Disclaimers
2 Important Notices and Disclaimers Forward-Looking Statements This presentation contains forward-looking statements within the meaning of the federal securities laws, which reflect our current expectations and beliefs with respect to, among other things, future events and our financial performance.
Slide 3: Overview of Southern States Bancshares, Inc.
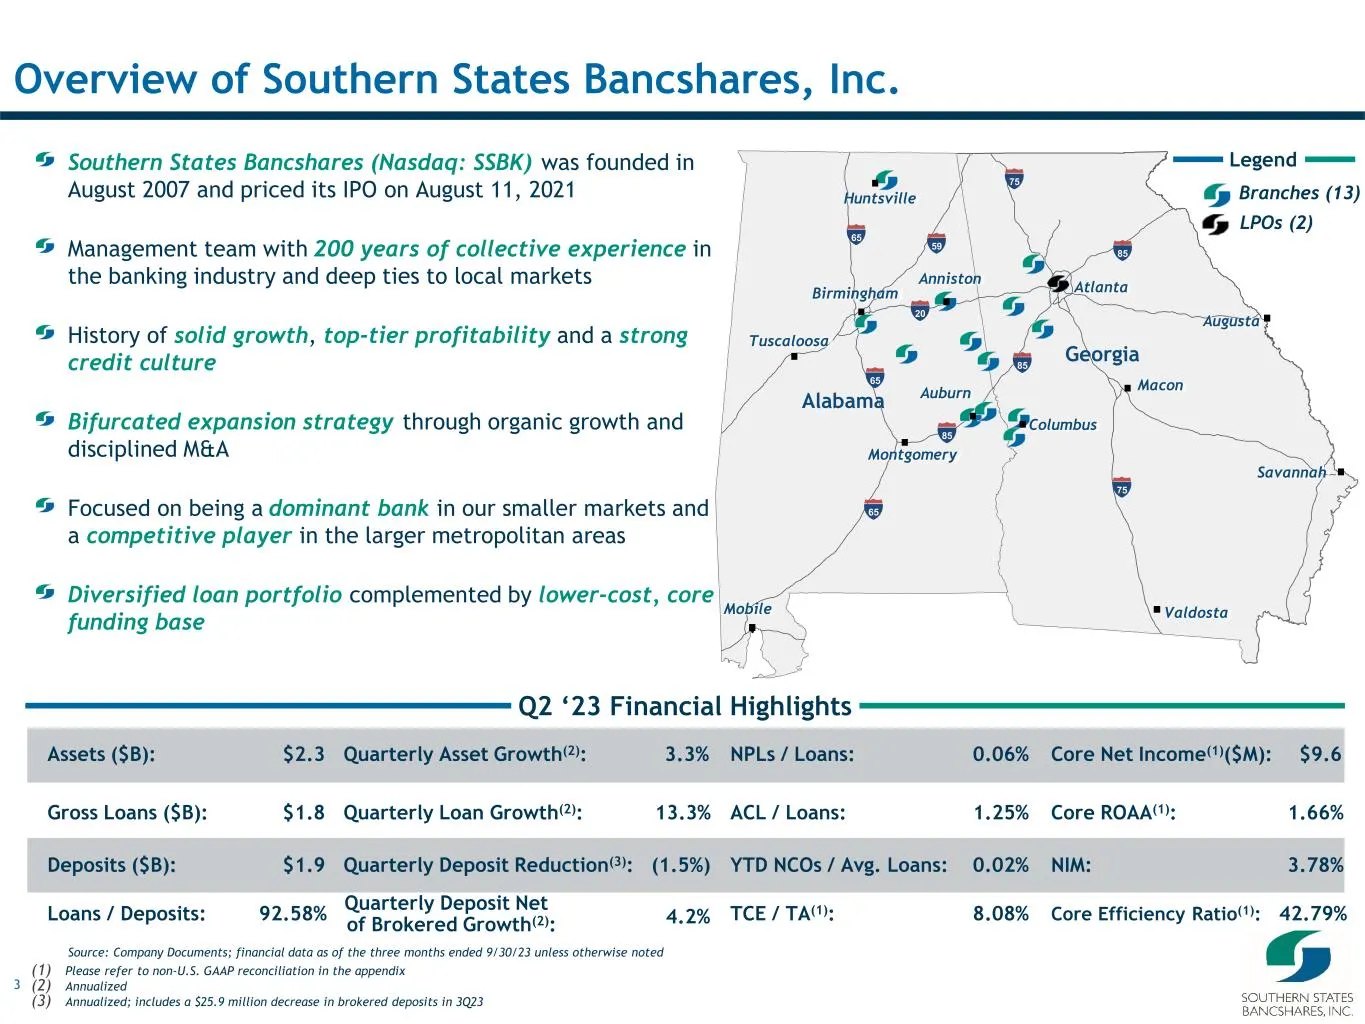
3 Branches (13) Legend Huntsville Birmingham Montgomery Columbus Atlanta Alabama Georgia 65 85 75 Anniston Auburn 20 85 75 85 65 65 59 Tuscaloosa LPOs (2) Quarterly Deposit NetLoans / Deposits: 92.58% Overview of Southern States Bancshares, Inc. Q2 ‘23 Financial Highlights Quarterly Asset Growth(2):
Slide 4: Robust Market Dynamics
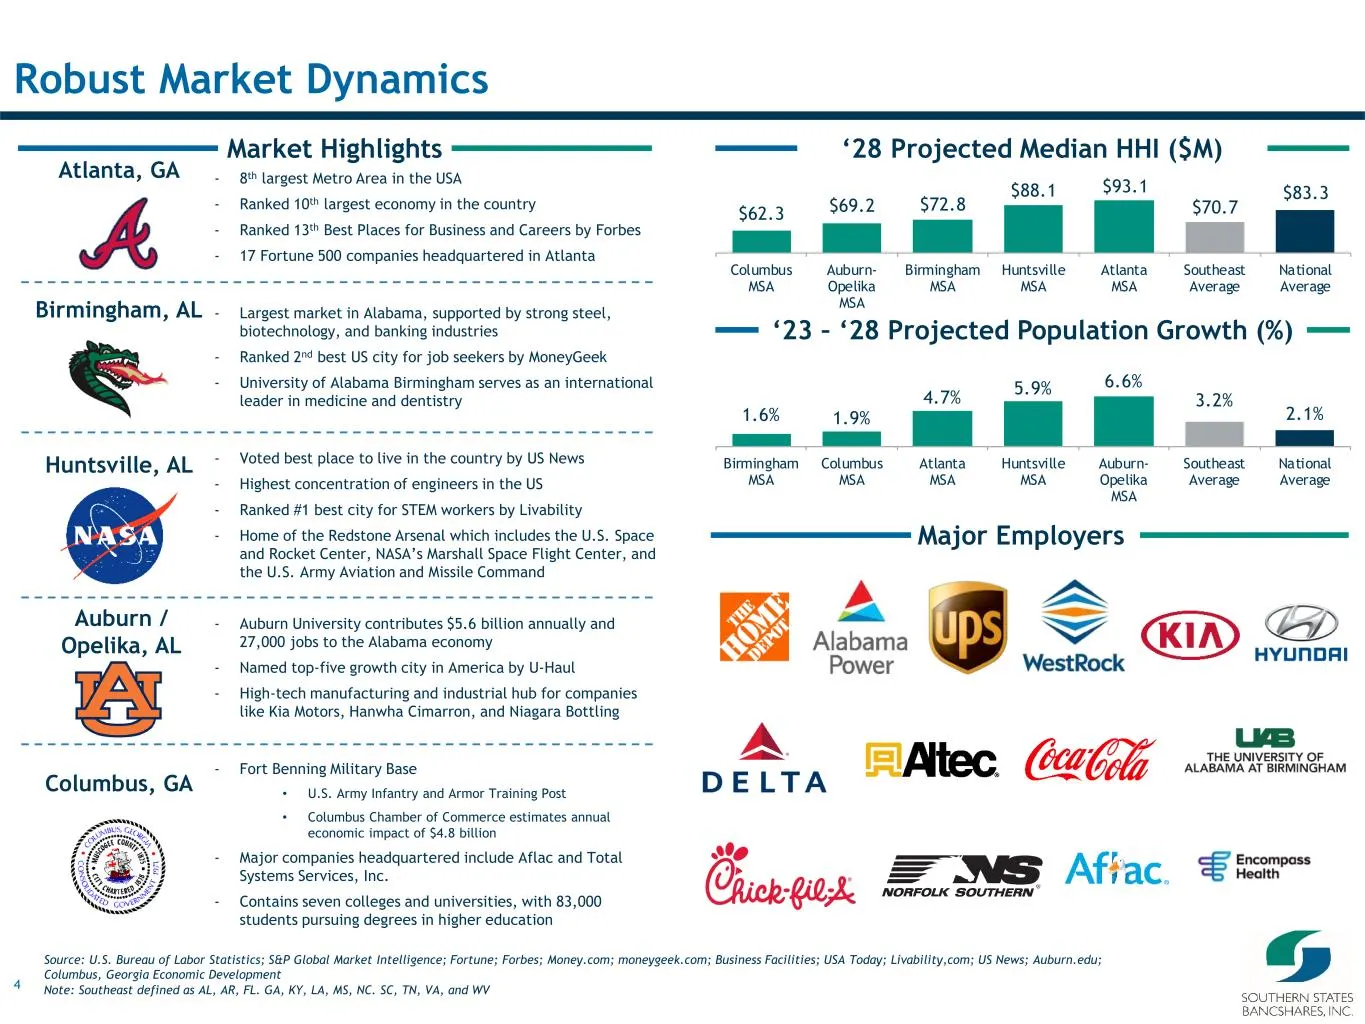
4 $62.3 $69.2 $72.8 $88.1 $93.1 $70.7 $83.3 Columbus MSA Auburn- Opelika MSA Birmingham MSA Huntsville MSA Atlanta MSA Southeast Average National Average 1.6% 1.9% 4.7% 5.9% 6.6% 3.2% 2.1% Birmingham MSA Columbus MSA Atlanta MSA Huntsville MSA Auburn- Opelika MSA Southeast Average National Average C
Slide 5: Proven, Veteran Management Team
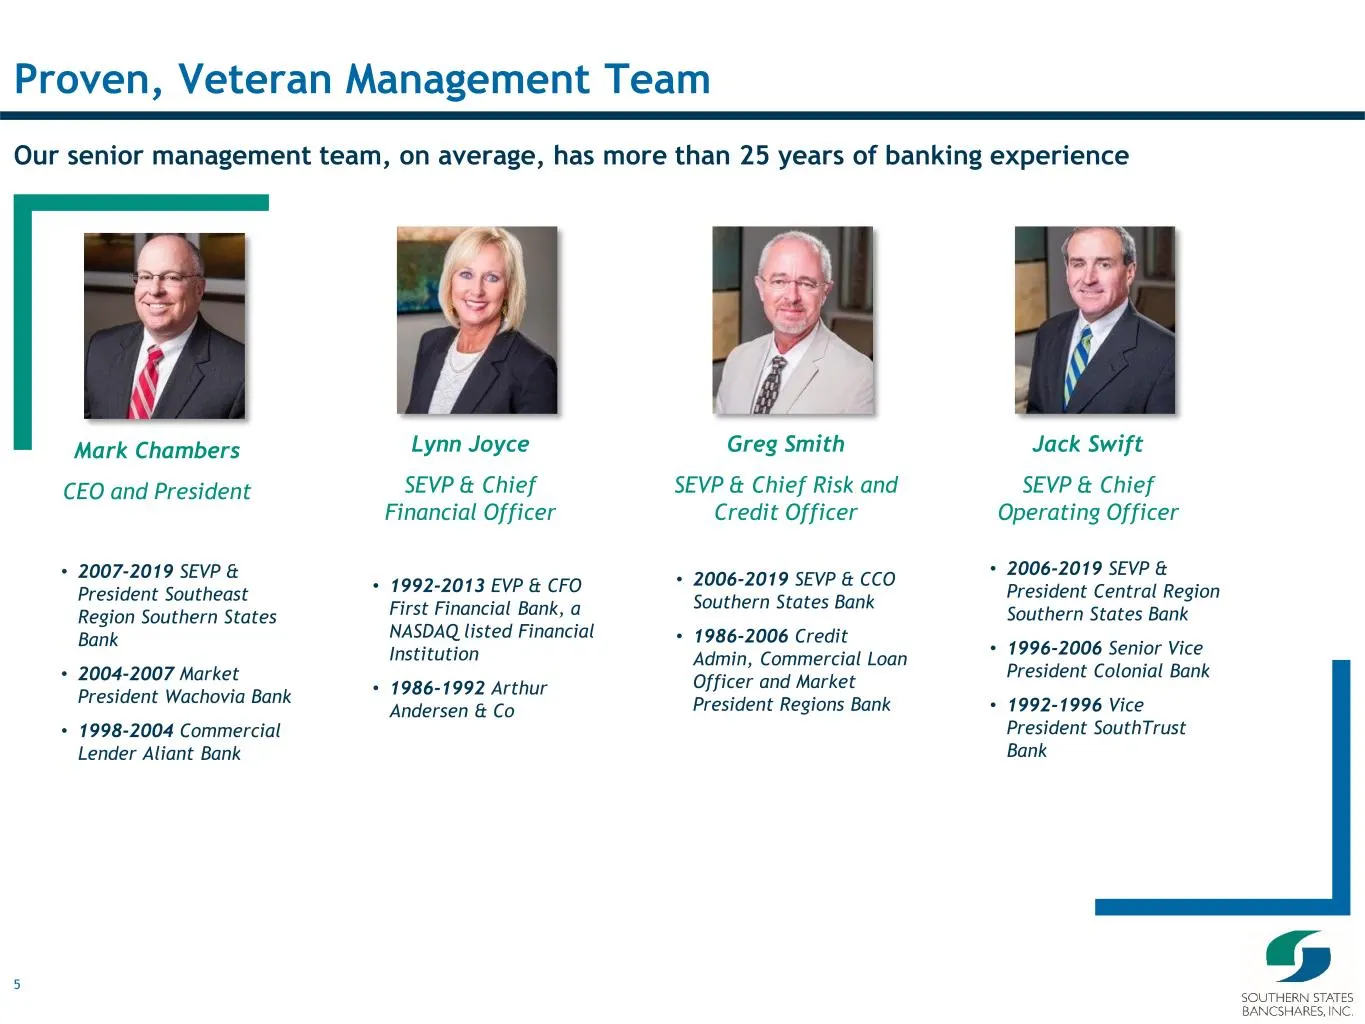
5 Proven, Veteran Management Team Lynn Joyce SEVP & Chief Financial Officer Greg Smith SEVP & Chief Risk and Credit Officer Jack Swift SEVP & Chief Operating Officer Our senior management team, on average, has more than 25 years of banking experience Mark Chambers CEO and President • 2007-2019 SEVP
Slide 6: Q3 2023 Results Highlights
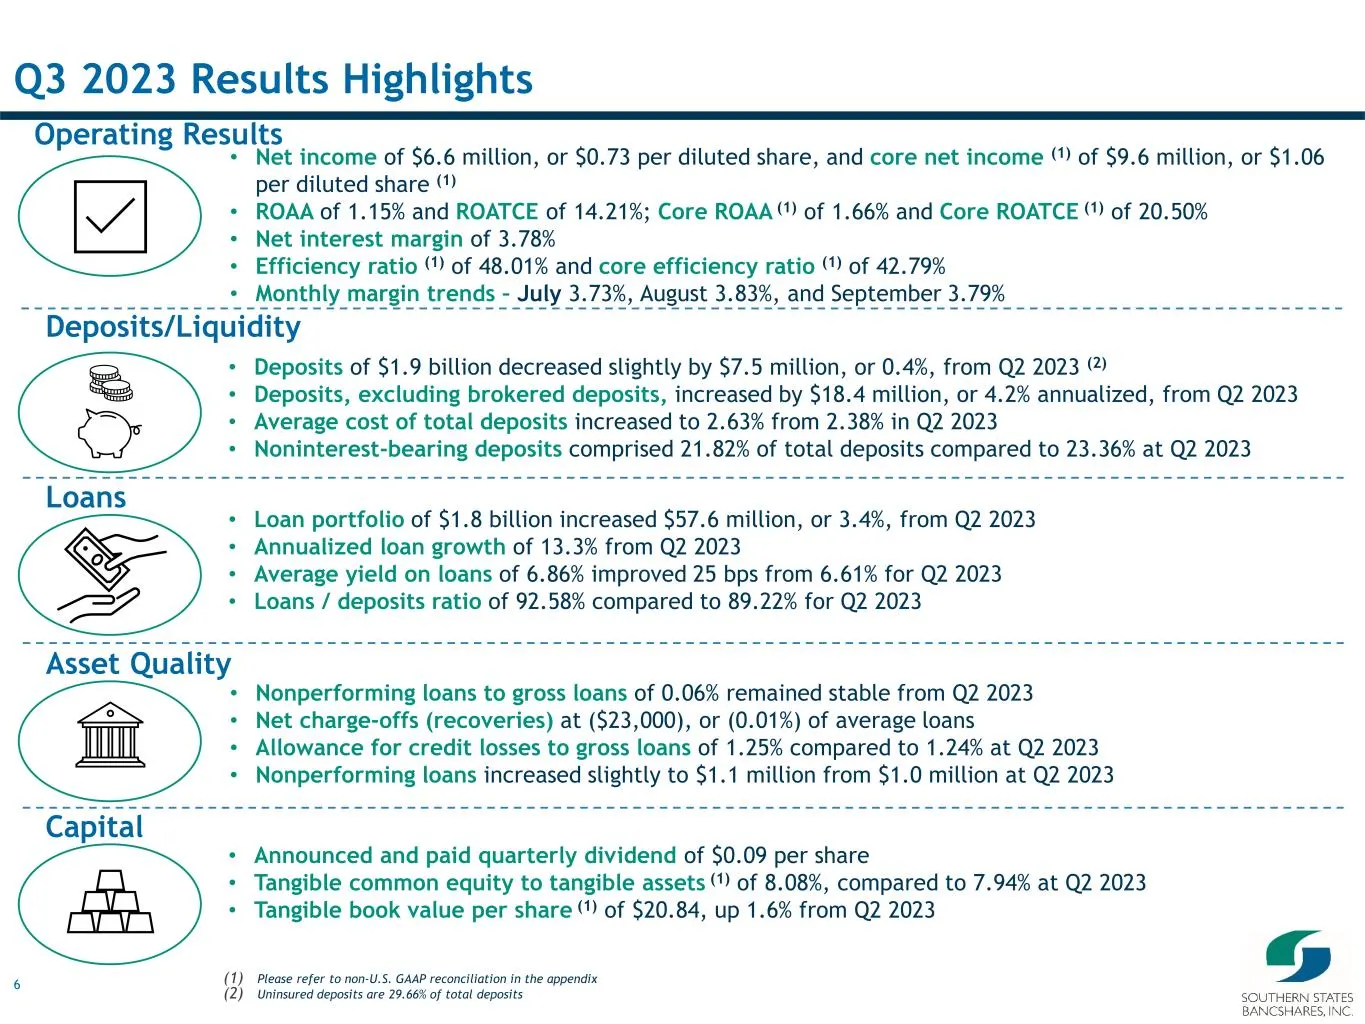
6 Q3 2023 Results Highlights (1) Please refer to non-U.S. GAAP reconciliation in the appendix (2) Uninsured deposits are 29.66% of total deposits Operating Results Deposits/Liquidity Loans Capital Asset Quality • Net income of $6.6 million, or $0.73 per diluted share, and core net income (1) of $9.6
Slide 7: Change In Employee Retention Credit Summary
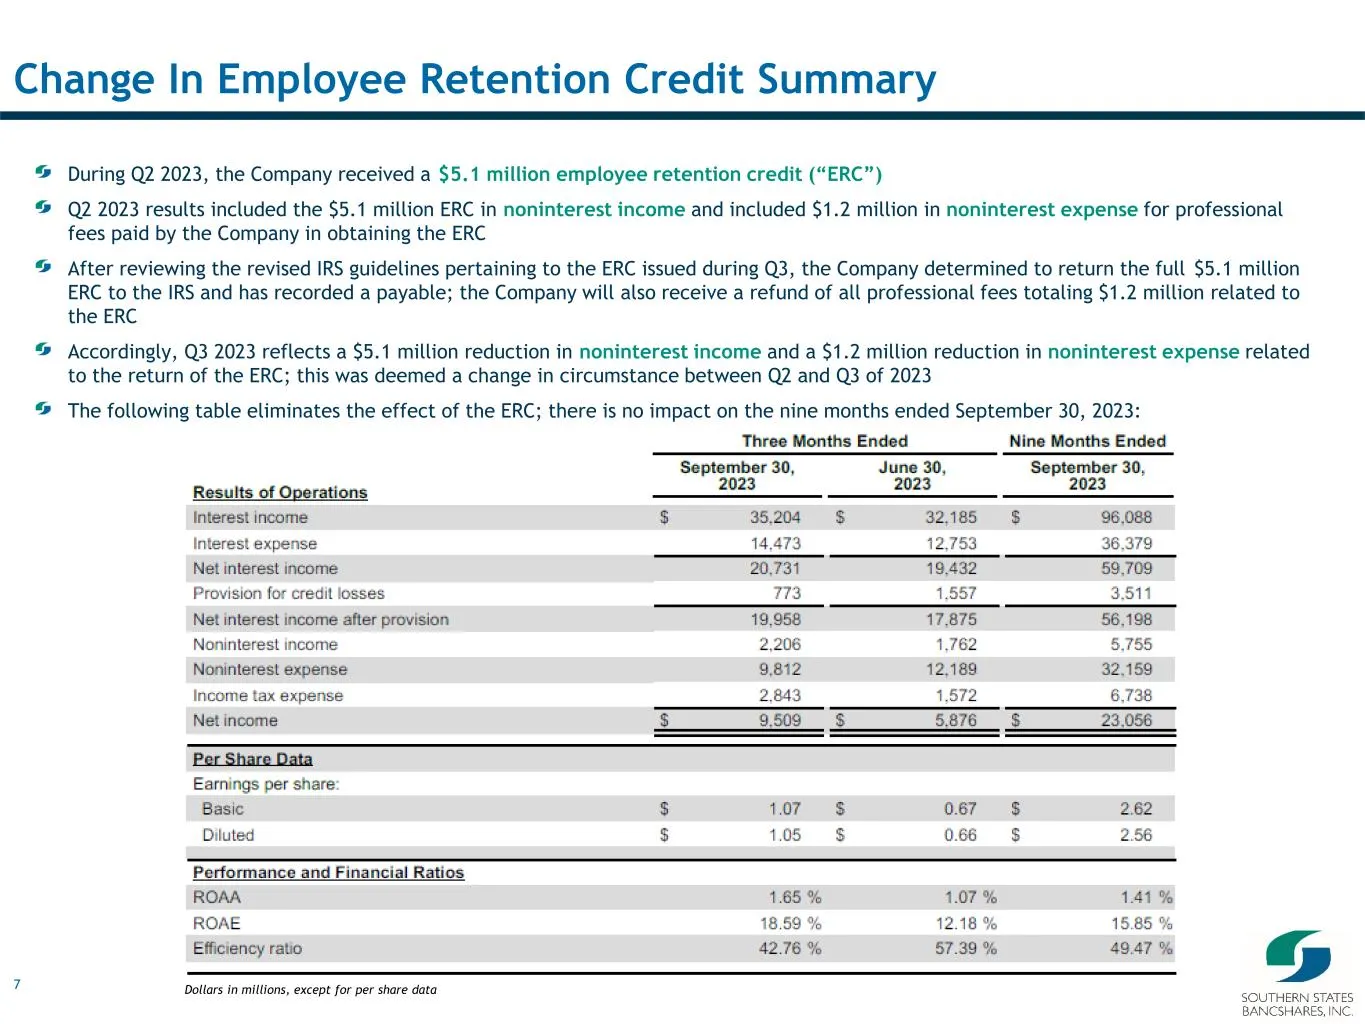
7 Change In Employee Retention Credit Summary During Q2 2023, the Company received a $5.1 million employee retention credit (“ERC”) Q2 2023 results included the $5.1 million ERC in noninterest income and included $1.2 million in noninterest expense for professional fees paid by the Company in obtain
Slide 8: Net Interest Income and Net Interest Margin
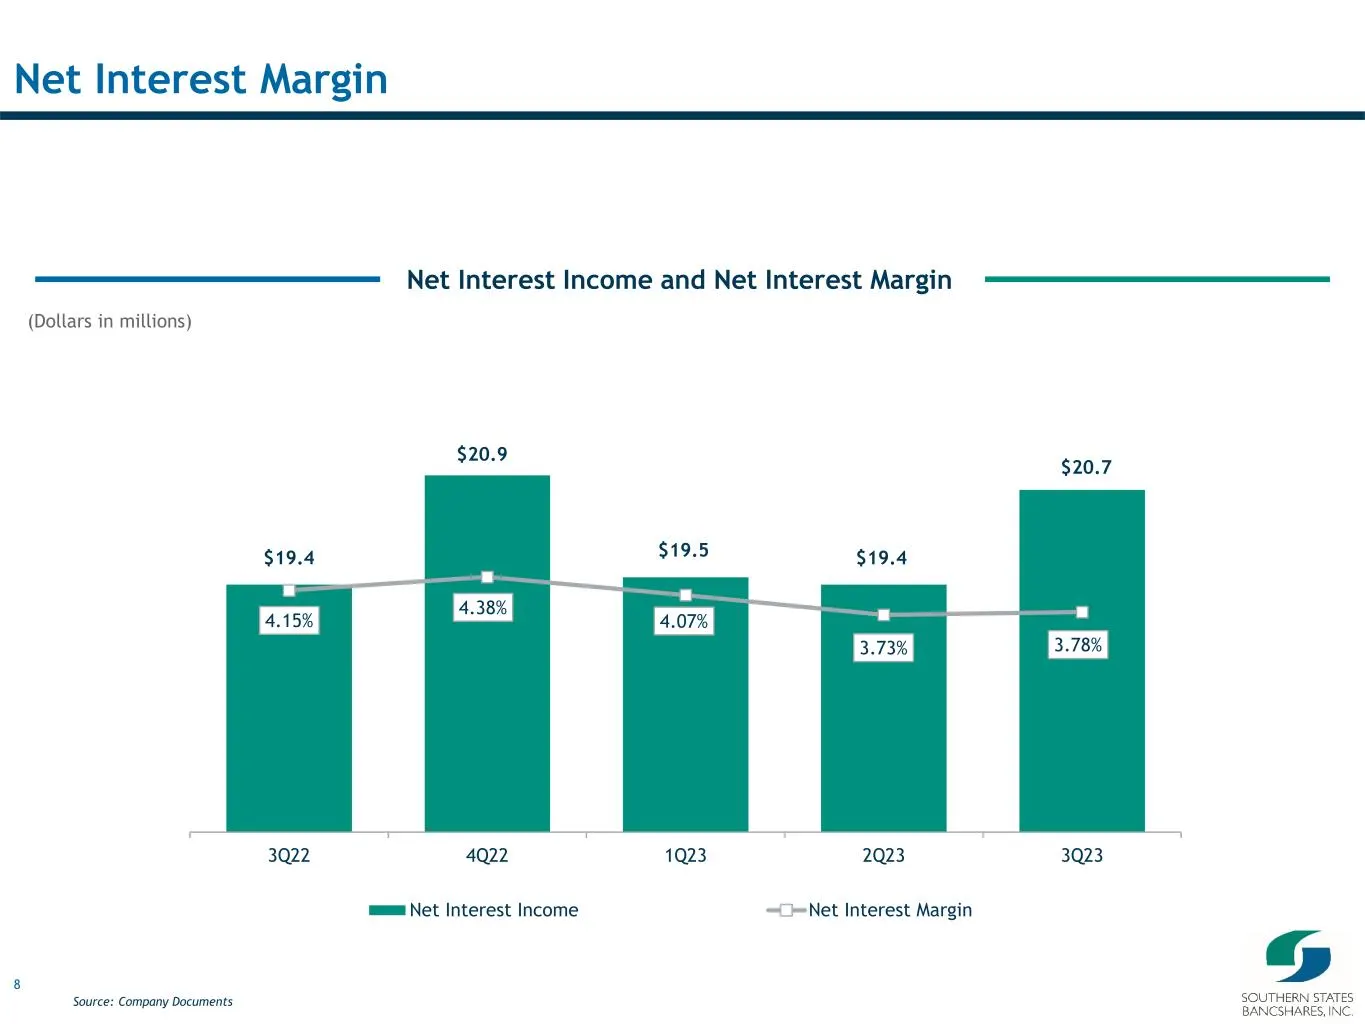
8 $19.4 $20.9 $19.5 $19.4 $20.7 4.15% 4.38% 4.07% 3.73% 3.78% $16.0 $17.0 $18.0 $19.0 $20.0 $21.0 $22.0 3Q22 4Q22 1Q23 2Q23 3Q23 Net Interest Income Net Interest Margin Net Interest Income and Net Interest Margin Net Interest Margin Source: Company Documents (Dollars in millions)
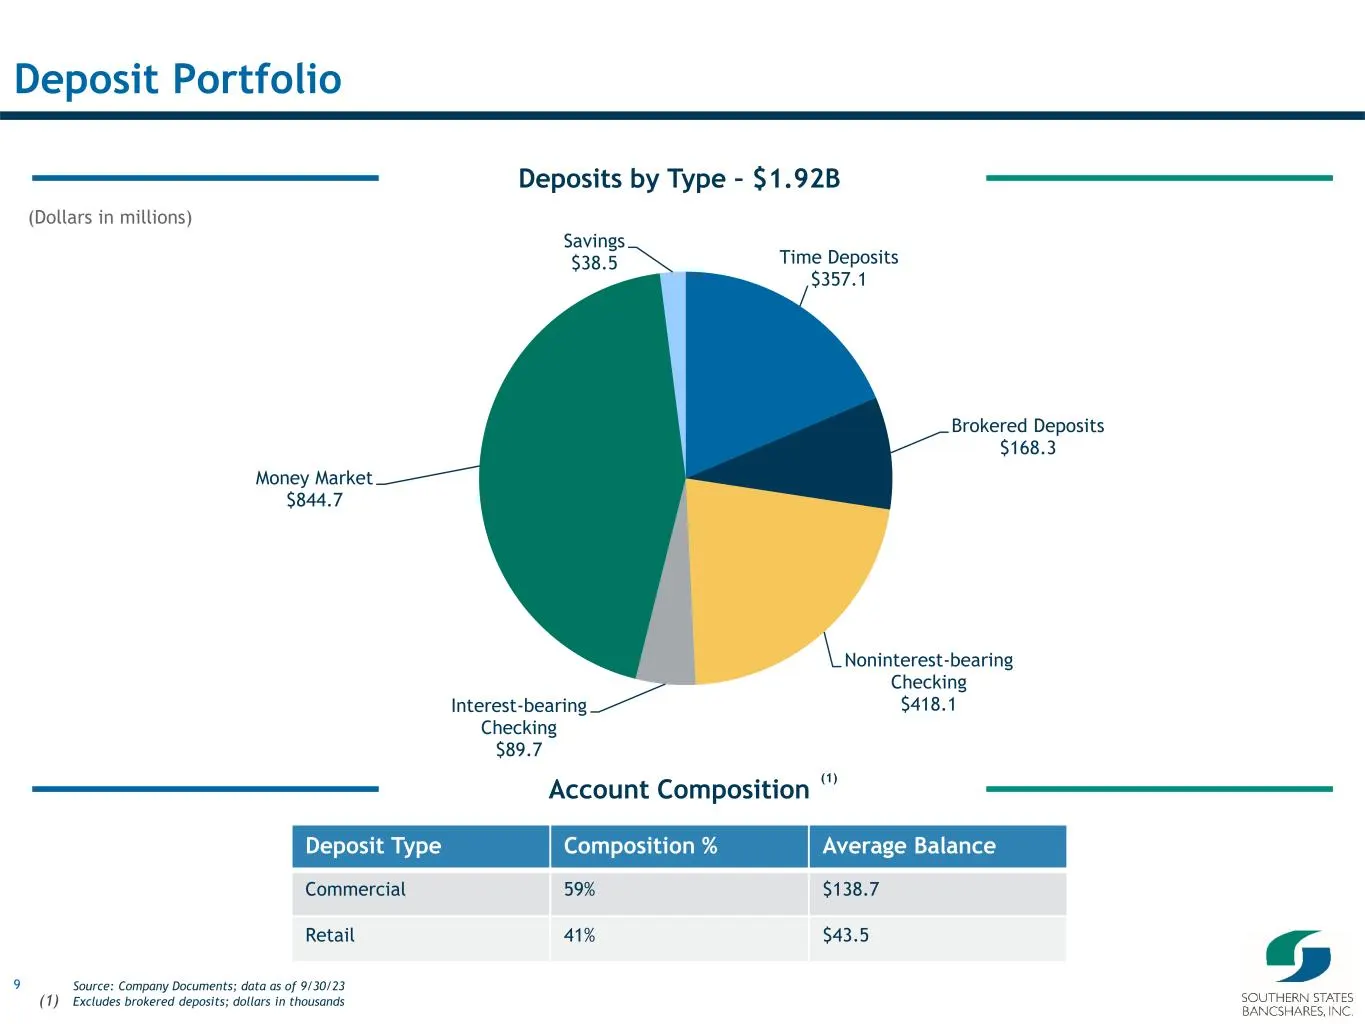
Slide 9: Deposit Portfolio
9 Time Deposits $357.1 Brokered Deposits $168.3 Noninterest-bearing Checking $418.1Interest-bearing Checking $89.7 Money Market $844.7 Savings $38.5 Deposits by Type – $1.92B Deposit Portfolio Source: Company Documents; data as of 9/30/23 (1) Excludes brokered deposits; dollars in thousands Deposit
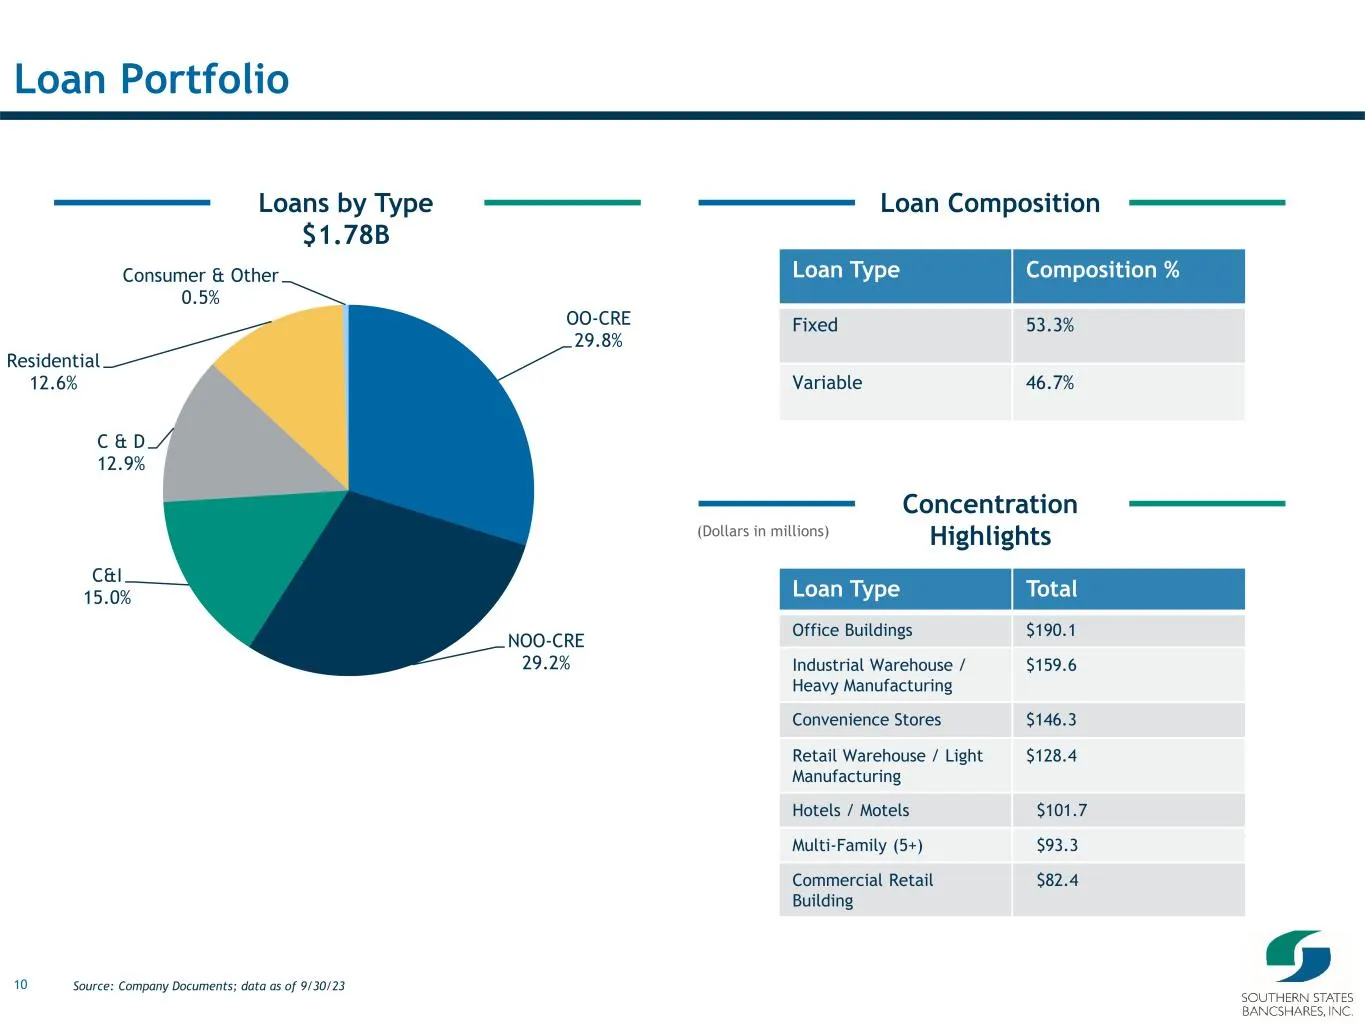
Slide 10: Loan Portfolio
10 OO-CRE 29.8% NOO-CRE 29.2% C&I 15.0% C & D 12.9% Residential 12.6% Consumer & Other 0.5% Loans by Type $1.78B Loan Portfolio Source: Company Documents; data as of 9/30/23 Loan Type Composition % Fixed 53.3% Variable 46.7% Loan Composition Loan Type Total Office Buildings $190.1 Industrial Warehou
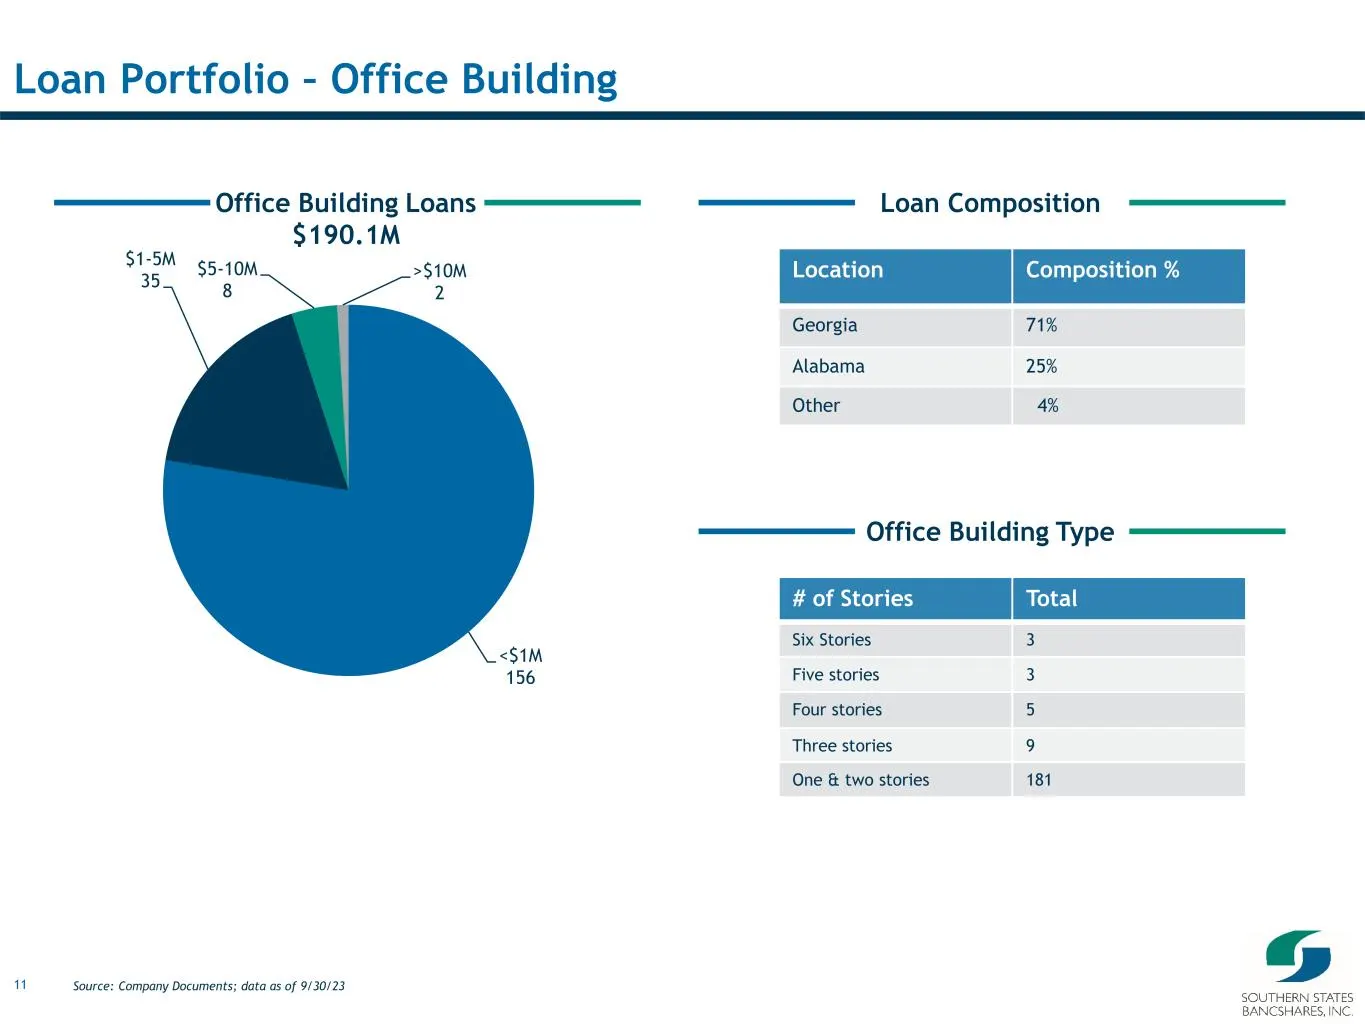
Slide 11: Loan Portfolio – Office Building
11 <$1M 156 $1-5M 35 $5-10M 8 >$10M 2 Office Building Loans $190.1M Loan Portfolio – Office Building Source: Company Documents; data as of 9/30/23 Location Composition % Georgia 71% Alabama 25% Other 4% Loan Composition # of Stories Total Six Stories 3 Five stories 3 Four stories 5 Three stories 9 O
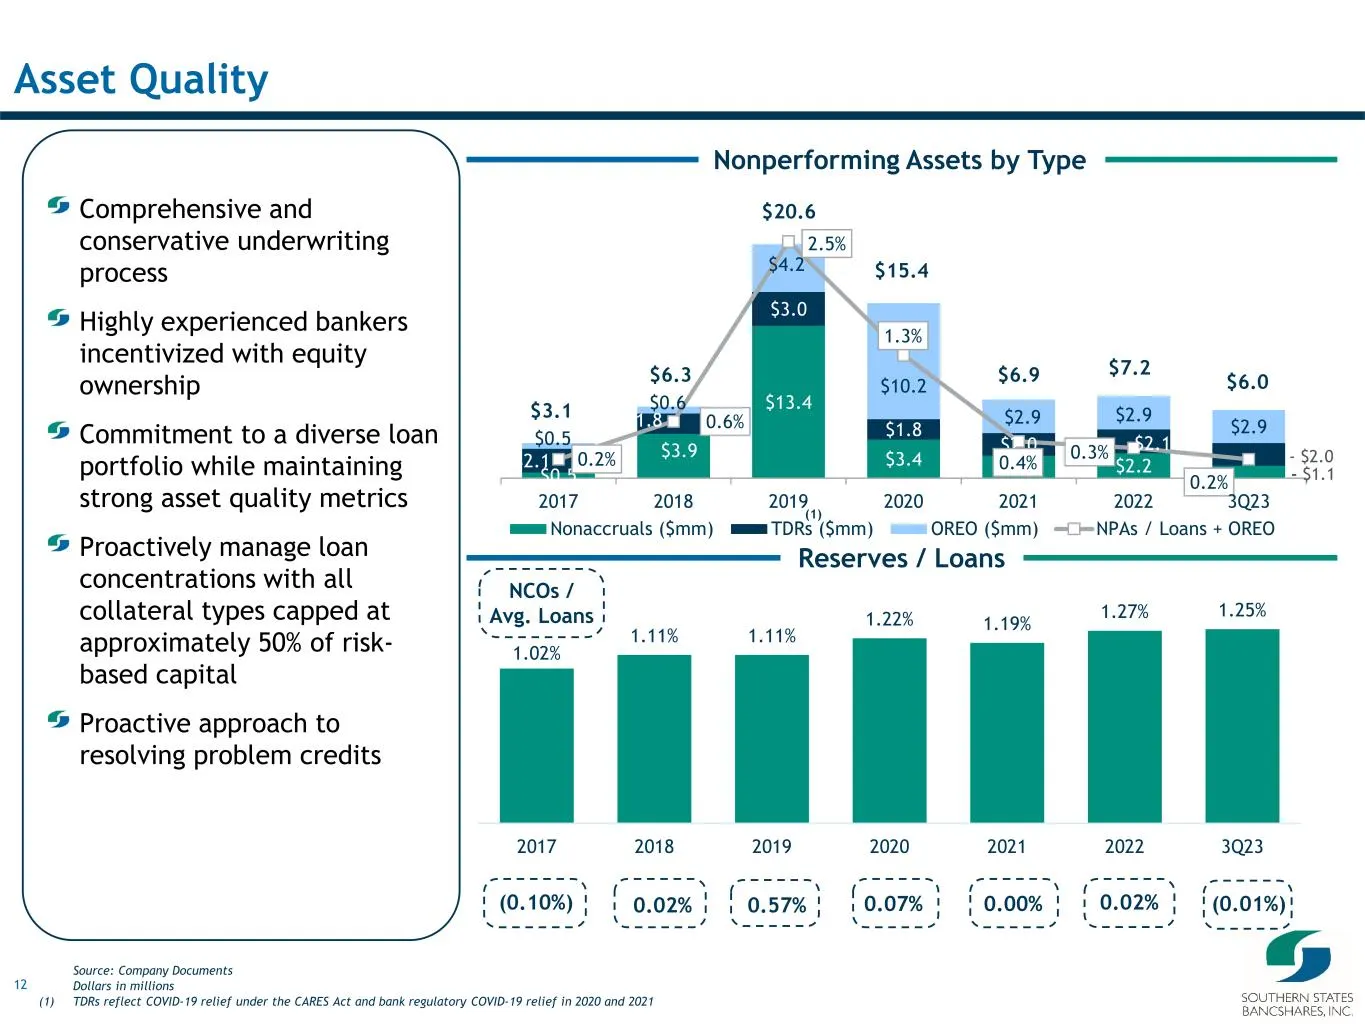
Slide 12: Asset Quality
12 $0.5 $3.9 $13.4 $3.4 $2.0 $2.2 - $1.1 $2.1 $1.8 $3.0 $1.8 $2.0 $2.1 - $2.0 $0.5 $0.6 $4.2 $10.2 $2.9 $2.9 $2.9 0.2% 0.6% 2.5% 1.3% 0.4% 0.3% 0.2%$0.0 $5.0 $10.0 $15.0 $20.0 $25.0 2017 2018 2019 2020 2021 2022 3Q23 Nonaccruals ($mm) TDRs ($mm) OREO ($mm) NPAs / Loans + OREO $20.6 Nonperforming Ass
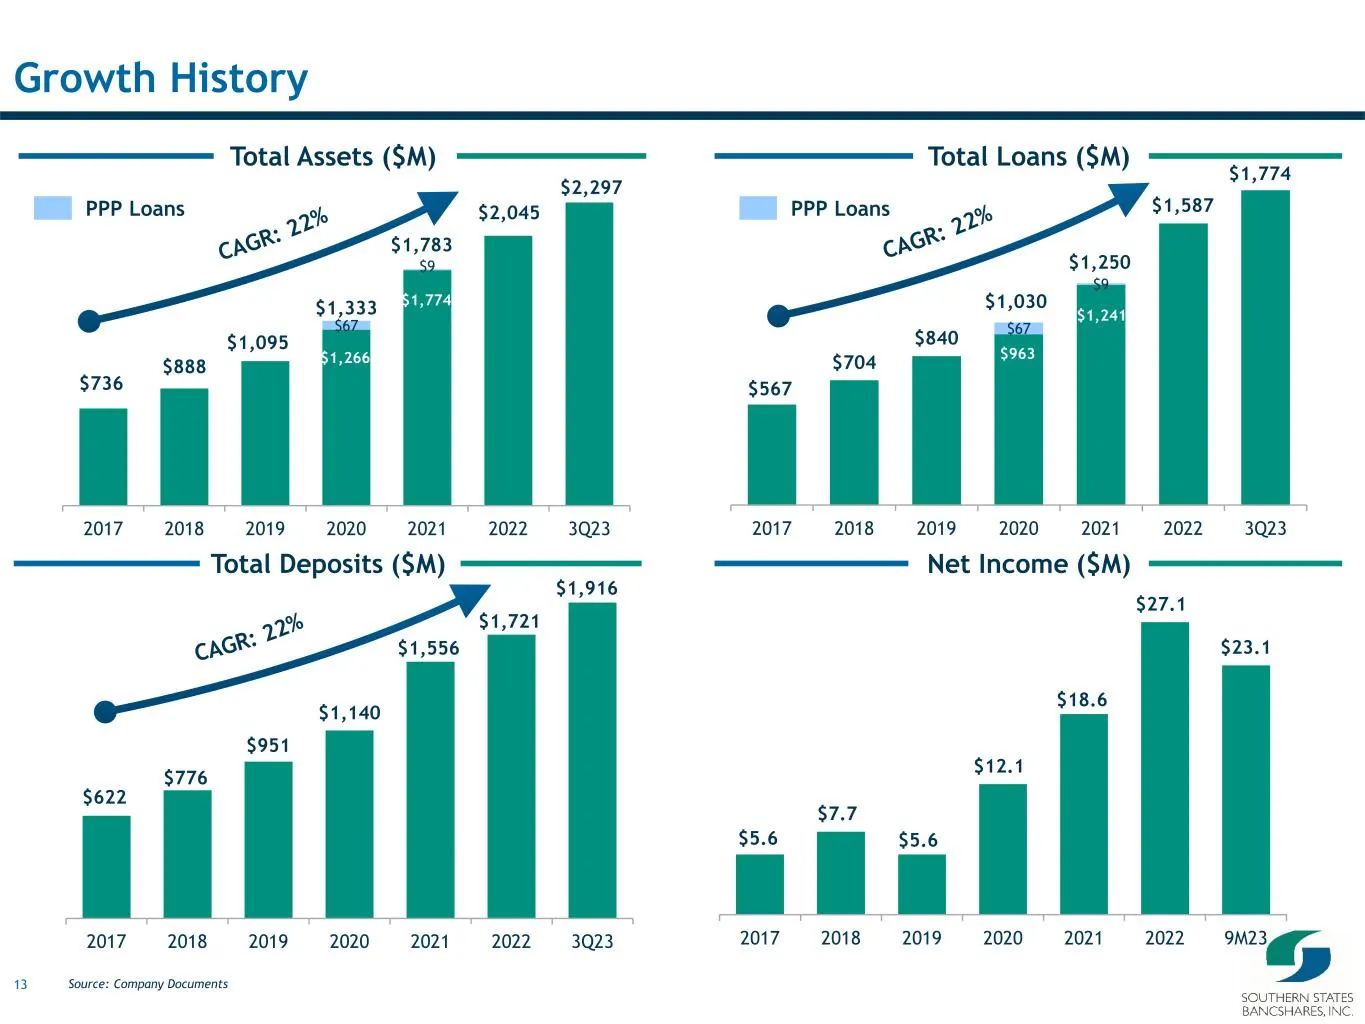
Slide 13: Growth History
13 $567 $704 $840 $1,030 $963 $1,241 $1,774 $67 $9 2017 2018 2019 2020 2021 2022 3Q23 $1,587 $1,250 $622 $776 $951 $1,140 $1,556 $1,721 $1,916 2017 2018 2019 2020 2021 2022 3Q23 $736 $888 $1,095 $1,333 $1,774 $1,266 $2,297 $67 $9 2017 2018 2019 2020 2021 2022 3Q23 $2,045 Net Income ($M)Total Deposit
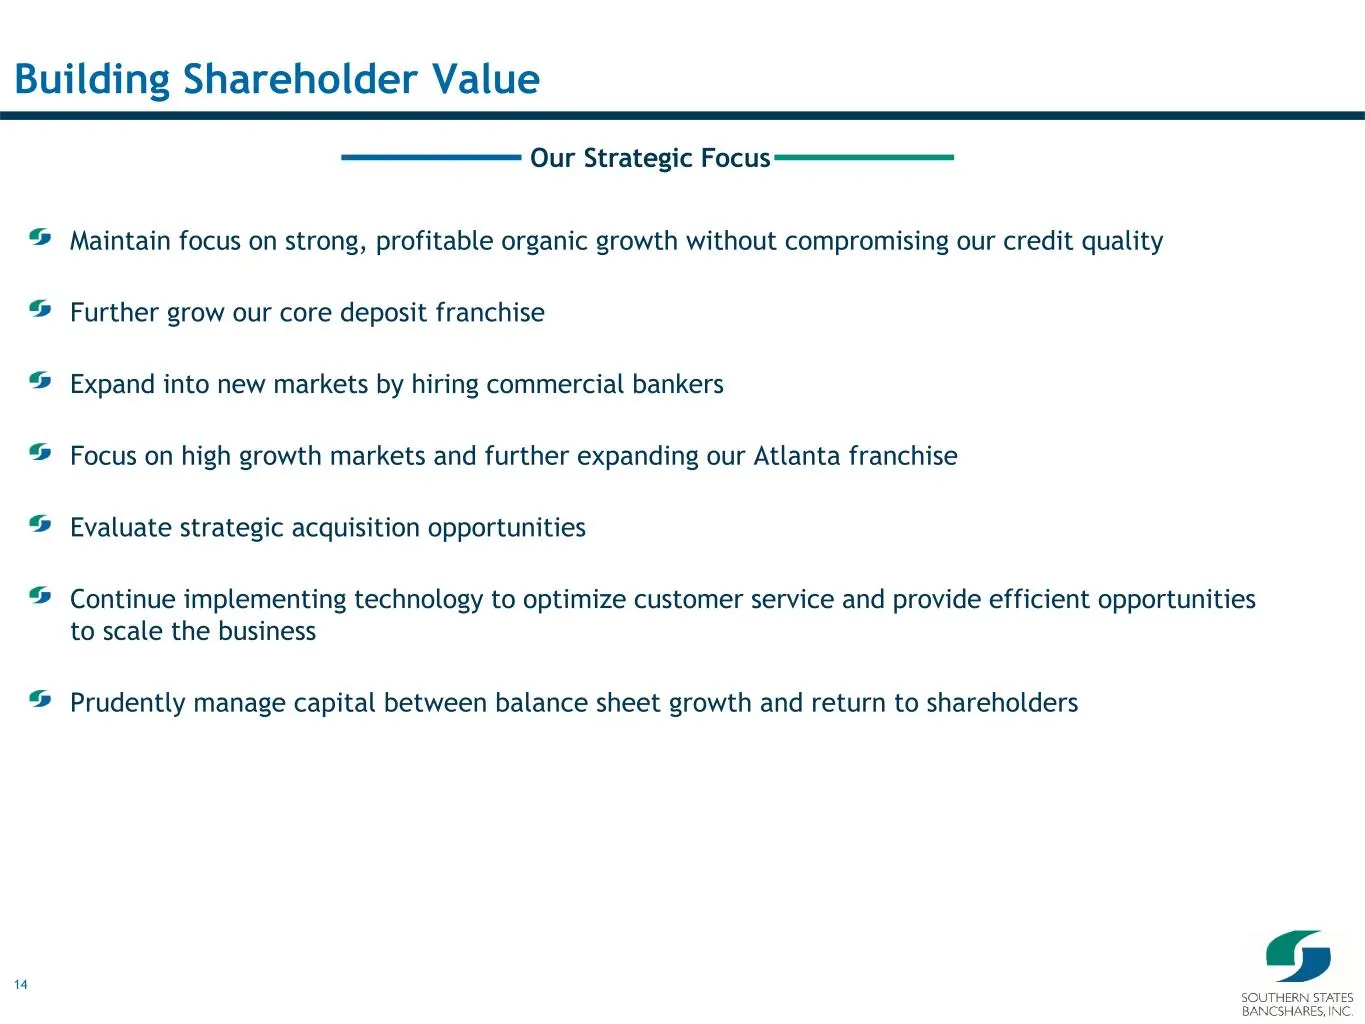
Slide 14: Building Shareholder Value: Our Strategic Focus
14 Building Shareholder Value Our Strategic Focus Maintain focus on strong, profitable organic growth without compromising our credit quality Further grow our core deposit franchise Expand into new markets by hiring commercial bankers Focus on high growth markets and further expanding our Atlanta fr
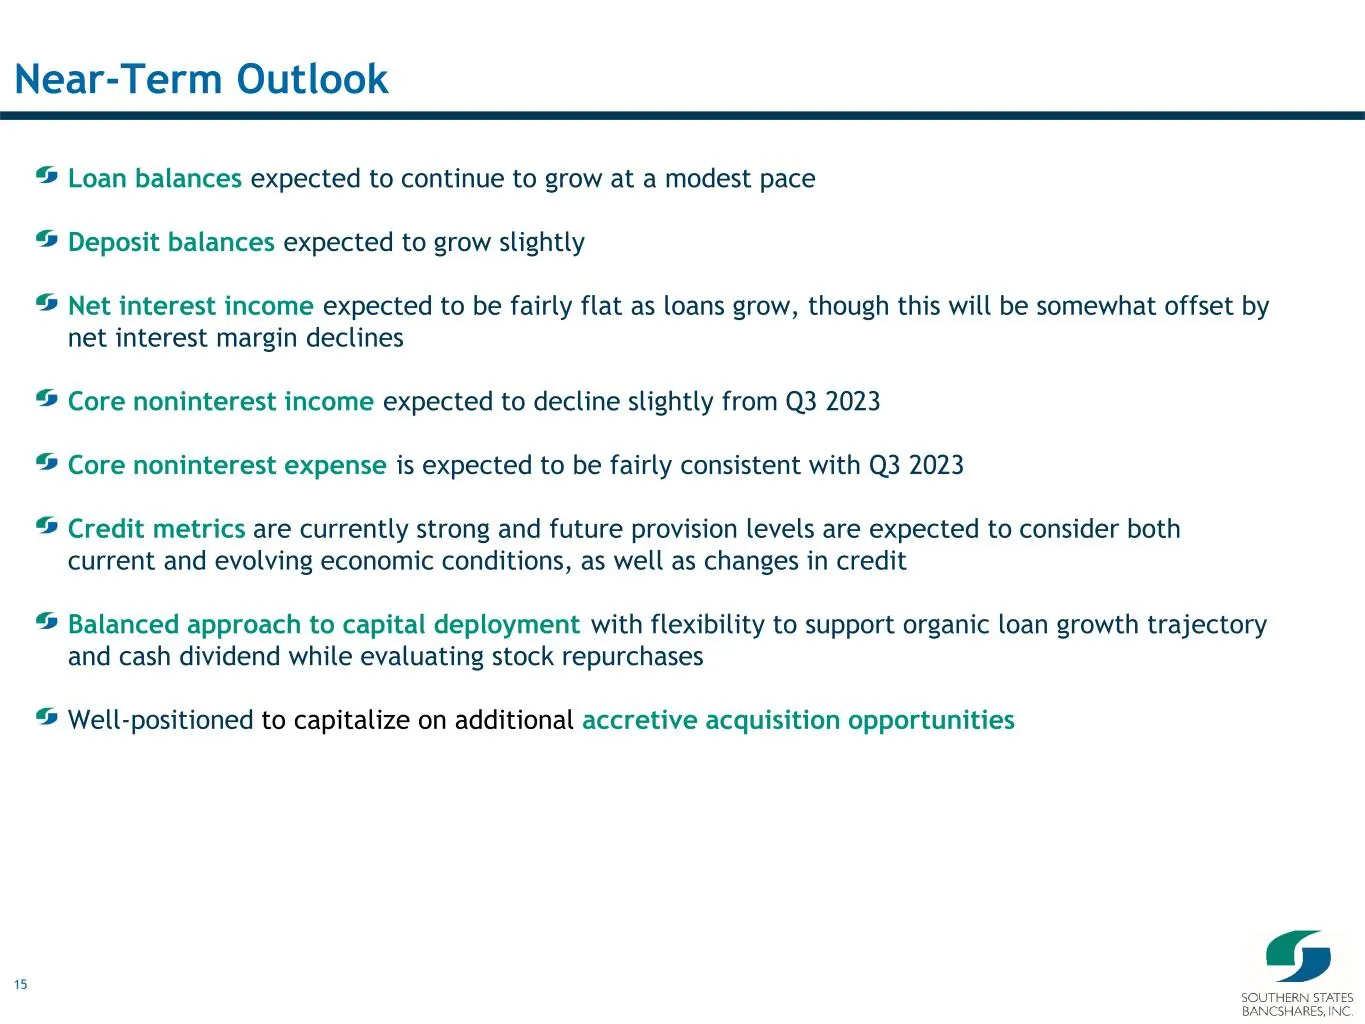
Slide 15: Near-Term Outlook
15 Near-Term Outlook Loan balances expected to continue to grow at a modest pace Deposit balances expected to grow slightly Net interest income expected to be fairly flat as loans grow, though this will be somewhat offset by net interest margin declines Core noninterest income expected to decline sl
Slide 16: Appendix
Appendix ay SOUTHERN STATES BANCSHARES, INC.
Slide 17: Non-GAAP Financial Measures Reconciliations
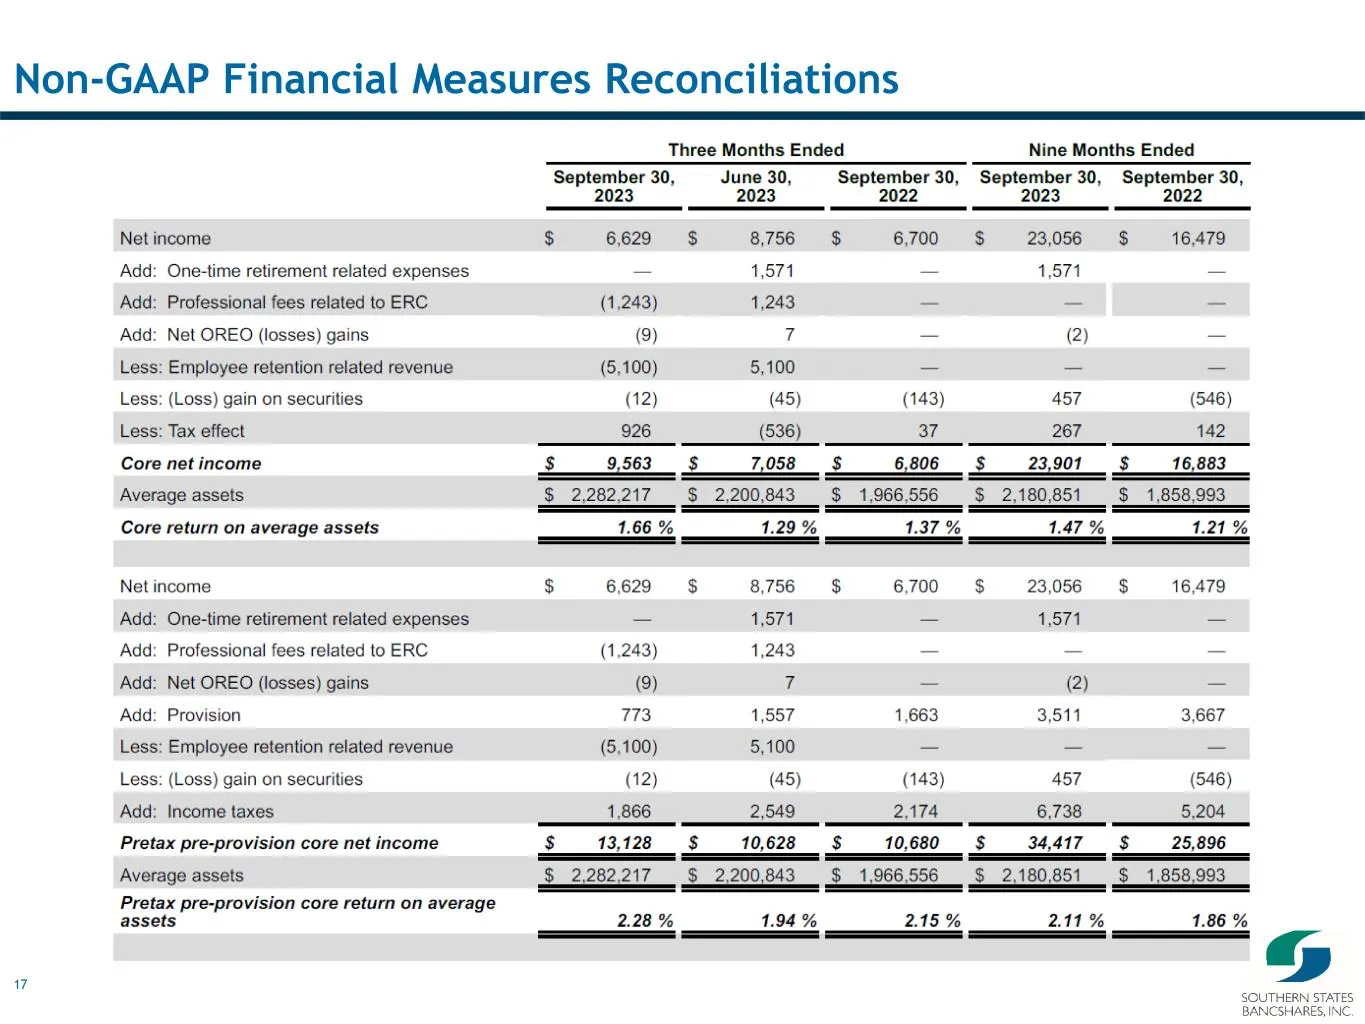
17 Non-GAAP Financial Measures Reconciliations
Slide 18: Non-GAAP Financial Measures Reconciliations
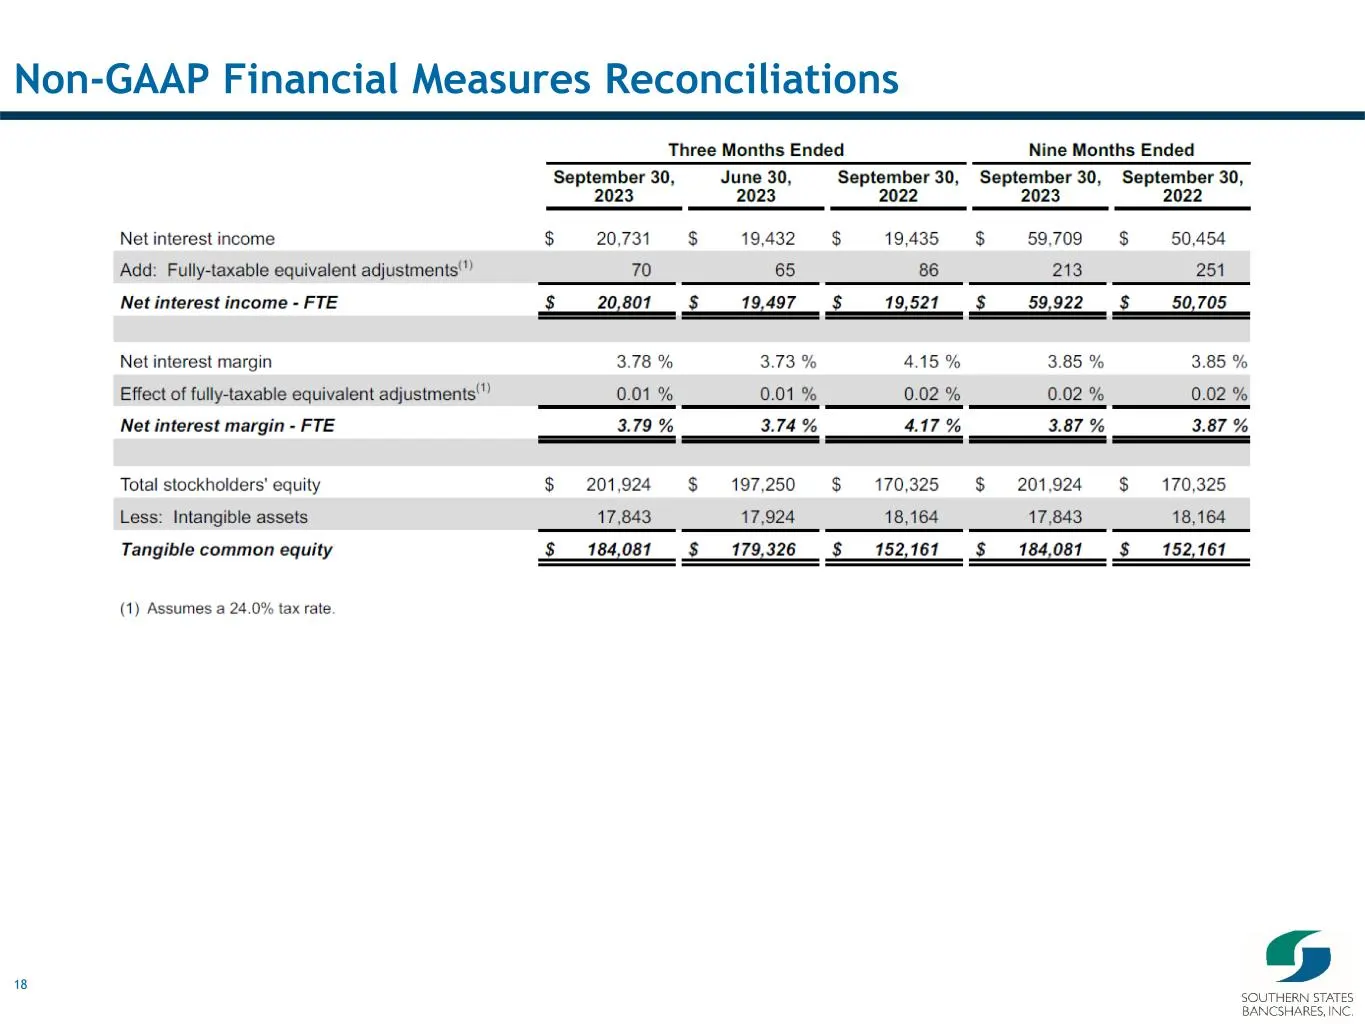
18 Non-GAAP Financial Measures Reconciliations
Slide 19: Non-GAAP Financial Measures Reconciliations
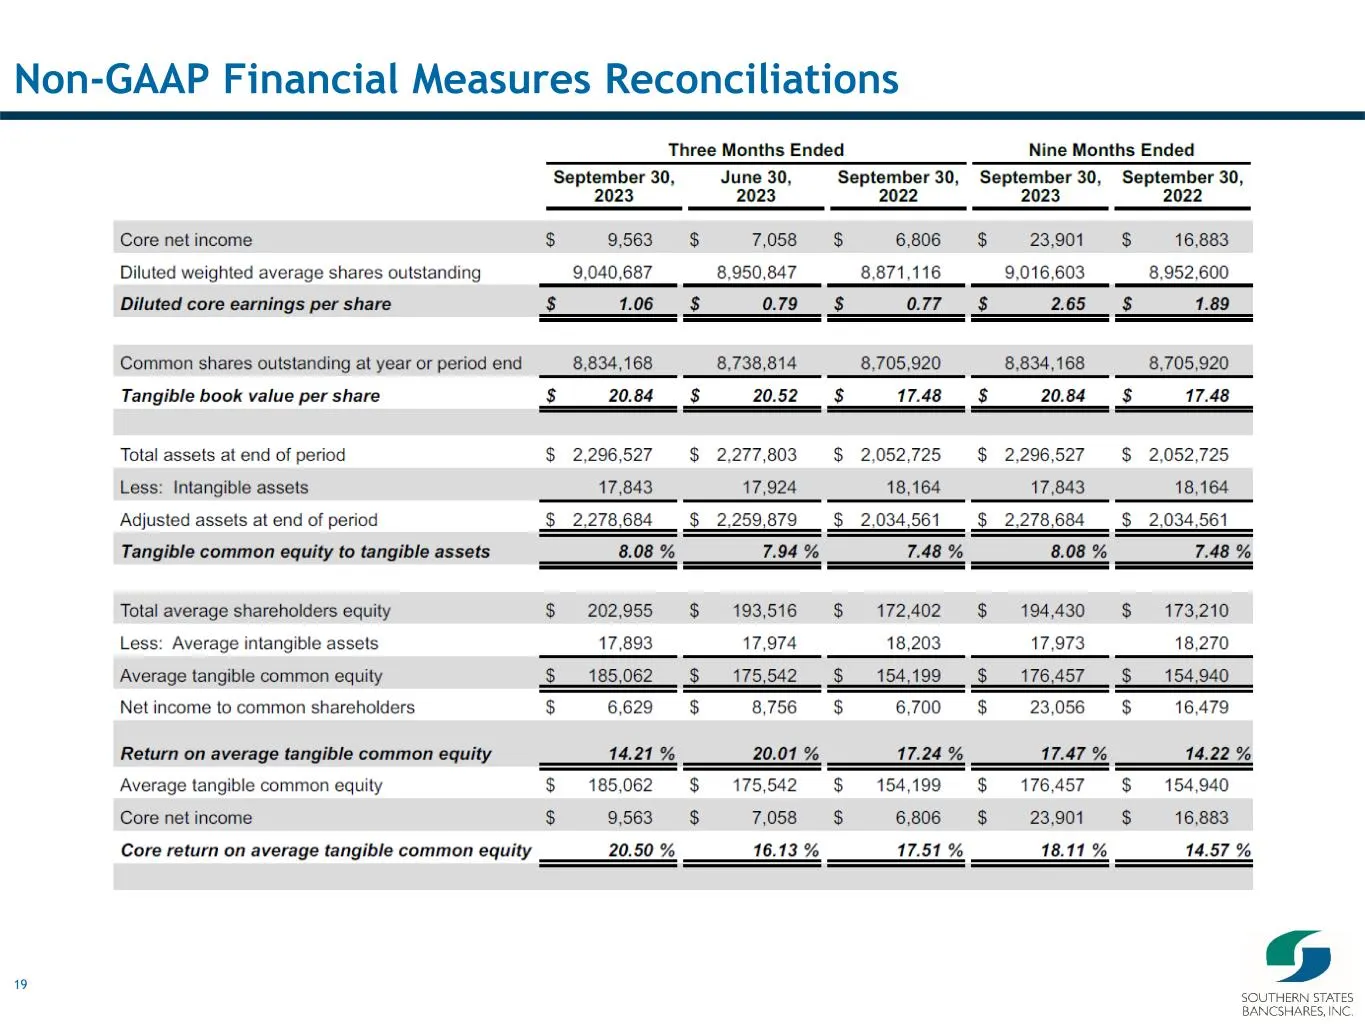
19 Non-GAAP Financial Measures Reconciliations
Slide 20: Non-GAAP Financial Measures Reconciliations
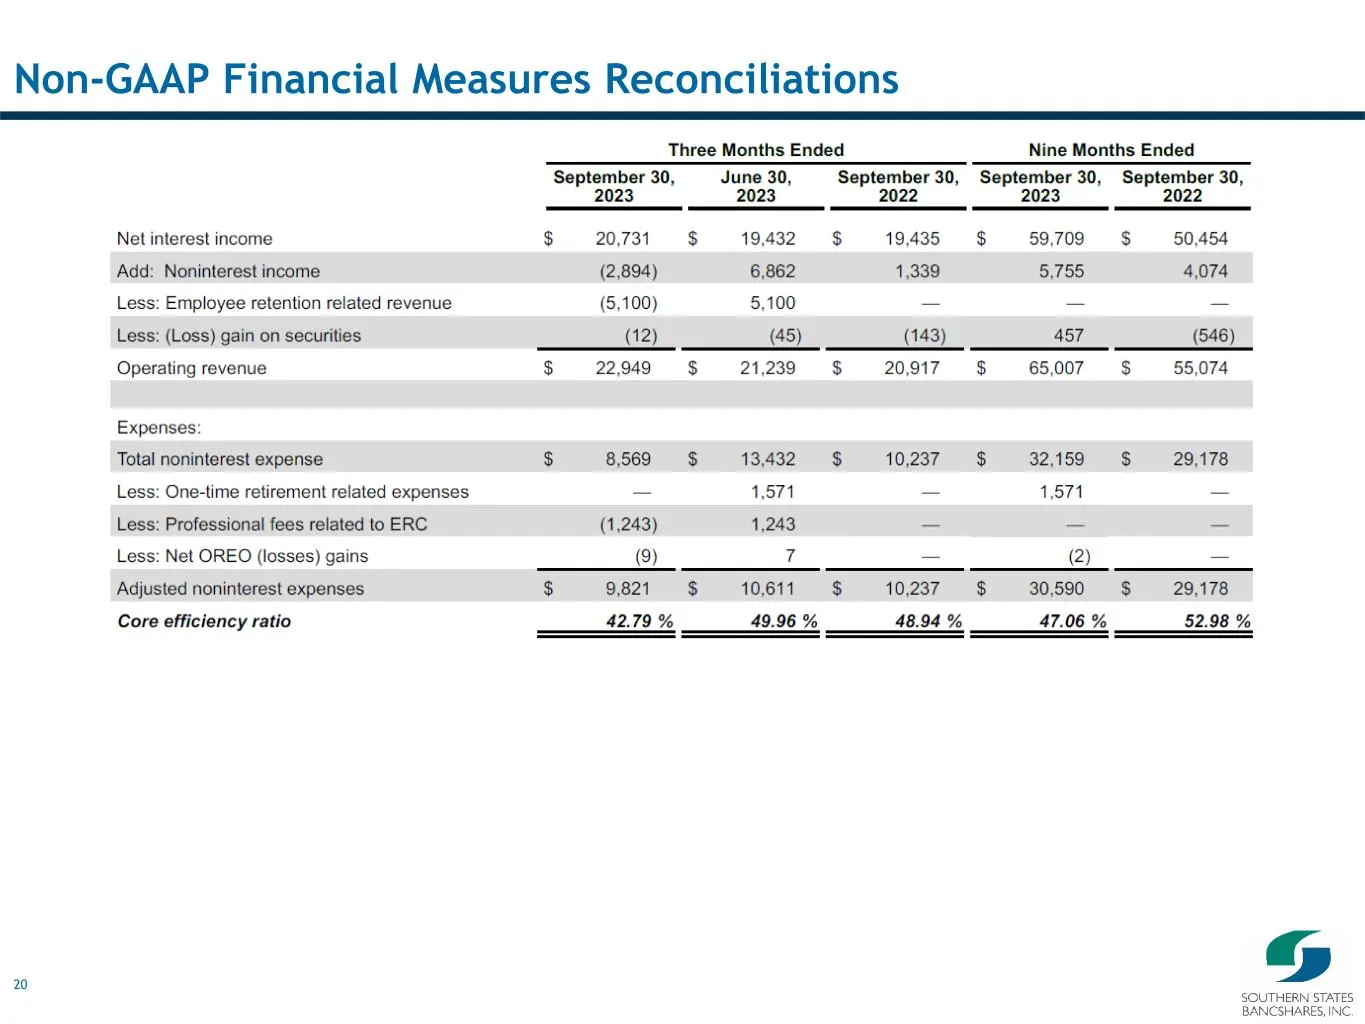
20 Non-GAAP Financial Measures Reconciliations
Source: SEC EDGAR · 8-K filed Oct 24, 2023
More decks from Southern States Bancshares Inc
 Stephens Investor Conference 202537 slides · Jun 3, 2025
 Q1 2025 Earnings Presentation22 slides · Apr 22, 2025
 Merger or Acquisition (March 2025)20 slides · Mar 31, 2025
 Q4 2024 Earnings Presentation22 slides · Jan 22, 2025
 Q3 2024 Earnings Presentation19 slides · Oct 22, 2024
 Q2 2024 Earnings Presentation17 slides · Jul 23, 2024