Southern States Bancshares Inc
Southern States Bancshares — Q3 2024 Earnings Presentation
19 slides from Southern States Bancshares's earnings presentation, Oct 22, 2024
Slide 1: Q3 2024 Investor Presentation
Q3 2024 Investor Presentation October 2024
Slide 2: Forward-Looking Statements
Forward-Looking Statements This presentation contains forward-looking statements within the meaning of the federal securities laws, which reflect our current expectations and beliefs with respect to, among other things, future events and our financial performance. These forward-looking statements ar
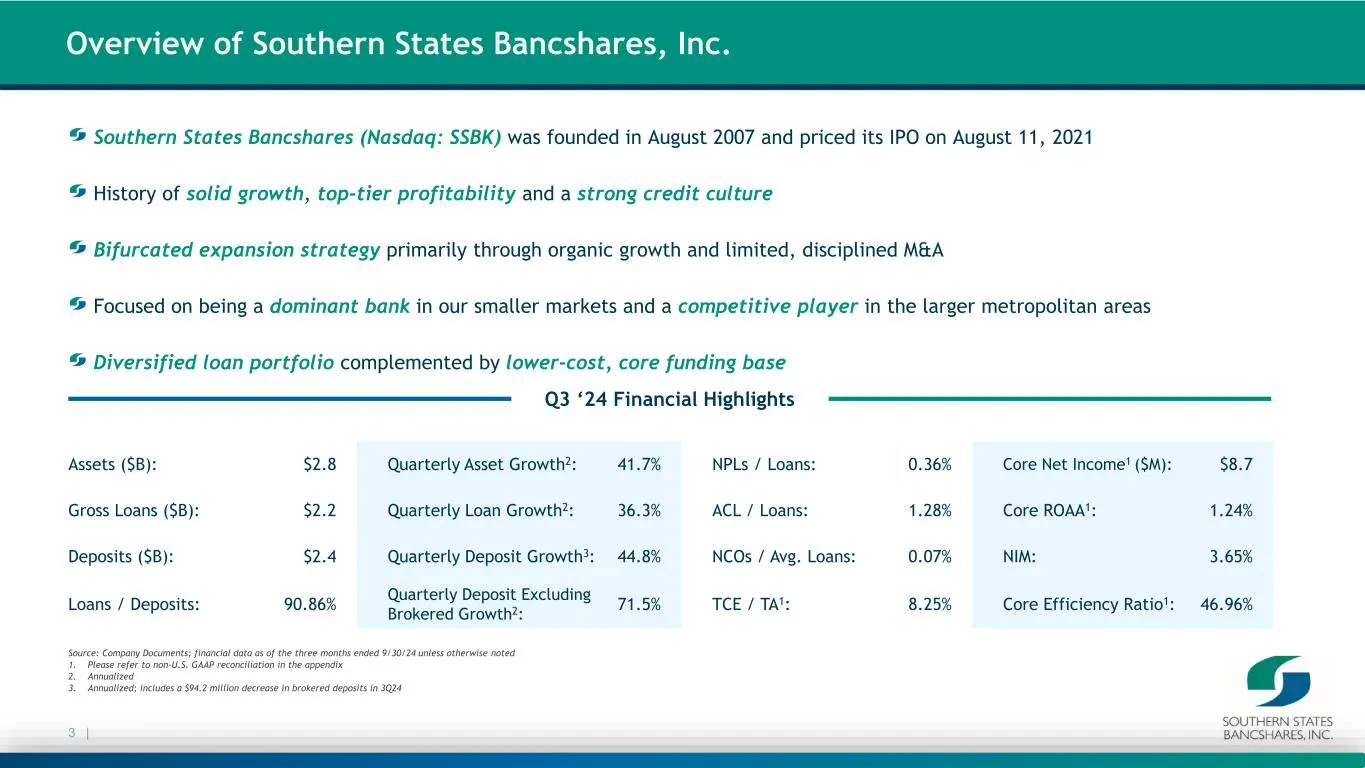
Slide 3: Q3 '24 Financial Highlights - Overview of Southern States Bancshares
3 | Source: Company Documents; financial data as of the three months ended 9/30/24 unless otherwise noted 1. Please refer to non-U.S. GAAP reconciliation in the appendix 2. Annualized 3. Annualized; includes a $94.2 million decrease in brokered deposits in 3Q24 Q3 ‘24 Financial Highlights Southern S
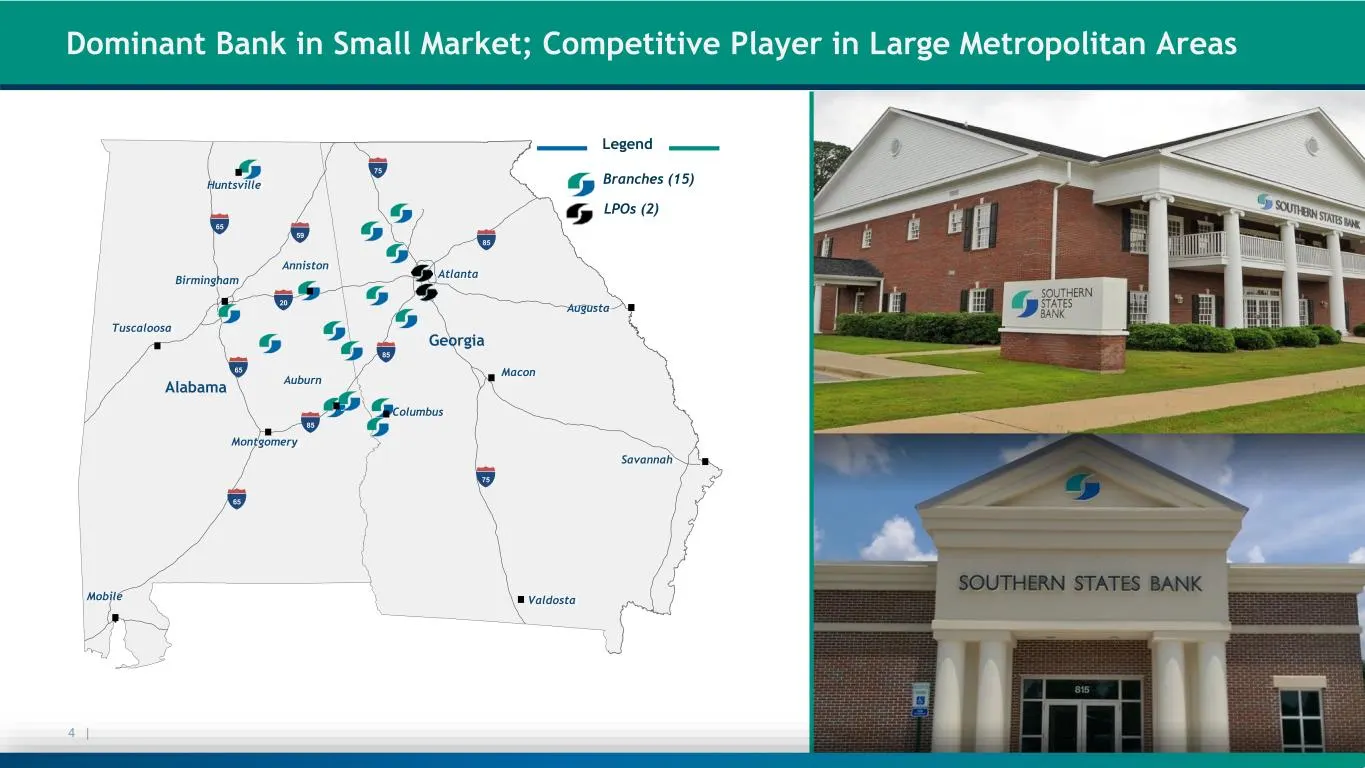
Slide 4: Dominant Bank in Small Market; Competitive Player in Large Metropolitan Areas
4 | Branches (15) Legend Huntsville Birmingham Montgomery Columbus Atlanta Alabama Georgia 65 85 75 Anniston Auburn 20 85 75 85 65 65 59 Tuscaloosa LPOs (2) Mobile Savannah Macon Valdosta Augusta Dominant Bank in Small Market; Competitive Player in Large Metropolitan Areas
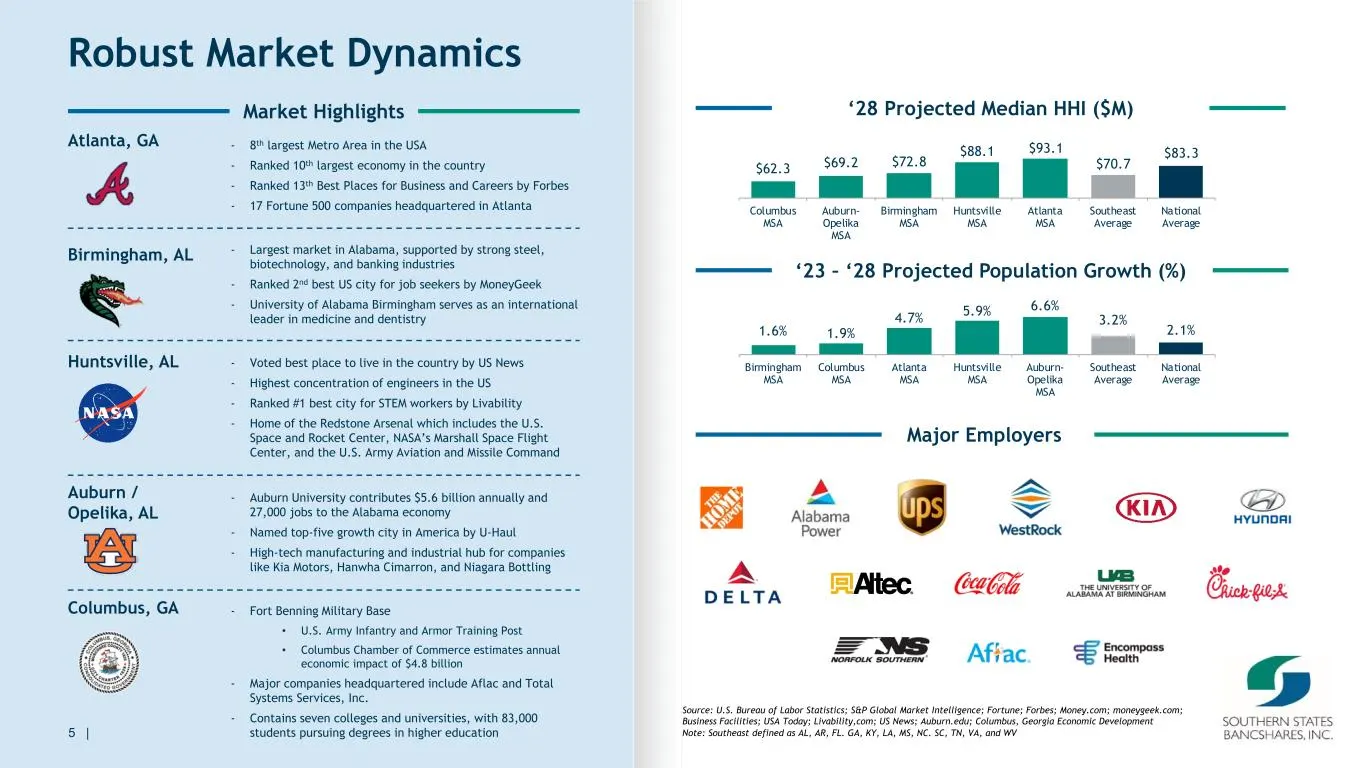
Slide 5: Robust Market Dynamics
$62.3 $69.2 $72.8 $88.1 $93.1 $70.7 $83.3 Columbus MSA Auburn- Opelika MSA Birmingham MSA Huntsville MSA Atlanta MSA Southeast Average National Average 1.6% 1.9% 4.7% 5.9% 6.6% 3.2% 2.1% Birmingham MSA Columbus MSA Atlanta MSA Huntsville MSA Auburn- Opelika MSA Southeast Average National Average Col
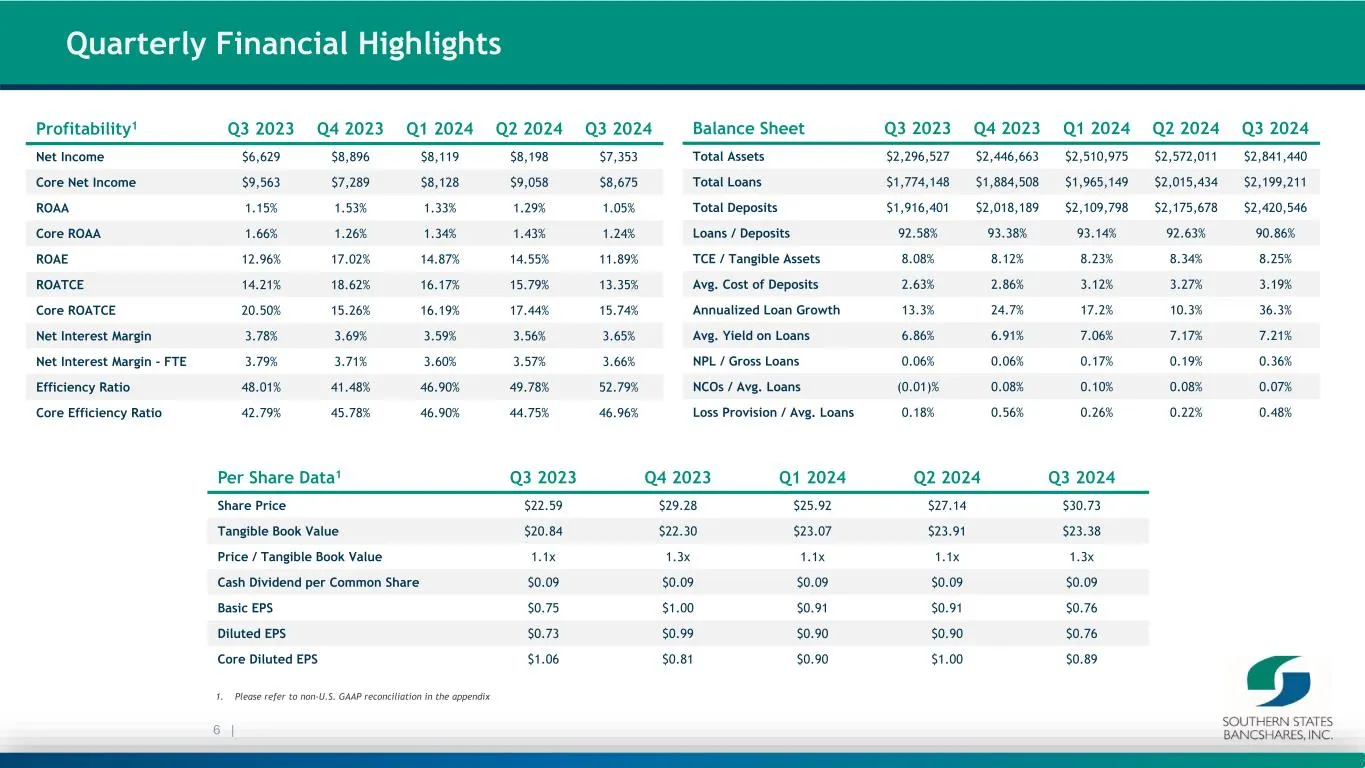
Slide 6: Profitability and Per Share Data
6 | 1. Please refer to non-U.S. GAAP reconciliation in the appendix Profitability1 Q3 2023 Q4 2023 Q1 2024 Q2 2024 Q3 2024 Net Income $6,629 $8,896 $8,119 $8,198 $7,353 Core Net Income $9,563 $7,289 $8,128 $9,058 $8,675 ROAA 1.15% 1.53% 1.33% 1.29% 1.05% Core ROAA 1.66% 1.26% 1.34% 1.43% 1.24% ROAE
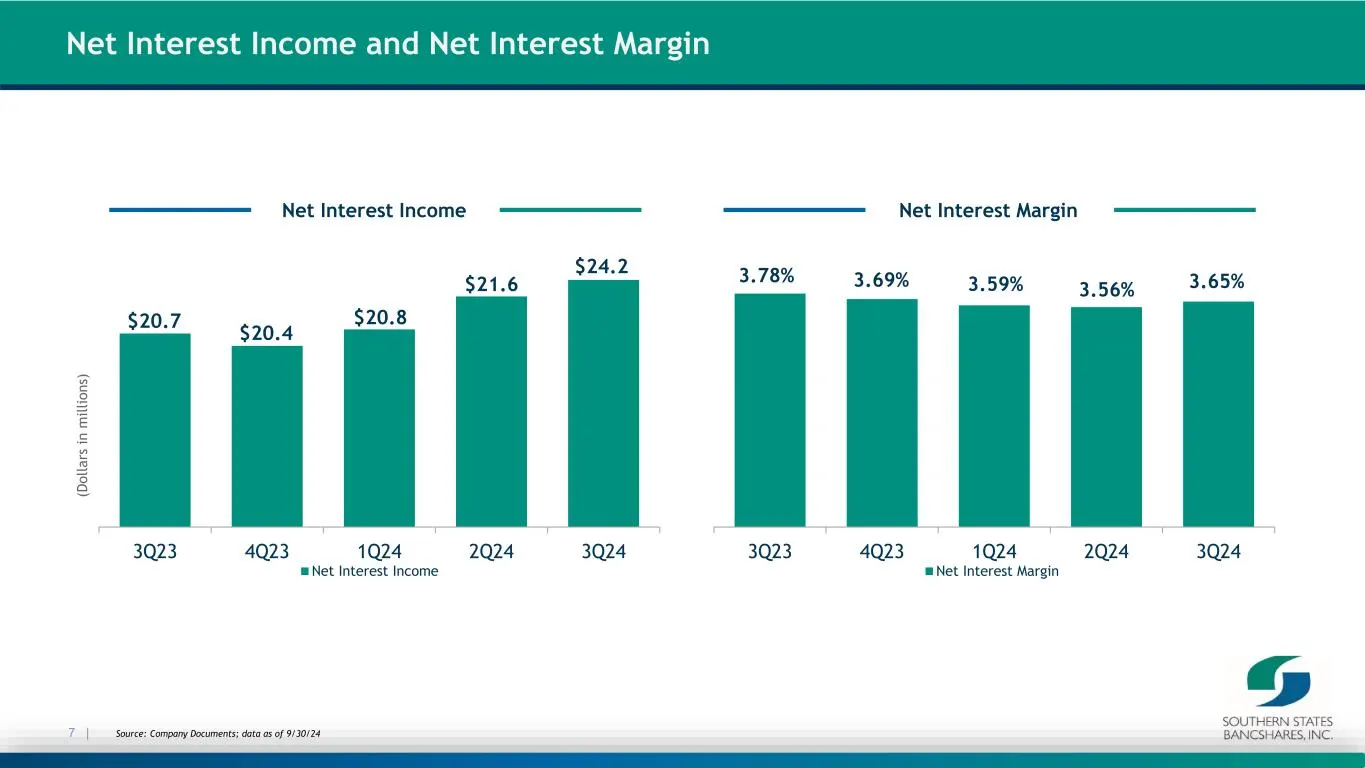
Slide 7: Net Interest Income and Net Interest Margin
$20.7 $20.4 $20.8 $21.6 $24.2 $16.0 $17.0 $18.0 $19.0 $20.0 $21.0 $22.0 3Q23 4Q23 1Q24 2Q24 3Q24 Net Interest Income 7 | (D ol la rs in m ill io ns ) Net Interest Income Net Interest Margin Source: Company Documents; data as of 9/30/24 Net Interest Income and Net Interest Margin 3.78% 3.69% 3.59% 3.
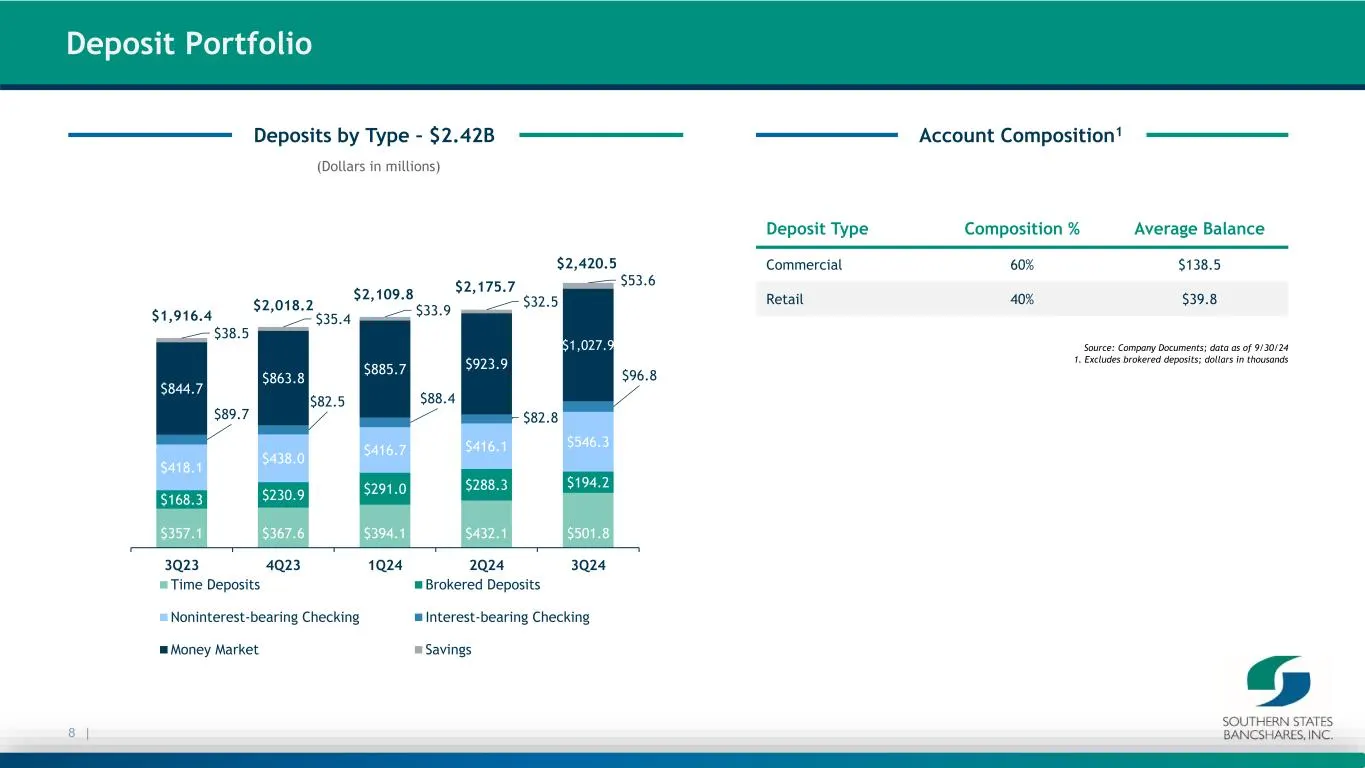
Slide 8: Deposit Portfolio
$357.1 $367.6 $394.1 $432.1 $501.8 $168.3 $230.9 $291.0 $288.3 $194.2 $418.1 $438.0 $416.7 $416.1 $546.3 $89.7 $82.5 $88.4 $82.8 $96.8 $844.7 $863.8 $885.7 $923.9 $1,027.9 $38.5 $35.4 $33.9 $32.5 $53.6 $1,916.4 $2,018.2 $2,109.8 $2,175.7 $2,420.5 3Q23 4Q23 1Q24 2Q24 3Q24 Time Deposits Brokered Depos
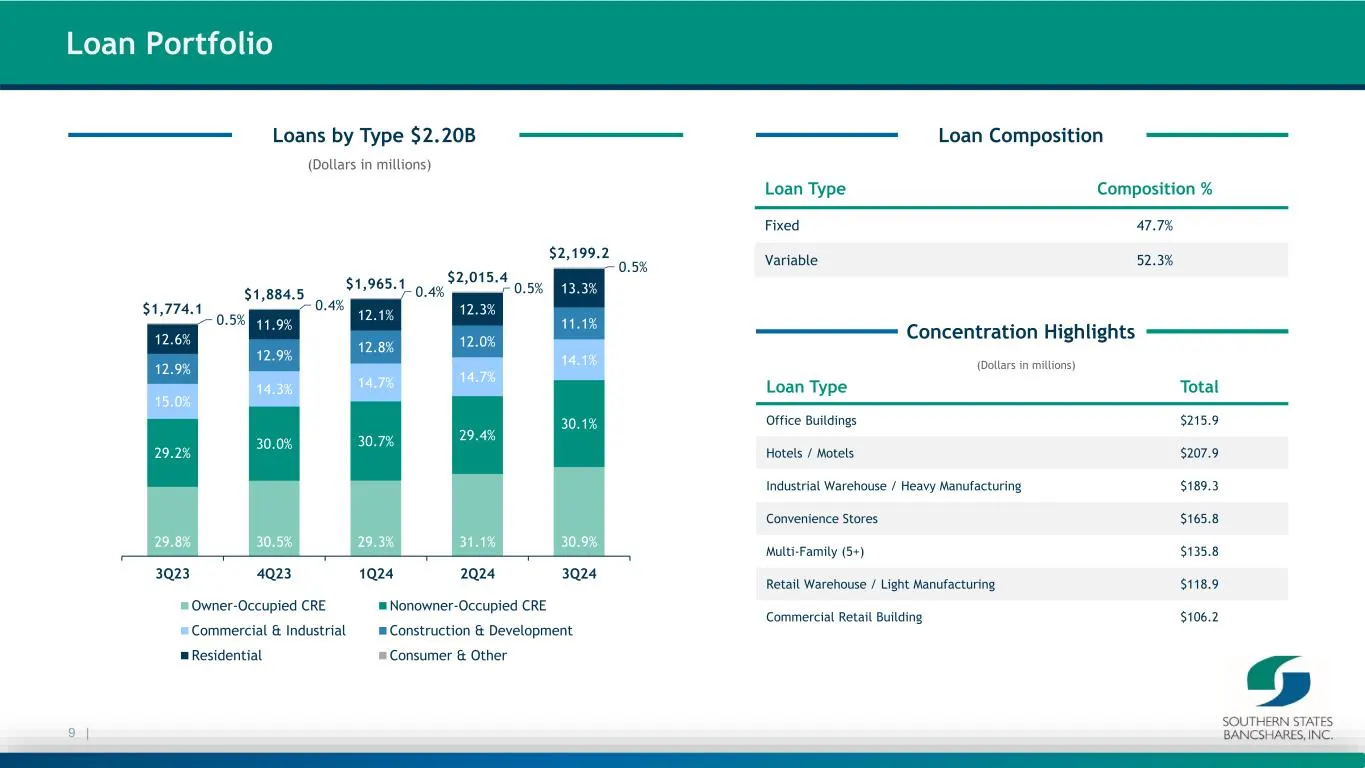
Slide 9: Loan Portfolio
Loan Type Composition % Fixed 47.7% Variable 52.3% 9 | Loan Type Total Office Buildings $215.9 Hotels / Motels $207.9 Industrial Warehouse / Heavy Manufacturing $189.3 Convenience Stores $165.8 Multi-Family (5+) $135.8 Retail Warehouse / Light Manufacturing $118.9 Commercial Retail Building $106.2 C
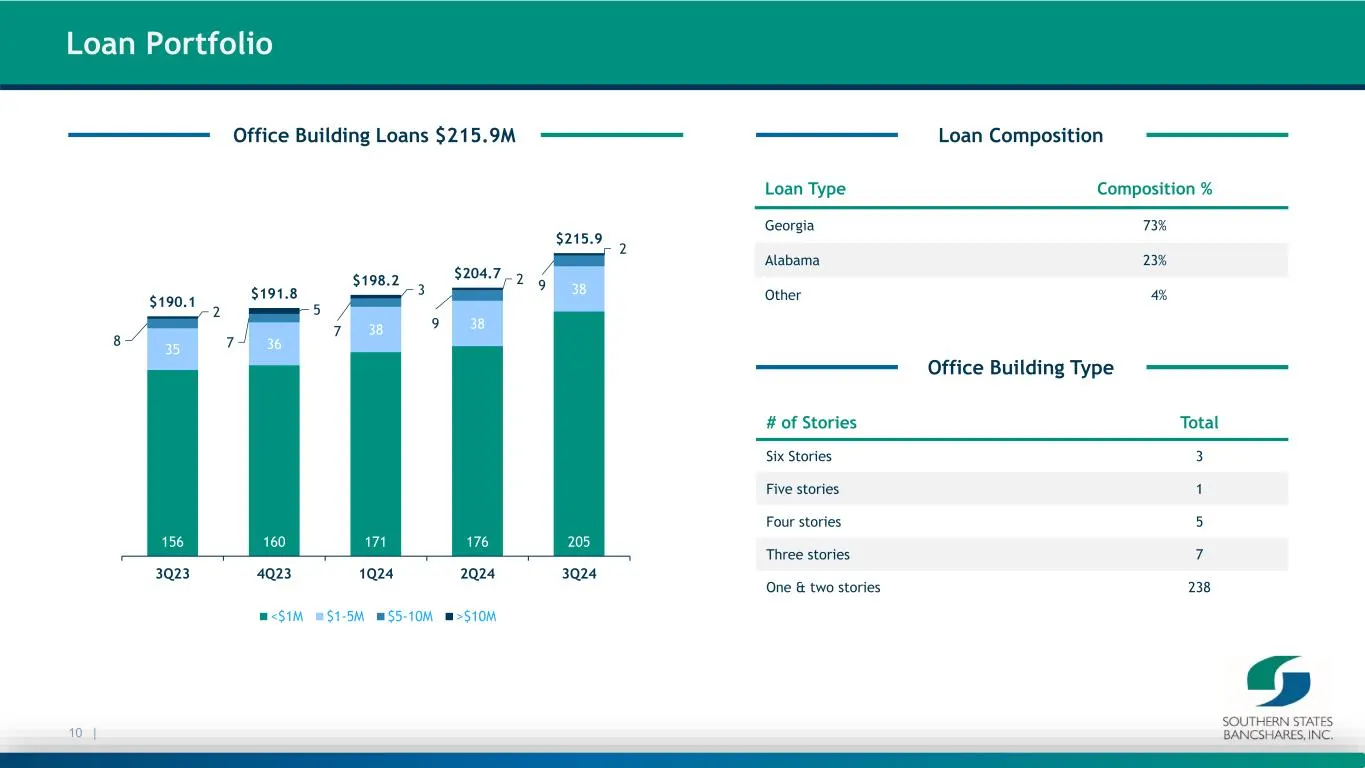
Slide 10: Loan Portfolio - Office Buildings
Loan Type Composition % Georgia 73% Alabama 23% Other 4% 10 | # of Stories Total Six Stories 3 Five stories 1 Four stories 5 Three stories 7 One & two stories 238 Office Building Type Office Building Loans $215.9M Loan Composition 156 160 171 176 205 35 36 38 38 38 8 7 7 9 9 2 5 3 2 2 $190.1 $191.8
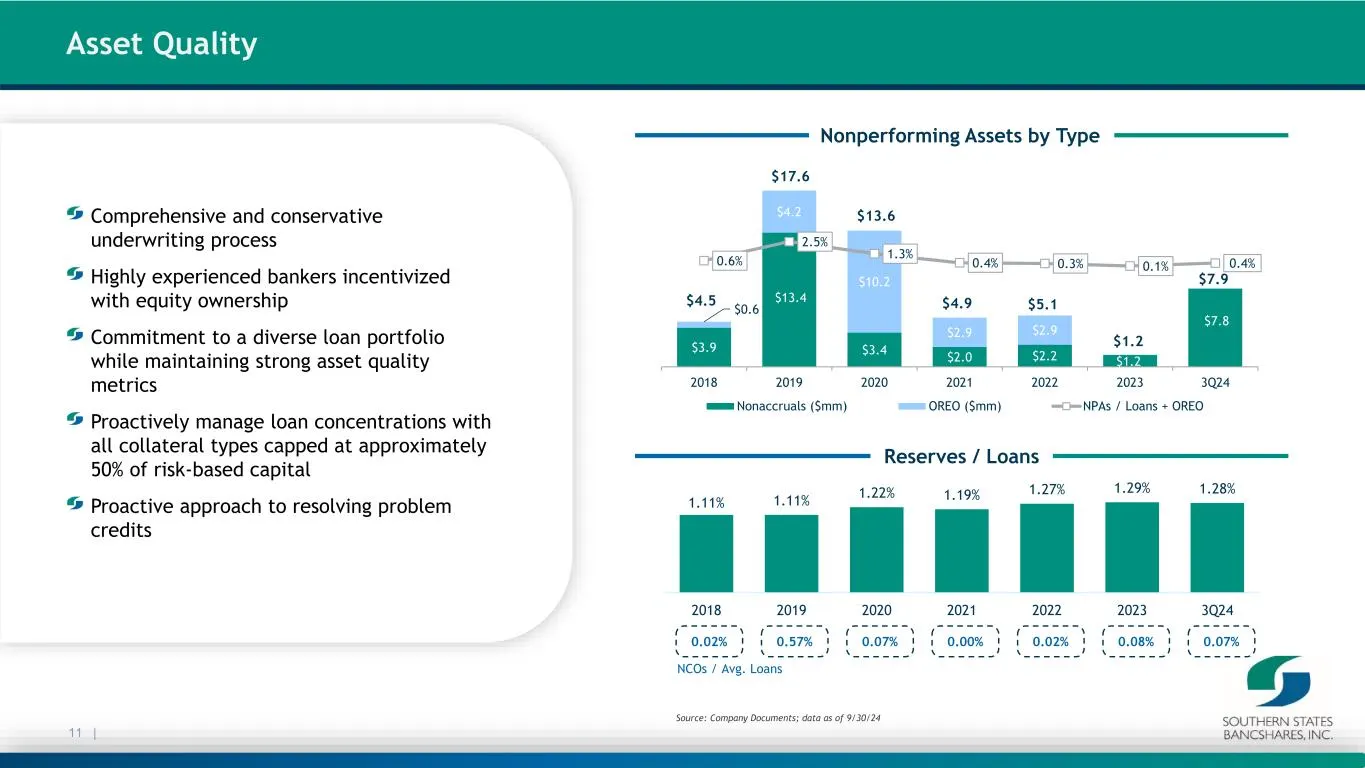
Slide 11: Asset Quality
$3.9 $13.4 $3.4 $2.0 $2.2 $1.2 $7.8 $0.6 $4.2 $10.2 $2.9 $2.9 0.6% 2.5% 1.3% 0.4% 0.3% 0.1% 0.4% $0.0 $2.0 $4.0 $6.0 $8.0 $10.0 $12.0 $14.0 $16.0 $18.0 $20.0 2018 2019 2020 2021 2022 2023 3Q24 Nonaccruals ($mm) OREO ($mm) NPAs / Loans + OREO $17.6 1.11% 1.11% 1.22% 1.19% 1.27% 1.29% 1.28% 2018 2019
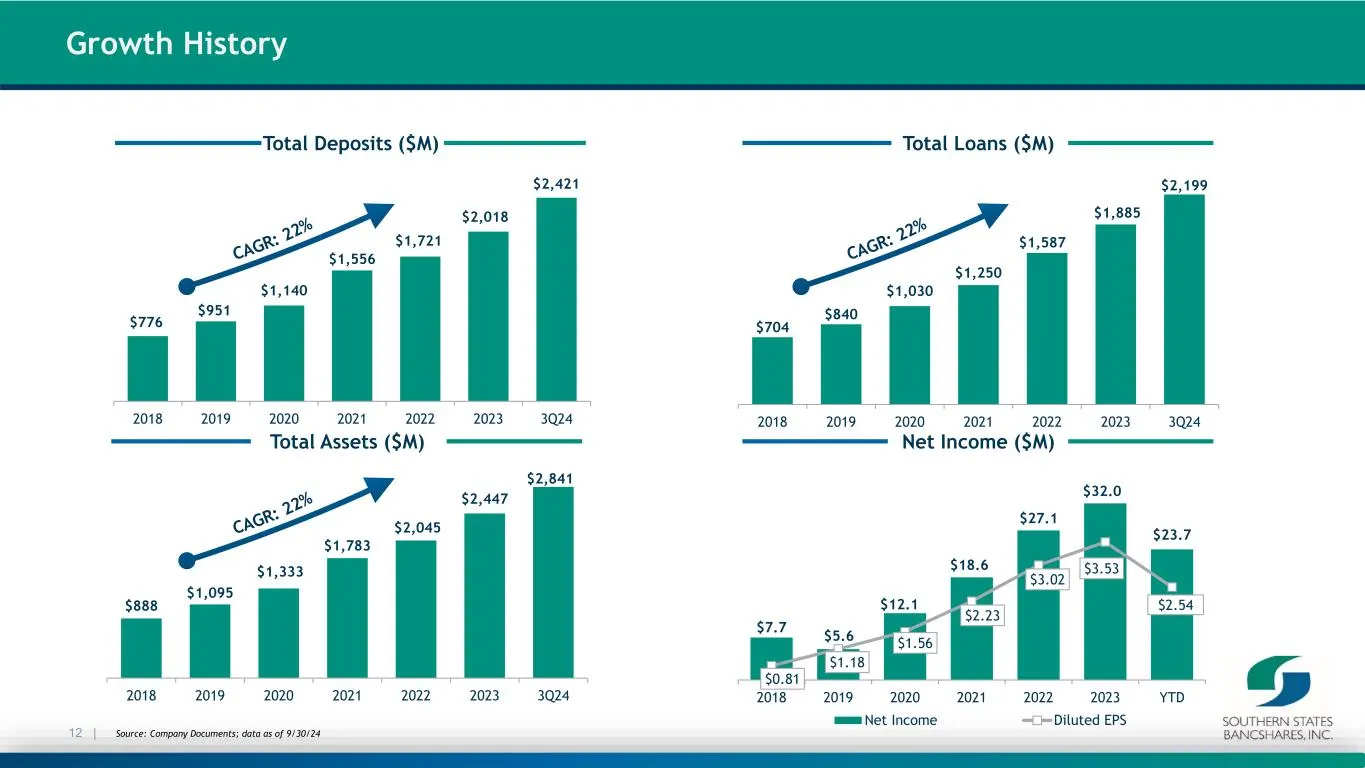
Slide 12: Growth History
$704 $840 $1,030 $1,250 $1,587 $1,885 $2,199 2018 2019 2020 2021 2022 2023 3Q24 $776 $951 $1,140 $1,556 $1,721 $2,018 $2,421 2018 2019 2020 2021 2022 2023 3Q24 $888 $1,095 $1,333 $1,783 $2,045 $2,447 $2,841 2018 2019 2020 2021 2022 2023 3Q24 Net Income ($M)Total Assets ($M) Total Deposits ($M) Total
Slide 13: Our Strategic Focus - Building Shareholder Value
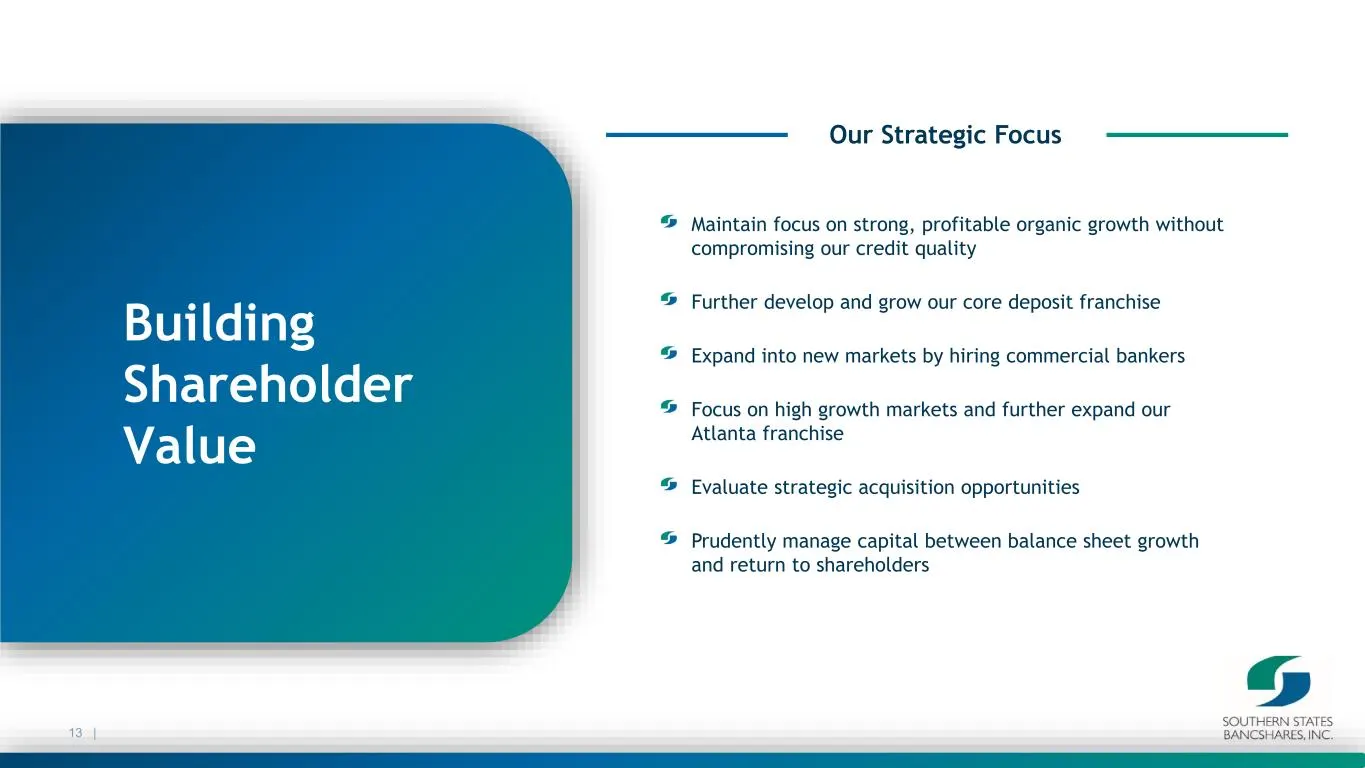
13 | Building Shareholder Value Maintain focus on strong, profitable organic growth without compromising our credit quality Further develop and grow our core deposit franchise Expand into new markets by hiring commercial bankers Focus on high growth markets and further expand our Atlanta franchise E
Slide 14: (Bees
Oa = (Bees i it} Hil | \\ A i i
Slide 15: Non-GAAP Financial Measures Reconciliations
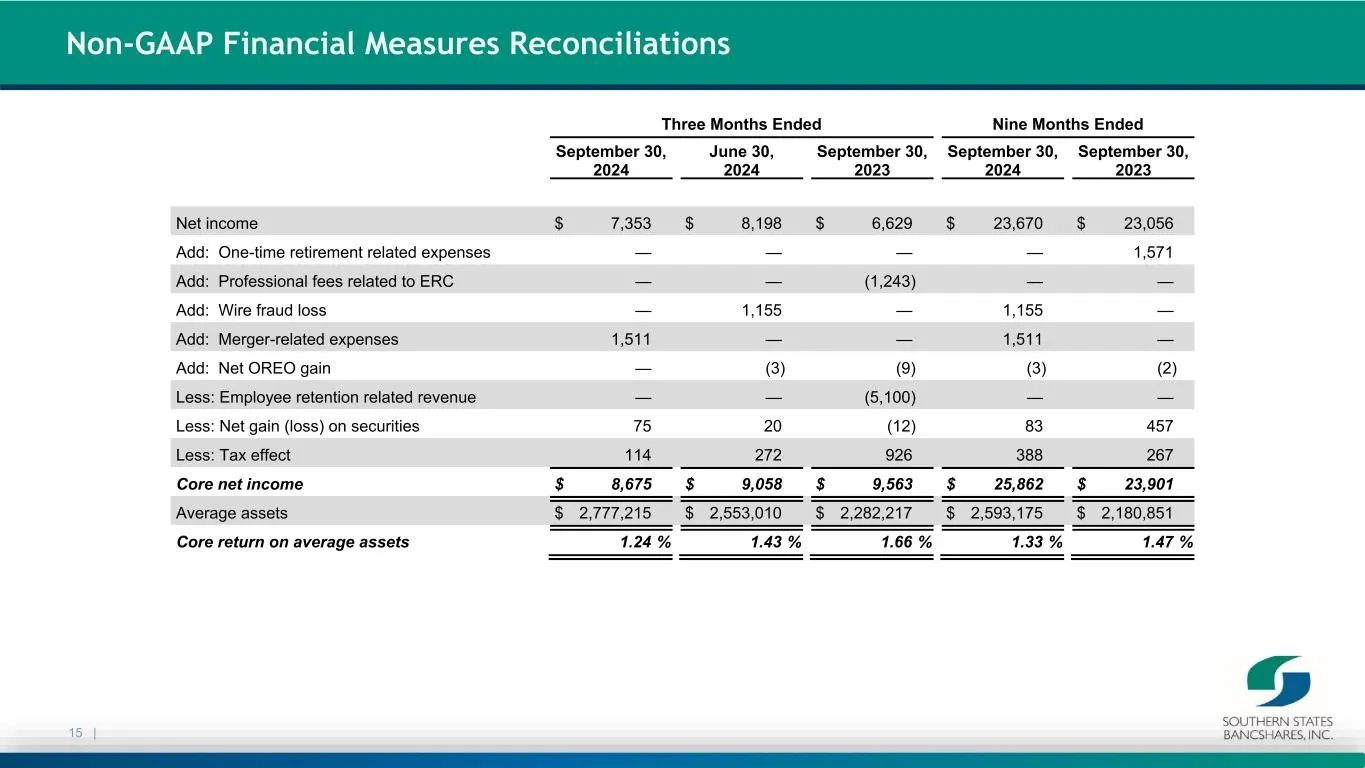
15 | Non-GAAP Financial Measures Reconciliations Three Months Ended Nine Months Ended September 30, 2024 June 30, 2024 September 30, 2023 September 30, 2024 September 30, 2023 Net income $ 7,353 $ 8,198 $ 6,629 $ 23,670 $ 23,056 Add: One-time retirement related expenses — — — — 1,571 Add: Profession
Slide 16: Non-GAAP Financial Measures Reconciliations
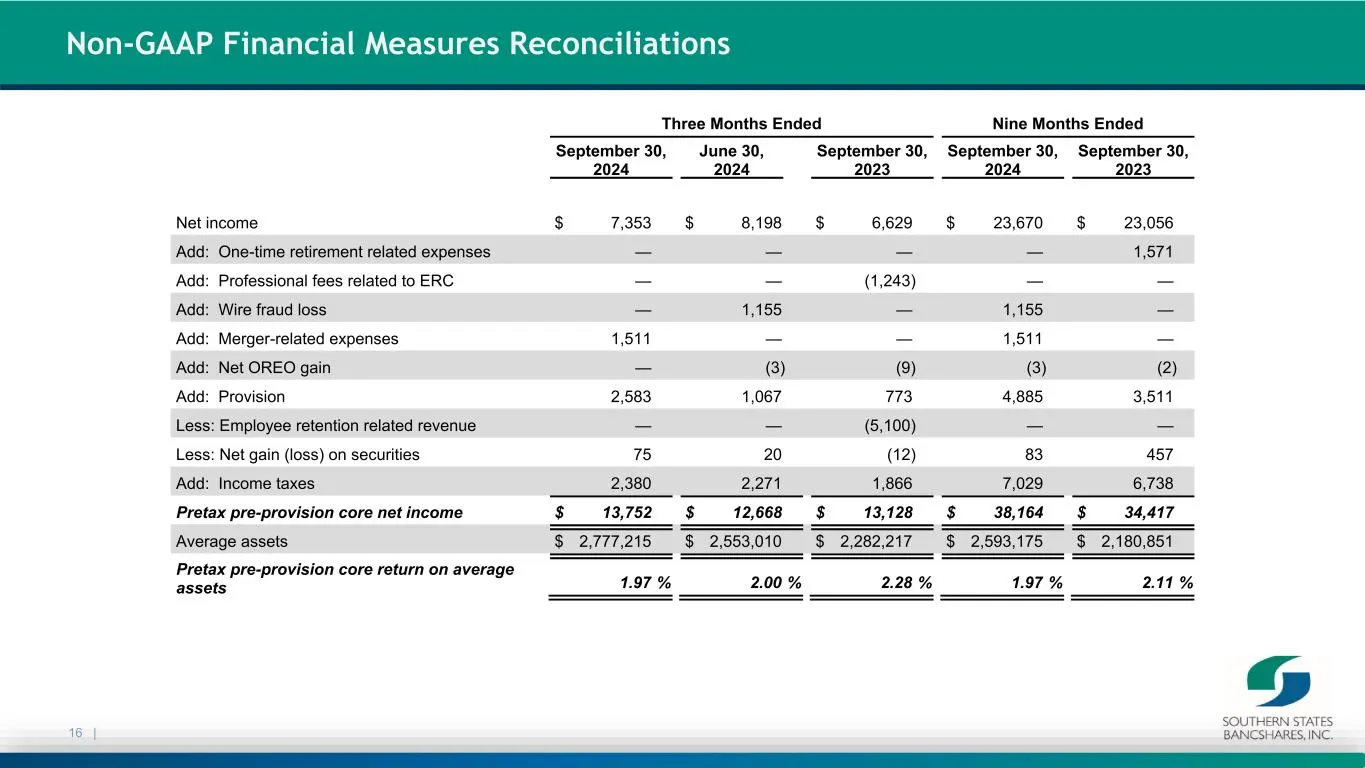
16 | Non-GAAP Financial Measures Reconciliations Three Months Ended Nine Months Ended September 30, 2024 June 30, 2024 September 30, 2023 September 30, 2024 September 30, 2023 Net income $ 7,353 $ 8,198 $ 6,629 $ 23,670 $ 23,056 Add: One-time retirement related expenses — — — — 1,571 Add: Profession
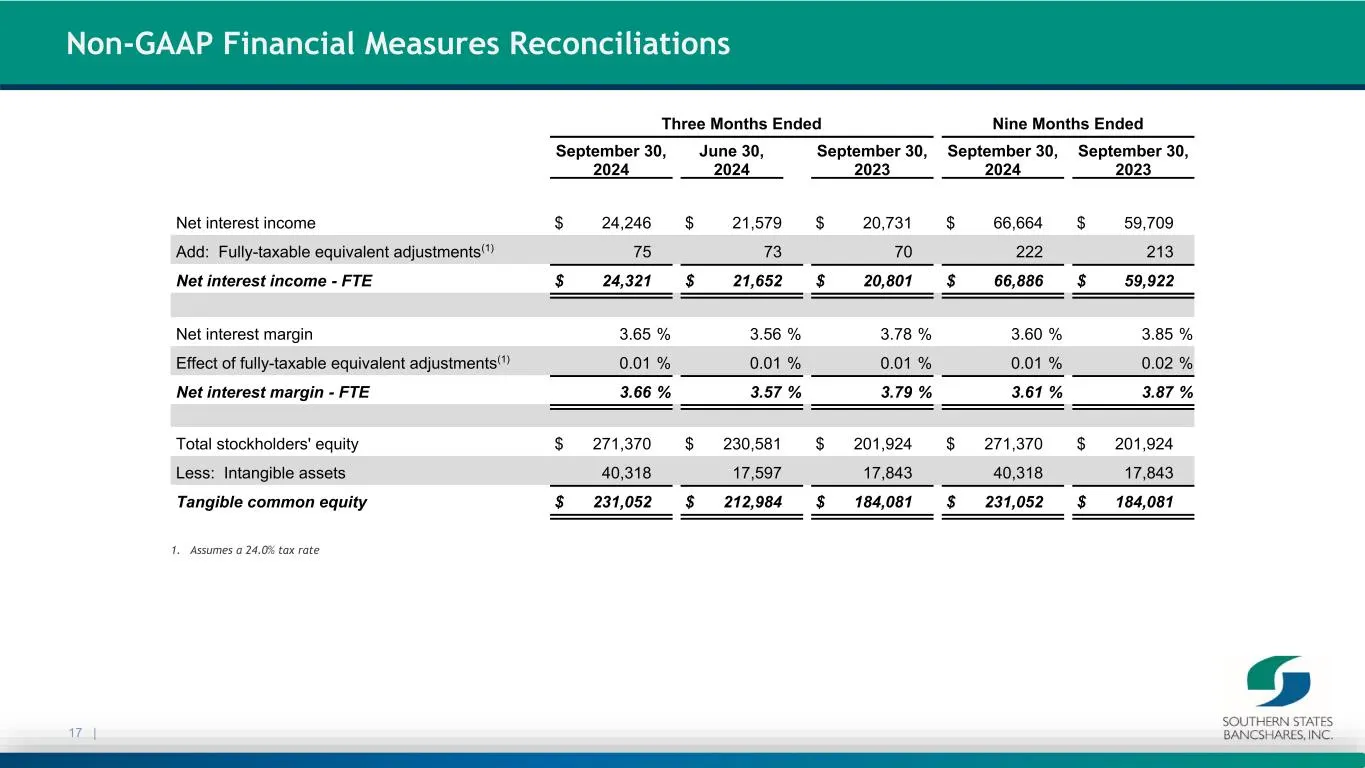
Slide 17: Non-GAAP Financial Measures Reconciliations
17 | Non-GAAP Financial Measures Reconciliations Three Months Ended Nine Months Ended September 30, 2024 June 30, 2024 September 30, 2023 September 30, 2024 September 30, 2023 Net interest income $ 24,246 $ 21,579 $ 20,731 $ 66,664 $ 59,709 Add: Fully-taxable equivalent adjustments(1) 75 73 70 222 2
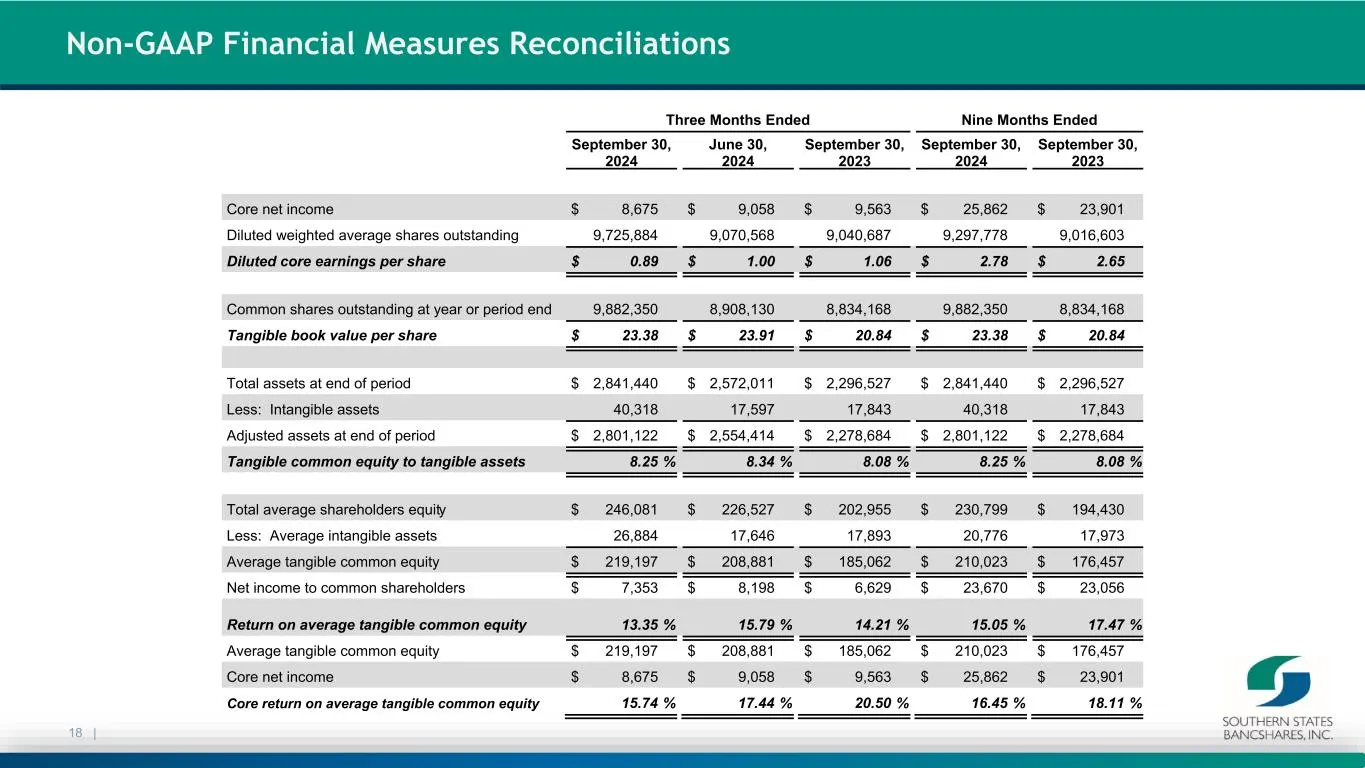
Slide 18: Non-GAAP Financial Measures Reconciliations
18 | Non-GAAP Financial Measures Reconciliations Three Months Ended Nine Months Ended September 30, 2024 June 30, 2024 September 30, 2023 September 30, 2024 September 30, 2023 Core net income $ 8,675 $ 9,058 $ 9,563 $ 25,862 $ 23,901 Diluted weighted average shares outstanding 9,725,884 9,070,568 9,
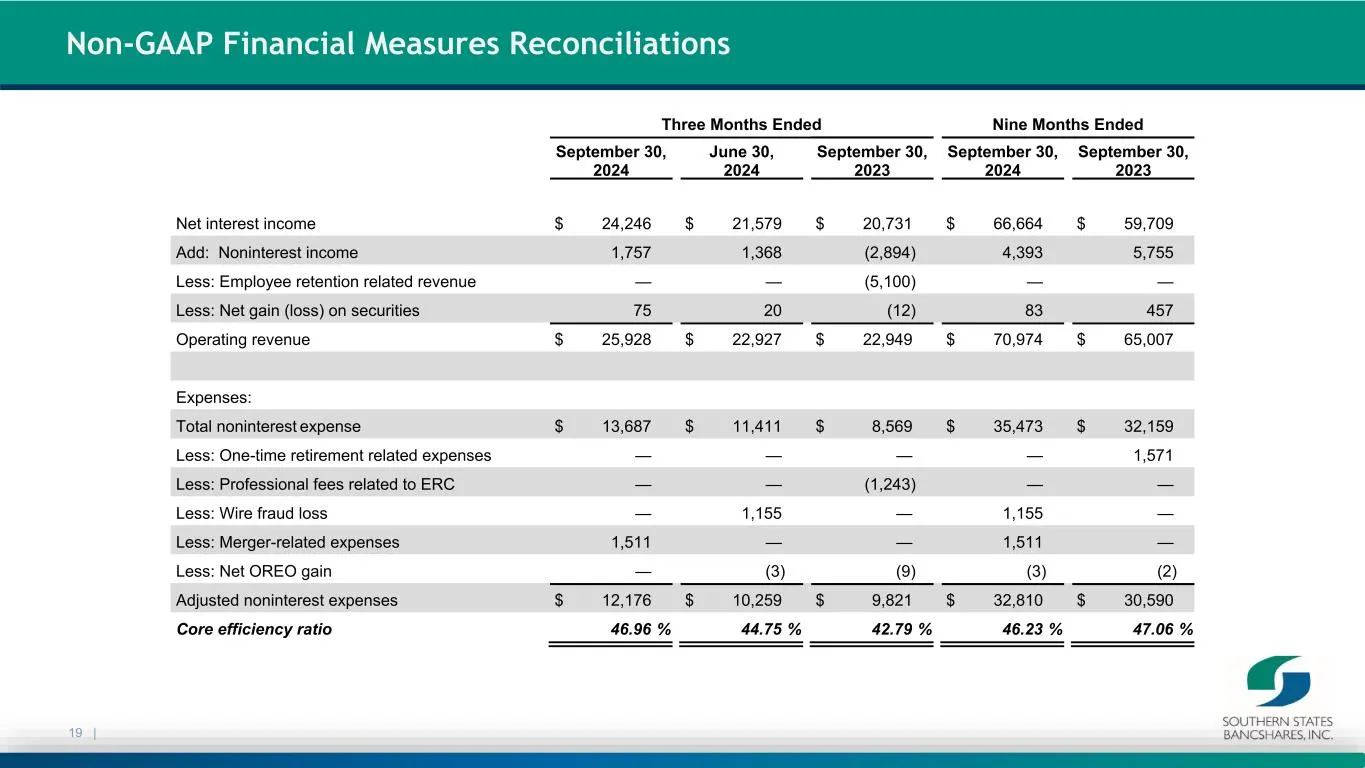
Slide 19: Non-GAAP Financial Measures Reconciliations
19 | Non-GAAP Financial Measures Reconciliations Three Months Ended Nine Months Ended September 30, 2024 June 30, 2024 September 30, 2023 September 30, 2024 September 30, 2023 Net interest income $ 24,246 $ 21,579 $ 20,731 $ 66,664 $ 59,709 Add: Noninterest income 1,757 1,368 (2,894) 4,393 5,755 Les
Source: SEC EDGAR · 8-K filed Oct 22, 2024
More decks from Southern States Bancshares Inc
 Stephens Investor Conference 202537 slides · Jun 3, 2025
 Q1 2025 Earnings Presentation22 slides · Apr 22, 2025
 Merger or Acquisition (March 2025)20 slides · Mar 31, 2025
 Q4 2024 Earnings Presentation22 slides · Jan 22, 2025
 Q2 2024 Earnings Presentation17 slides · Jul 23, 2024
 Q1 2024 Earnings Presentation17 slides · Apr 23, 2024