comScore, Inc. · NASDAQ:SCOR
comScore — comScore and EXPO Webinar: The Synergy of User Generated and Professional Video Content (April 2012)
45 slides from comScore's conference presentation, Apr 3, 2012

Slide 1: The Synergy of User Generated and Professional Video Content
The Synergy of User Generated and Professional Video Content 4/3/2012 Frank Findley, VP, Research & Development, comScore, Inc. Jessica Thorpe, VP, Marketing, EXPO Communications *A copy of today’s presentation will be sent to all attendees within 48 hours

Slide 2: Speakers
Y Frank Findley o VP R&D, comScore u Jessica Thorpe r VP Marketing, EXPO S p e a k e r s © comScore, Inc. Proprietary. 2

Slide 3: comScore Customer Knowledge Platform
comScore Customer Knowledge Platform: A granular 360° view of the multitude of online activities for 2 million global users Designed to be representative of the total online population. © comScore, Inc. Proprietary. 3 TRUSTe certified for information privacy & security.
Slide 4: A Digital Business Analytics Company
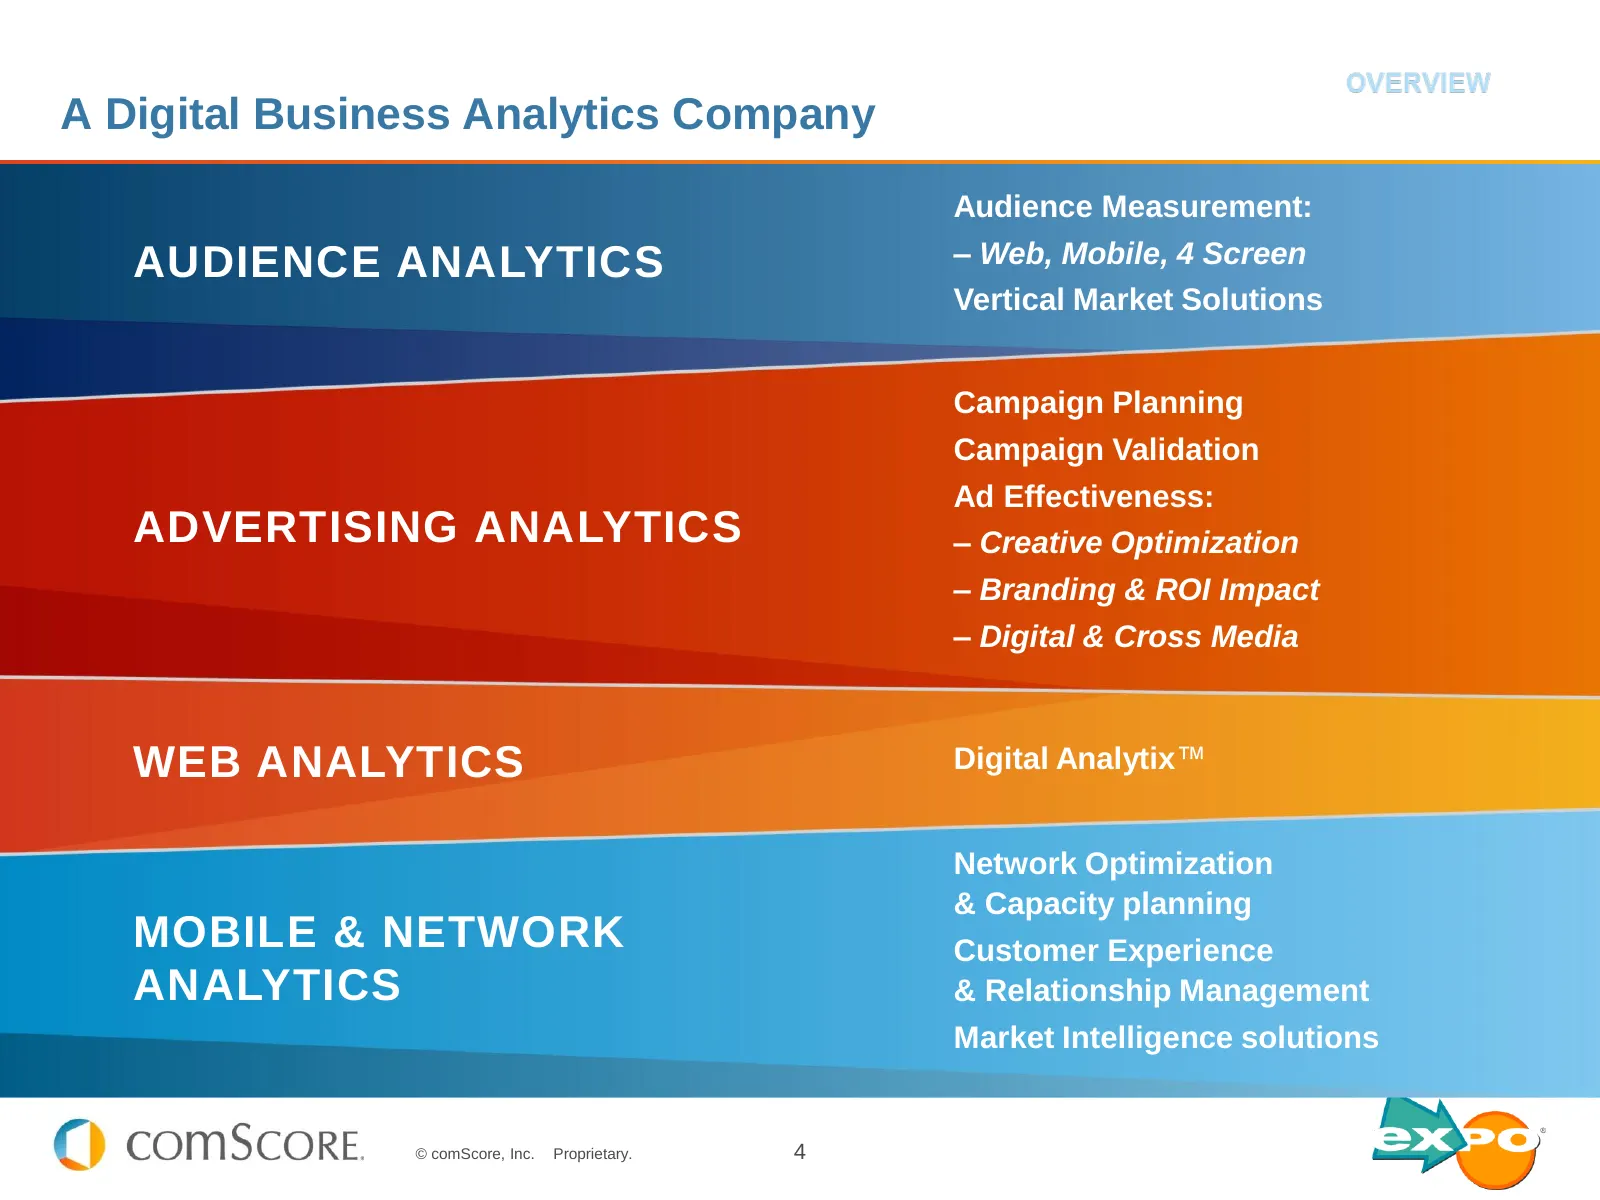
A Digital Business Analytics Company Audience Measurement: AUDIENCE ANALYTICS – Web, Mobile, 4 Screen Vertical Market Solutions Campaign Planning Campaign Validation Ad Effectiveness: ADVERTISING ANALYTICS – Creative Optimization – Branding & ROI Impact – Digital & Cross Media WEB ANALYTICS Digital
Slide 5: Agenda
Agenda Introduction to EXPO and User Generated Product Videos – What are they? – How can they be used in marketing and e-commerce Findings from previous research Current research – blinded case example Summary and some suggested best practices Q&A © comScore, Inc. Proprietary. 5

Slide 6: Introduction to EXPO and User Generated Product Videos
Introduction to EXPO and User Generated Product Videos © comScore, Inc. Proprietary. 6
Slide 7: EXPO Communications Inc. Overview
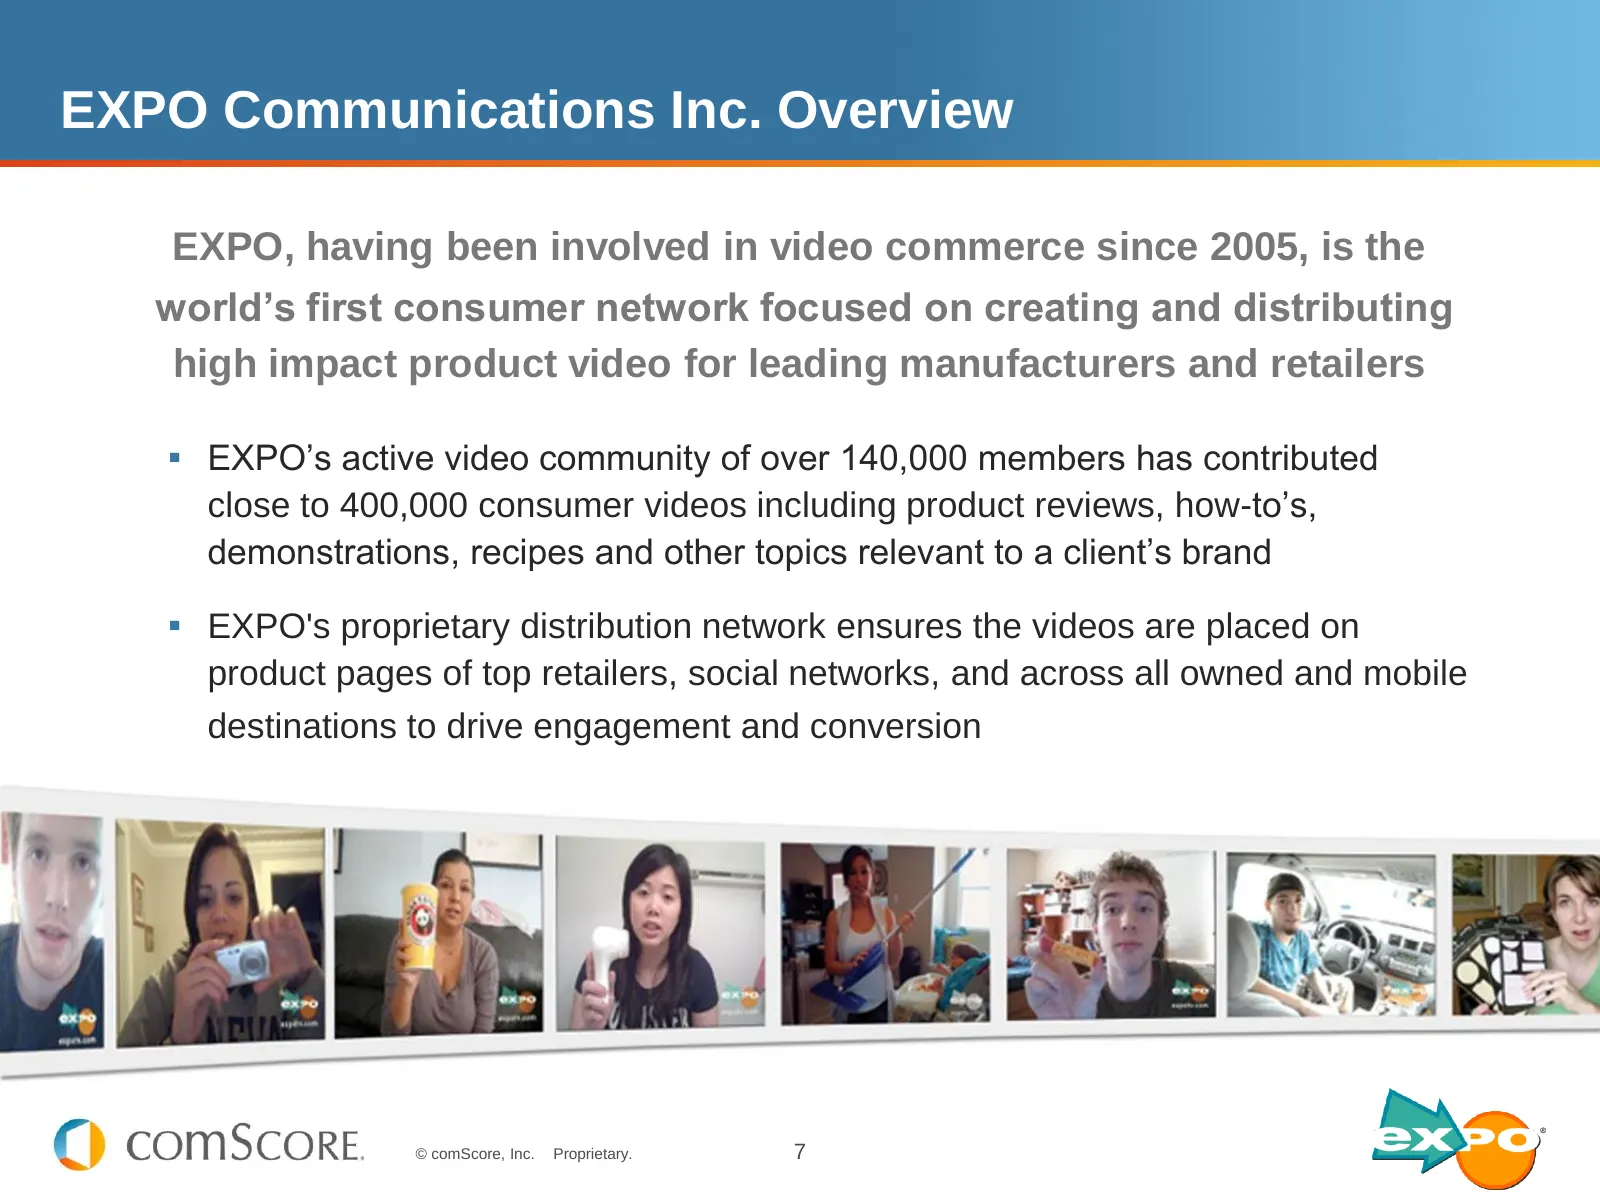
EXPO Communications Inc. Overview EXPO, having been involved in video commerce since 2005, is the world’s first consumer network focused on creating and distributing high impact product video for leading manufacturers and retailers EXPO’s active video community of over 140,000 members has contribu
Slide 8: Paid Media Integration
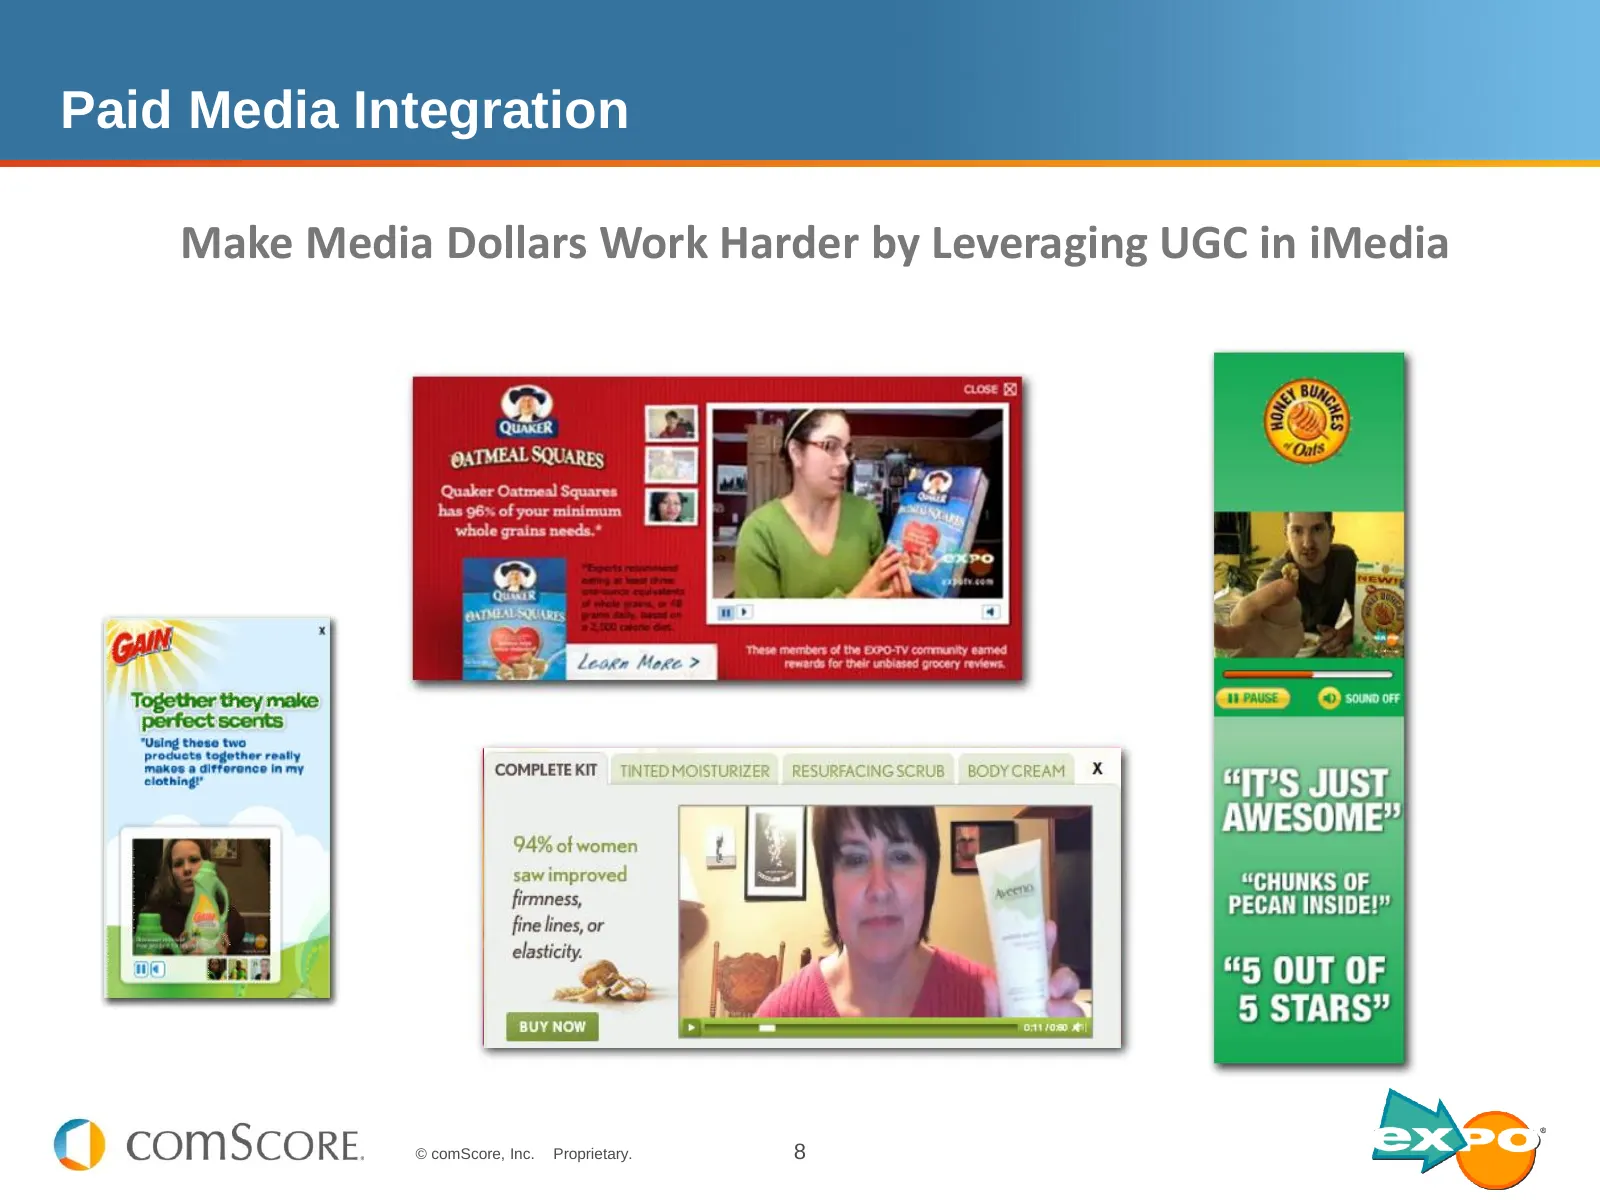
Paid Media Integration Increase Conversions at Digital Point of Purchase Make Media Dollars Work Harder by Leveraging UGC in iMedia © comScore, Inc. Proprietary. 8
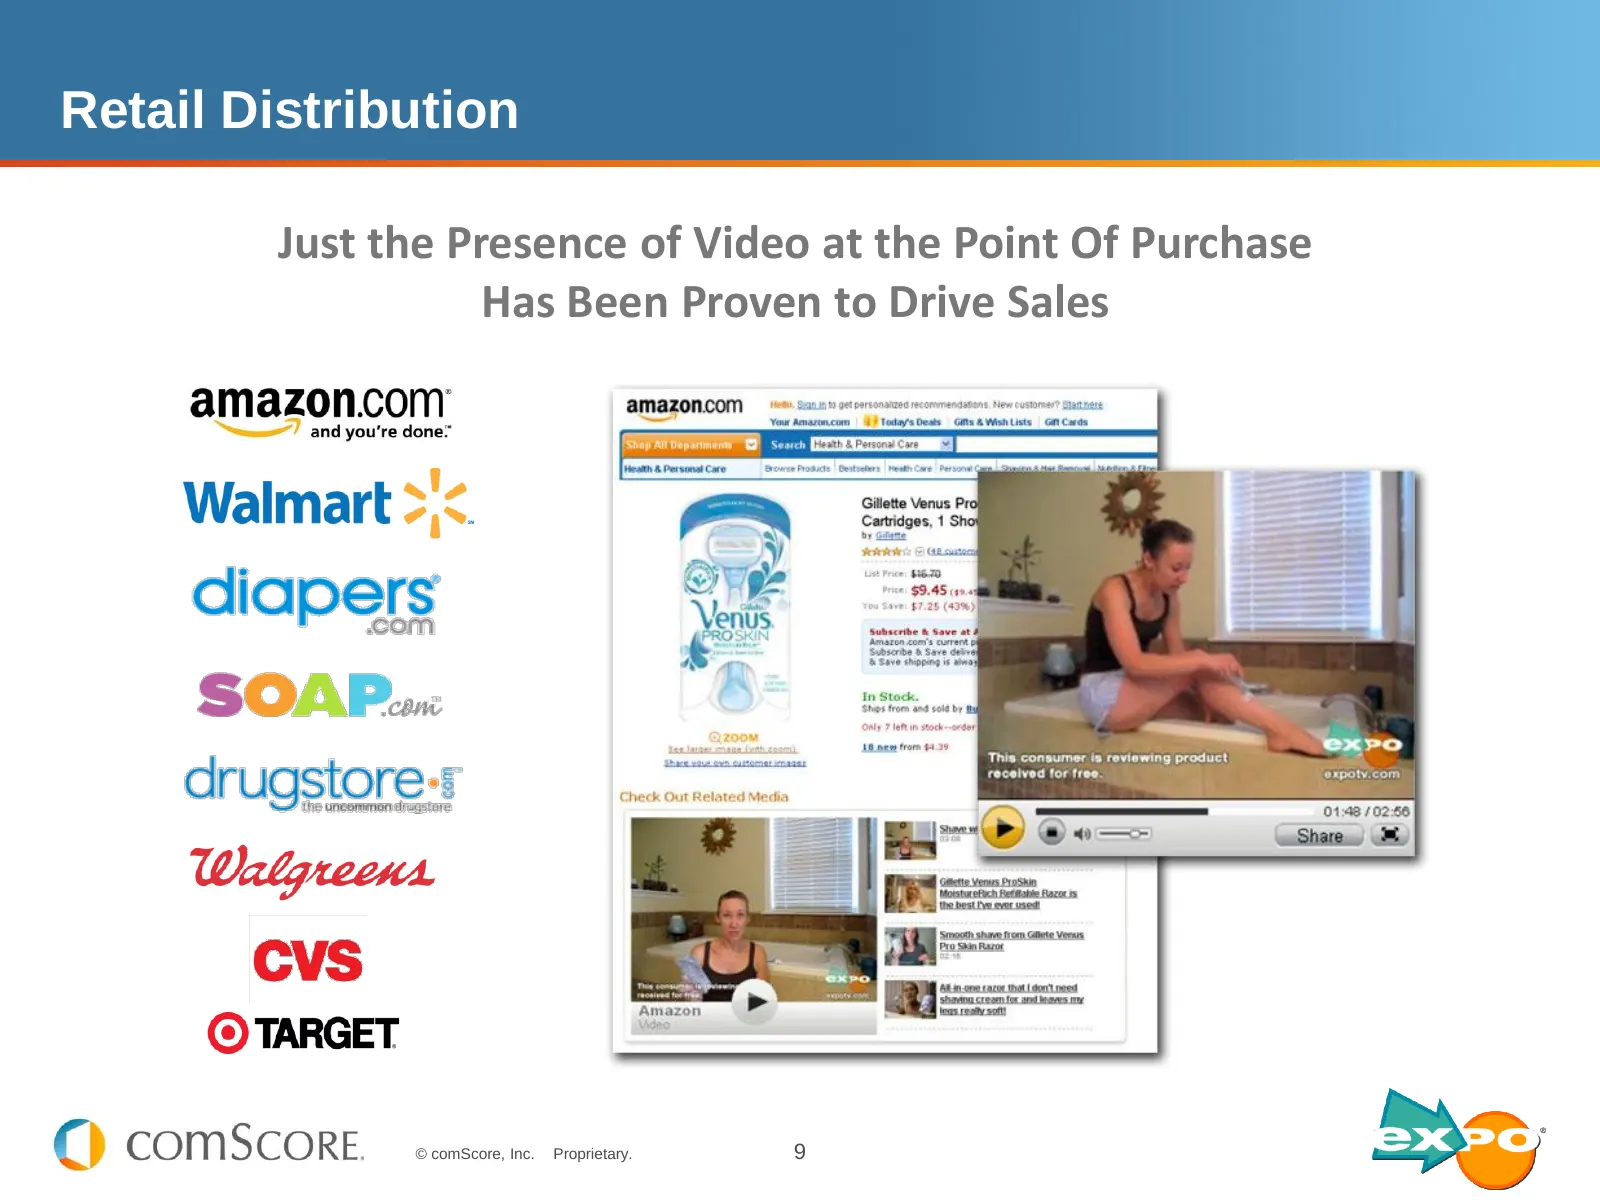
Slide 9: Retail Distribution
Retail Distribution Increase Conversions at Digital Point of Purchase Just the Presence of Video at the Point Of Purchase Has Been Proven to Drive Sales © comScore, Inc. Proprietary. 9
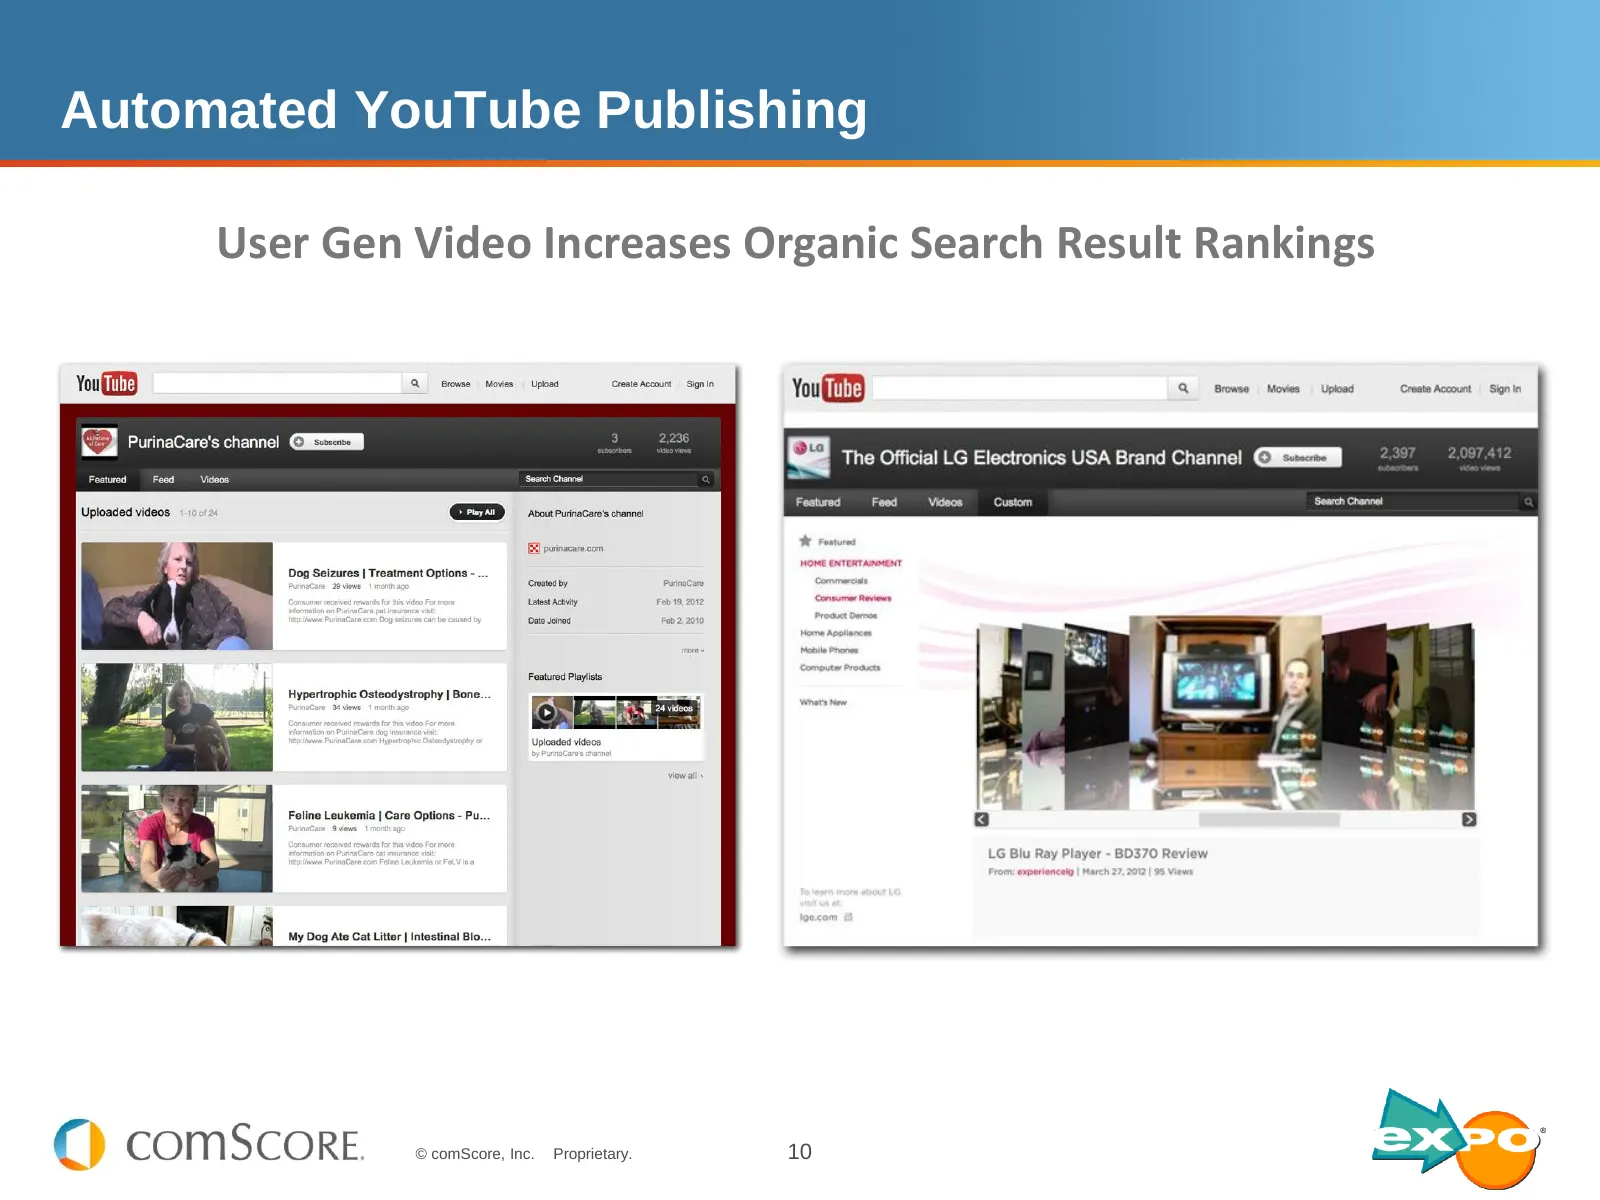
Slide 10: Automated YouTube Publishing
Automated YouTube Publishing Increase Conversions at Digital Point of Purchase User Gen Video Increases Organic Search Result Rankings © comScore, Inc. Proprietary. 10
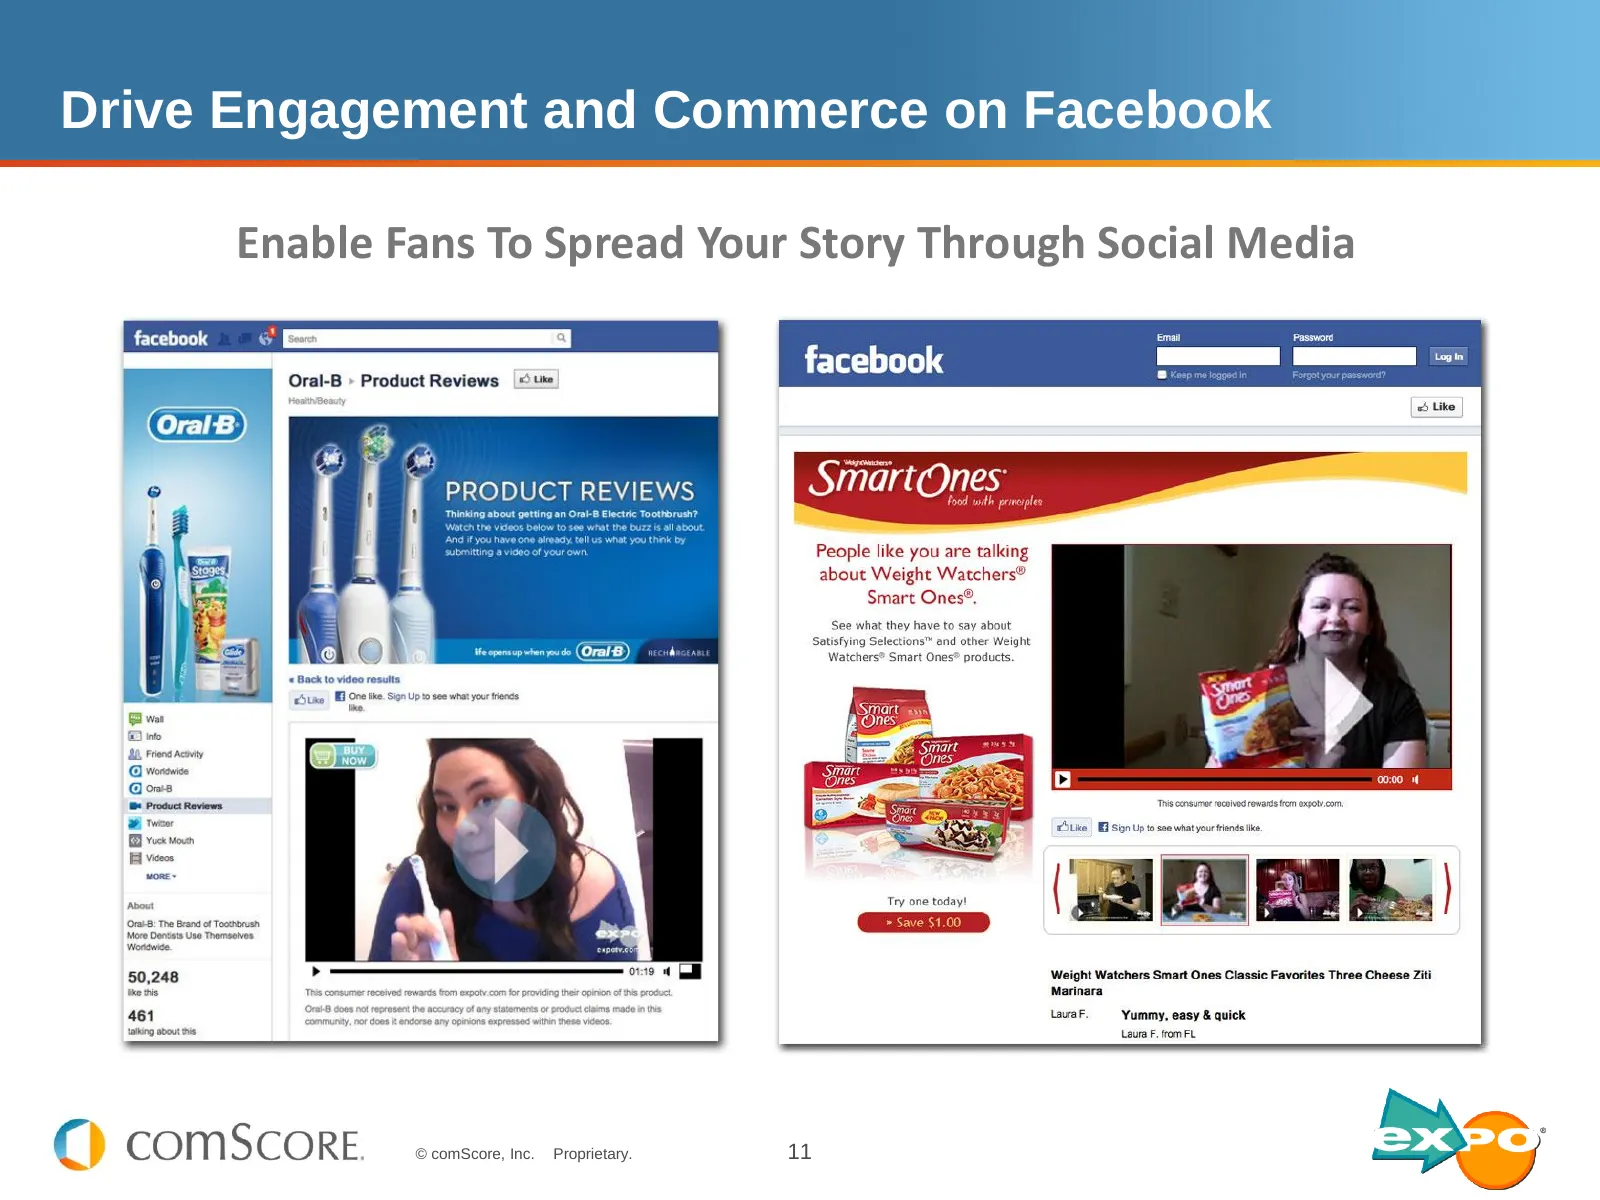
Slide 11: Drive Engagement and Commerce on Facebook
Drive Engagement and Commerce on Facebook Increase Conversions at Digital Point of Purchase Enable Fans To Spread Your Story Through Social Media © comScore, Inc. Proprietary. 11
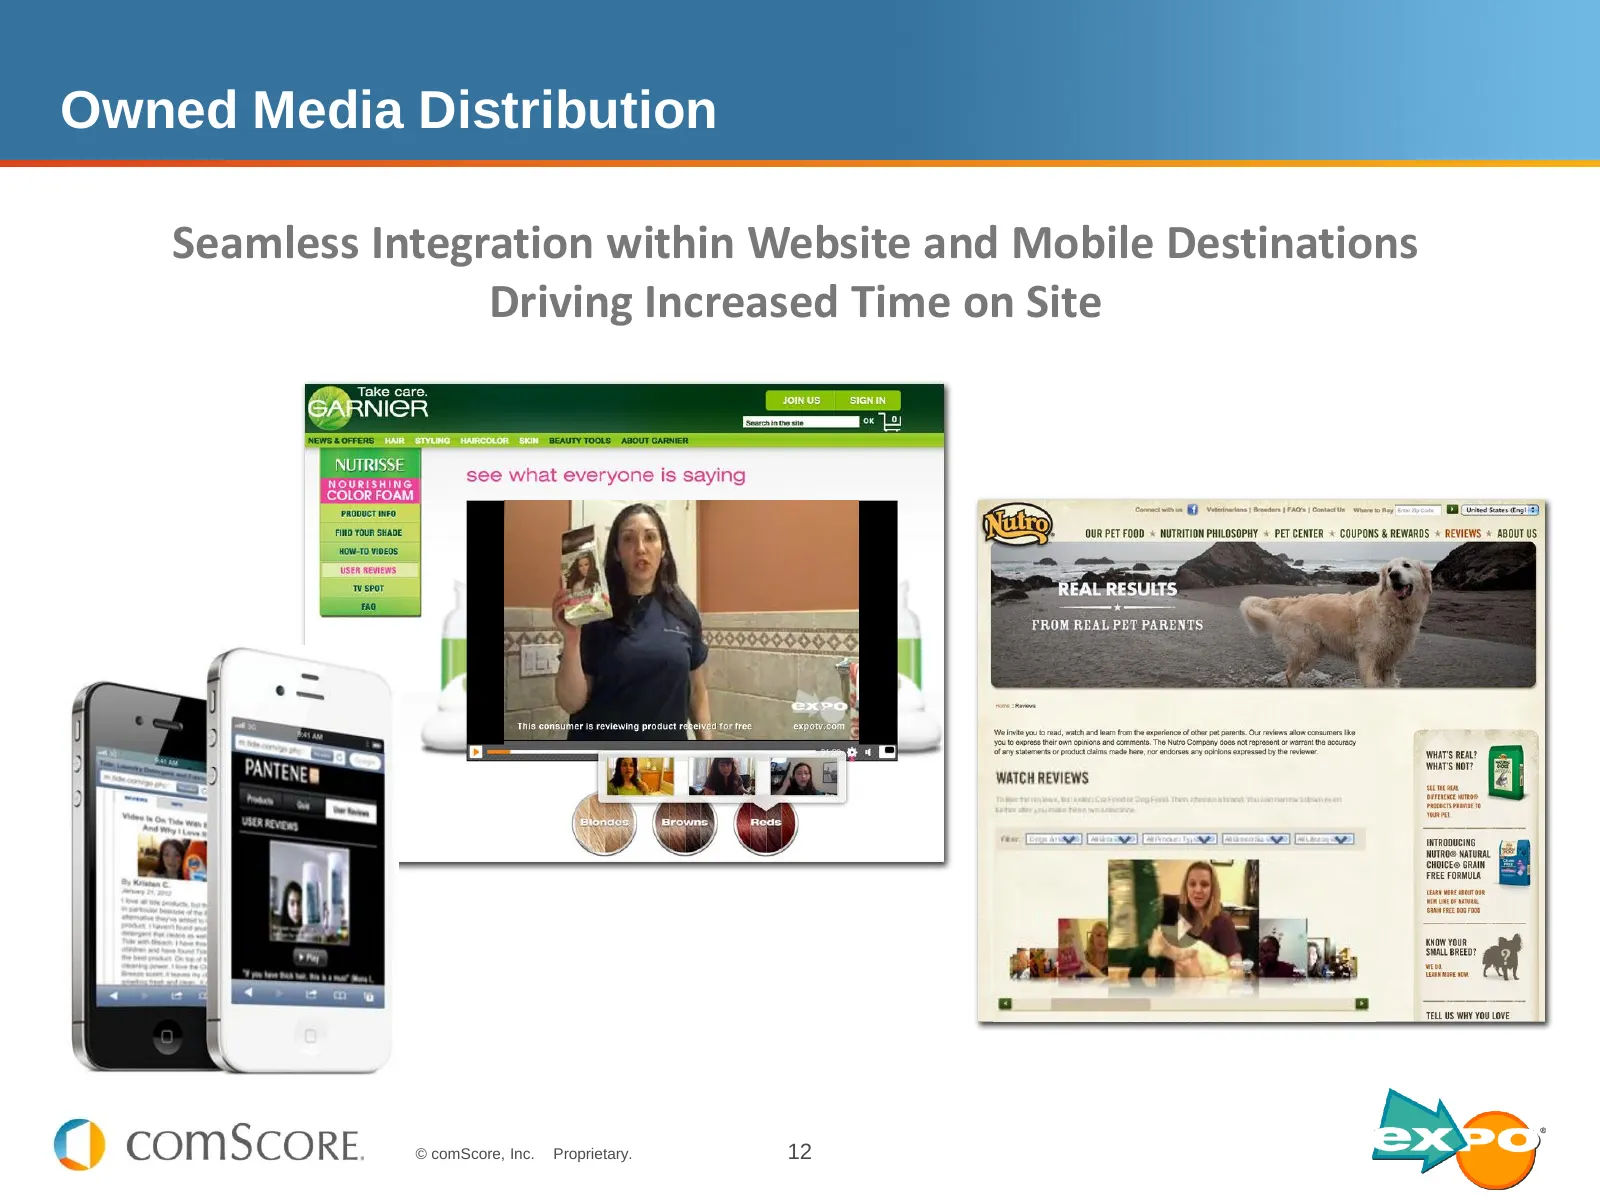
Slide 12: Owned Media Distribution
Owned Media Distribution Increase Conversions at Digital Point of Purchase Seamless Integration within Website and Mobile Destinations Driving Increased Time on Site © comScore, Inc. Proprietary. 12
Slide 13: Video Montage
Video Montage © comScore, Inc. Proprietary. 13

Slide 14: Previous Findings
Previous Findings © comScore, Inc. Proprietary. 14
Slide 15: Two Phases of Research
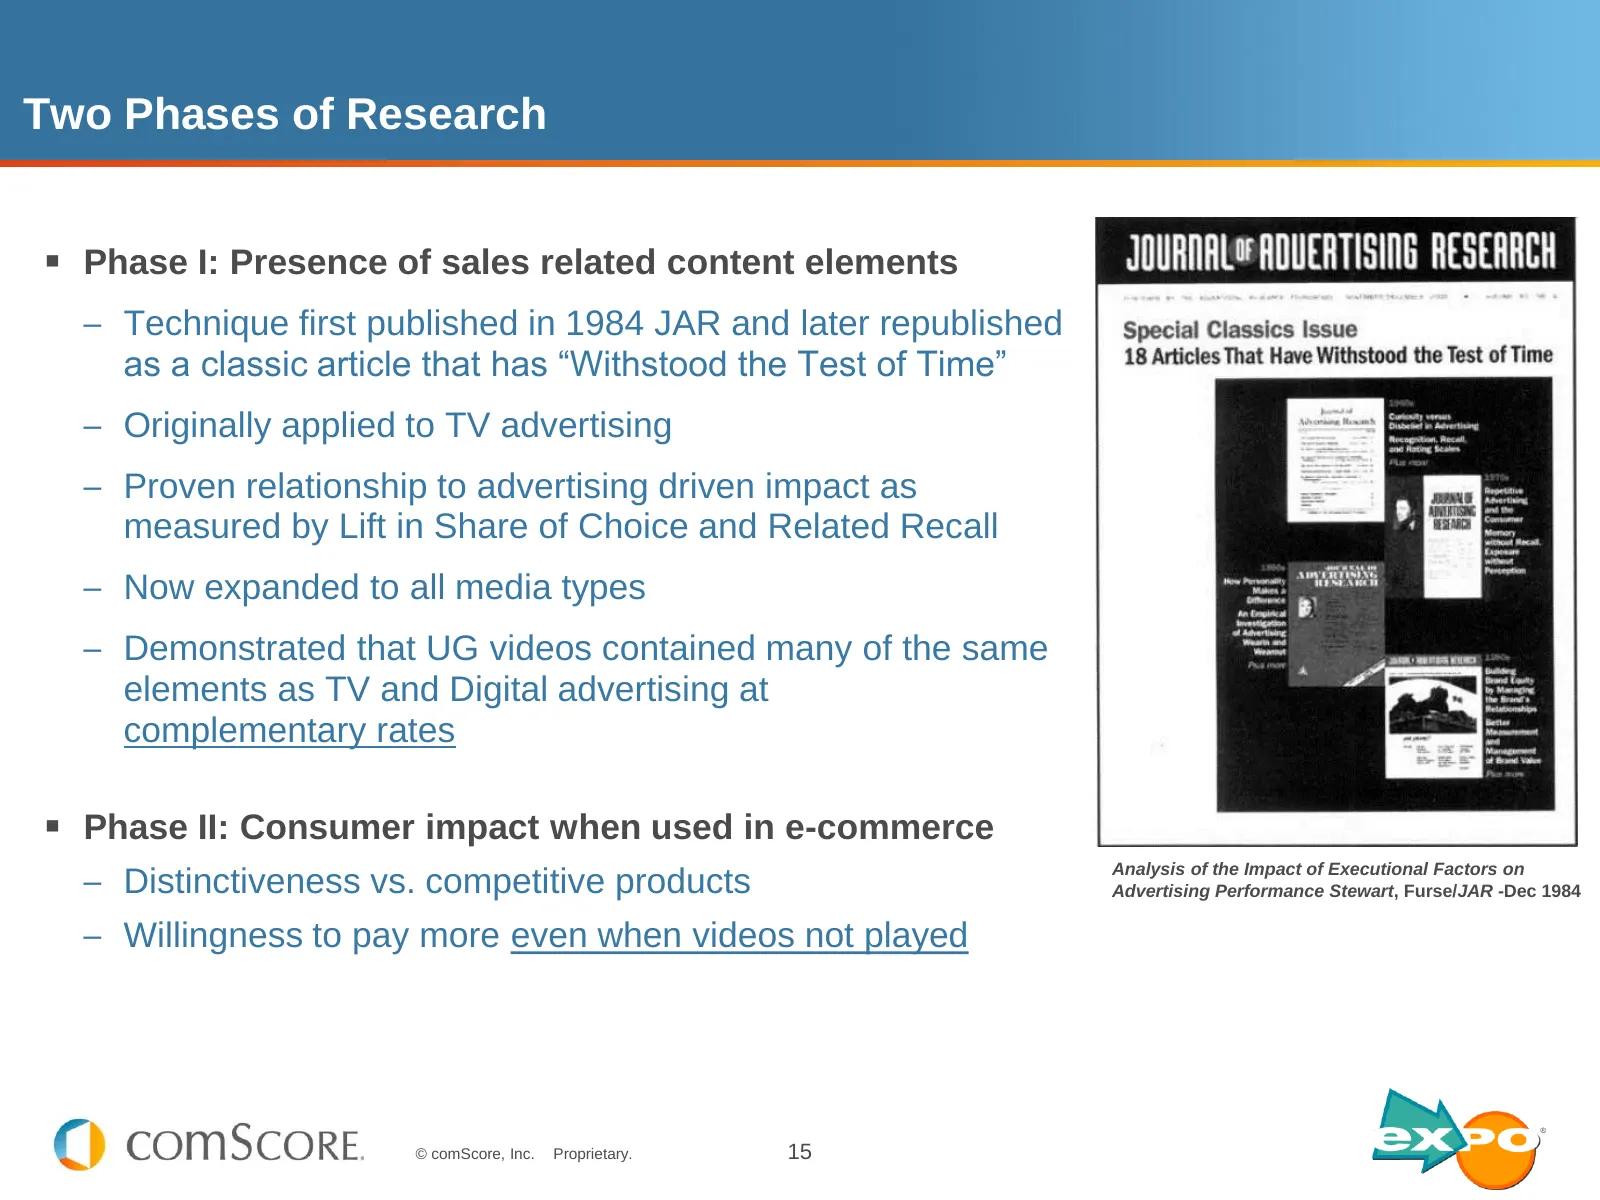
Two Phases of Research Phase I: Presence of sales related content elements – Technique first published in 1984 JAR and later republished as a classic article that has “Withstood the Test of Time” – Originally applied to TV advertising – Proven relationship to advertising driven impact as measured
Slide 16: Phase I Results – Strong Content Presence Relative to Other Formats
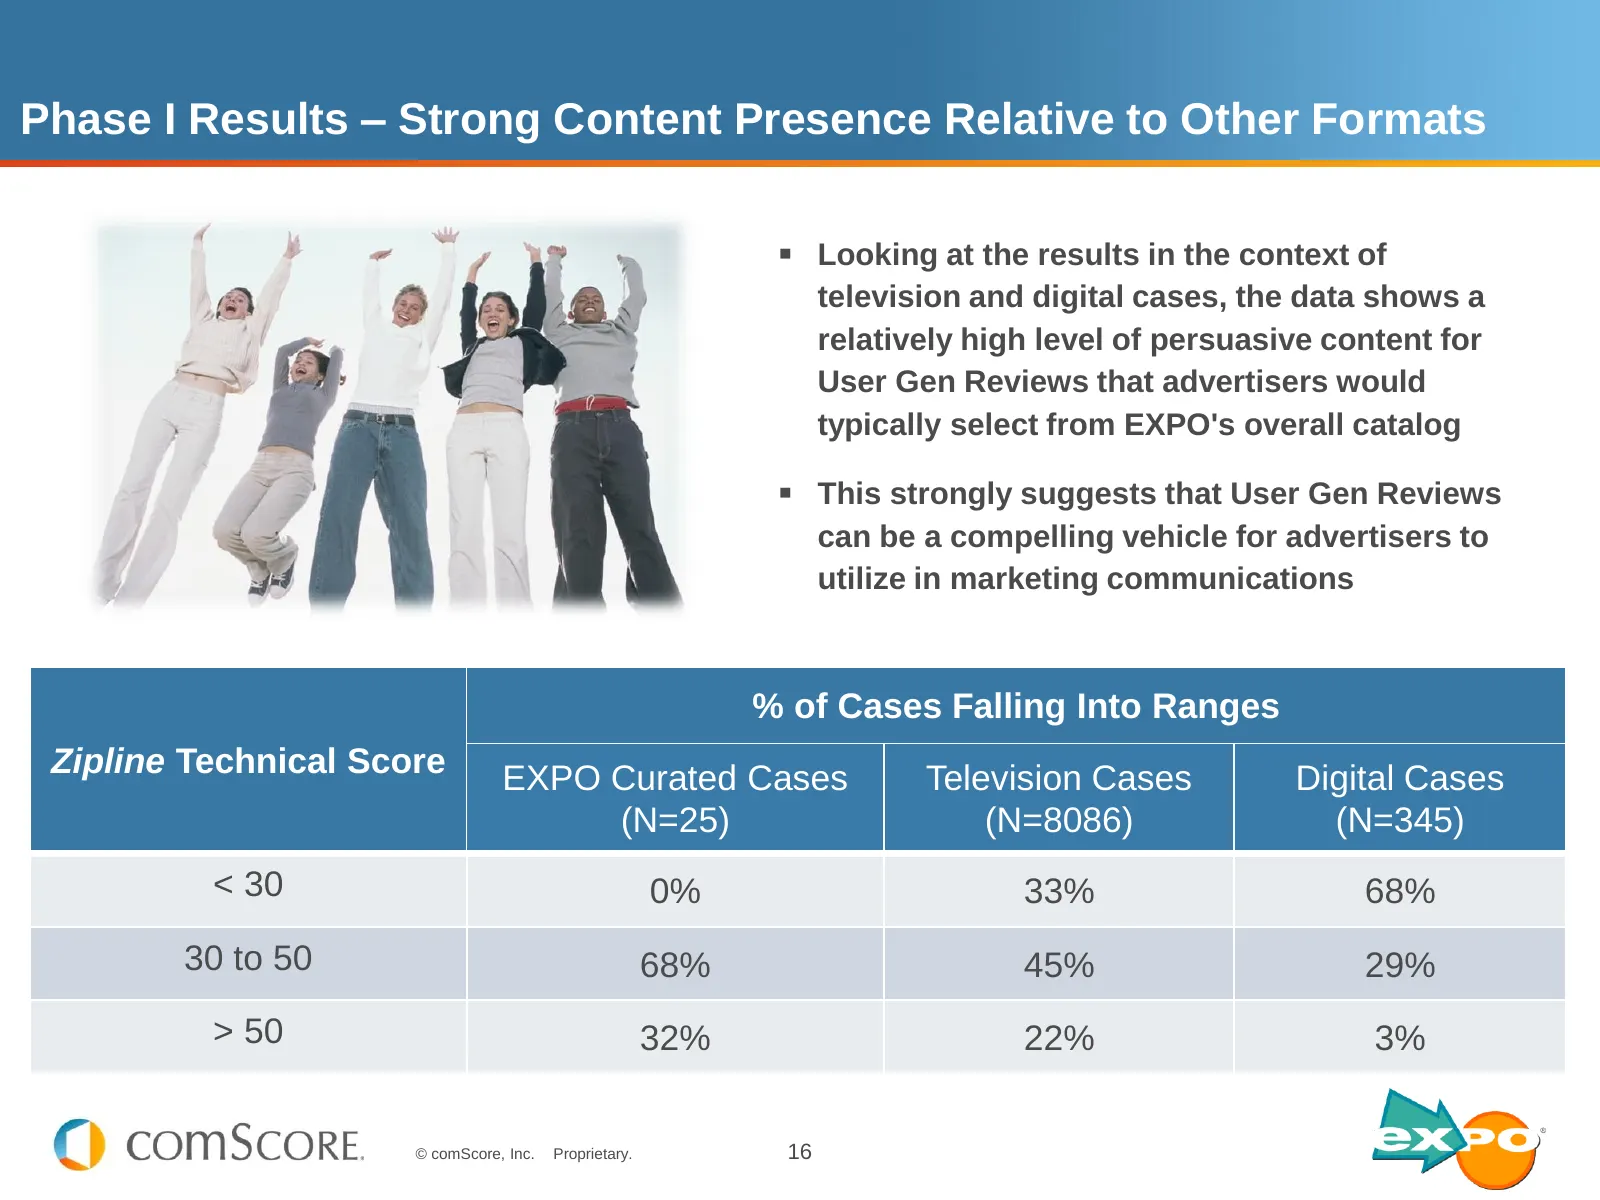
Phase I Results – Strong Content Presence Relative to Other Formats Looking at the results in the context of television and digital cases, the data shows a relatively high level of persuasive content for User Gen Reviews that advertisers would typically select from EXPO's overall catalog This st
Slide 17: Phase I Results – Complements Other Media Types
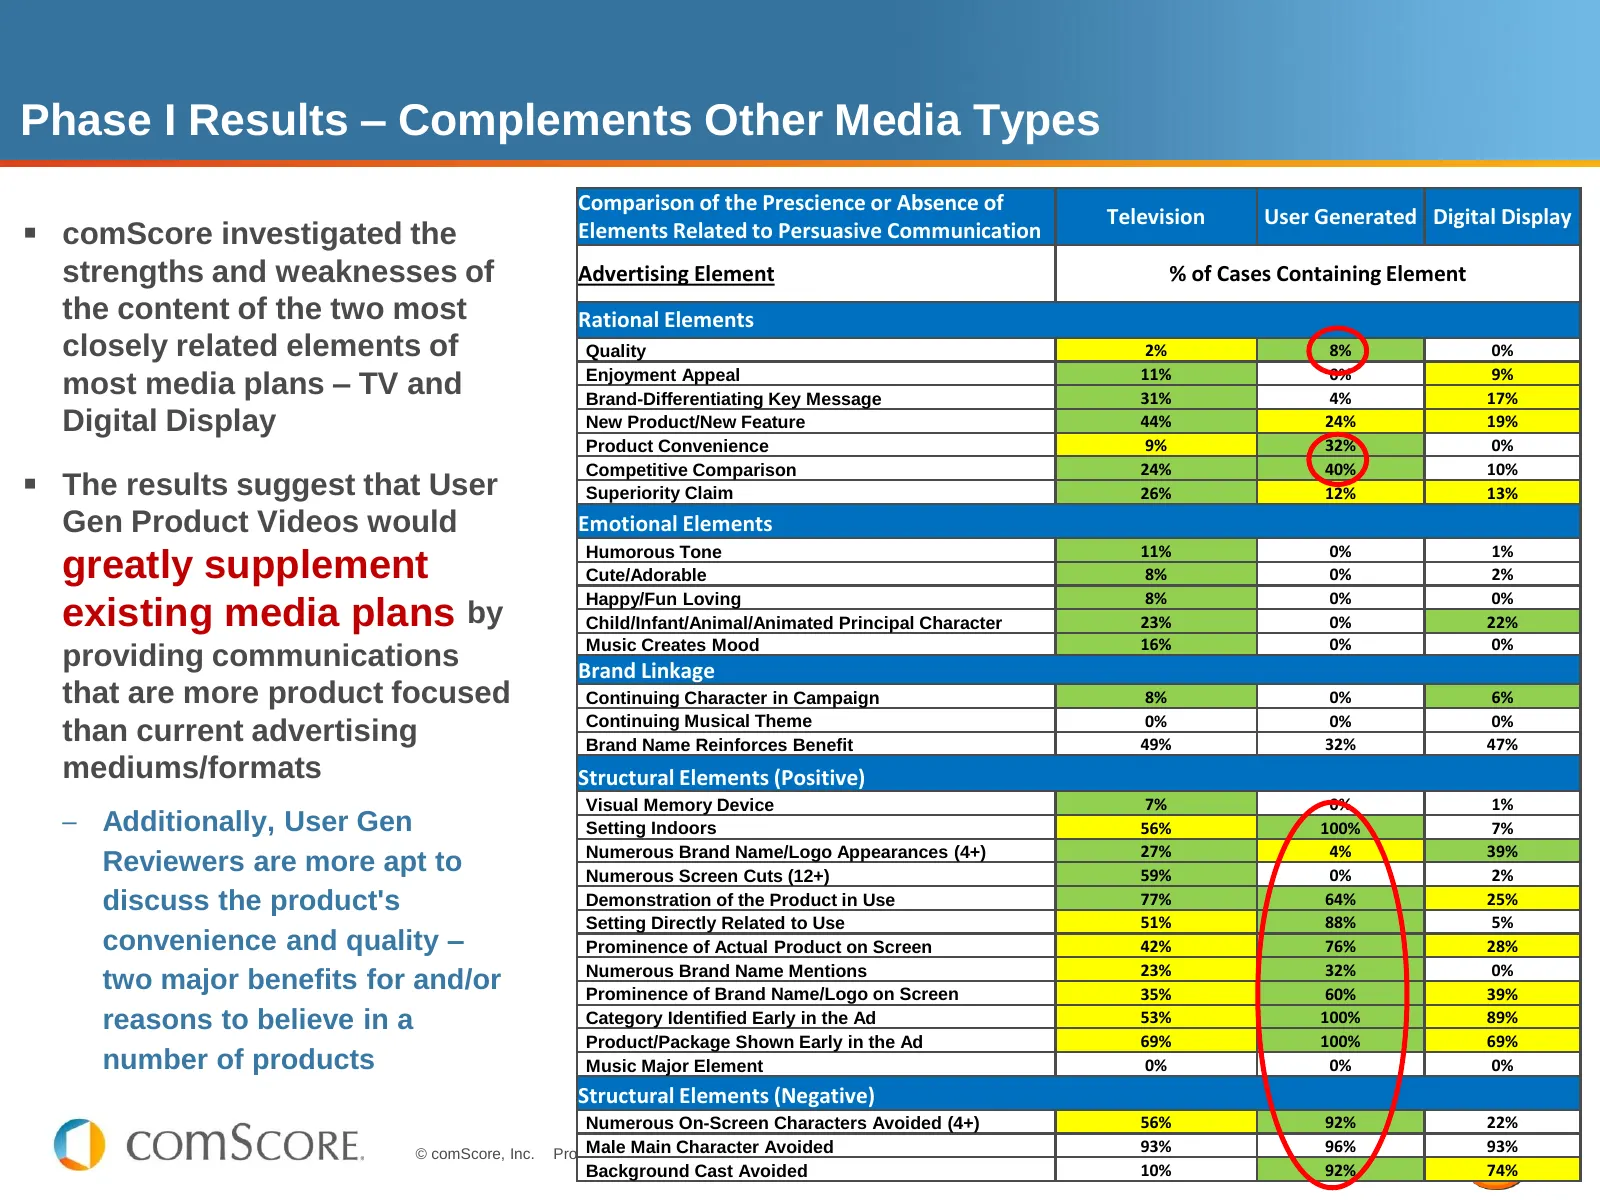
Phase I Results – Complements Other Media Types Comparison of the Prescience or Absence of Television User Generated Digital Display comScore investigated the Elements Related to Persuasive Communication strengths and weaknesses of Advertising Element % of Cases Containing Element the content of t
Slide 18: Phase I Results – Exceptional Examples
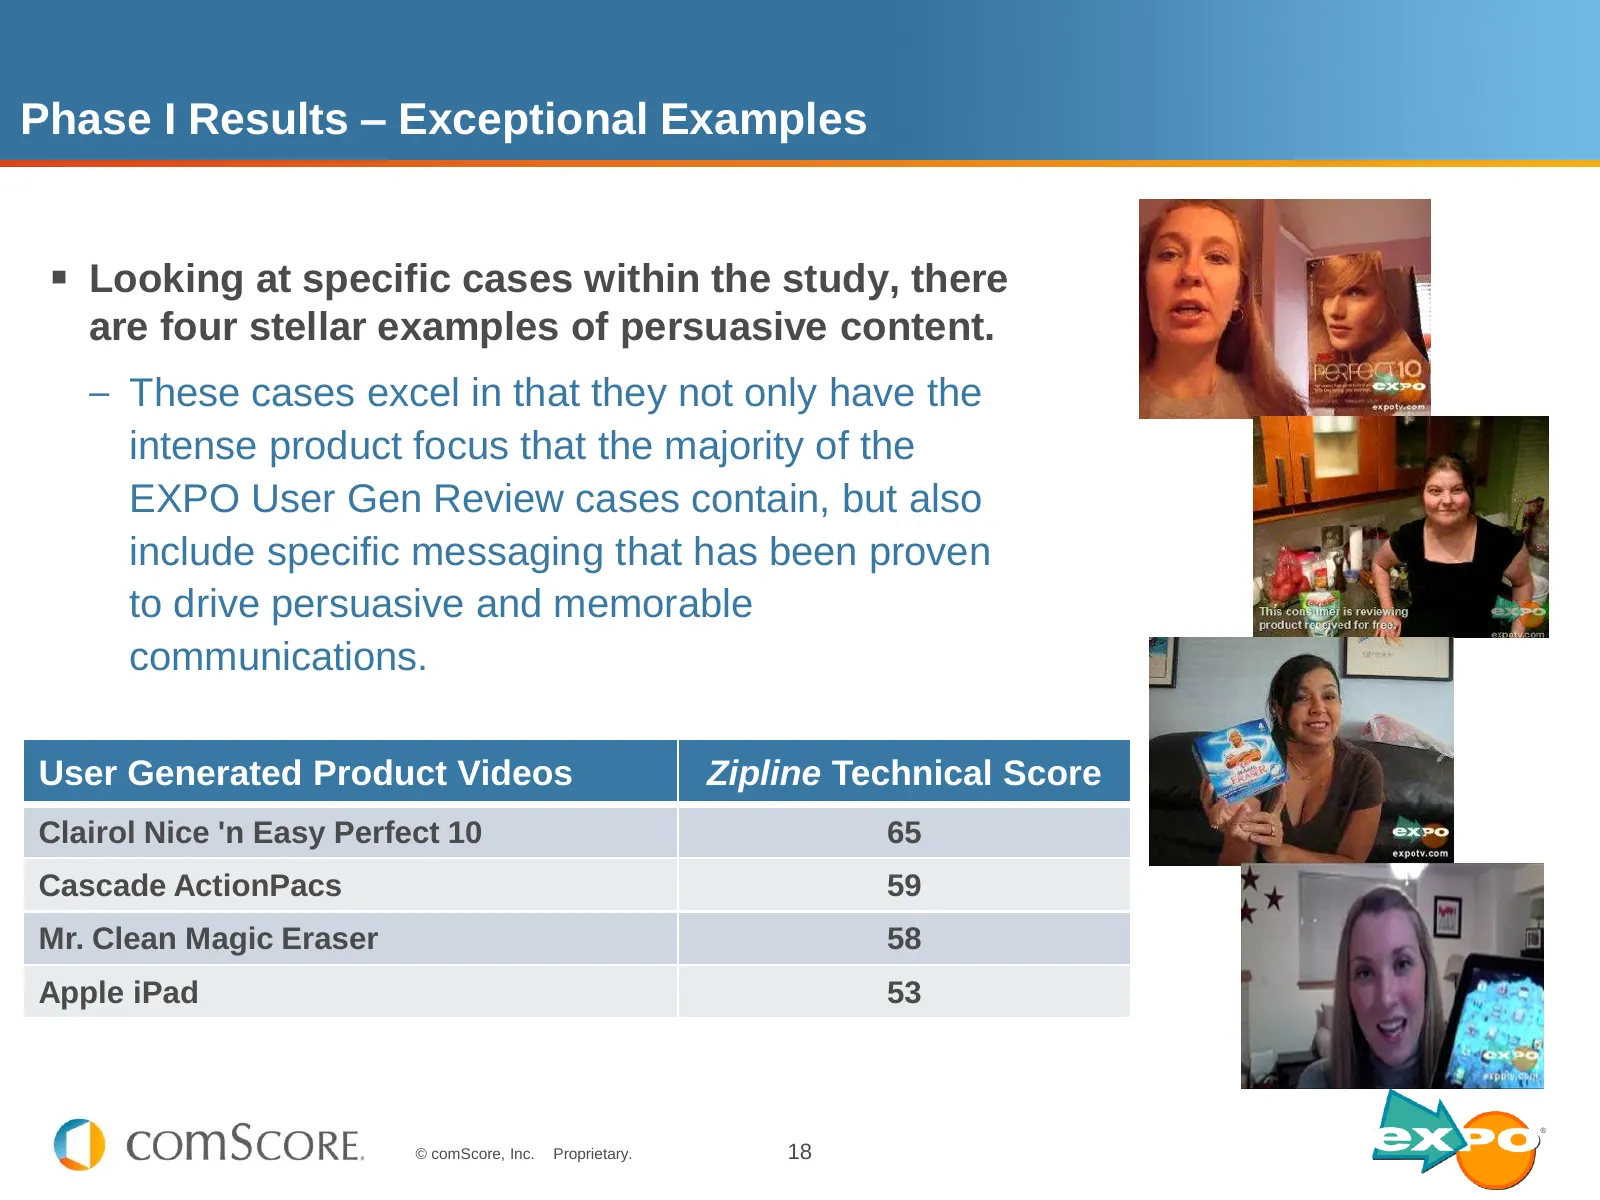
Phase I Results – Exceptional Examples Looking at specific cases within the study, there are four stellar examples of persuasive content. – These cases excel in that they not only have the intense product focus that the majority of the EXPO User Gen Review cases contain, but also include specific
Slide 19: Cascade ActionPacs – Tryology Program (sampling)
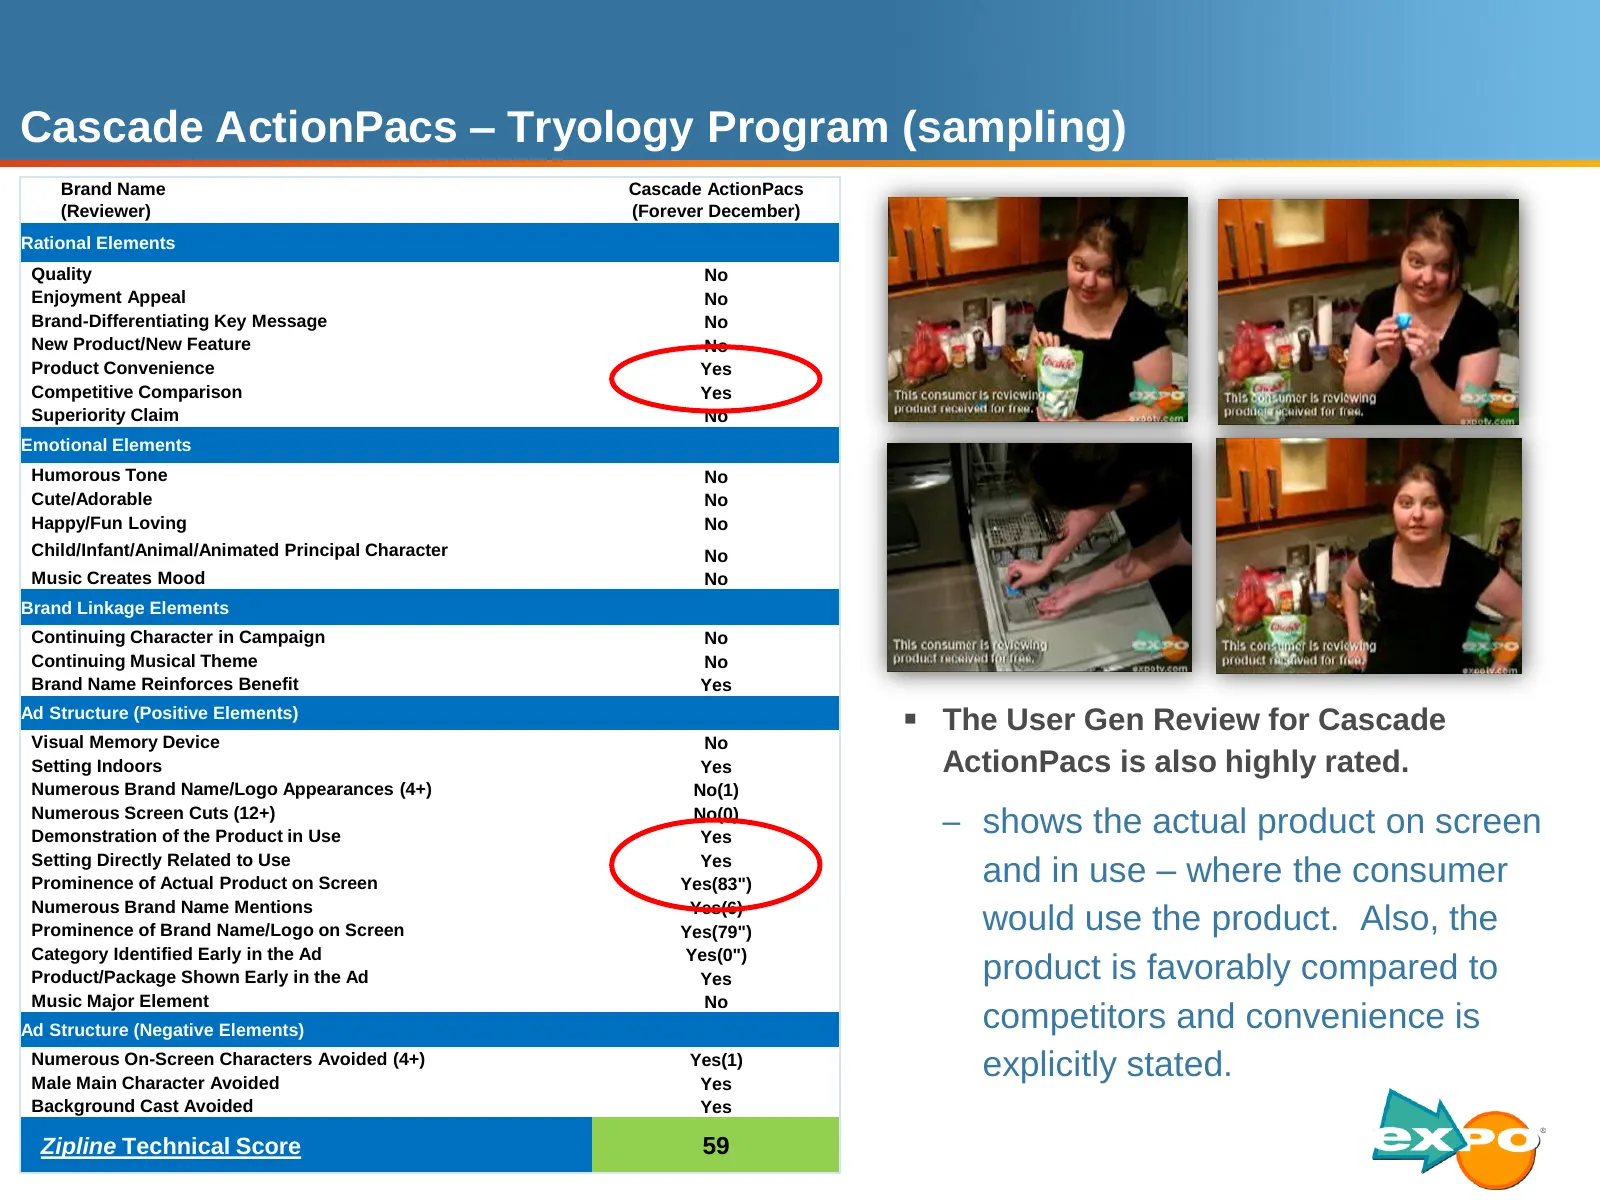
Cascade ActionPacs – Tryology Program (sampling) Brand Name Cascade ActionPacs (Reviewer) (Forever December) Rational Elements Quality No Enjoyment Appeal No Brand-Differentiating Key Message No New Product/New Feature No Product Convenience Yes Competitive Comparison Yes Superiority Claim No Emotio
Slide 20: Phase II Results – Tremendous Opportunities within e-Commerce
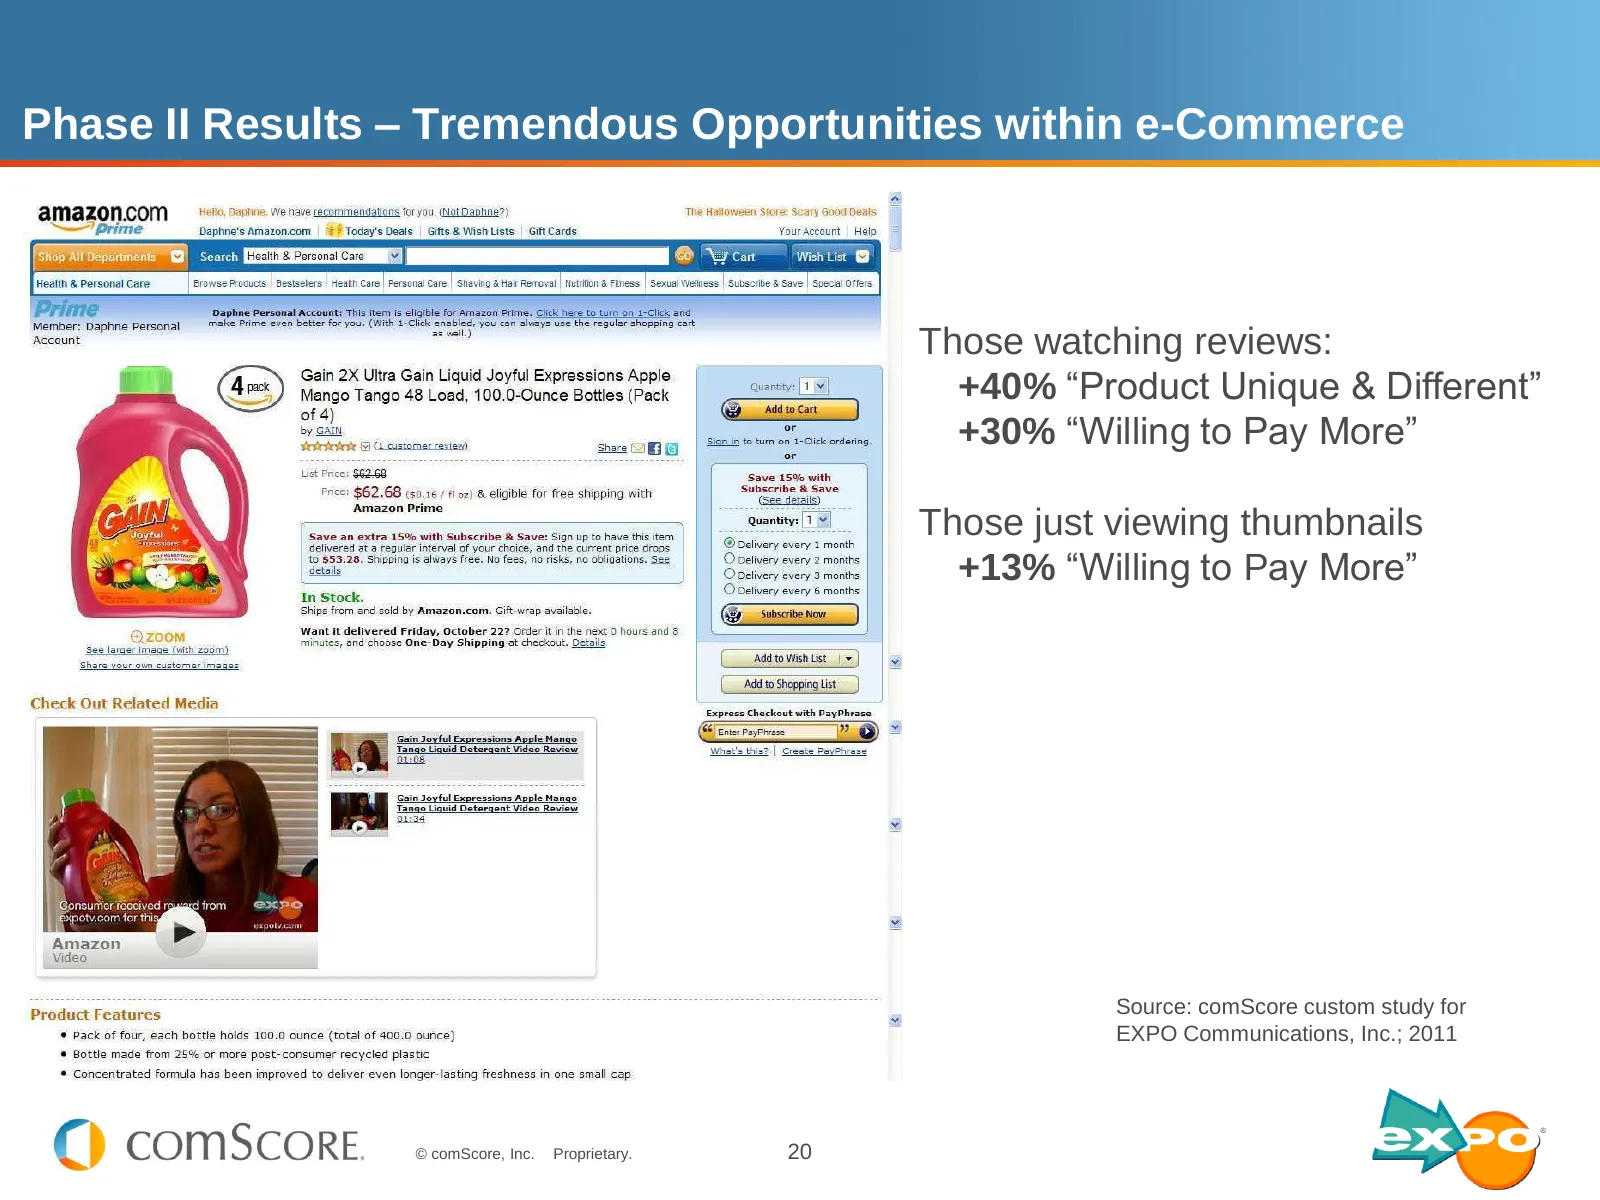
Phase II Results – Tremendous Opportunities within e-Commerce Those watching reviews: +40% “Product Unique & Different” +30% “Willing to Pay More” Those just viewing thumbnails +13% “Willing to Pay More” Source: comScore custom study for EXPO Communications, Inc.; 2011 © comScore, Inc. Proprietary.

Slide 21: Phase III: Objective and Methodology
Phase III: Objective and Methodology © comScore, Inc. Proprietary. 21
Slide 22: Blinded Case Study – Synergies with Professionally Produced Content
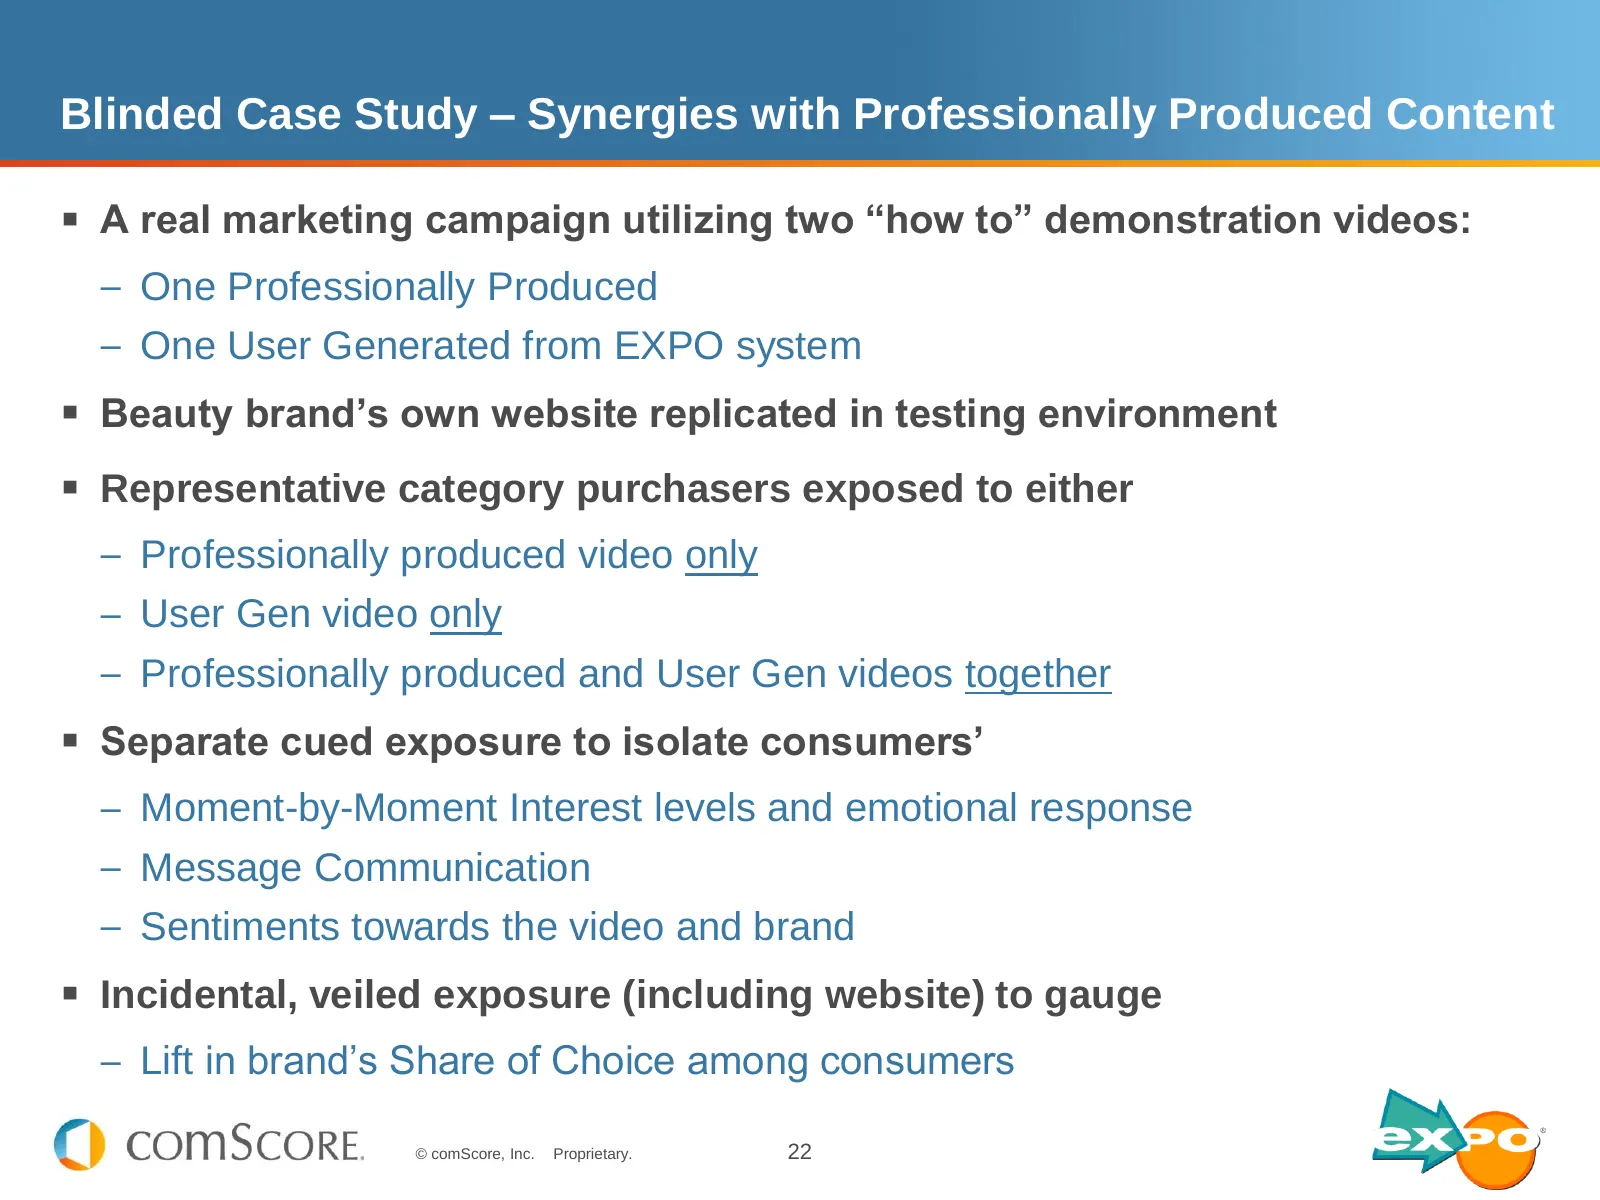
Blinded Case Study – Synergies with Professionally Produced Content A real marketing campaign utilizing two “how to” demonstration videos: – One Professionally Produced – One User Generated from EXPO system Beauty brand’s own website replicated in testing environment Representative category pu
Slide 23: Analytical Framework
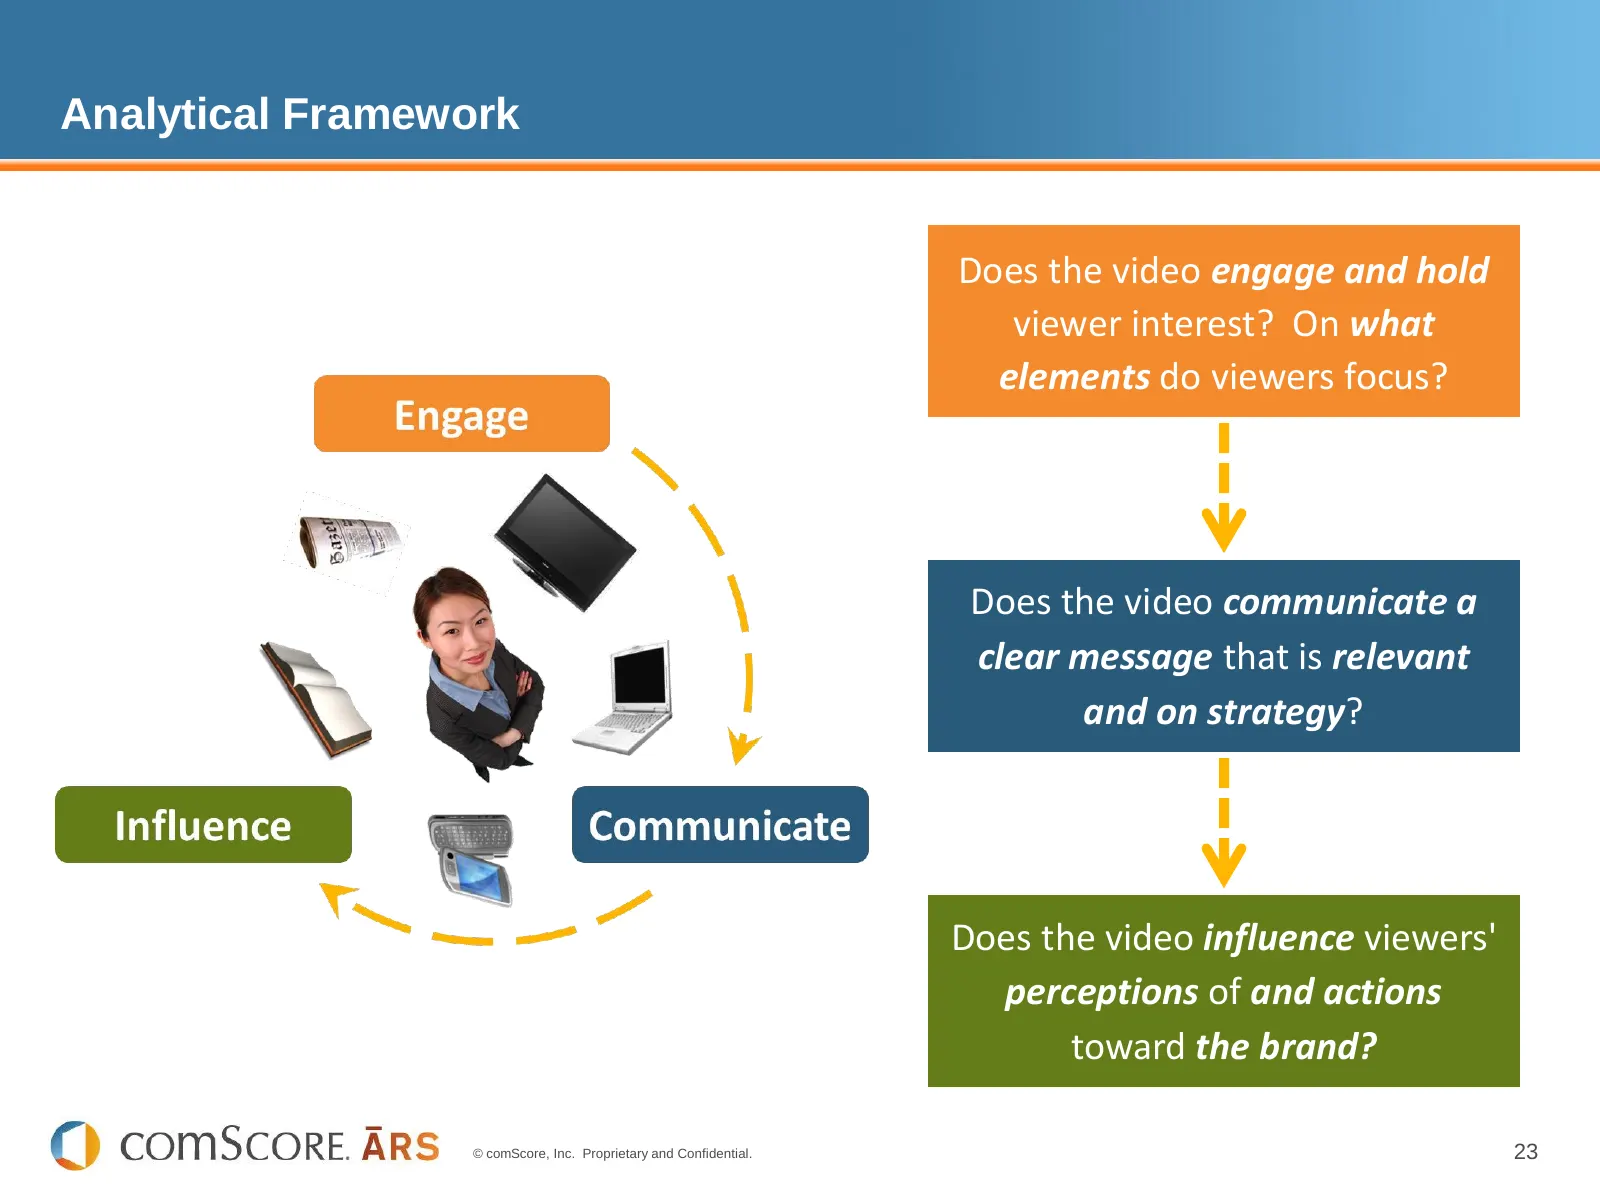
Analytical Framework Does the video engage and hold viewer interest? On what elements do viewers focus? Does the video communicate a clear message that is relevant and on strategy? Does the video influence viewers' perceptions of and actions toward the brand? © comScore, Inc. Proprietary and Confide
Slide 24: Engage the consumer
Engage the consumer © comScore, Inc. Proprietary. 24
Slide 25: Interest and Evoked Emotion
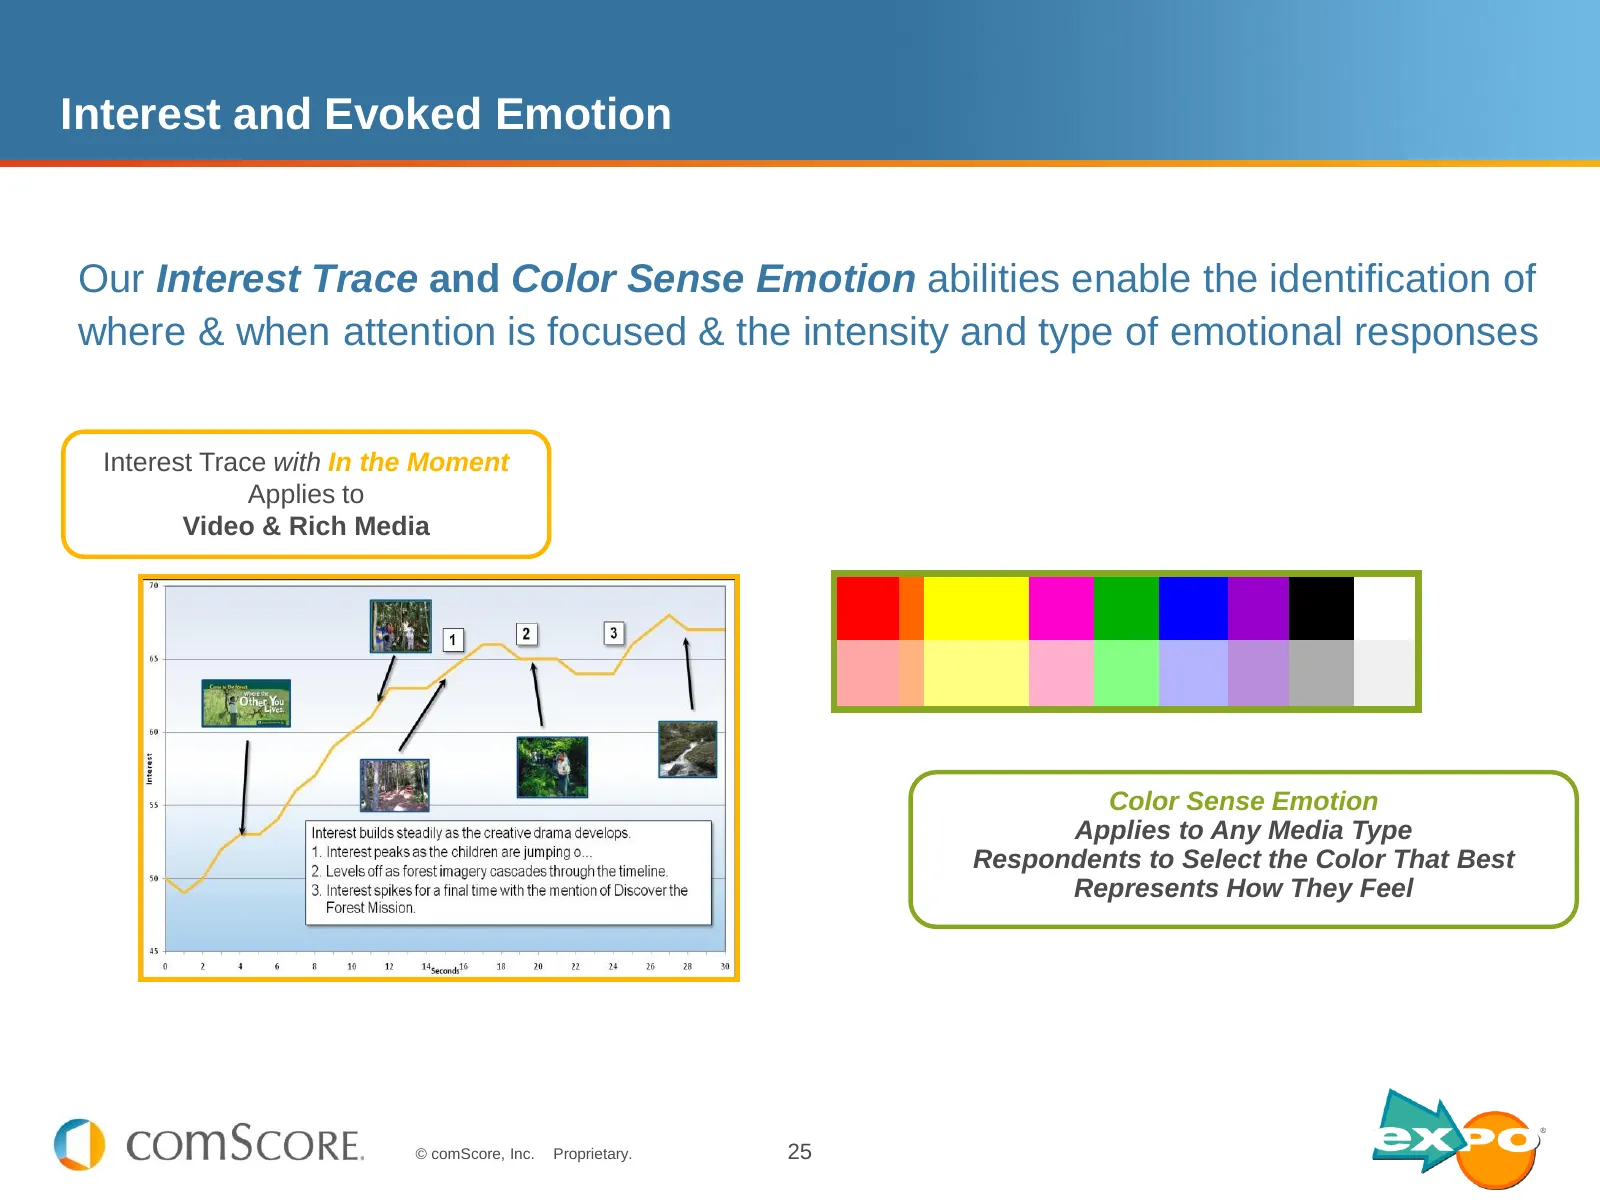
Interest and Evoked Emotion Our Interest Trace and Color Sense Emotion abilities enable the identification of where & when attention is focused & the intensity and type of emotional responses Interest Trace with In the Moment Applies to Video & Rich Media Color Sense Emotion Applies to Any Media Typ
Slide 26: Interest Trace Benchmark Levels
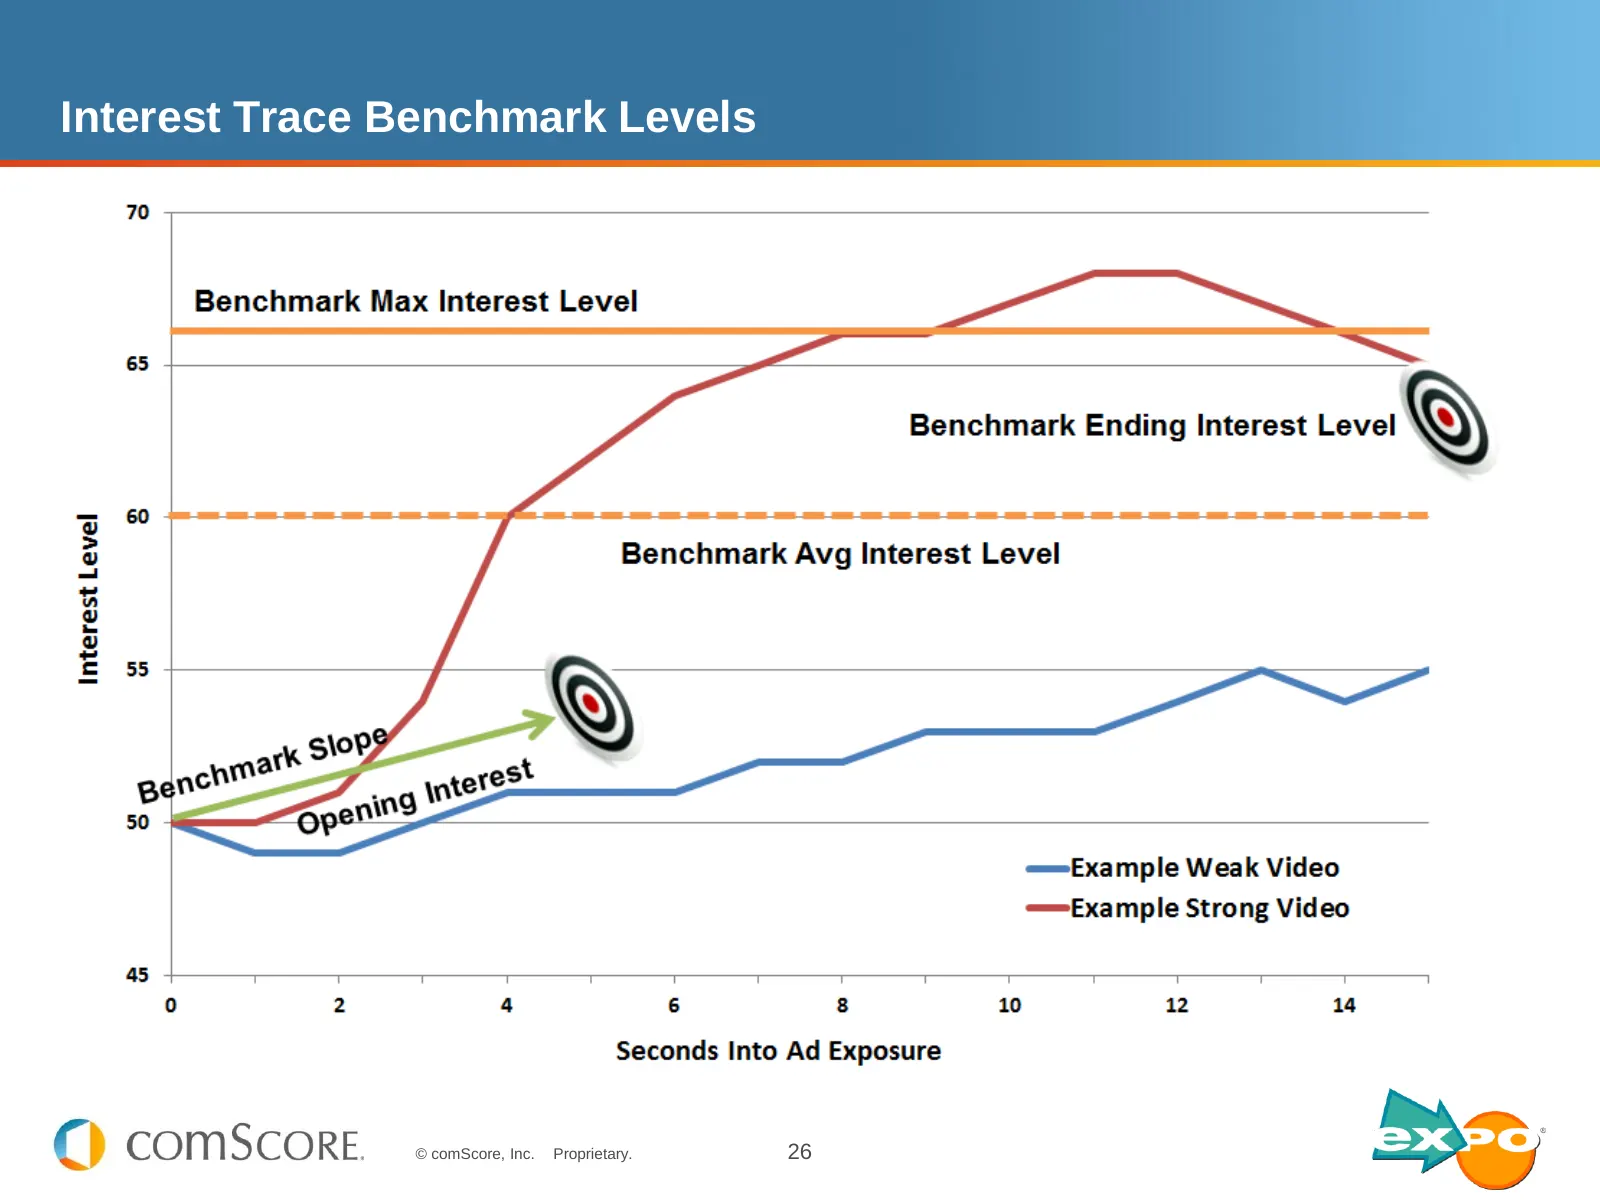
Interest Trace Benchmark Levels © comScore, Inc. Proprietary. 26
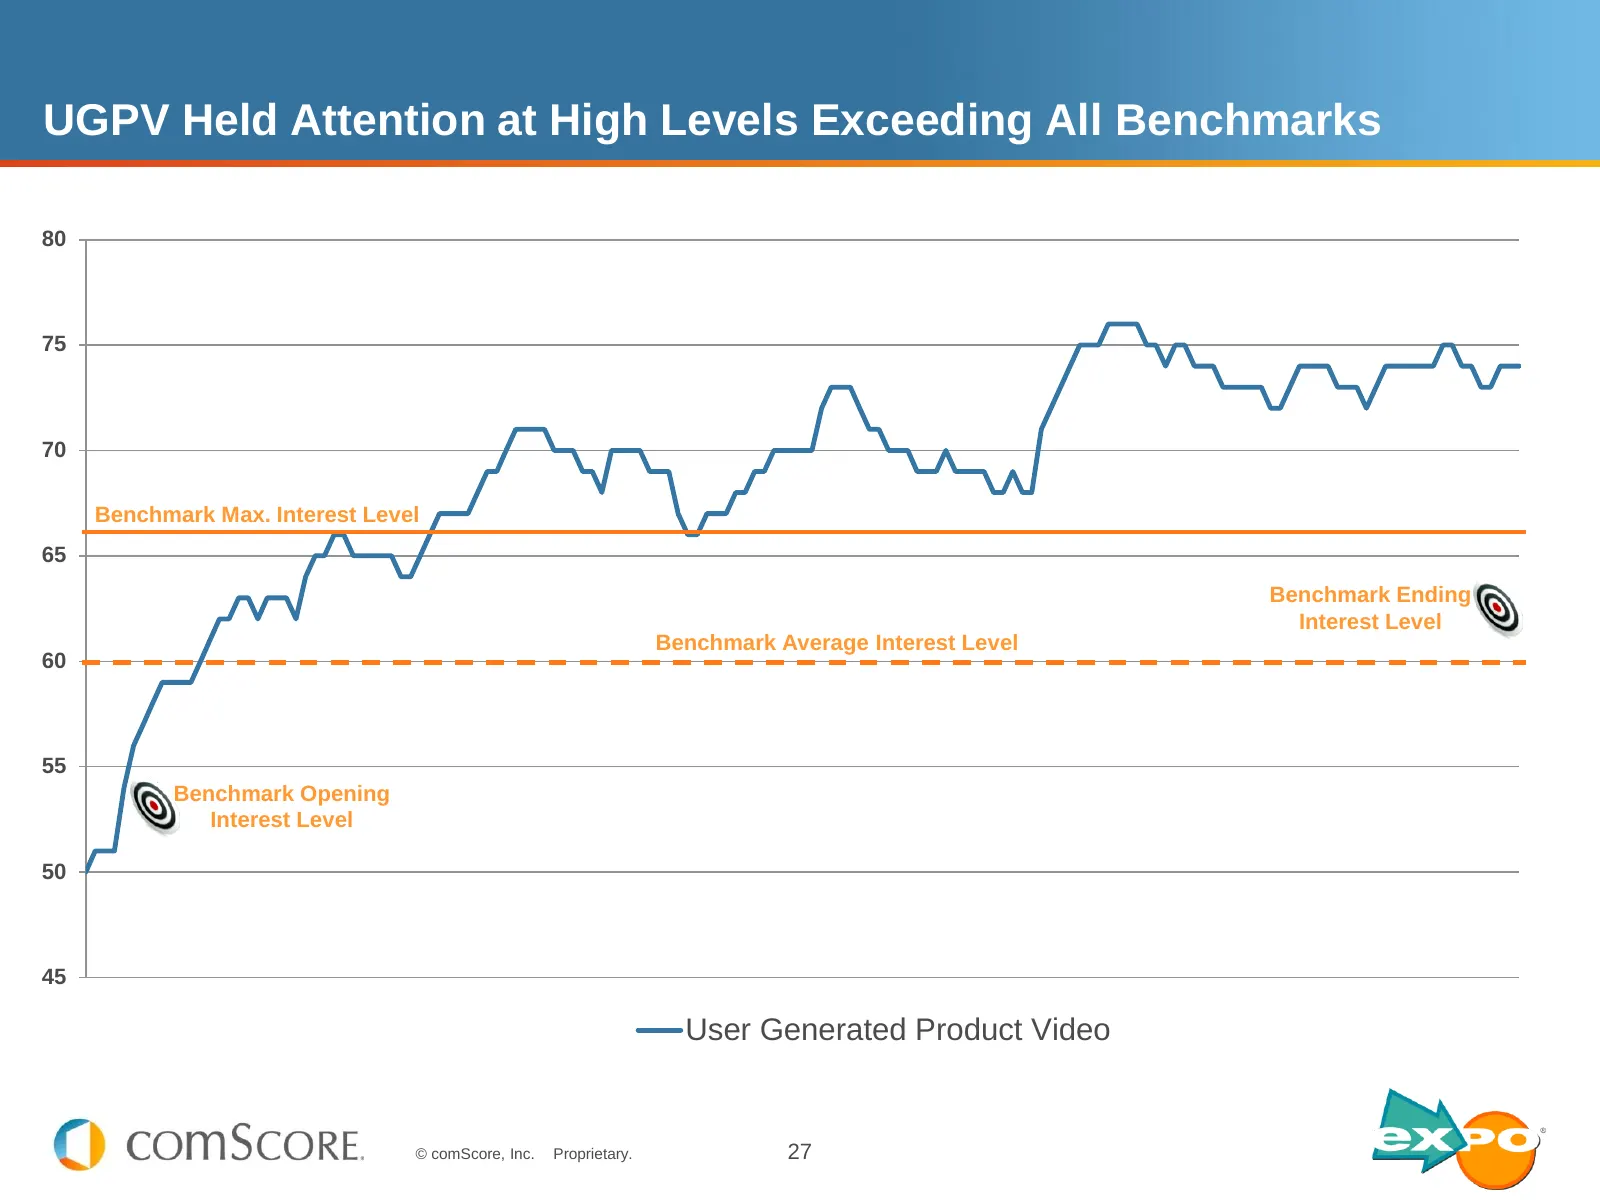
Slide 27: UGPV Held Attention at High Levels Exceeding All Benchmarks
UGPV Held Attention at High Levels Exceeding All Benchmarks 80 75 70 Benchmark Max. Interest Level 65 Benchmark Ending Interest Level Benchmark Average Interest Level 60 55 Benchmark Opening Interest Level 50 45 User Generated Product Video © comScore, Inc. Proprietary. 27
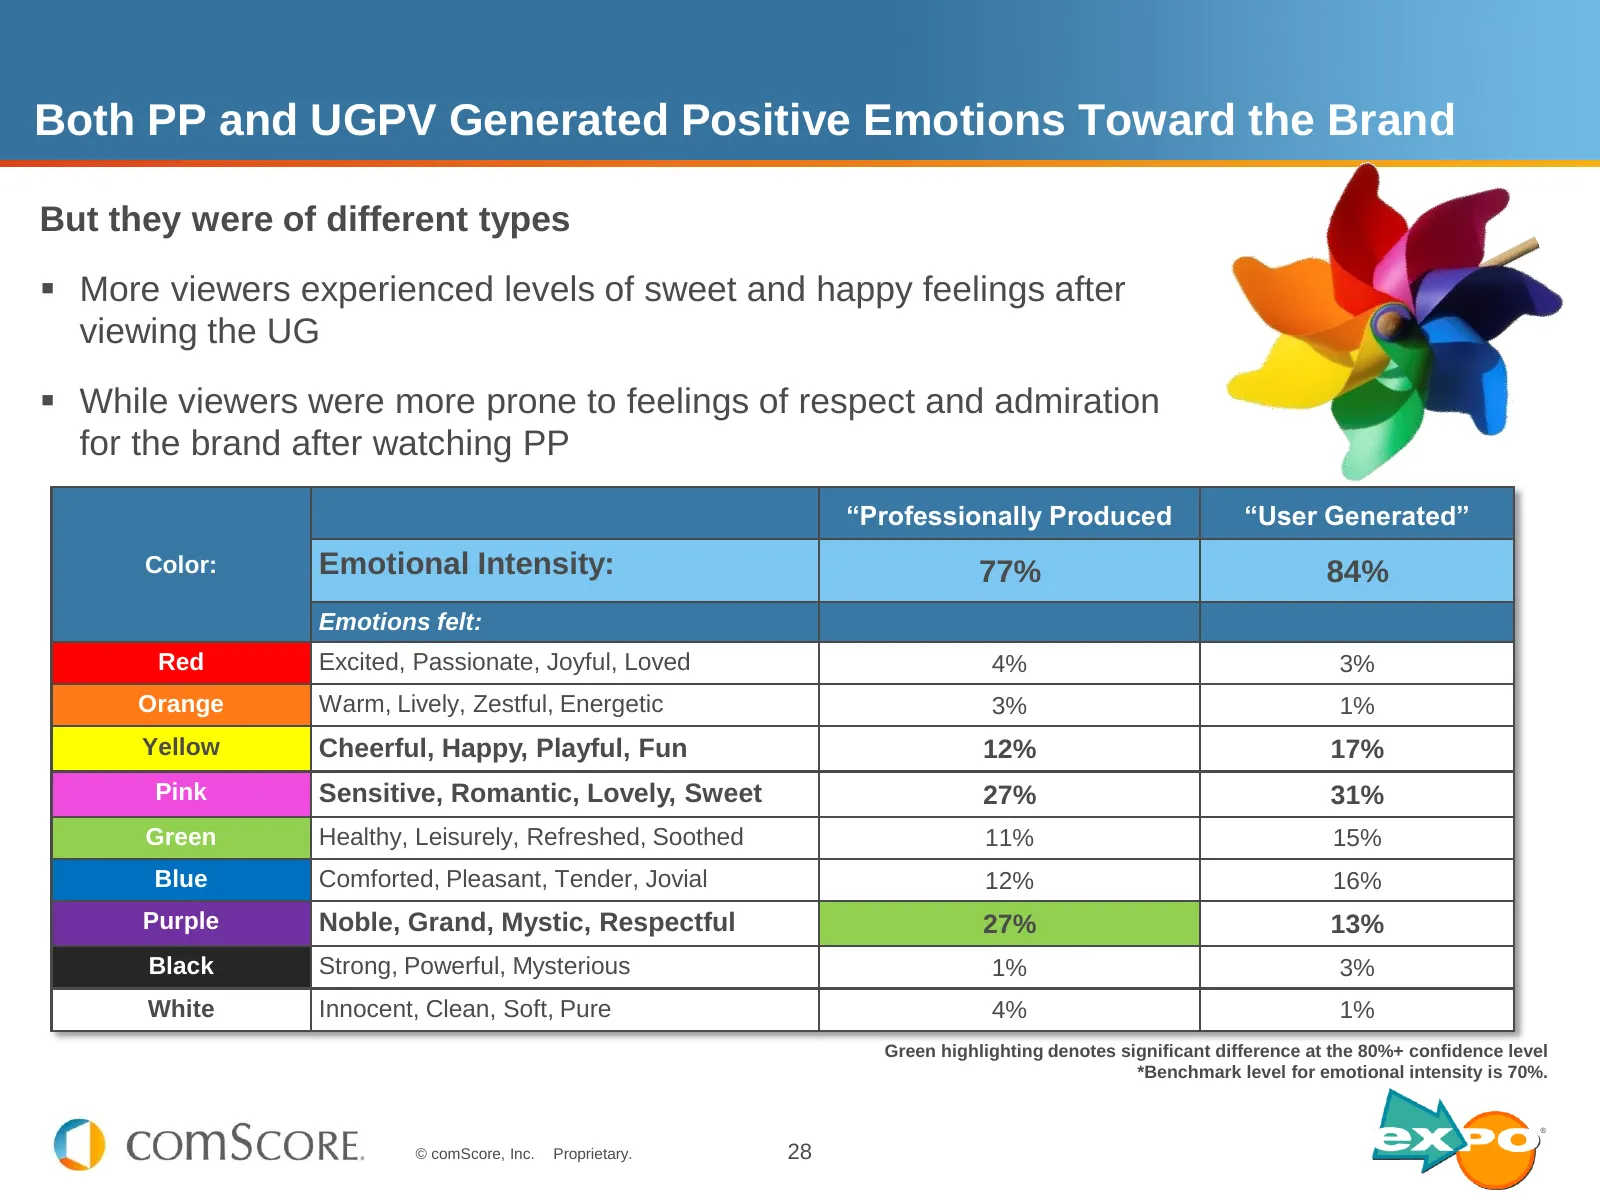
Slide 28: Both PP and UGPV Generated Positive Emotions Toward the Brand
Both PP and UGPV Generated Positive Emotions Toward the Brand But they were of different types More viewers experienced levels of sweet and happy feelings after viewing the UG While viewers were more prone to feelings of respect and admiration for the brand after watching PP “Professionally Prod
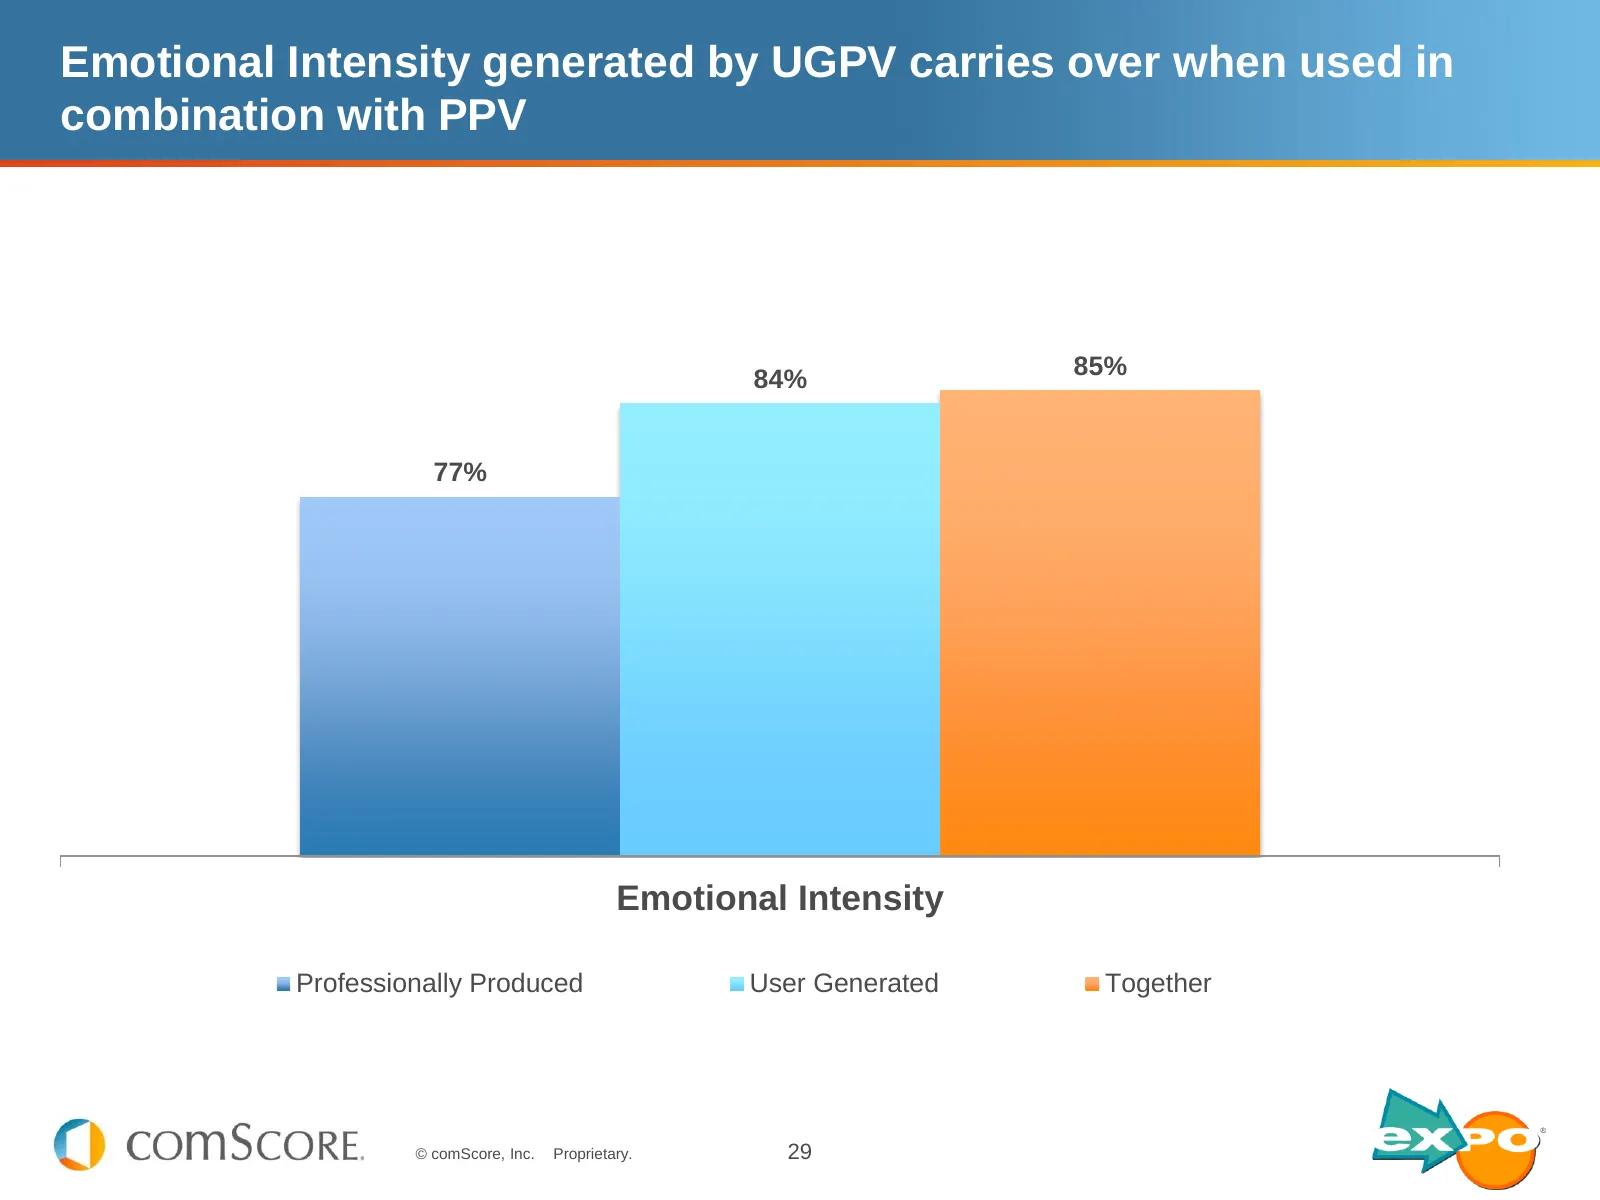
Slide 29: Emotional Intensity generated by UGPV carries over when combined with PPV
Emotional Intensity generated by UGPV carries over when used in combination with PPV 84% 85% 77% Emotional Intensity Professionally Produced User Generated Together © comScore, Inc. Proprietary. 29
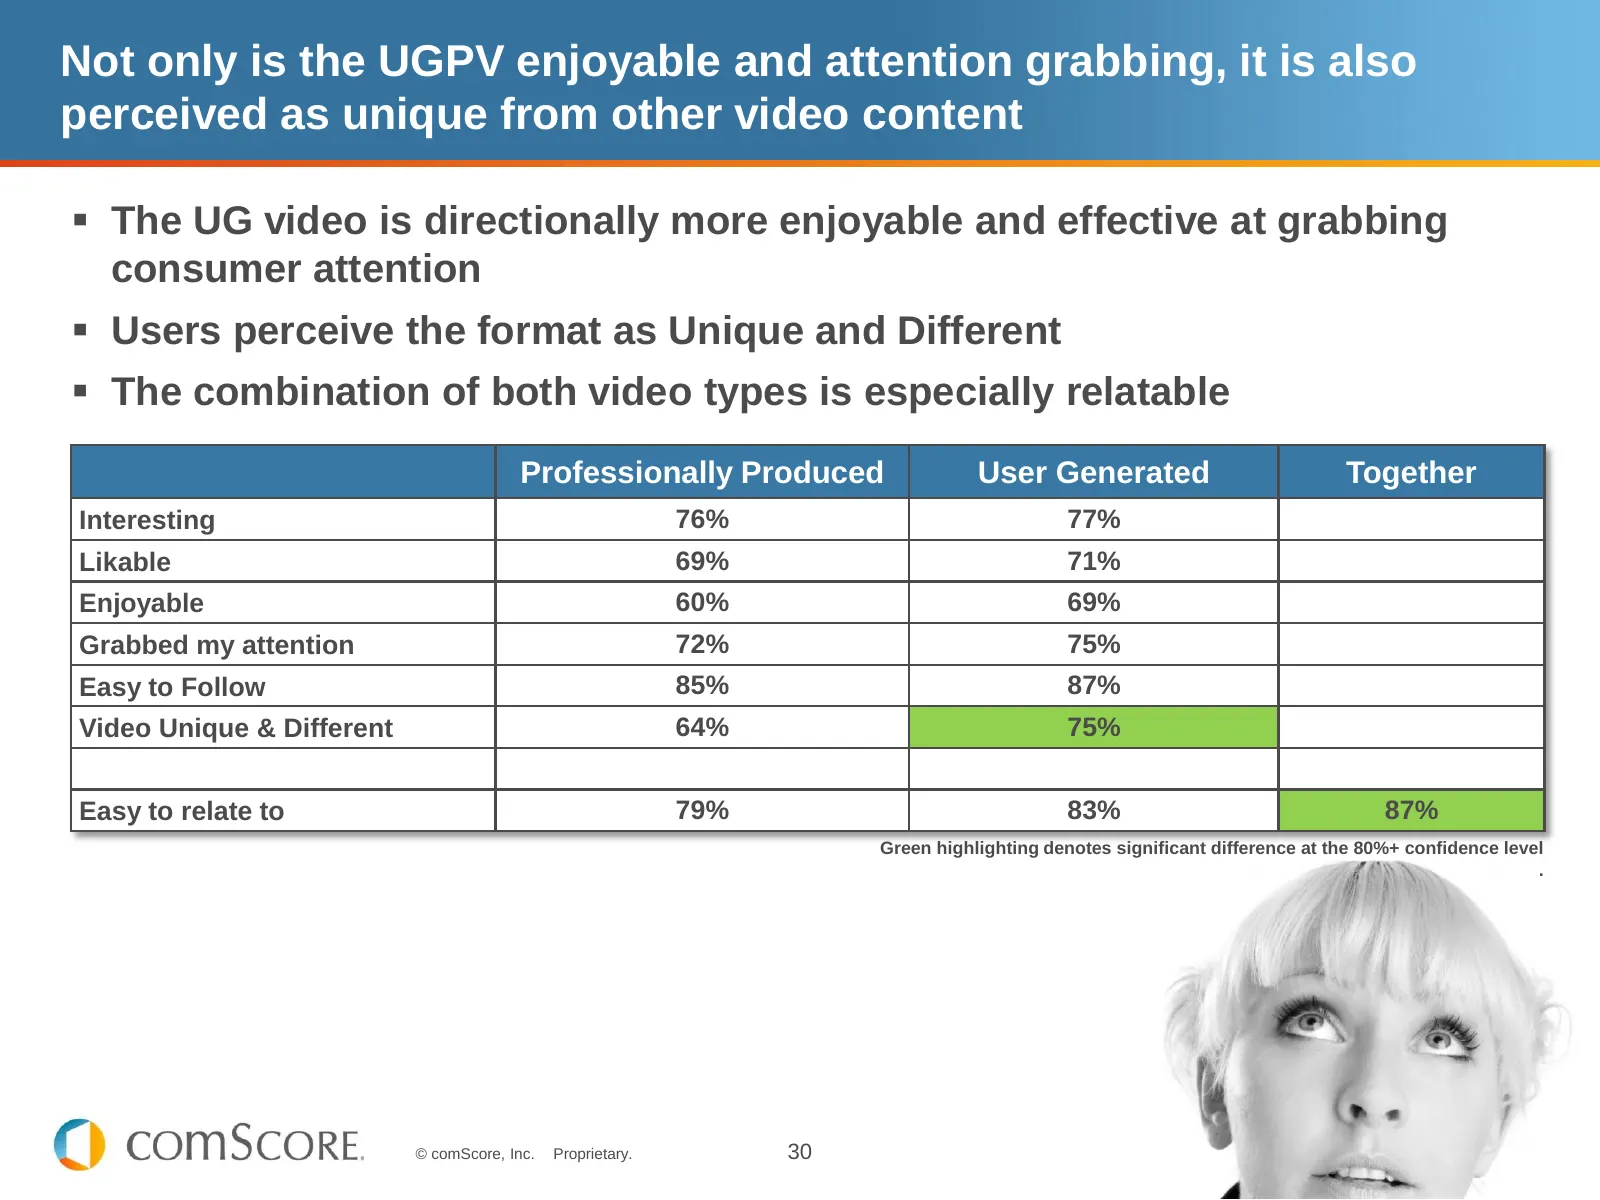
Slide 30: UGPV is enjoyable, attention grabbing and perceived as unique
Not only is the UGPV enjoyable and attention grabbing, it is also perceived as unique from other video content The UG video is directionally more enjoyable and effective at grabbing consumer attention Users perceive the format as Unique and Different The combination of both video types is espe
Slide 31: Communicate A Relevant Message
Communicate A Relevant Message © comScore, Inc. Proprietary. 31
Slide 32: Both Videos Strongly Communicated the Key Message
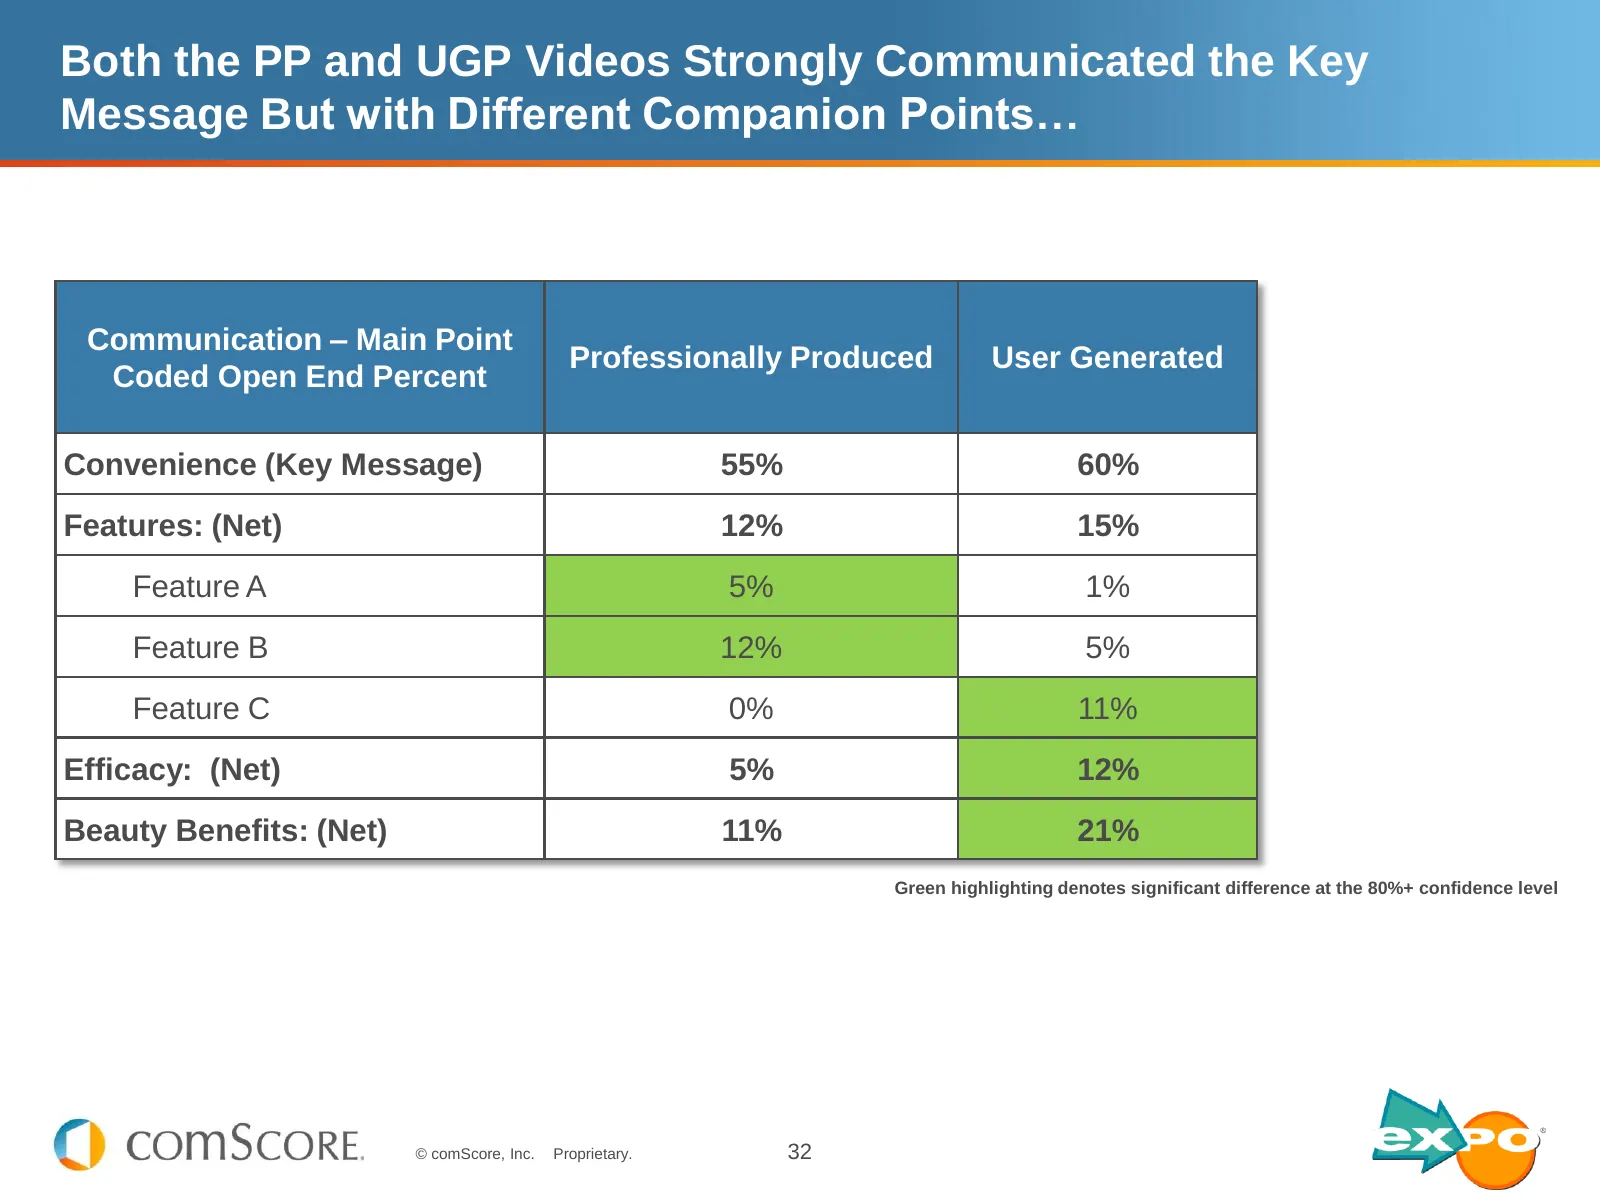
Both the PP and UGP Videos Strongly Communicated the Key Message But with Different Companion Points… Communication – Main Point Professionally Produced User Generated Coded Open End Percent Convenience (Key Message) 55% 60% Features: (Net) 12% 15% Feature A 5% 1% Feature B 12% 5% Feature C 0% 11% E
Slide 33: Strong Key Message Synergy When Viewed Together
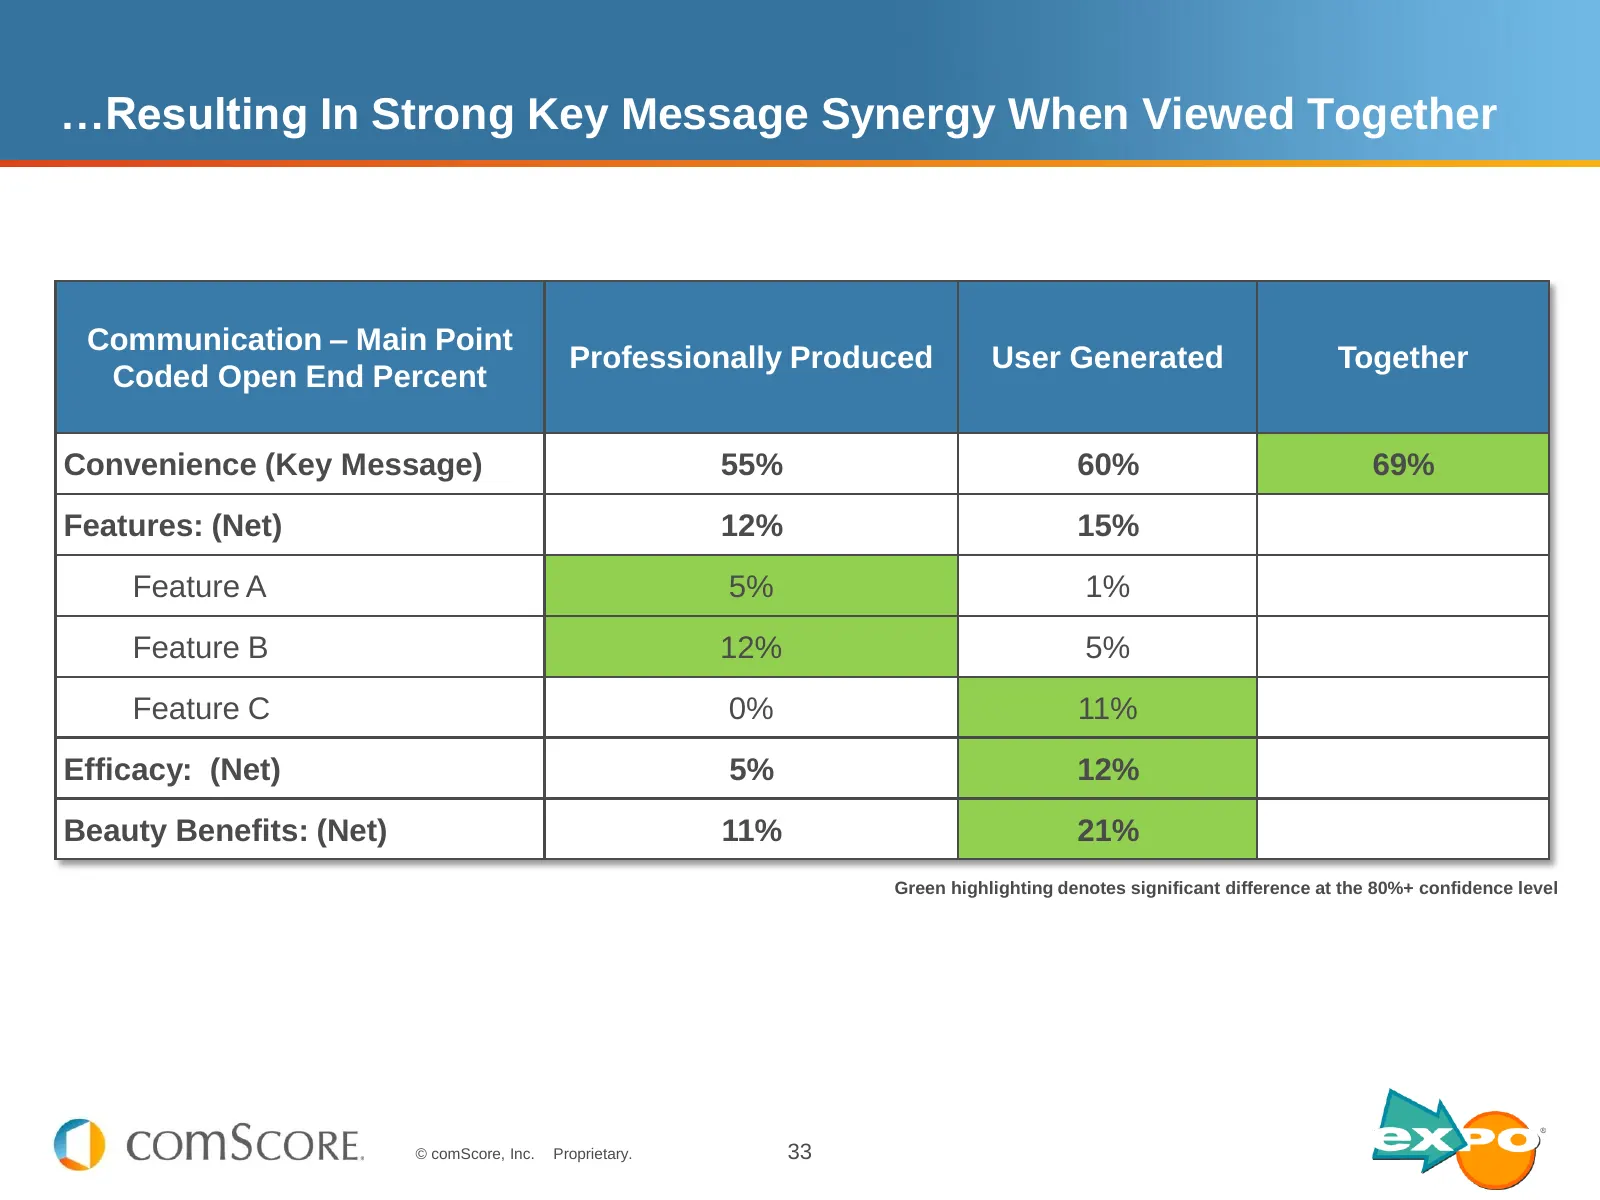
…Resulting In Strong Key Message Synergy When Viewed Together Communication – Main Point Professionally Produced User Generated Together Coded Open End Percent Convenience (Key Message) 55% 60% 69% Features: (Net) 12% 15% Feature A 5% 1% Feature B 12% 5% Feature C 0% 11% Efficacy: (Net) 5% 12% Beaut
Slide 34: Content Pairing Results In Increased Relevance of the Message
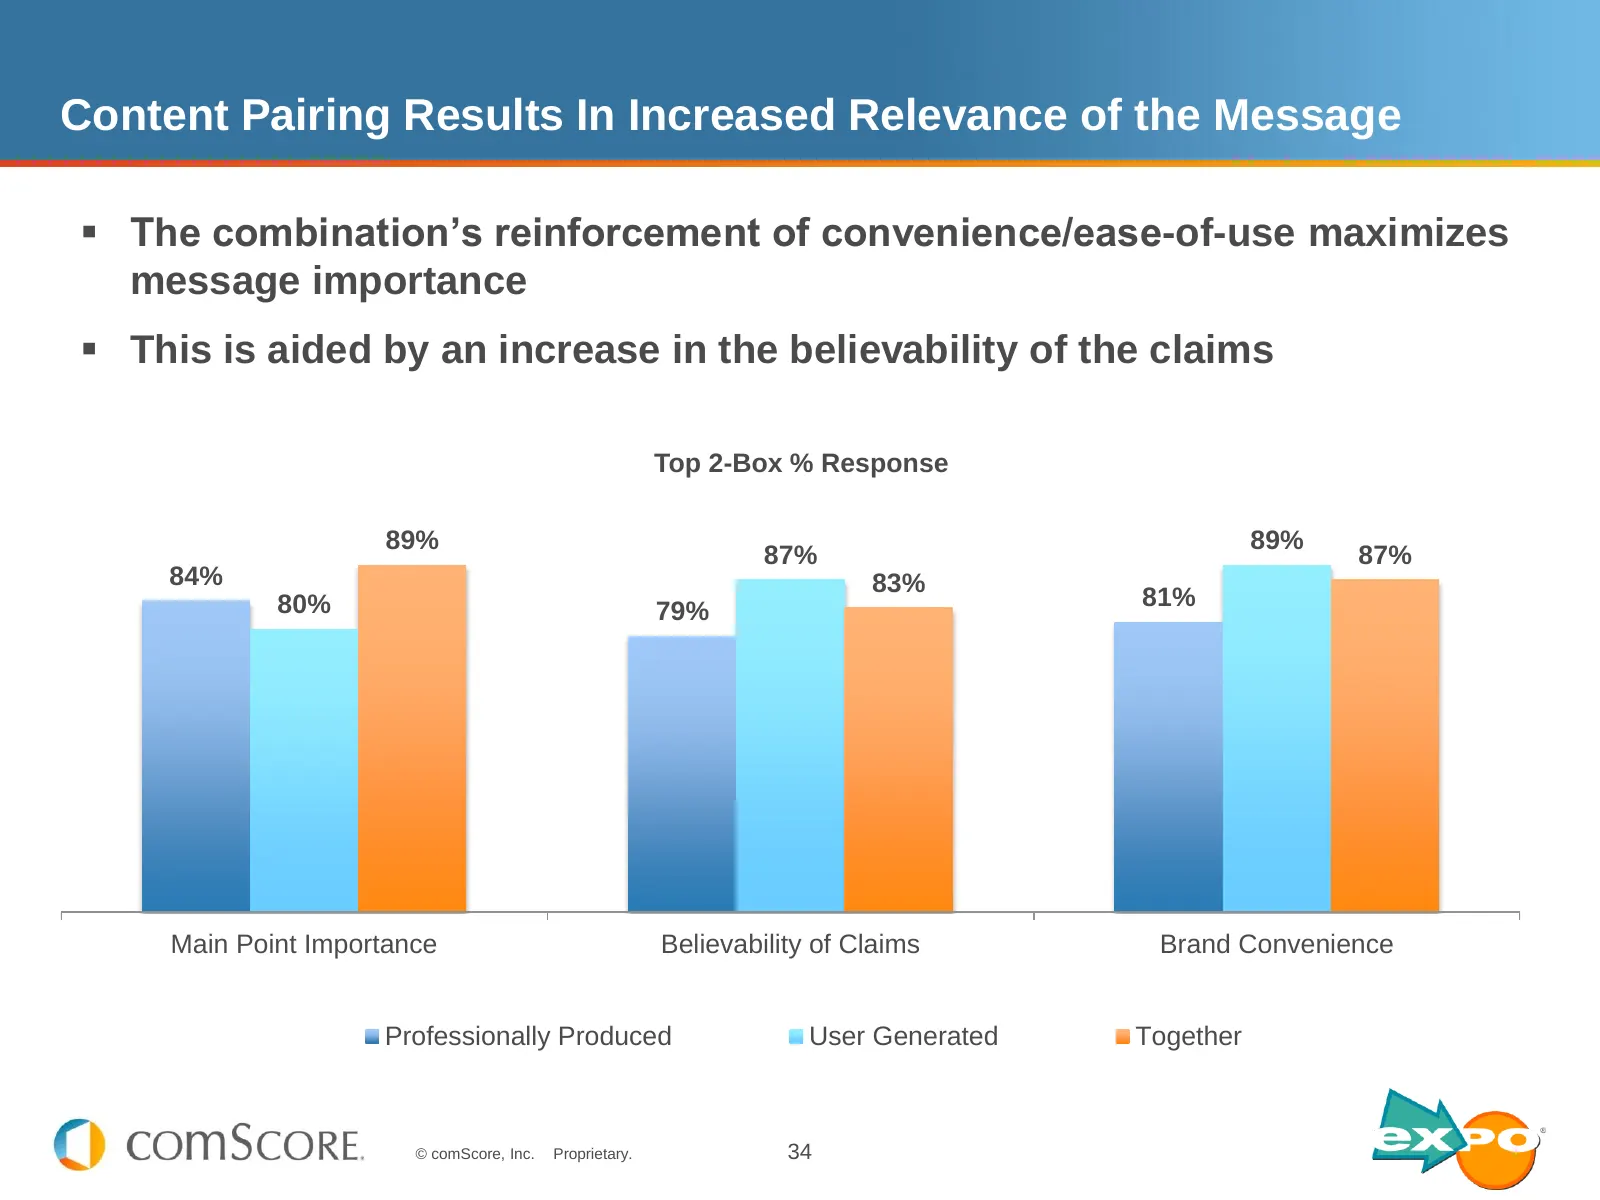
Content Pairing Results In Increased Relevance of the Message The combination’s reinforcement of convenience/ease-of-use maximizes message importance This is aided by an increase in the believability of the claims Top 2-Box % Response 89% 89% 87% 87% 84% 83% 80% 81% 79% Main Point Importance Bel

Slide 35: Influence
Influence © comScore, Inc. Proprietary. 35
Slide 36: UGPV Did Not Exhibit Signs of Negatively Impacting Brand Equity
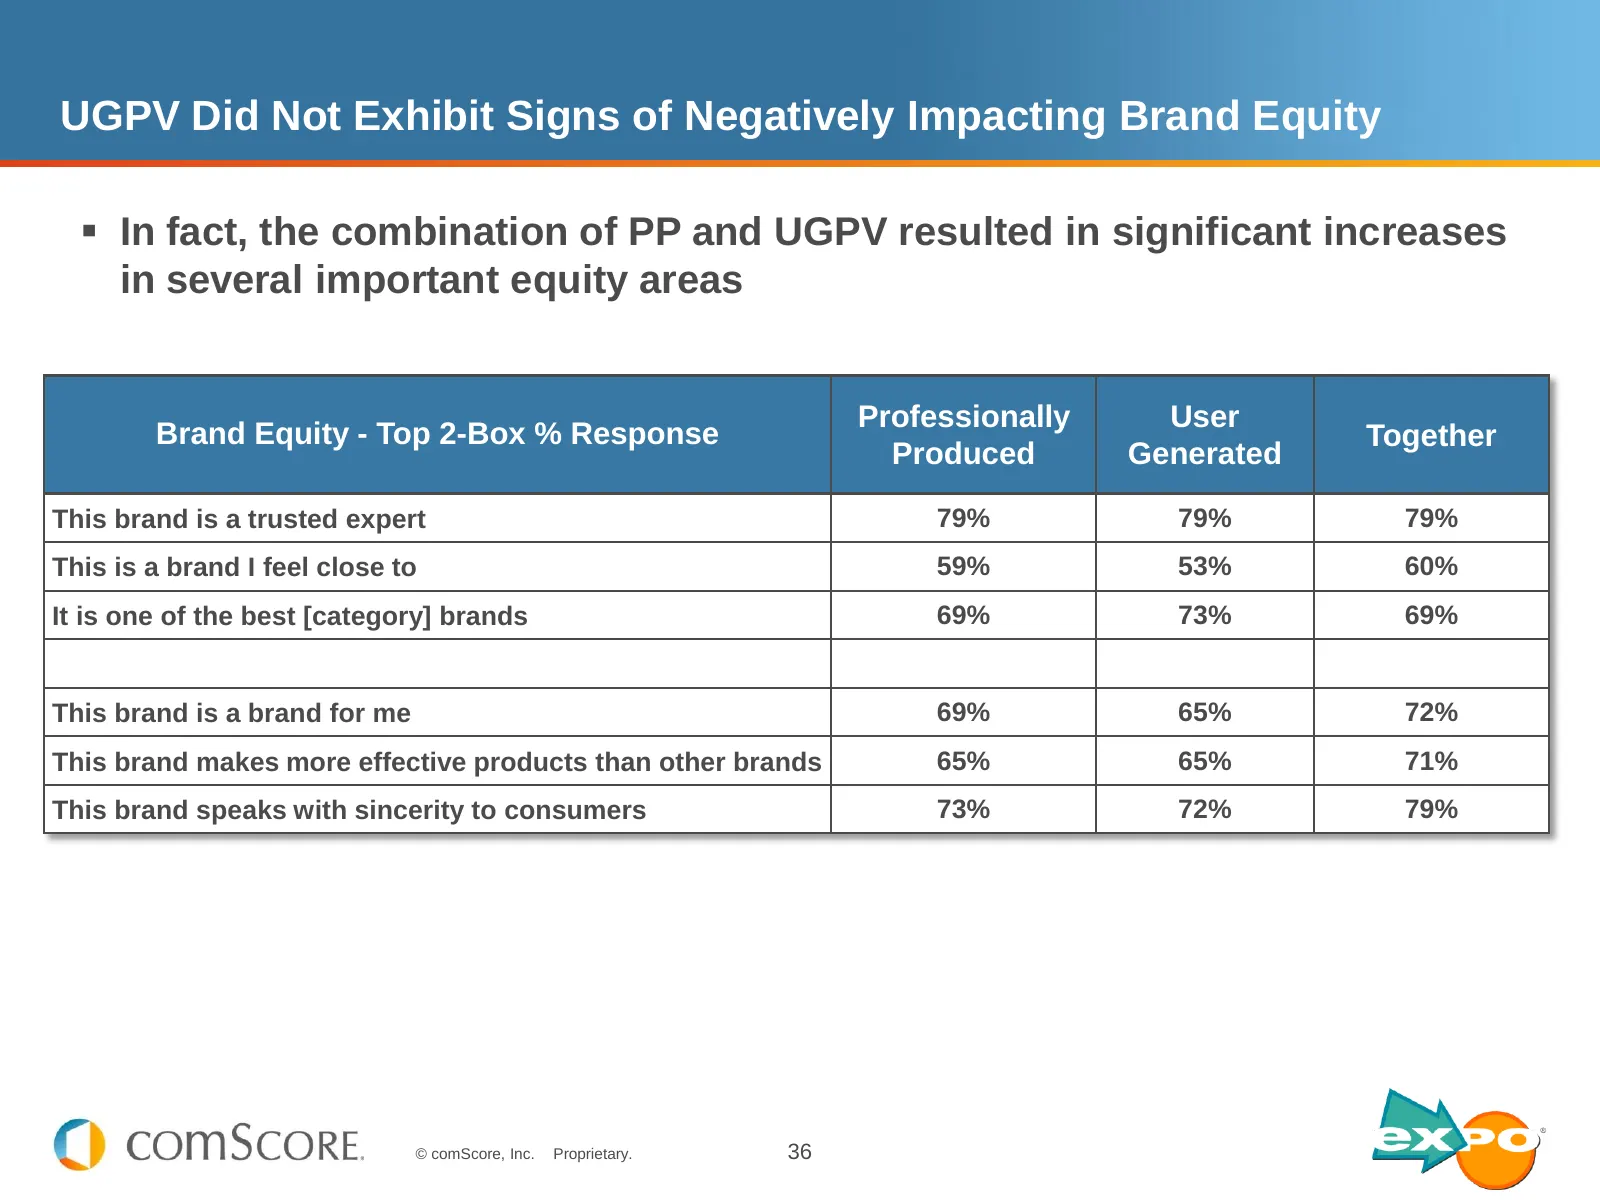
UGPV Did Not Exhibit Signs of Negatively Impacting Brand Equity In fact, the combination of PP and UGPV resulted in significant increases in several important equity areas Professionally User Brand Equity - Top 2-Box % Response Together Produced Generated This brand is a trusted expert 79% 79% 79%
Slide 37: Superior Sensitivity and Precision; Identifies Category & Halo Effects
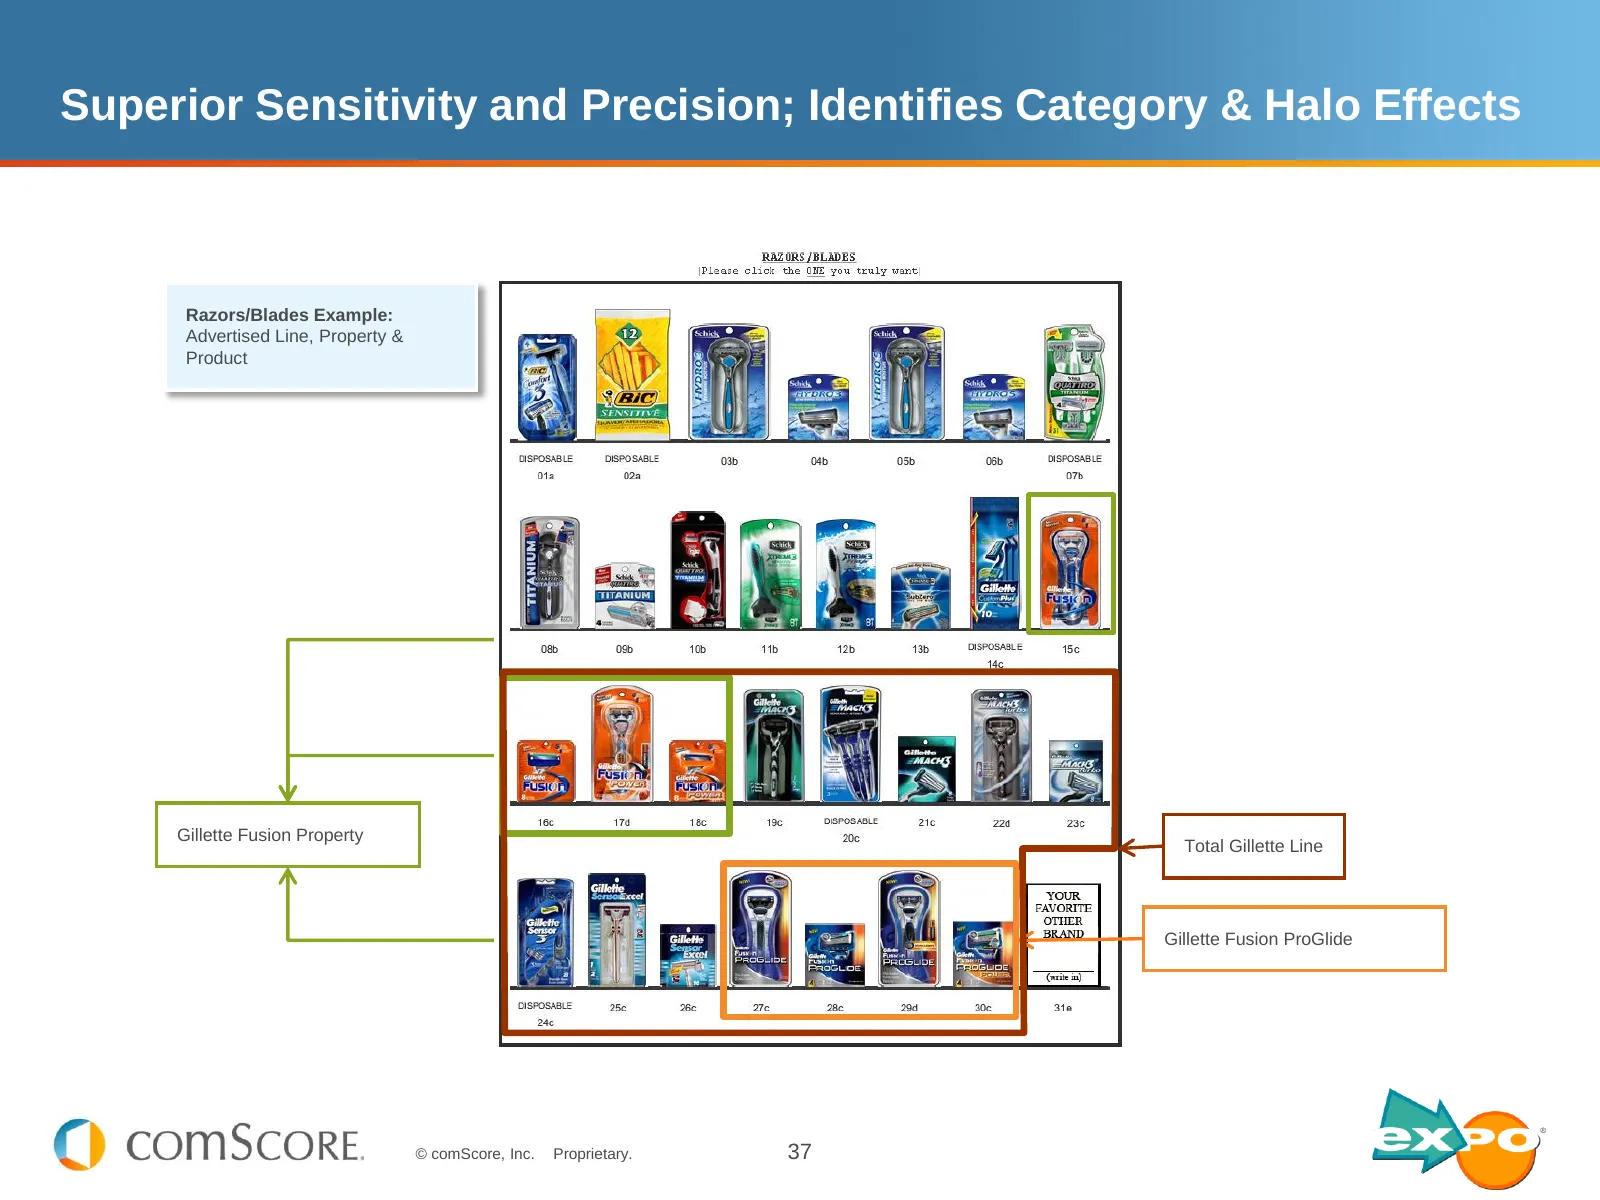
Superior Sensitivity and Precision; Identifies Category & Halo Effects Razors/Blades Example: Advertised Line, Property & Product Gillette Fusion Property Total Gillette Line Gillette Fusion ProGlide © comScore, Inc. Proprietary. 37
Slide 38: Share of Choice is Highly Predictive of Sales
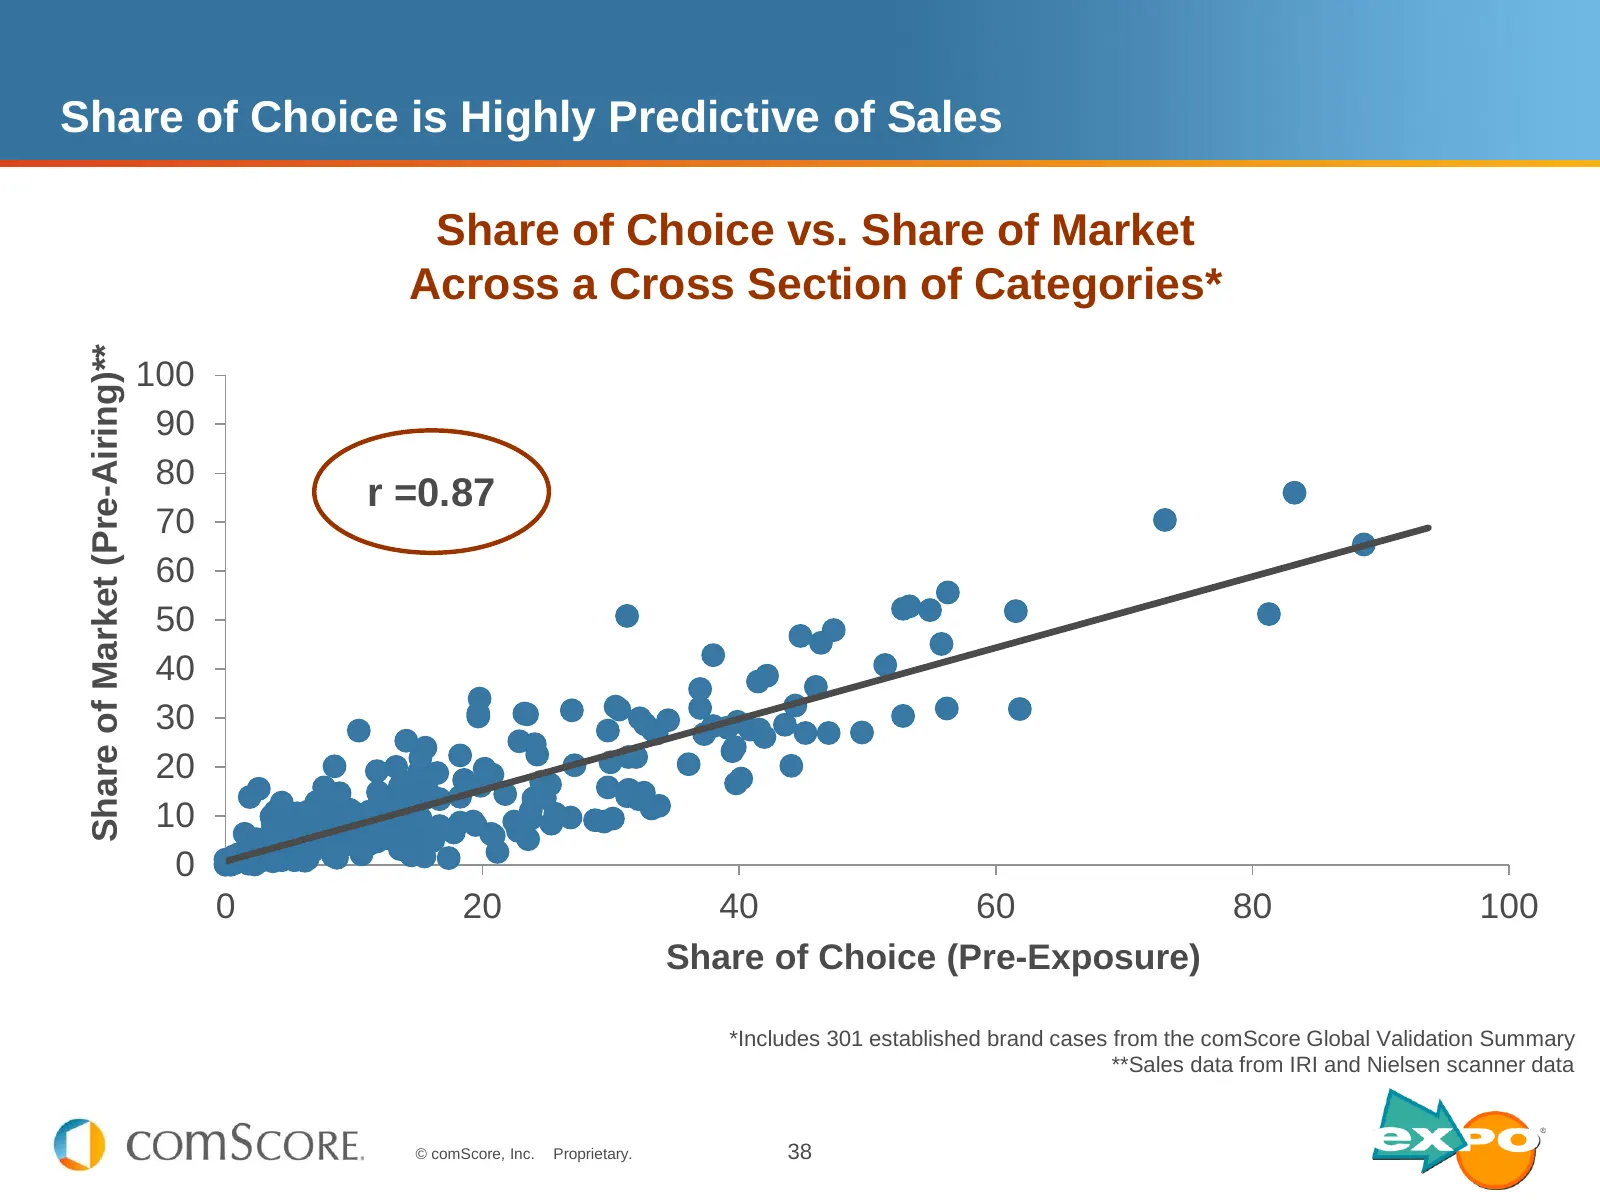
Share of Choice is Highly Predictive of Sales Share of Choice vs. Share of Market Across a Cross Section of Categories* Share of Market (Pre-Airing)** 100 90 80 r =0.87 70 60 50 40 30 20 10 0 0 20 40 60 80 100 Share of Choice (Pre-Exposure) *Includes 301 established brand cases from the comScore Glo
Slide 39: Both PP and UG Videos Are Effective at Driving Choice
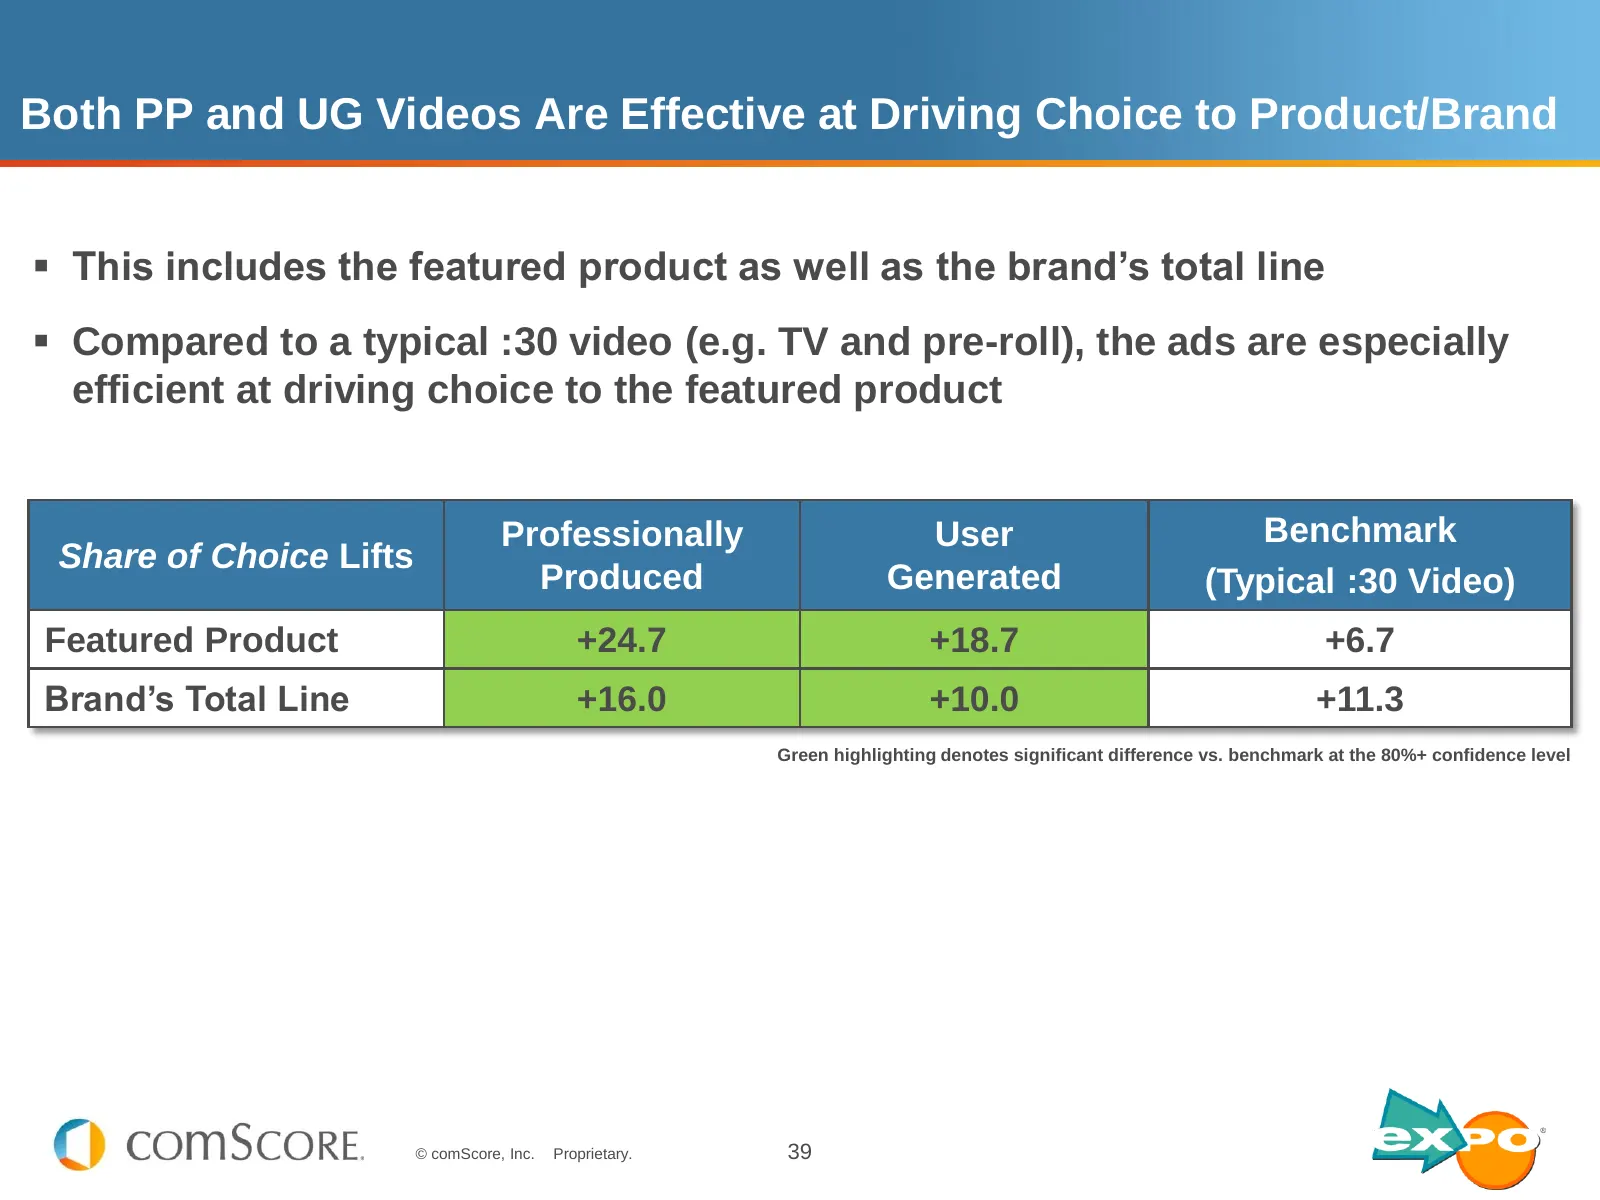
Both PP and UG Videos Are Effective at Driving Choice to Product/Brand This includes the featured product as well as the brand’s total line Compared to a typical :30 video (e.g. TV and pre-roll), the ads are especially efficient at driving choice to the featured product Professionally User Bench
Slide 40: PP and UG Videos Are Highly Synergistic in Driving Choice
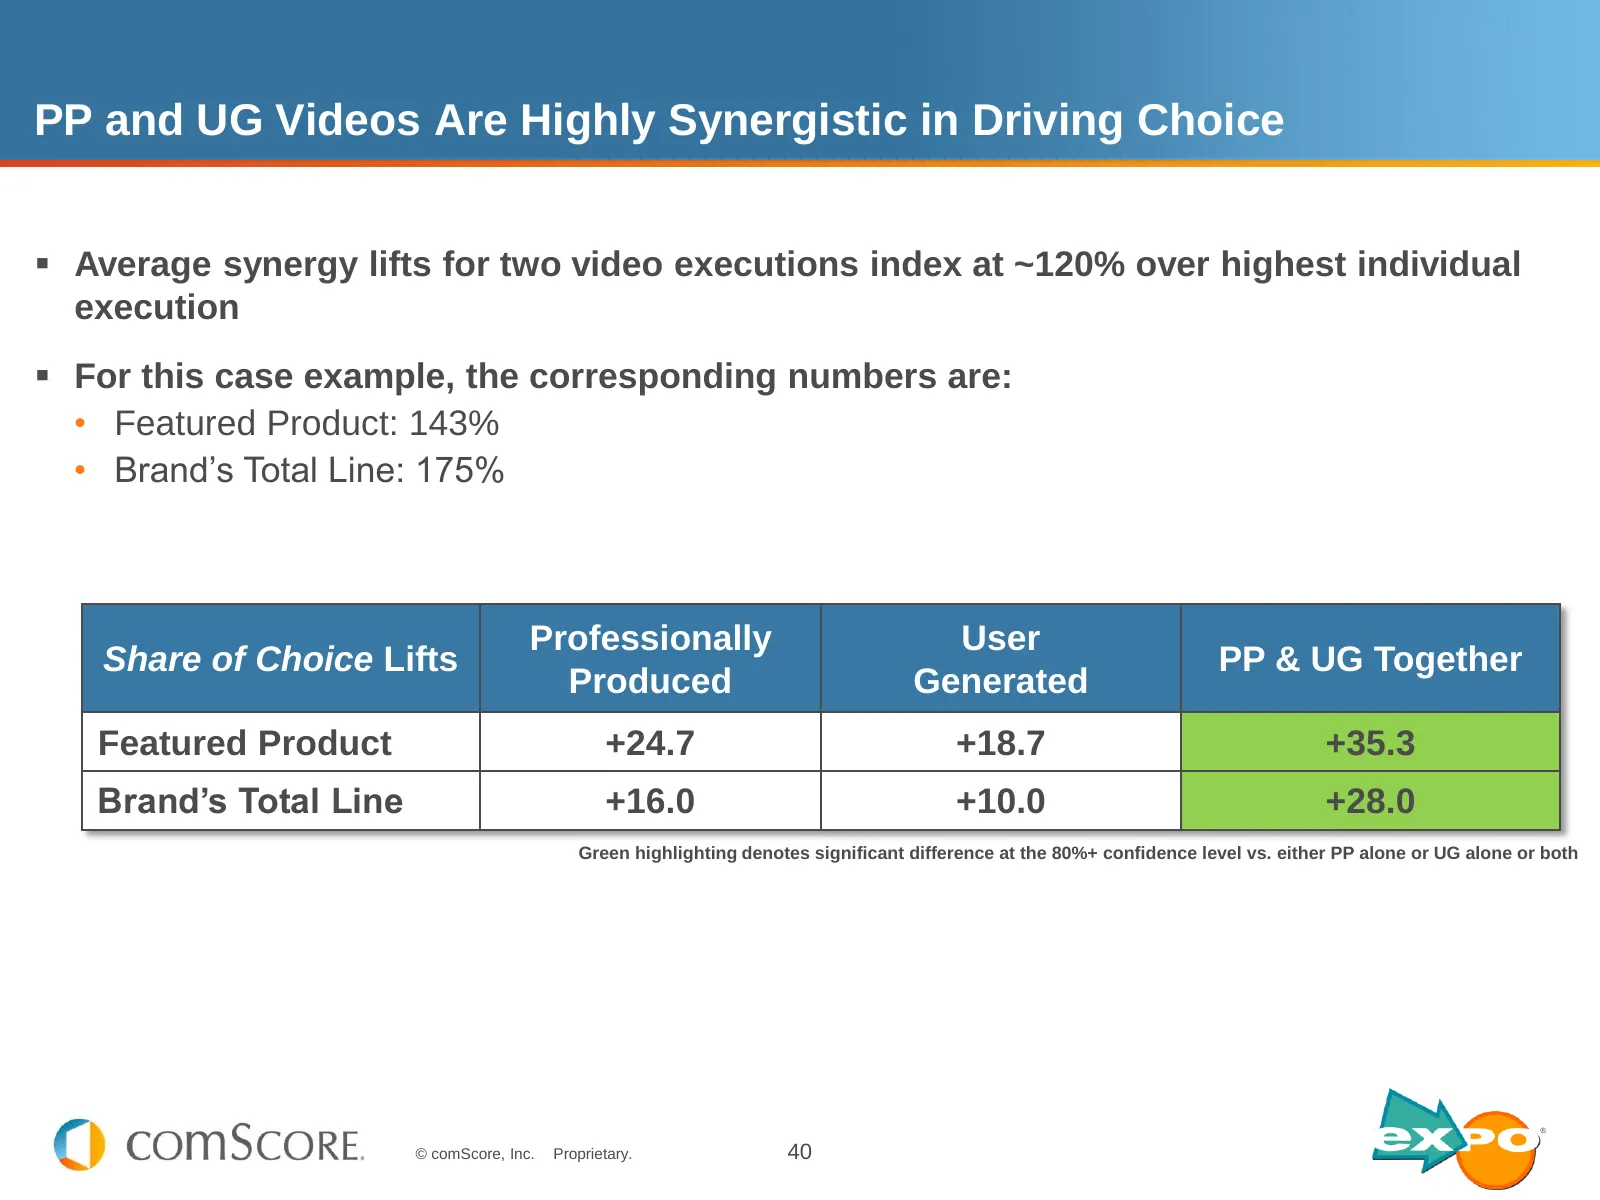
PP and UG Videos Are Highly Synergistic in Driving Choice Average synergy lifts for two video executions index at ~120% over highest individual execution For this case example, the corresponding numbers are: • Featured Product: 143% • Brand’s Total Line: 175% Professionally User Share of Choice
Slide 41: Incremental Gain Is Sourcing From Competitors
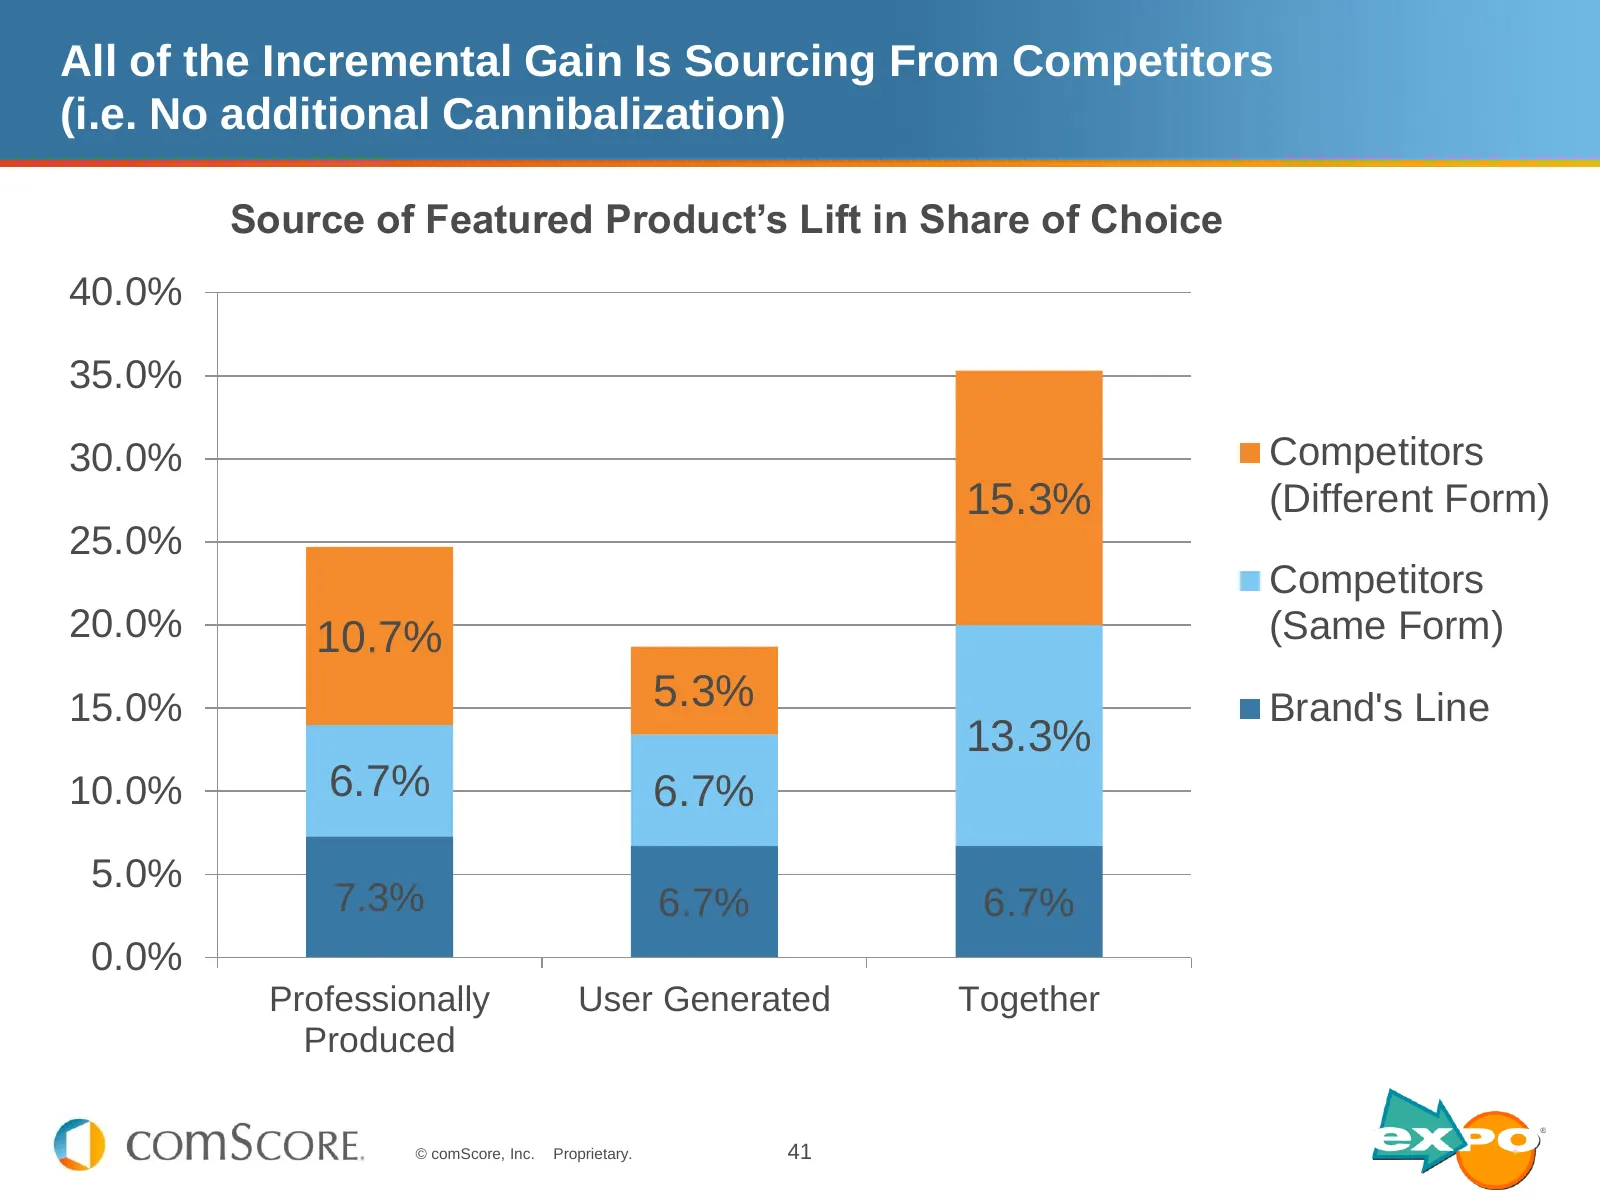
All of the Incremental Gain Is Sourcing From Competitors (i.e. No additional Cannibalization) Source of Featured Product’s Lift in Share of Choice 40.0% 35.0% 30.0% Competitors 15.3% (Different Form) 25.0% Competitors 20.0% 10.7% (Same Form) 15.0% 5.3% Brand's Line 13.3% 10.0% 6.7% 6.7% 5.0% 7.3% 6.

Slide 42: Summary
Summary © comScore, Inc. Proprietary. 42
Slide 43: The PP and UGP Videos Are Highly Synergistic
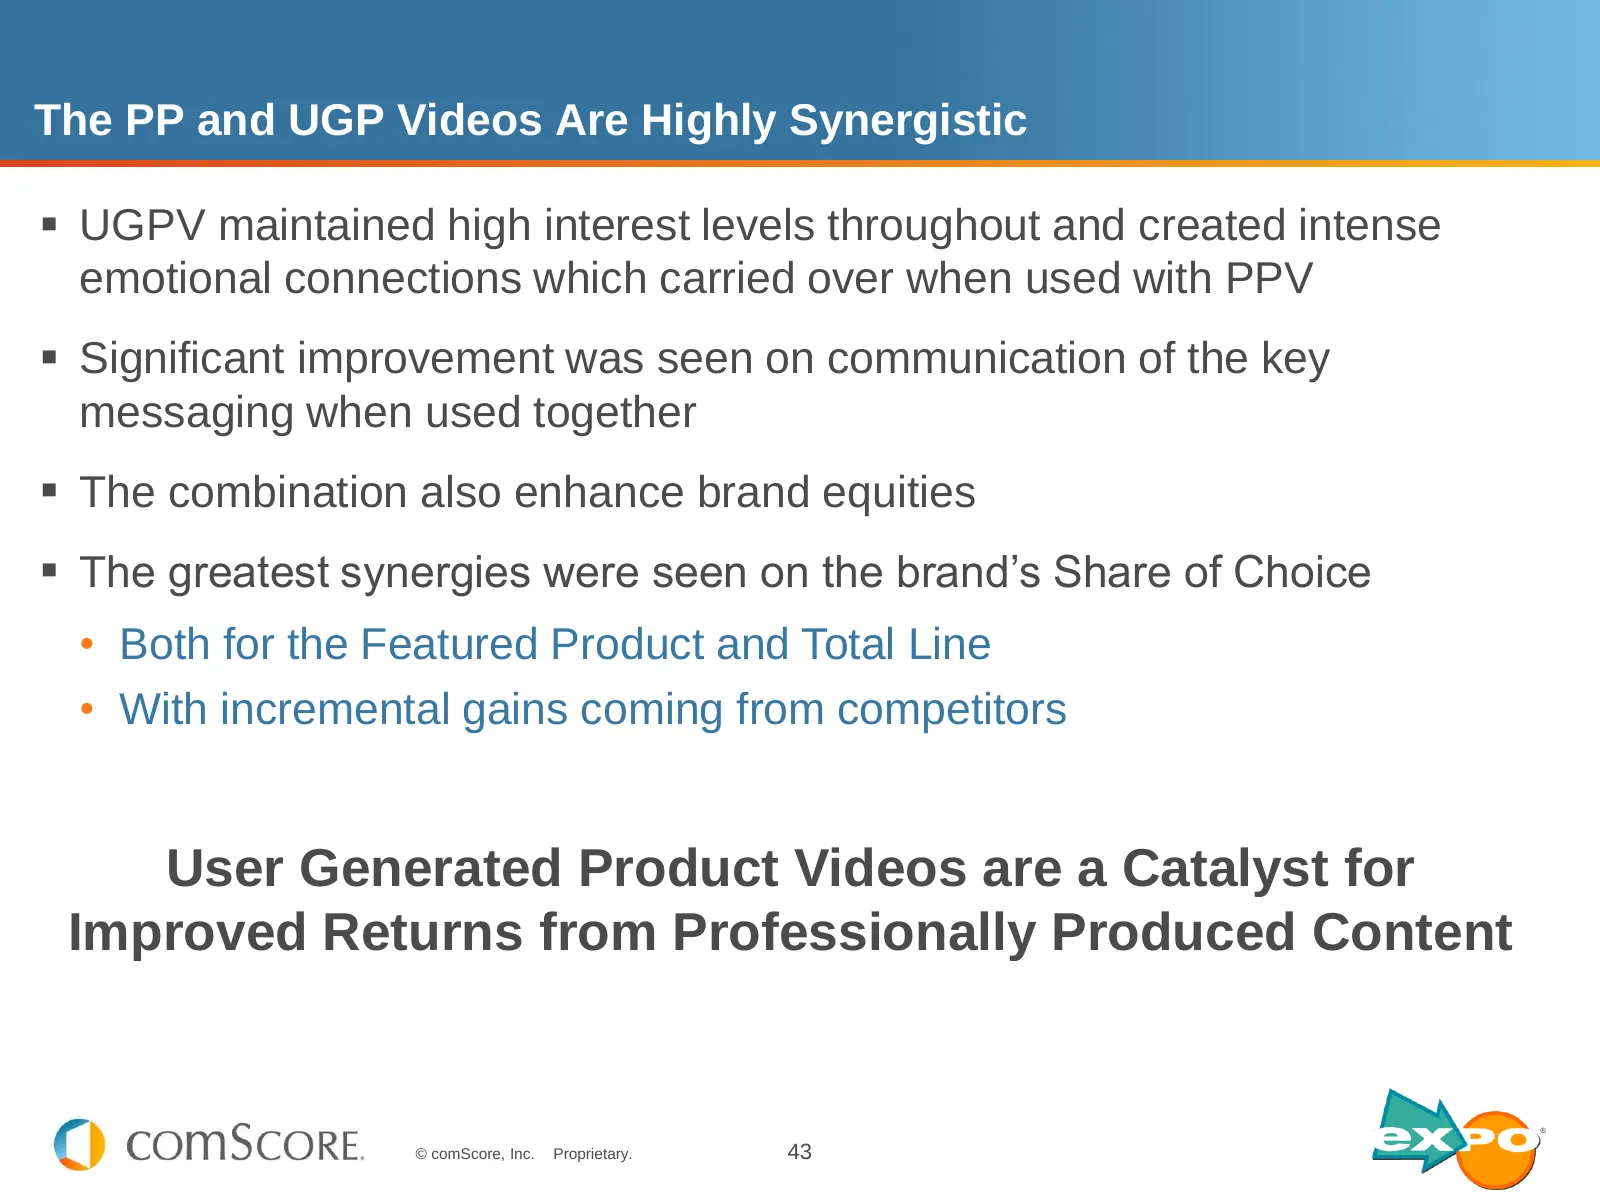
The PP and UGP Videos Are Highly Synergistic UGPV maintained high interest levels throughout and created intense emotional connections which carried over when used with PPV Significant improvement was seen on communication of the key messaging when used together The combination also enhance br

Slide 44: Questions?
Questions? © comScore, Inc. Proprietary. 44
Slide 45: Thank you!
Thank you! Frank Findley ffindley@comscore.com Jessica Thorpe jessica@expotv.com © comScore, Inc. Proprietary. 45
Source: Internet Archive copy of comscore.com
More decks from comScore, Inc.
 Q3 2026 Earnings Presentation17 slides · Nov 3, 2026
 Q2 2026 Earnings Presentation20 slides · Aug 12, 2026
 Investor Presentation (June 2026)27 slides · Jun 10, 2026
 Q4 2025 Earnings Presentation13 slides · Mar 17, 2026
 Q3 2025 Earnings Presentation15 slides · Nov 4, 2025
 Q2 2025 Earnings Presentation11 slides · Aug 5, 2025