Duke Realty — REITWorld 2017: NAREIT's Annual Convention
49 slides from Duke Realty's conference presentation, Nov 14, 2017
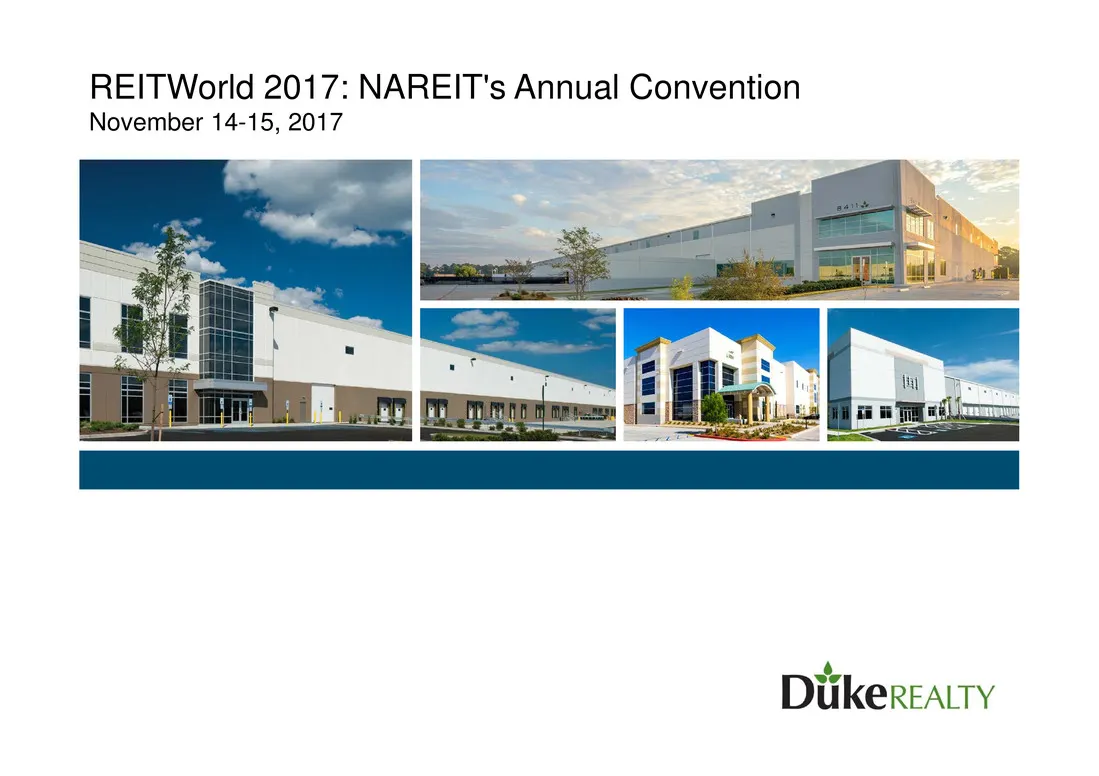
Slide 1: REITWorld 2017: NAREIT's Annual Convention
REITWorld 2017: NAREIT's Annual Convention November 14-15, 2017 ve DiikereAtty
Slide 2: Forward-Looking Statement
Forward-Looking Statement Tie slide presentation contsing statements that constitute forward: I-looking statements” within the meaning f 19: of 1934 as amended by the Private Securities Chigation Rotorm Act of 1995, hese forward-looking statements include, among others, our statement regarding (1) s
Slide 3: Contents
Contents Who We Are | Why Duke Realty Key Business Drivers Asset Strategy = Operating Portfolio = Development = Acquisitions Operating Strategy Capital Strategy Why Duke Realty & ESG Diikexeairy
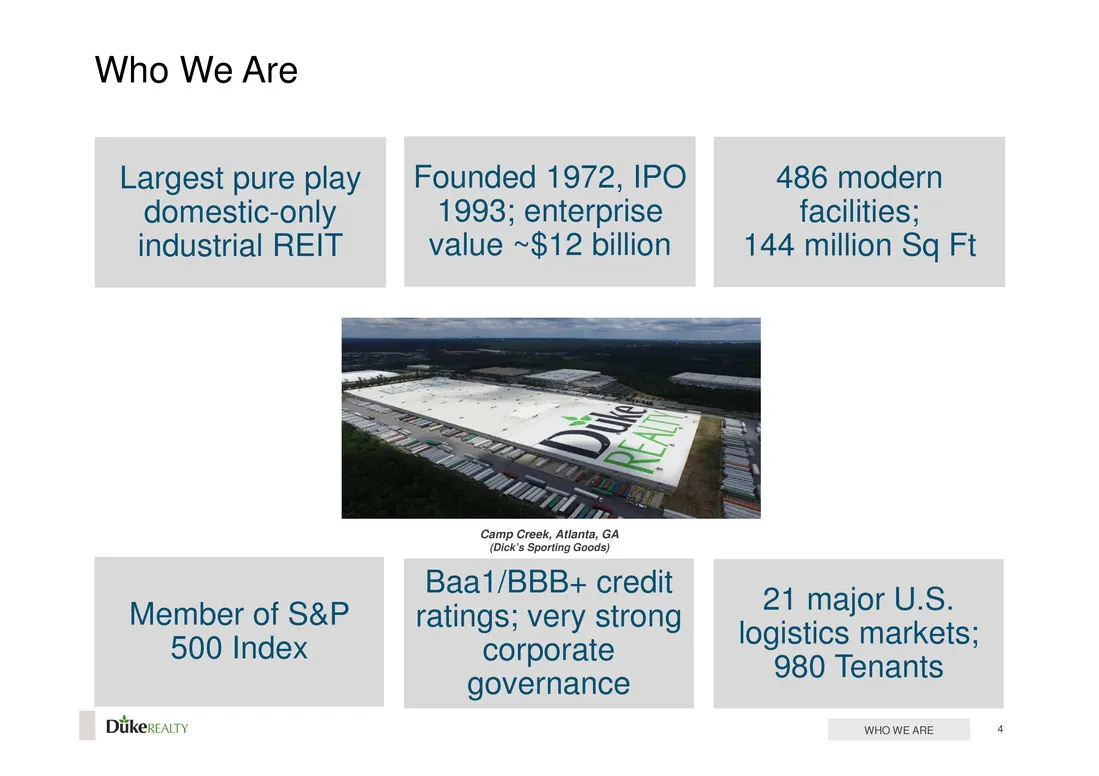
Slide 4: Who We Are
Who We Are Largest pure play Founded 1972, IPO 486 modern domestic-only 1993; enterprise facilities; industrial REIT value ~$12 billion 144 million Sq Ft Camp Creek, Atlanta, GA (Dick's Sporting Goods) Baa1/BBB+ credit F Member of S&P _ratings; very strong Ree 500 Index corporate “380 Tenants _ gove
Slide 5: Why Duke Realty?
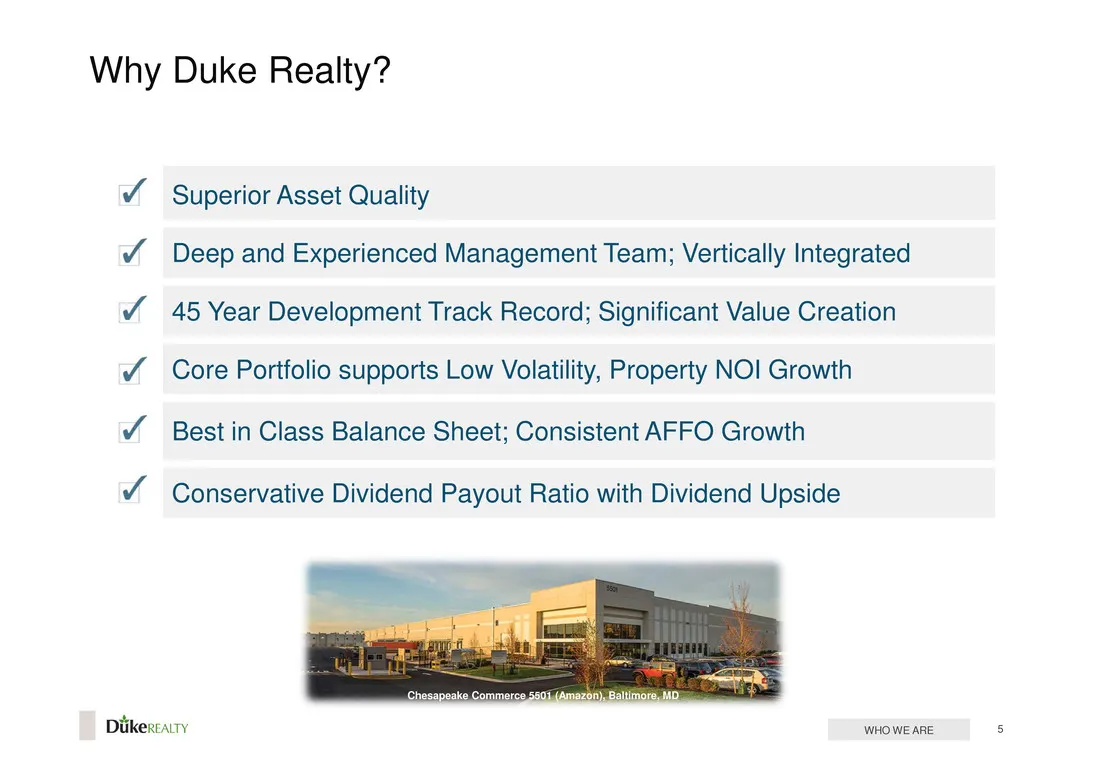
Why Duke Realty? Superior Asset Quality Deep and Experienced Management Team; Vertically Integrated 45 Year Development Track Record; Significant Value Creation Core Portfolio supports Low Volatility, Property NOI Growth Best in Class Balance Sheet; Consistent AFFO Growth SSRARRA Conservative Divide
Slide 6: Industrial Advantage
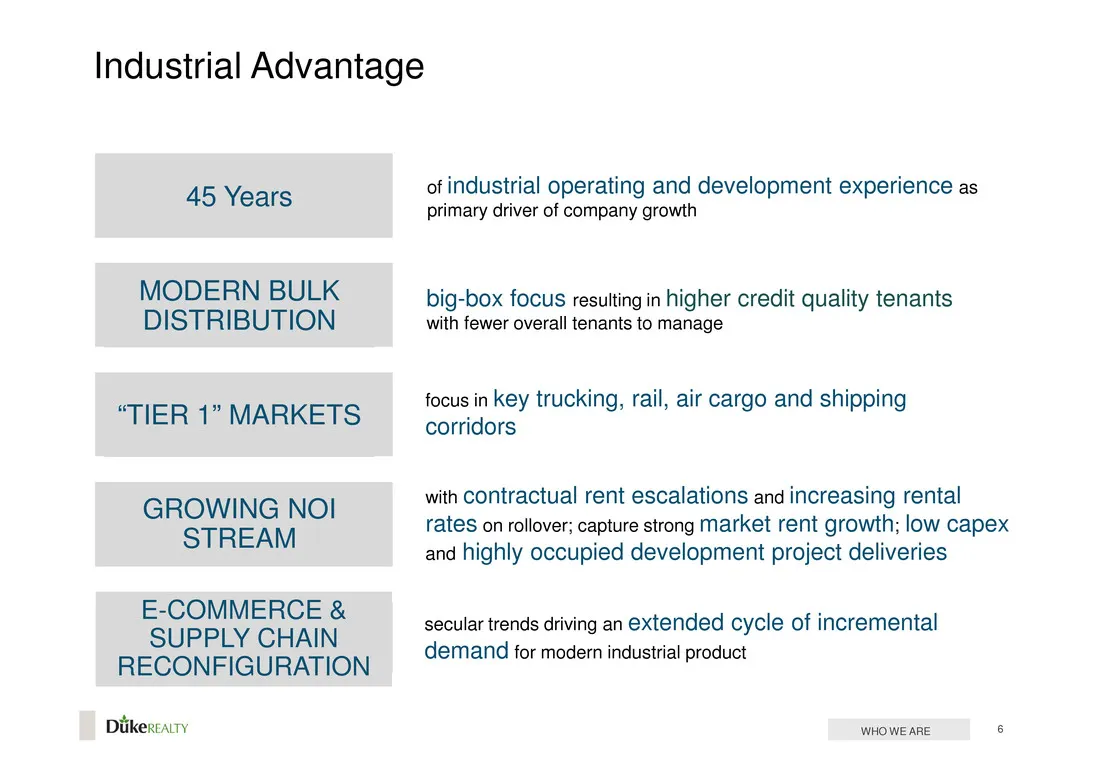
Industrial Advantage of industrial operating and development experience as 45 Years primary driver of company growt MODERN BULK big-box focus resulting in higher credit quality tenants DISTRIBUTION with fewer overall tenants to manage focus in key trucking, rail, air cargo and shipping corridors “TI
Slide 7: Key Industrial Business Drivers & State of the Market
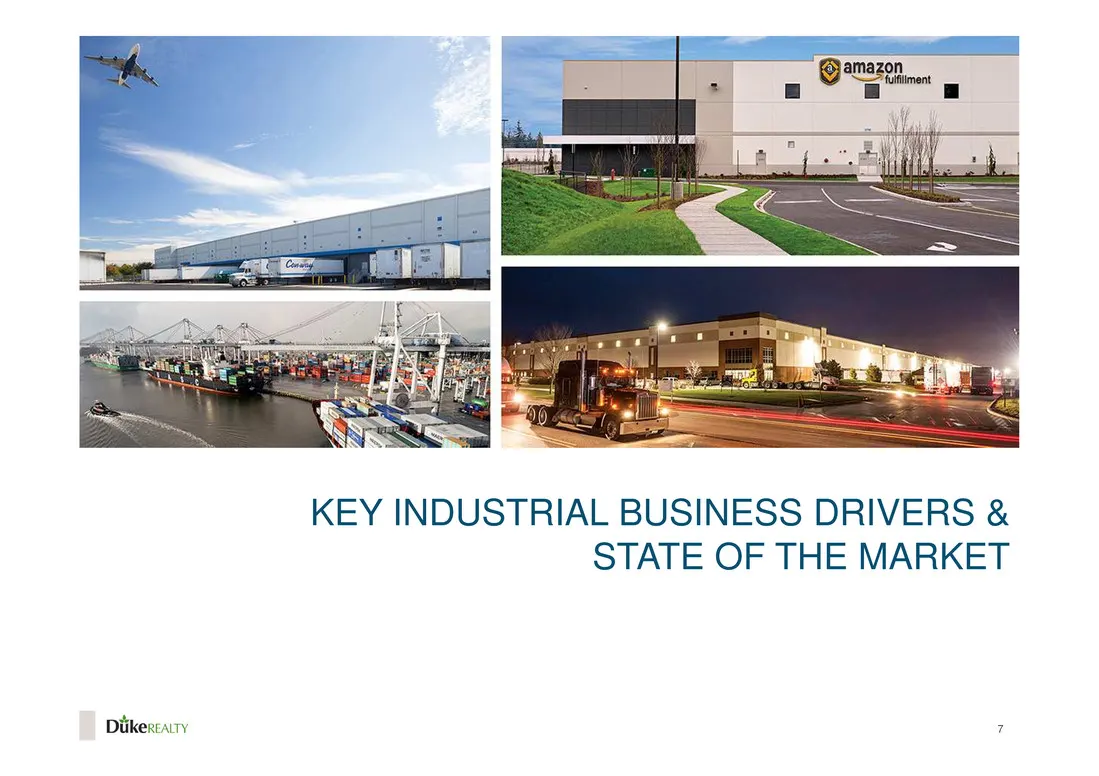
KEY INDUSTRIAL BUSINESS DRIVERS & STATE OF THE MARKET re Dukercatry
Slide 8: Demand: Macroeconomic Indicators / Drivers
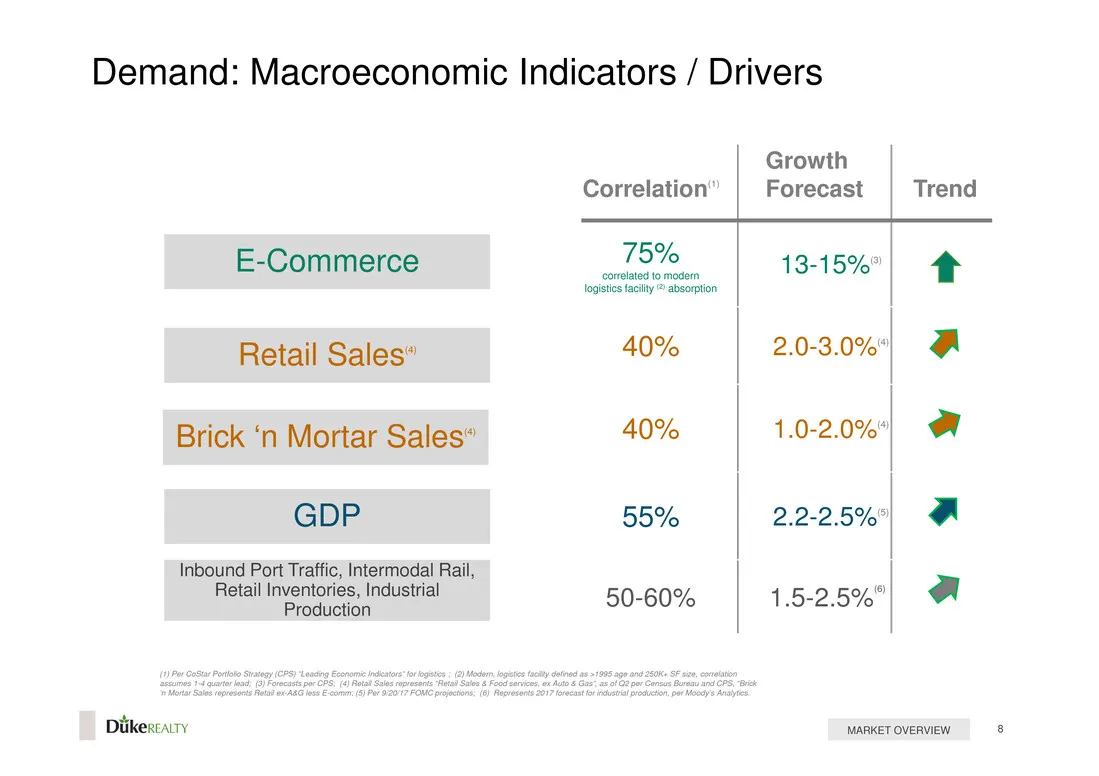
Demand: Macroeconomic Indicators / Drivers E-Commerce Retail Sales® Brick ‘n Mortar Sales” GDP Inbound Port Traffic, Intermodal Rail, Retail Inventories, Industrial luction Diikexiairy Growth Correlation” Forecast Trend eae, oe 40% 2.0-3.0%"| A 40% 1.0-2.0%"| WT 55% 2.2-2.5%"| 50-60% 1.5-2.5%"| A MA
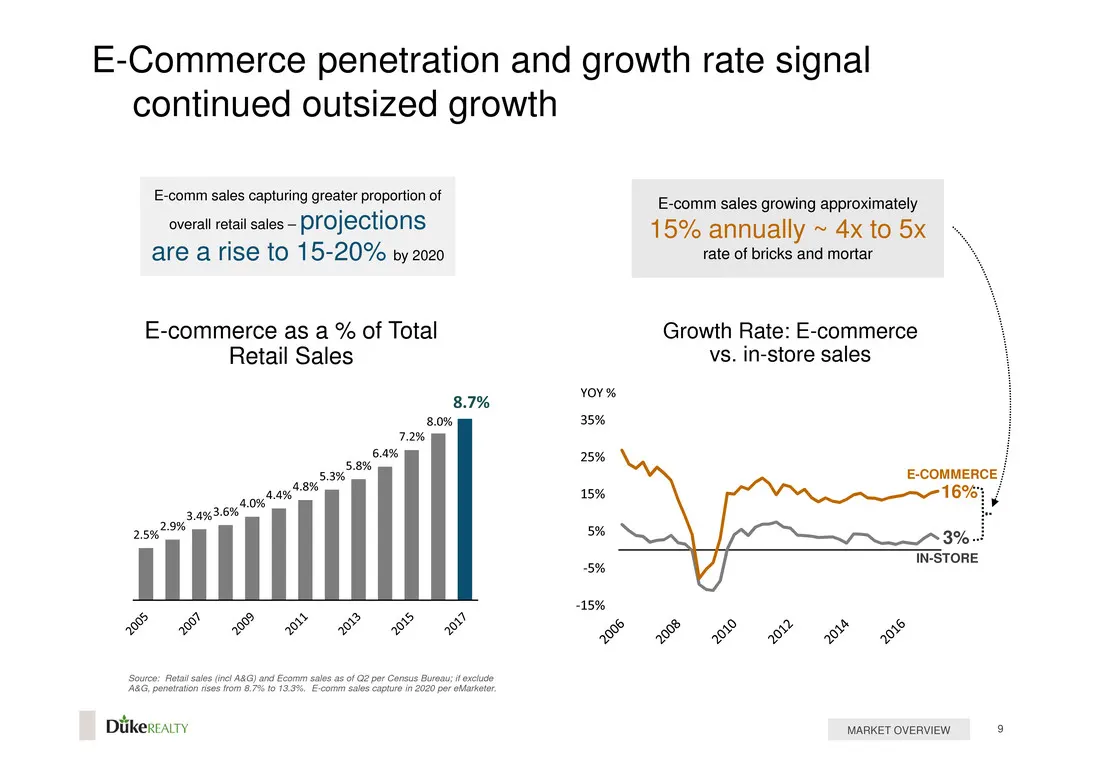
Slide 9: E-Commerce penetration and growth rate signal continued outsized growth
E-Commerce penetration and growth rate signal continued outsized growth E-comm sales capturing greater proportion of overall retail sales - Projections are a rise to 15-20% by 2020 E-commerce as a % of Total Retail Sales Diikexeairy E-comm sales growing approximately 15% annually ~ 4x to 5x ~. rate
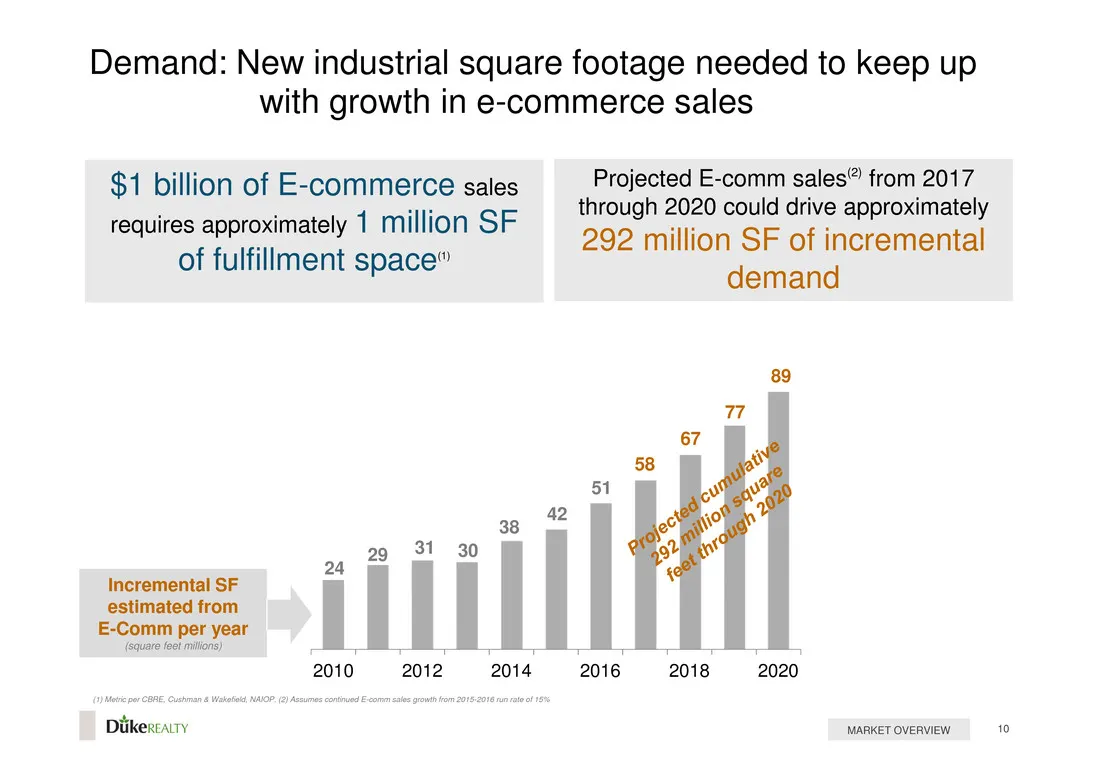
Slide 10: Demand: New industrial square footage needed to keep up with growth in e-commerce sales
Demand: New industrial square footage needed to keep up with growth in e-commerce sales $1 billion of E-commerce sales Projected E-comm sales® from 2017 ites approximately 1 emillion(SE through 2020 could drive approximately pease ane taal 292 million SF of incremental of fulfillment space” demand 8
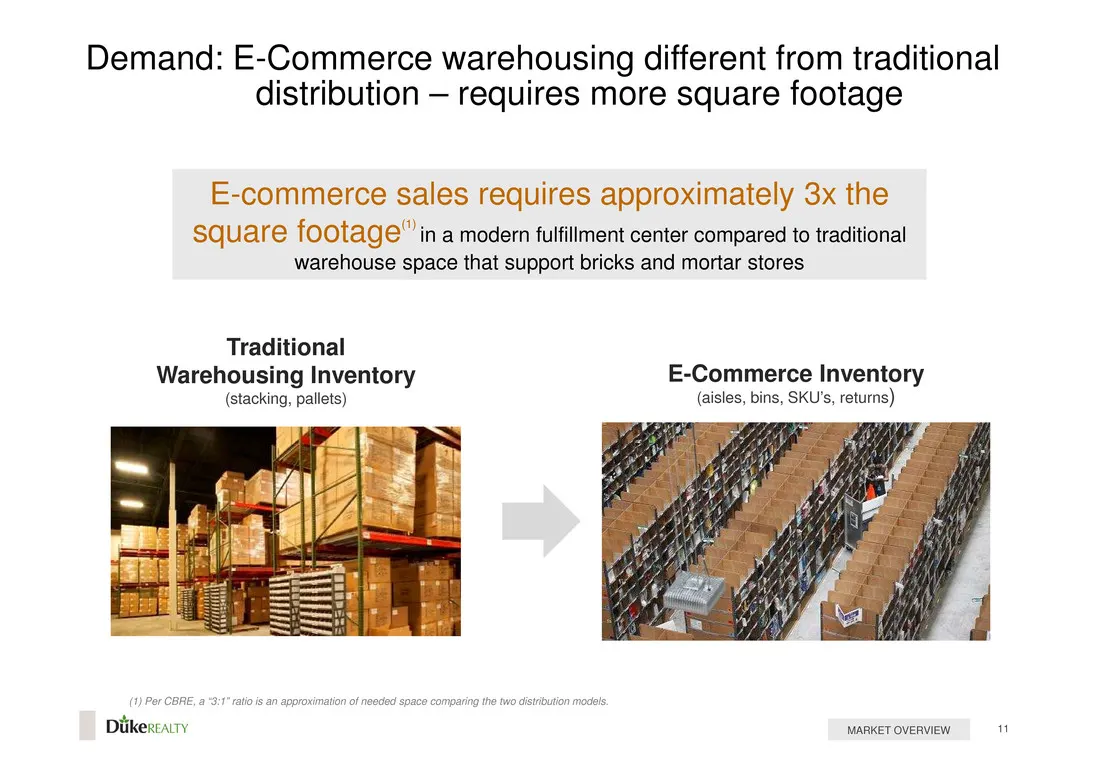
Slide 11: Demand: E-Commerce warehousing different from traditional distribution
Demand: E-Commerce warehousing different from traditional distribution — requires more square footage E-commerce sales requires approximately 3x the square footage" in a modern fulfillment center compared to traditional warehouse space that support bricks and mortar stores Traditional Warehousing In
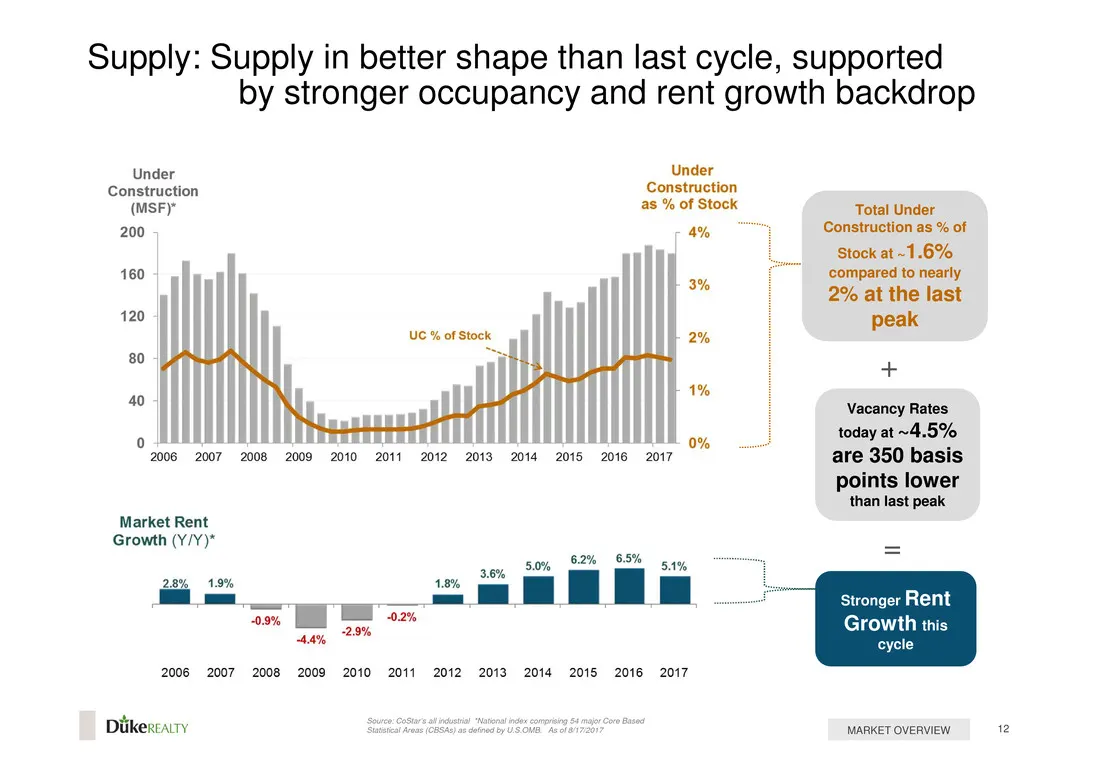
Slide 12: Supply: Supply in better shape than last cycle
Supply: Supply in better shape than last cycle, supported by stronger occupancy and rent growth backdrop inde Under Construction Construction (MSFP as % of Stock malUnten 200 4% Construction as % of Stock at ~1.6% 160 wa compared to nearly 2% at the last 120 ak UC % of Stock 2% re 80 | + 1% a0 Vacan
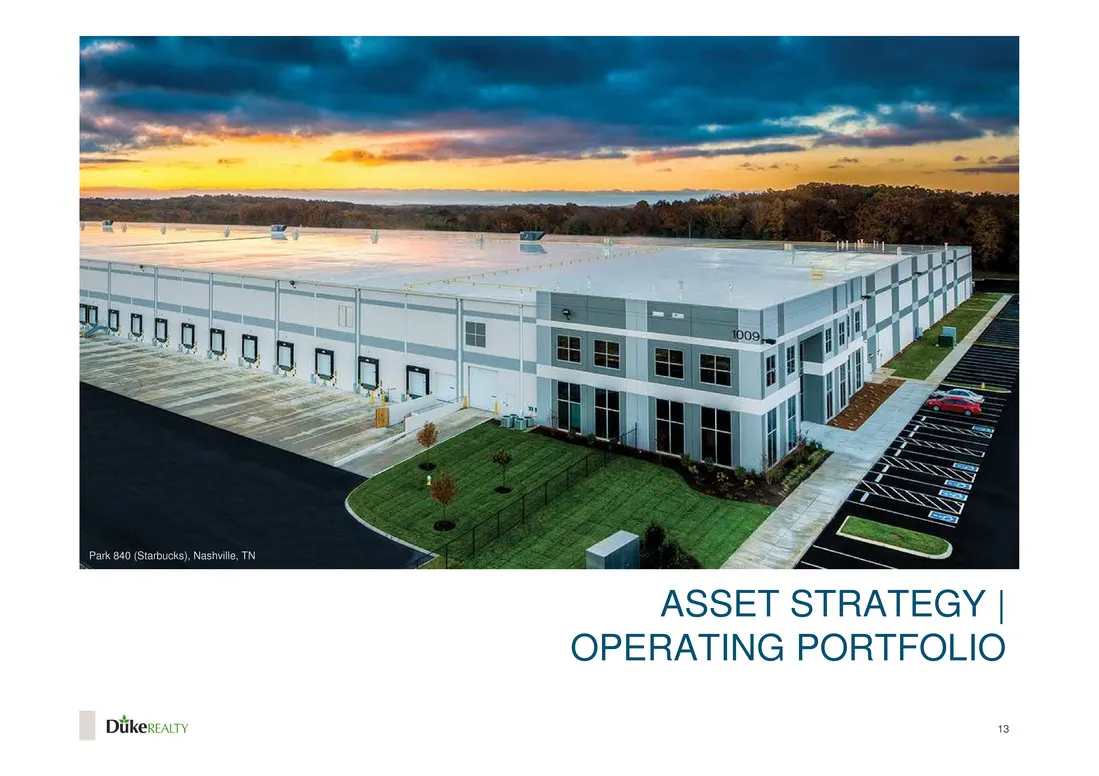
Slide 13: Asset Strategy | Operating Portfolio
ASSET STRATEGY | OPERATING PORTFOLIO Diikexiairy
Slide 14: Portfolio Geography
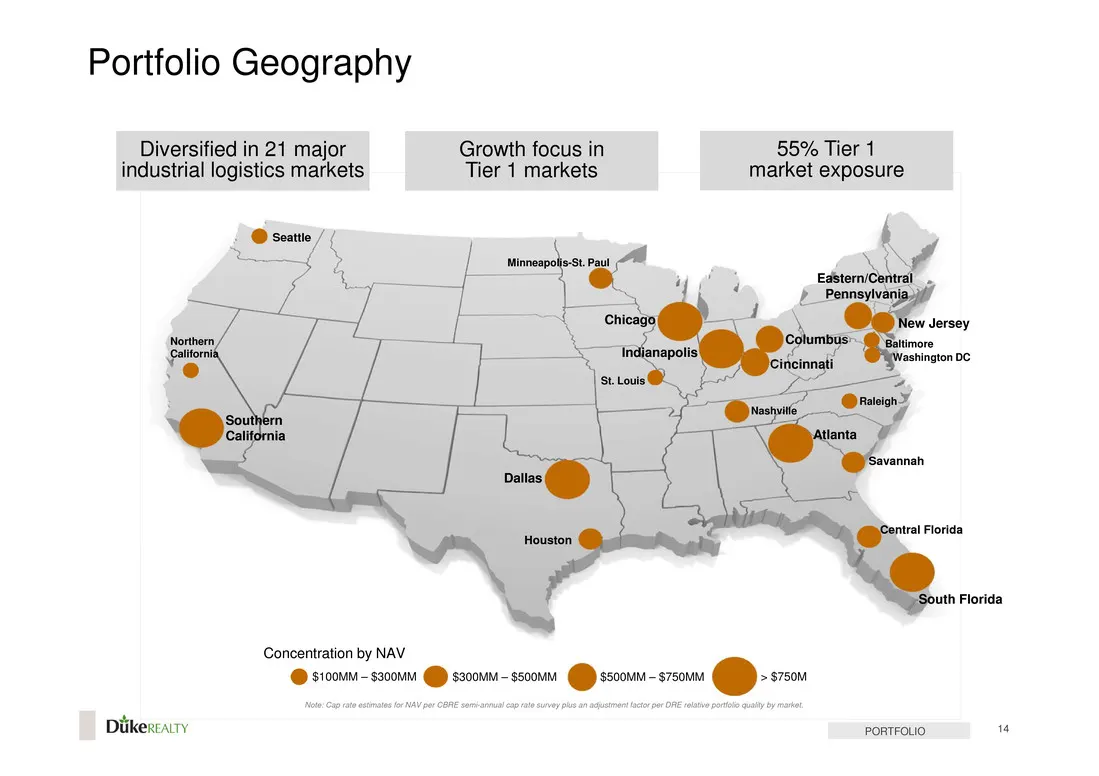
Portfolio Geography __ Diversified in 21 major Growth focus in 55% Tier 1 industrial logistics markets Tier 1 markets market exposure Concentration by NAV @ icone sso0.01 @ sscowne—sseova @ssoo.01-srsorae @-- i Diikereairy PORTFOLIO. 4
Slide 15: In-Service Industrial Portfolio - Peer Comparison
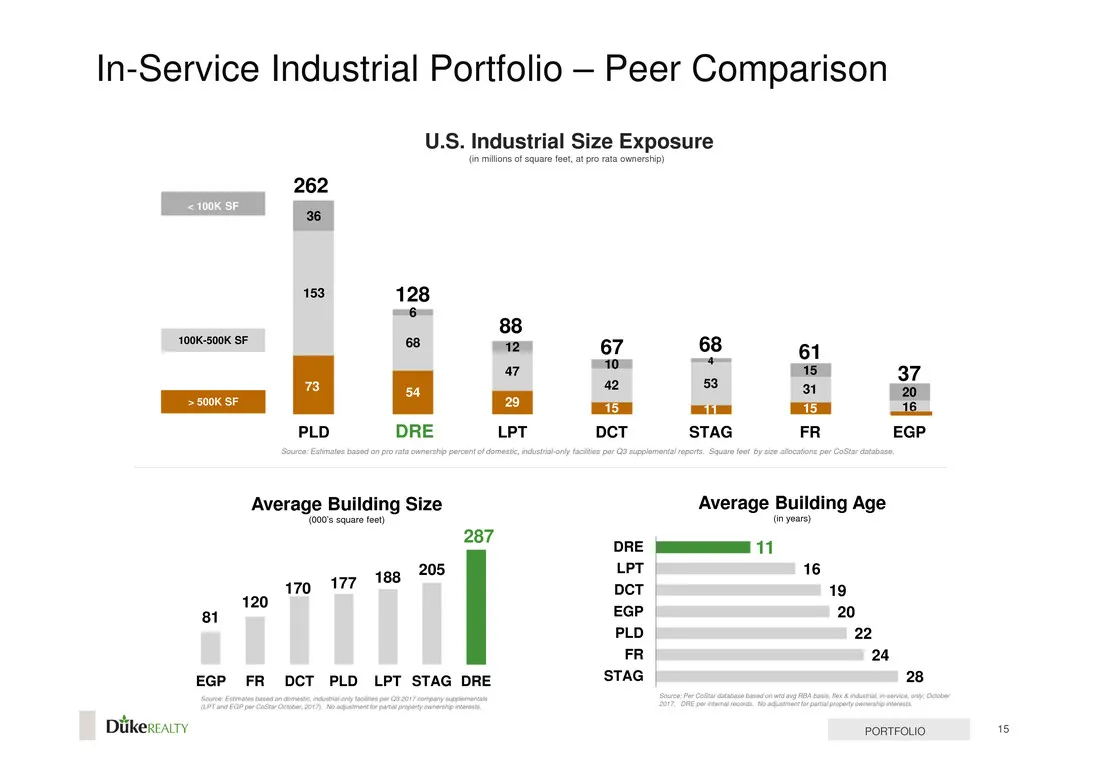
In-Service Industrial Portfolio - Peer Comparison U.S. Industrial Size Exposure ‘ var fc a po raa owes) milons of equa 262 36 153 128 6 88 100K 500K SF 68 st 67 68 61 47 _ * 15 37 2 | — oe PLD DRE LPT pcT STAG FR EGP Average Building Size Average Building Age {000% square fot) (yeas aah RE a 11 205
Slide 16: Modern Portfolio Advantage | 32'+ Clear Height Capturing Outsized Demand
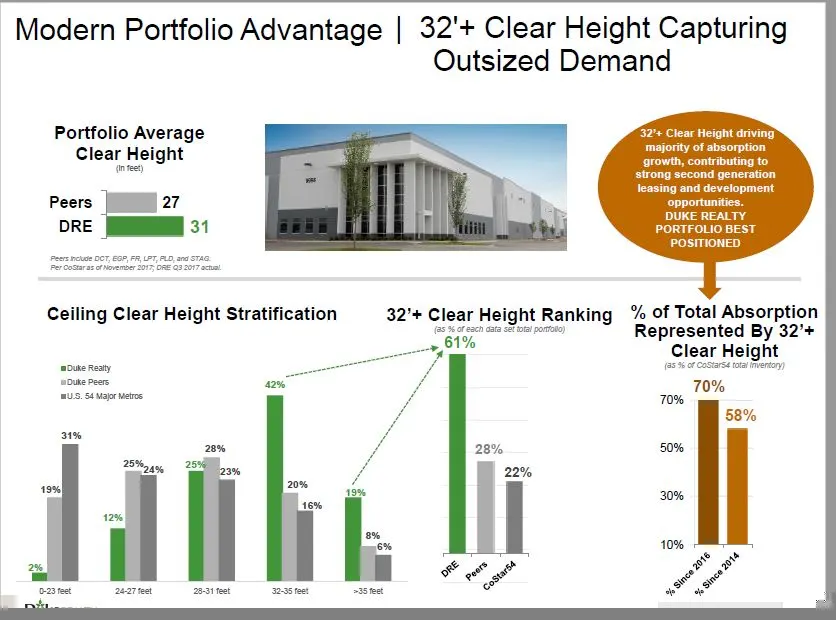
Modern Portfolio Advantage | 32'+ Clear Height Capturing Outsized Demand Portfolio Average Clear Height tee development nities. DUKE REALTY ORTFOLIO BEST POSITIONED Ceiling Clear Height Stratification 32’+ Clear Height Ranking % of Total Absorption “—i% Represented By 32’+ Clear Height owe neaty / (
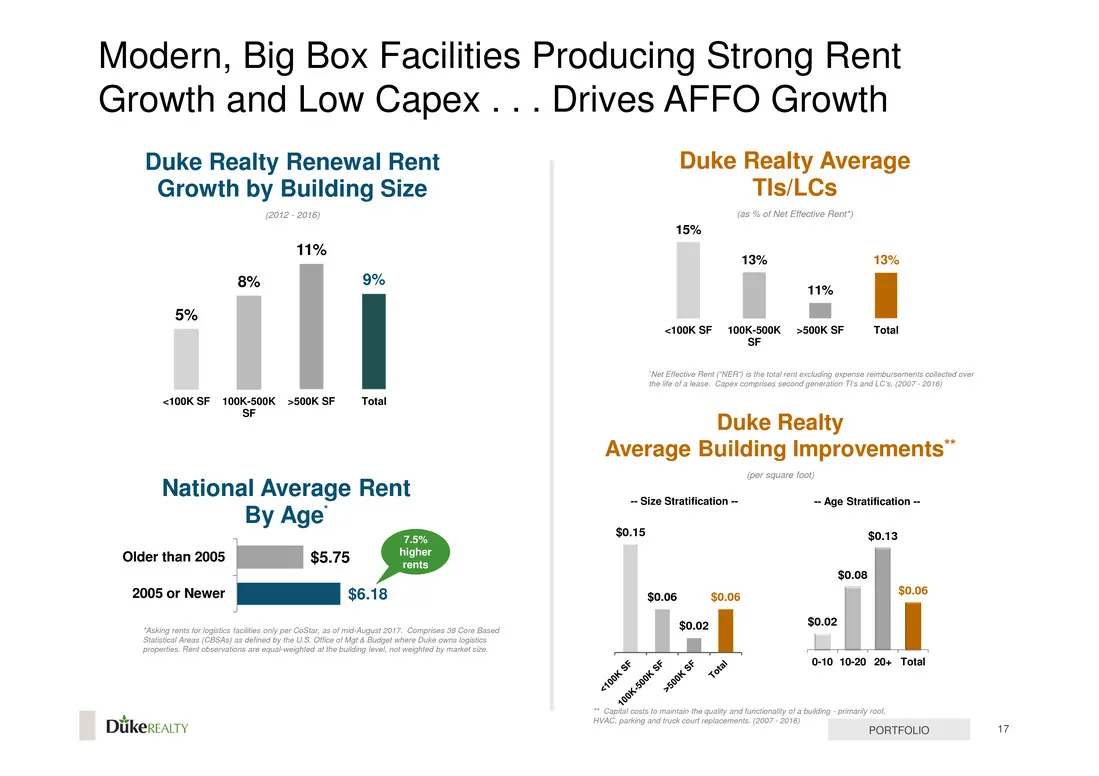
Slide 17: Modern, Big Box Facilities Producing Strong Rent Growth and Low Capex
Modern, Big Box Facilities Producing Strong Rent Growth and Low Capex... Drives AFFO Growth Duke Realty Renewal Rent Growth by Building Size 11% <100K SF 100K-500K >500K SF Total, SF National Average Rent By Age’ Older than 2005 JI) $5.75 2005 or Newer SN $6.18 i Diikereaity Duke Realty Average TIs/
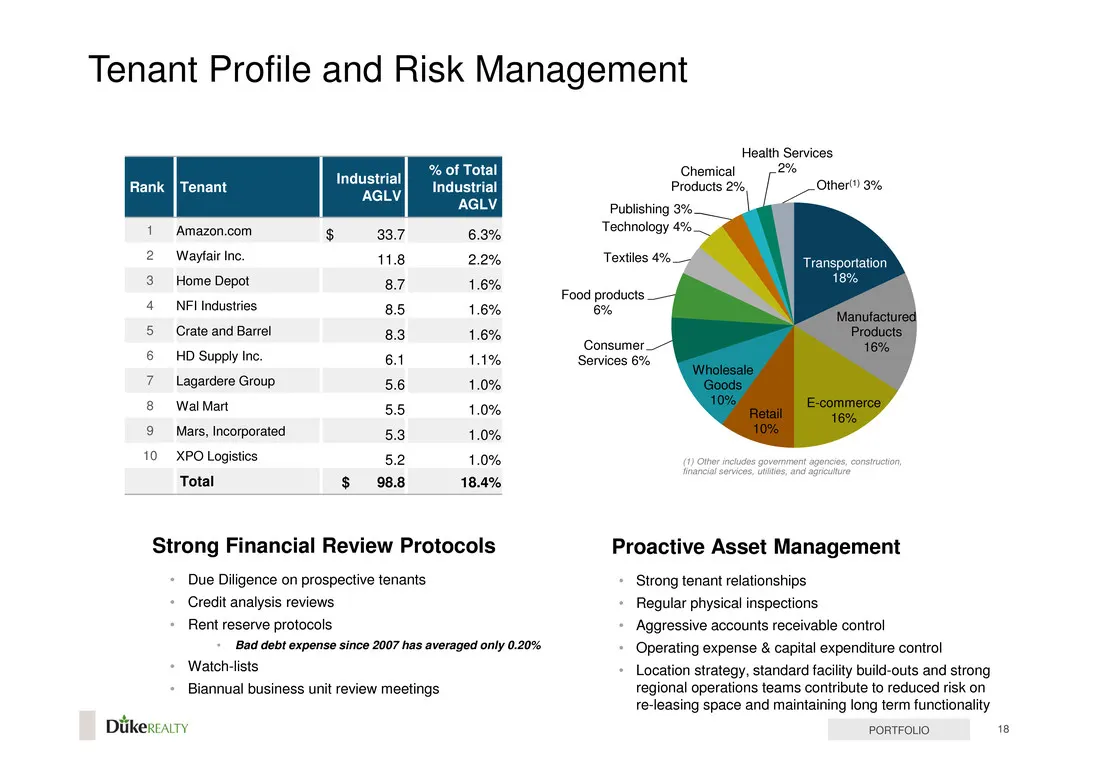
Slide 18: Tenant Profile and Risk Management
Tenant Profile and Risk Management Industrial] % of Total Rank | Tenant AGLV Publishing 3% 1 Amazon.com $ 337 6.3% Technology 4% 2 Wayfair Inc. 11.8 2.2% Textiles 4% __/ 3 Home Depot i 1.6% «Neti ost, 5 Crate and Barrel 83 1.6% Consumer. 6 HD Supply Inc. 6.1 1.1% Services 6% 7 Lagardere Group 5.6 1.
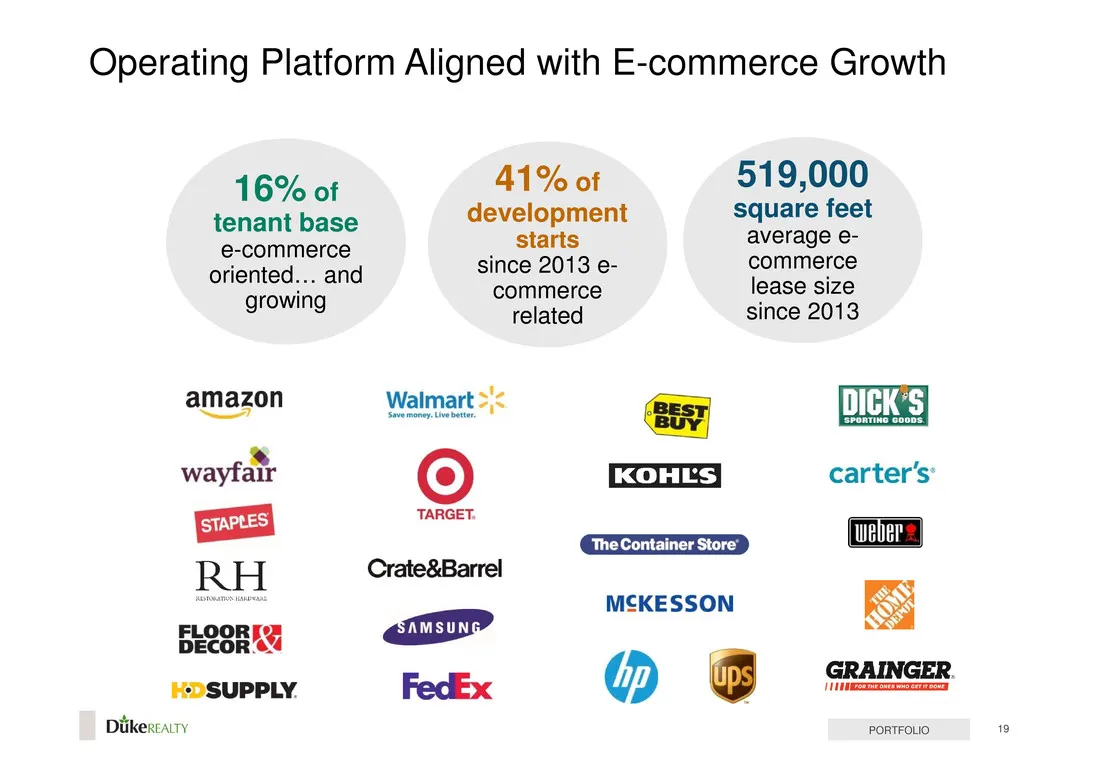
Slide 19: Operating Platform Aligned with E-commerce Growth
Operating Platform Aligned with E-commerce Growth 16% of tenant base e-commerce oriented... and growing amazon —s wayfar RH Beton }DSUPPLY. re Dukercatry 41% of 519,000 development square feet starts average e- since 2013 e- commerce commerce lease size related since 2013 Walmart >| /KOHLS| ‘TARGET.
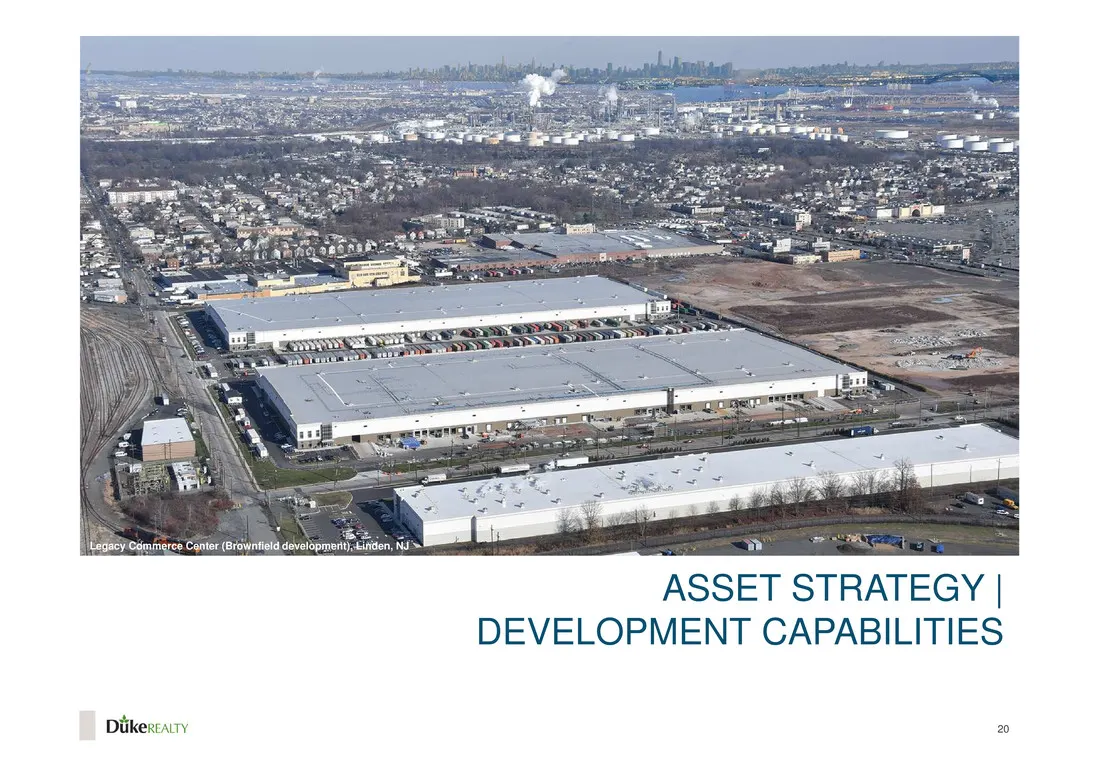
Slide 20: Asset Strategy | Development Capabilities
18 ASSET STRATEGY | DEVELOPMENT CAPABILITIES Diikexeairy 20
Slide 21: Development Strategic Advantages
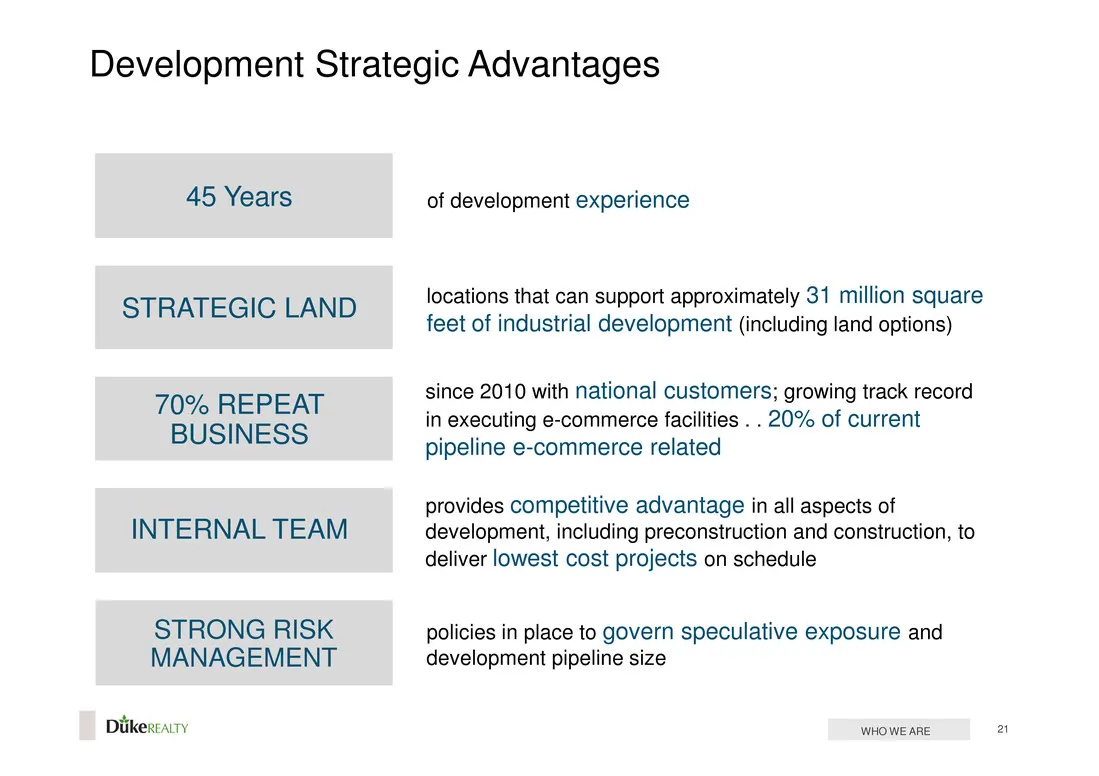
Development Strategic Advantages 45 Years of development experience locations that can support approximately 31 million square STRATEGIC LAND feet of industrial development (including land options) since 2010 with national customers; growing track record in executing e-commerce facilities .. 20% of
Slide 22: Development Strategic Advantages: Activity Since 2010
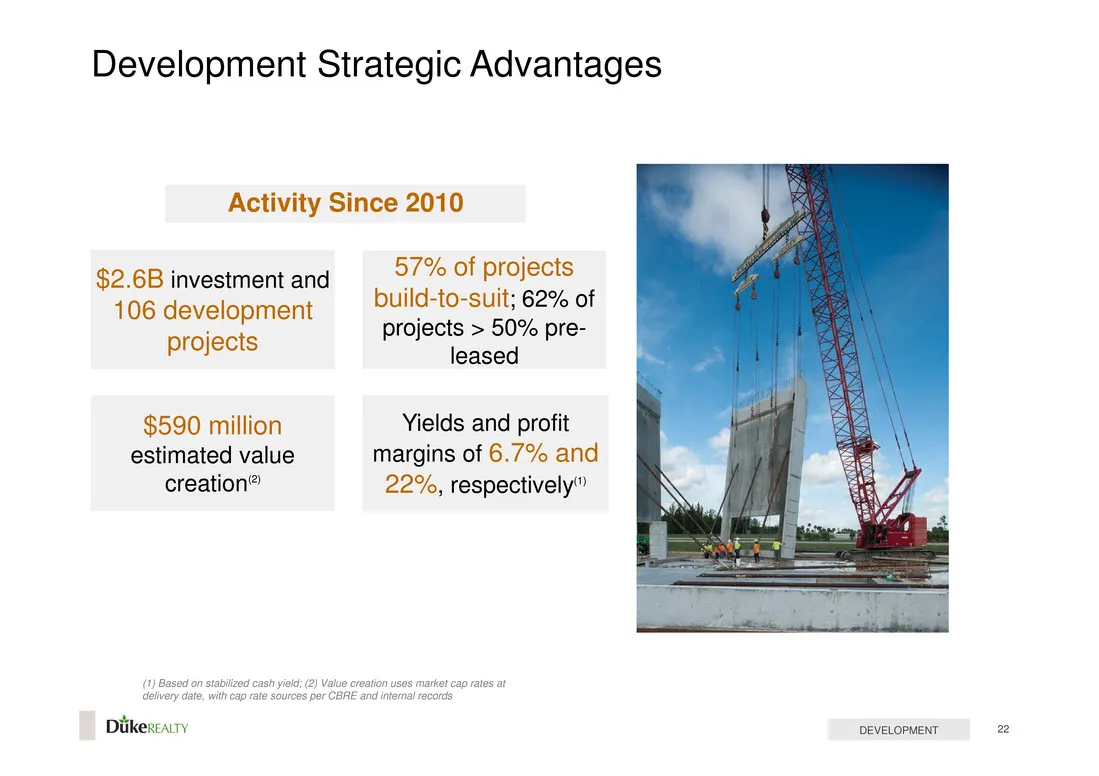
Development Strategic Advantages Activity Since 2010 57% of projects 2.6B investment and G2 CE rvcsimemand le icito sities ot 106 development A projects > 50% pre- [pReEeIS leased $590 million Yields and profit estimated value margins of 6.7% and creation® 22%, respectively” delivery date, with cap
Slide 23: 2017 Development Starts
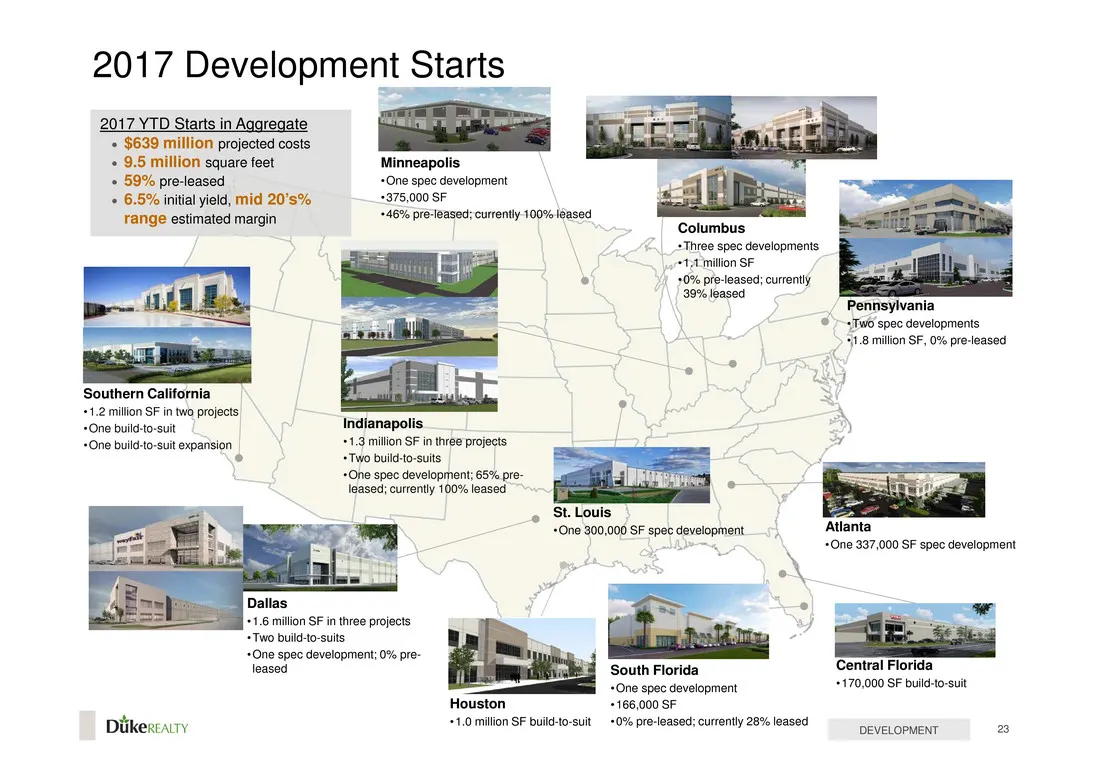
2017 Developmen Starts 2017 YTD + $639 million see costs + 9.5 million square feet Minneapolis + 59% pre-leased +One spec development + 6.5% initial yield, mid 20’s% +375,000 SF 100% leased Southern California 1.2 million SF in two projects +One build ‘suit ‘suit expansion © Dallas 1.6 milion SF in
Slide 24: Speculative Development: Proven execution
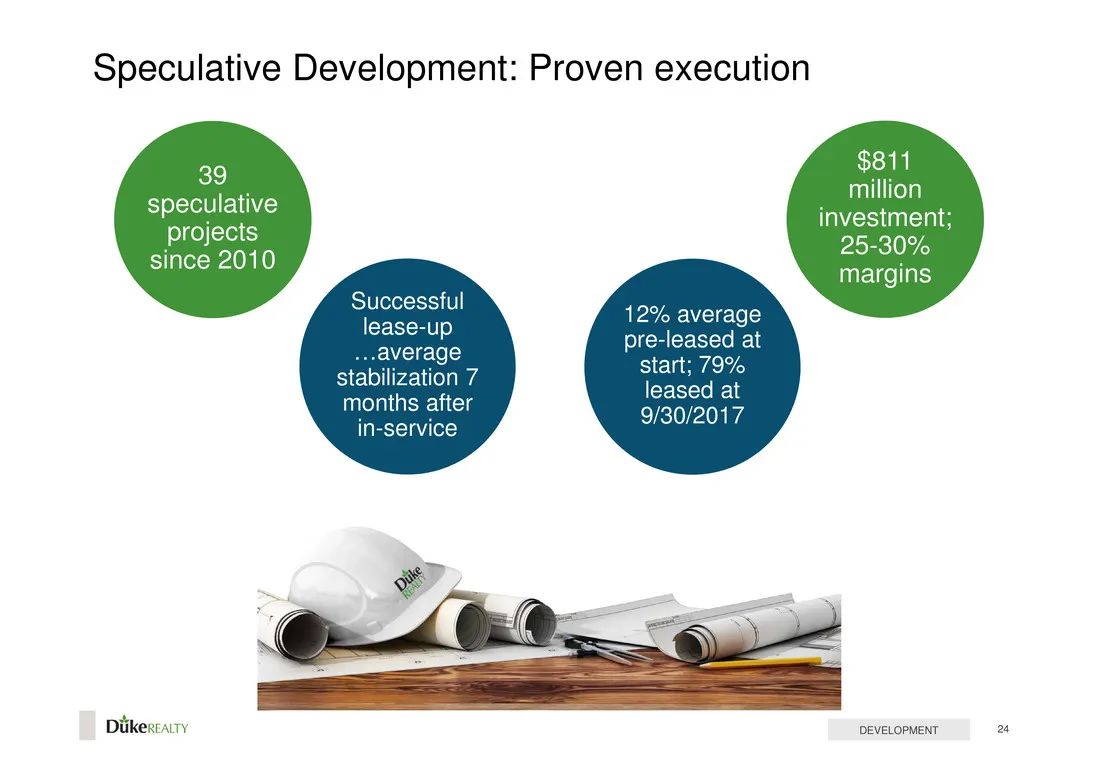
Speculative Development: Proven execution $811 million investment; 25-30% margins 39 speculative projects since 2010 Successful lease-up . average stabilization 7 months after in-service 12% average pre-leased at start; 79% leased at 9/30/2017 Diikexeairy DEVELOPMENT
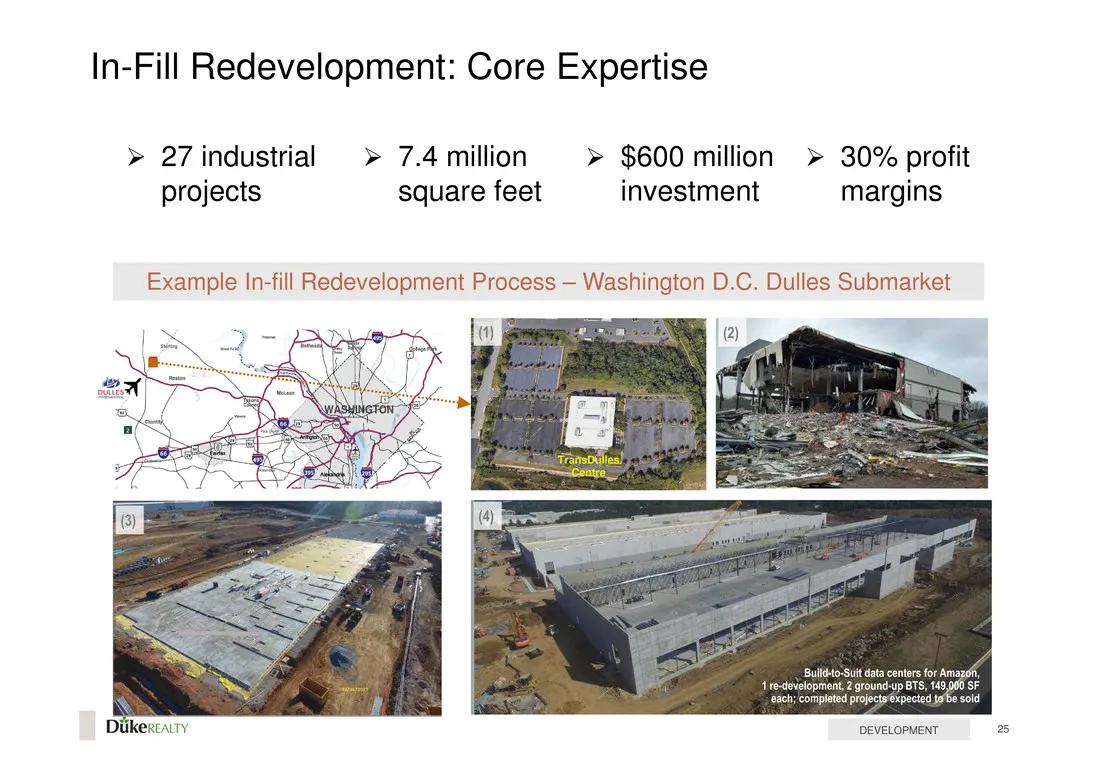
Slide 25: In-Fill Redevelopment: Core Expertise
In-Fill Redevelopment: Core Expertise > 27 industrial > 7.4 million > $600 million > 30% profit projects square feet investment margins Example In-fill Redevelopment Process — Washington D.C. Dulles Submarket Builé-o-Suit data centers for Amazoh, Fecesetin 2 round BTS, 9g Sr ompleted projects@xpecte
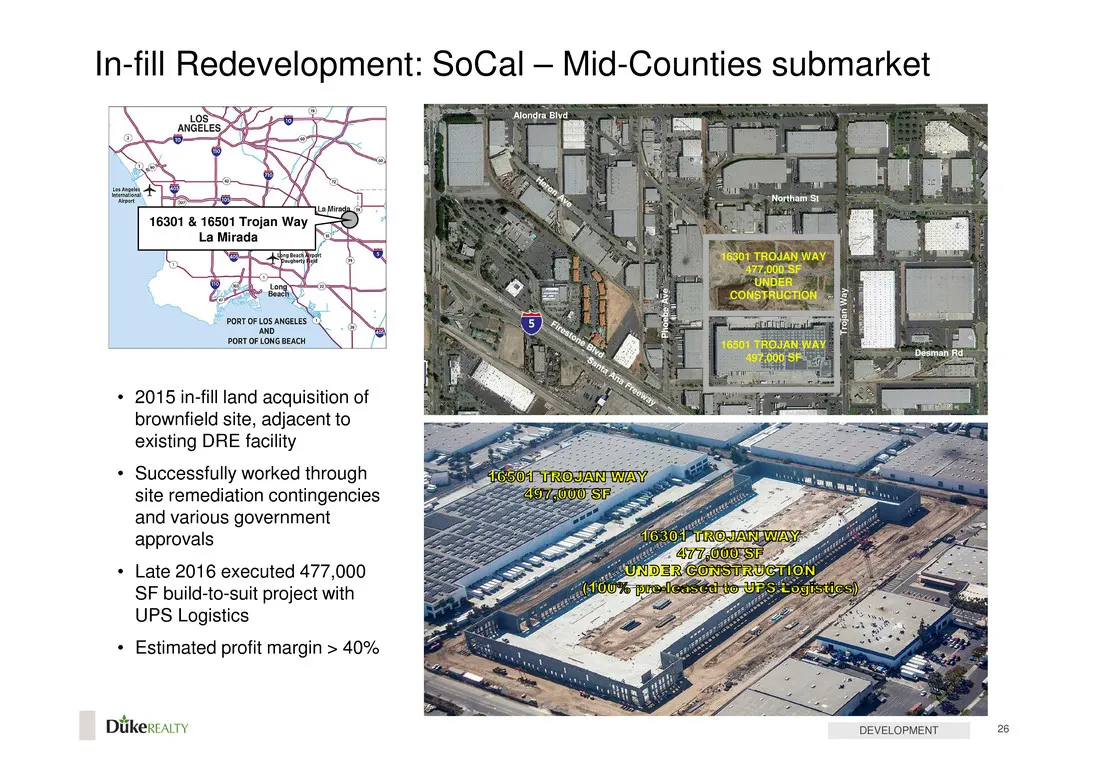
Slide 26: In-fill Redevelopment: SoCal — Mid-Counties submarket
In-fill Redevelopment: SoCal — Mid-Counties submarket * 2015 in-fill land acquisition of brownfield site, adjacent to existing DRE facility + Successfully worked through site remediation contingencies and various government provals + Late 2016 executed 477,000 SF build-to- hal project with UPS Logis
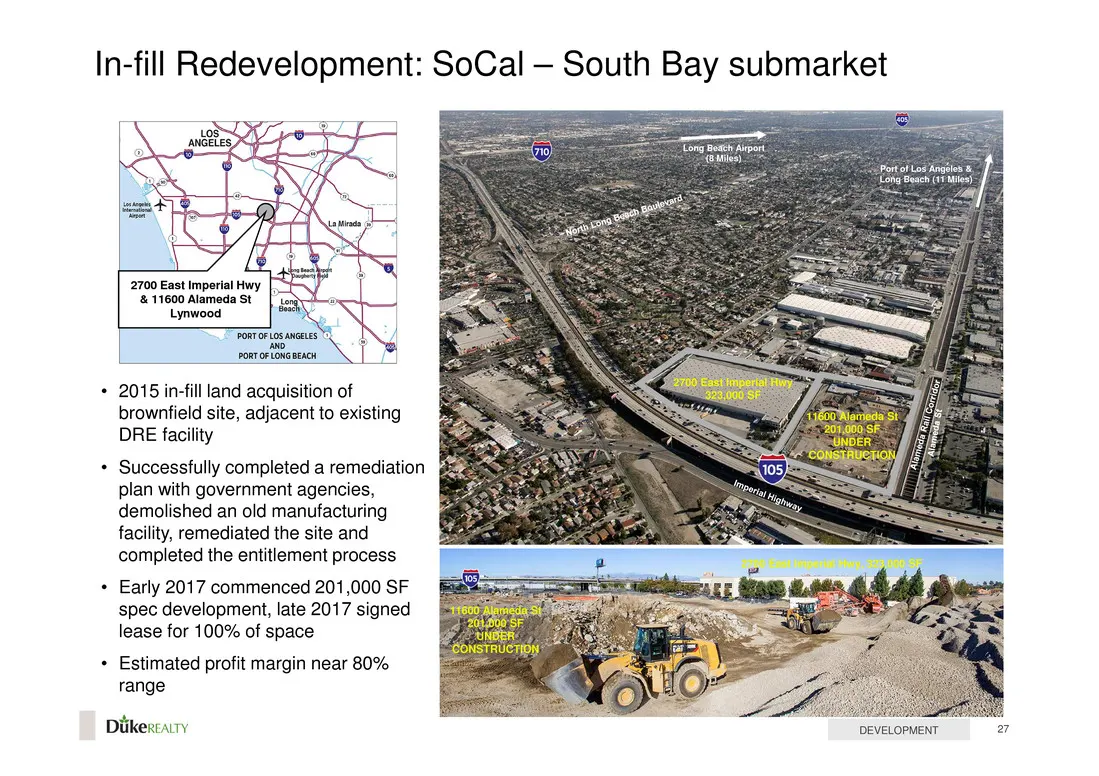
Slide 27: In-fill Redevelopment: SoCal — South Bay submarket
In-fill Redevelopment: SoCal — South Bay submarket S ———— Tong both Apart eales) * 2015 in-fill land acquisition of brownfield site, adjacent to existing DRE facility completed a “pan with government agencies, demolished an old manufacturing facility, remediated the site and completed the entitlemen
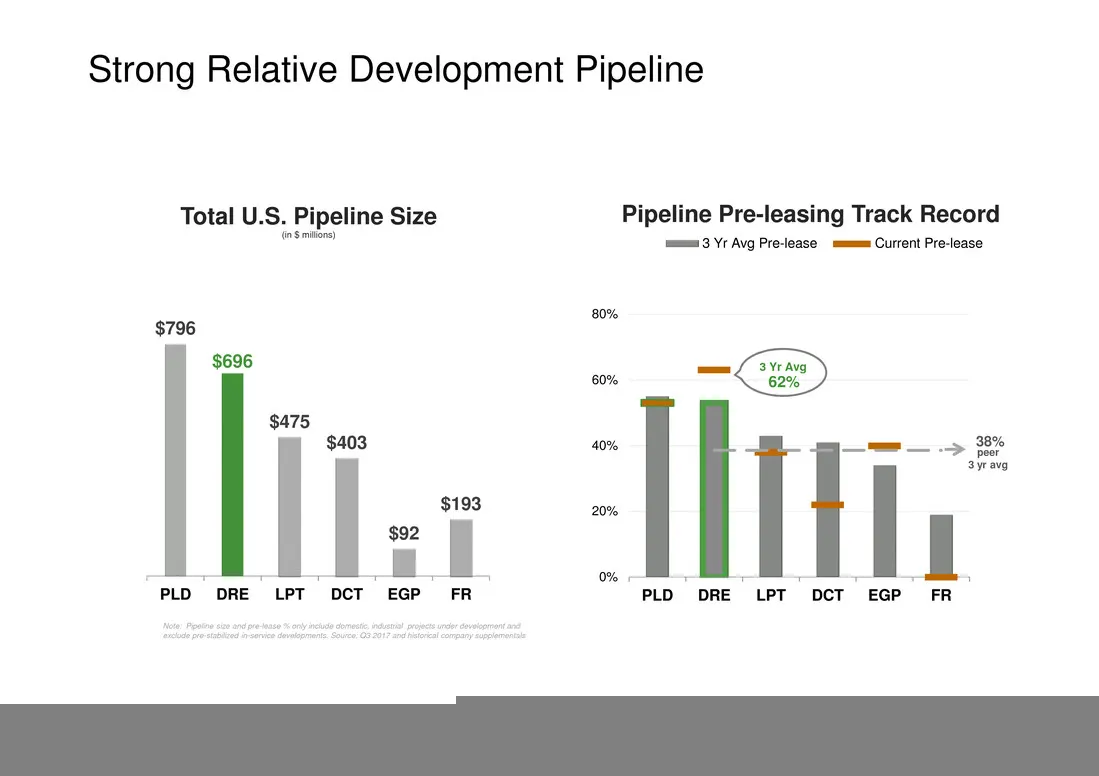
Slide 28: Strong Relative Development Pipeline
Strong Relative Development Pipeline Total U. S. . Pipeline Size Pipeline Pre-leasing Track Record muons) mmm 3 Yr Avg Pre-lease mmm Current Pre-lease 80% $796 $696 60% Cima $475 $403 40% a — .-> 38% ayravg $193 _ 7 | * 7 0% 7 : PLD DRE Ler per | 7 FR PLD DRE LPT DCT EGP FR
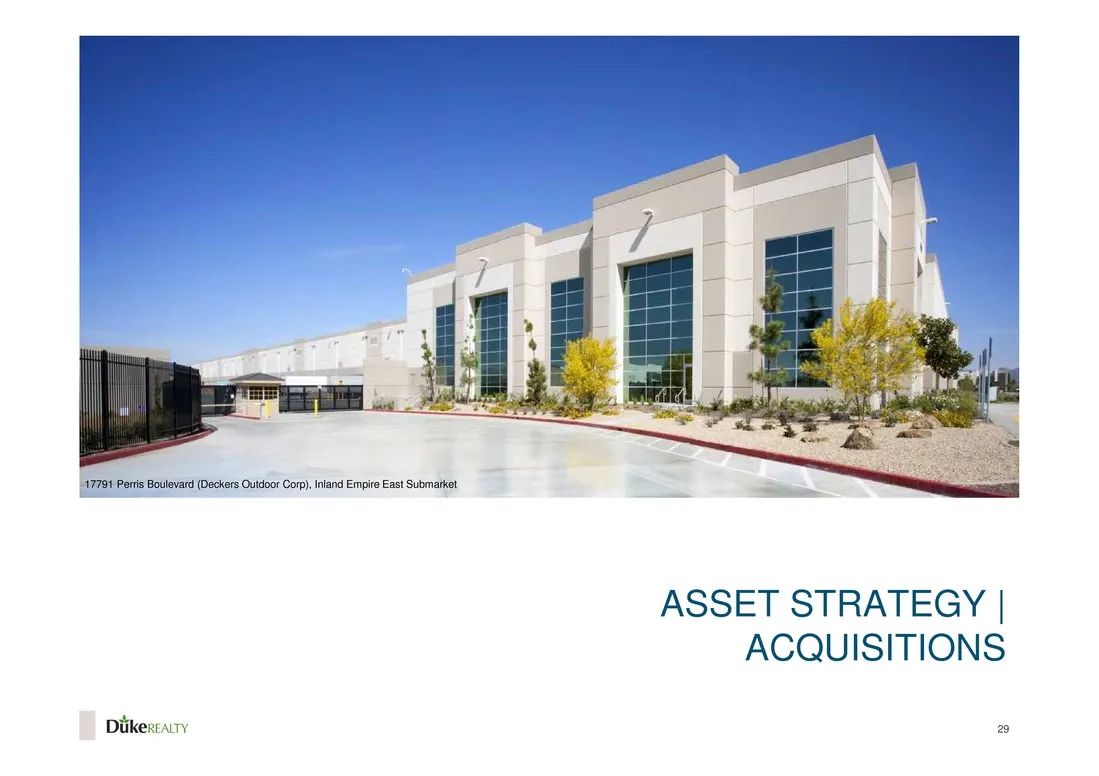
Slide 29: Asset Strategy | Acquisitions
ASSET STRATEGY | ACQUISITIONS Diikexeairy 20
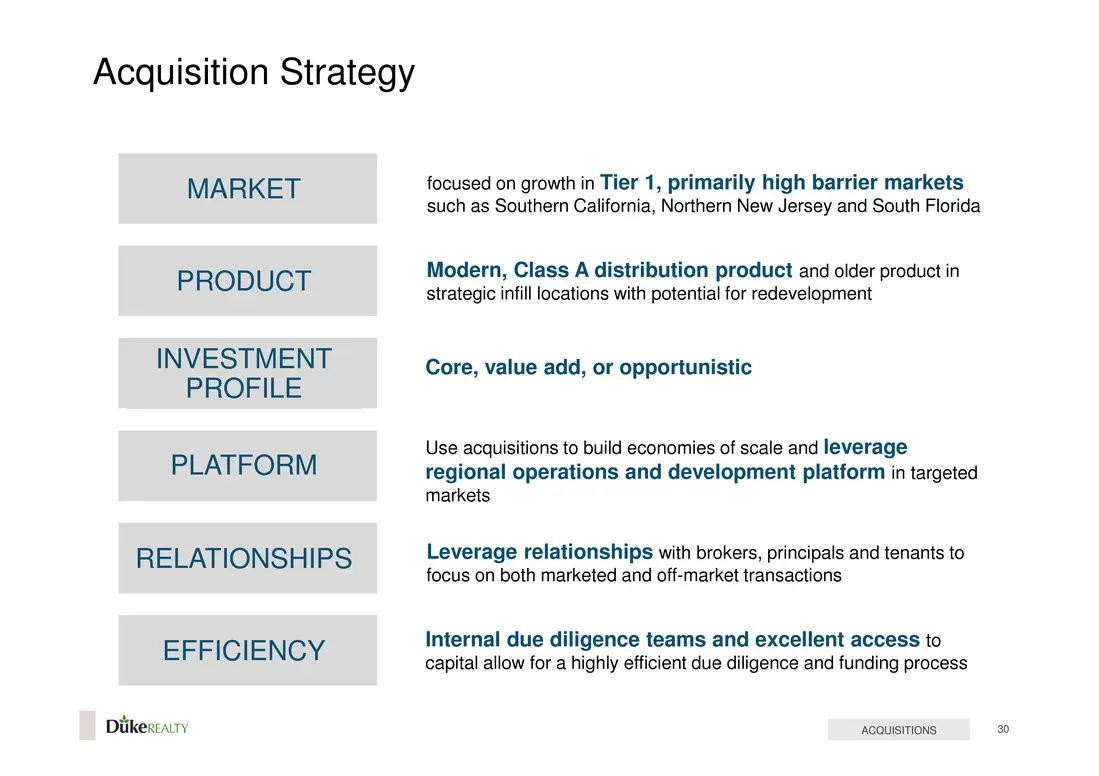
Slide 30: Acquisition Strategy
Acquisition Strategy MARKET focused on growth in Tier 1, primarily high barrier markets such as Southern California, Northern New Jersey and South Florida Modern, Class A distribution product and older product in PRODUCT strategic infill locations with potential for redevelopment INVESTMENT Core, va
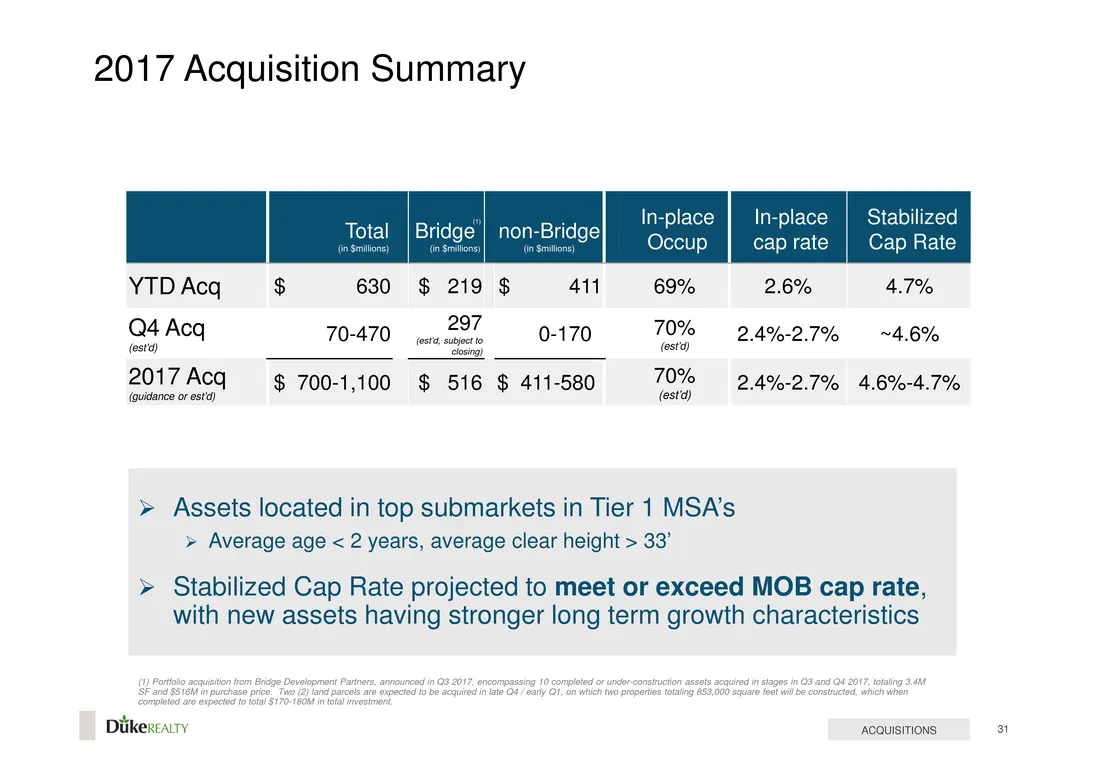
Slide 31: 2017 Acquisition Summary
2017 Acquisition Summary In-place In-place Stabilized Occup cap rate Cap Rate YTDAcq $ 630 $ 219$ 411 69% 2.6% 4.7% Q4 Acq 70-470 eee, 0-170 70%) B.A %-2.7% — ~8.6% (eta aj ata 2017 Acq —$ 700-1,100 $ 516 $ 411-580 (oe O% — 2.4%-2.7% 4.6%-4.7% > Assets located in top submarkets in Tier 1 MSA's > Ave
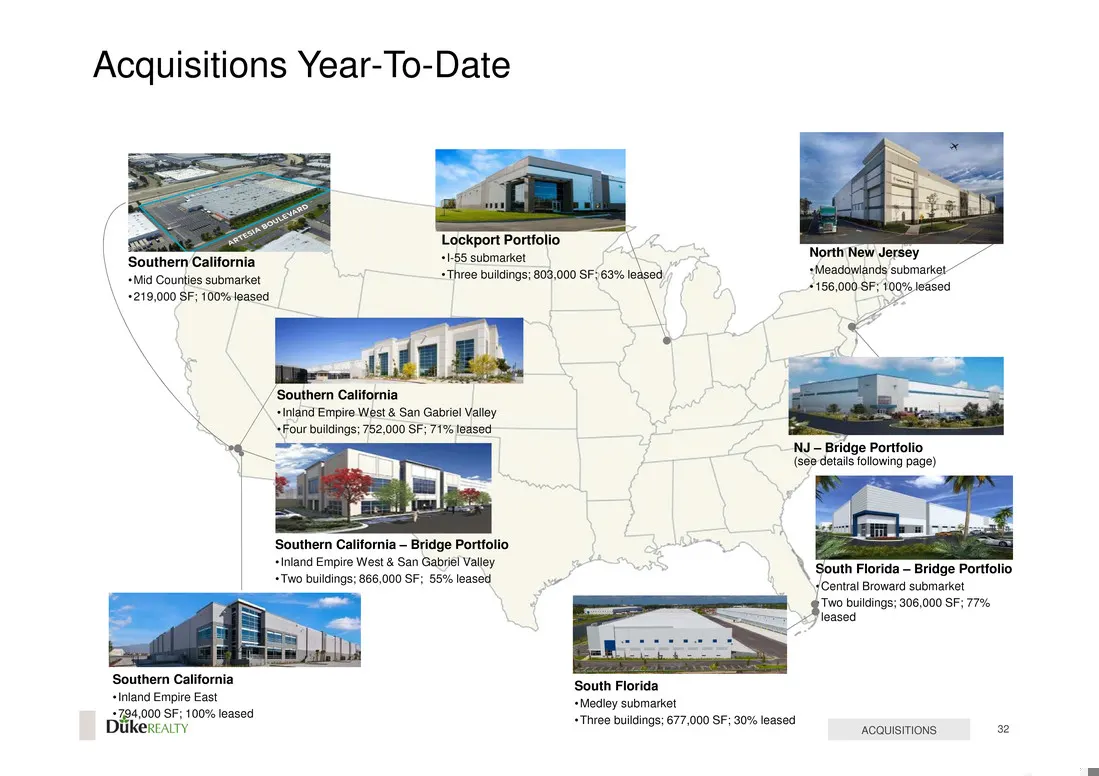
Slide 32: Acquisitions Year-To-Date
Acquisitions Year-To-Date ifornia hNew Jersey Mid Counties submarket “Thee marie £803,000 SF:63% leased fea serait “219,000 SF 100% teased oe ‘Southern California “Inland Empire West & San Gabriel Valley ‘Four buildings; 752,000 SF; 71% leased NJ ~ Bridge Portfolio (see details following page) uther
Slide 33: Acquisitions — Bridge New Jersey
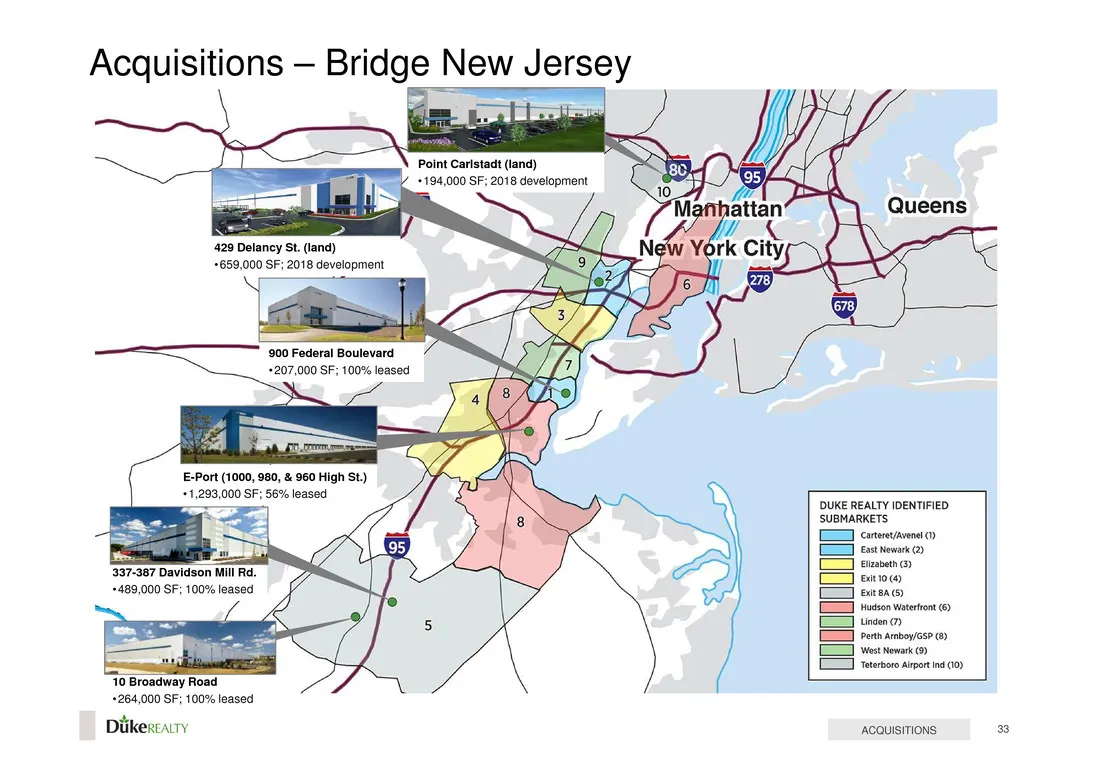
Acquisitions — Bridge New Jersey i) Point Carlstadt (land) + 194,000 SF; 2018 development a 429 Delancy St. (land) +659,000 SF; 2018 development ‘900 Federal Boulevard +207,000 SF; 100% leased E-Port (1000, 980, & 960 High St.) +1,293,000 SF; 56% leased —e DUKE REALTY IDENTIFIED SUBMARKETS -387 Davi
Slide 34: 2017 Capital Redeployment Summary
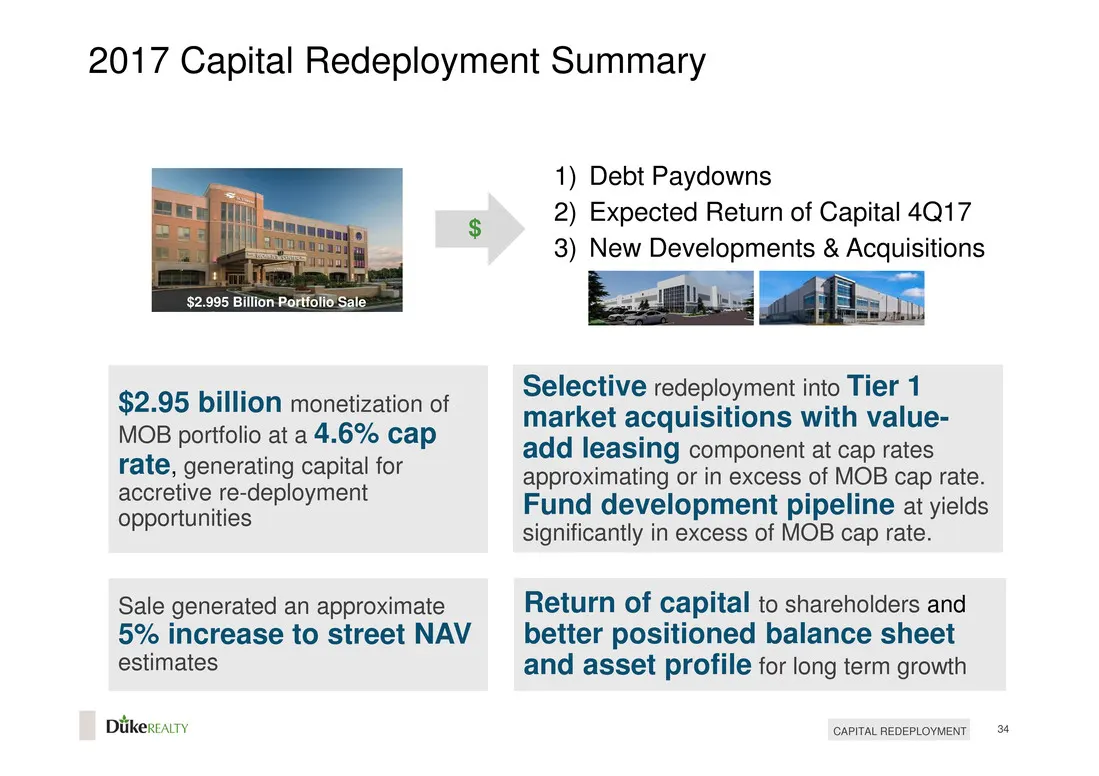
2017 Capital Redeployment Summary $2.95 Billion Portfolio’ Sale $2.95 billion monetization of MOB portfolio at a 4.6% cap rate, generating capital for accretive re-deployment opportunities Sale generated an approximate 5% increase to street NAV estimates Diikexeairy 1) Debt Paydowns 2) Expected Retu
Slide 35: Operating Strategy
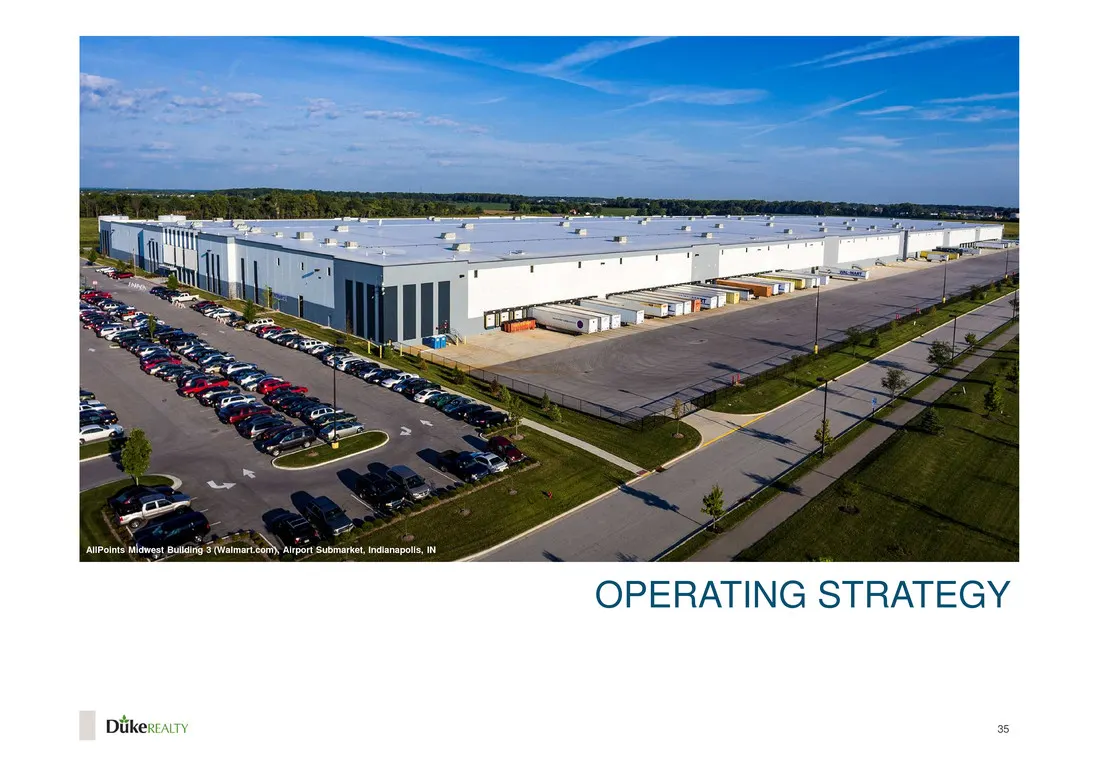
OPERATING STRATEGY re Dukeréaity 35
Slide 36: Exceptional Leasing Performance | Record Occupancy
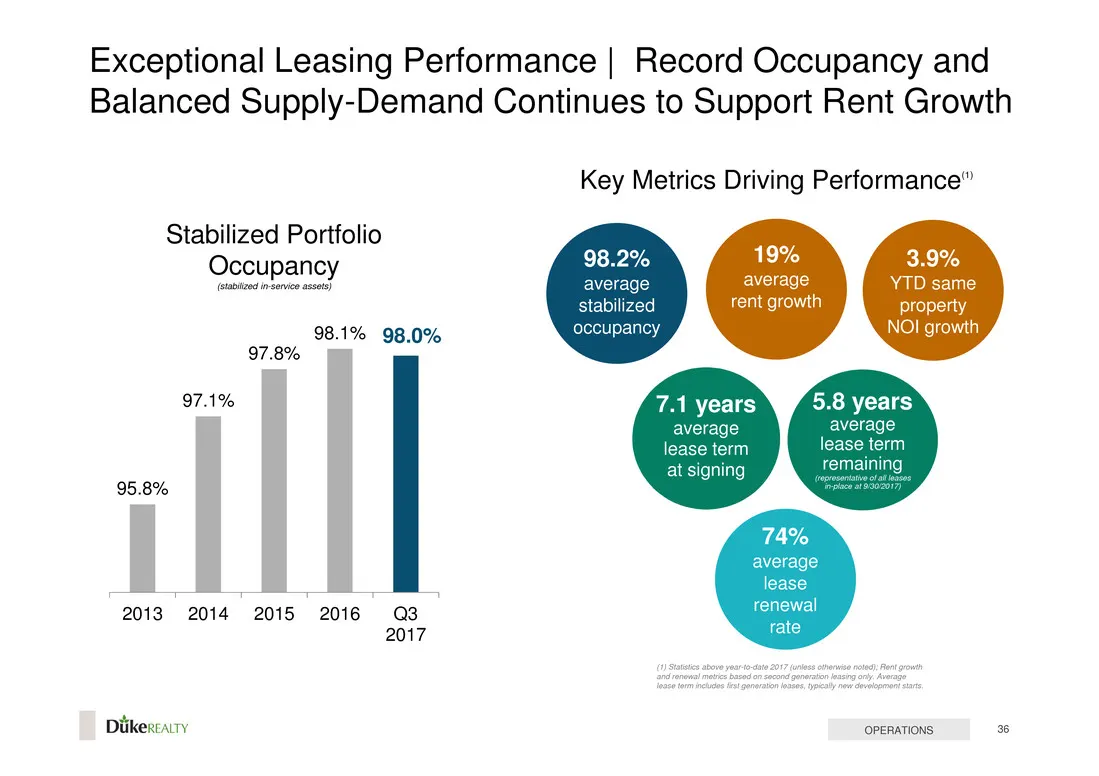
Exceptional Leasing Performance | Record Occupancy and Balanced Supply-Demand Continues to Support Rent Growth Stabilized Portfolio Occupancy in-soice asses) 98.1% 98.0% 97.8% 2013 2014 2015 2016 Q3 2017 Diikexeairy Key Metrics Driving Performance” 98.2% 19% 3.9% average average YTD same stabilized
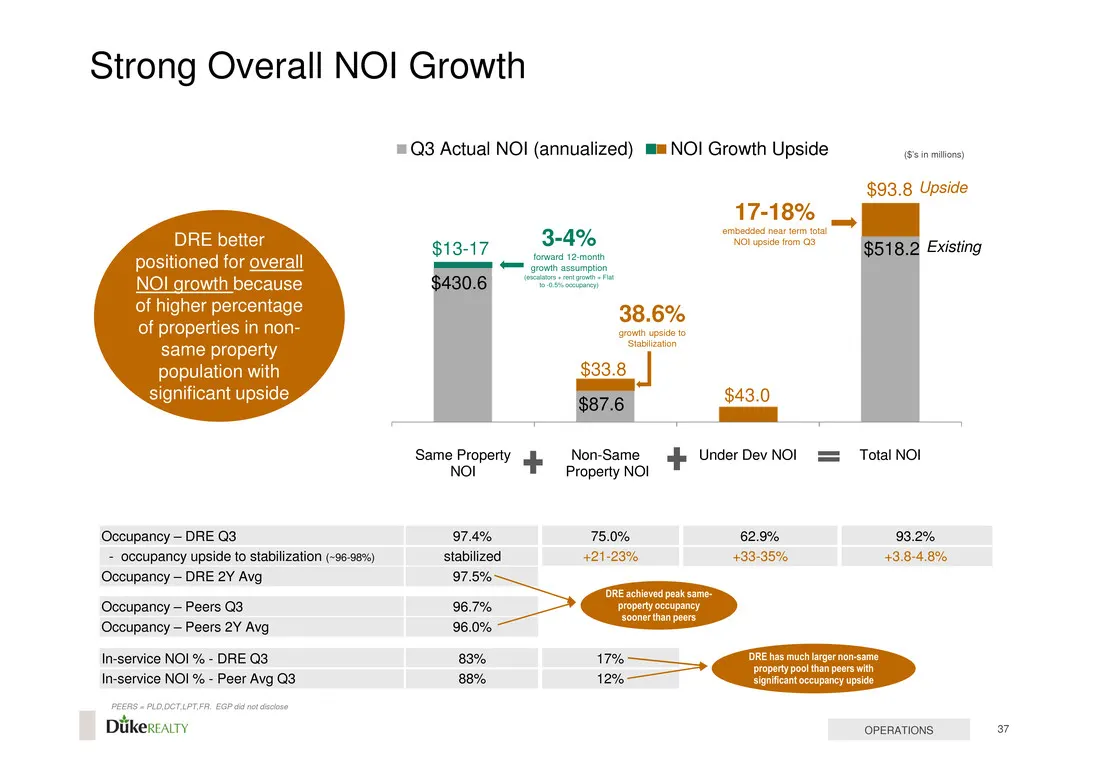
Slide 37: Strong Overall NOI Growth
Strong Overall NOI Growth DRE beiter positioned for overall NOI growth because of higher percentage of properties in non- significant upside Occupancy — DRE Q3 = occupancy upside to stabilization (-26-06%) Occupancy ~ DRE 2Y Avg Occupancy — Peers 3 Occupancy ~ Peers 2Y Avg In-service NOI % - DRE Q3
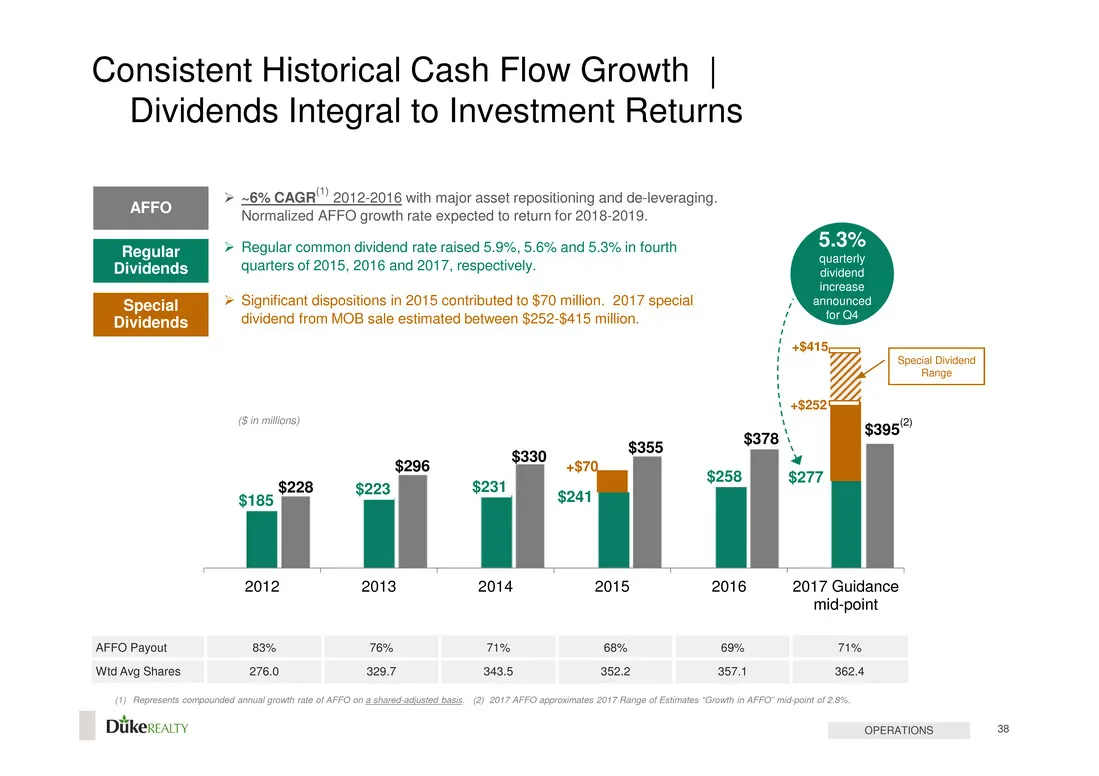
Slide 38: Consistent Historical Cash Flow Growth | Dividends Integral to Investment Returns
Consistent Historical Cash Flow Growth | Dividends Integral to Investment Returns gular > Regular 5.6% and 5.3% in fourth Dividends quarters of 2015, 2016 and 2017, respectively > ~6% CAGR" 2012-2016 with major asset repositioning and de-leveraging. Normalized AFFO growth rate expected to return for
Slide 39: Capital Strategy
Diikexeairy
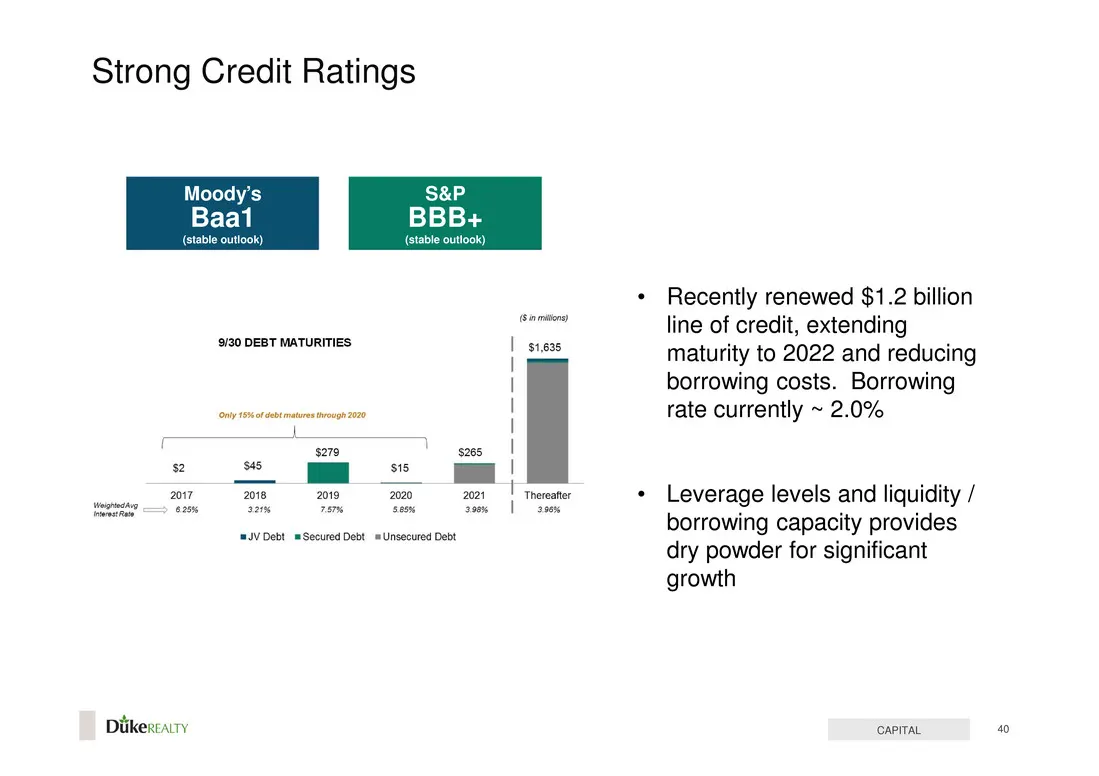
Slide 40: Strong Credit Ratings
Strong Credit Ratings Moody’s S&P Baa1 BBB+ (stable outlook) (stable outlook) 9130 DEBT MATURITIES ny to et mate og 200 \ t $279 $265 2 34s S15 17 2018 2019 2020 2021 a. 625% 321% 7 505% a "JV Debt mSecured Debt = Unsecured Debt Diikexeairy armors) $1,635 Thereater Recently renewed $1.2 billion line
Slide 41: Conservative Capital Structure with Refinancing Upside
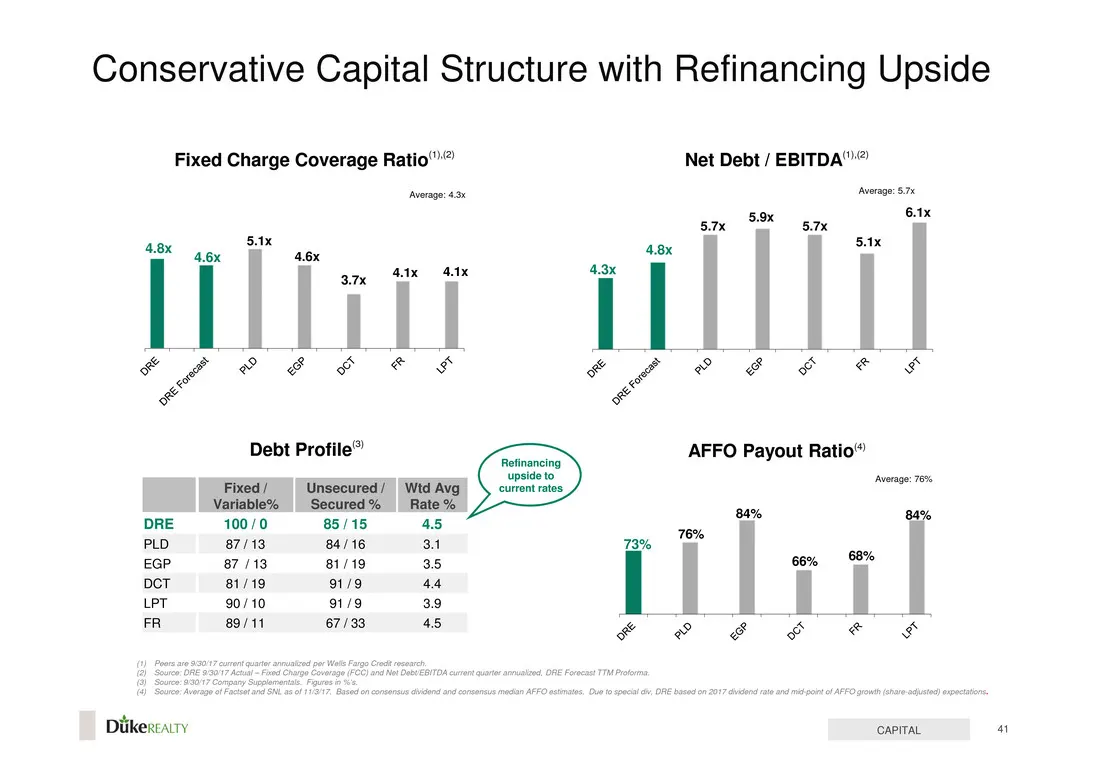
Conservative Capital Structure with Refinancing Upside Fixed Charge Coverage Ratio" Net Debt / EBITDA”? Average: 57 ‘Average: 43 AFFO Payout Ratio” Average: 7% DRE a 80% 84% PLD 73% EGP 66% 68% pot LPT FR = a_i __i, & & € F F€ $F CAPITAL Diikexeairy
Slide 42: Why Duke Realty?
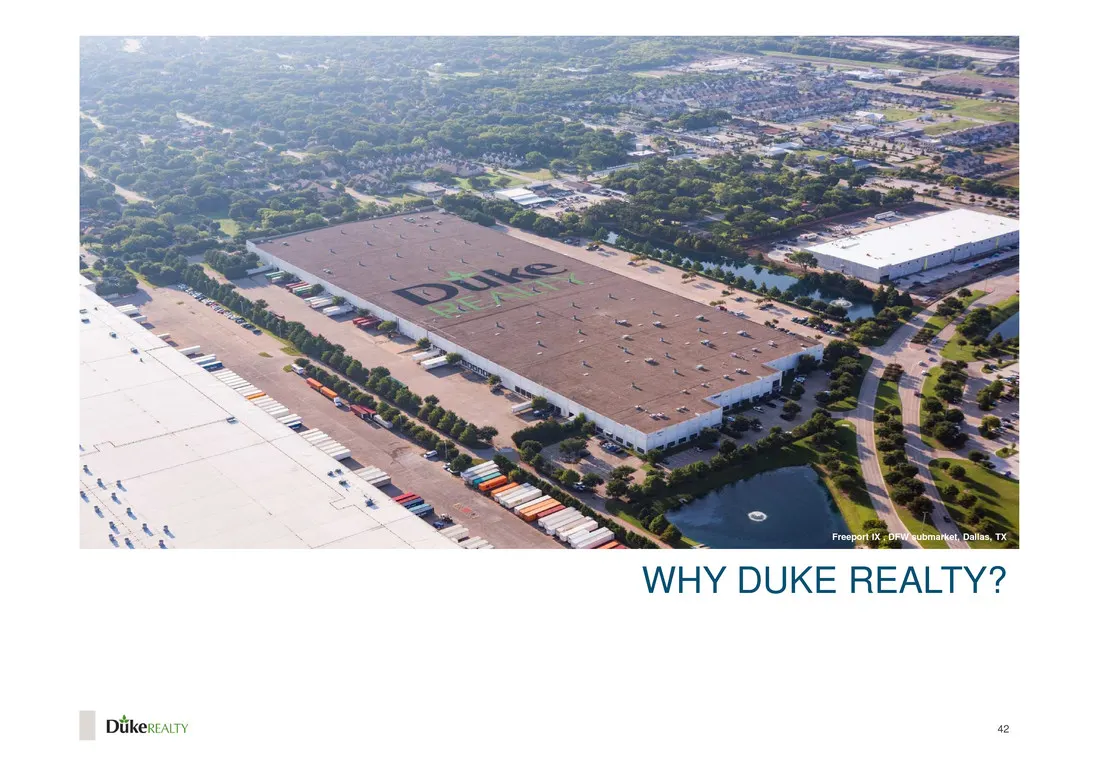
WHY DUKE REALTY? Diikexeairy 2
Slide 43: Why Duke Realty?
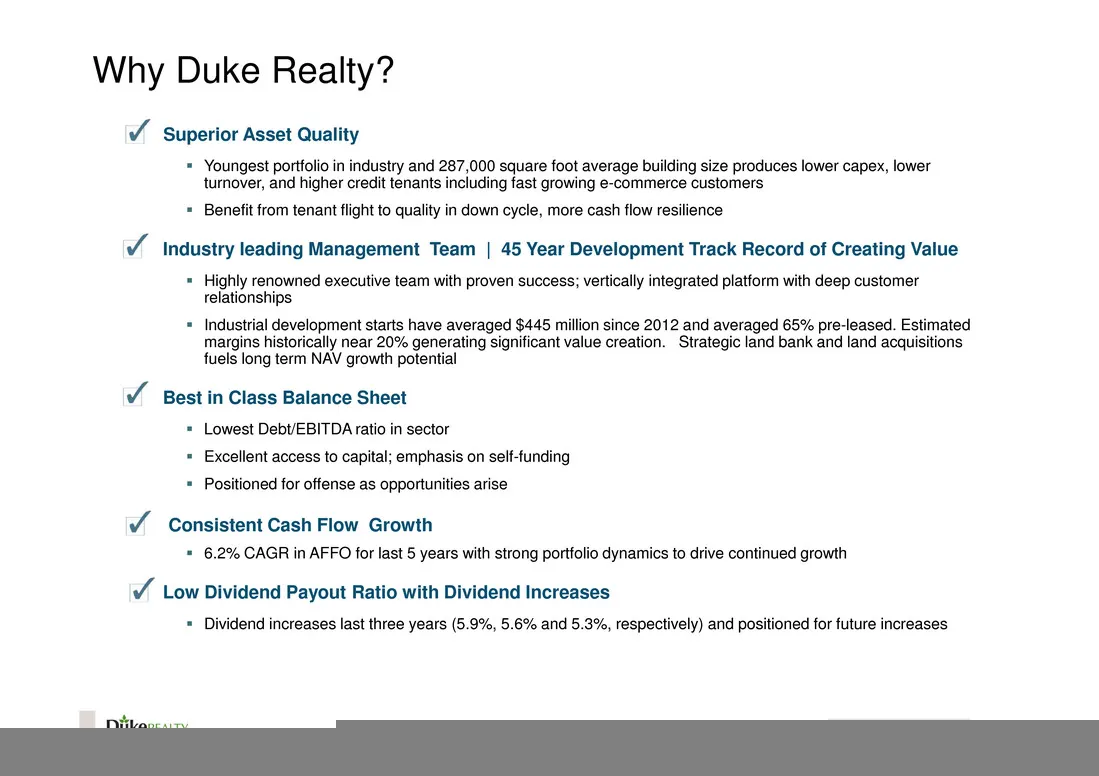
Why Duke Realty? ov Superior Asset Quality * Youngest porto in industry and 287,000 square foot average building size produces lower caper, lower turnover, and higher * Benefit from tenant flight to quality in down cycle, more cash flow resilience ov Industry leading Management Team | 45 Year Develo
Slide 44: Sustainability at Duke Realty
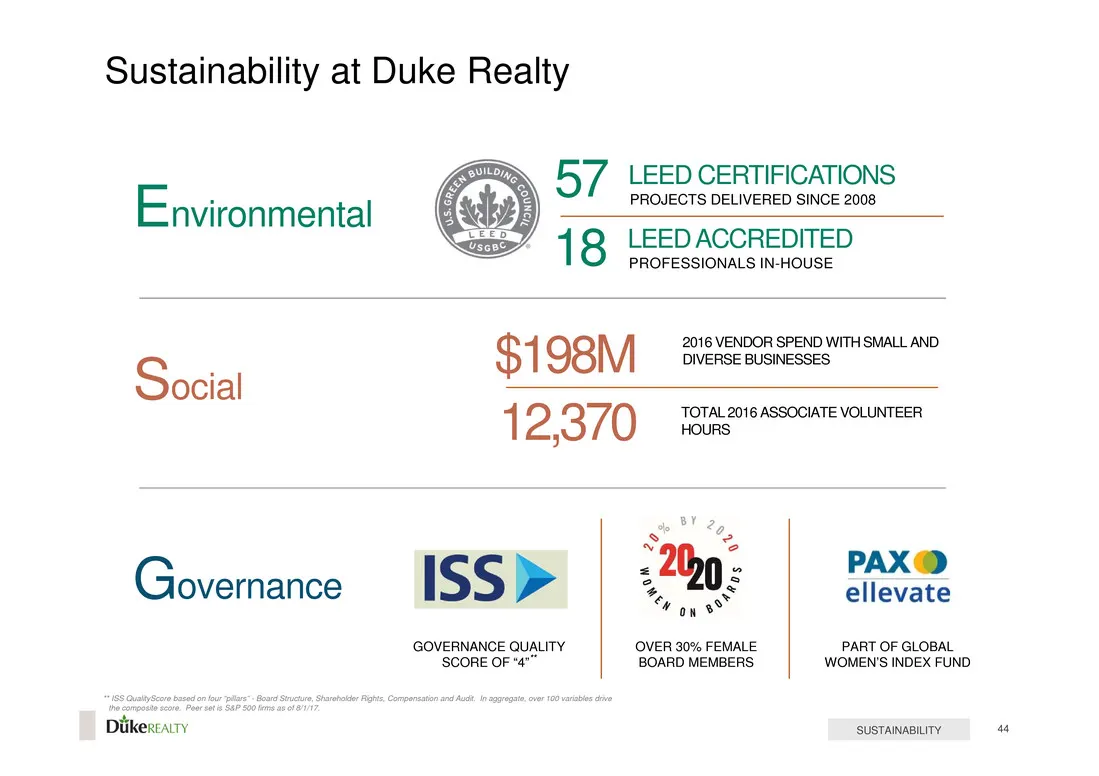
Sustainability at Duke Realty LEED CERTIFICATIONS PROJECTS DELIVERED SINCE 2008 Environmental LEED ACCREDITED PROFESSIONALS IN-HOUSE 2016 VENDOR SPEND WITH SMALL AND: DIVERSE BUSINESSES S ocial TOTAL 2016 ASSOCIATE VOLUNTEER 3 HOURS Governance ISS > =P: ae yah ellevate on® GOVERNANCE QUALITY OVER 30
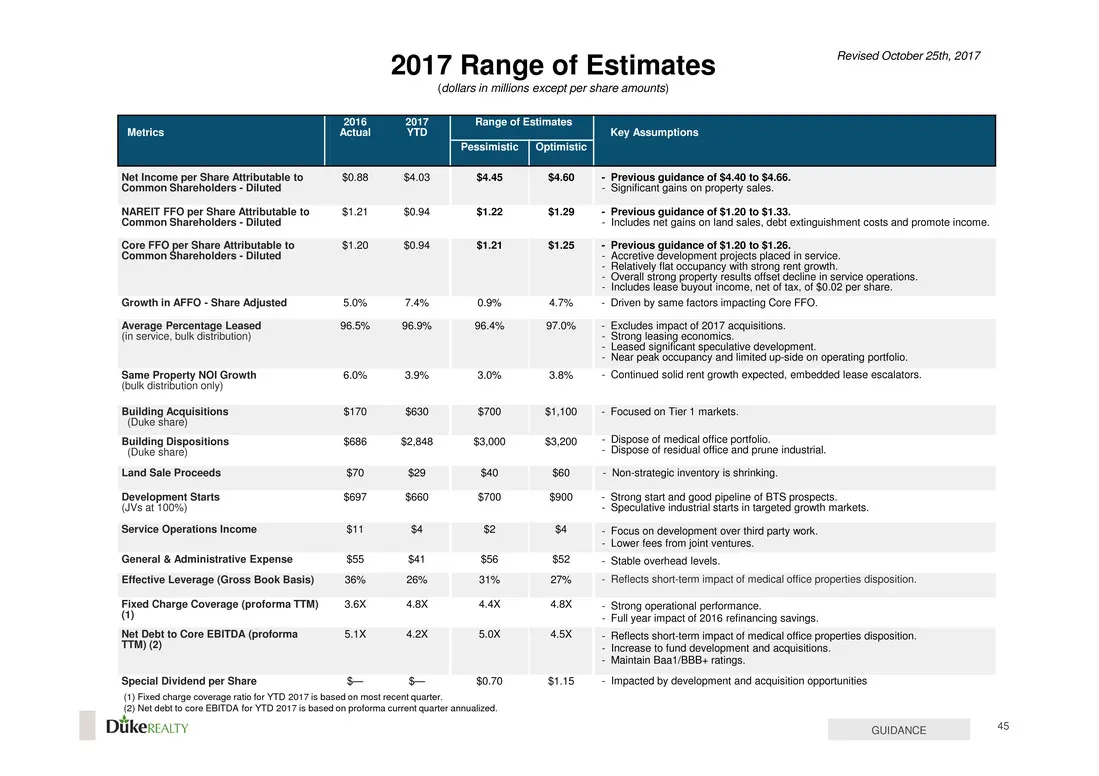
Slide 45: 2017 Range of Estimates
[Net income per Share Attributable to (Common Shareholders - Diluted INAREIT FEO per Share tbutable to Nn Shareholders - Diluted, Gore FFO por Share Atibtabe to Com holders - Diluted Growth in AFFO - Share Adjusted ‘Average Percentage Leased {inSorvee, bak detnbutony me Property NOI Growth imacisbot
Slide 46: CoStar Disclaimer
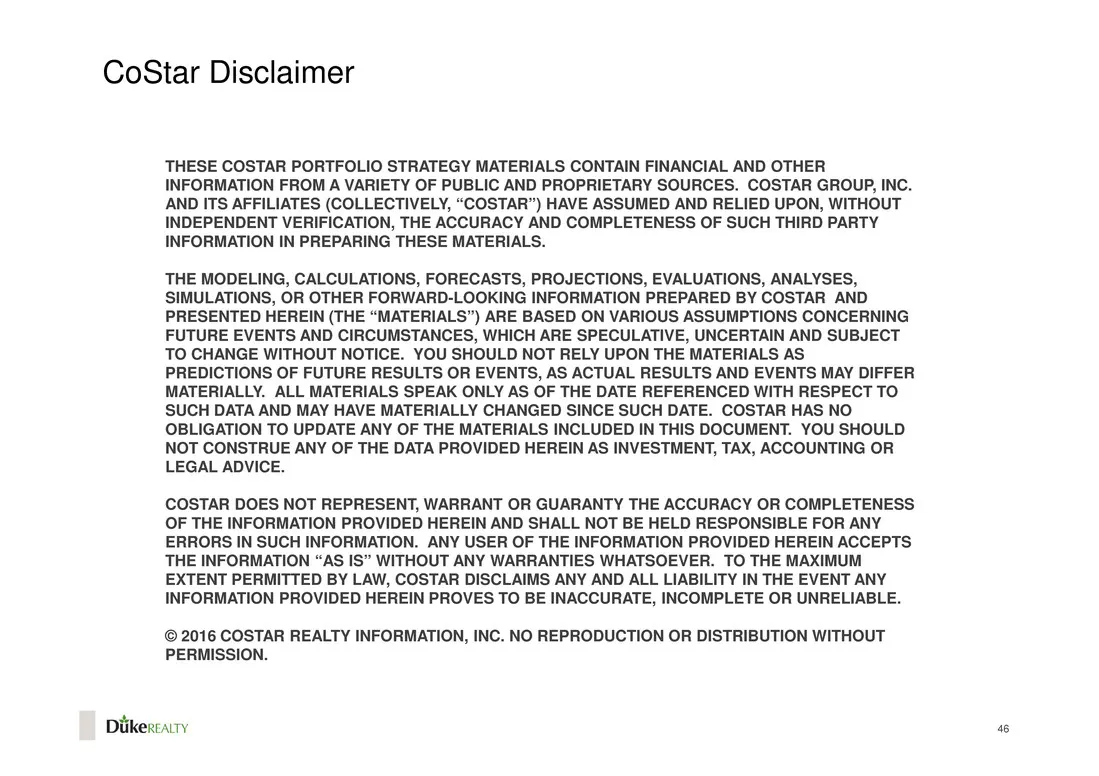
CoStar Disclaimer THESE COSTAR PORTFOLIO STRATEGY MATERIALS CONTAIN FINANCIAL AND OTHER INFORMATION FROM A VARIETY OF PUBLIC AND PROPRIETARY SOURCES. COSTAR GROUP, INC. AND ITS AFFILIATES (COLLECTIVELY, “COSTAR”) HAVE ASSUMED AND RELIED UPON, WITHOUT INDEPENDENT VERIFICATION, THE ACCURACY AND COMPLE
Slide 47: Definitions
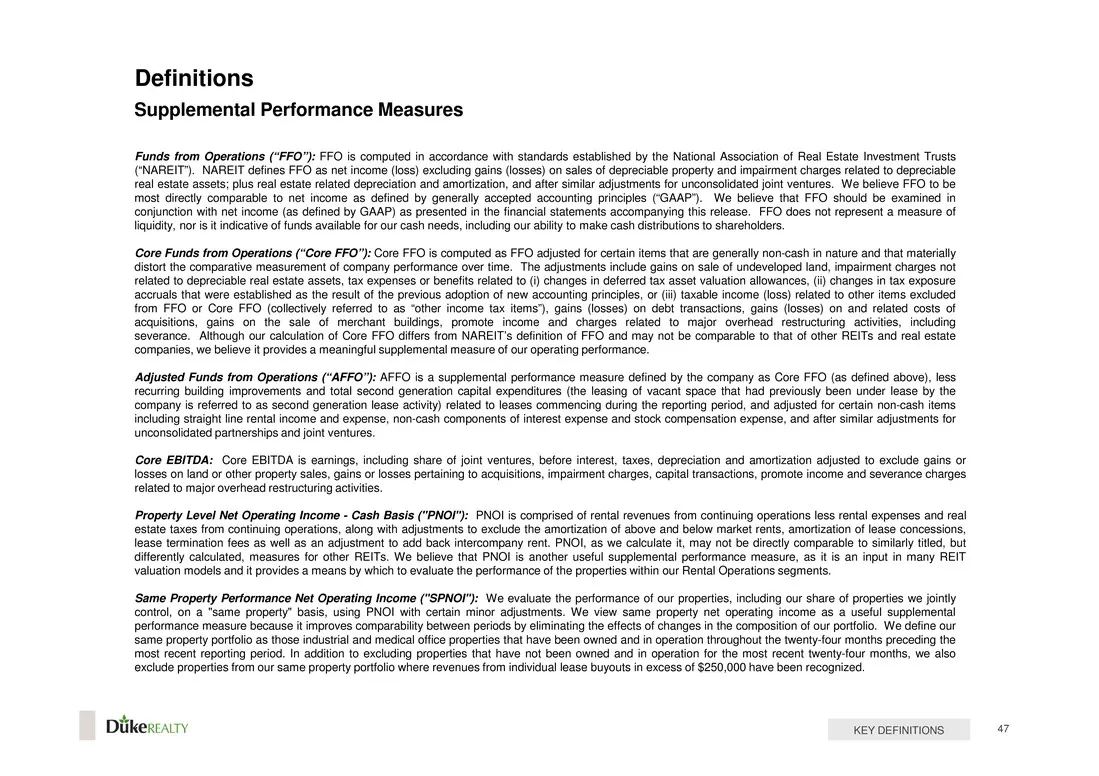
Definitions Supplemental Performance Measures the National tion of Real Estate Investment Trusts Funds from Operations (“FFO"): FFO is computed in (NAREIT). NAREIT similar iu most dtecty comparable to net income as defined by generally accepted accountng principles GAAP". We believe that FFO should
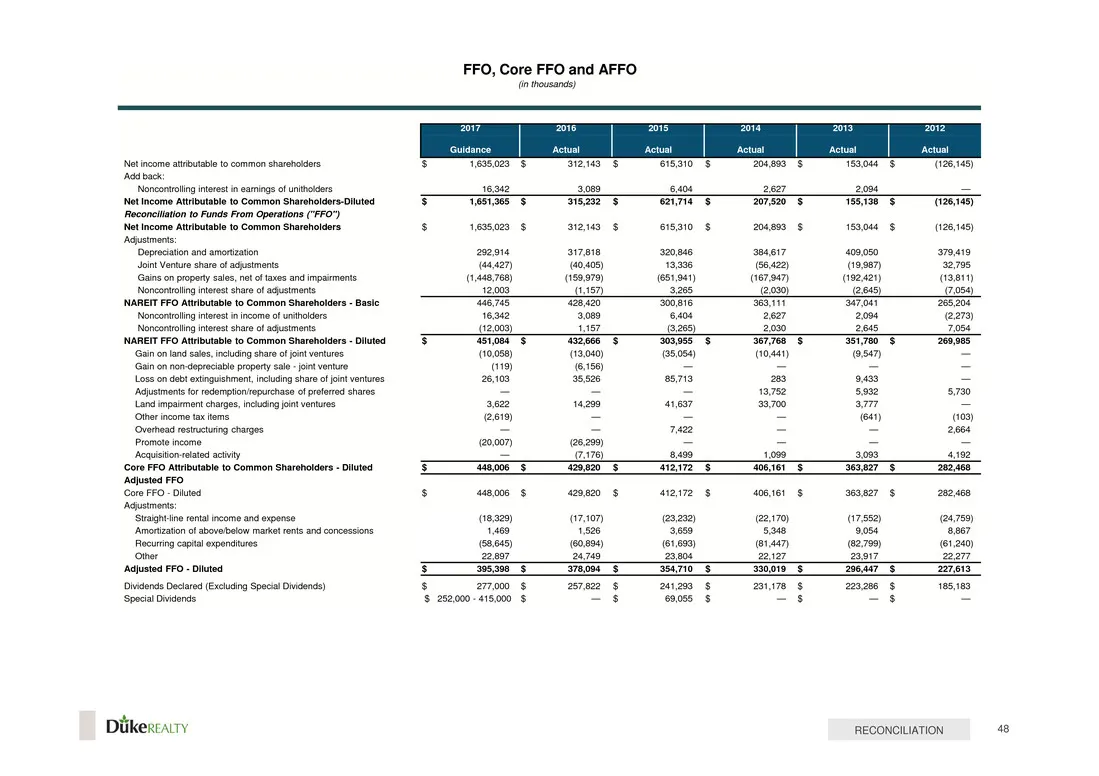
Slide 48: FFO, Core FFO and AFFO
FFO, Core FFO and AFFO (in hovsands) ‘Not income atibuabe to common shareholders essa Noncontling intrest in eamings of unthoiers "Not Income Atributabe fo Common Shareholders-Diuted tons (FFO") From [Net Income Atributable to Common Shareholders Adjustments: Ouston nd anorzaton ‘Adjusted F (core FO
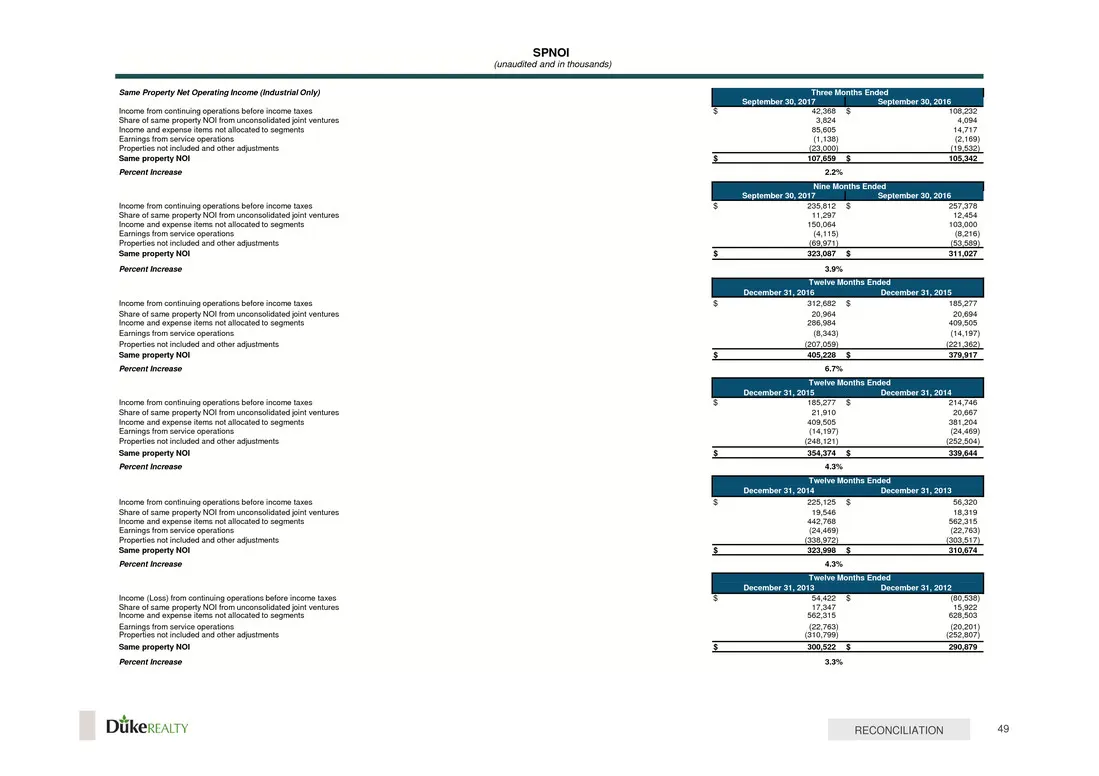
Slide 49: Same Property NOI Reconciliation
‘SPNOL (unausted ard in thowsands) Same Property Net Operating come (nds On) ‘scone fom entnang epraons bale acon aes Sirelsane oe ten entra ‘scone om eartnangepraons bole cone aes Sirol ear pop No ton resin it ete re property NOL ‘neon Loe) Hom contung pmatnsbalre nome tases re Dukertaity RECONCILI
Source: SEC EDGAR · 8-K filed Nov 14, 2017
More decks from Duke Realty Corporation
 Merger or Acquisition (June 2022)14 slides · Jun 13, 2022
 Investor Presentation (June 2021)58 slides · Jun 7, 2021
 Investor Presentation (May 2021)44 slides · May 10, 2021
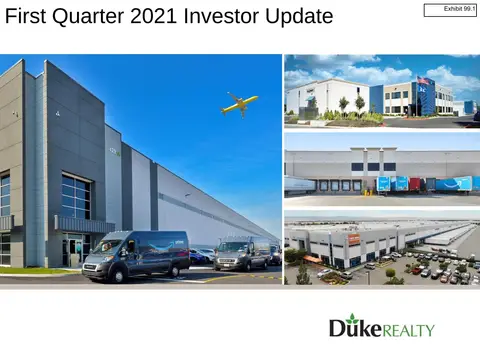 Investor Presentation (February 2021)58 slides · Feb 22, 2021
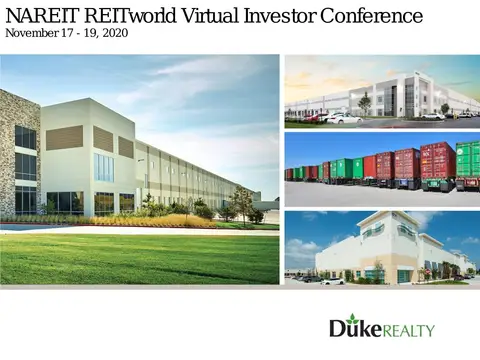 NAREIT REITworld Virtual Investor Conference 202056 slides · Nov 16, 2020
 B of A Securities 2020 Global Real Estate Conference56 slides · Sep 15, 2020