Aryzta AG · SIX:ARYN
Aryzta — FY2013 Earnings Presentation
62 slides from Aryzta's earnings presentation, Sep 30, 2013
Slide 1: FY 2013 Results
ARYZTA AG FY 2013 Results 30 September 2013
Slide 2: Forward Looking Statement
Forward Looking Statement This document contains forward looking statements which reflect management’s current views and estimates. The forward looking statements involve certain risks and uncertainties that could cause actual results to differ materially from those contained in the forward looking
Slide 3: Agenda
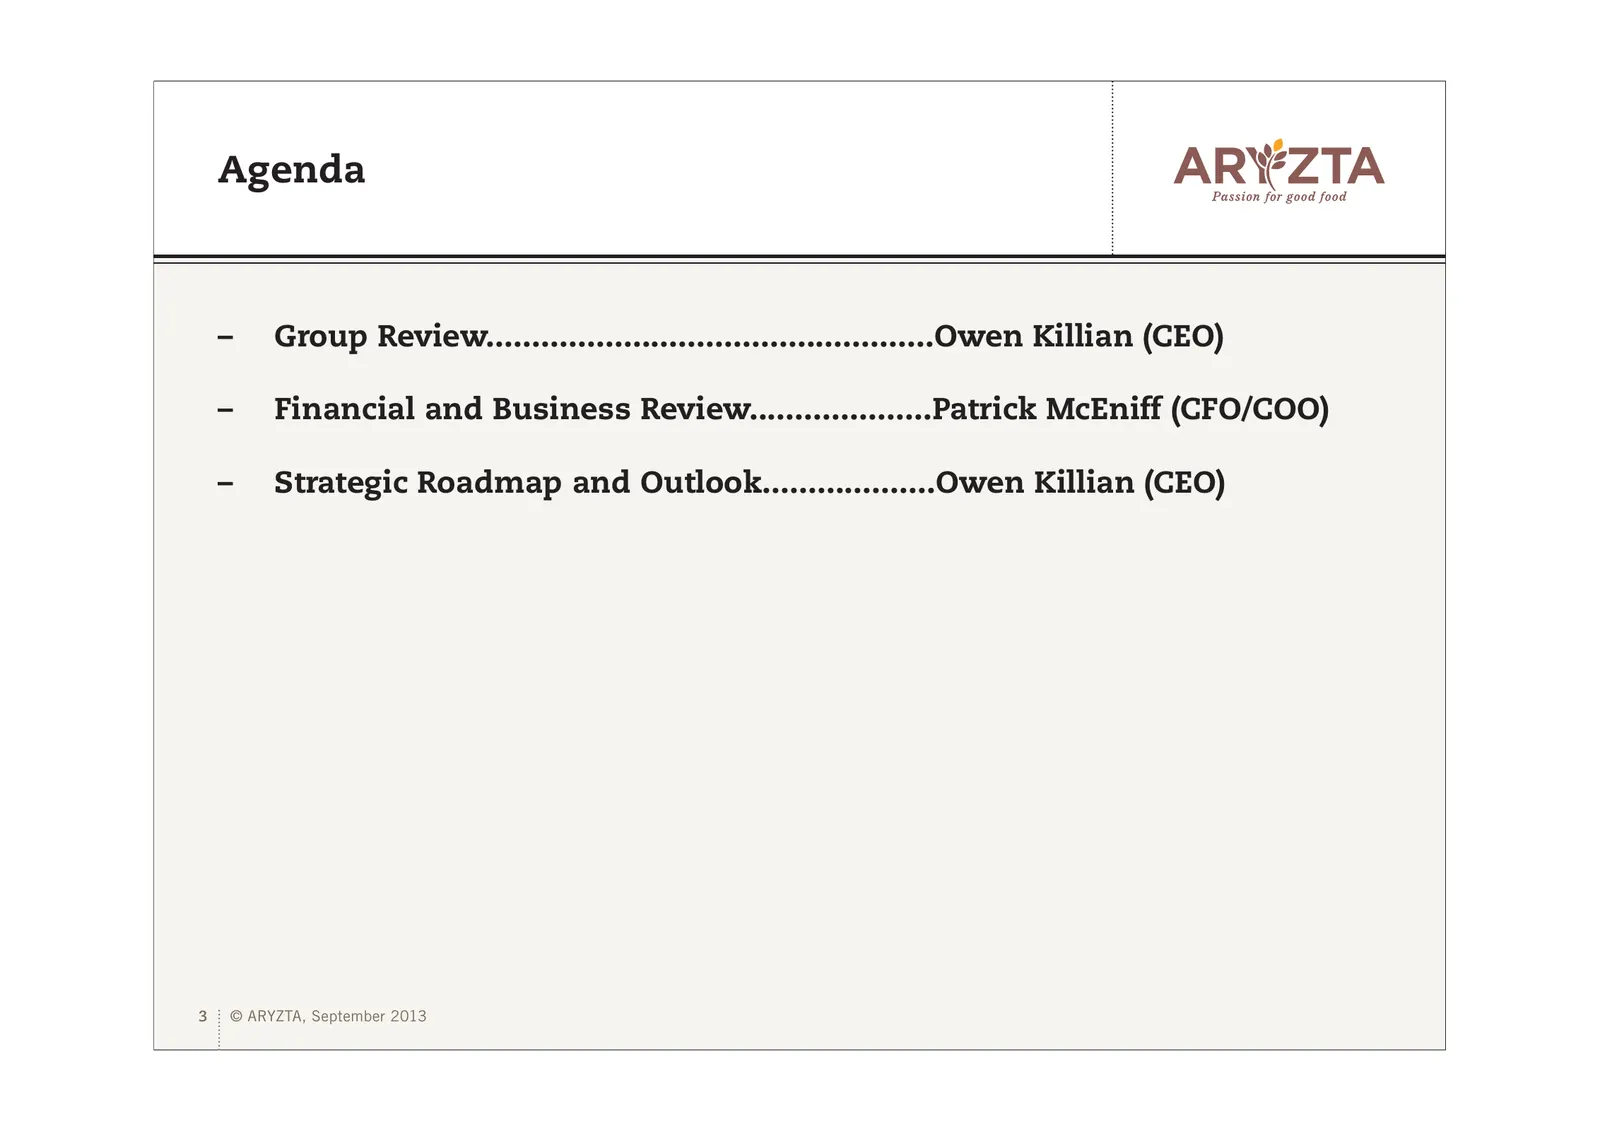
Agenda – Group Review.................................................Owen Killian (CEO) – Financial and Business Review....................Patrick McEniff (CFO/COO) – Strategic Roadmap and Outlook...................Owen Killian (CEO) 3 © ARYZTA, September 2013
Slide 4: ARYZTA Group Today
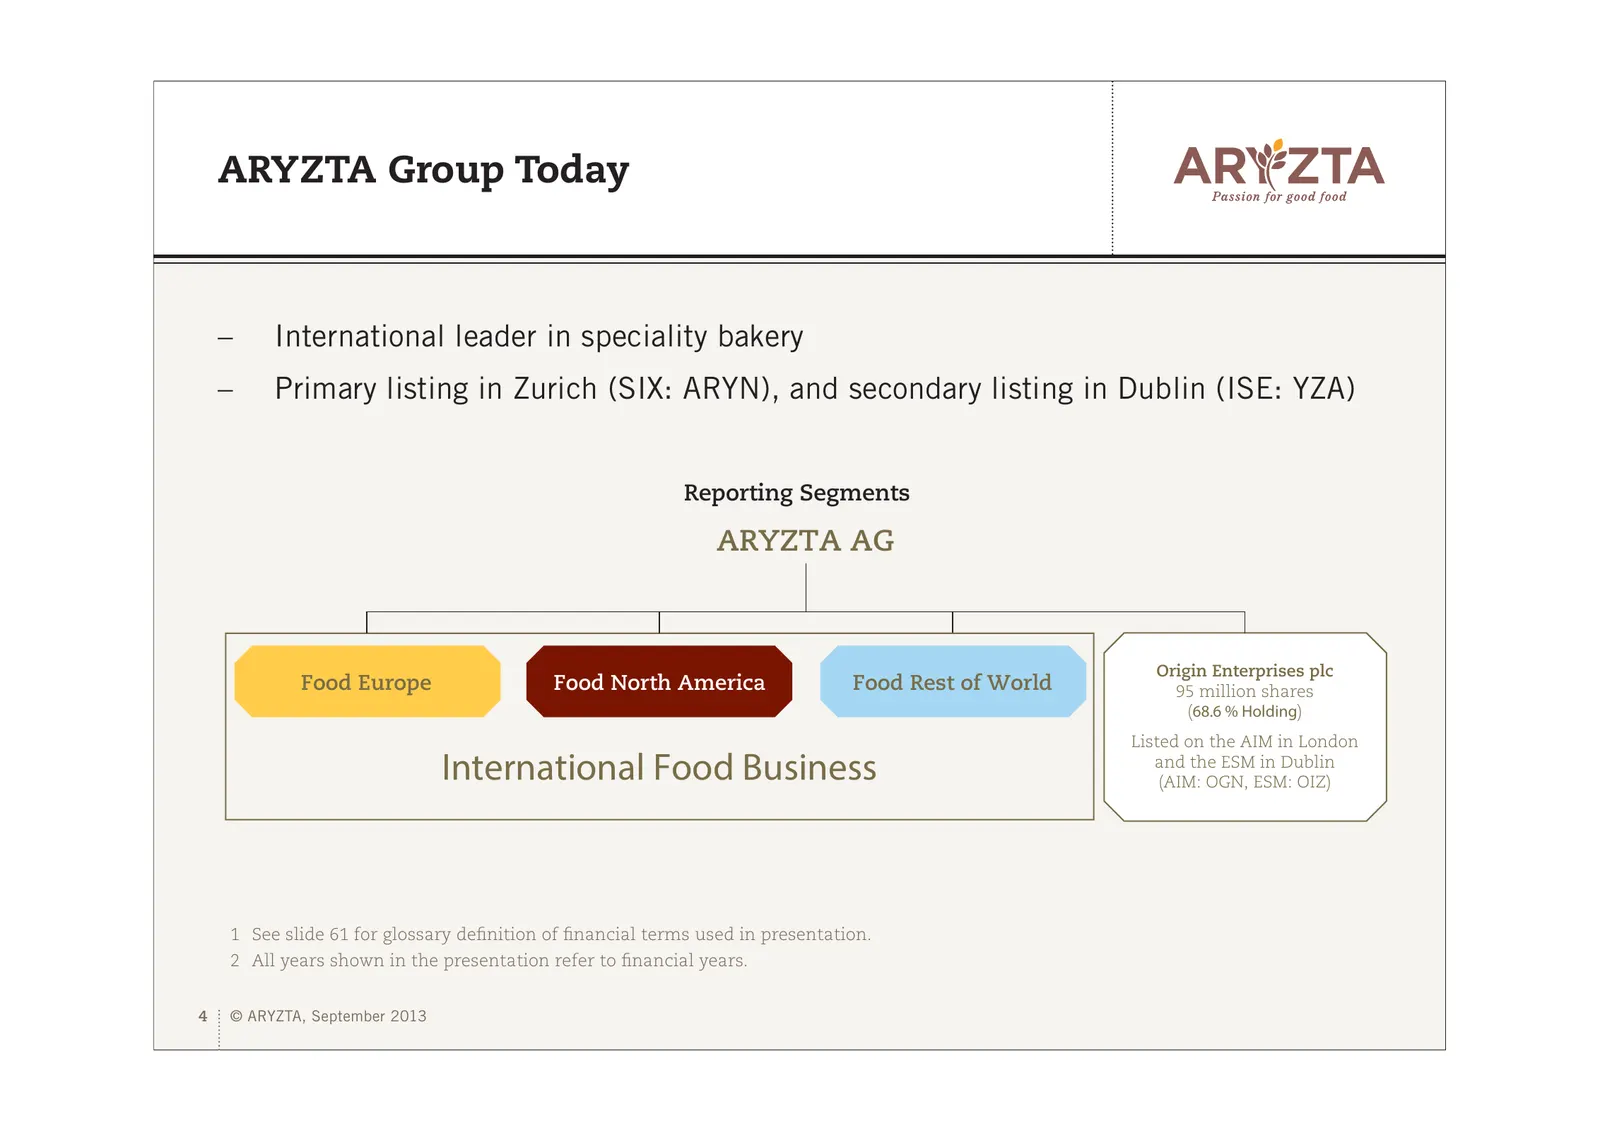
ARYZTA Group Today – International leader in speciality bakery – Primary listing in Zurich (SIX: ARYN), and secondary listing in Dublin (ISE: YZA) Reporting Segments ARYZTA AG Origin Enterprises plc Food Europe Food North America Food Rest of World 95 million shares (68.6 % Holding) Listed on the AI
Slide 5: Origin Enterprises plc – 68.6% Holding
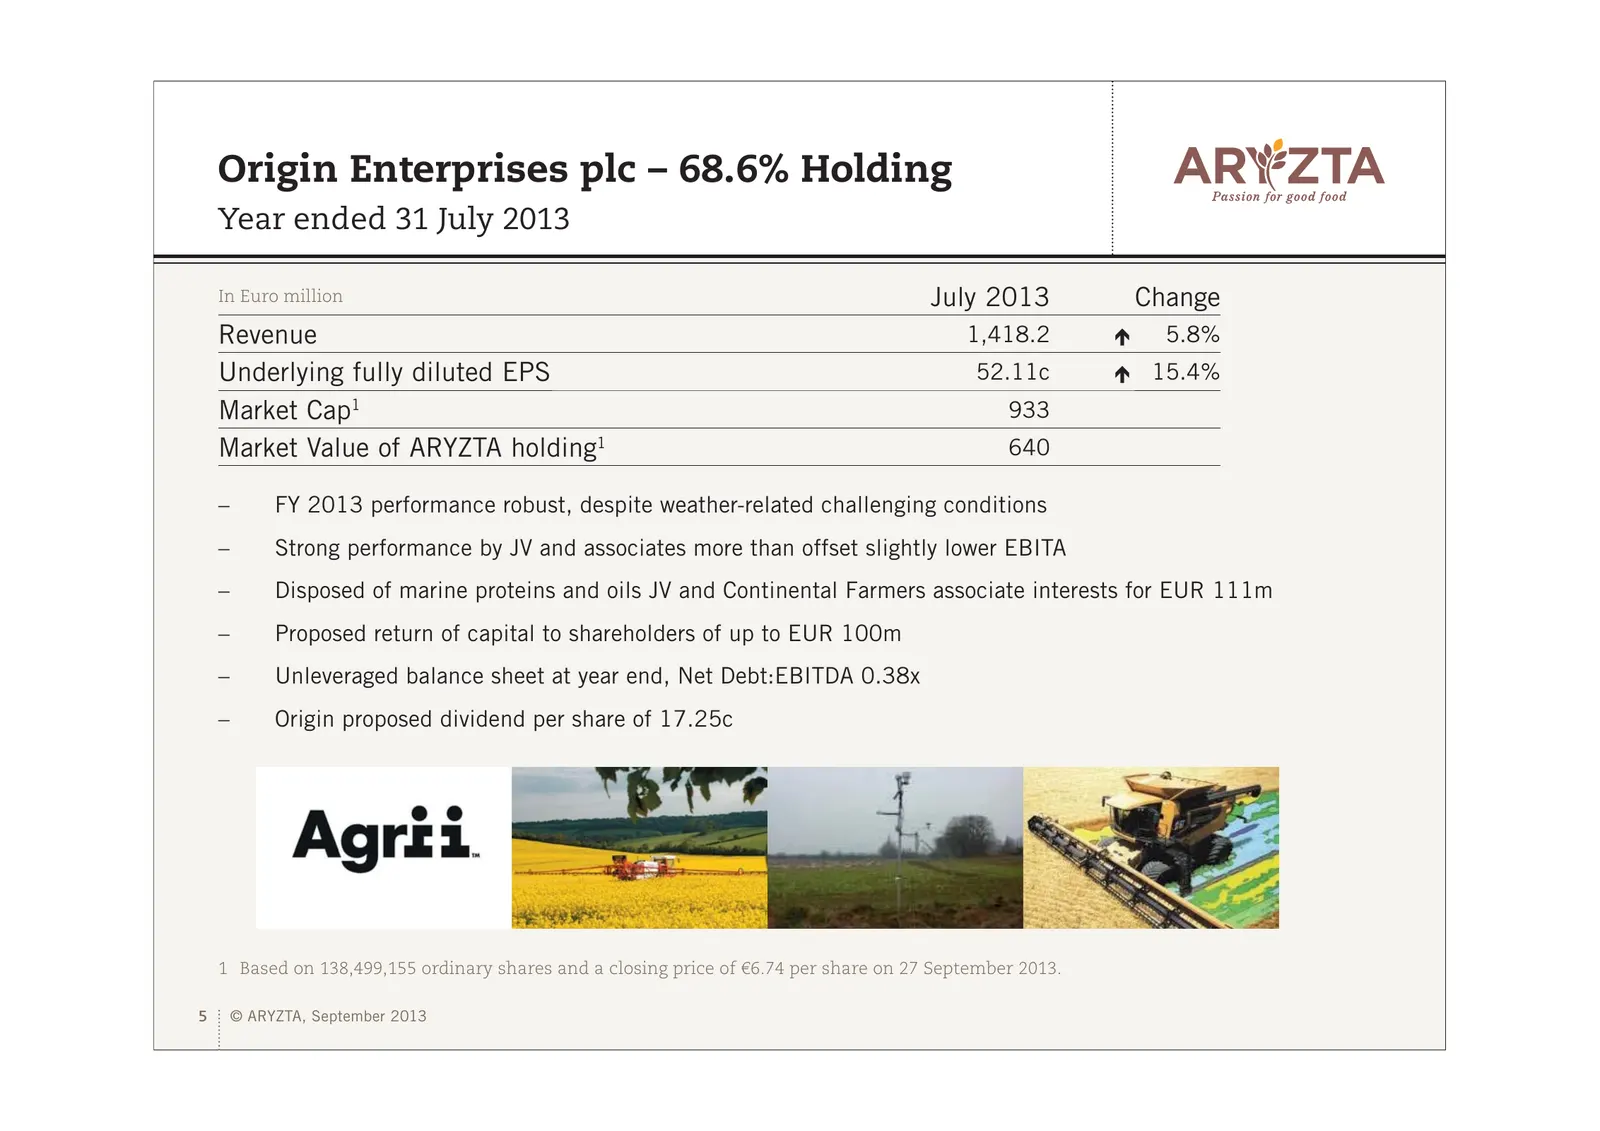
Origin Enterprises plc – 68.6% Holding Year ended 31 July 2013 In Euro million July 2013 Change Revenue 1,418.2 Ï 5.8% Underlying fully diluted EPS 52.11c Ï 15.4% Market Cap1 933 Market Value of ARYZTA holding1 640 – FY 2013 performance robust, despite weather-related challenging conditions – Strong
Slide 6: ARYZTA Food Group – Repositioning Continues
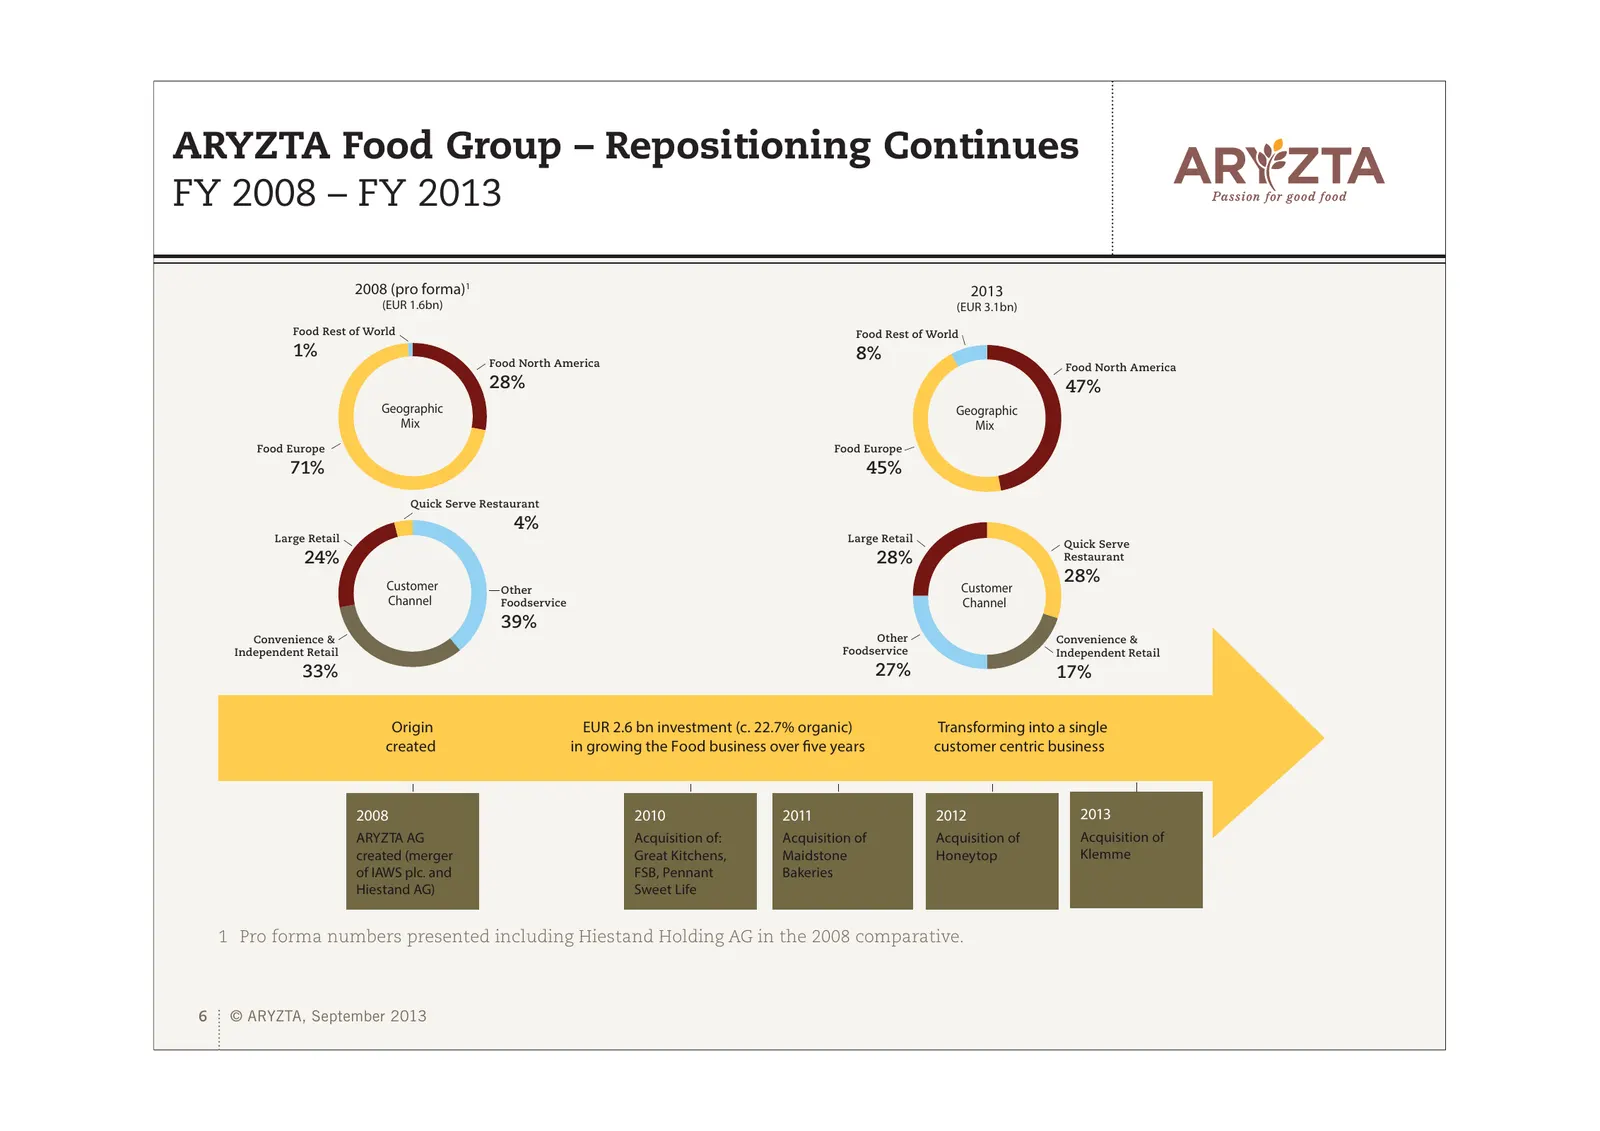
ARYZTA Food Group – Repositioning Continues FY 2008 – FY 2013 2008 (pro forma)1 2013 (EUR 1.6bn) (EUR 3.1bn) Food Rest of World Food Rest of World 1% 8% Food North America Food North America 28% 47% Geographic Geographic Mix Mix Food Europe Food Europe 71% 45% Quick Serve Restaurant 4% Large Retail
Slide 7: Food Group – International Footprint
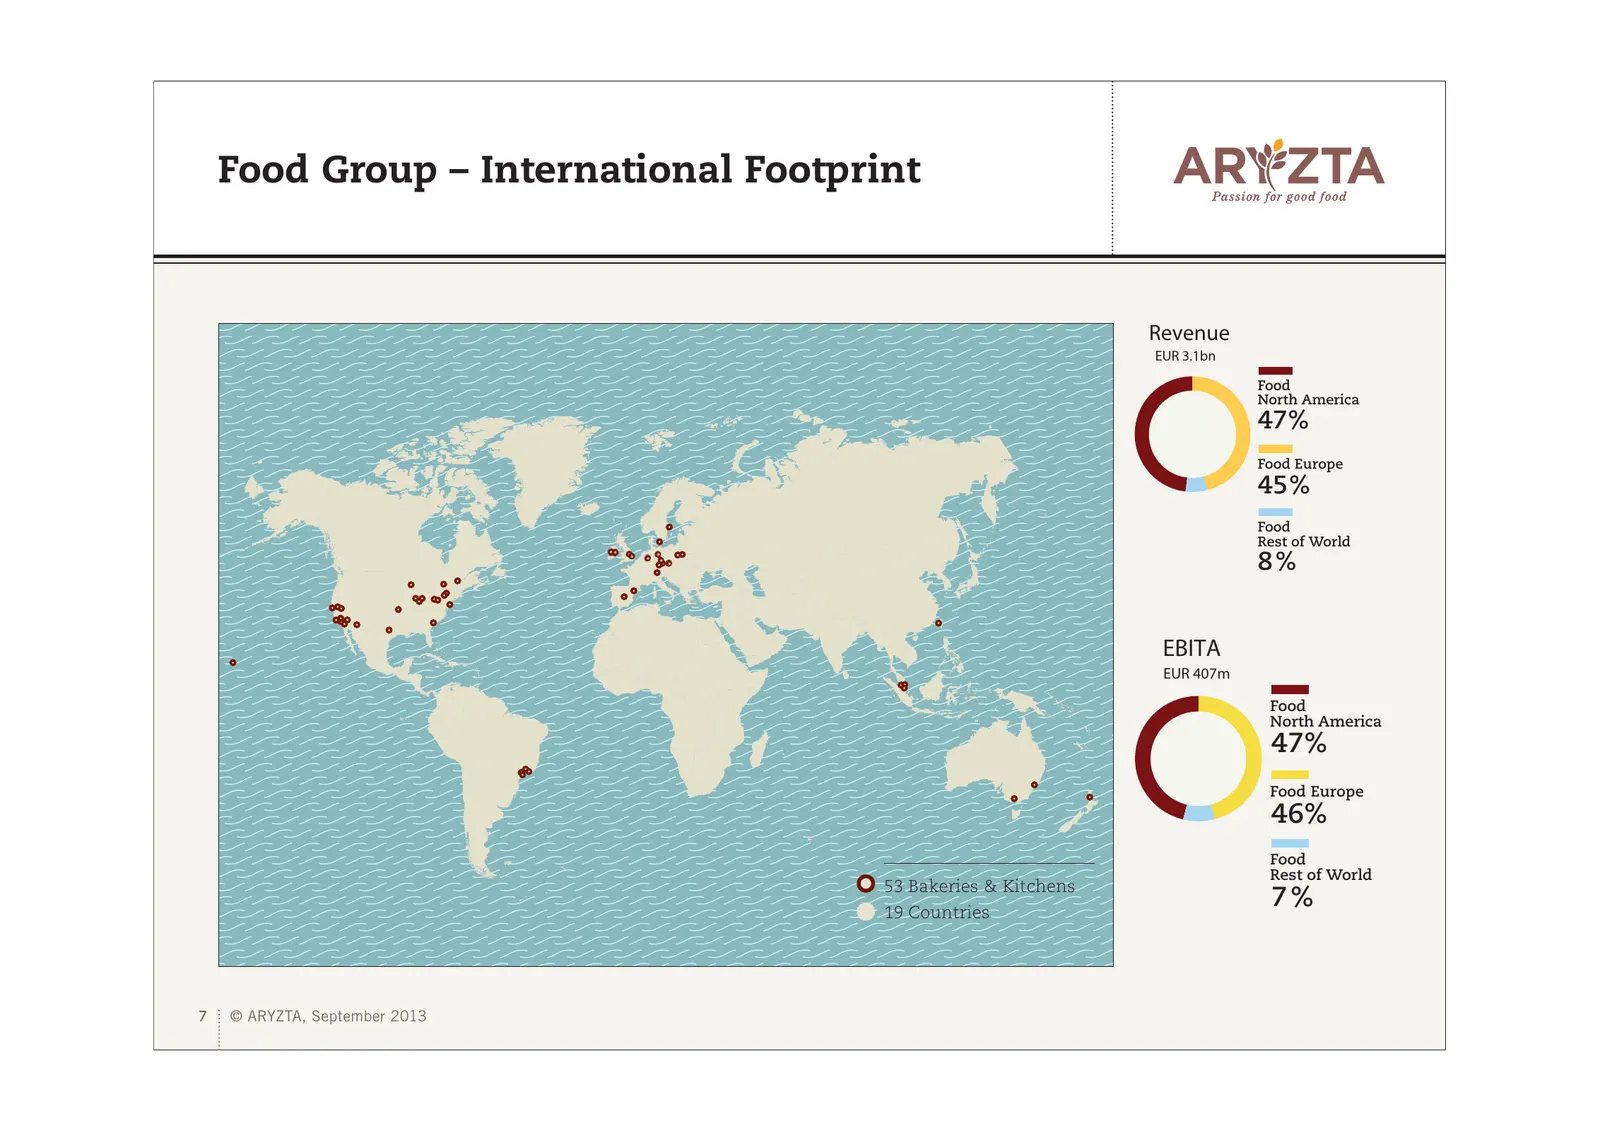
Food Group – International Footprint Revenue EUR 3.1bn Food North America 47% Food Europe 45% Food Rest of World 8% EBITA EUR 407m Food North America 47% Food Europe 46% Food Rest of World 53 Bakeries & Kitchens 19 Countries 7% 7 © ARYZTA, September 2013
Slide 8: ARYZTA Group Financial Performance FY 2008 – FY 2013
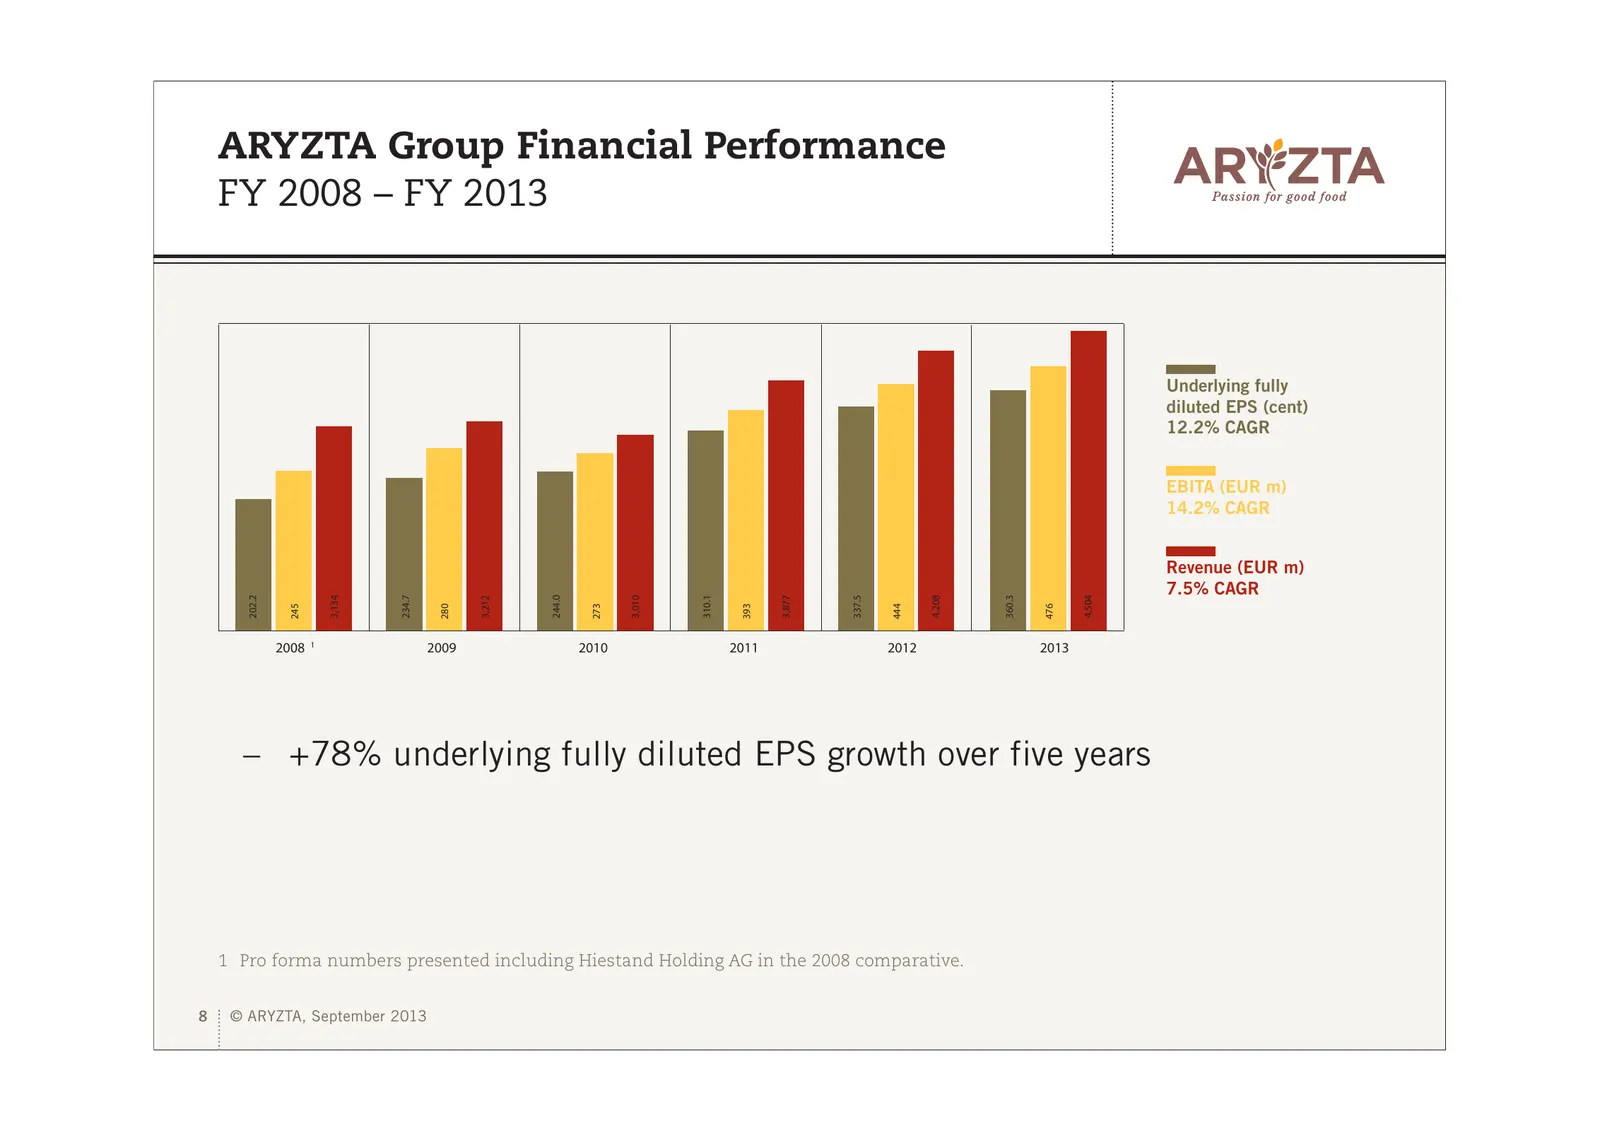
ARYZTA Group Financial Performance FY 2008 – FY 2013 Underlying fully diluted EPS (cent) 12.2% CAGR EBITA (EUR m) 14.2% CAGR Revenue (EUR m) 7.5% CAGR 4,208 4,504 202.2 3,134 234.7 3,212 244.0 3,010 310.1 3,877 337.5 360.3 245 280 273 393 444 476 2008 1 2009 2010 2011 2012 2013 – +78% underlying ful
Slide 9: Food Group – Financial Performance FY 2008 – FY 2013
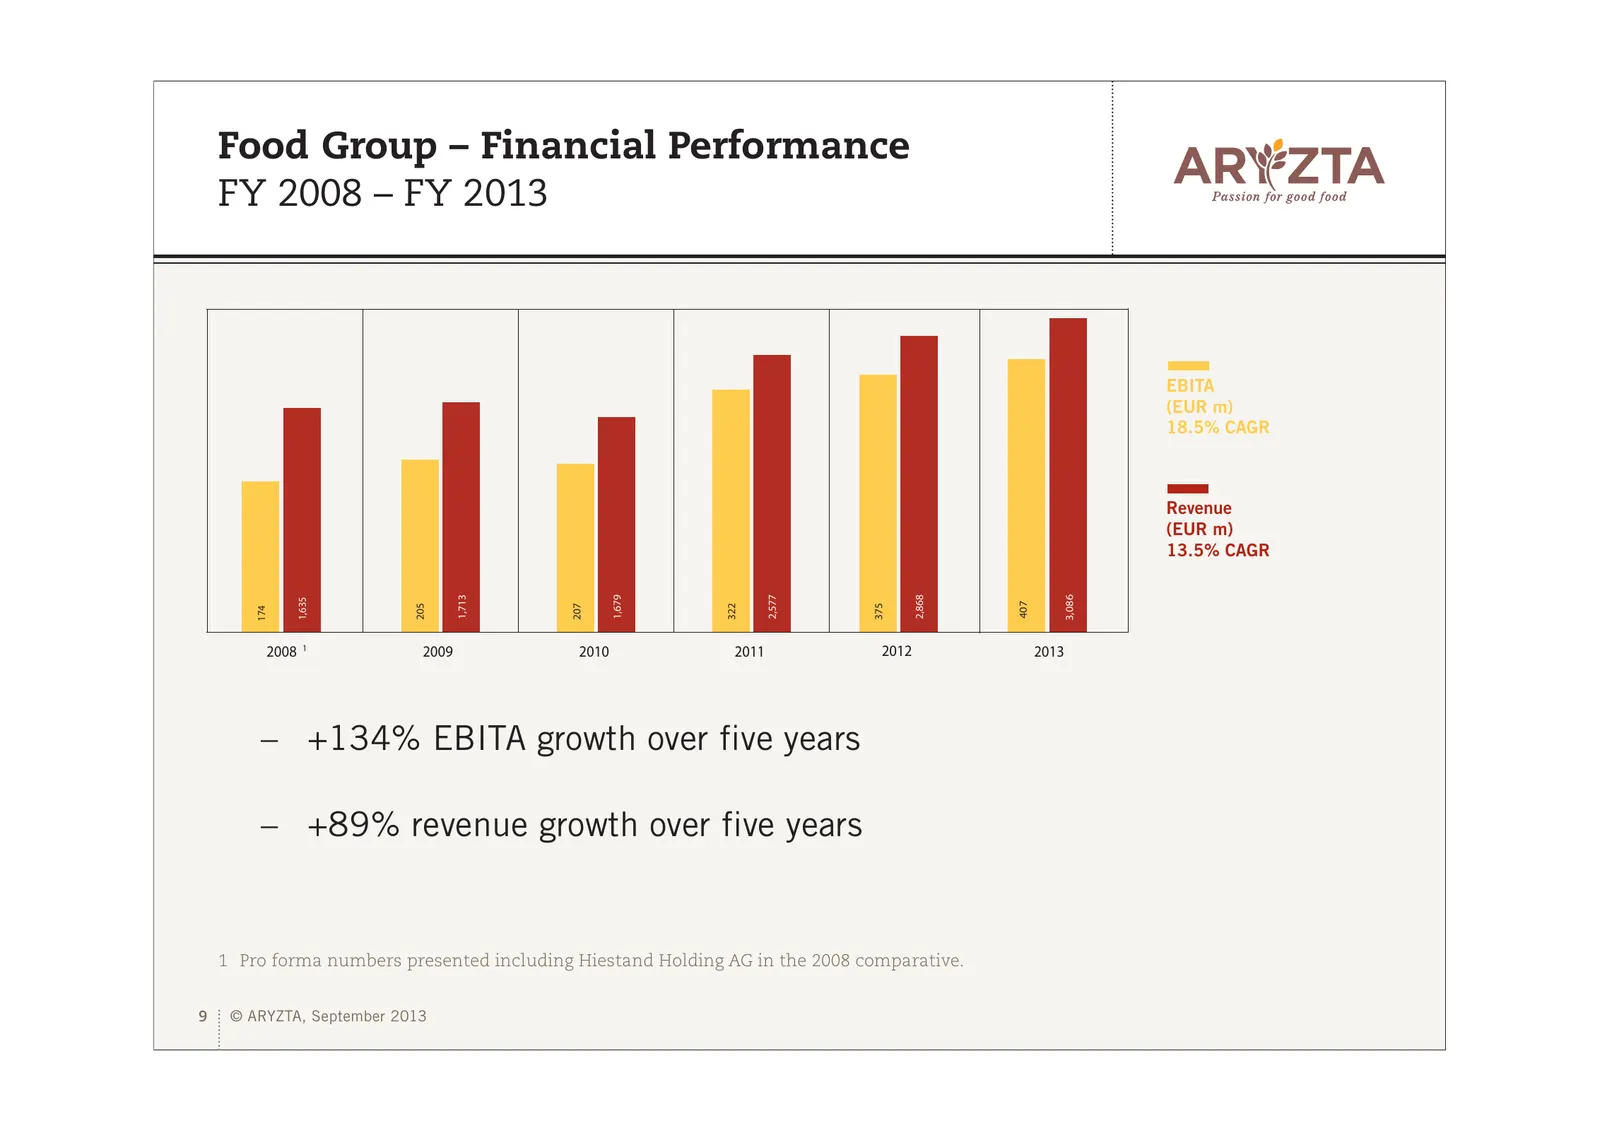
Food Group – Financial Performance FY 2008 – FY 2013 EBITA (EUR m) 18.5% CAGR Revenue (EUR m) 13.5% CAGR 1,713 1,679 2,577 2,868 3,086 1,635 407 205 207 322 375 174 2008 1 2009 2010 2011 2012 2013 – +134% EBITA growth over five years – +89% revenue growth over five years 1 Pro forma numbers presente
Slide 10: ARYZTA Group Financial Review
ARYZTA Group Financial Review 10 © ARYZTA, September 2013
Slide 11: FY 2013 Key Financial Highlights
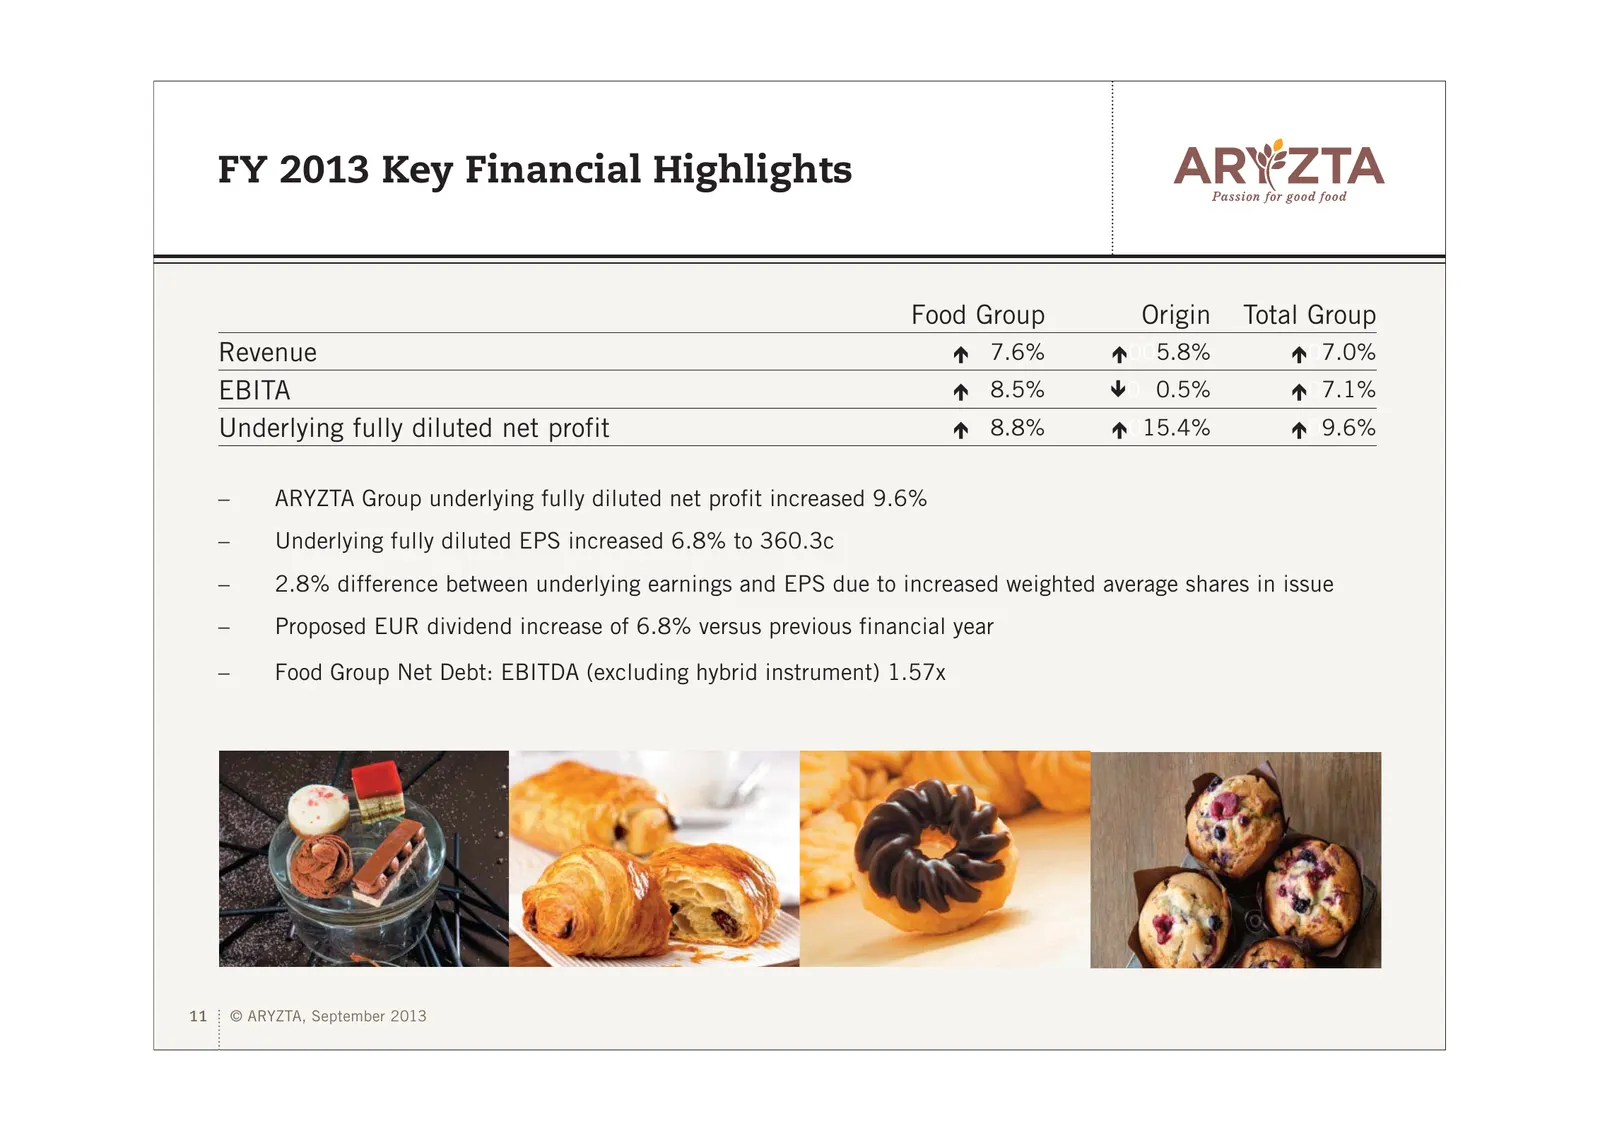
FY 2013 Key Financial Highlights Food Group Origin Total Group Revenue Ï 7.6% Ï005.8% Ï07.0% EBITA Ï 8.5% Ð0 0.5% Ï07.1% Underlying fully diluted net profit Ï 8.8% Ï015.4% Ï09.6% – ARYZTA Group underlying fully diluted net profit increased 9.6% – Underlying fully diluted EPS increased 6.8% to 360.3c
Slide 12: ARYZTA Group – Income Statement
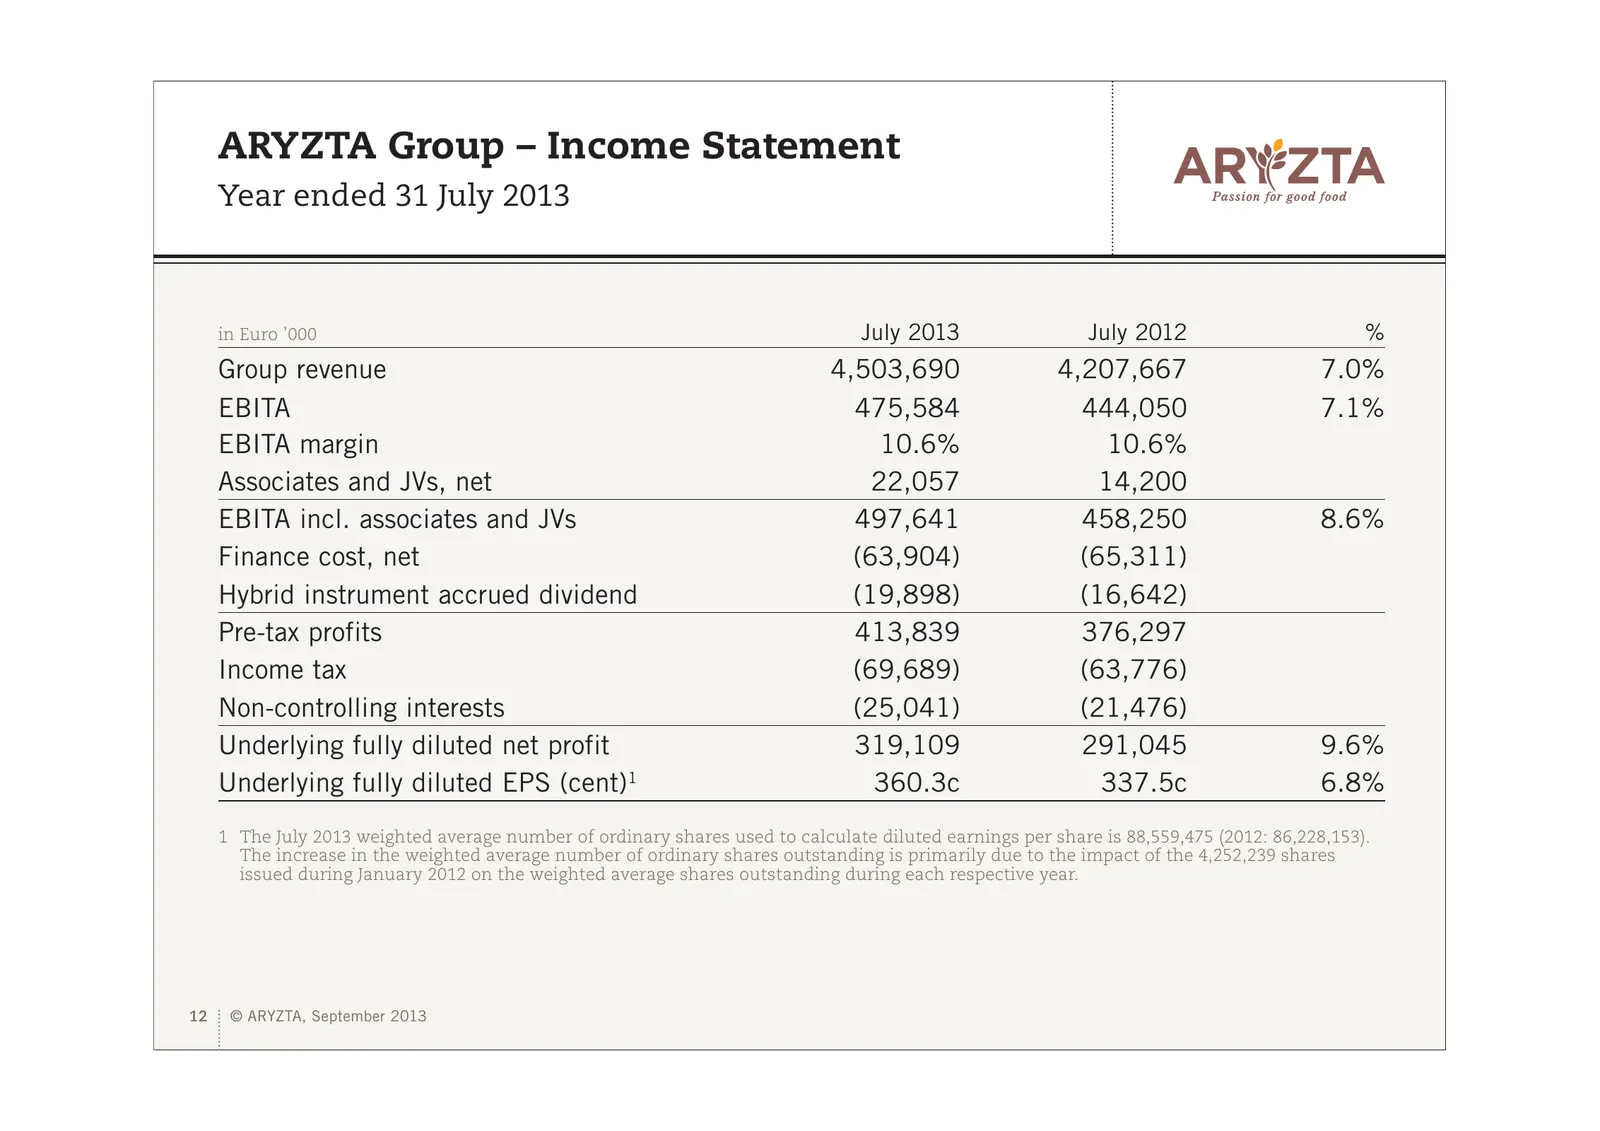
ARYZTA Group – Income Statement Year ended 31 July 2013 in Euro ’000 July 2013 July 2012 % Group revenue 4,503,690 4,207,667 7.0% EBITA 475,584 444,050 7.1% EBITA margin 10.6% 10.6% Associates and JVs, net 22,057 14,200 EBITA incl. associates and JVs 497,641 458,250 8.6% Finance cost, net (63,904) (
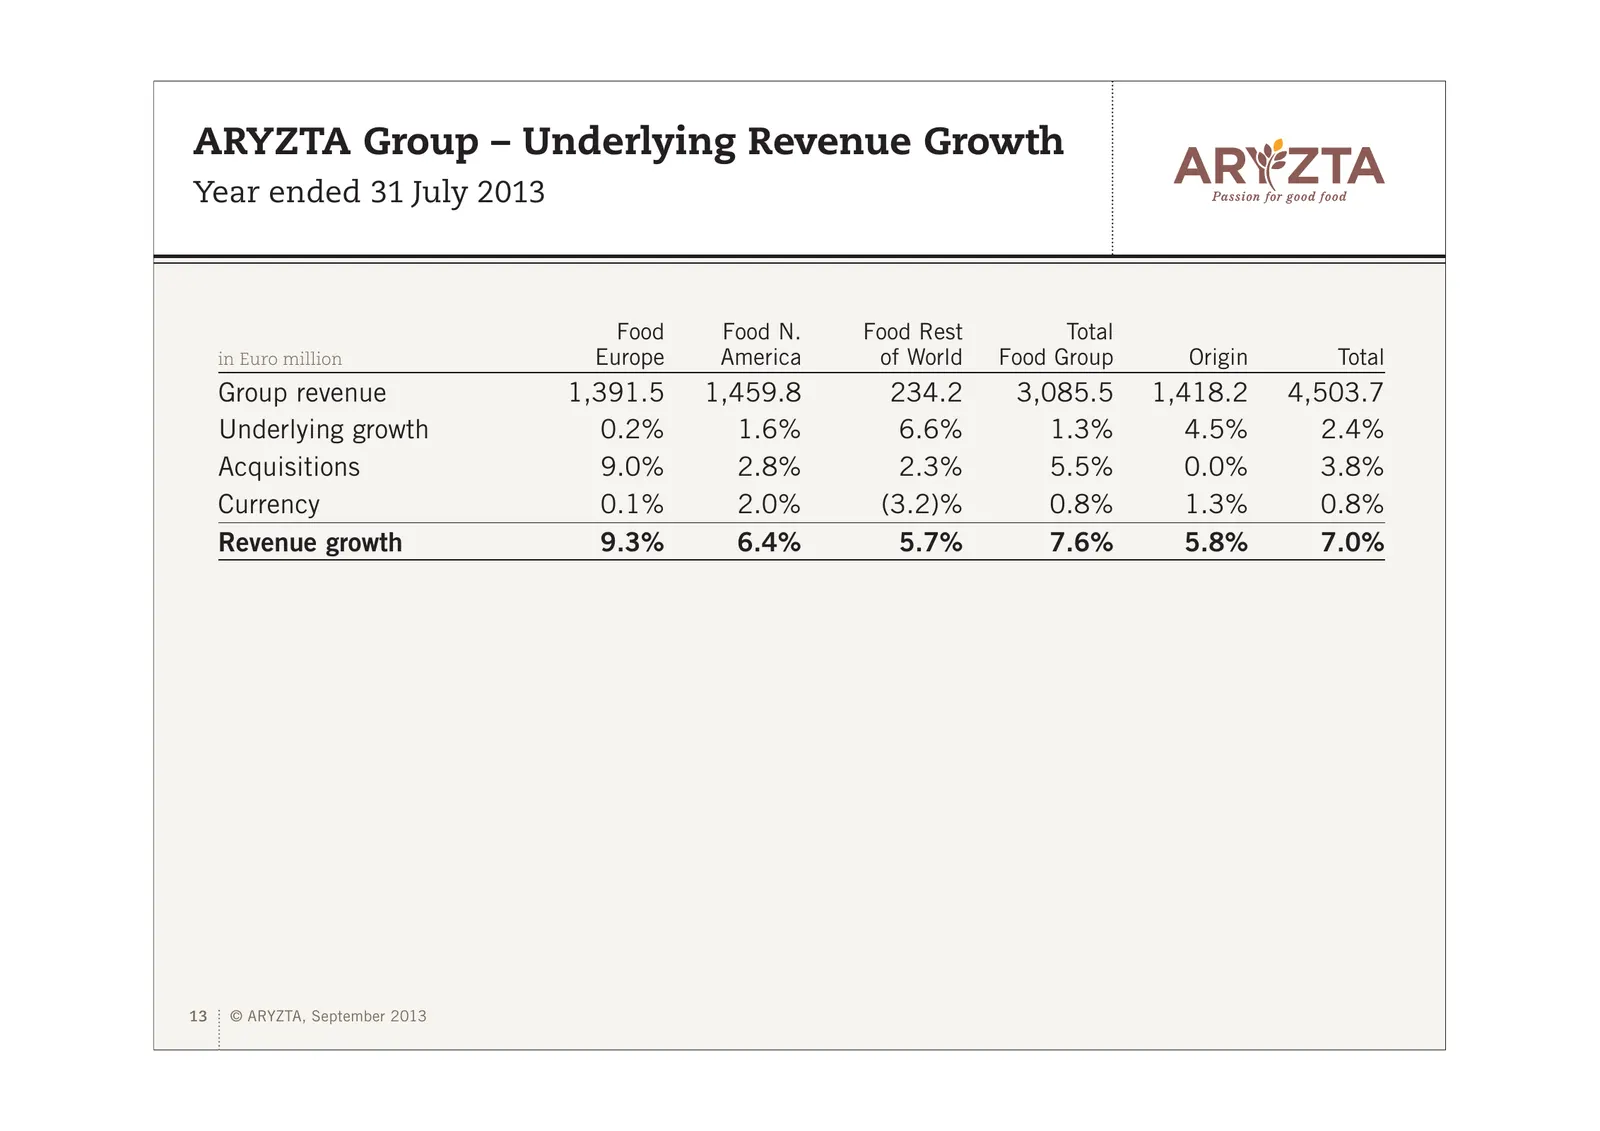
Slide 13: ARYZTA Group – Underlying Revenue Growth
ARYZTA Group – Underlying Revenue Growth Year ended 31 July 2013 Food Food N. Food Rest Total in Euro million Europe America of World Food Group Origin Total Group revenue 1,391.5 1,459.8 234.2 3,085.5 1,418.2 4,503.7 Underlying growth 0.2% 1.6% 6.6% 1.3% 4.5% 2.4% Acquisitions 9.0% 2.8% 2.3% 5.5% 0
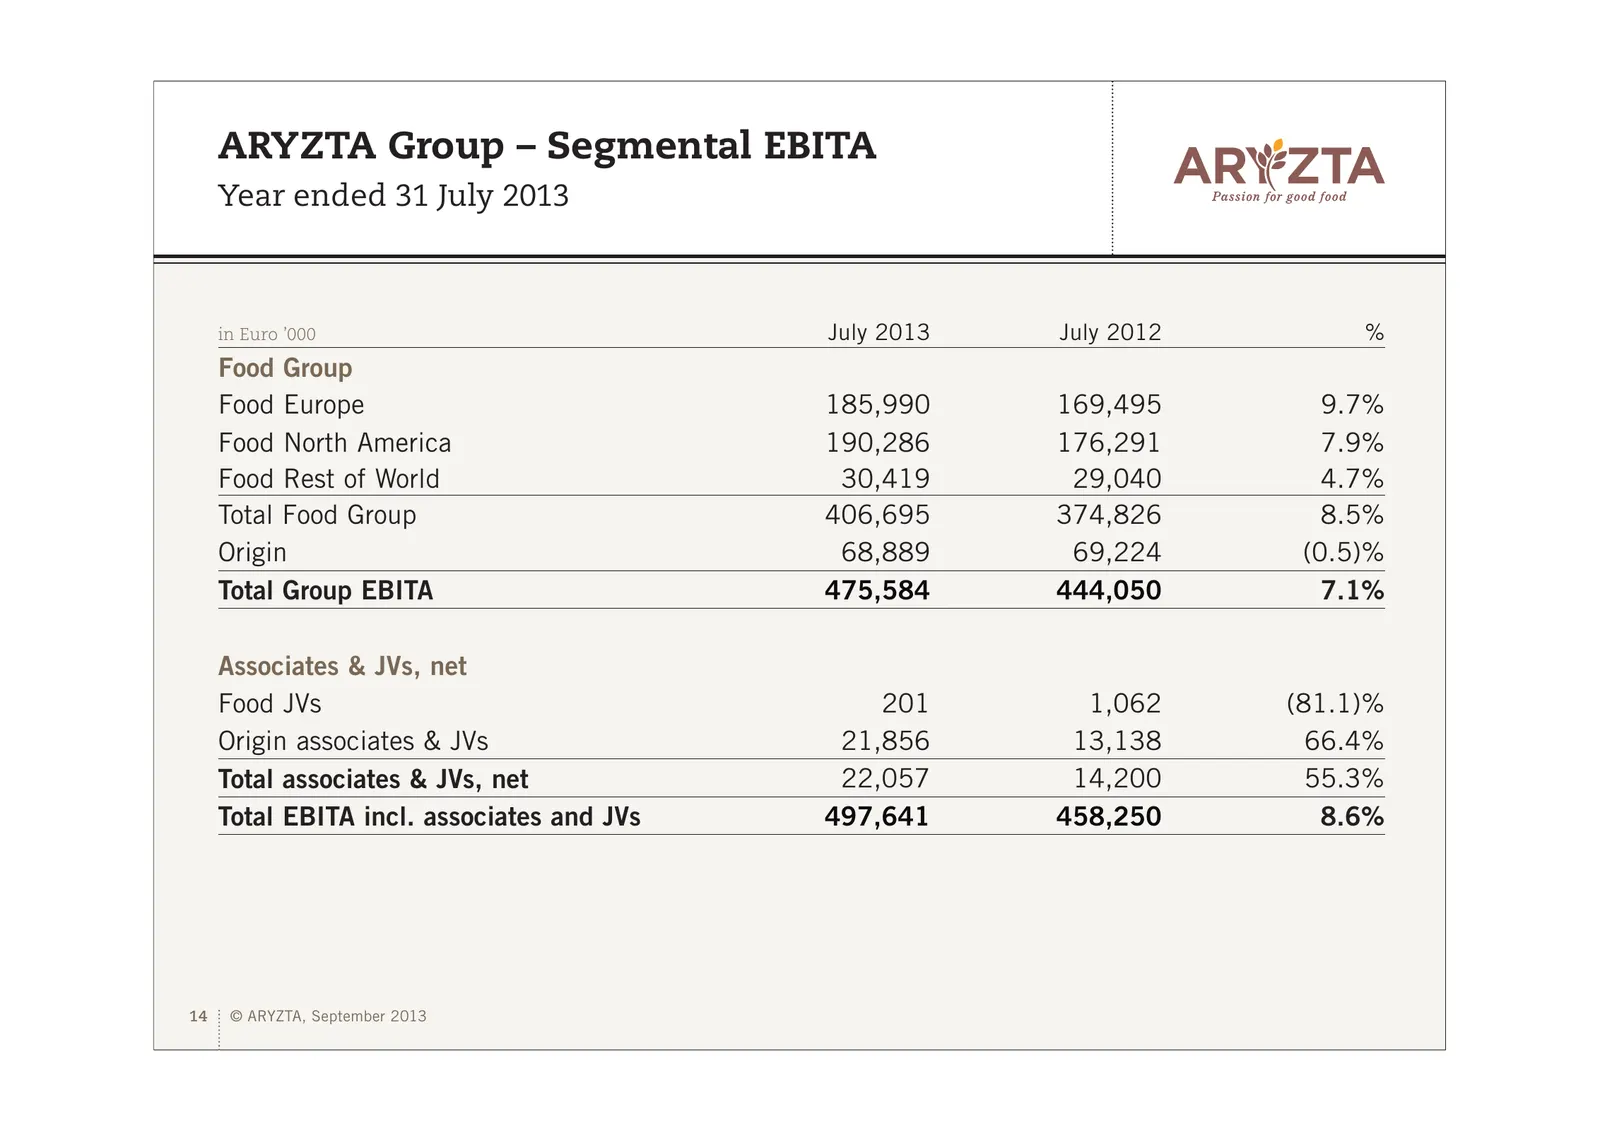
Slide 14: ARYZTA Group – Segmental EBITA
ARYZTA Group – Segmental EBITA Year ended 31 July 2013 in Euro ’000 July 2013 July 2012 % Food Group Food Europe 185,990 169,495 9.7% Food North America 190,286 176,291 7.9% Food Rest of World 30,419 29,040 4.7% Total Food Group 406,695 374,826 8.5% Origin 68,889 69,224 (0.5)% Total Group EBITA 475,
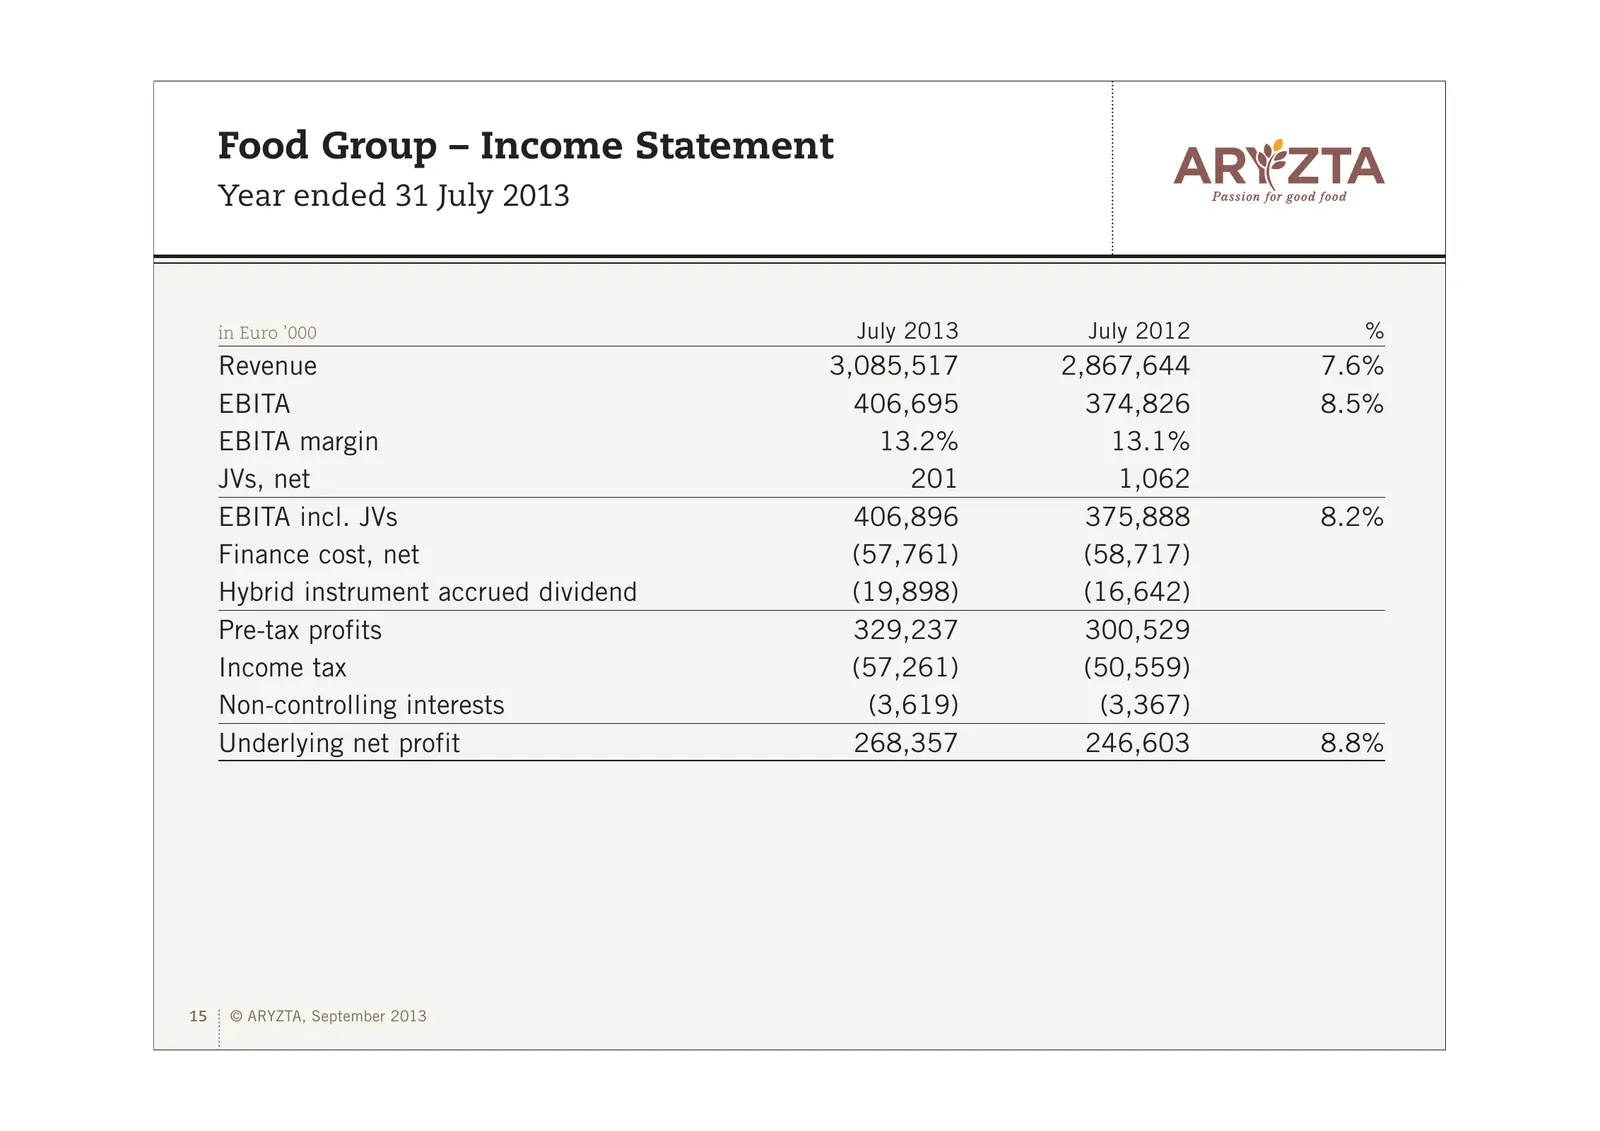
Slide 15: Food Group – Income Statement
Food Group – Income Statement Year ended 31 July 2013 in Euro ’000 July 2013 July 2012 % Revenue 3,085,517 2,867,644 7.6% EBITA 406,695 374,826 8.5% EBITA margin 13.2% 13.1% JVs, net 201 1,062 EBITA incl. JVs 406,896 375,888 8.2% Finance cost, net (57,761) (58,717) Hybrid instrument accrued dividend
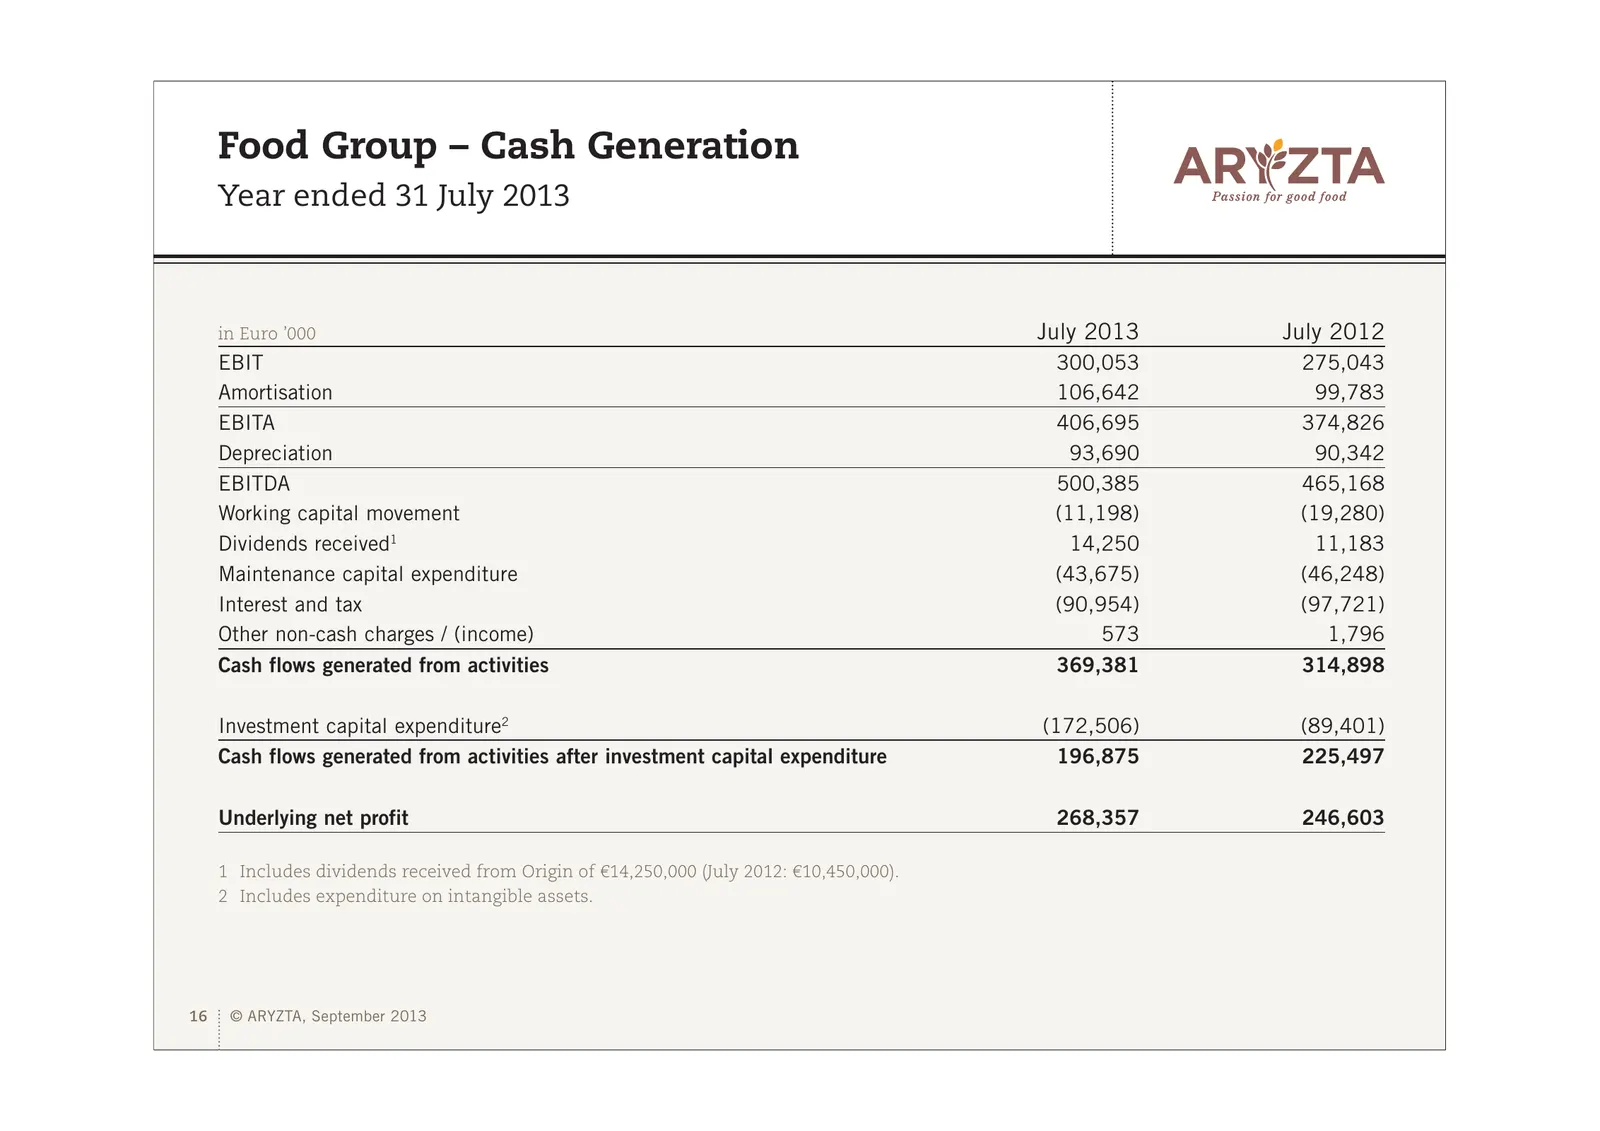
Slide 16: Food Group – Cash Generation
Food Group – Cash Generation Year ended 31 July 2013 in Euro ’000 July 2013 July 2012 EBIT 300,053 275,043 Amortisation 106,642 99,783 EBITA 406,695 374,826 Depreciation 93,690 90,342 EBITDA 500,385 465,168 Working capital movement (11,198) (19,280) Dividends received1 14,250 11,183 Maintenance capi
Slide 17: Food Group Net Debt and Investment Activity
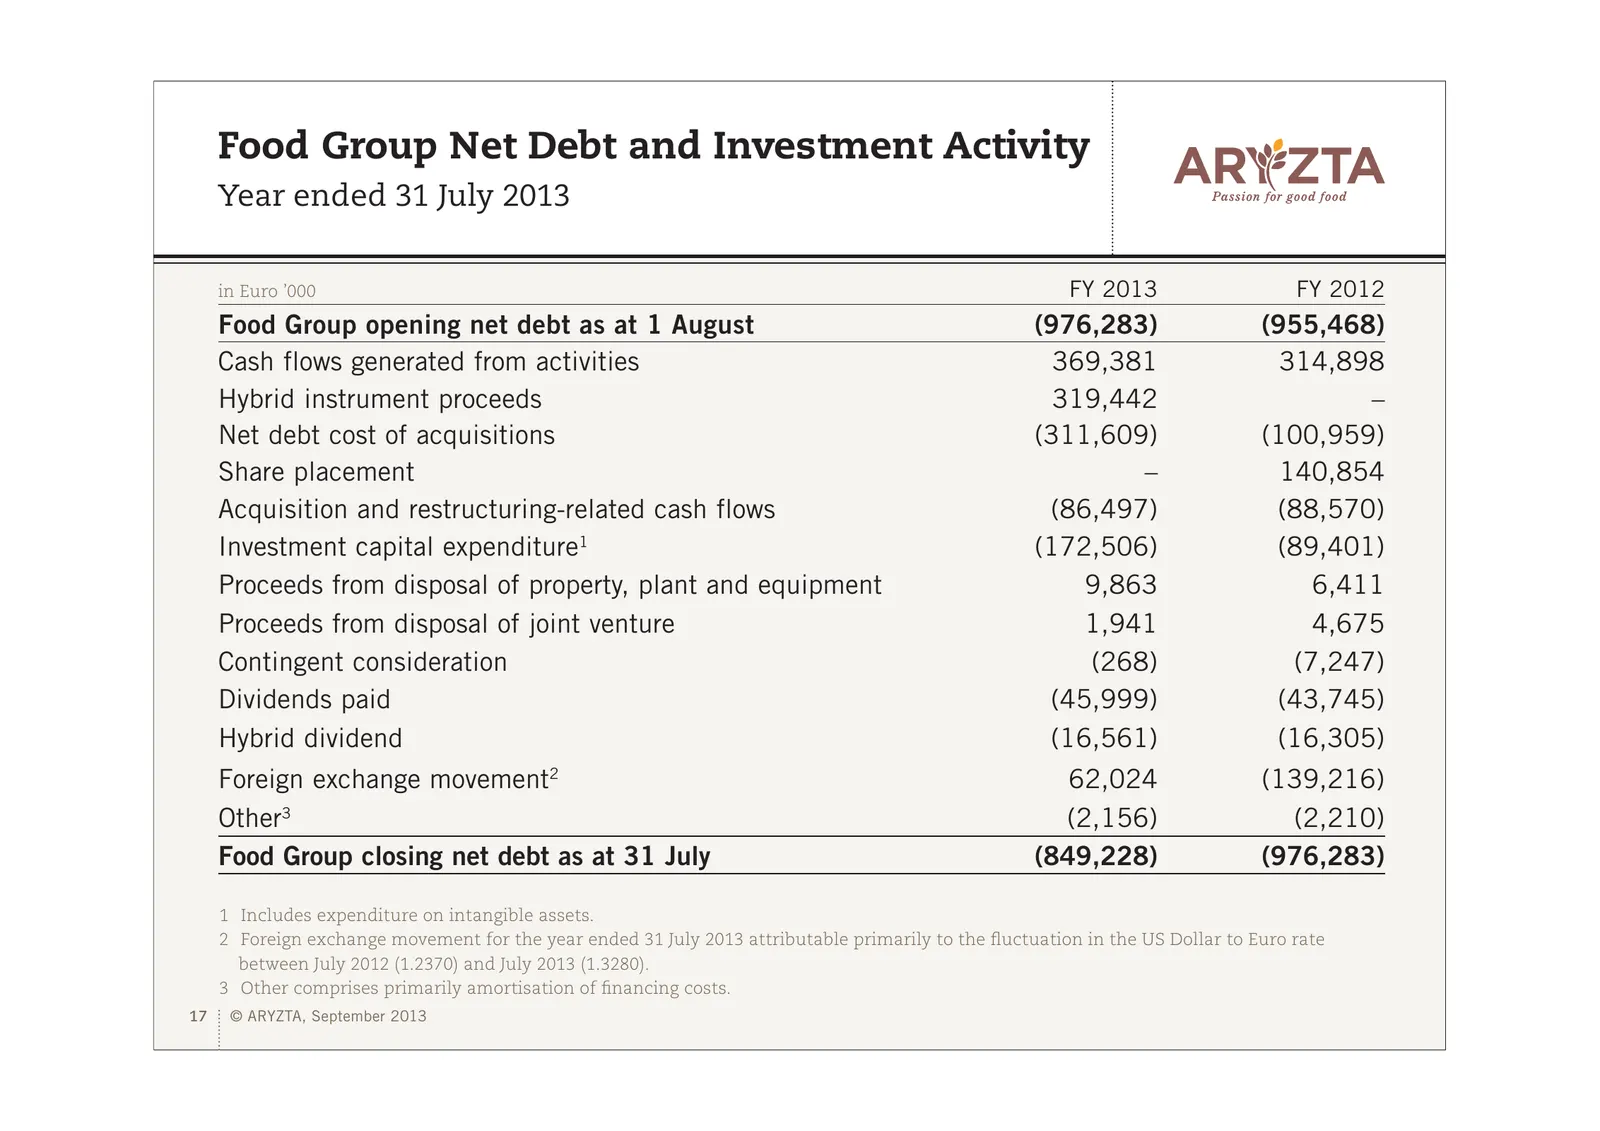
Food Group Net Debt and Investment Activity Year ended 31 July 2013 in Euro ’000 FY 2013 FY 2012 Food Group opening net debt as at 1 August (976,283) (955,468) Cash flows generated from activities 369,381 314,898 Hybrid instrument proceeds 319,442 – Net debt cost of acquisitions (311,609) (100,959)
Slide 18: Food Group Financing
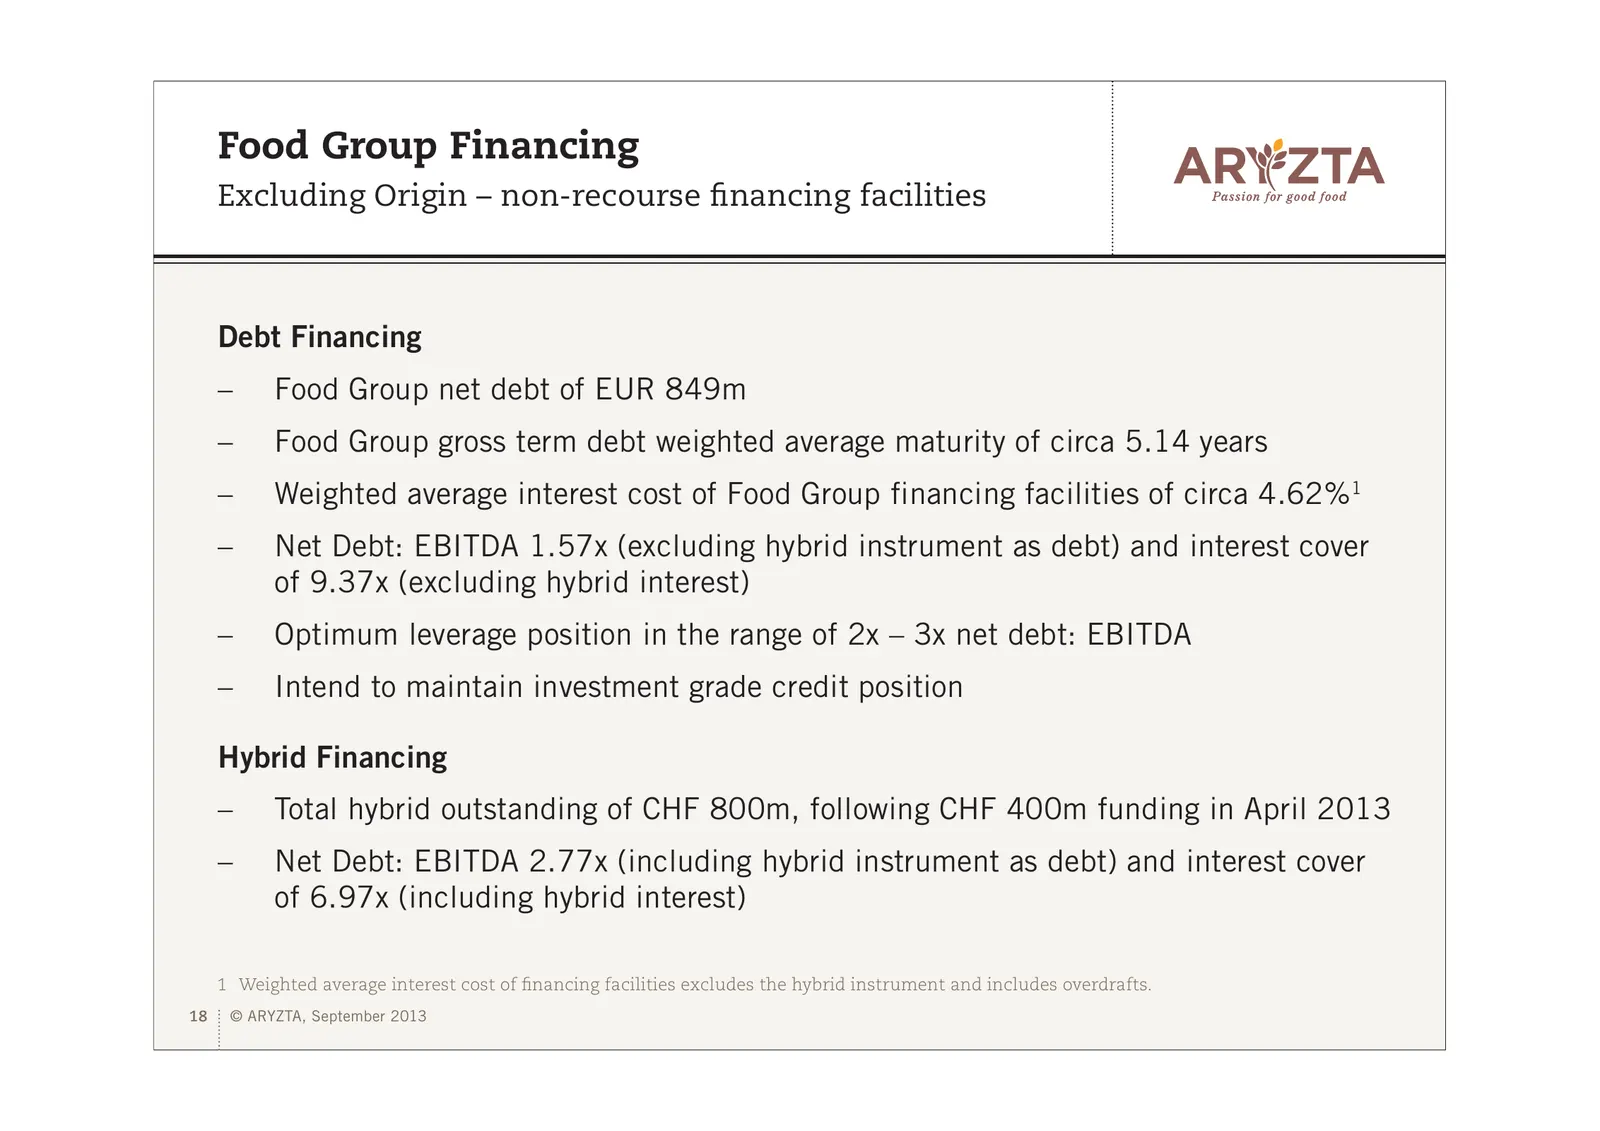
Food Group Financing Excluding Origin – non-recourse financing facilities Debt Financing – Food Group net debt of EUR 849m – Food Group gross term debt weighted average maturity of circa 5.14 years – Weighted average interest cost of Food Group financing facilities of circa 4.62%1 – Net Debt: EBITDA
Slide 19: ARYZTA Group – Return on Investment
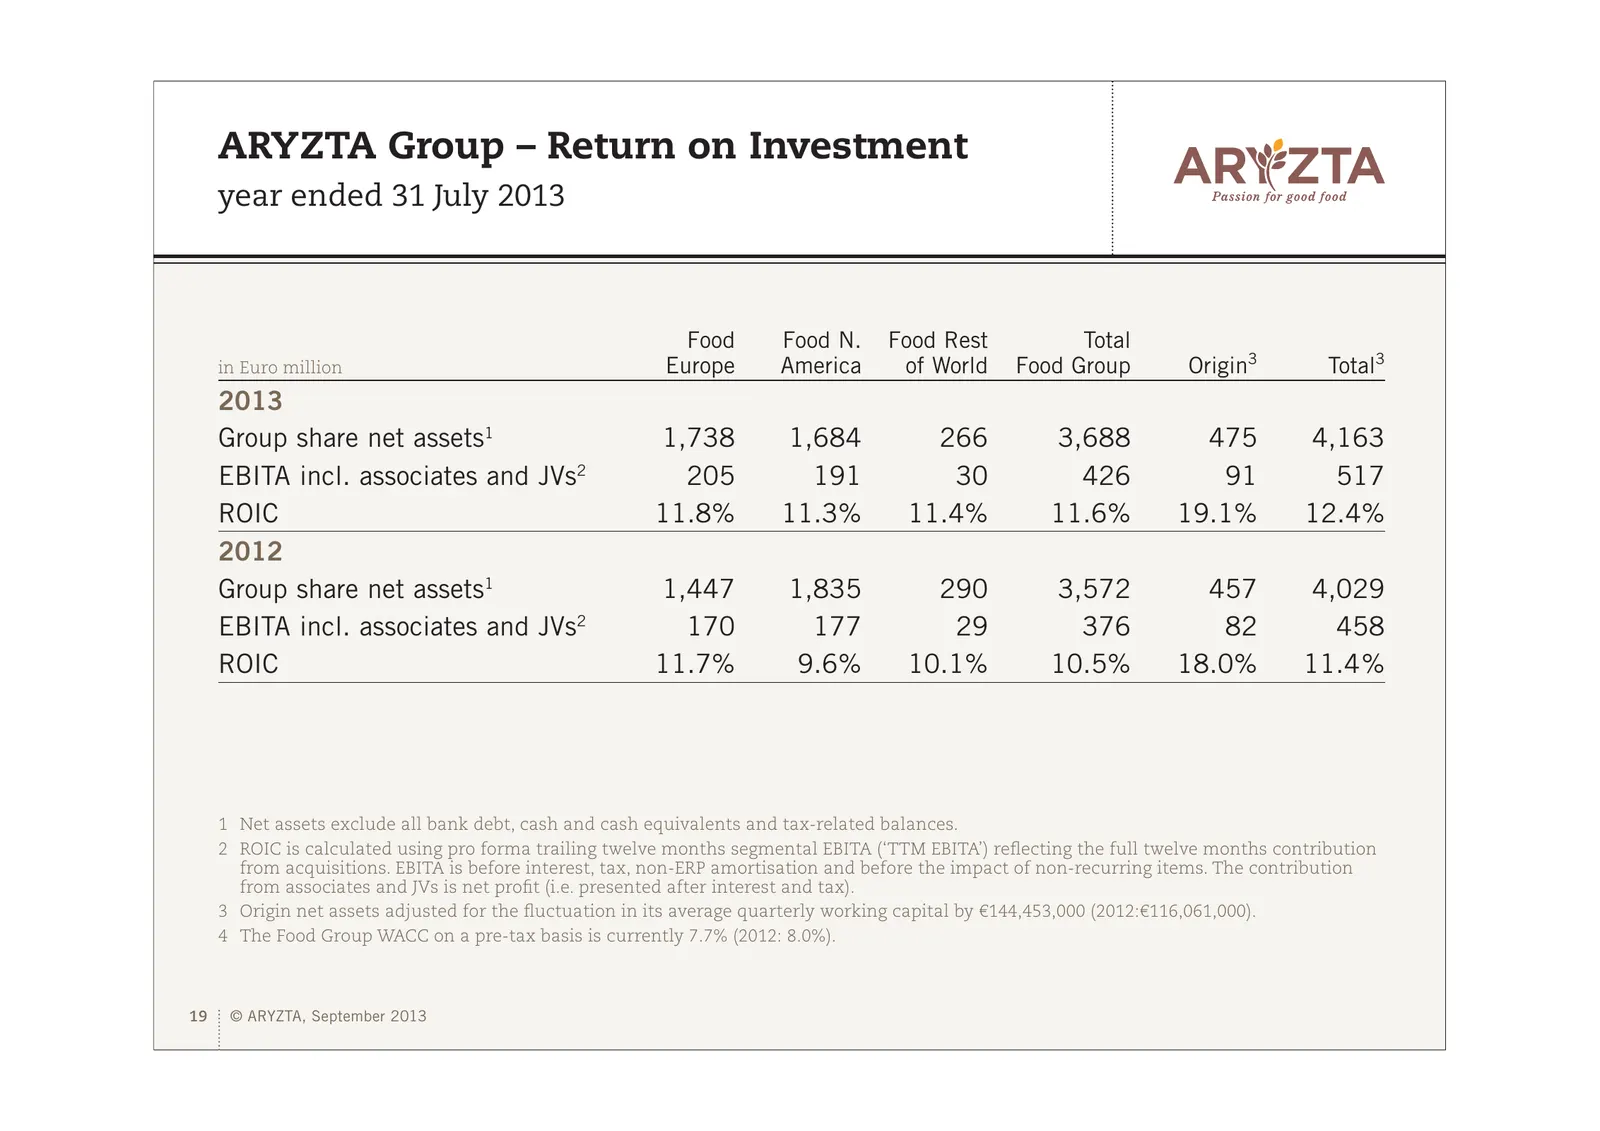
ARYZTA Group – Return on Investment year ended 31 July 2013 Food Food N. Food Rest Total in Euro million Europe America of World Food Group Origin3 Total3 2013 Group share net assets1 1,738 1,684 266 3,688 475 4,163 EBITA incl. associates and JVs2 205 191 30 426 91 517 ROIC 11.8% 11.3% 11.4% 11.6% 1
Slide 20: Dividend
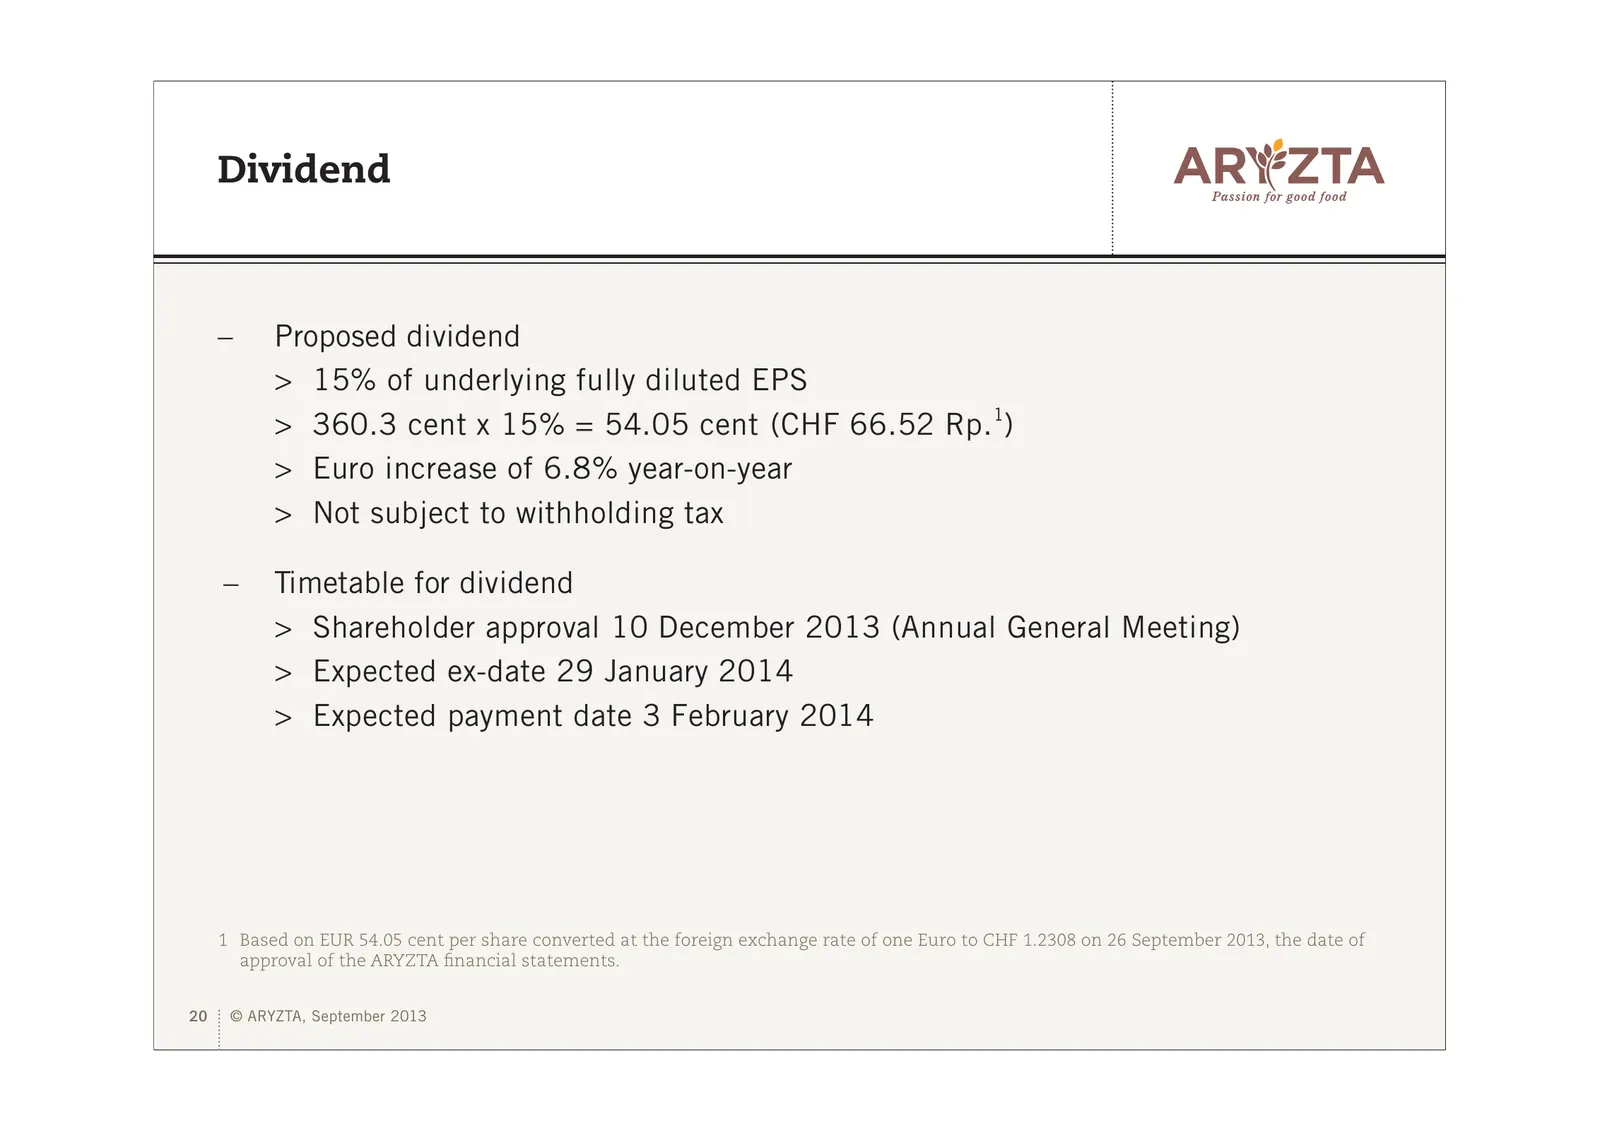
Dividend – Proposed dividend > 15% of underlying fully diluted EPS > 360.3 cent x 15% = 54.05 cent (CHF 66.52 Rp.1) > Euro increase of 6.8% year-on-year > Not subject to withholding tax – Timetable for dividend > Shareholder approval 10 December 2013 (Annual General Meeting) > Expected ex-date 29 Ja
Slide 21: Business Review
Business Review Year ended 31 July 2013 – ARYZTA Transformation Initiative (ATI) – Food Europe – Food North America – Food Rest of World – Food Group Underlying Revenue Growth – Food Group Five Year KPIs 21 © ARYZTA, September 2013
Slide 22: ARYZTA Transformation Initiative Update
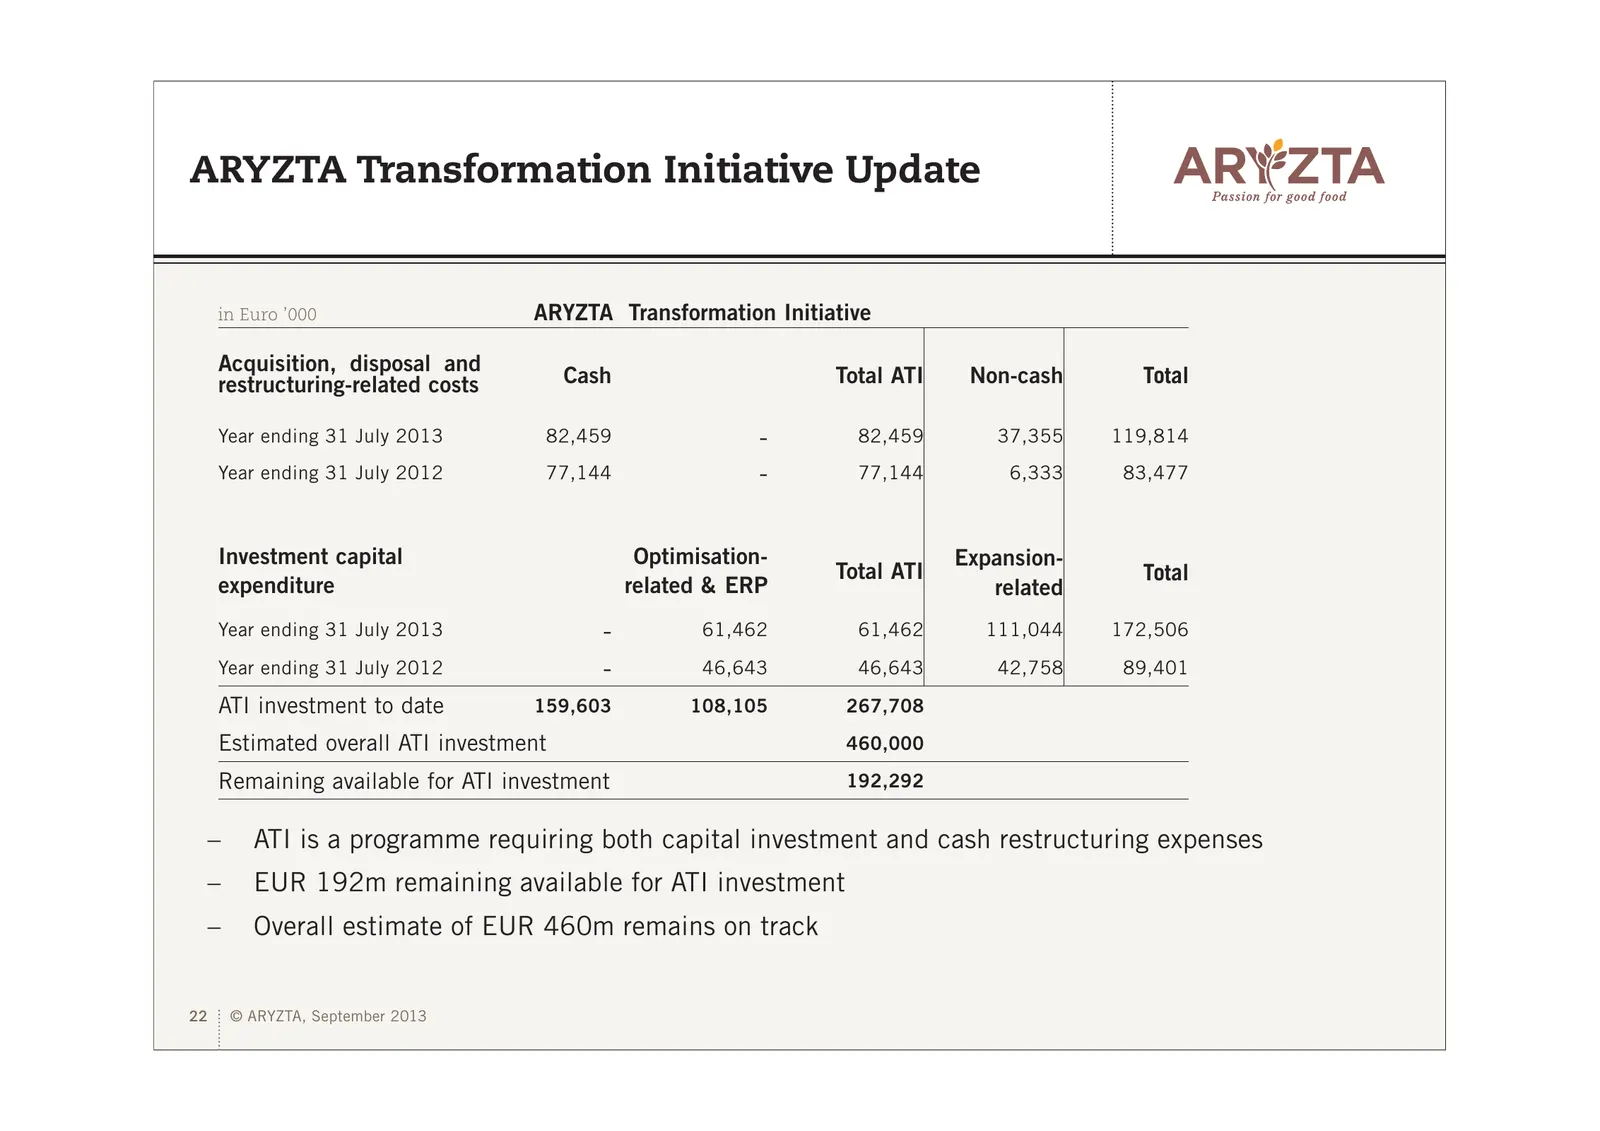
ARYZTA Transformation Initiative Update in Euro ’000 ARYZTA Transformation Initiative Acquisition, disposal and restructuring-related costs Cash Total ATI Non-cash Total Year ending 31 July 2013 82,459 - 82,459 37,355 119,814 Year ending 31 July 2012 77,144 - 77,144 6,333 83,477 Investment capital O
Slide 23: ARYTZA Transformation Initiative Update
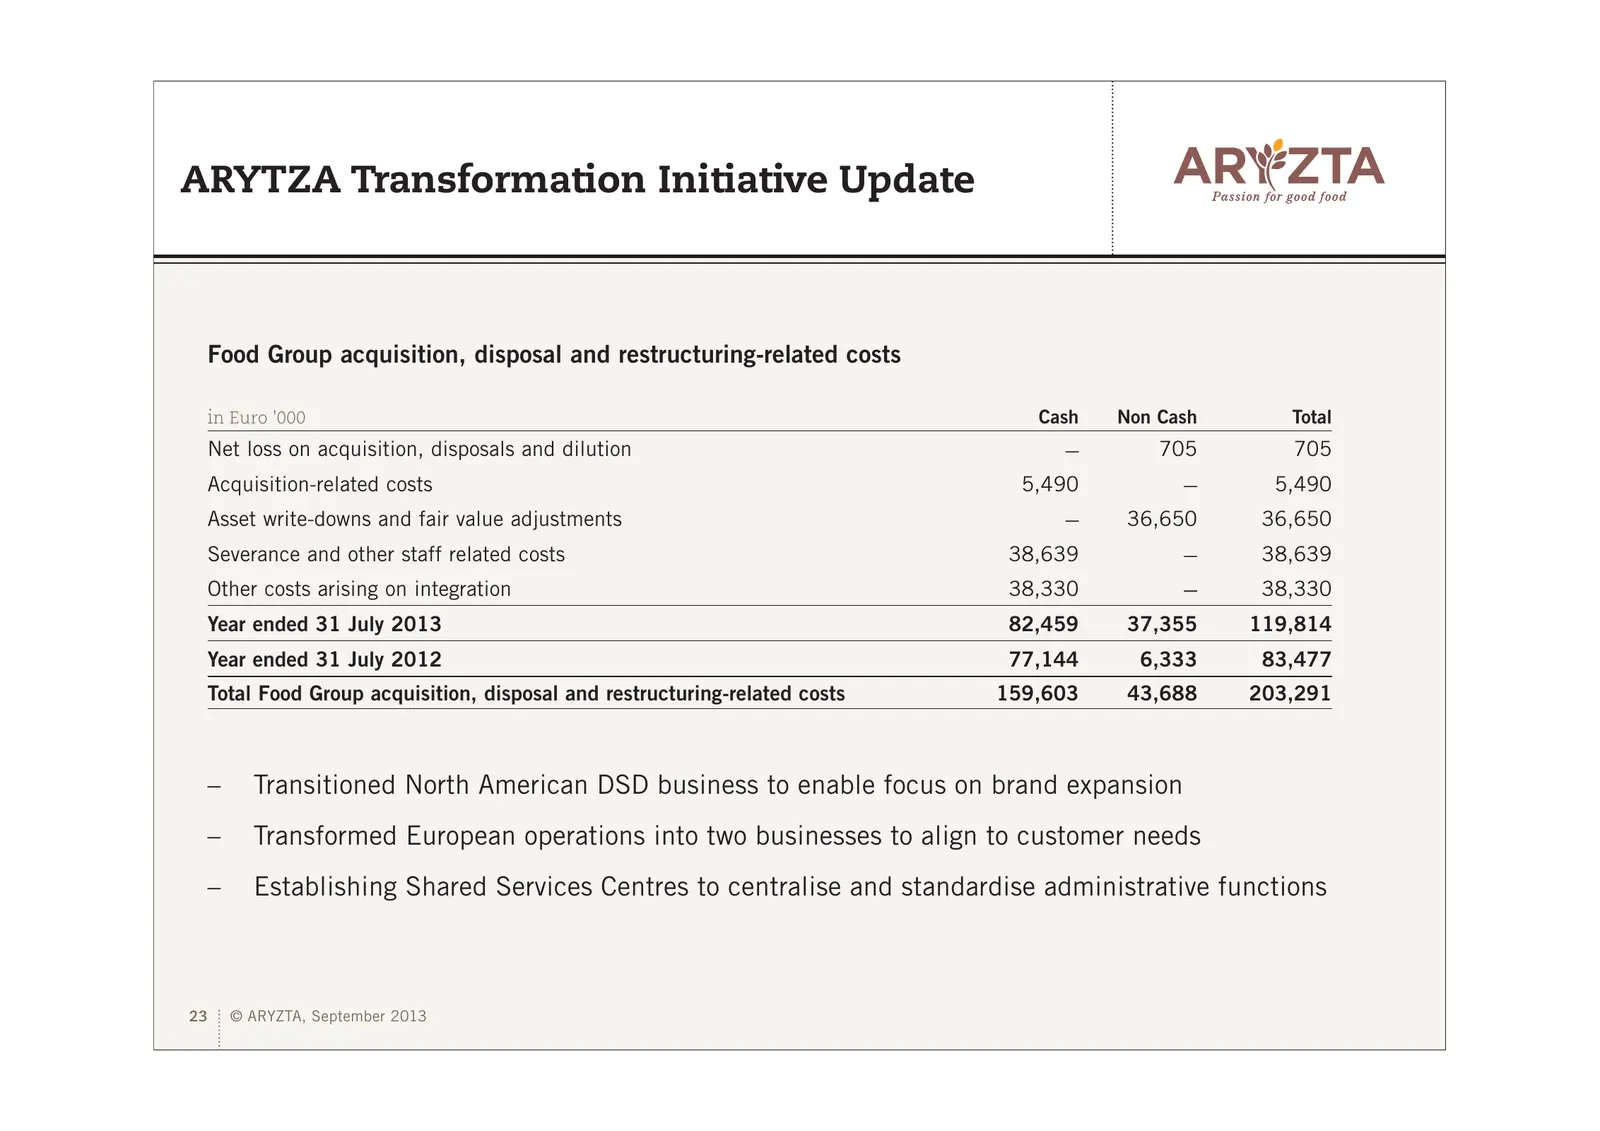
ARYTZA Transformation Initiative Update Food Group acquisition, disposal and restructuring-related costs in Euro '000 Cash Non Cash Total Net loss on acquisition, disposals and dilution – 705 705 Acquisition-related costs 5,490 – 5,490 Asset write-downs and fair value adjustments – 36,650 36,650 Sev
Slide 24: ARYZTA Transformation Initiative Update
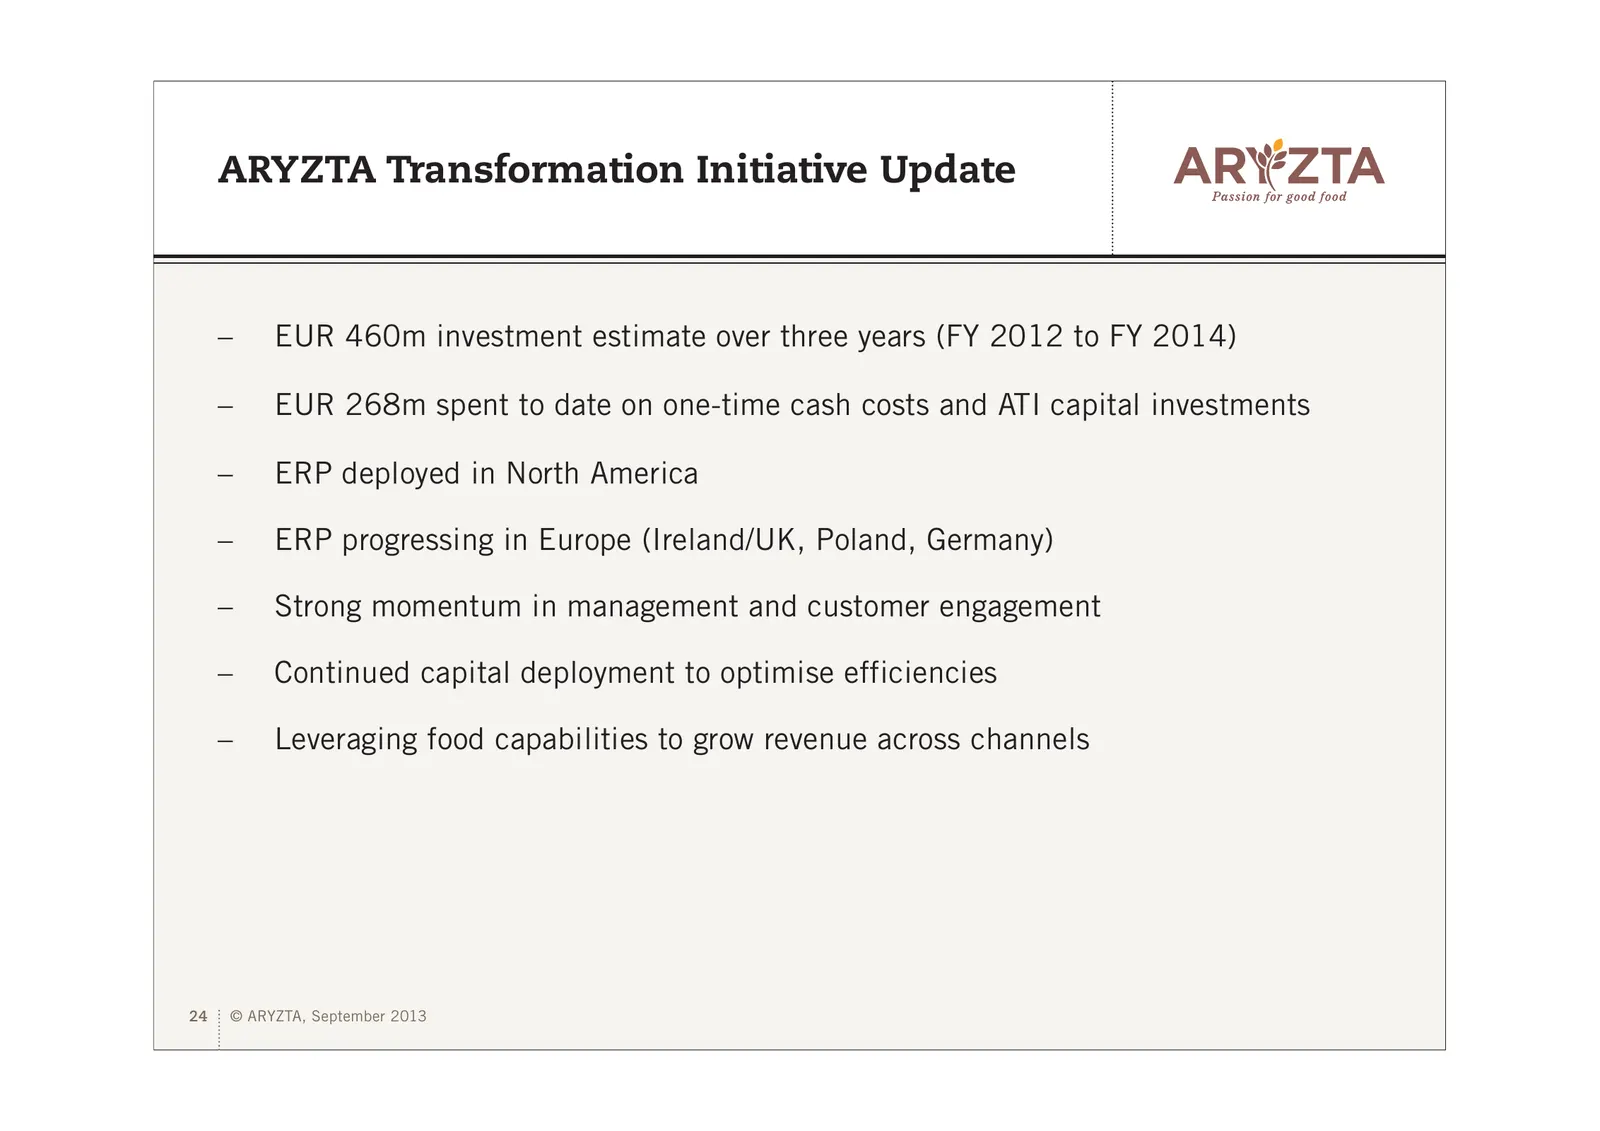
ARYZTA Transformation Initiative Update – EUR 460m investment estimate over three years (FY 2012 to FY 2014) – EUR 268m spent to date on one-time cash costs and ATI capital investments – ERP deployed in North America – ERP progressing in Europe (Ireland/UK, Poland, Germany) – Strong momentum in mana
Slide 25: Food Europe
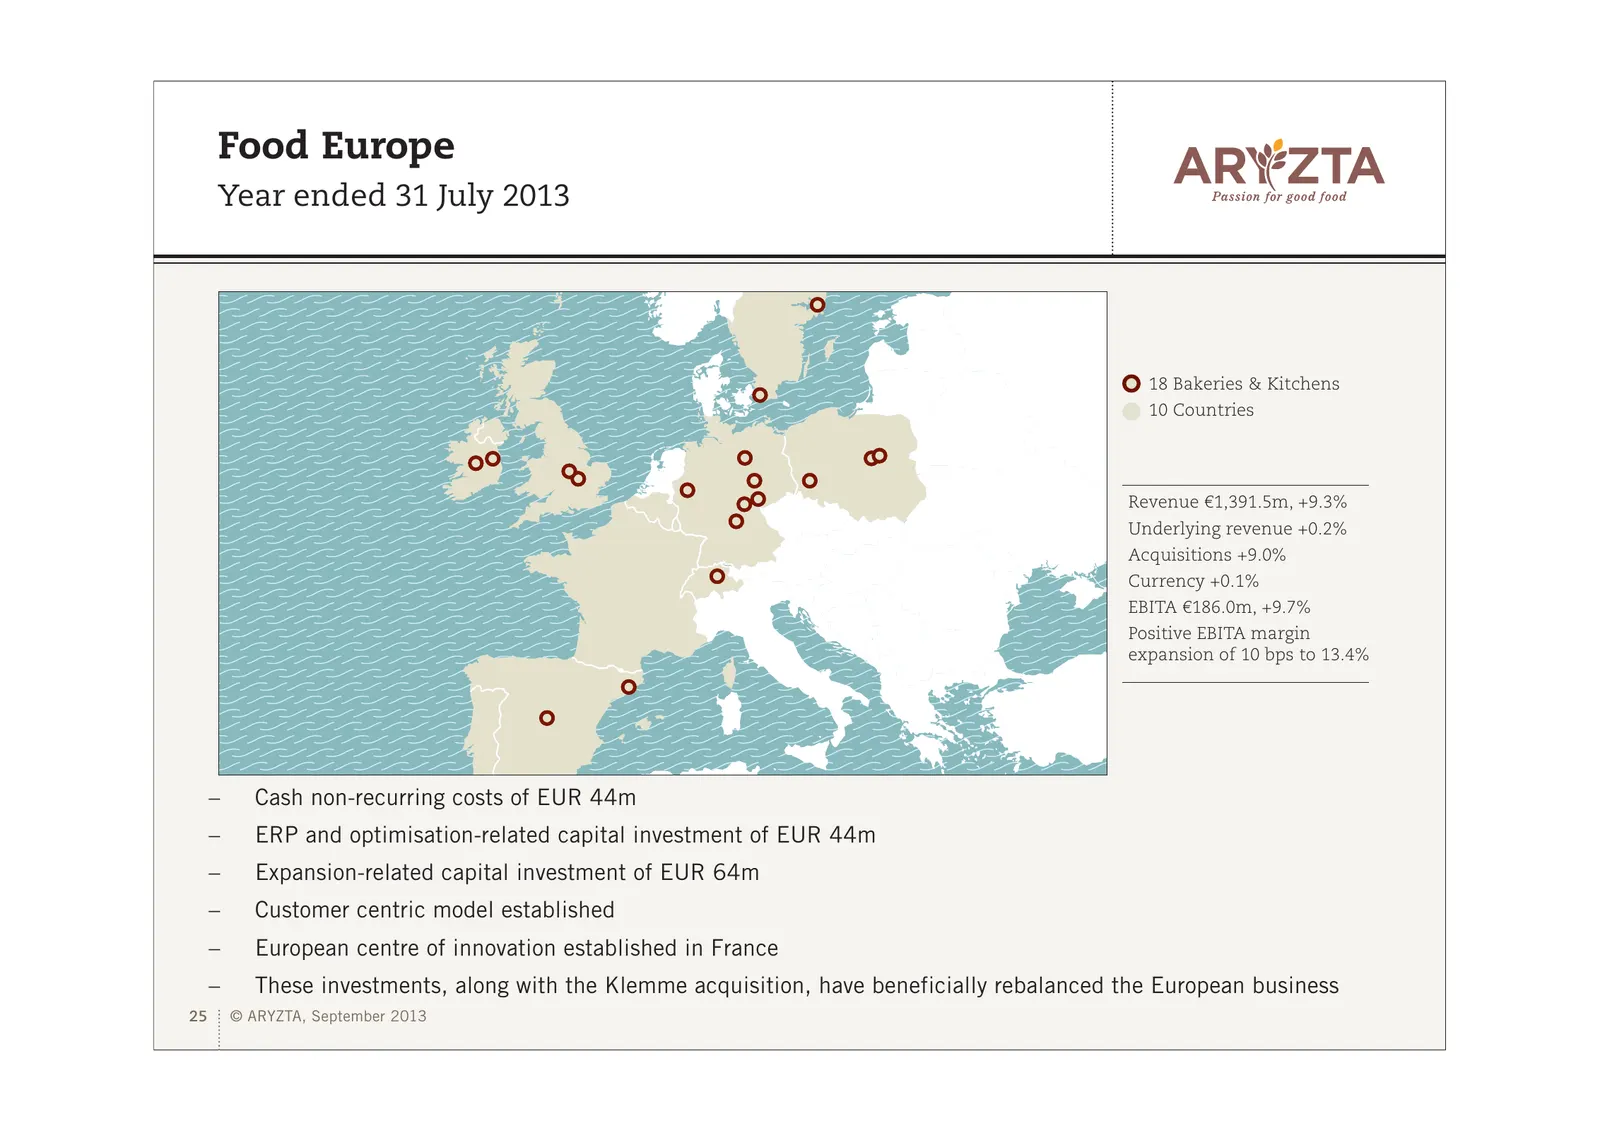
Food Europe Year ended 31 July 2013 18 Bakeries & Kitchens 10 Countries Revenue €1,391.5m, +9.3% Underlying revenue +0.2% Acquisitions +9.0% Currency +0.1% EBITA €186.0m, +9.7% Positive EBITA margin expansion of 10 bps to 13.4% – Cash non-recurring costs of EUR 44m – ERP and optimisation-related cap
Slide 26: Food North America
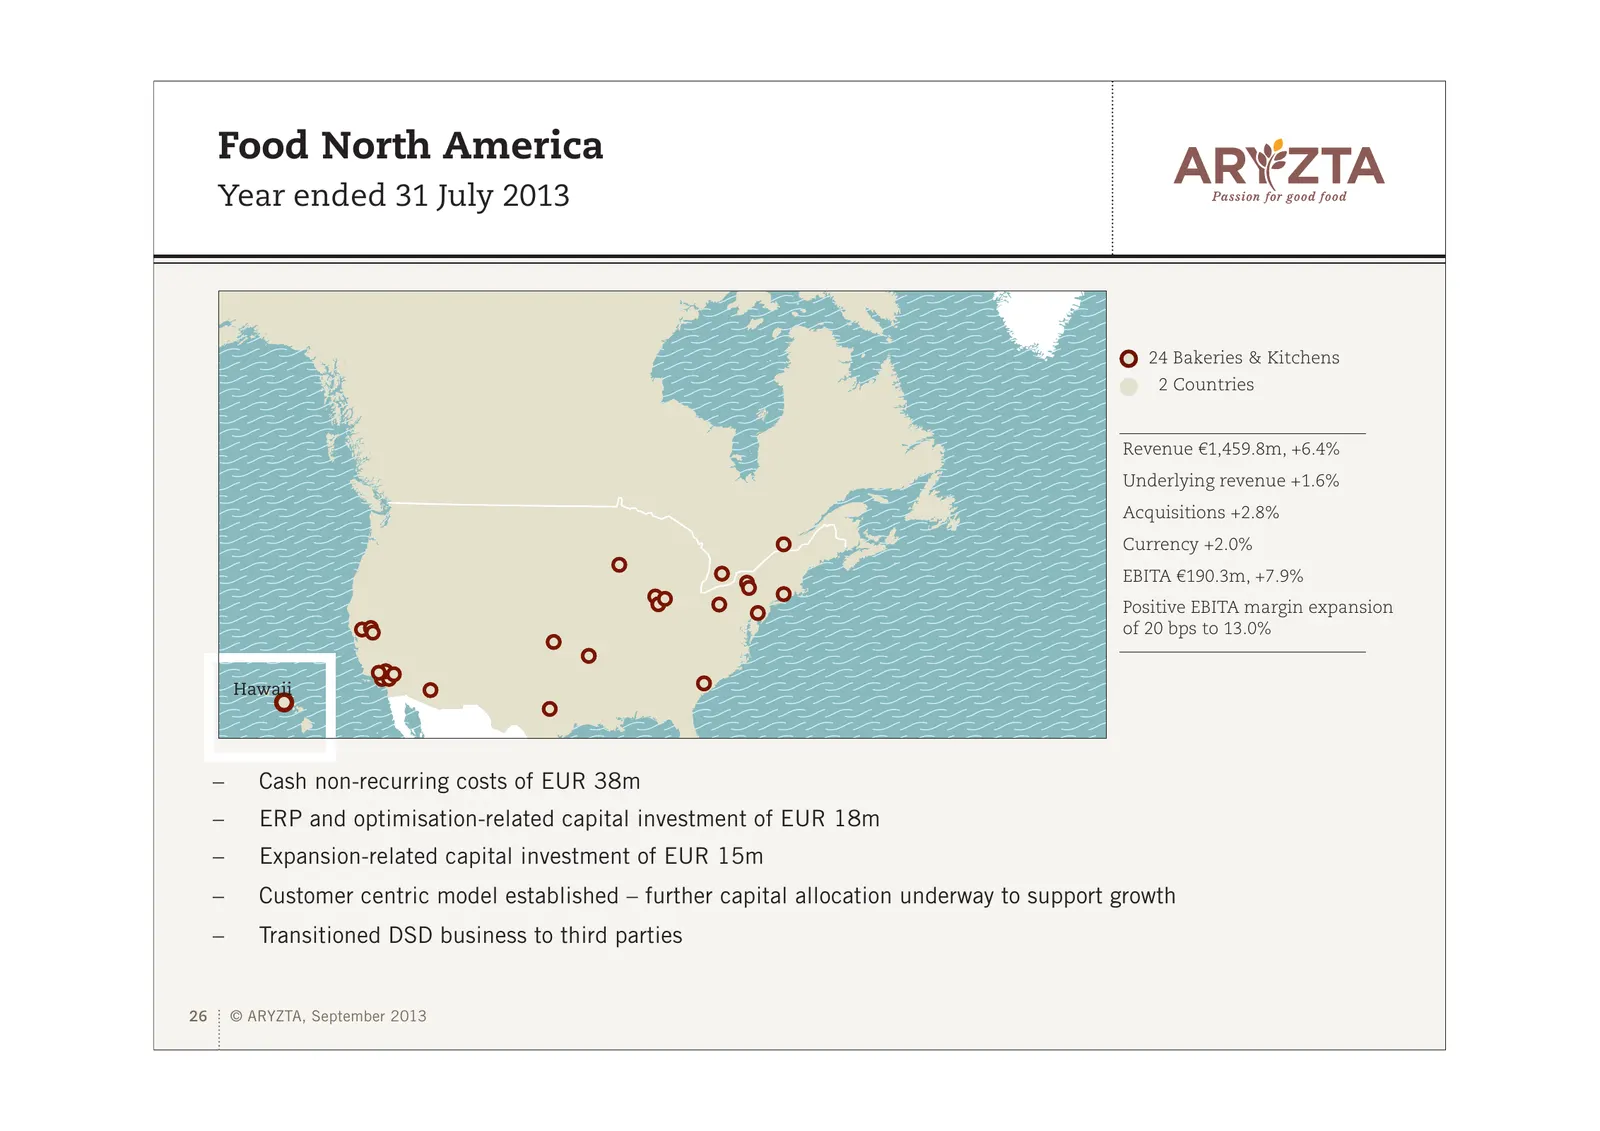
Food North America Year ended 31 July 2013 24 Bakeries & Kitchens 2 Countries Revenue €1,459.8m, +6.4% Underlying revenue +1.6% Acquisitions +2.8% Currency +2.0% EBITA €190.3m, +7.9% Positive EBITA margin expansion of 20 bps to 13.0% Hawaii – Cash non-recurring costs of EUR 38m – ERP and optimisatio
Slide 27: Food Rest of World
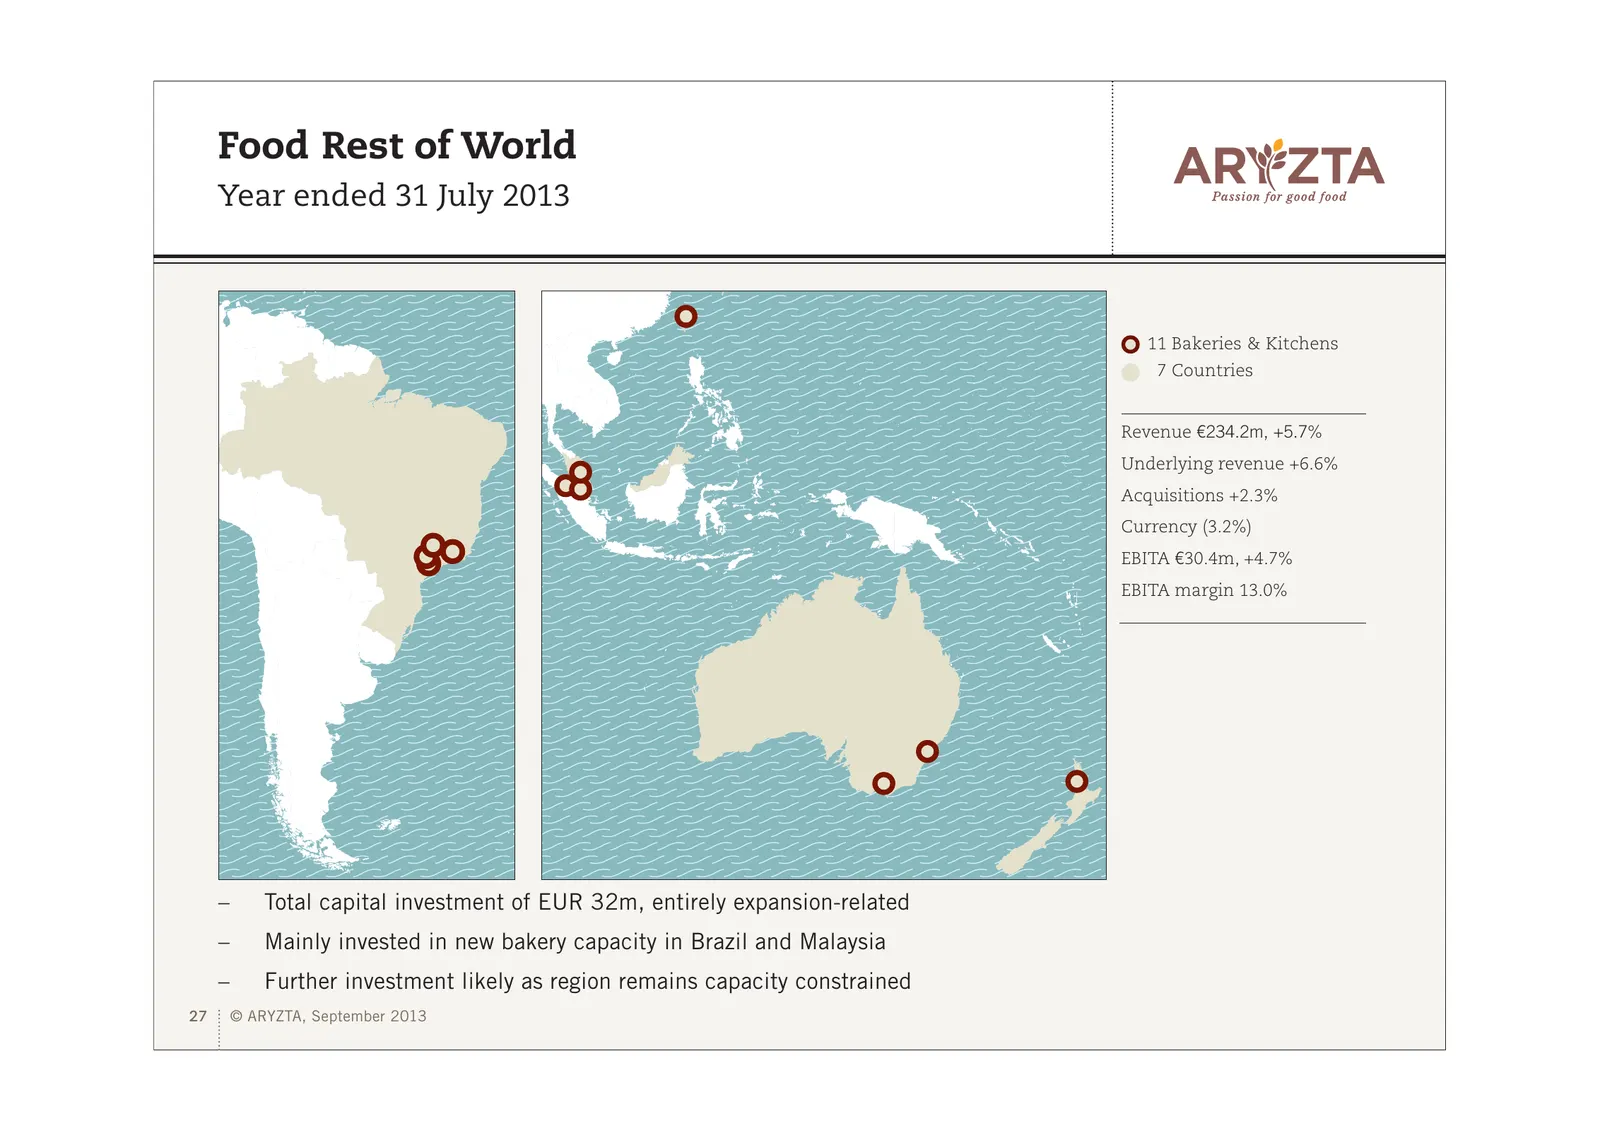
Food Rest of World Year ended 31 July 2013 11 Bakeries & Kitchens 7 Countries Revenue €234.2m, +5.7% Underlying revenue +6.6% Acquisitions +2.3% Currency (3.2%) EBITA €30.4m, +4.7% EBITA margin 13.0% – Total capital investment of EUR 32m, entirely expansion-related – Mainly invested in new bakery ca
Slide 28: Food Group Underlying Revenue Growth
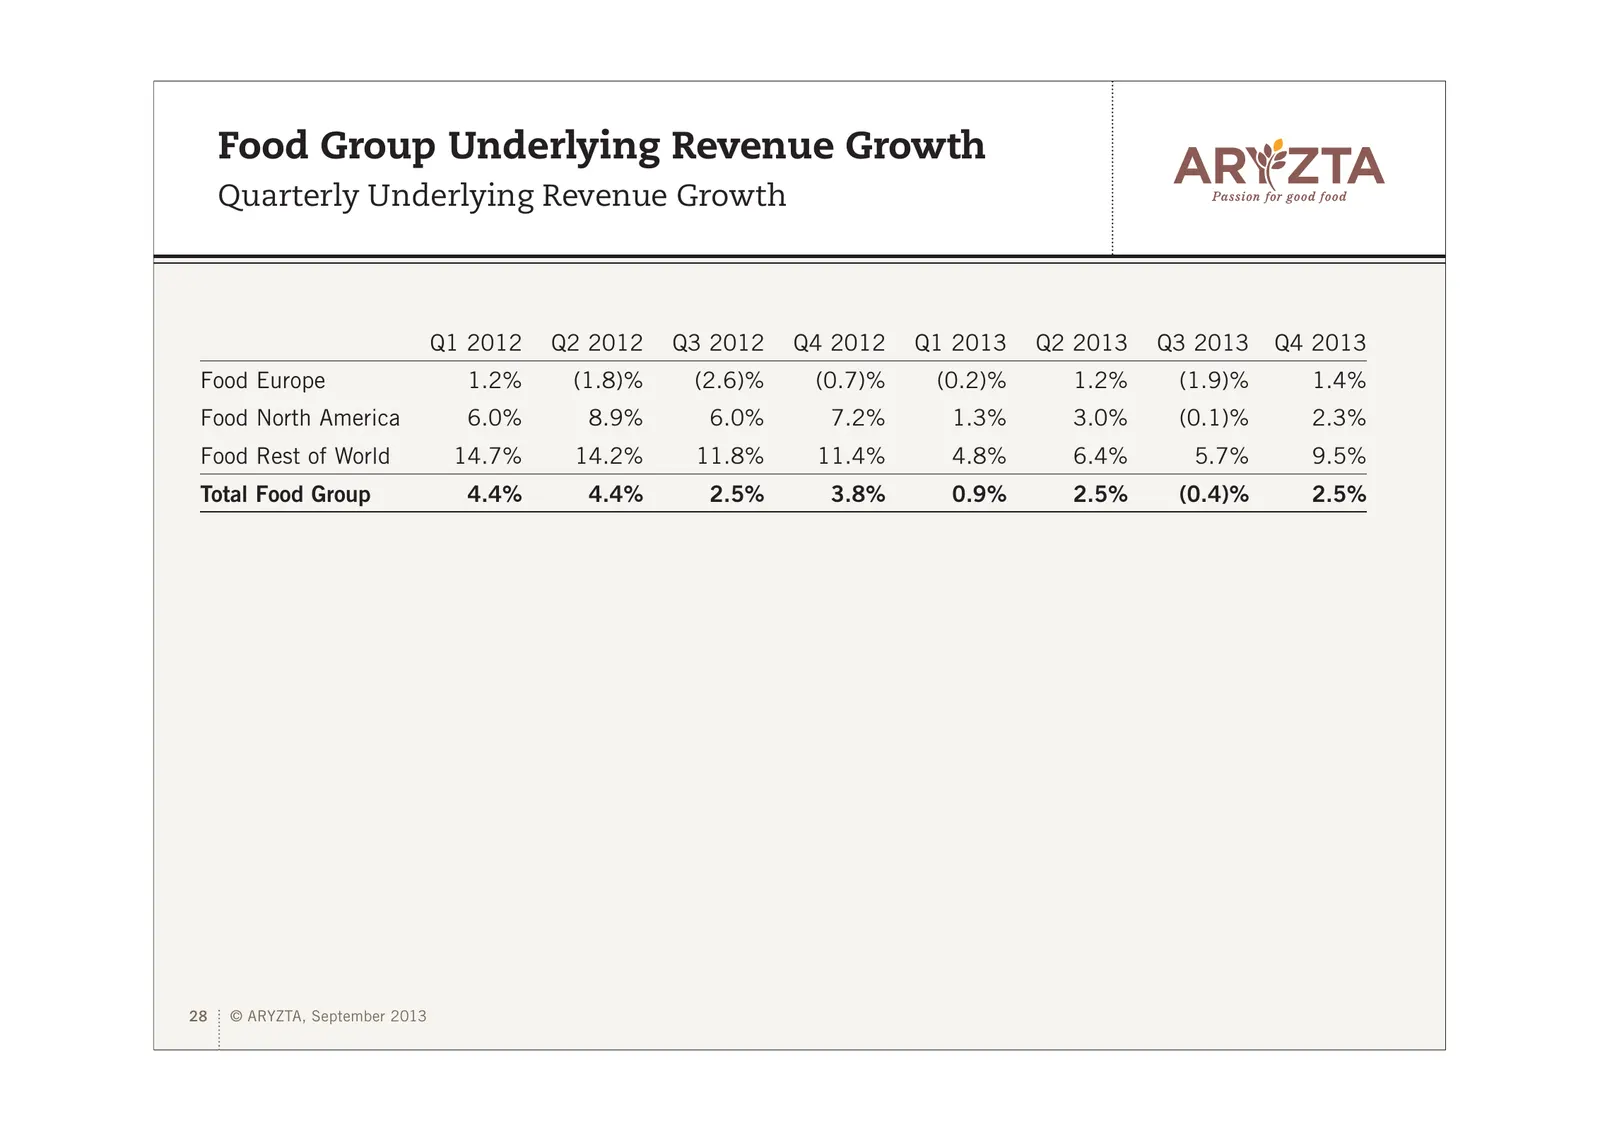
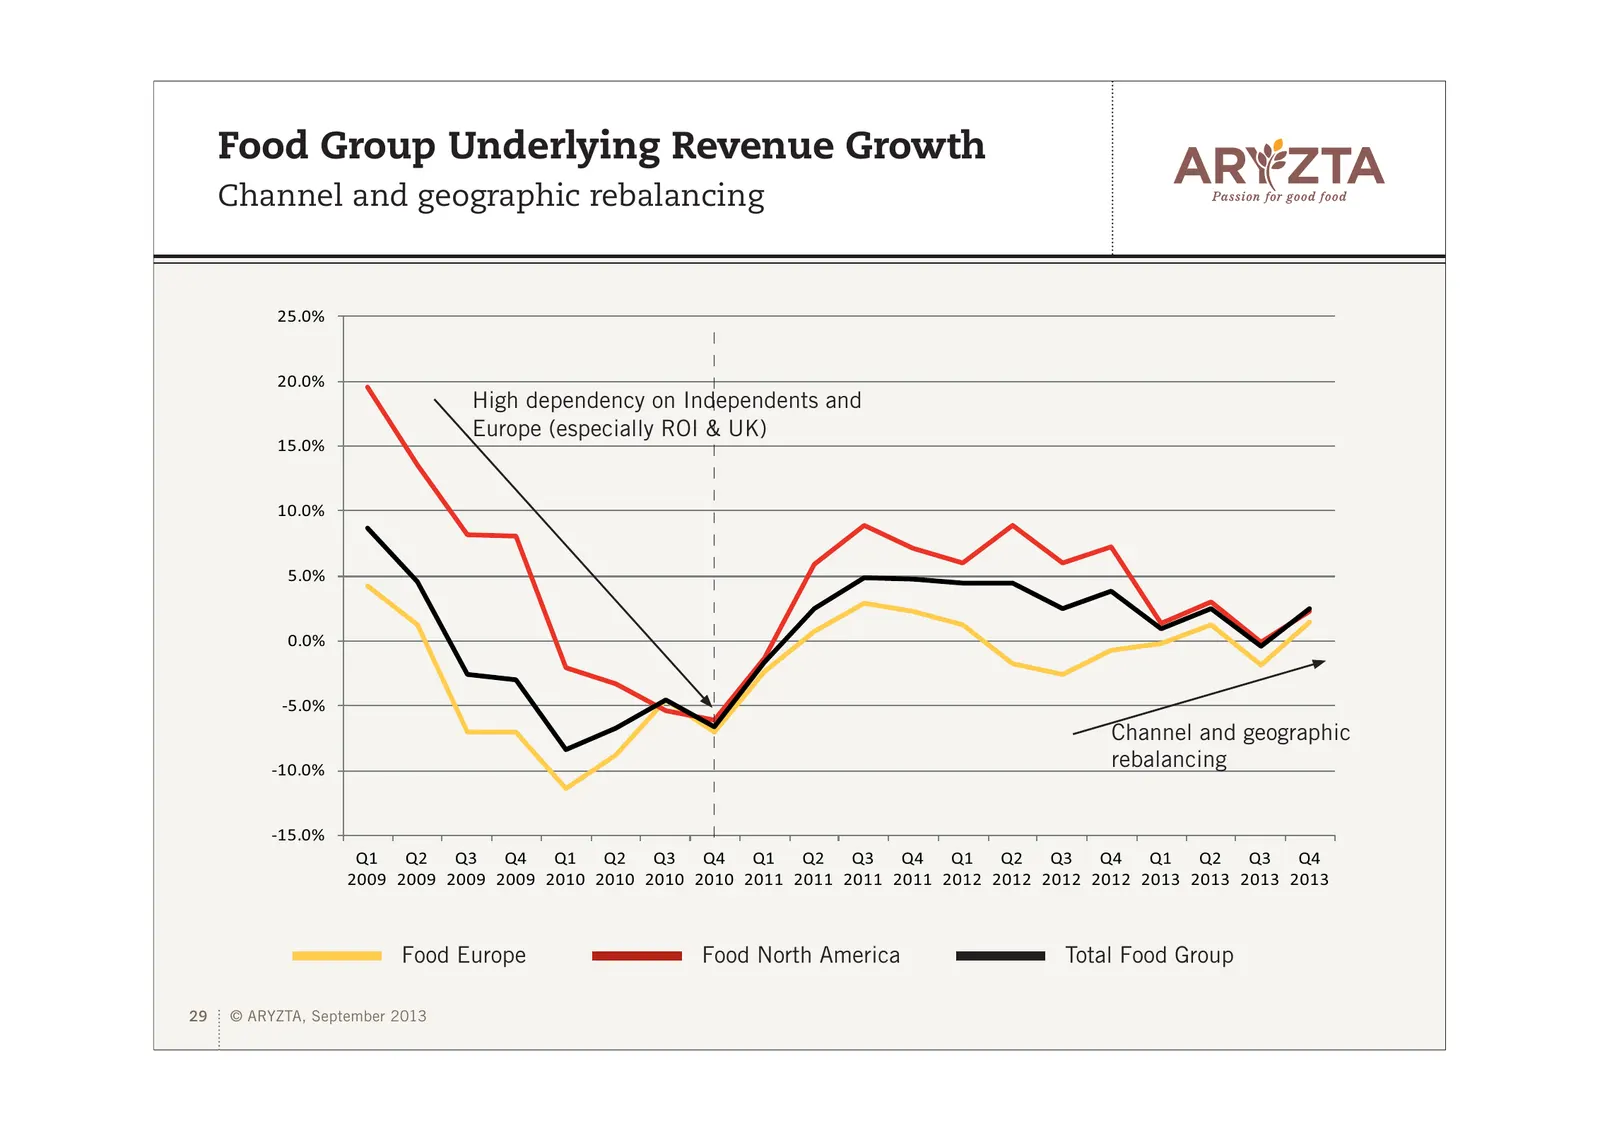
Food Group Underlying Revenue Growth Quarterly Underlying Revenue Growth Q1 2012 Q2 2012 Q3 2012 Q4 2012 Q1 2013 Q2 2013 Q3 2013 Q4 2013 Food Europe 1.2% (1.8)% (2.6)% (0.7)% (0.2)% 1.2% (1.9)% 1.4% Food North America 6.0% 8.9% 6.0% 7.2% 1.3% 3.0% (0.1)% 2.3% Food Rest of World 14.7% 14.2% 11.8% 11.
Slide 29: Food Group Underlying Revenue Growth
Food Group Underlying Revenue Growth Channel and geographic rebalancing 25.0% 20.0% High dependency on Independents and Europe (especially ROI & UK) 15.0% 10.0% 5.0% 0.0% -5.0% Channel and geographic -10.0% rebalancing -15.0% Q1 Q2 Q3 Q4 Q1 Q2 Q3 Q4 Q1 Q2 Q3 Q4 Q1 Q2 Q3 Q4 Q1 Q2 Q3 Q4 2009 2009 2009
Slide 30: Inflationary Input Trends
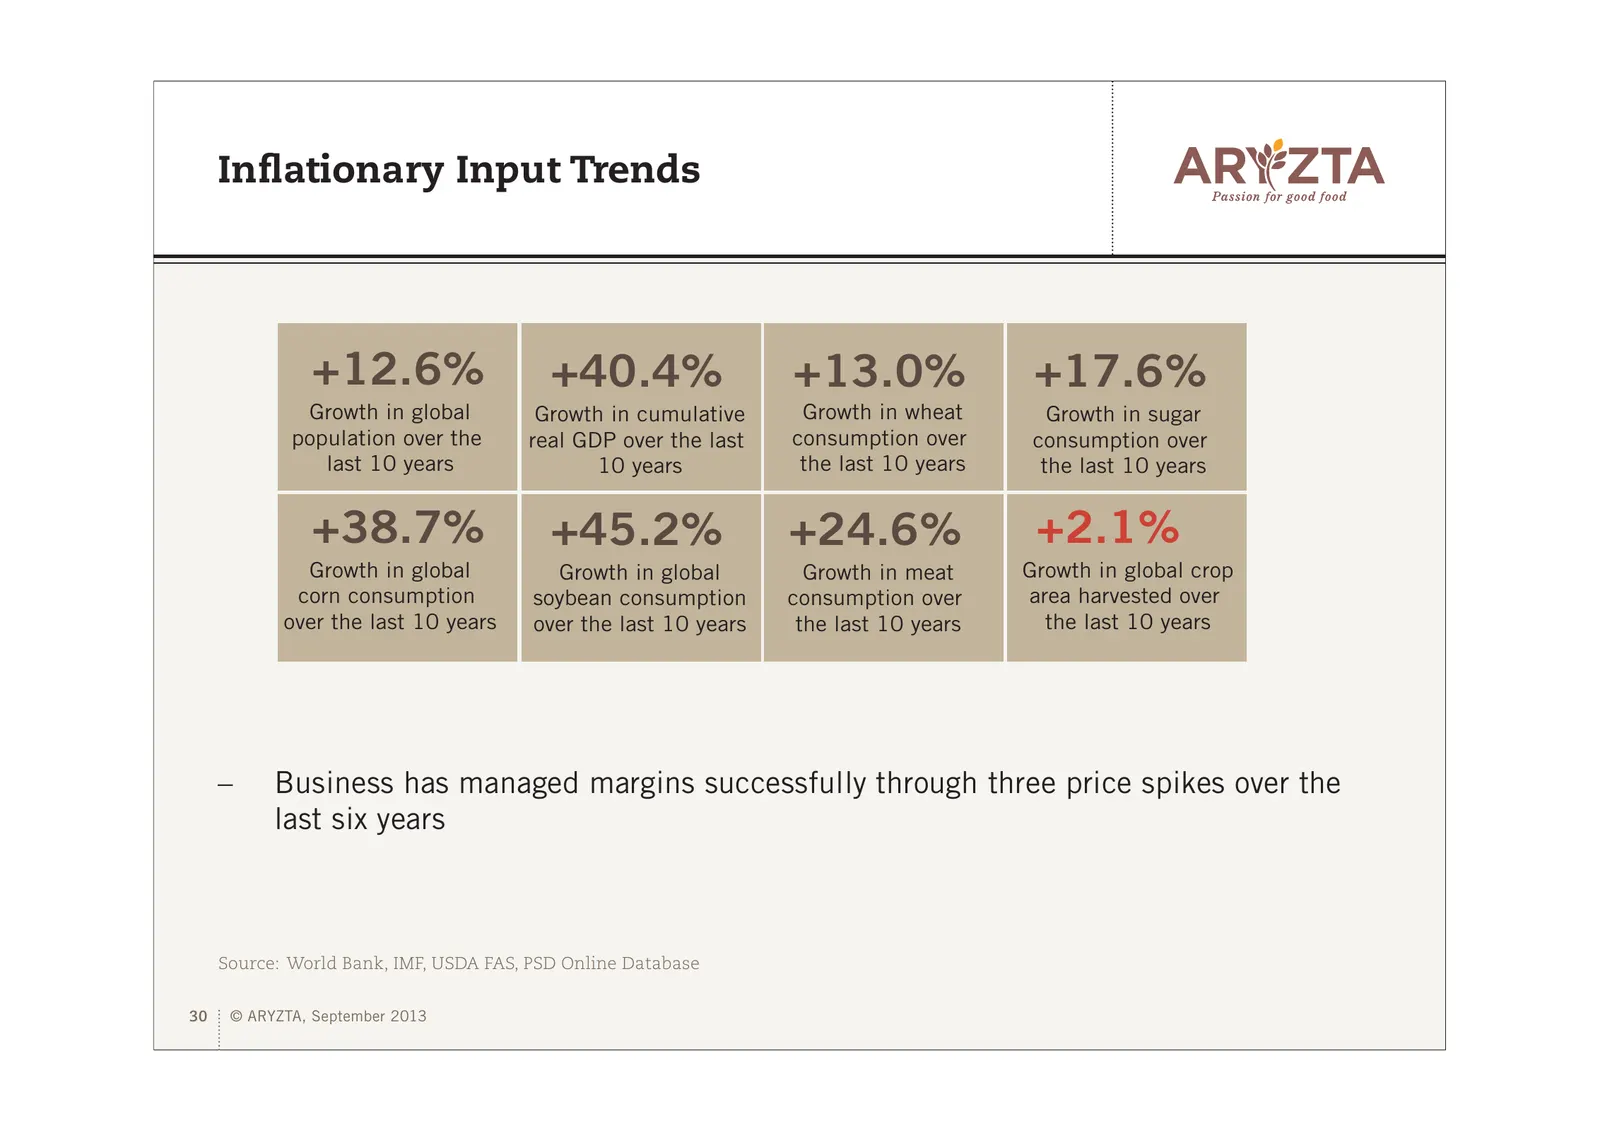
Inflationary Input Trends +12.6% +40.4% +13.0% +17.6% Growth in global Growth in cumulative Growth in wheat Growth in sugar population over the real GDP over the last consumption over consumption over last 10 years 10 years the last 10 years the last 10 years +38.7% +45.2% +24.6% +2.1% Growth in glo
Slide 31: Food Group Five Year KPIs
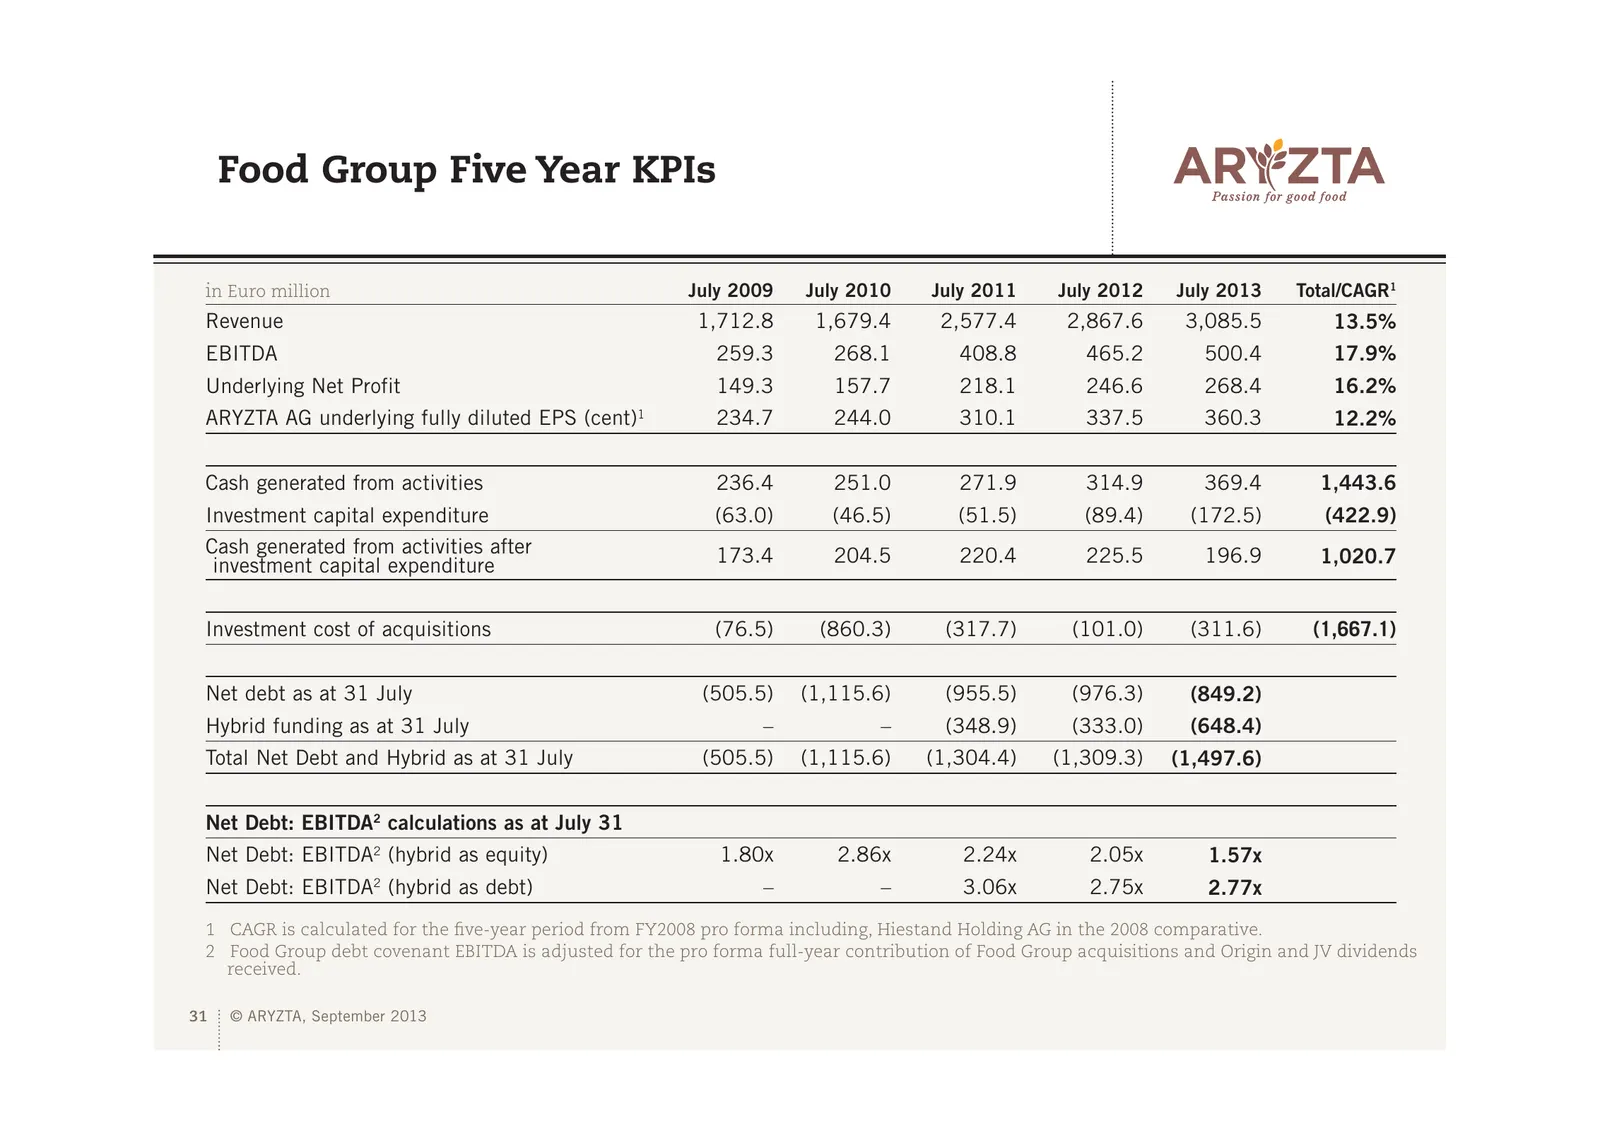
Food Group Five Year KPIs in Euro million July 2009 July 2010 July 2011 July 2012 July 2013 Total/CAGR1 Revenue 1,712.8 1,679.4 2,577.4 2,867.6 3,085.5 13.5% EBITDA 259.3 268.1 408.8 465.2 500.4 17.9% Underlying Net Profit 149.3 157.7 218.1 246.6 268.4 16.2% ARYZTA AG underlying fully diluted EPS (c
Slide 32: Food Group Strategic Roadmap
ARYZTA is a Leading International Food Group Food Group Strategic Roadmap 32 © ARYZTA, September 2013
Slide 33: Vision: Leadership in Speciality Foods Globally
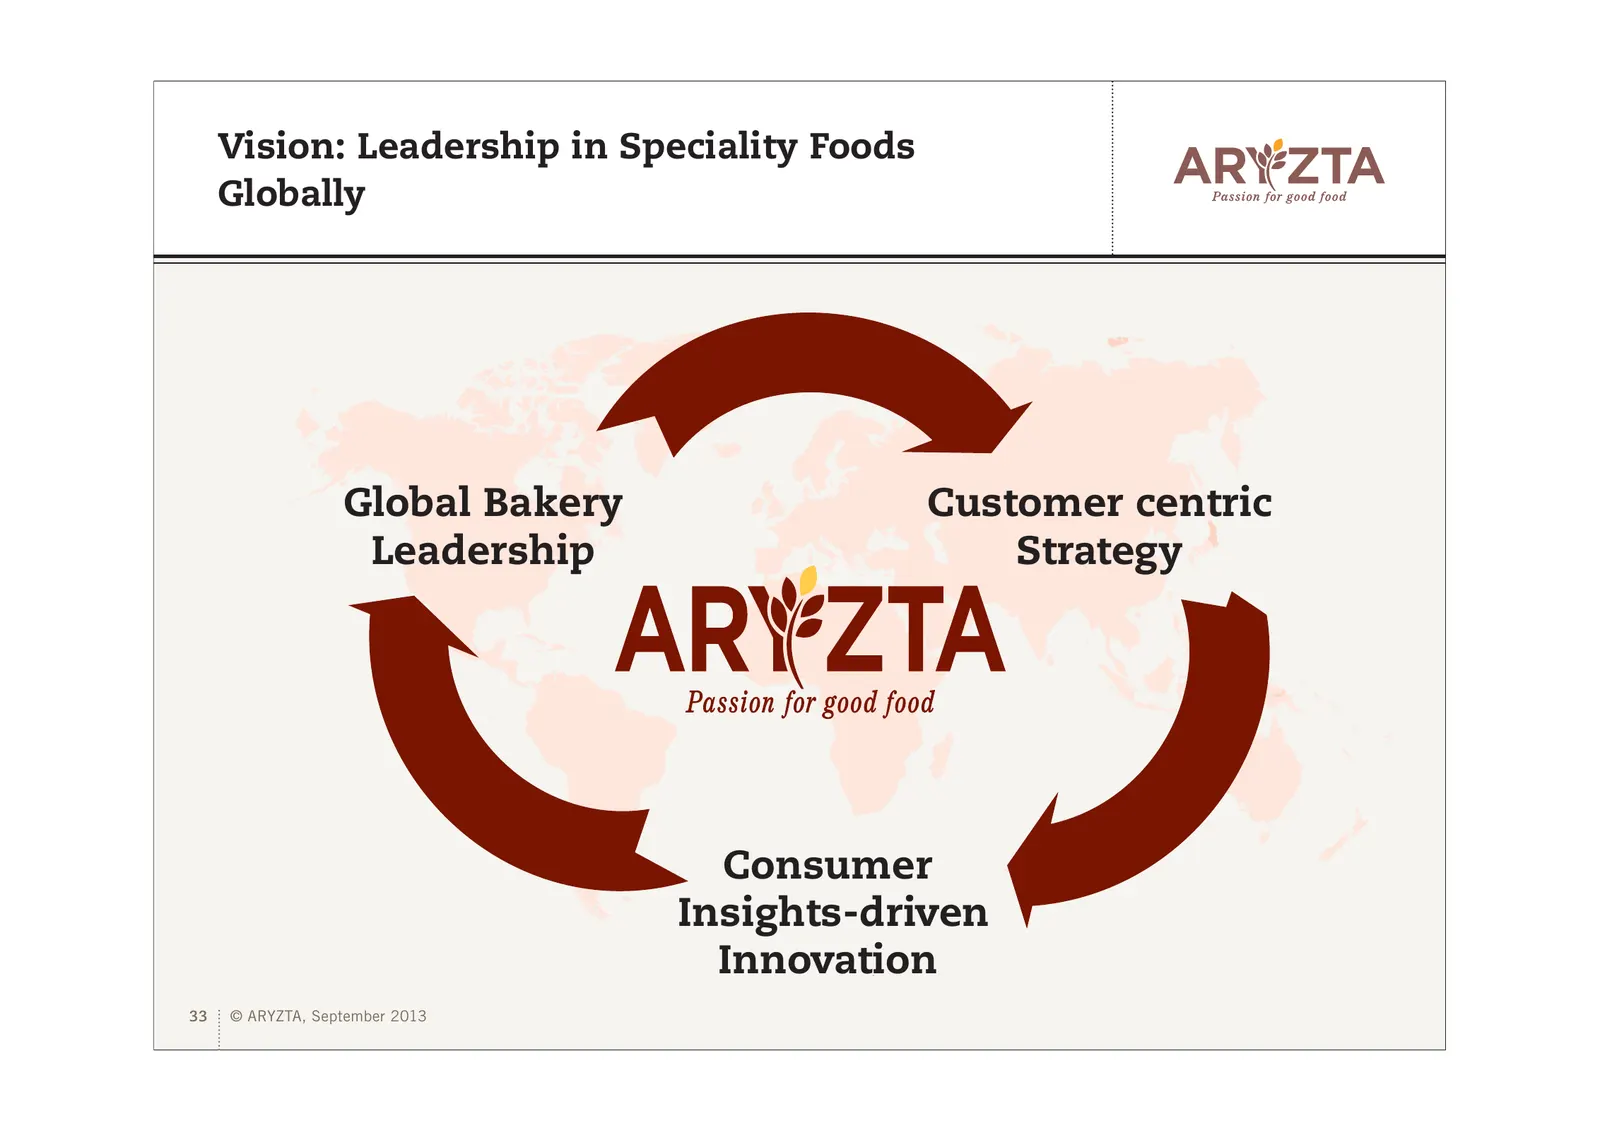
Vision: Leadership in Speciality Foods Globally Global Bakery Customer centric Leadership Strategy Consumer Insights-driven Innovation 33 © ARYZTA, September 2013
Slide 34: Total Global Bakery Market
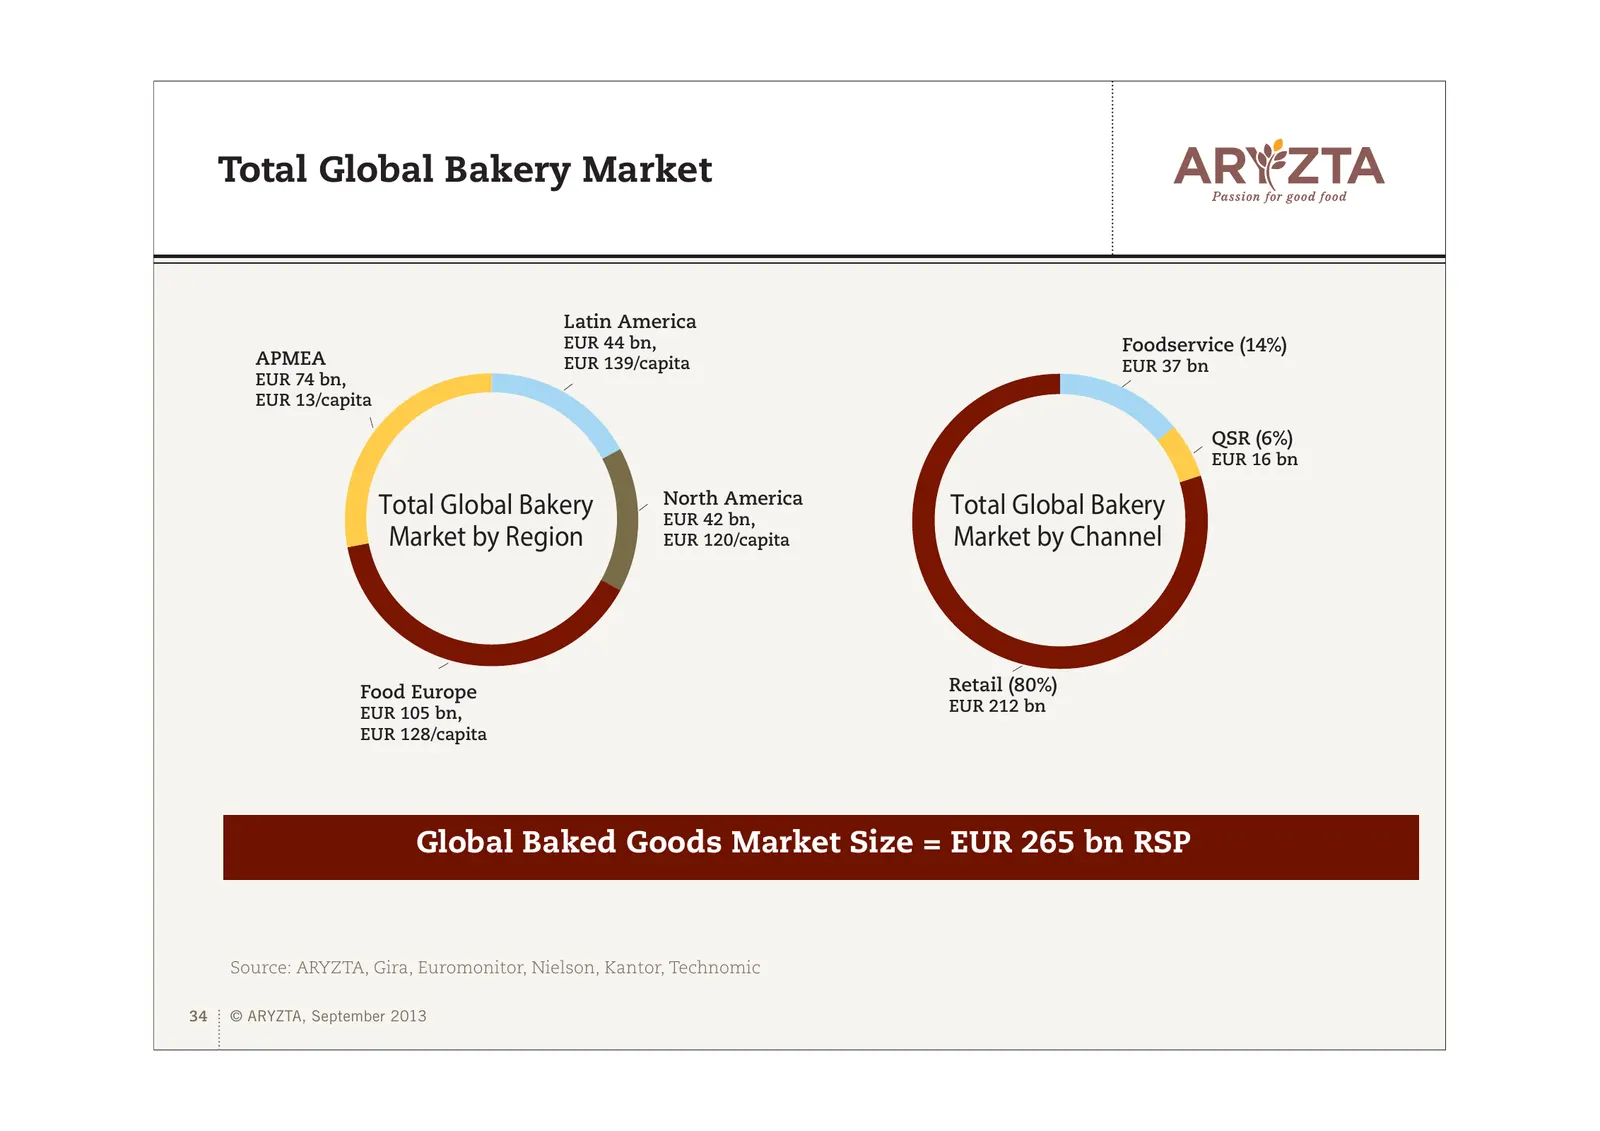
Total Global Bakery Market Latin America EUR 44 bn, Foodservice (14%) APMEA EUR 139/capita EUR 37 bn EUR 74 bn, EUR 13/capita QSR (6%) EUR 16 bn Total Global Bakery North America Total Global Bakery EUR 42 bn, Market by Region EUR 120/capita Market by Channel Food Europe Retail (80%) EUR 105 bn, EUR
Slide 35: Speciality Bakery/Bake-Off Opportunity for ARYZTA
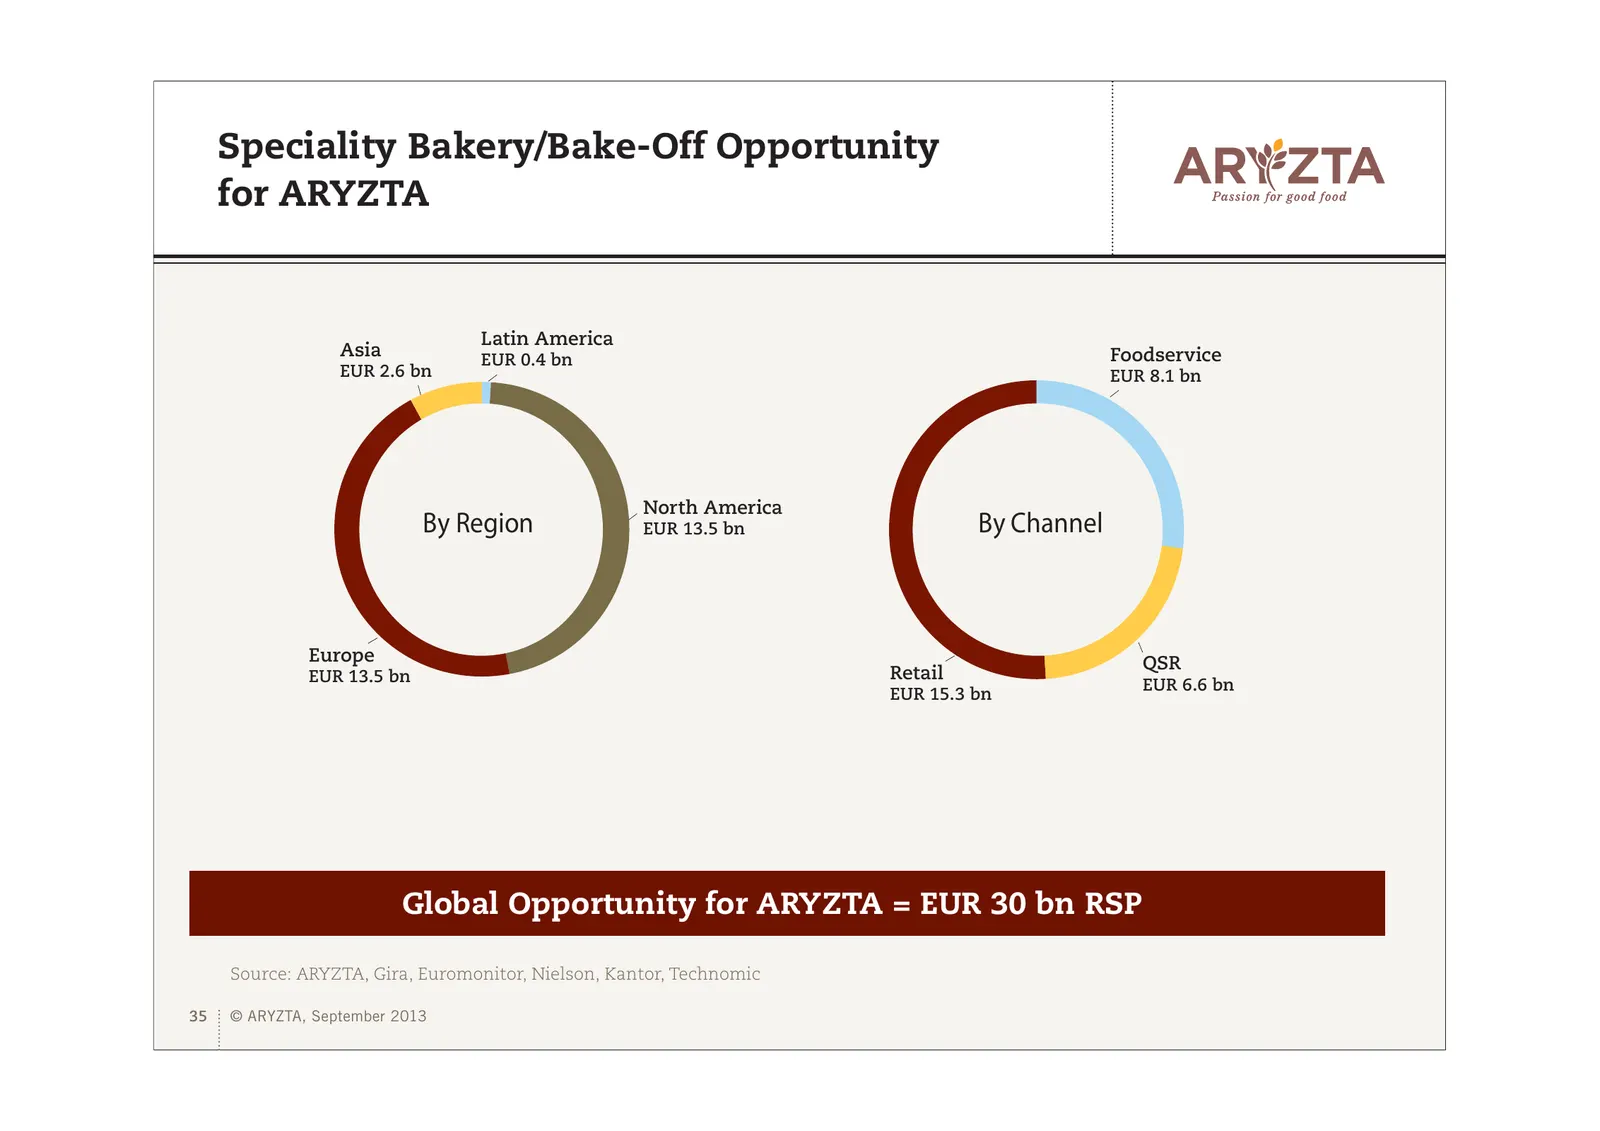
Speciality Bakery/Bake-Off Opportunity for ARYZTA Latin America Asia EUR 0.4 bn Foodservice EUR 2.6 bn EUR 8.1 bn North America By Region EUR 13.5 bn By Channel Europe QSR EUR 13.5 bn Retail EUR 6.6 bn EUR 15.3 bn Global Opportunity for ARYZTA = EUR 30 bn RSP Source: ARYZTA, Gira, Euromonitor, Niels
Slide 36: Global Bakery Market Drivers
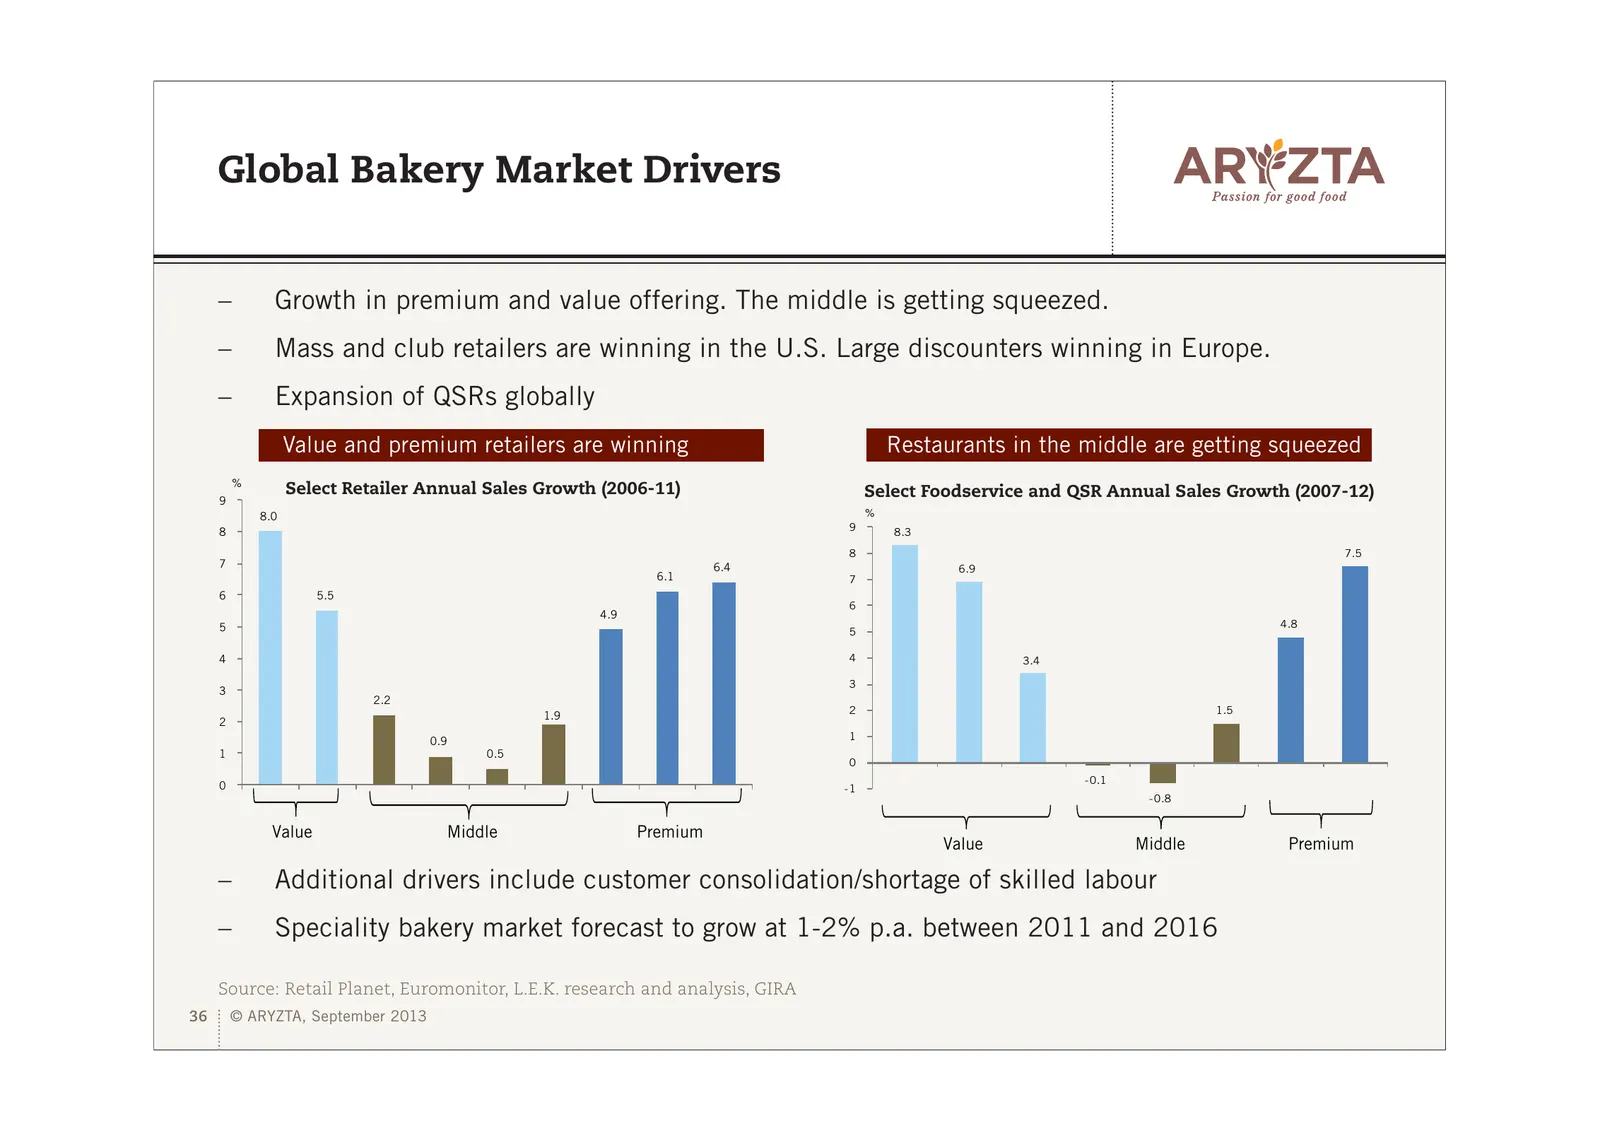
Global Bakery Market Drivers – Growth in premium and value offering. The middle is getting squeezed. – Mass and club retailers are winning in the U.S. Large discounters winning in Europe. – Expansion of QSRs globally Value and premium retailers are winning Restaurants in the middle are getting squee
Slide 37: Consumer Insights: Bakery Trends
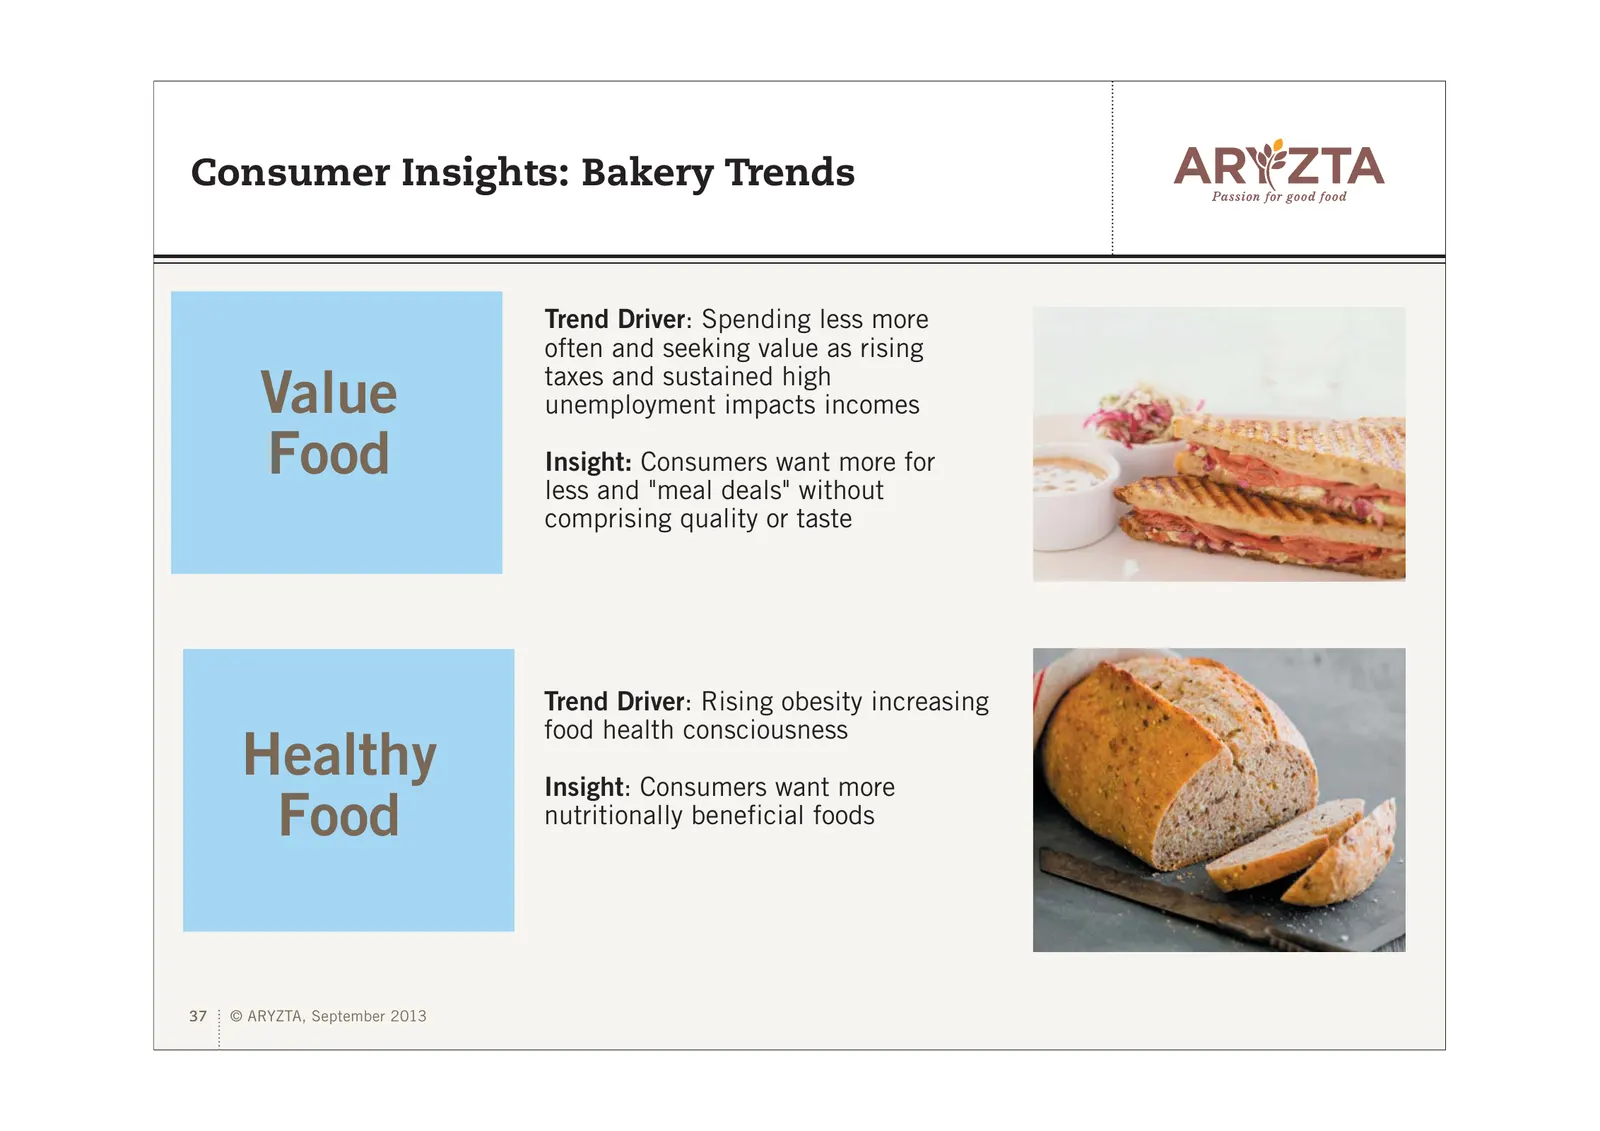
Consumer Insights: Bakery Trends Trend Driver: Spending less more often and seeking value as rising taxes and sustained high Value unemployment impacts incomes Food Insight: Consumers want more for less and "meal deals" without comprising quality or taste Trend Driver: Rising obesity increasing food
Slide 38: Consumer Insights: Bakery Trends
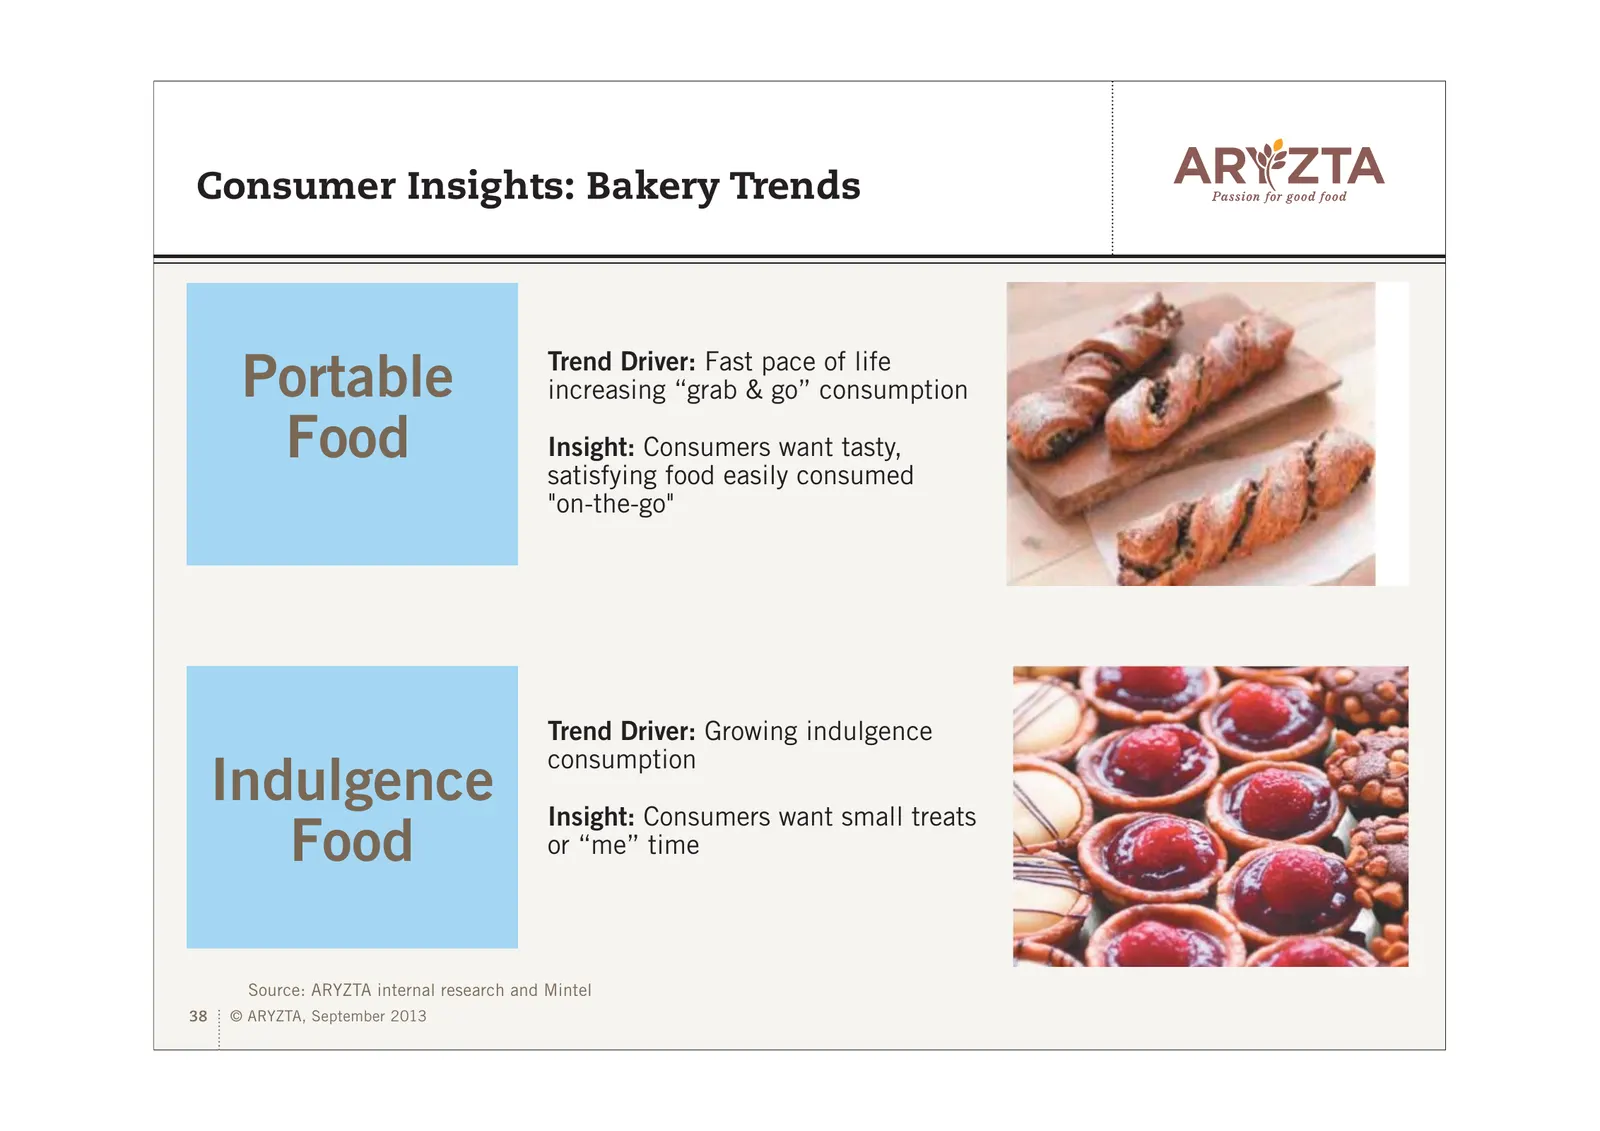
Consumer Insights: Bakery Trends Trend Driver: Fast pace of life Portable increasing “grab & go” consumption Food Insight: Consumers want tasty, satisfying food easily consumed "on-the-go" Trend Driver: Growing indulgence consumption Indulgence Insight: Consumers want small treats Food or “me” time
Slide 39: Key Customer Drivers in Global Bakery
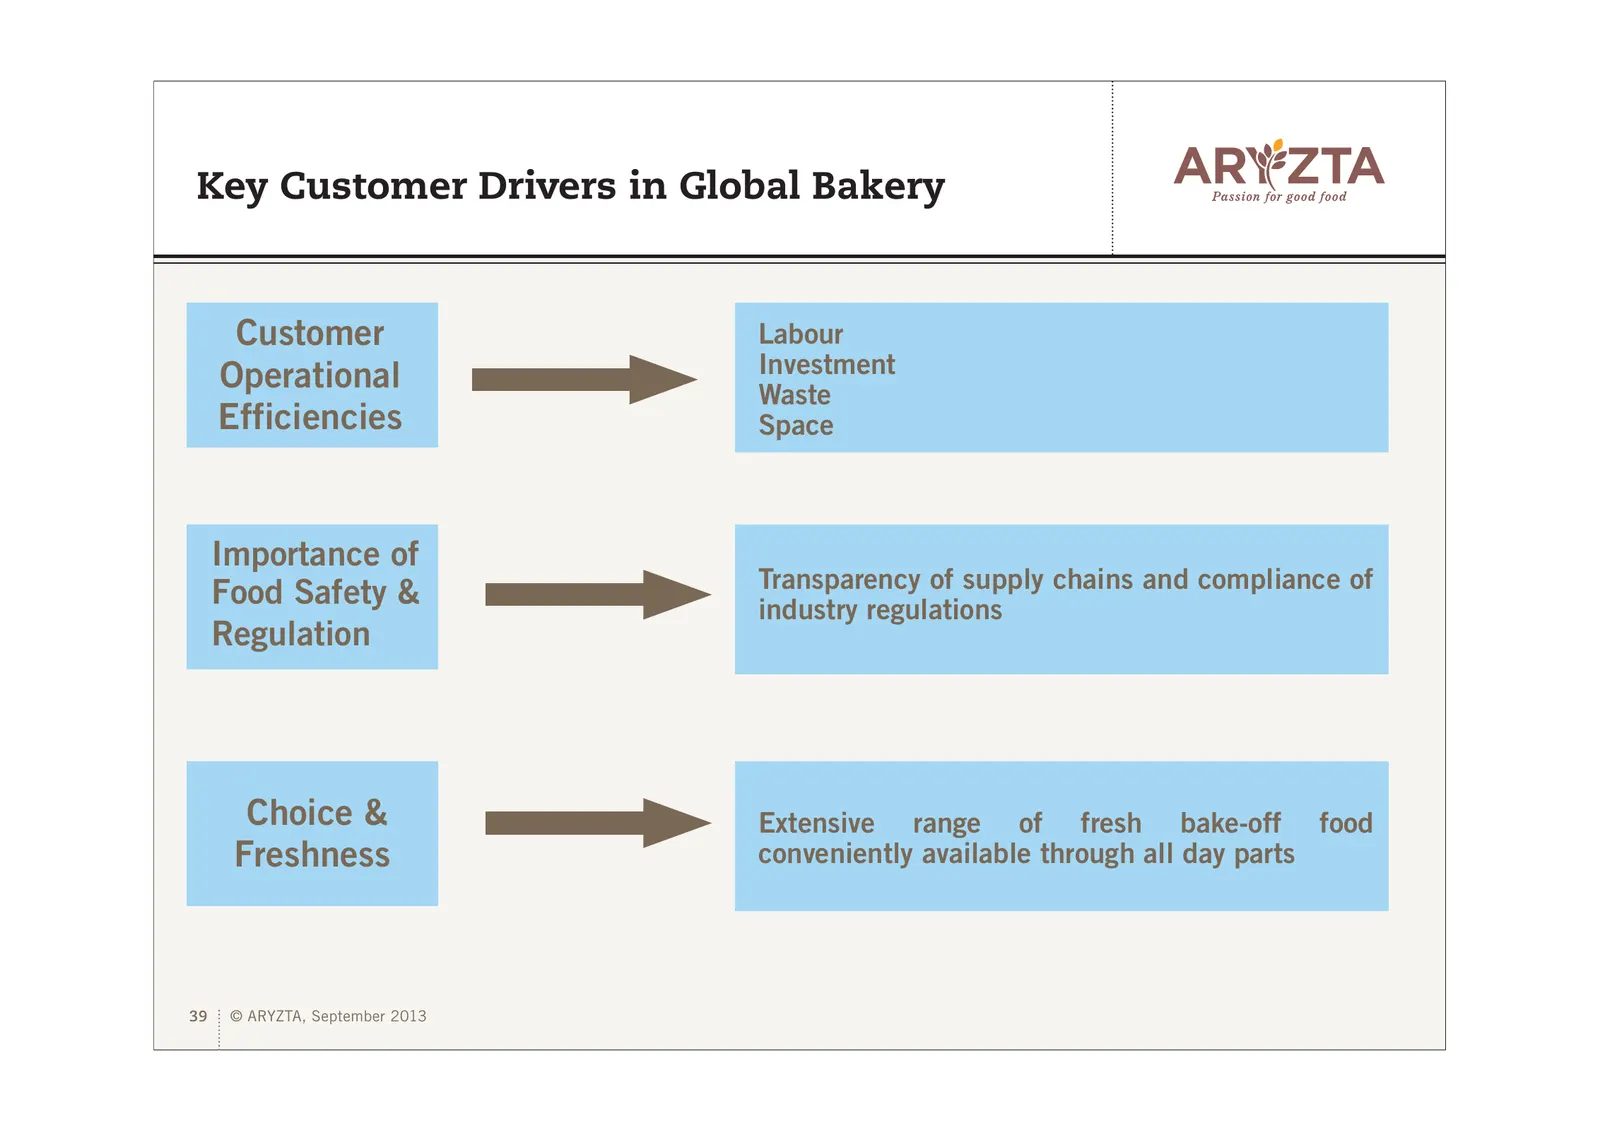
Key Customer Drivers in Global Bakery Customer Labour Operational Investment Waste Efficiencies Space Importance of Transparency of supply chains and compliance of Food Safety & industry regulations Regulation Choice & Extensive range of fresh bake-off food Freshness conveniently available through a
Slide 40: Our global Customer-Centric Strategy will enable us to win
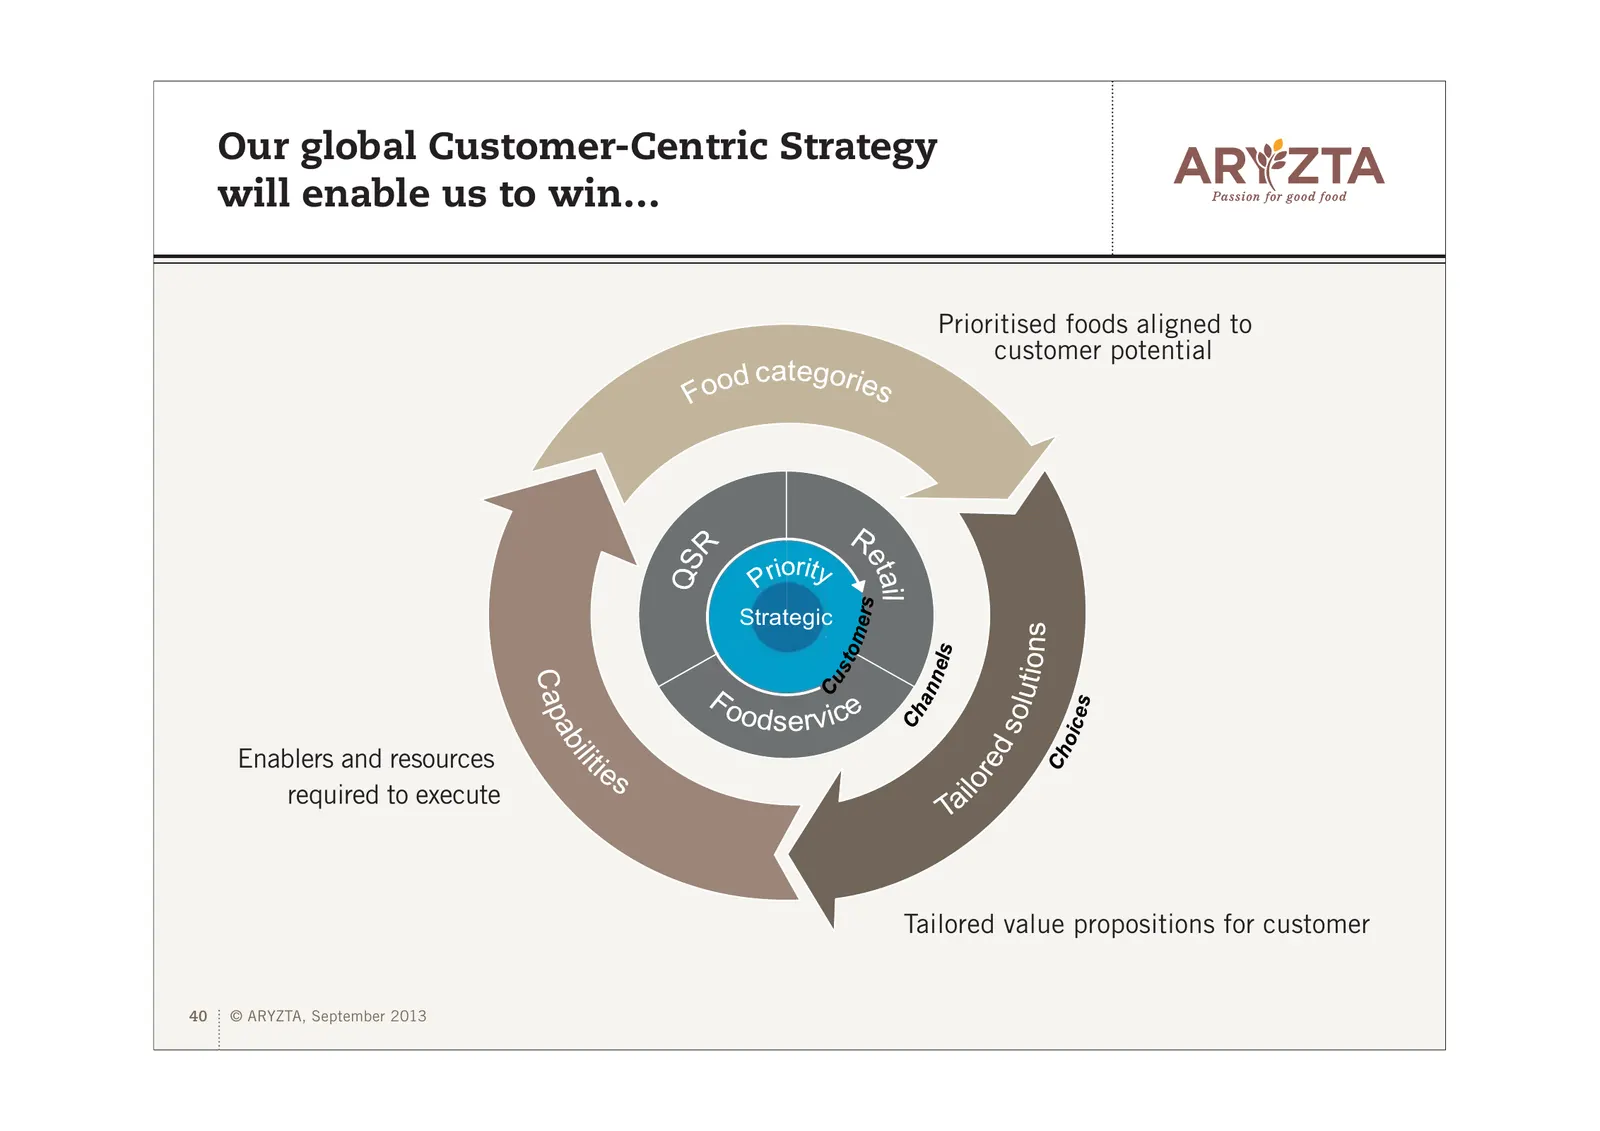
Our global Customer-Centric Strategy will enable us to win… Prioritised foods aligned to customer potential Strategic Enablers and resources required to execute Tailored value propositions for customer 40 © ARYZTA, September 2013
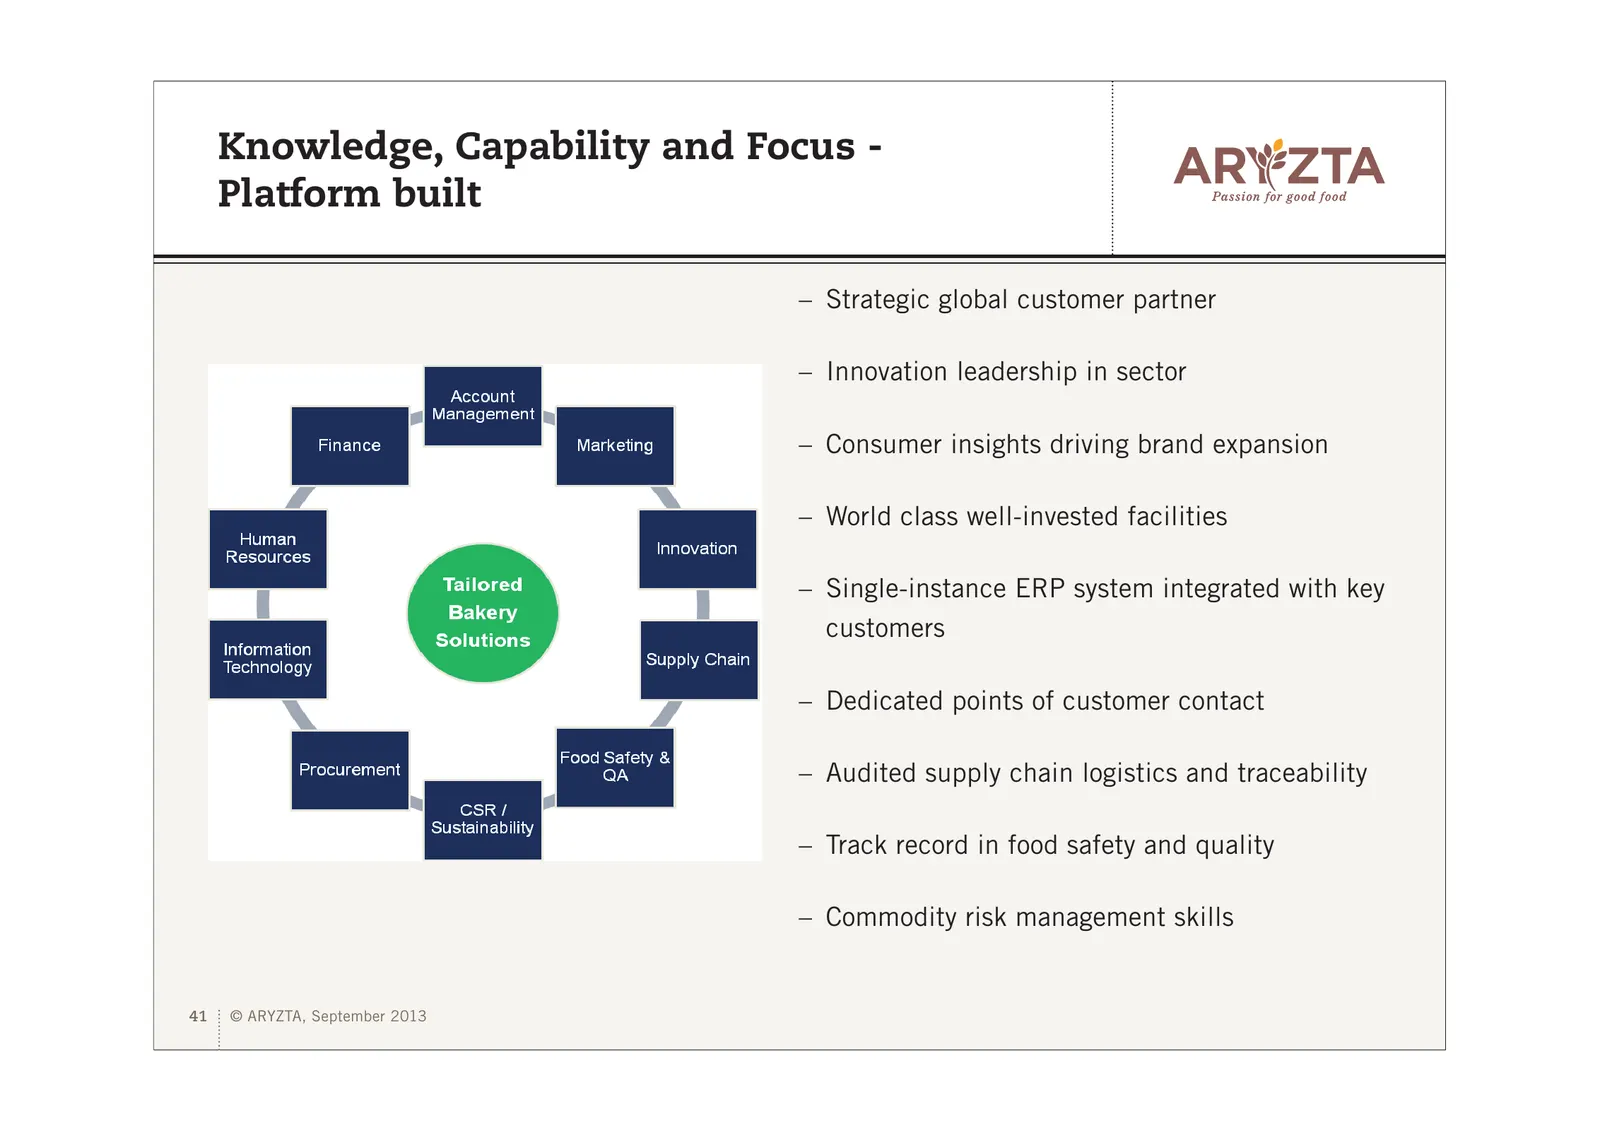
Slide 41: Knowledge, Capability and Focus - Platform built
Knowledge, Capability and Focus - Platform built – Strategic global customer partner – Innovation leadership in sector – Consumer insights driving brand expansion – World class well-invested facilities – Single-instance ERP system integrated with key customers – Dedicated points of customer contact
Slide 42: Strategic Focus and Outlook
Strategic Focus and Outlook – Speciality foods is an attractive growth segment – Leadership position in speciality bakery – Integrated customer centric model - responsibility centre management – Two years into a three year strategy – Focused on completion of ATI in FY 2014 – Excellent engagement by
Slide 43: Q&A – Food is our Core
Q&A Food is our Core 43 © ARYZTA, September 2013
Slide 44: Appendix – Origin Financials
ARYZTA AG Appendix 1 – Origin Financials 44 © ARYZTA, September 2013
Slide 45: Origin Income Statement
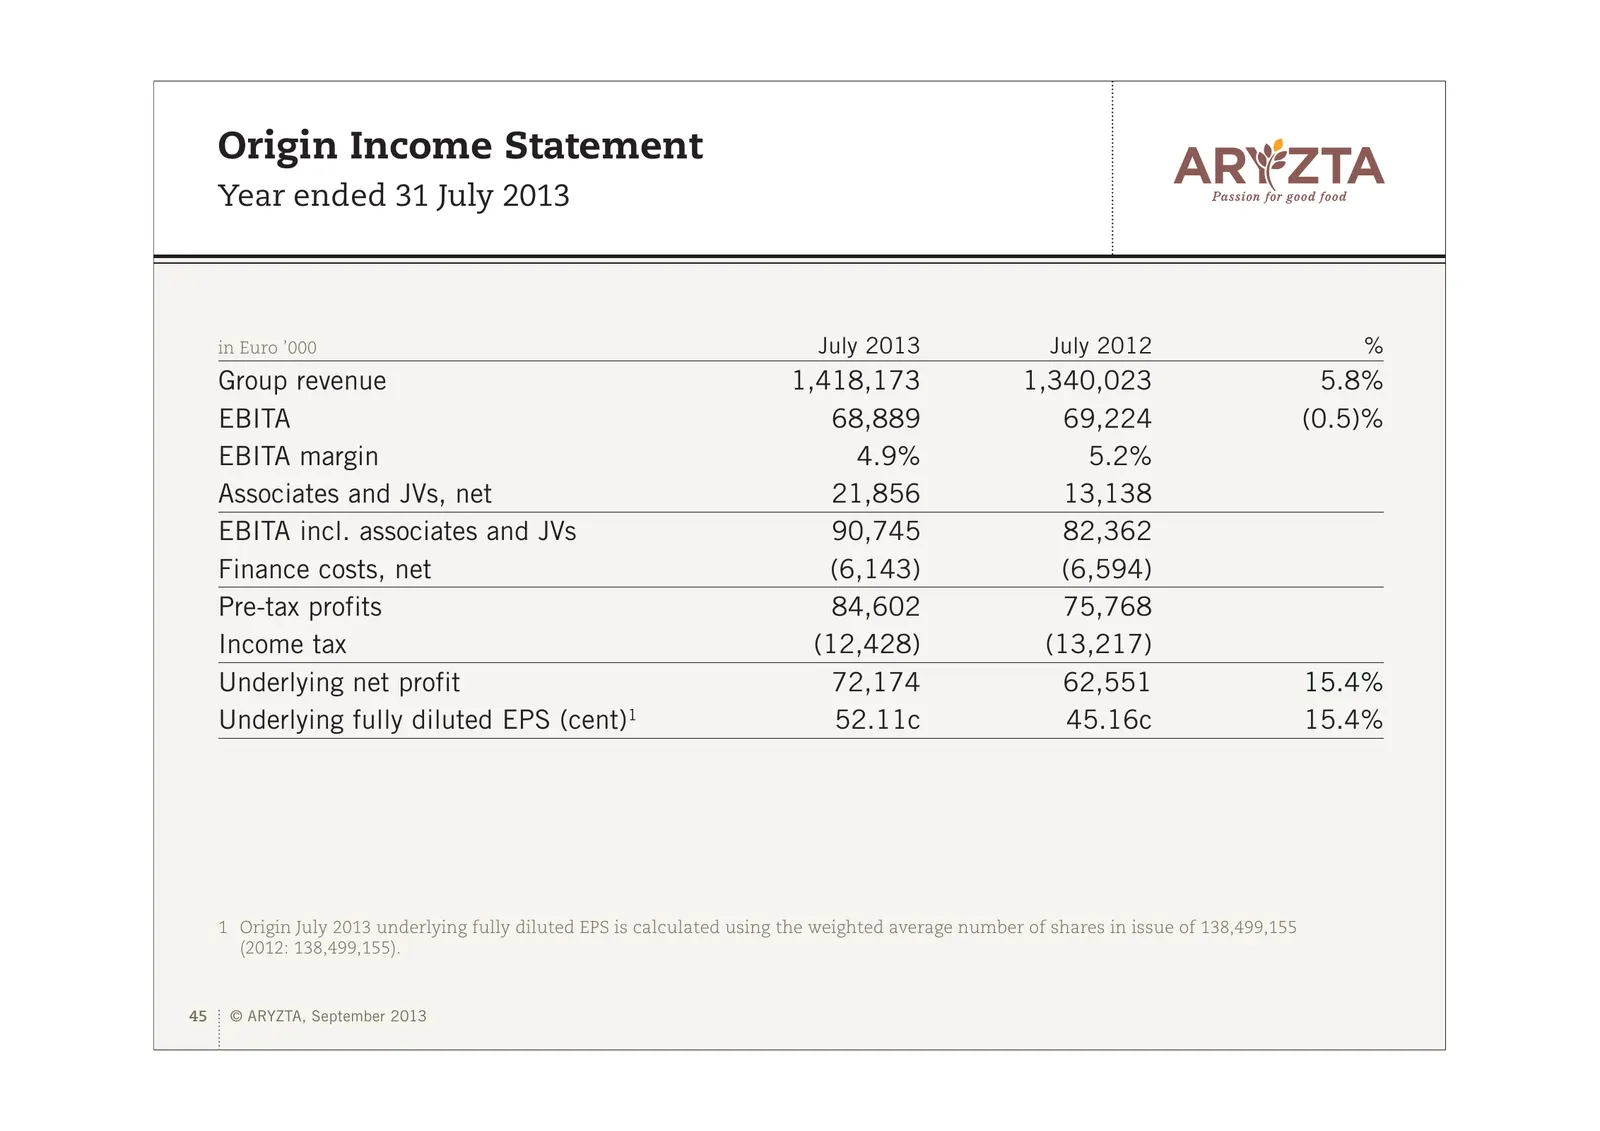
Origin Income Statement Year ended 31 July 2013 in Euro ’000 July 2013 July 2012 % Group revenue 1,418,173 1,340,023 5.8% EBITA 68,889 69,224 (0.5)% EBITA margin 4.9% 5.2% Associates and JVs, net 21,856 13,138 EBITA incl. associates and JVs 90,745 82,362 Finance costs, net (6,143) (6,594) Pre-tax pr
Slide 46: Origin Underlying Net Profit Rec.
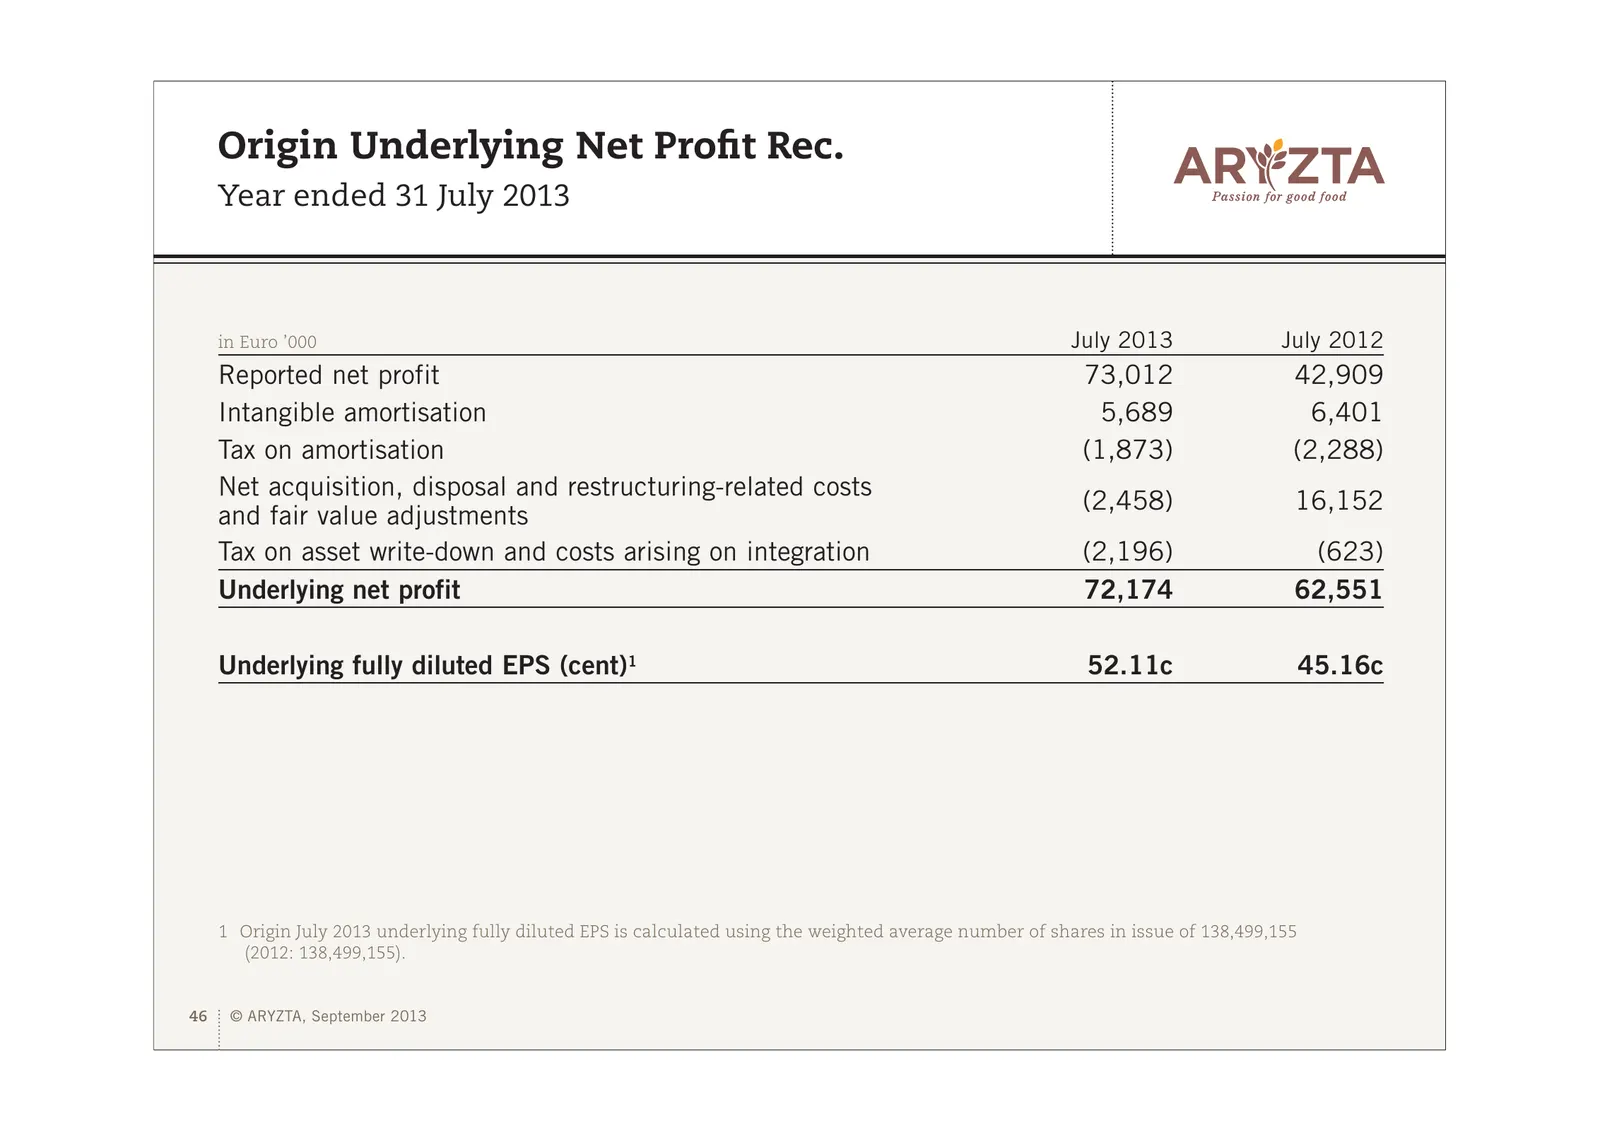
Origin Underlying Net Profit Rec. Year ended 31 July 2013 in Euro ’000 July 2013 July 2012 Reported net profit 73,012 42,909 Intangible amortisation 5,689 6,401 Tax on amortisation (1,873) (2,288) Net acquisition, disposal and restructuring-related costs (2,458) 16,152 and fair value adjustments Tax
Slide 47: Appendix – Other Financial Information
ARYZTA AG Appendix 2 – Other Financial Information 47 © ARYZTA, September 2013
Slide 48: ARYZTA AG Underlying Net Profit Rec.
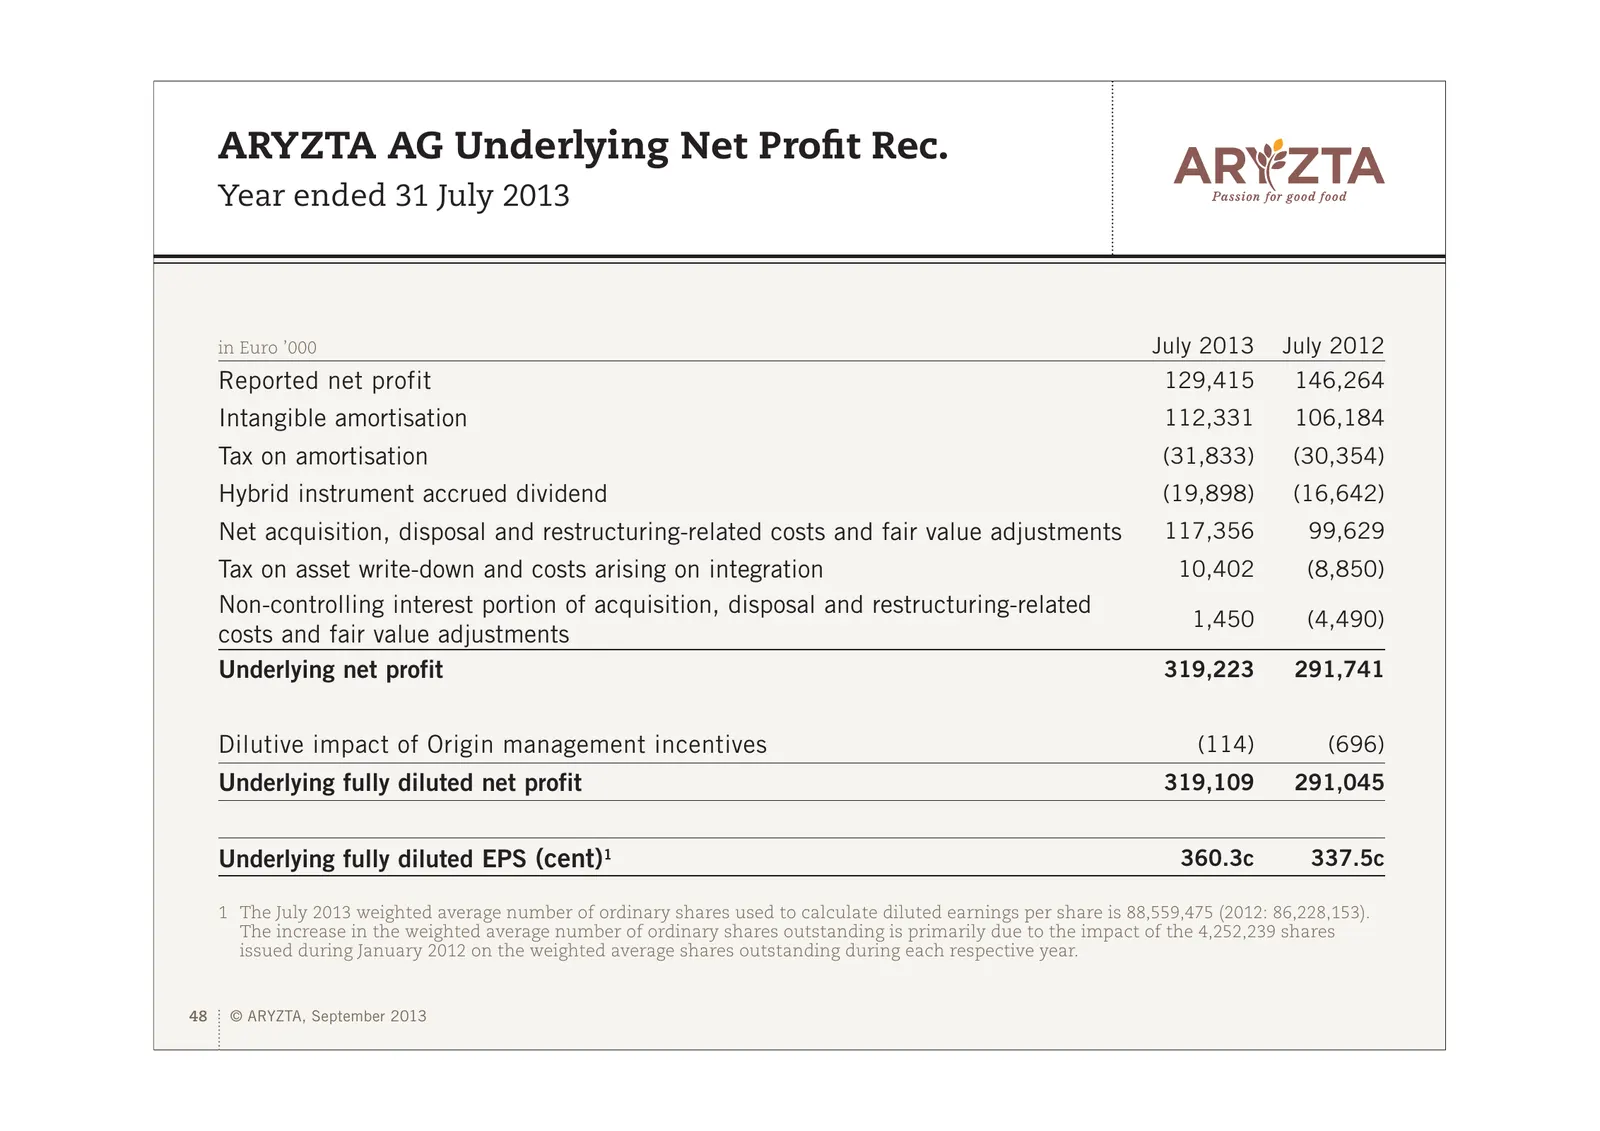
ARYZTA AG Underlying Net Profit Rec. Year ended 31 July 2013 in Euro ’000 July 2013 July 2012 Reported net profit 129,415 146,264 Intangible amortisation 112,331 106,184 Tax on amortisation (31,833) (30,354) Hybrid instrument accrued dividend (19,898) (16,642) Net acquisition, disposal and restructu
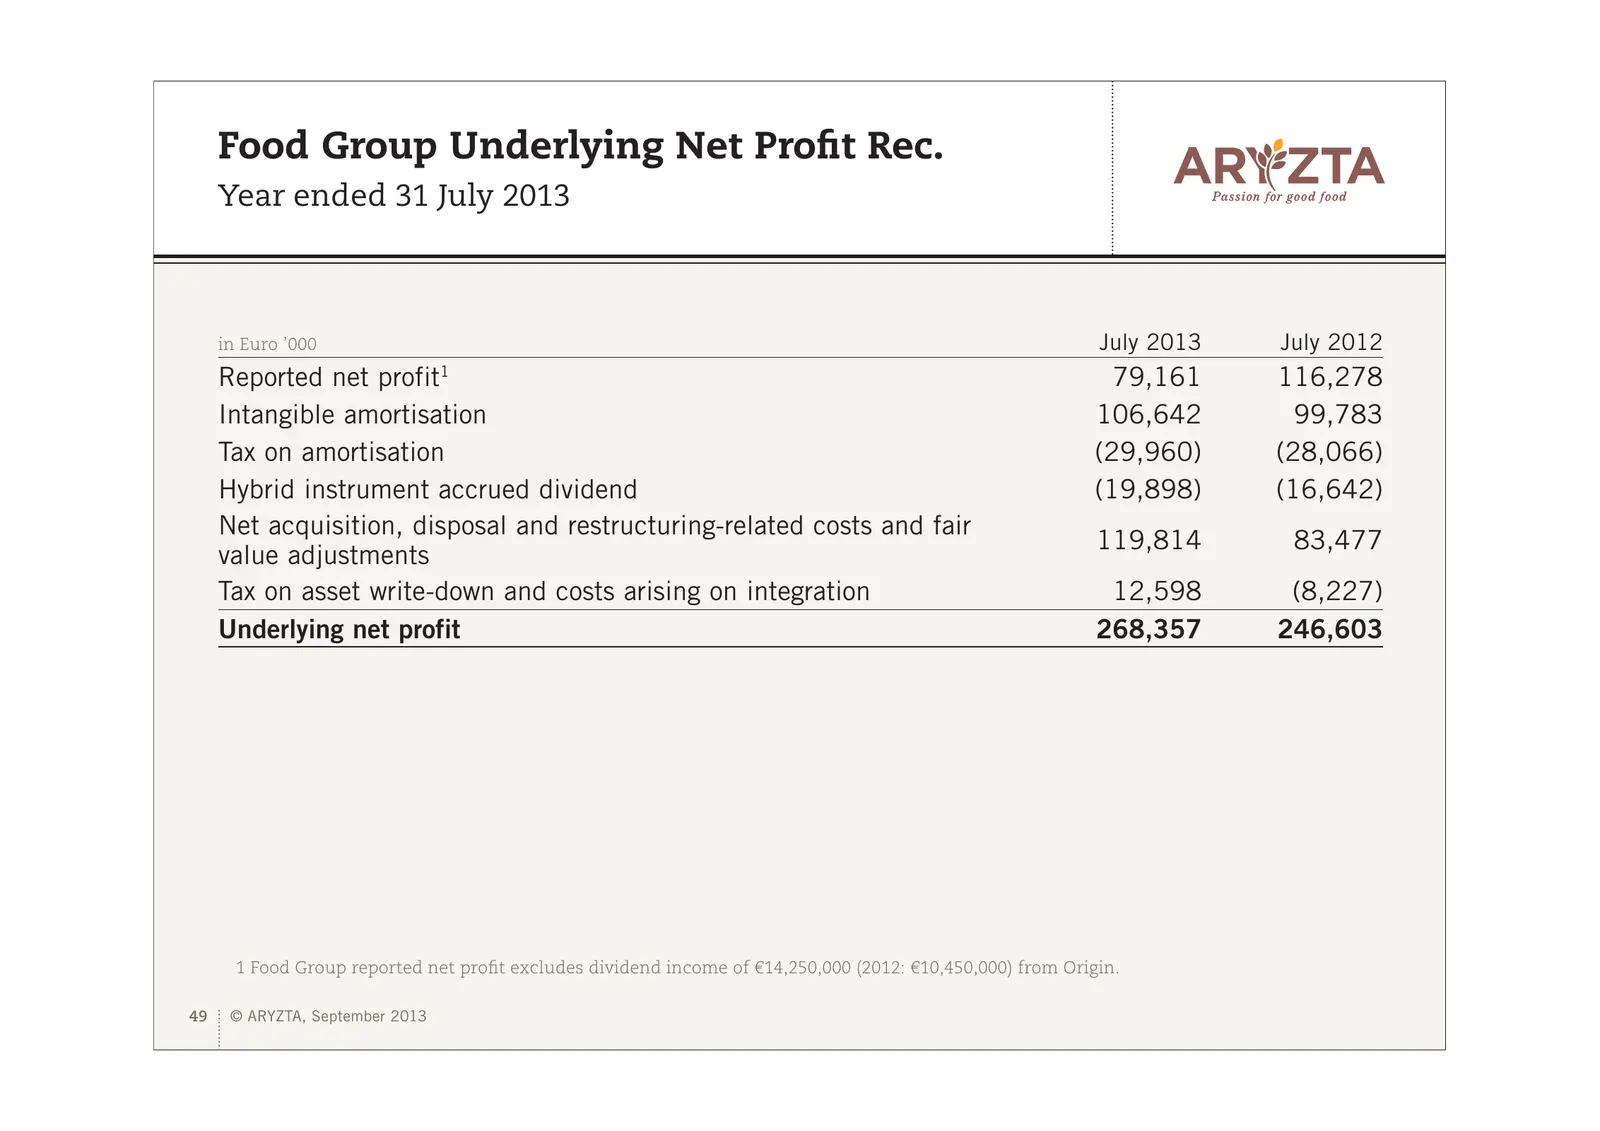
Slide 49: Food Group Underlying Net Profit Rec.
Food Group Underlying Net Profit Rec. Year ended 31 July 2013 in Euro ’000 July 2013 July 2012 1 Reported net profit 79,161 116,278 Intangible amortisation 106,642 99,783 Tax on amortisation (29,960) (28,066) Hybrid instrument accrued dividend (19,898) (16,642) Net acquisition, disposal and restruct
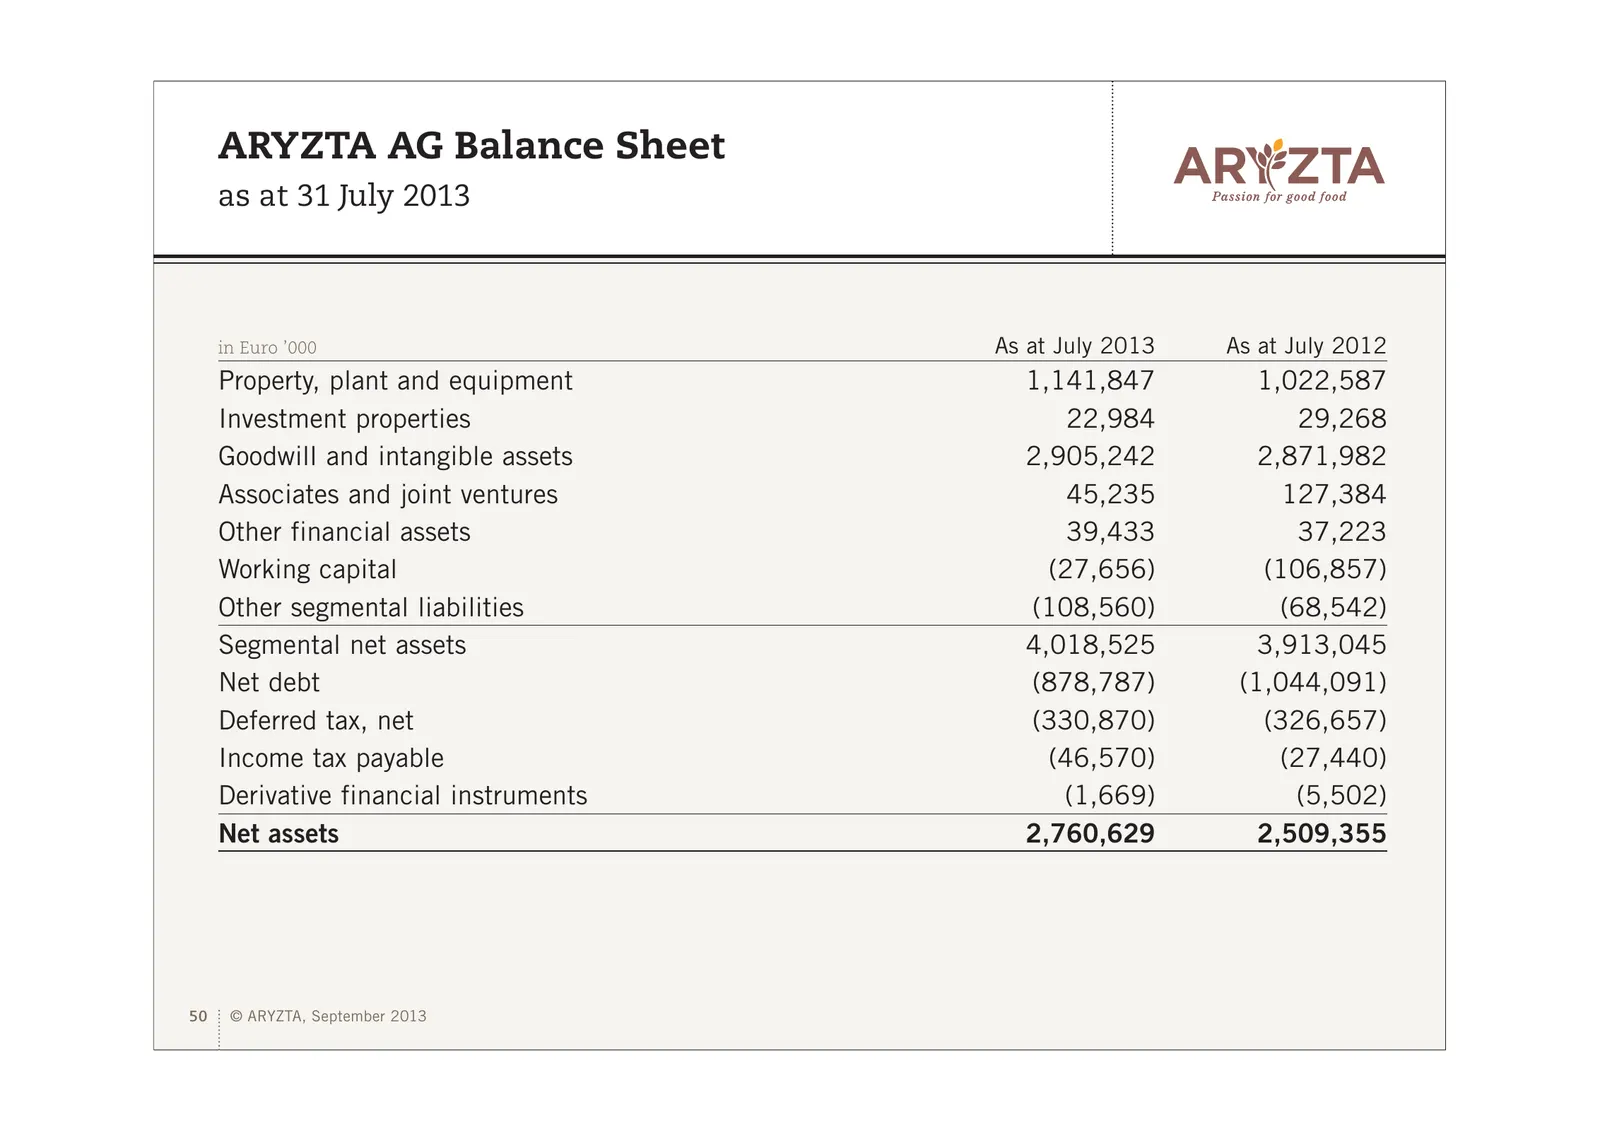
Slide 50: ARYZTA AG Balance Sheet
ARYZTA AG Balance Sheet as at 31 July 2013 in Euro ’000 As at July 2013 As at July 2012 Property, plant and equipment 1,141,847 1,022,587 Investment properties 22,984 29,268 Goodwill and intangible assets 2,905,242 2,871,982 Associates and joint ventures 45,235 127,384 Other financial assets 39,433
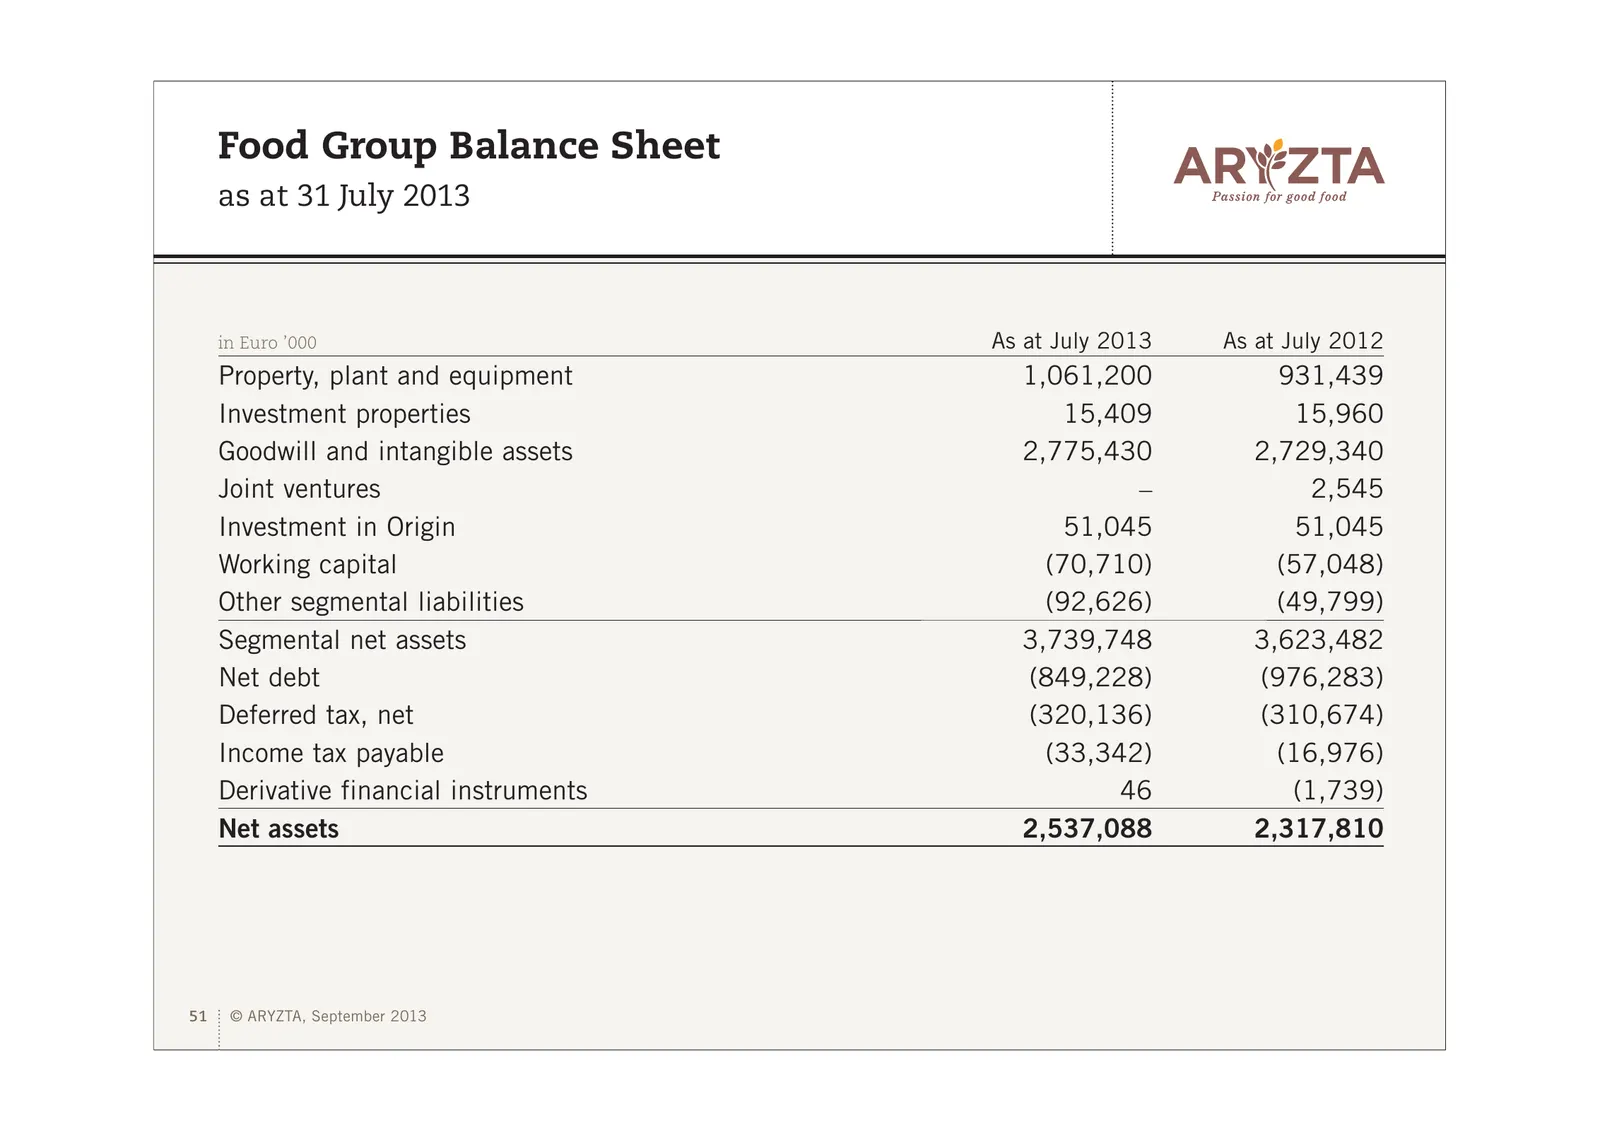
Slide 51: Food Group Balance Sheet
Food Group Balance Sheet as at 31 July 2013 in Euro ’000 As at July 2013 As at July 2012 Property, plant and equipment 1,061,200 931,439 Investment properties 15,409 15,960 Goodwill and intangible assets 2,775,430 2,729,340 Joint ventures – 2,545 Investment in Origin 51,045 51,045 Working capital (7
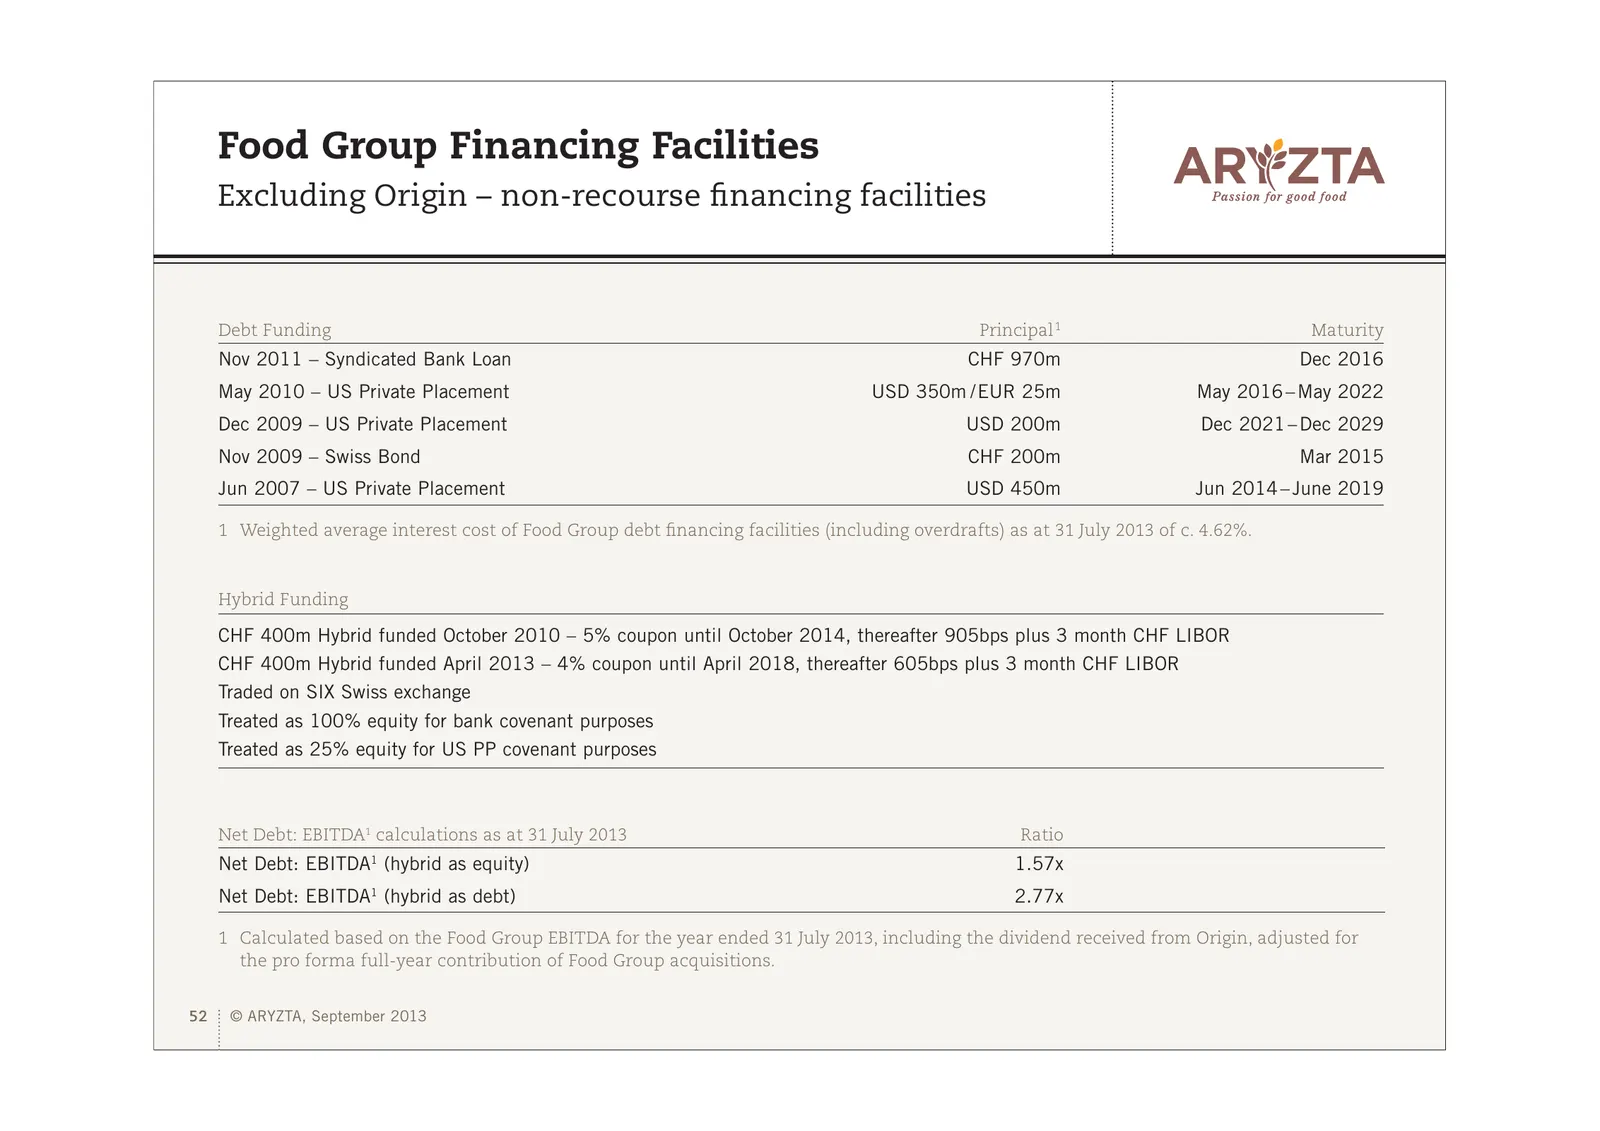
Slide 52: Food Group Financing Facilities
Food Group Financing Facilities Excluding Origin – non-recourse financing facilities Debt Funding Principal 1 Maturity Nov 2011 – Syndicated Bank Loan CHF 970m Dec 2016 May 2010 – US Private Placement USD 350m /EUR 25m May 2016 – May 2022 Dec 2009 – US Private Placement USD 200m Dec 2021 – Dec 2029
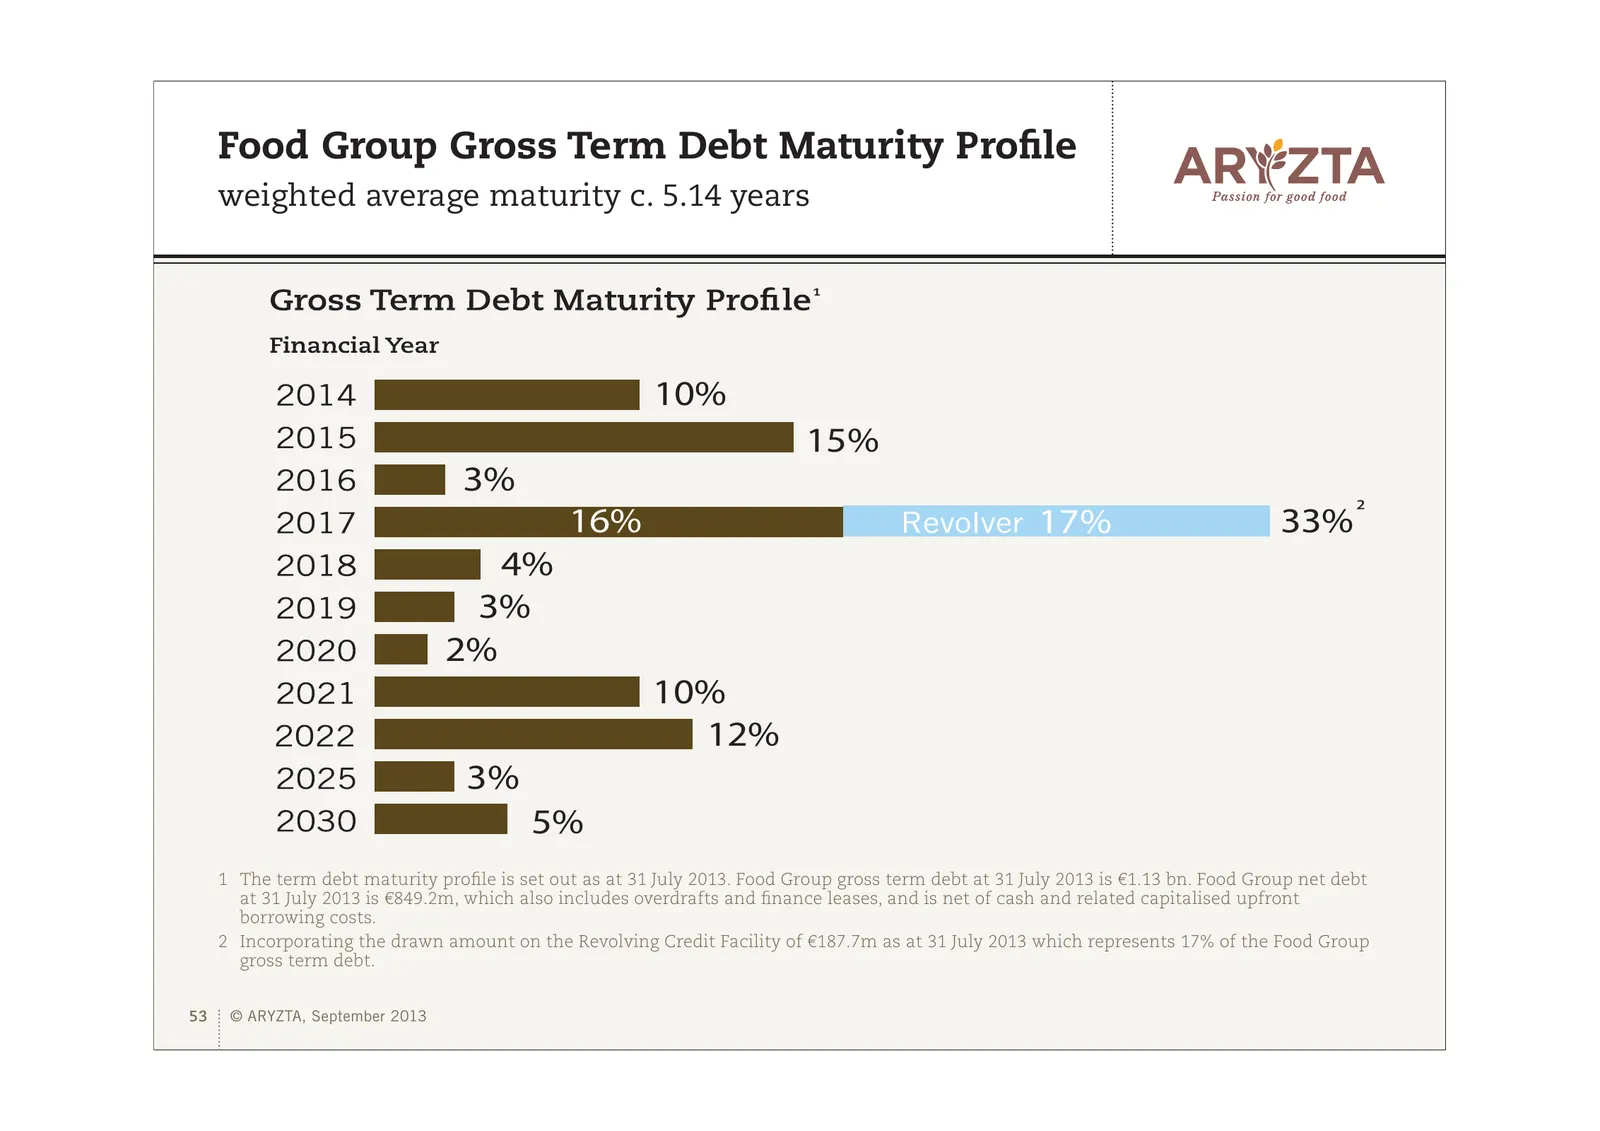
Slide 53: Food Group Gross Term Debt Maturity Profile
Food Group Gross Term Debt Maturity Profile weighted average maturity c. 5.14 years 10% 15% 3% 16% 17% 33% ² 4% 3% 2% 10% 12% 3% 5% 1 The term debt maturity profile is set out as at 31 July 2013. Food Group gross term debt at 31 July 2013 is €1.13 bn. Food Group net debt at 31 July 2013 is €849.2m,
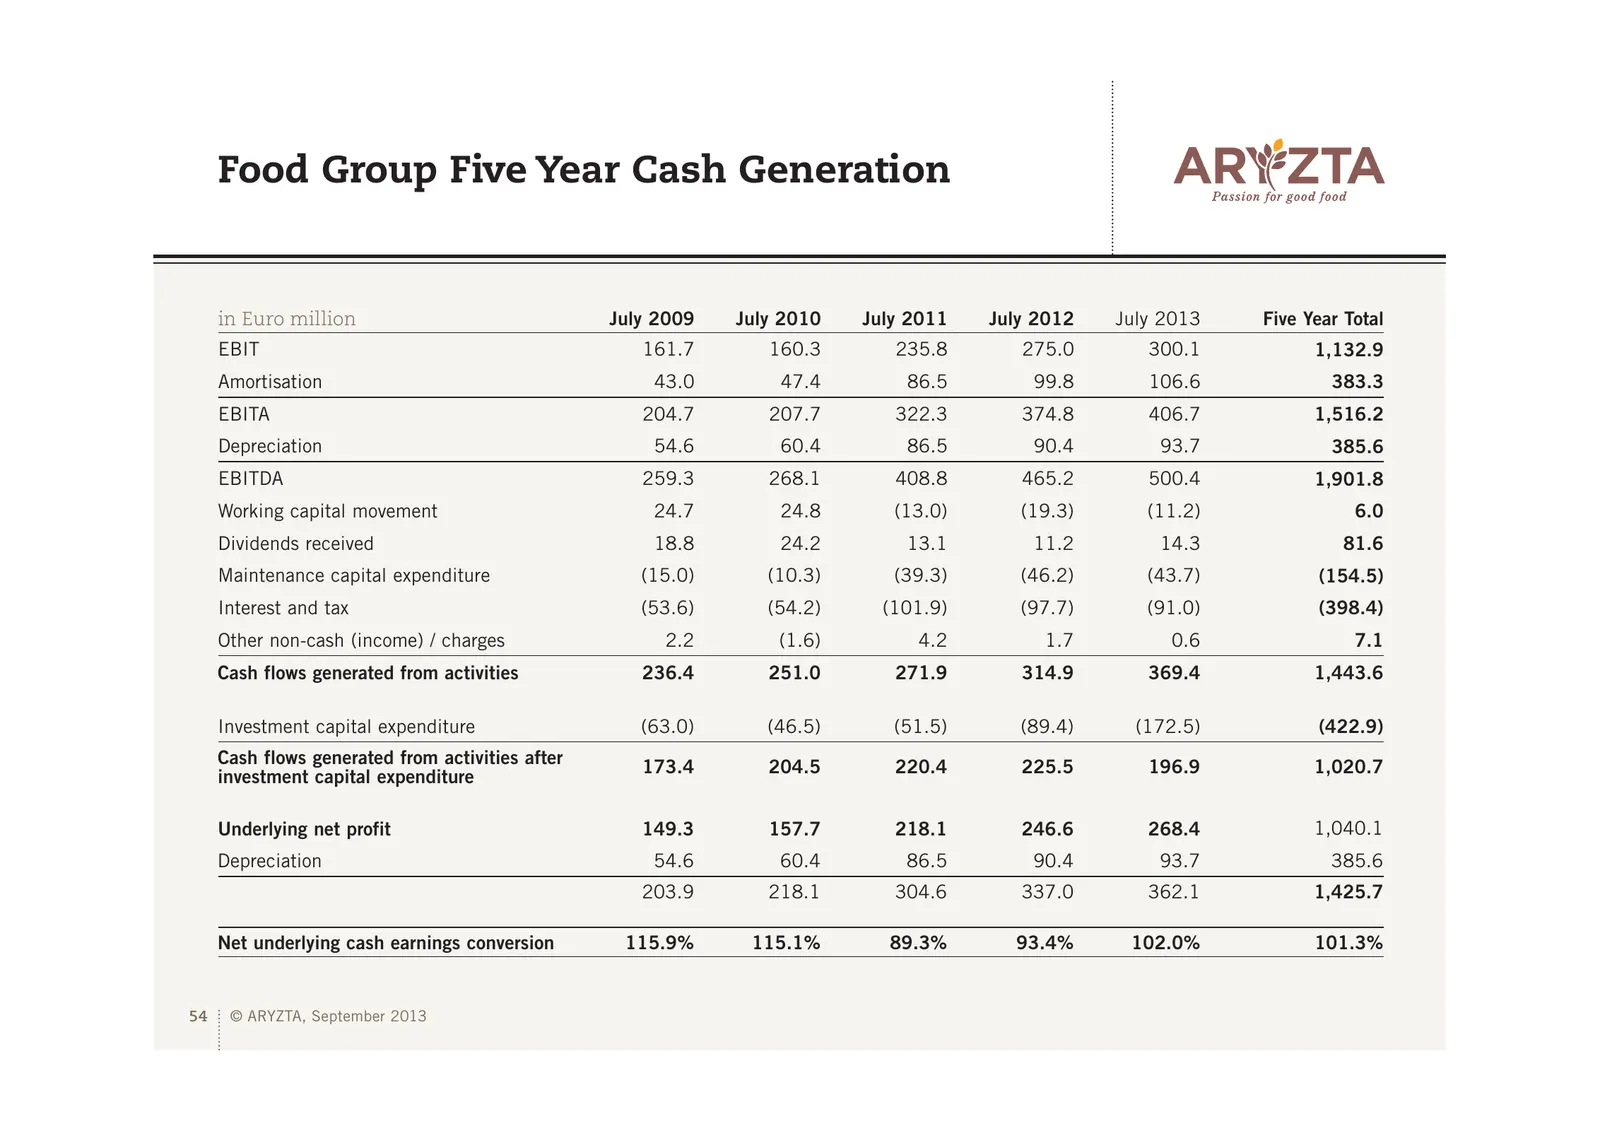
Slide 54: Food Group Five Year Cash Generation
Food Group Five Year Cash Generation in Euro million July 2009 July 2010 July 2011 July 2012 July 2013 Five Year Total EBIT 161.7 160.3 235.8 275.0 300.1 1,132.9 Amortisation 43.0 47.4 86.5 99.8 106.6 383.3 EBITA 204.7 207.7 322.3 374.8 406.7 1,516.2 Depreciation 54.6 60.4 86.5 90.4 93.7 385.6 EBITD
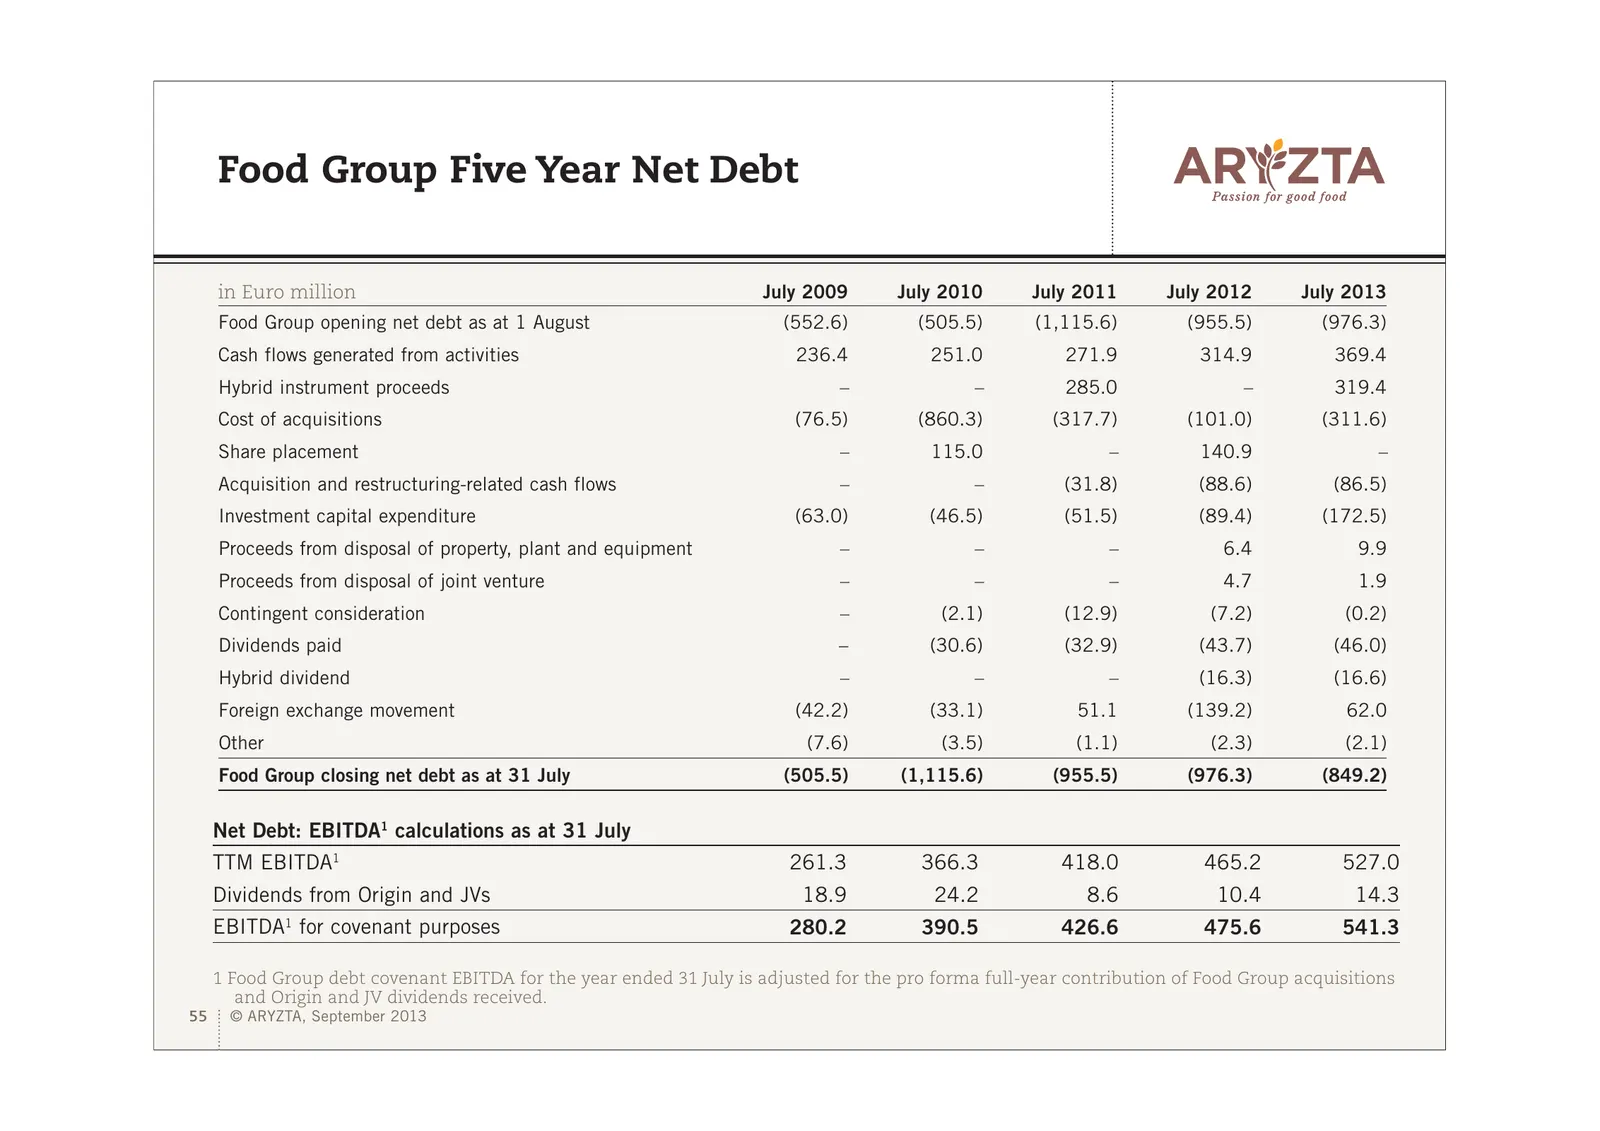
Slide 55: Food Group Five Year Net Debt
Food Group Five Year Net Debt in Euro million July 2009 July 2010 July 2011 July 2012 July 2013 Food Group opening net debt as at 1 August (552.6) (505.5) (1,115.6) (955.5) (976.3) Cash flows generated from activities 236.4 251.0 271.9 314.9 369.4 Hybrid instrument proceeds – – 285.0 – 319.4 Cost of
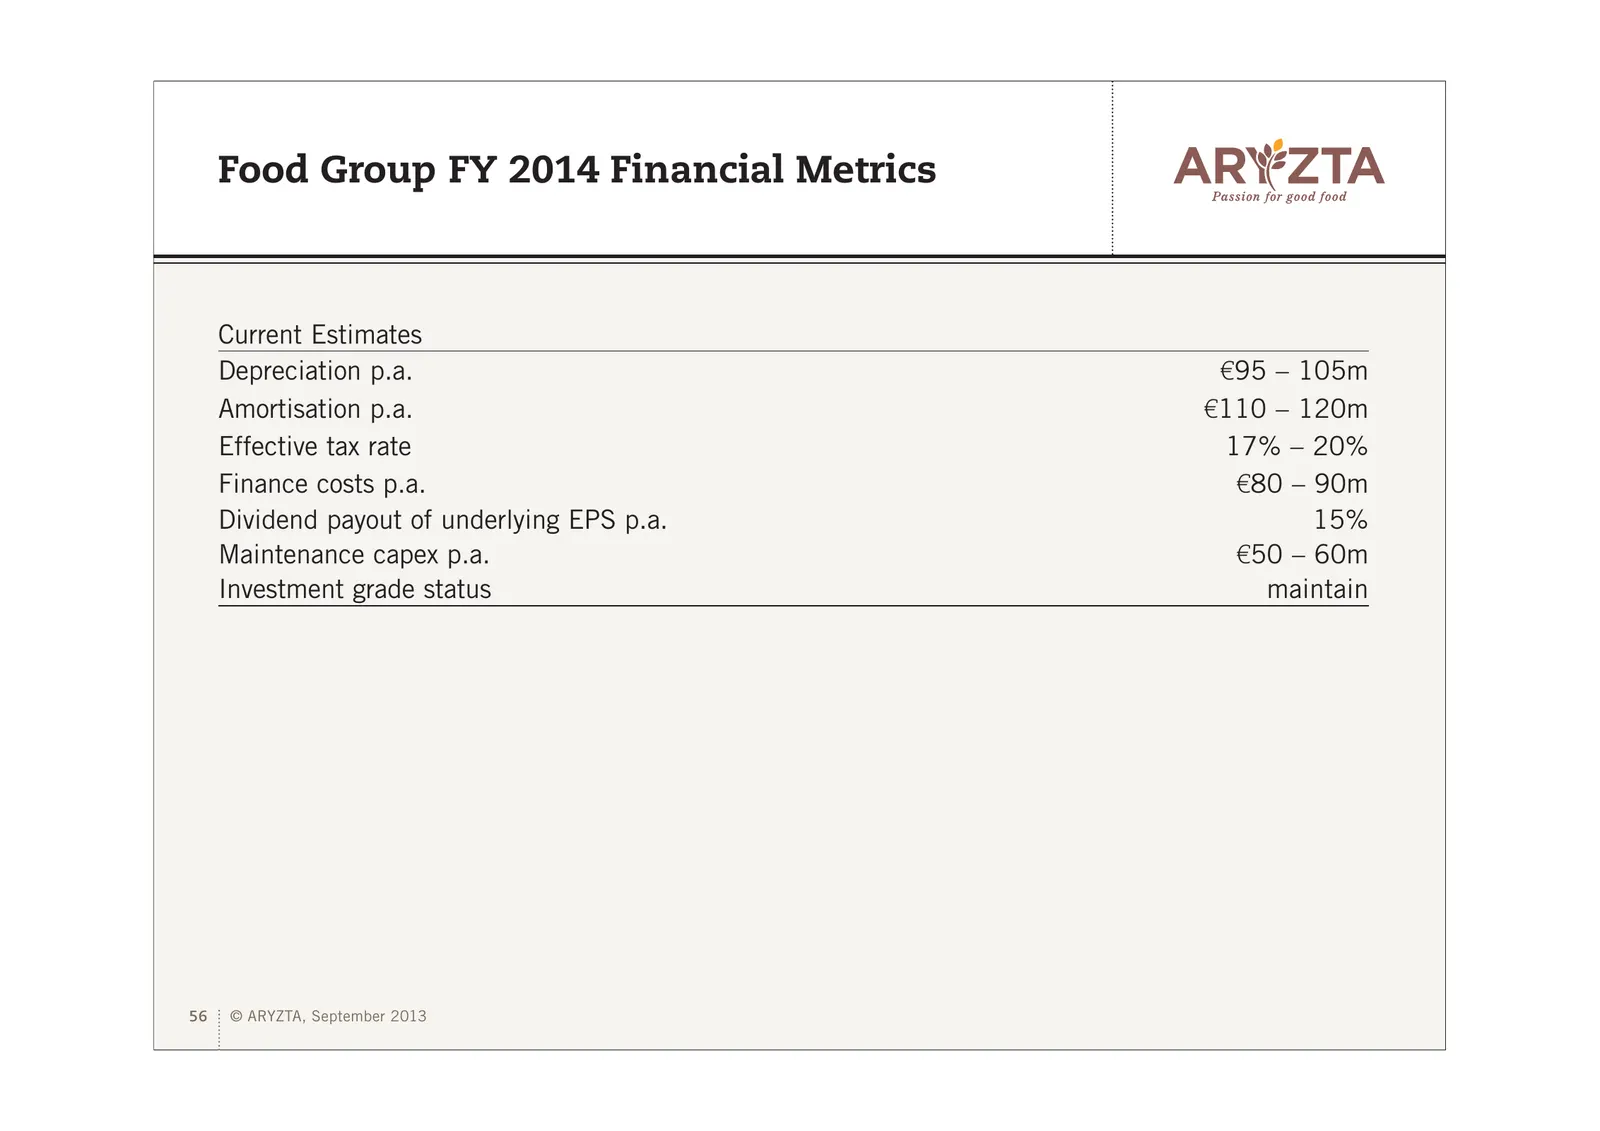
Slide 56: Food Group FY 2014 Financial Metrics
Food Group FY 2014 Financial Metrics Current Estimates Depreciation p.a. €95 – 105m Amortisation p.a. €110 – 120m Effective tax rate 17% – 20% Finance costs p.a. €80 – 90m Dividend payout of underlying EPS p.a. 15% Maintenance capex p.a. €50 – 60m Investment grade status maintain 56 © ARYZTA, Septem
Slide 57: Appendix – FX Analysis, Shareholder information, Consensus Estimates and Glossary
ARYZTA AG Appendix 3 – FX Analysis, Shareholder information, Consensus Estimates and Presentation Glossary 57 © ARYZTA, September 2013
Slide 58: EUR Average and Closing FX Rates
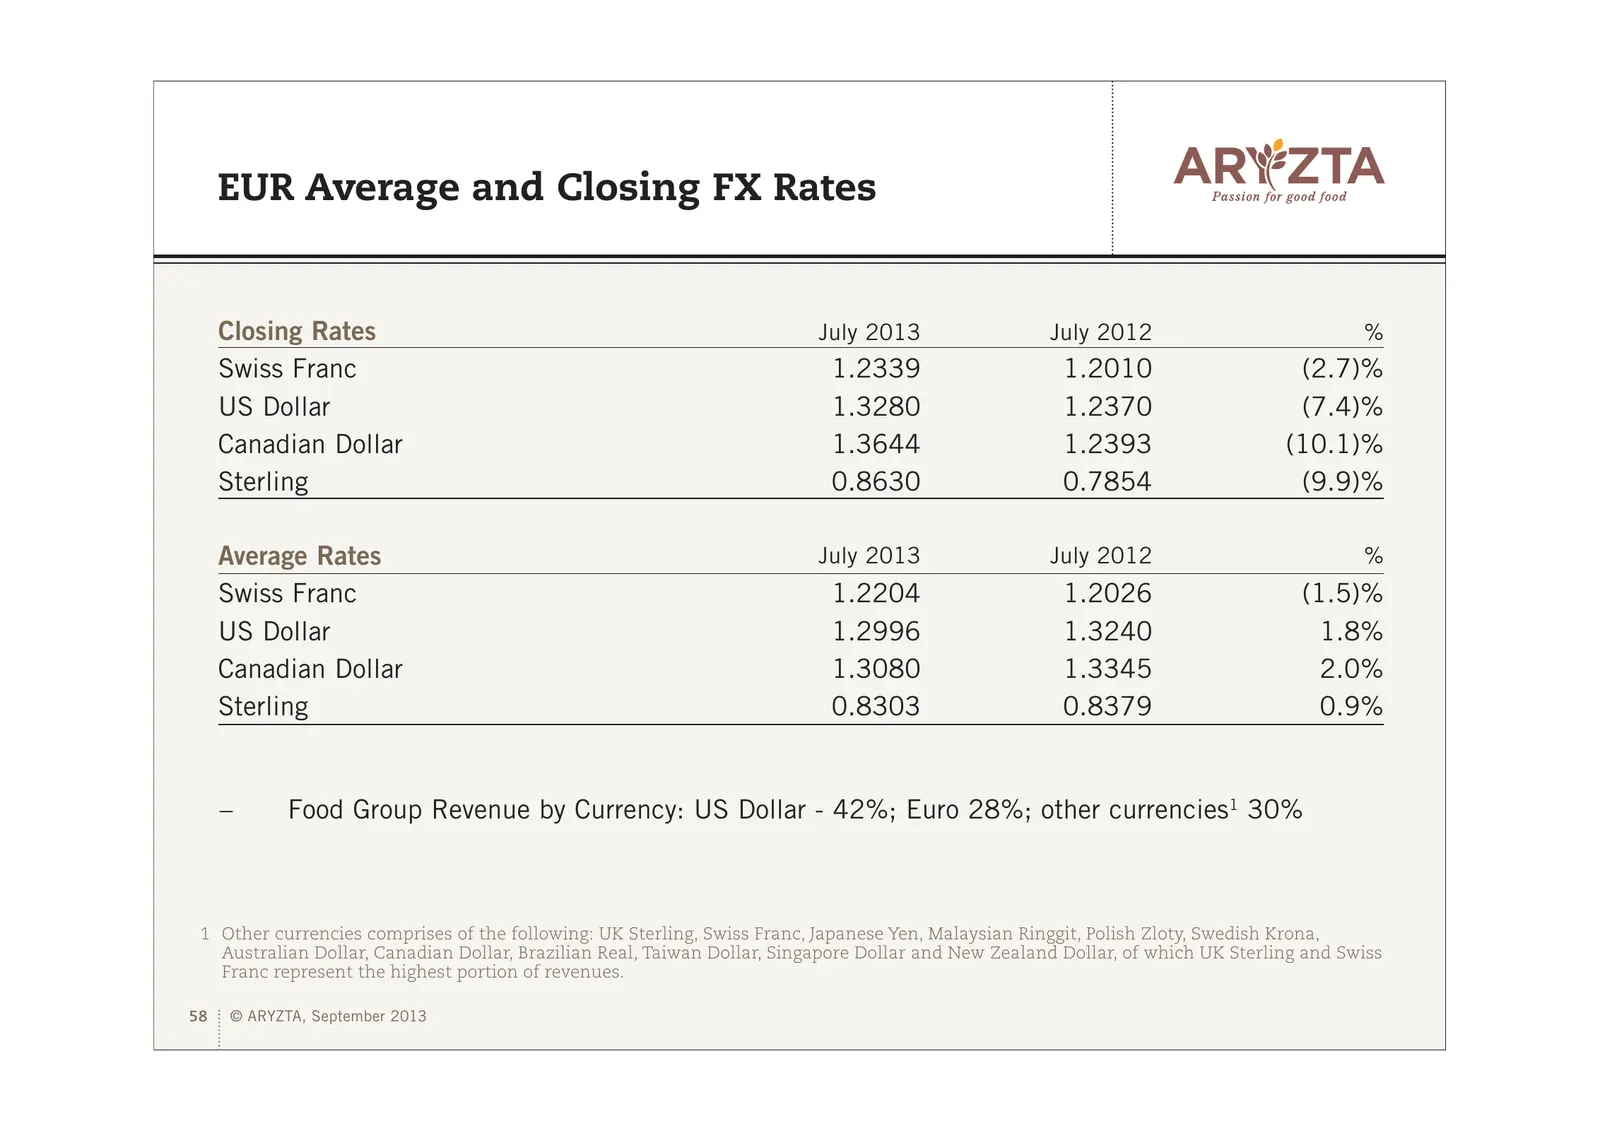
EUR Average and Closing FX Rates Closing Rates July 2013 July 2012 % Swiss Franc 1.2339 1.2010 (2.7)% US Dollar 1.3280 1.2370 (7.4)% Canadian Dollar 1.3644 1.2393 (10.1)% Sterling 0.8630 0.7854 (9.9)% Average Rates July 2013 July 2012 % Swiss Franc 1.2204 1.2026 (1.5)% US Dollar 1.2996 1.3240 1.8% C
Slide 59: Shareholder Composition – Institutional Shareholding
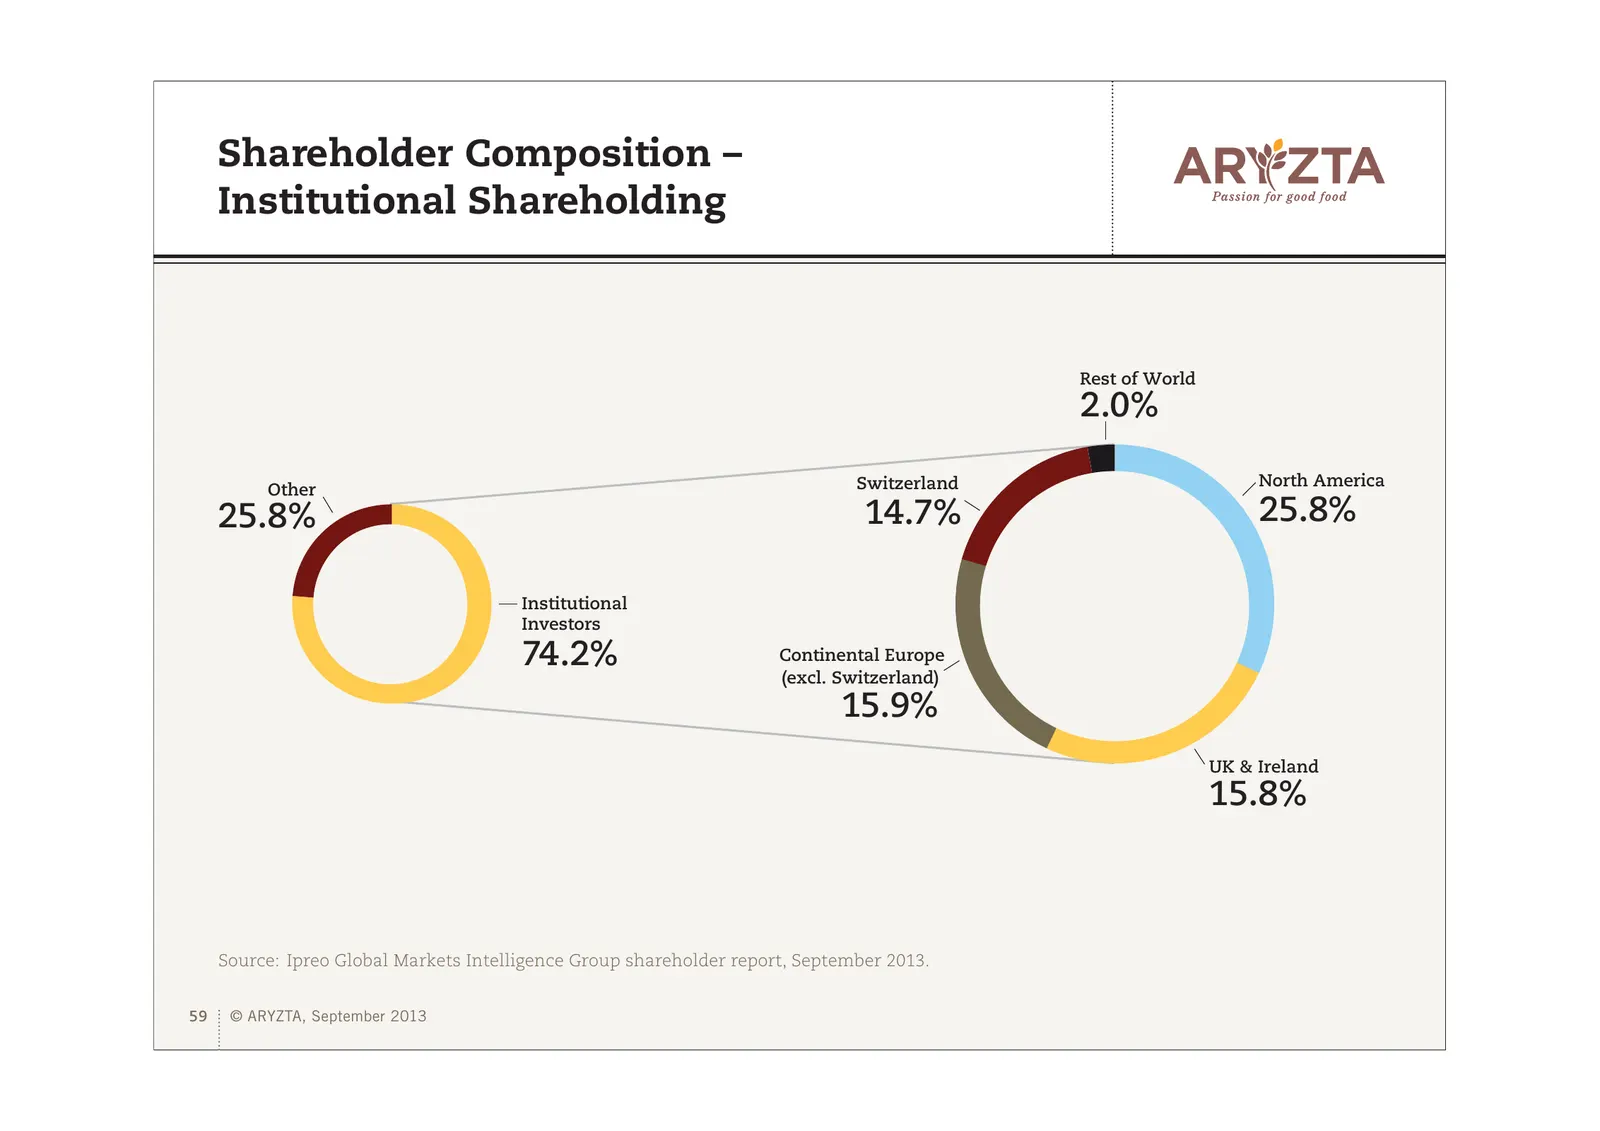
Shareholder Composition – Institutional Shareholding Rest of World 2.0% Switzerland North America Other 25.8% 14.7% 25.8% Institutional Investors 74.2% Continental Europe (excl. Switzerland) 15.9% UK & Ireland 15.8% Source: Ipreo Global Markets Intelligence Group shareholder report, September 2013.
Slide 60: ARYZTA FY 2014 Consensus Estimates
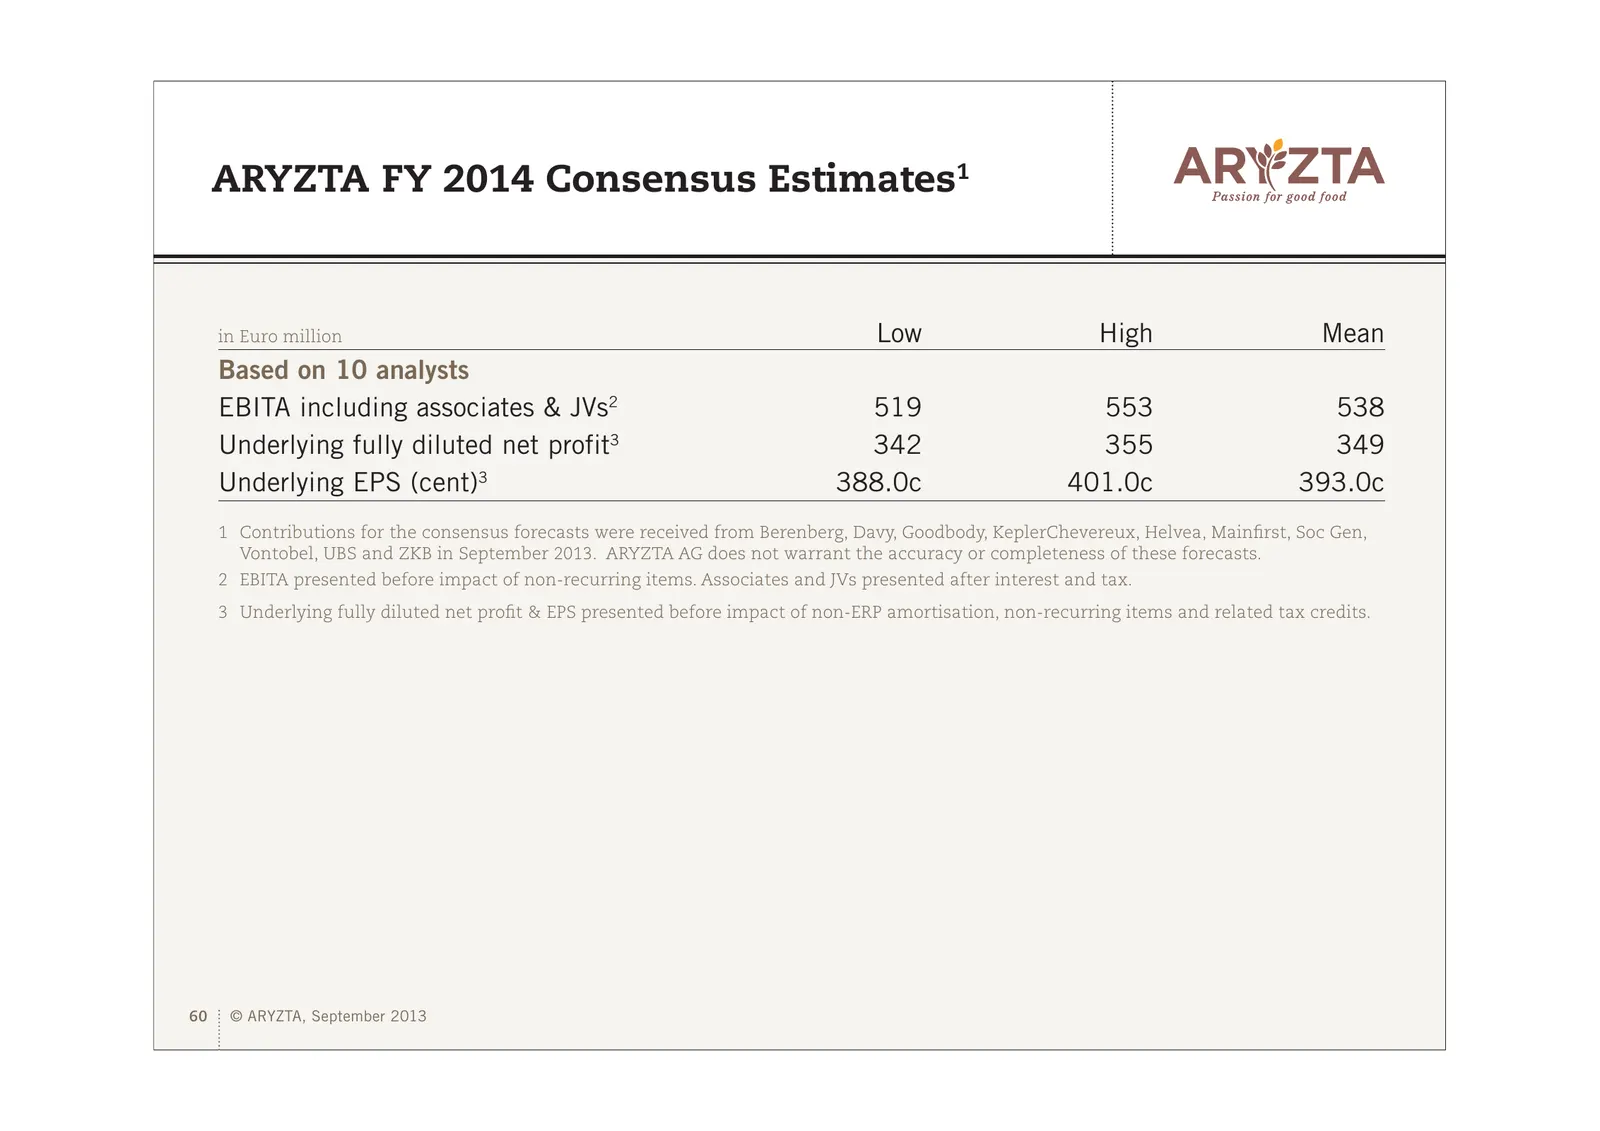
ARYZTA FY 2014 Consensus Estimates1 in Euro million Low High Mean Based on 10 analysts EBITA including associates & JVs2 519 553 538 Underlying fully diluted net profit3 342 355 349 Underlying EPS (cent)3 388.0c 401.0c 393.0c 1 Contributions for the consensus forecasts were received from Berenberg,
Slide 61: Presentation Glossary
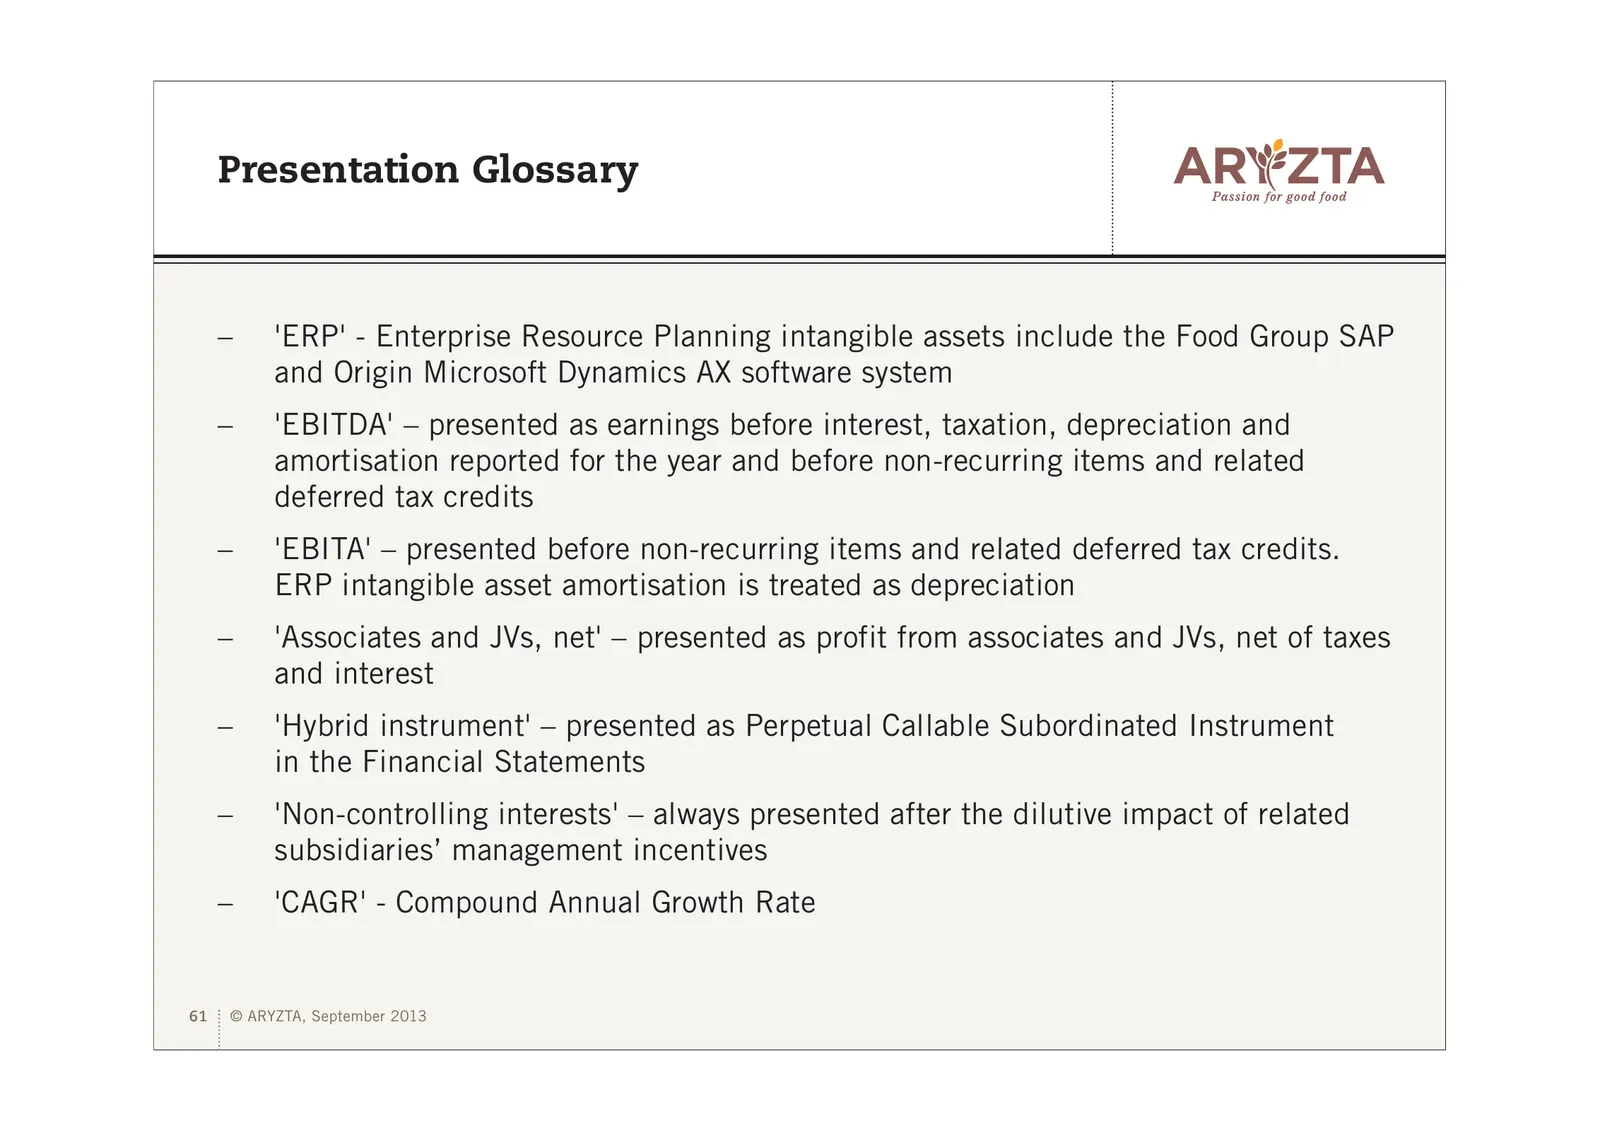
Presentation Glossary – 'ERP' - Enterprise Resource Planning intangible assets include the Food Group SAP and Origin Microsoft Dynamics AX software system – 'EBITDA' – presented as earnings before interest, taxation, depreciation and amortisation reported for the year and before non-recurring items
Slide 62: Investor Information
Investor Information Company Contact Paul Meade Communications Officer ARYZTA AG Talacker 41 8001 Zurich Switzerland Tel: +41 (0) 44 583 42 00 Fax: +41 (0) 44 583 42 49 info@aryzta.com www.aryzta.com 62 © ARYZTA, September 2013
Source: Internet Archive copy of aryzta.com
More decks from Aryzta AG
 H1 2026 Earnings Presentation32 slides · Aug 10, 2026
 FY2025 Earnings Presentation7 slides · Jan 22, 2026
 Q3 2025 Earnings Presentation15 slides · Oct 20, 2025
 H1 2025 Earnings Presentation34 slides · Aug 11, 2025
 Investor Day (May 2025)48 slides · May 7, 2025
 Q1 2025 Earnings Presentation35 slides · Mar 2, 2025