Earthstone Energy — Investor Presentation (February 2022)
25 slides from Earthstone Energy's investor presentation, Feb 18, 2022
Slide 1: The Transformed Earthstone: Bigger, Better and Built to Last
The Transformed Earthstone Bigger, Better and Built to Last February 16, 2022 Exhibit 99.2
Slide 2: Disclaimer: Forward-Looking Statements
2 Disclaimer Forward-Looking Statements This presentation contains forward-looking statements within the meaning of Section 27A of the Securities Act of 1933, as amended (the “Securities Act”), and Section 21E of the Securities Exchange Act of 1934, as amended (the “Exchange Act”). Statements that a
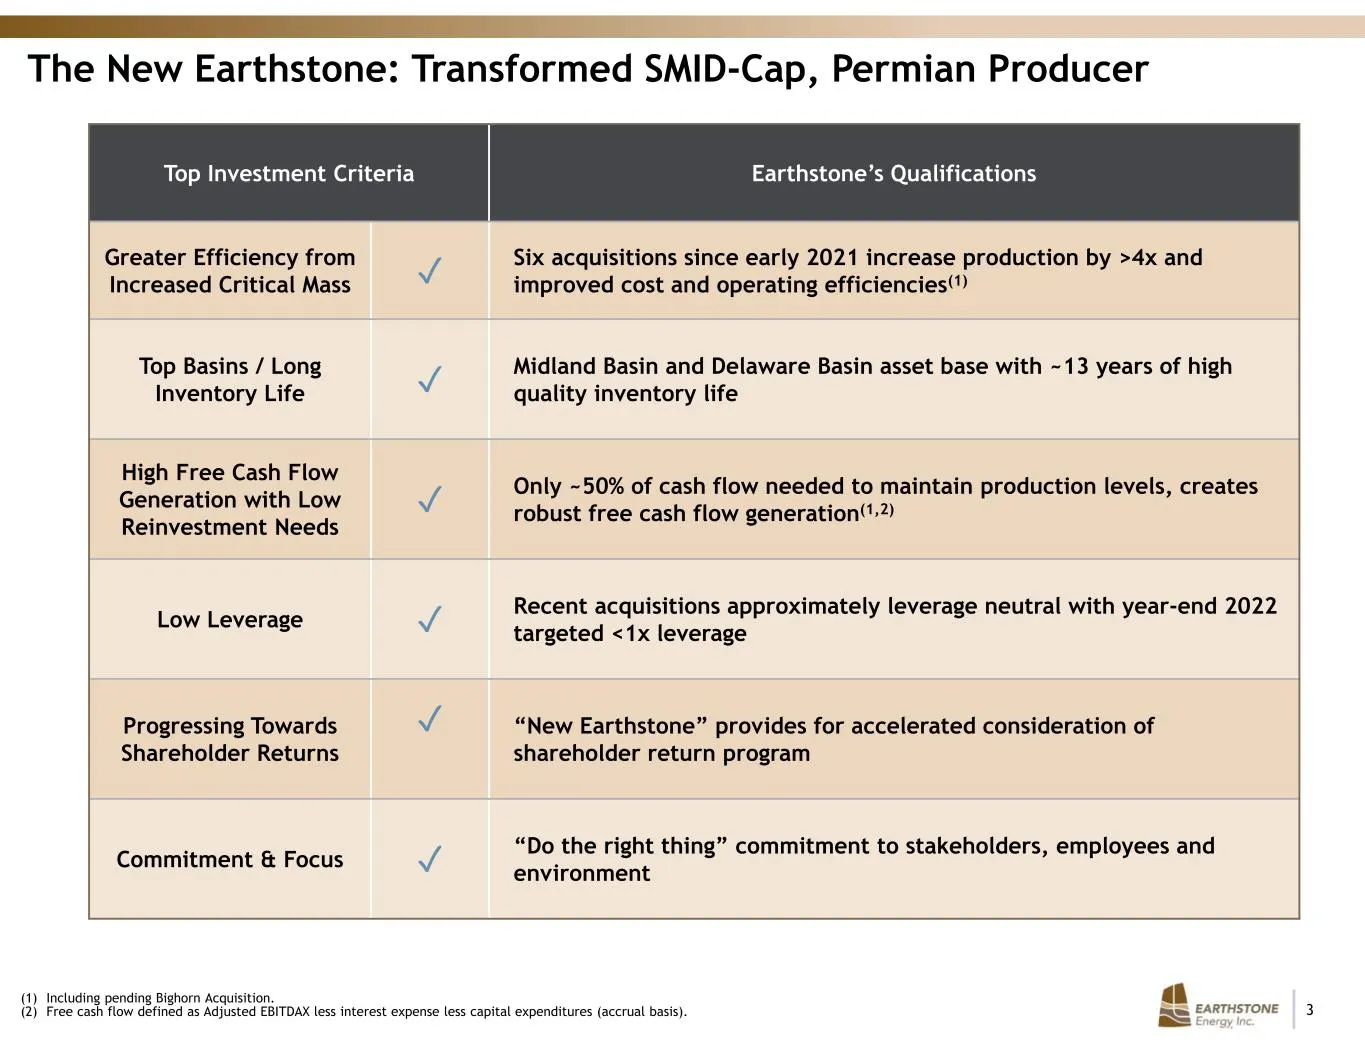
Slide 3: The New Earthstone: Transformed SMID-Cap, Permian Producer
3 The New Earthstone: Transformed SMID-Cap, Permian Producer Top Investment Criteria Earthstone’s Qualifications Greater Efficiency from Increased Critical Mass ✓ Six acquisitions since early 2021 increase production by >4x and improved cost and operating efficiencies(1) Top Basins / Long Inventory
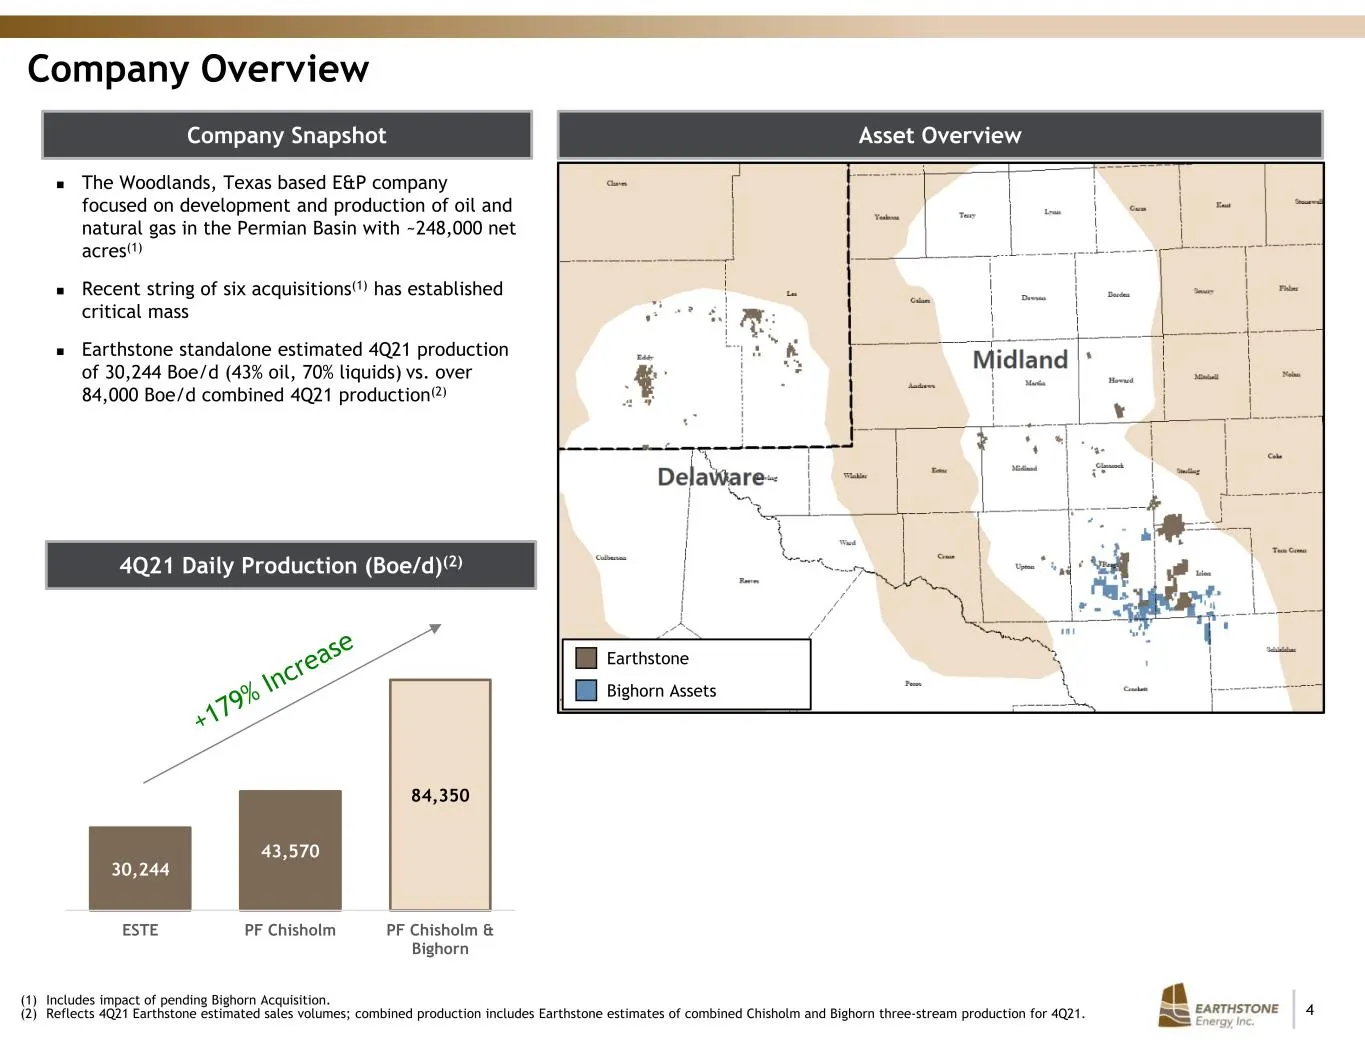
Slide 4: Company Overview and Asset Overview
4 30,244 43,570 84,350 ESTE PF Chisholm PF Chisholm & Bighorn Company Overview Asset Overview The Woodlands, Texas based E&P company focused on development and production of oil and natural gas in the Permian Basin with ~248,000 net acres(1) Recent string of six acquisitions(1) has established c
Slide 5: Capital Structure and Liquidity Snapshot
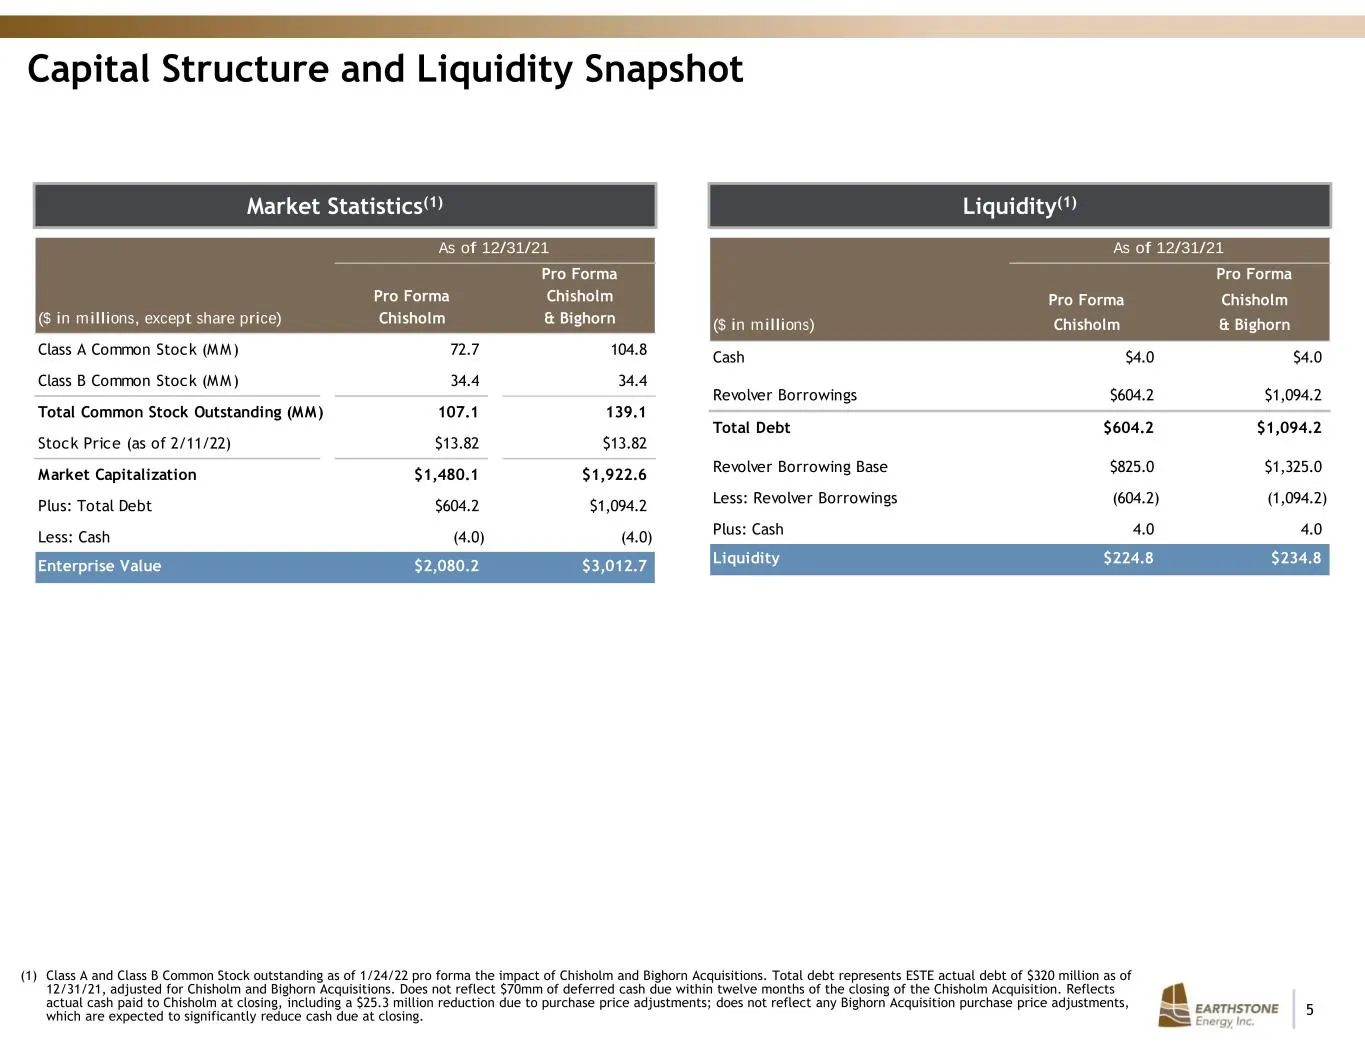
5 Capital Structure and Liquidity Snapshot Market Statistics(1) (1) Class A and Class B Common Stock outstanding as of 1/24/22 pro forma the impact of Chisholm and Bighorn Acquisitions. Total debt represents ESTE actual debt of $320 million as of 12/31/21, adjusted for Chisholm and Bighorn Acquisiti
Slide 6: Acquisitions Have Transformed Earthstone in 2021-22
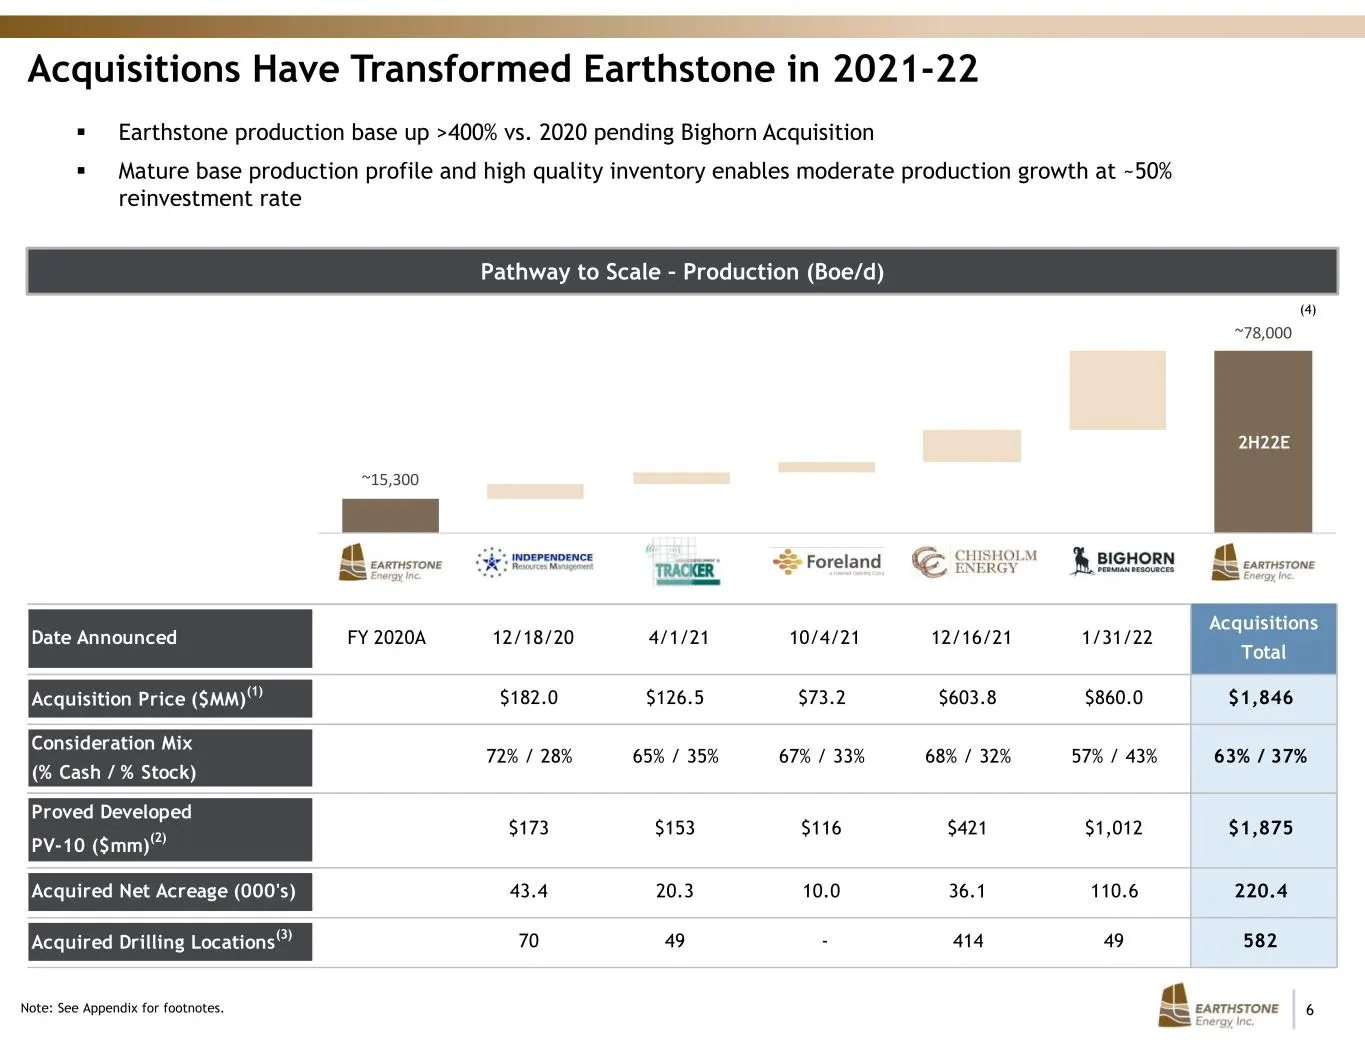
6 Date Announced FY 2020A 12/18/20 4/1/21 10/4/21 12/16/21 1/31/22 Acquisitions Total Acquisition Price ($MM)(1) $182.0 $126.5 $73.2 $603.8 $860.0 $1,846 Consideration Mix (% Cash / % Stock) 72% / 28% 65% / 35% 67% / 33% 68% / 32% 57% / 43% 63% / 37% Proved Developed PV-10 ($mm)(2) $173 $153 $116 $4
Slide 7: Northern Delaware Basin Asset Overview
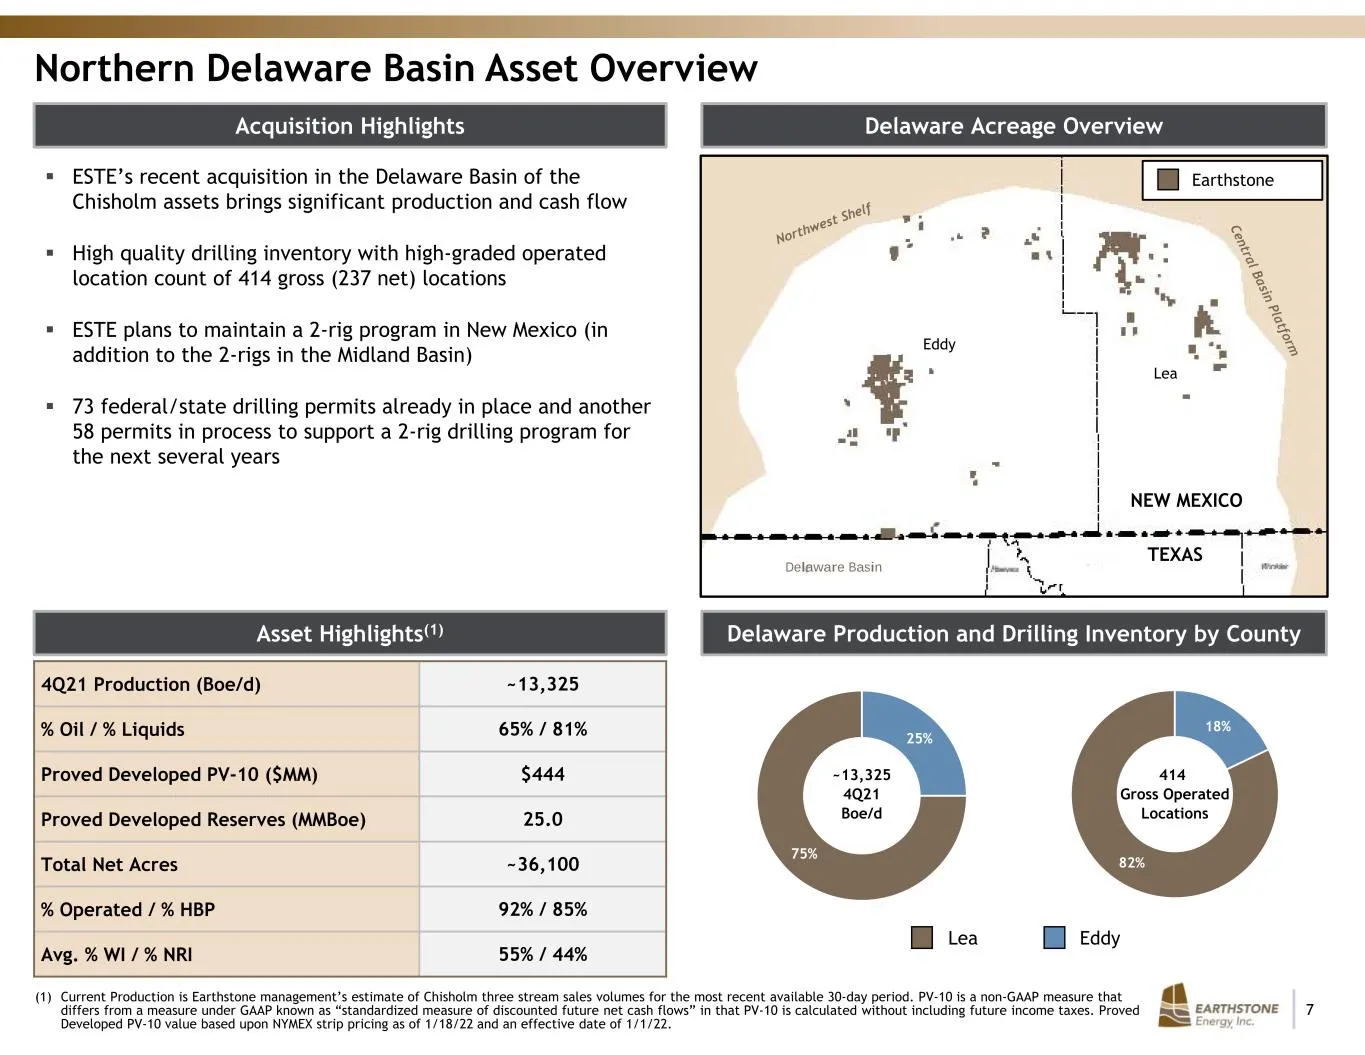
7 18% 82% 25% 75% Northern Delaware Basin Asset Overview Delaware Acreage OverviewAcquisition Highlights 4Q21 Production (Boe/d) ~13,325 % Oil / % Liquids 65% / 81% Proved Developed PV-10 ($MM) $444 Proved Developed Reserves (MMBoe) 25.0 Total Net Acres ~36,100 % Operated / % HBP 92% / 85% Avg. % WI
Slide 8: Bighorn Asset Overview – Pending Closing
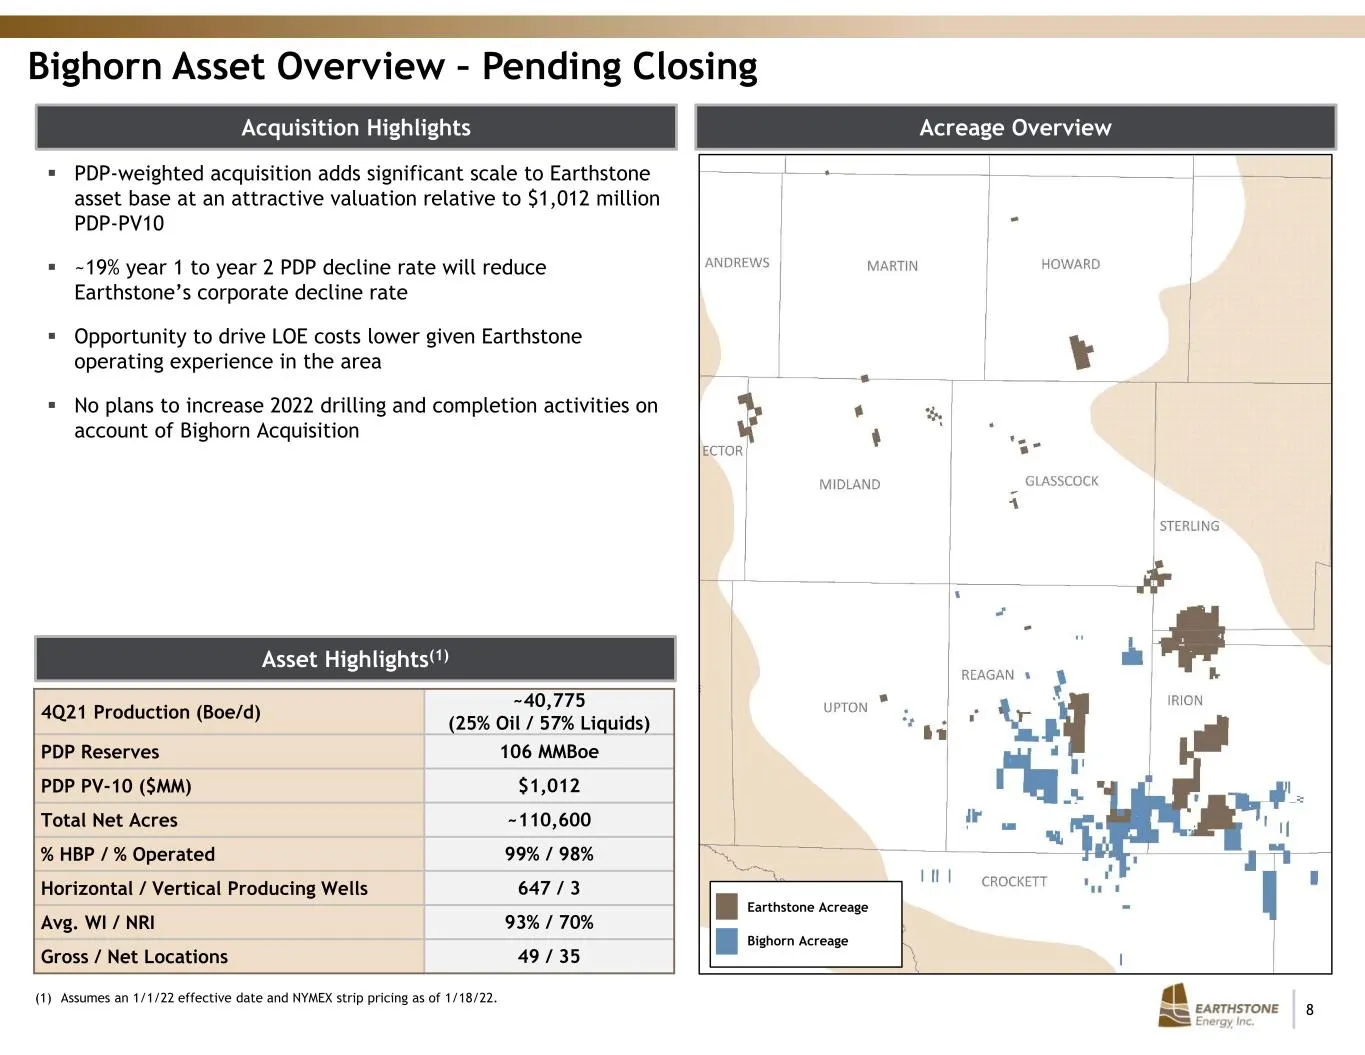
8 Bighorn Asset Overview – Pending Closing Acreage OverviewAcquisition Highlights Asset Highlights(1) 4Q21 Production (Boe/d) ~40,775 (25% Oil / 57% Liquids) PDP Reserves 106 MMBoe PDP PV-10 ($MM) $1,012 Total Net Acres ~110,600 % HBP / % Operated 99% / 98% Horizontal / Vertical Producing Wells 647
Slide 9: Pro Forma Earthstone Overview
9 Pro Forma Earthstone Overview
Slide 10: Permian Basin Growth Story
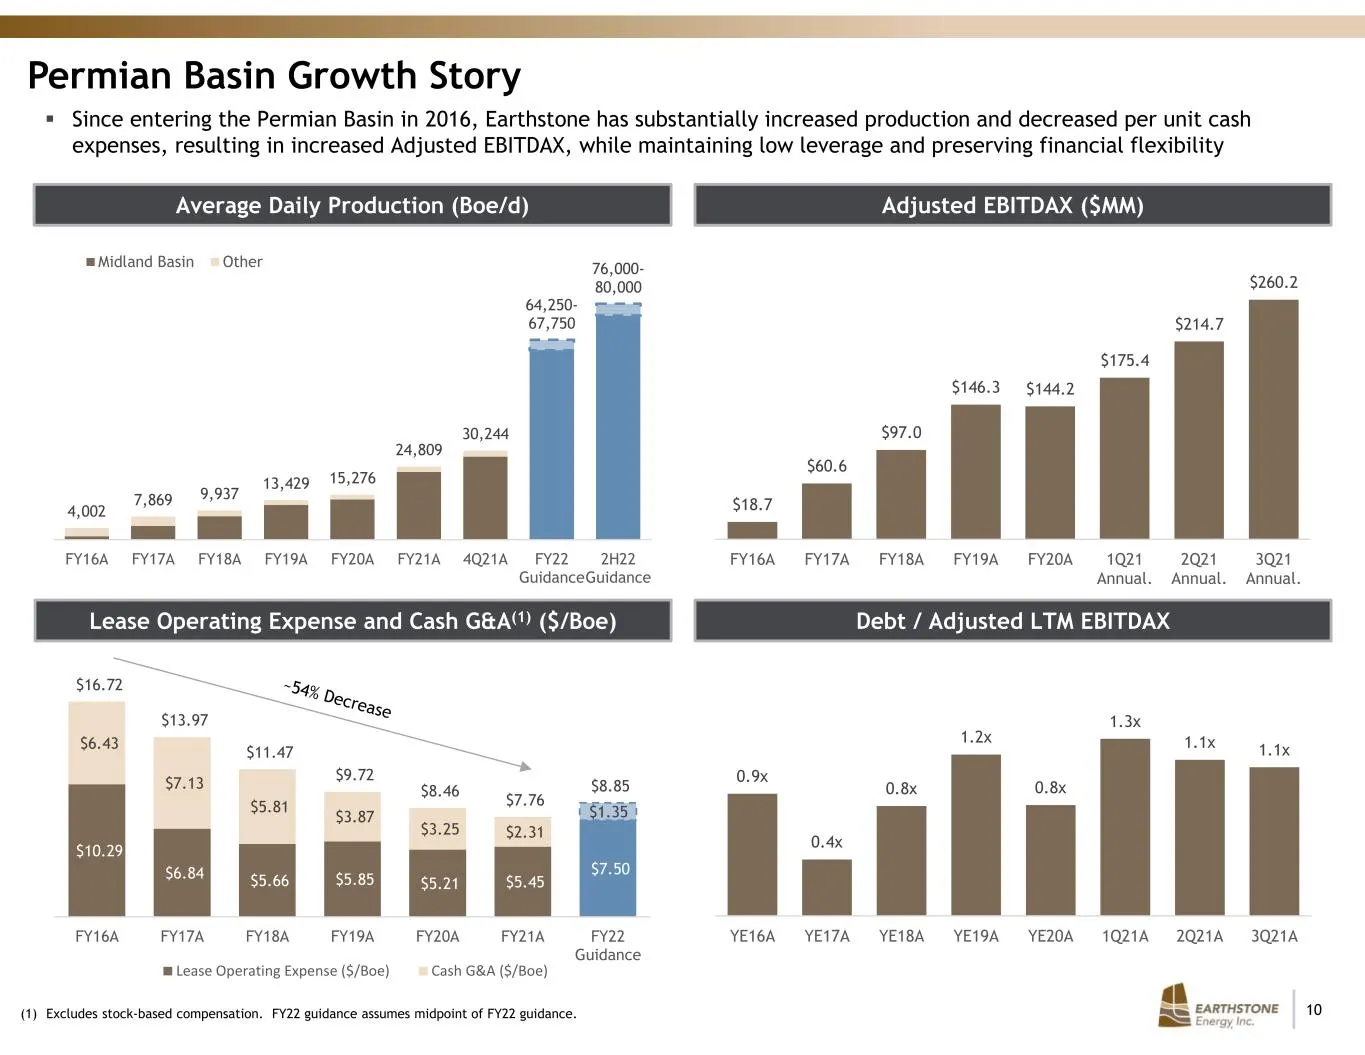
10 $10.29 $6.84 $5.66 $5.85 $5.21 $5.45 $7.50 $6.43 $7.13 $5.81 $3.87 $3.25 $2.31 $1.35 $16.72 $13.97 $11.47 $9.72 $8.46 $7.76 $8.85 FY16A FY17A FY18A FY19A FY20A FY21A FY22 Guidance Lease Operating Expense ($/Boe) Cash G&A ($/Boe) 4,002 7,869 9,937 13,429 15,276 24,809 30,244 64,250- 67,750 76,000-
Slide 11: Earthstone's Significant Growth Transformation
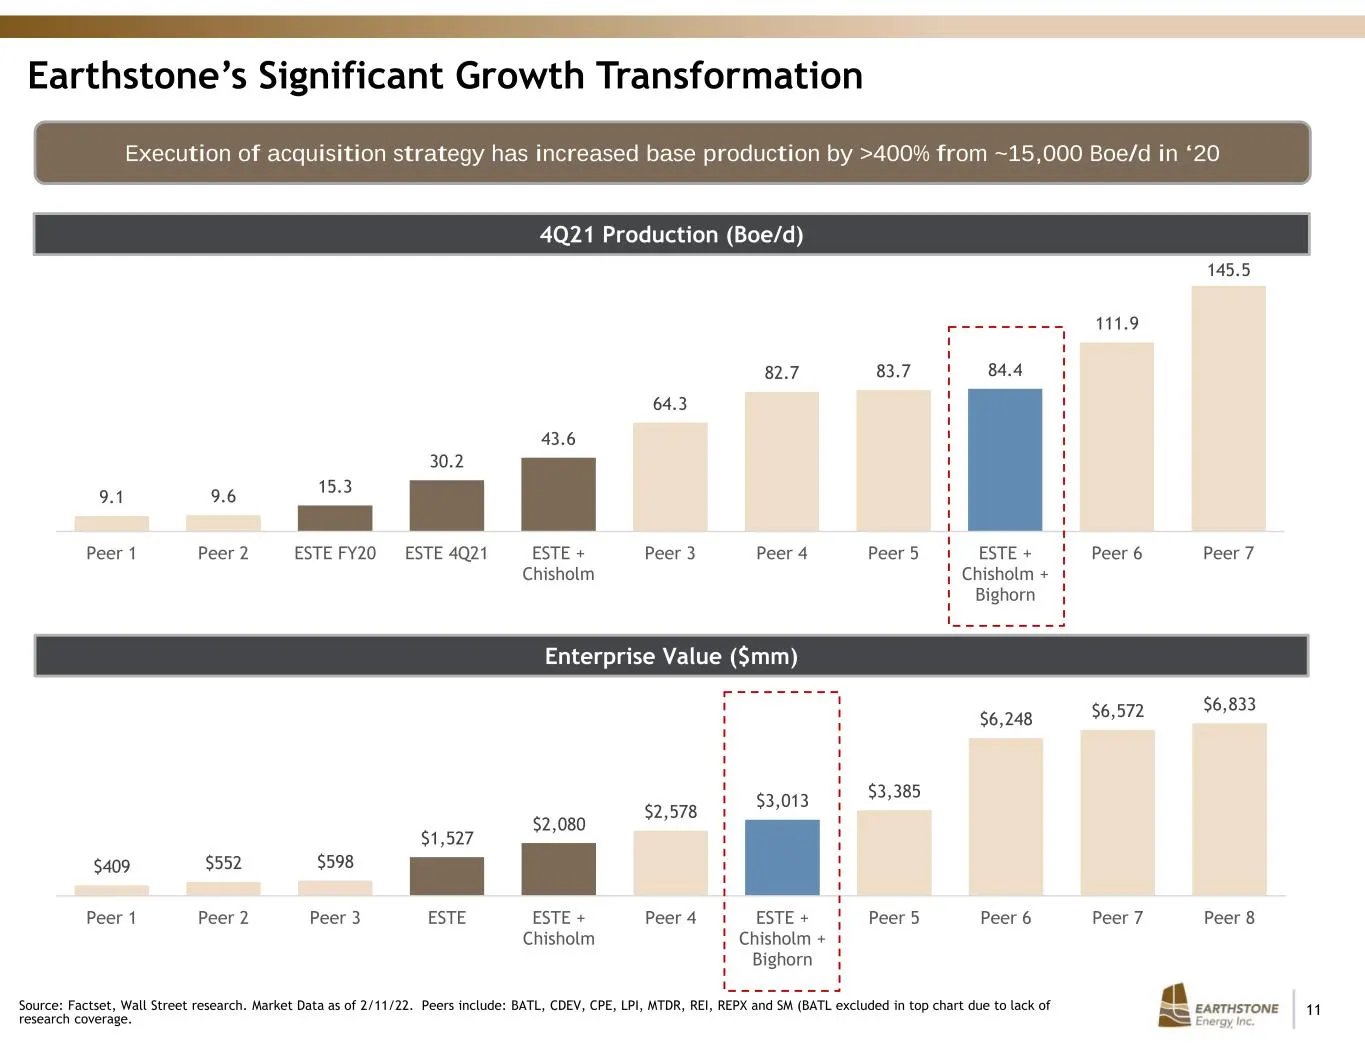
11 9.1 9.6 15.3 30.2 43.6 64.3 82.7 83.7 84.4 111.9 145.5 Peer 1 Peer 2 ESTE FY20 ESTE 4Q21 ESTE + Chisholm Peer 3 Peer 4 Peer 5 ESTE + Chisholm + Bighorn Peer 6 Peer 7 $409 $552 $598 $1,527 $2,080 $2,578 $3,013 $3,385 $6,248 $6,572 $6,833 Peer 1 Peer 2 Peer 3 ESTE ESTE + Chisholm Peer 4 ESTE + Chis
Slide 12: Reserves and Inventory
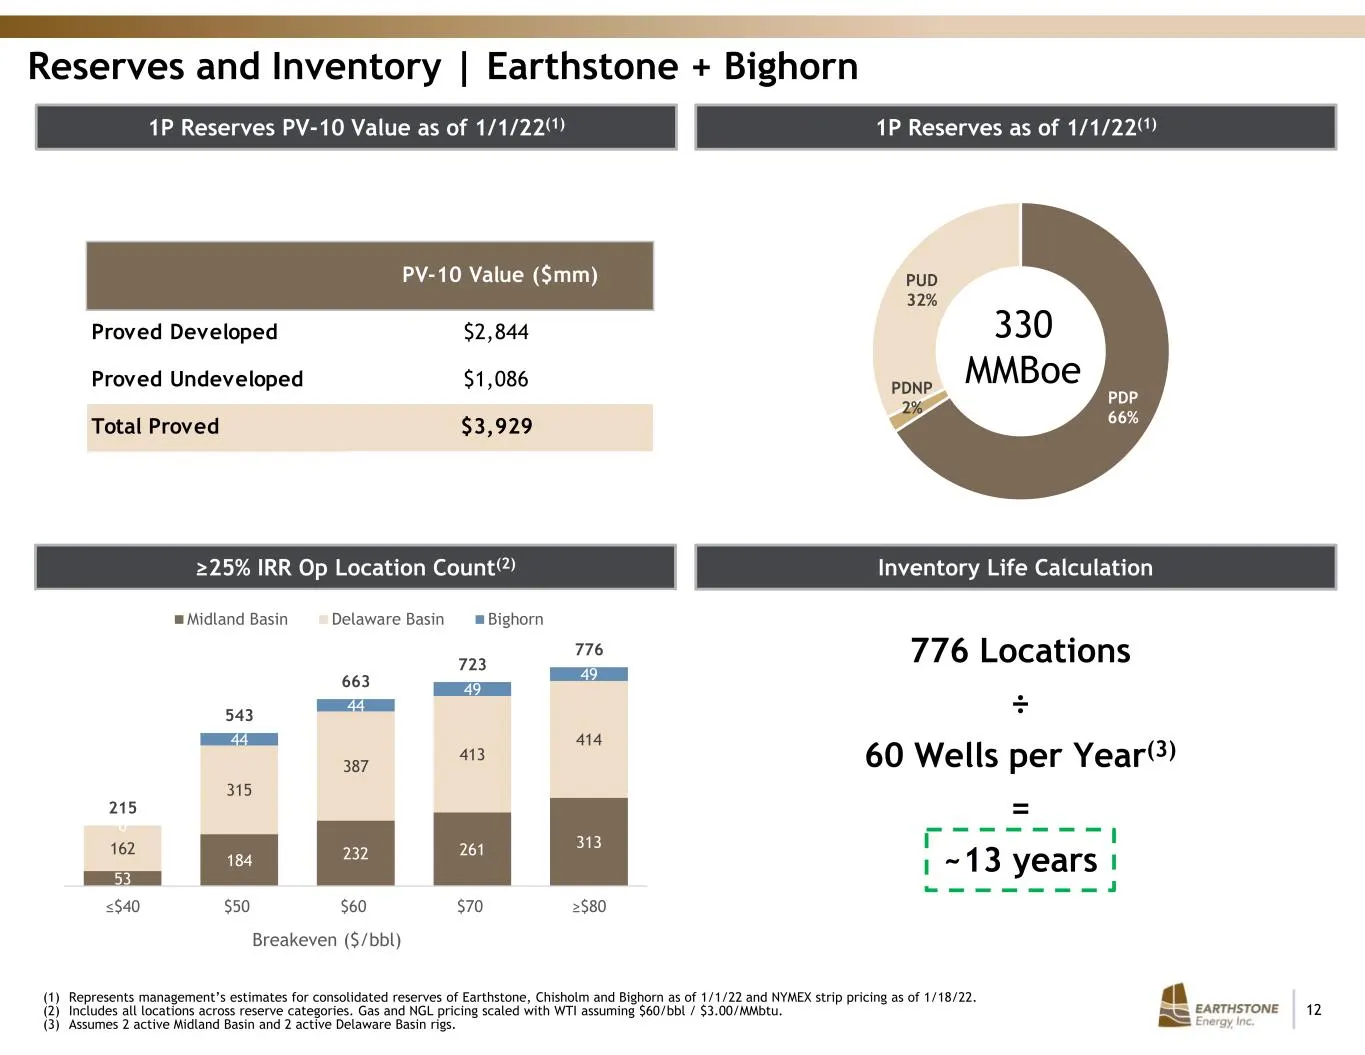
12 Reserves and Inventory | Earthstone + Bighorn 1P Reserves as of 1/1/22(1)1P Reserves PV-10 Value as of 1/1/22(1) ≥25% IRR Op Location Count(2) Inventory Life Calculation 776 Locations ÷ 60 Wells per Year(3) = ~13 years (1) Represents management’s estimates for consolidated reserves of Earthstone,
Slide 13: Financial Overview
Financial Overview EARTHSTONE | 13 Energy Ine.
Slide 14: 2022 Guidance
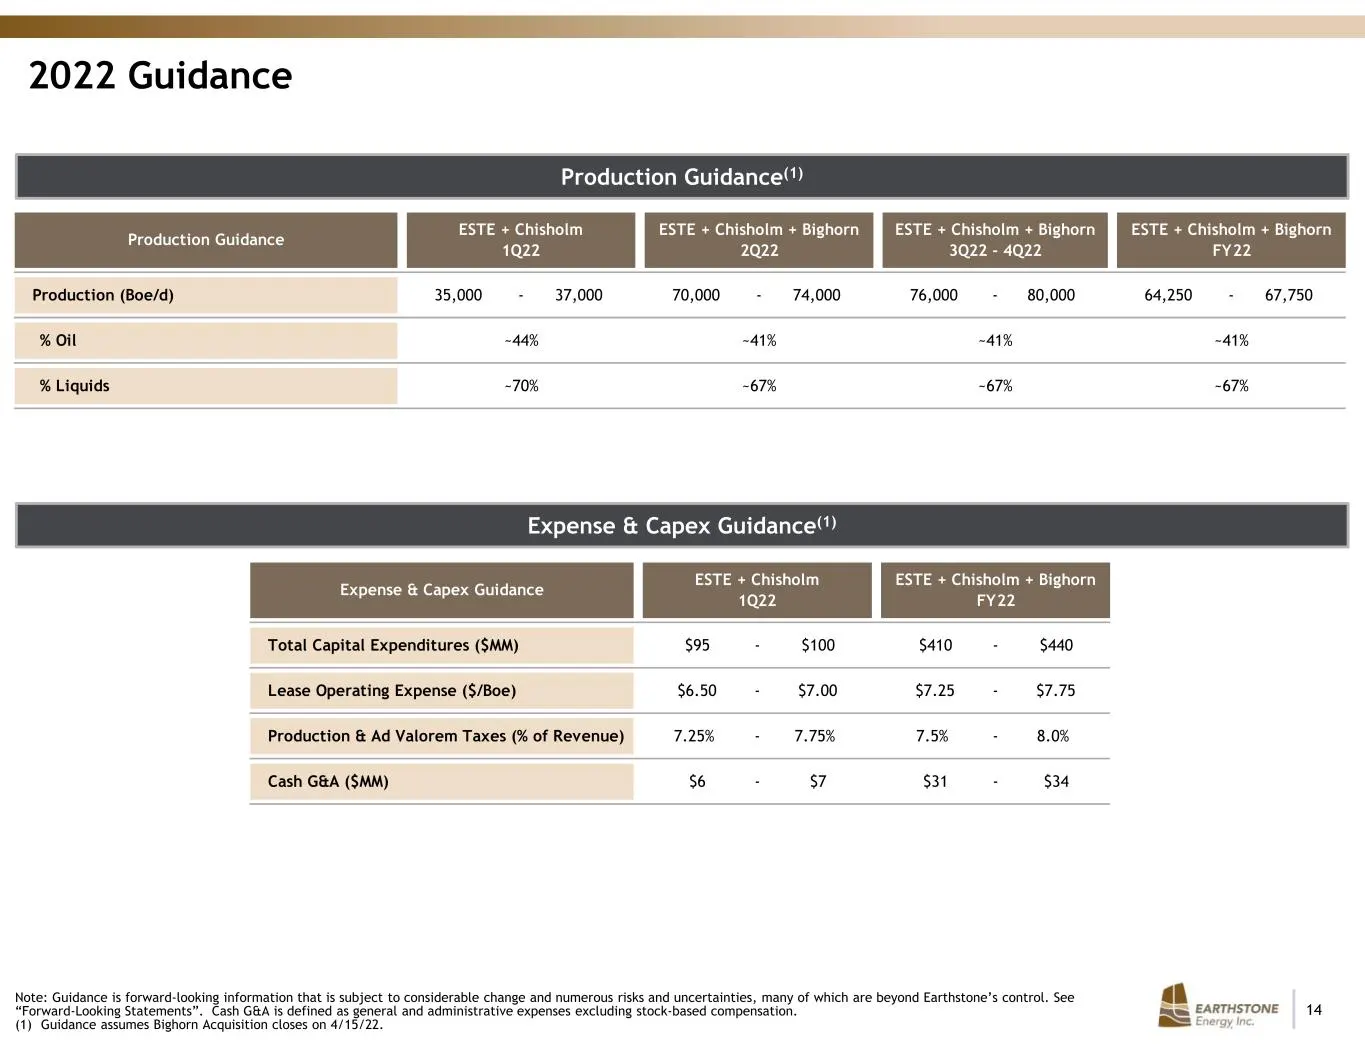
14 2022 Guidance Production Guidance(1) Expense & Capex Guidance(1) Note: Guidance is forward-looking information that is subject to considerable change and numerous risks and uncertainties, many of which are beyond Earthstone’s control. See “Forward-Looking Statements”. Cash G&A is defined as gener
Slide 15: 2022 Capital Program: Earthstone + Chisholm + Bighorn
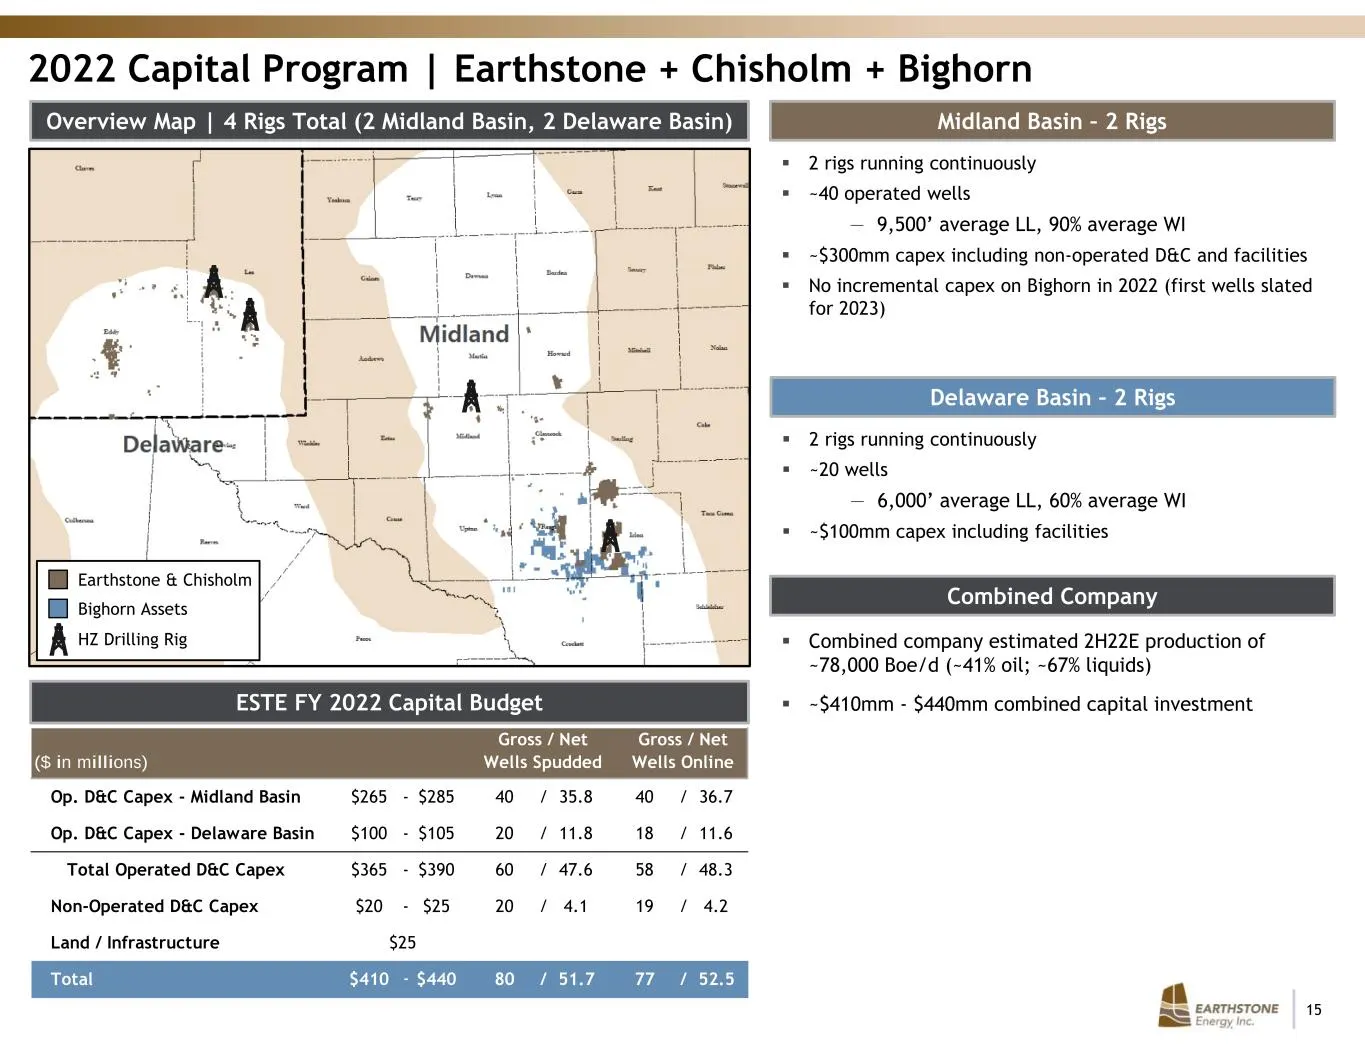
15 Midland Basin – 2 RigsOverview Map | 4 Rigs Total (2 Midland Basin, 2 Delaware Basin) 2 rigs running continuously ~40 operated wells — 9,500’ average LL, 90% average WI ~$300mm capex including non-operated D&C and facilities No incremental capex on Bighorn in 2022 (first wells slated for
Slide 16: Oil and Gas Hedging Summary
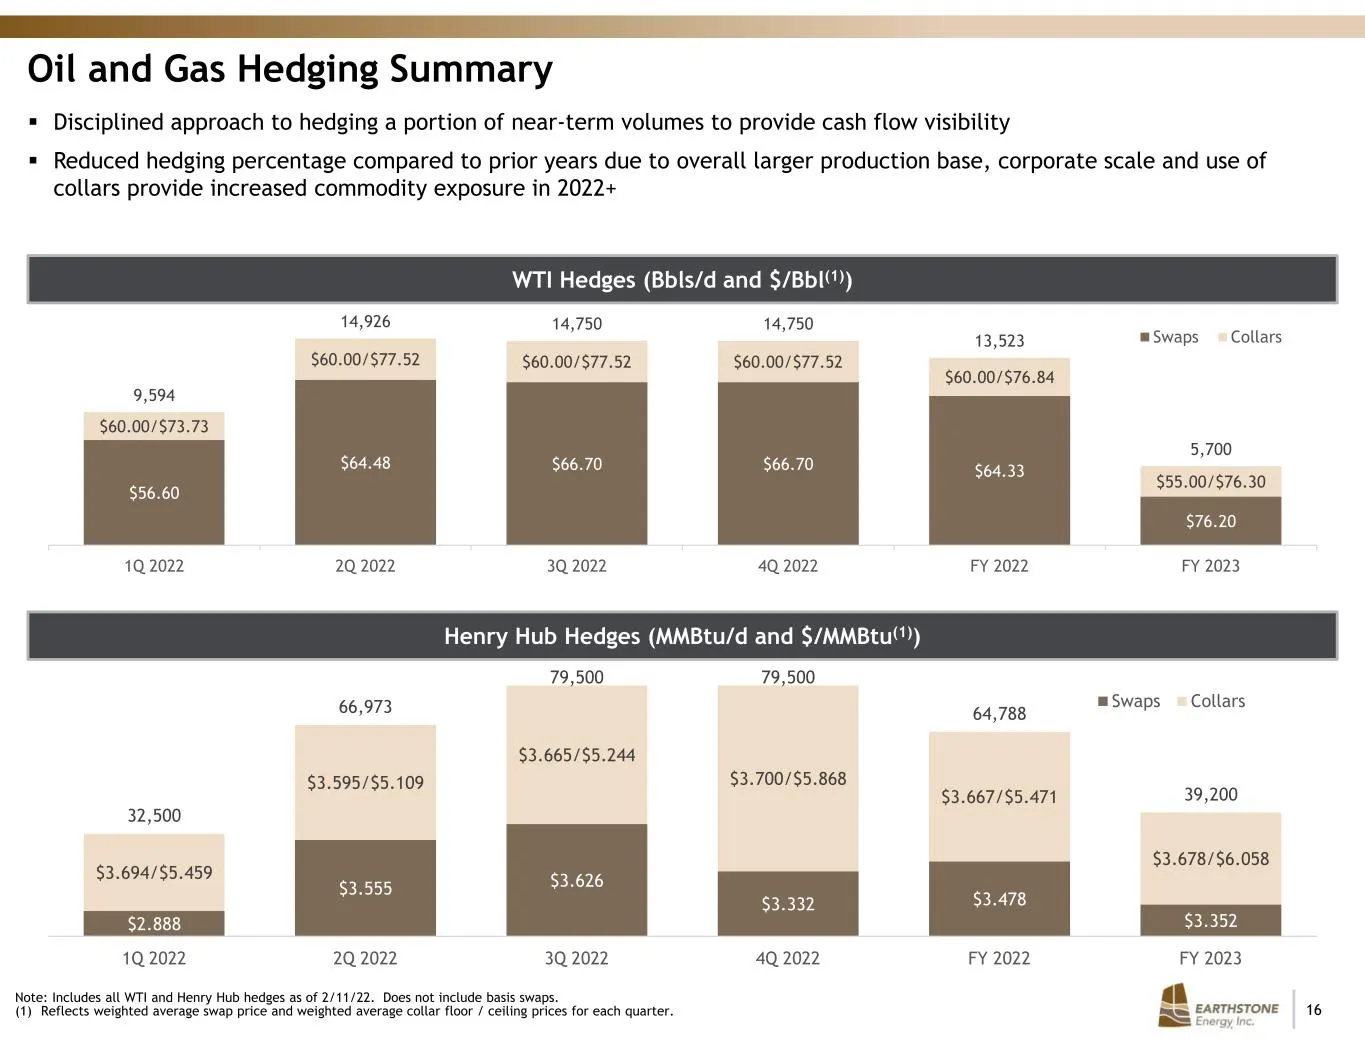
16 Oil and Gas Hedging Summary WTI Hedges (Bbls/d and $/Bbl(1)) Henry Hub Hedges (MMBtu/d and $/MMBtu(1)) Note: Includes all WTI and Henry Hub hedges as of 2/11/22. Does not include basis swaps. (1) Reflects weighted average swap price and weighted average collar floor / ceiling prices for each quar
Slide 17: Analyst Coverage
17 Analyst Coverage Firm Analyst Contact Info Alliance Global Partners Jeffrey Campbell / 888-543-4448 / jcampbell@allianceg.com Benchmark Subash Chandra / 212-312-6755 / schandra@benchmarkcompany.com Johnson Rice Charles Meade / 504-584-1274 / cmeade@jrco.com RBC Scott Hanold / 512-708-6354 / scott
Slide 18: Contact Information
18 Mark Lumpkin, Jr. EVP, Chief Financial Officer Scott Thelander Vice President of Finance Corporate Offices Houston 1400 Woodloch Forest Drive | Suite 300 | The Woodlands, TX 77380 | (281) 298-4246 Midland 600 N. Marienfeld | Suite 1000 | Midland, TX 79701 | (432) 686-1100 Website www.earthstoneen
Slide 19: Appendix
Appendix EARTHSTONE | 19 Energy Ine.
Slide 20: Pending Bighorn Acquisition
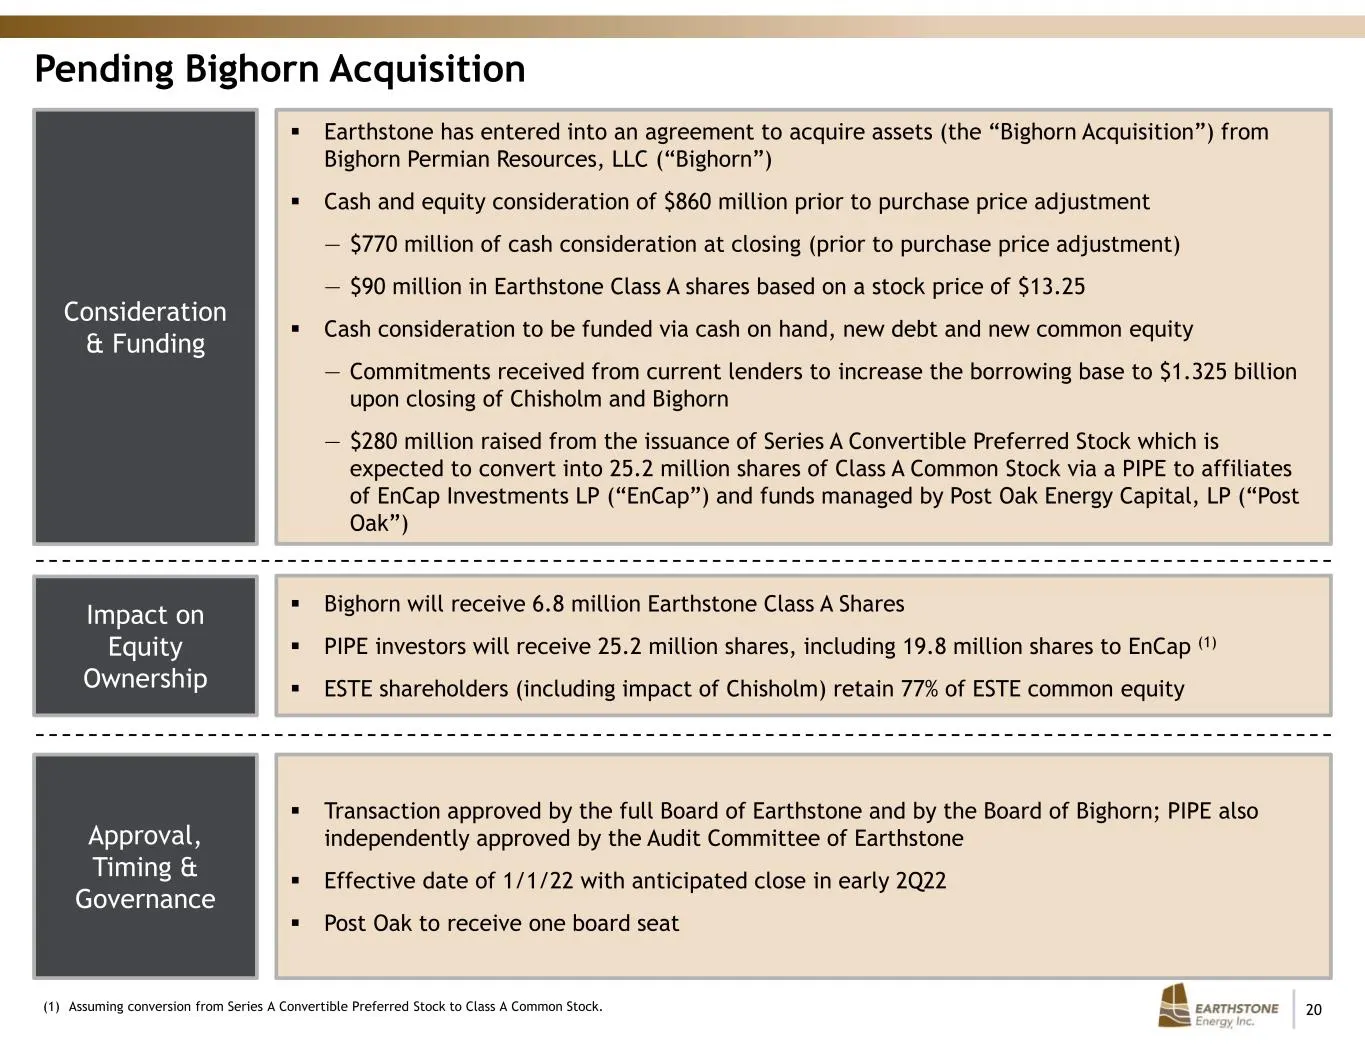
20 Pending Bighorn Acquisition Consideration & Funding Impact on Equity Ownership Approval, Timing & Governance Earthstone has entered into an agreement to acquire assets (the “Bighorn Acquisition”) from Bighorn Permian Resources, LLC (“Bighorn”) Cash and equity consideration of $860 million pri
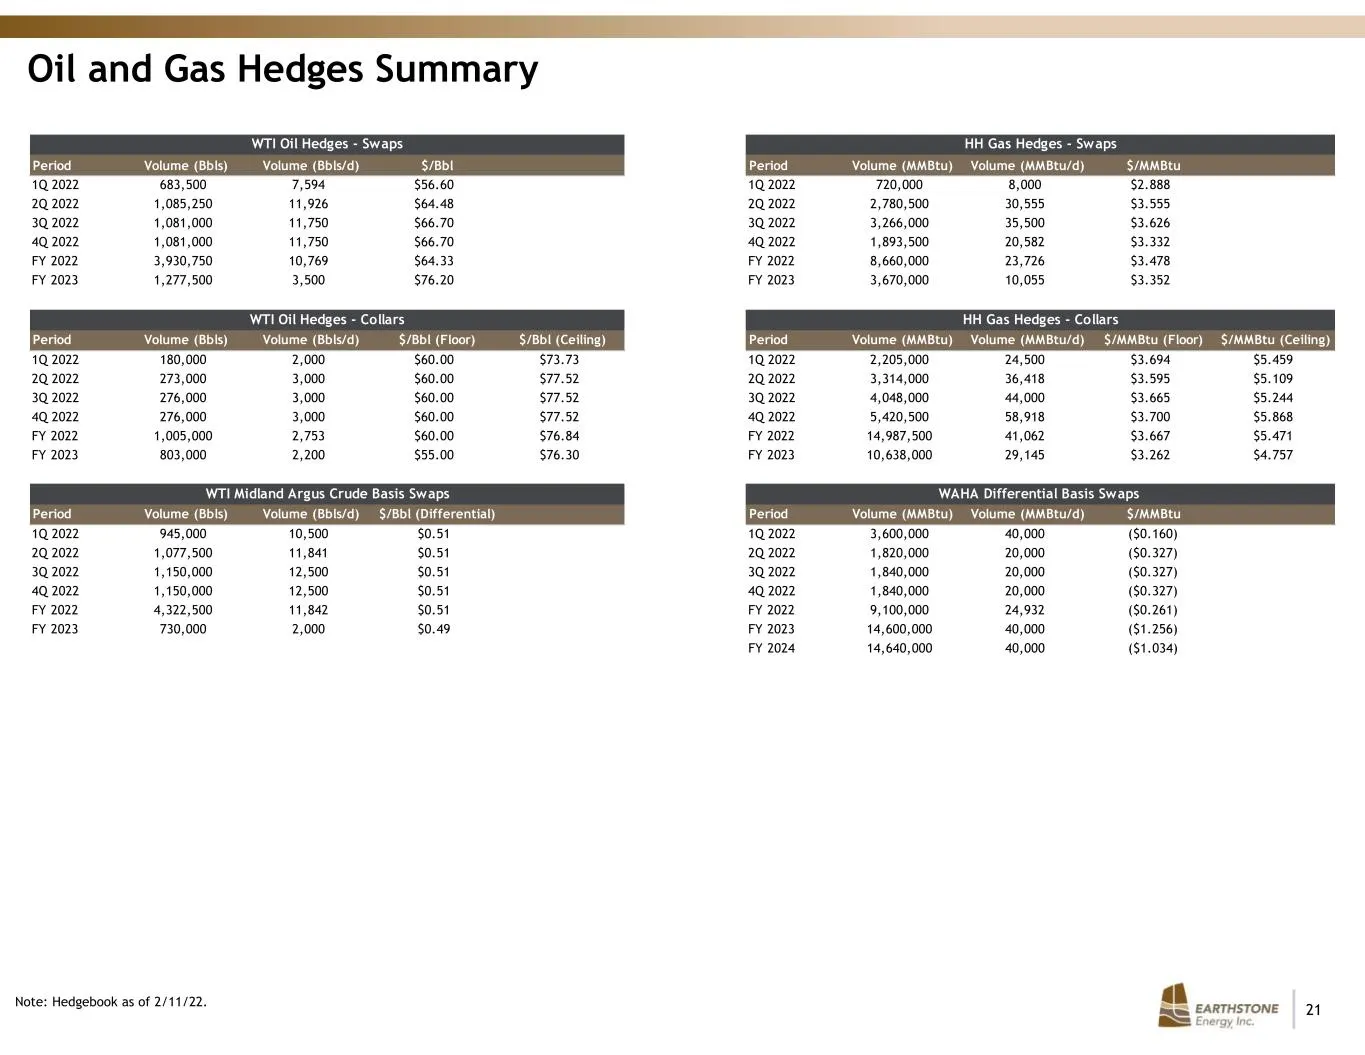
Slide 21: Oil and Gas Hedges Summary
21 Oil and Gas Hedges Summary Note: Hedgebook as of 2/11/22. WTI Oil Hedges - Swaps HH Gas Hedges - Swaps Period Volume (Bbls) Volume (Bbls/d) $/Bbl Period Volume (MMBtu) Volume (MMBtu/d) $/MMBtu 1Q 2022 683,500 7,594 $56.60 1Q 2022 720,000 8,000 $2.888 2Q 2022 1,085,250 11,926 $64.48 2Q 2022 2,780,
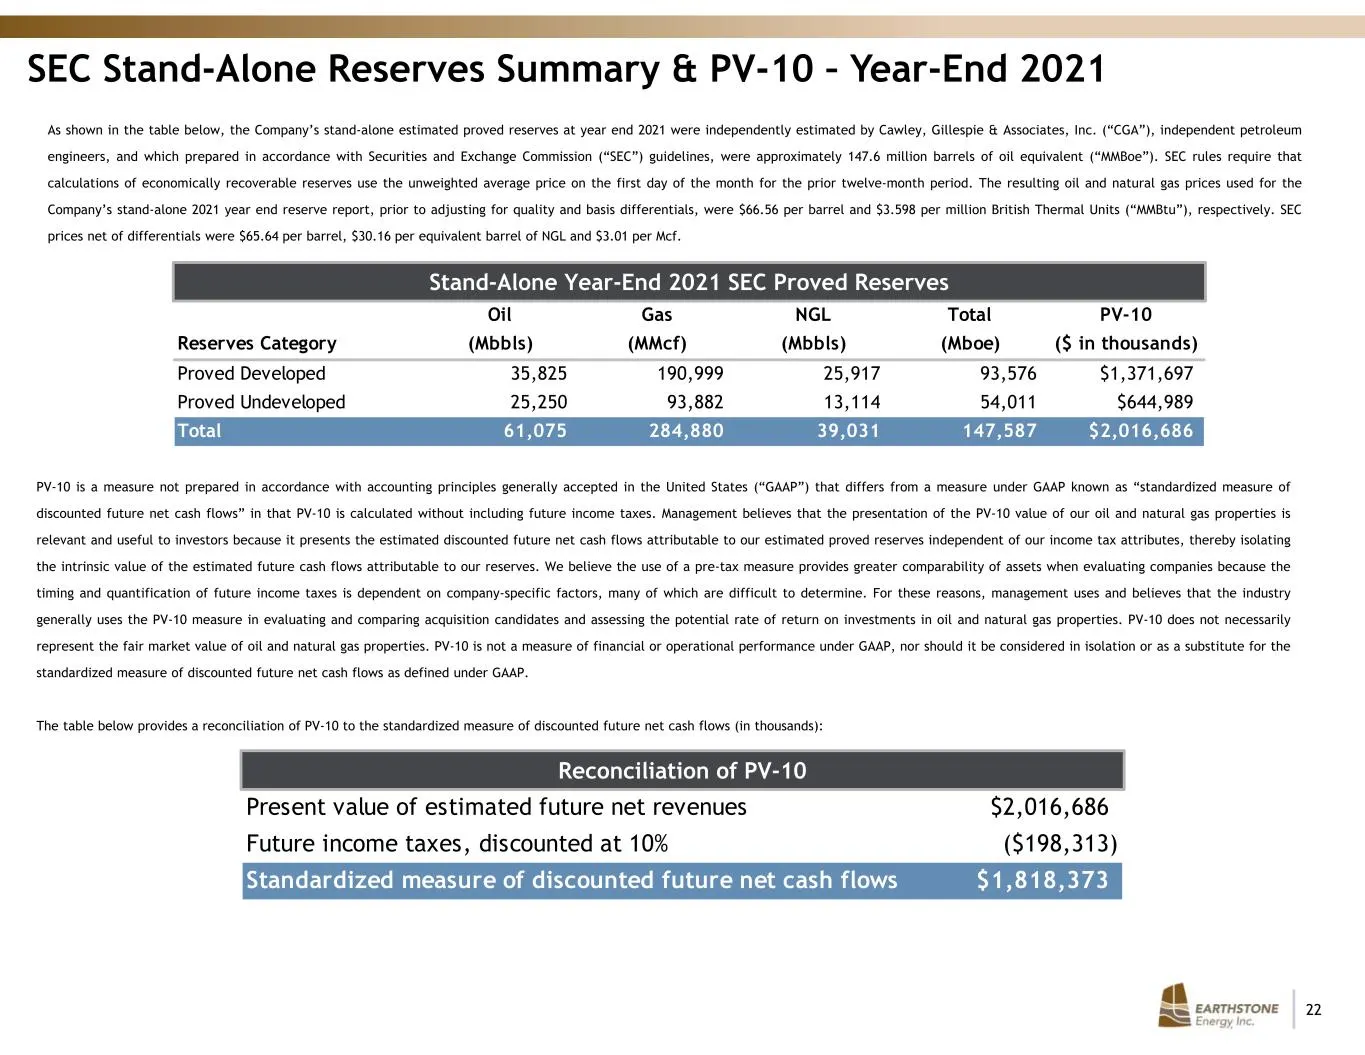
Slide 22: SEC Stand-Alone Reserves Summary & PV-10 – Year-End 2021
22 SEC Stand-Alone Reserves Summary & PV-10 – Year-End 2021 As shown in the table below, the Company’s stand-alone estimated proved reserves at year end 2021 were independently estimated by Cawley, Gillespie & Associates, Inc. (“CGA”), independent petroleum engineers, and which prepared in accordanc
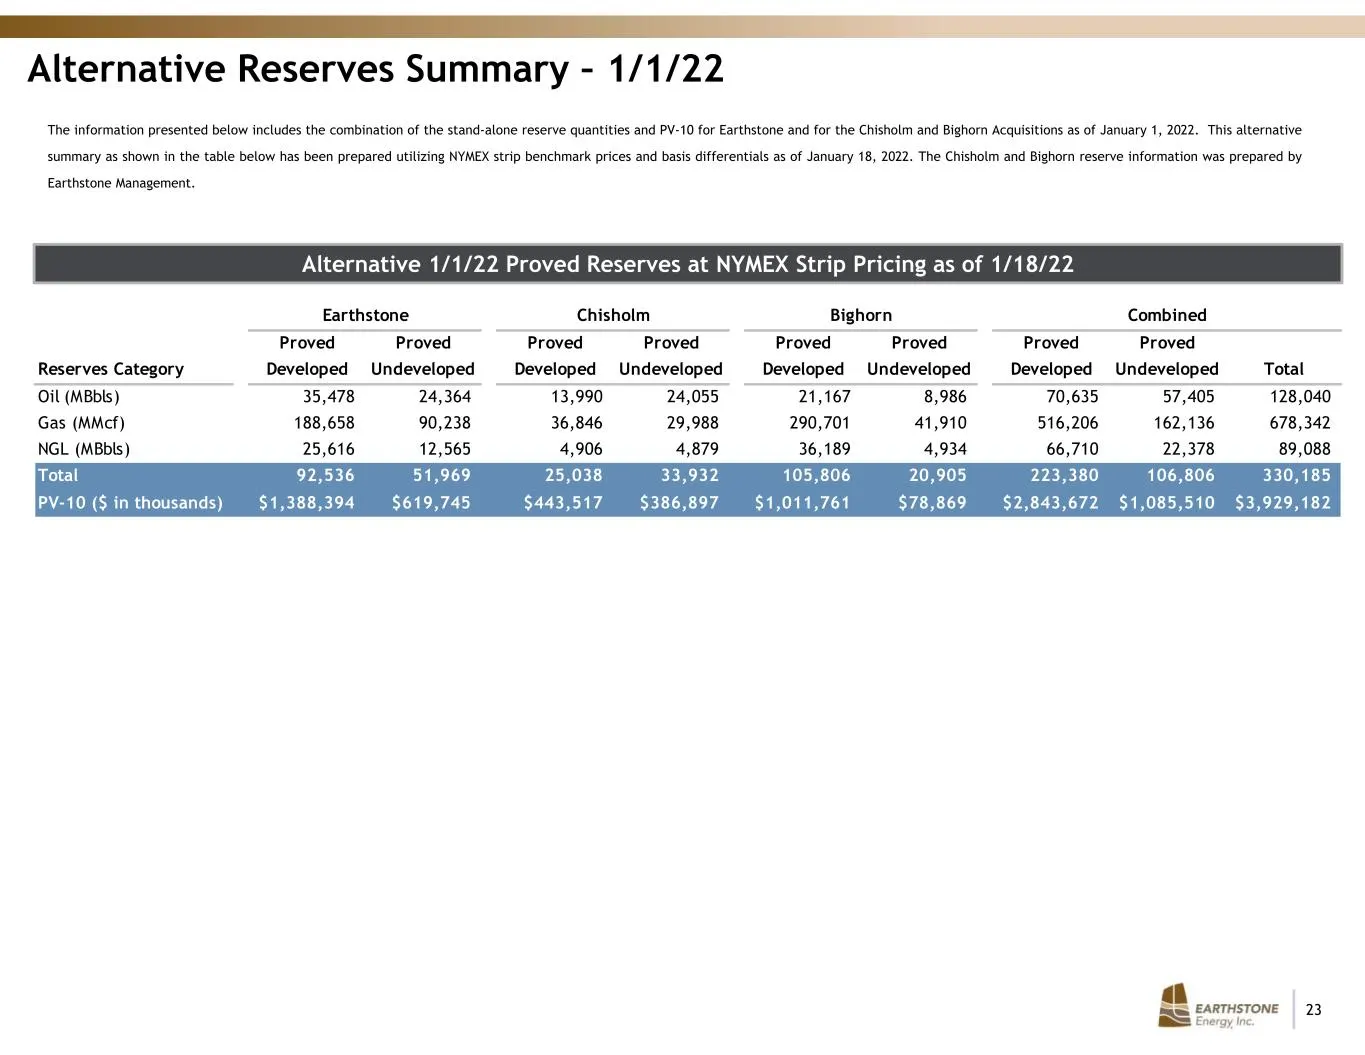
Slide 23: Alternative Reserves Summary – 1/1/22
23 Alternative Reserves Summary – 1/1/22 The information presented below includes the combination of the stand-alone reserve quantities and PV-10 for Earthstone and for the Chisholm and Bighorn Acquisitions as of January 1, 2022. This alternative summary as shown in the table below has been prepared
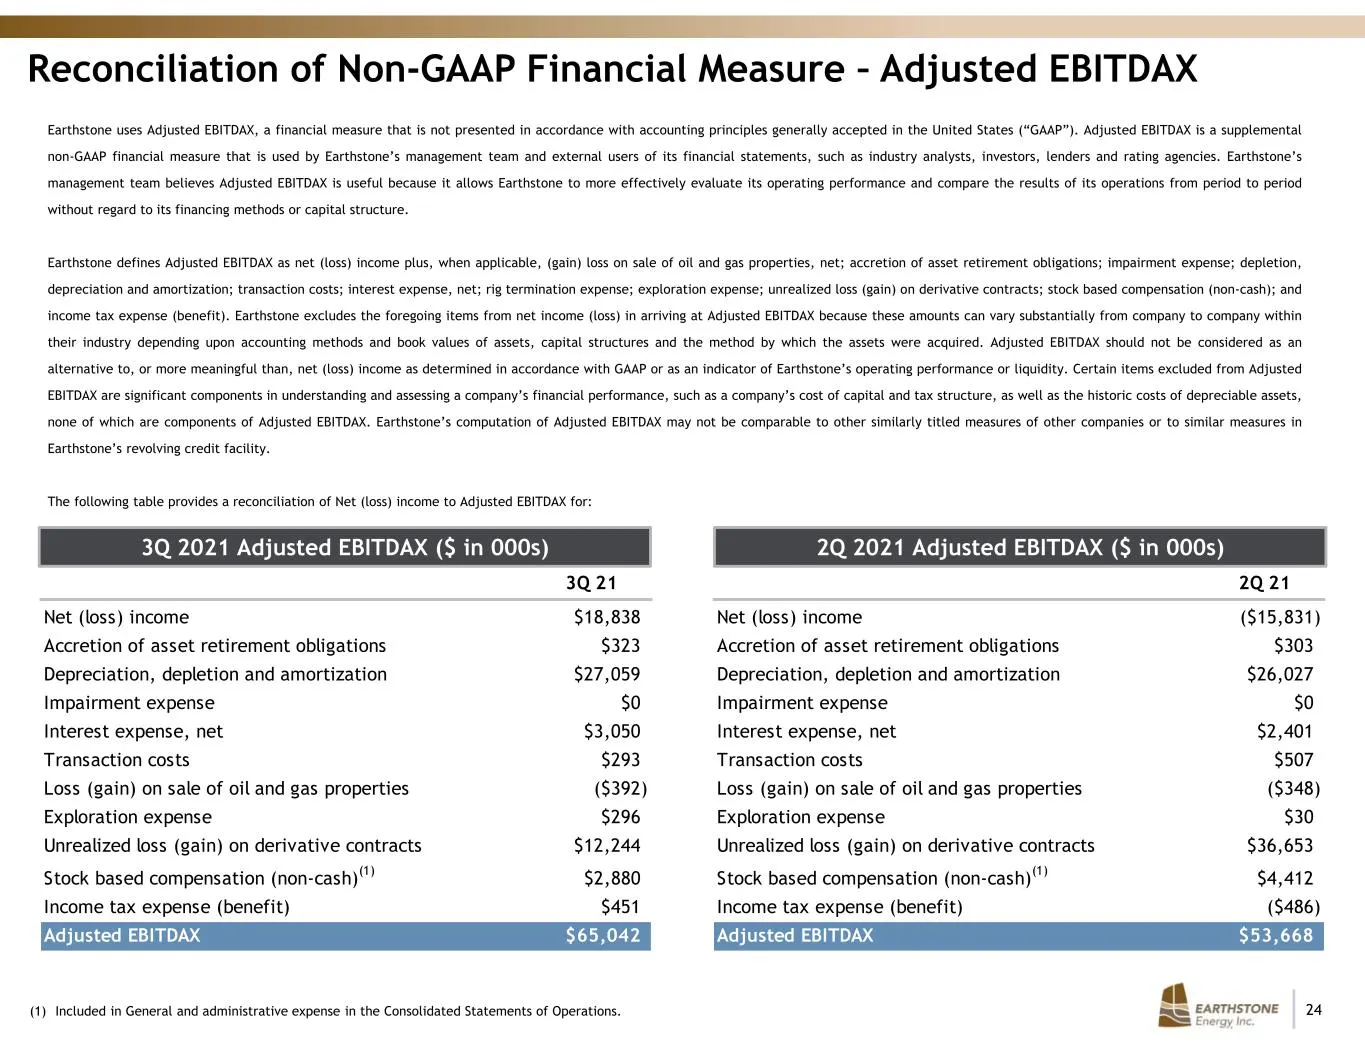
Slide 24: Reconciliation of Non-GAAP Financial Measure – Adjusted EBITDAX
24 Reconciliation of Non-GAAP Financial Measure – Adjusted EBITDAX Earthstone uses Adjusted EBITDAX, a financial measure that is not presented in accordance with accounting principles generally accepted in the United States (“GAAP”). Adjusted EBITDAX is a supplemental non-GAAP financial measure that
Slide 25: Footnotes Page
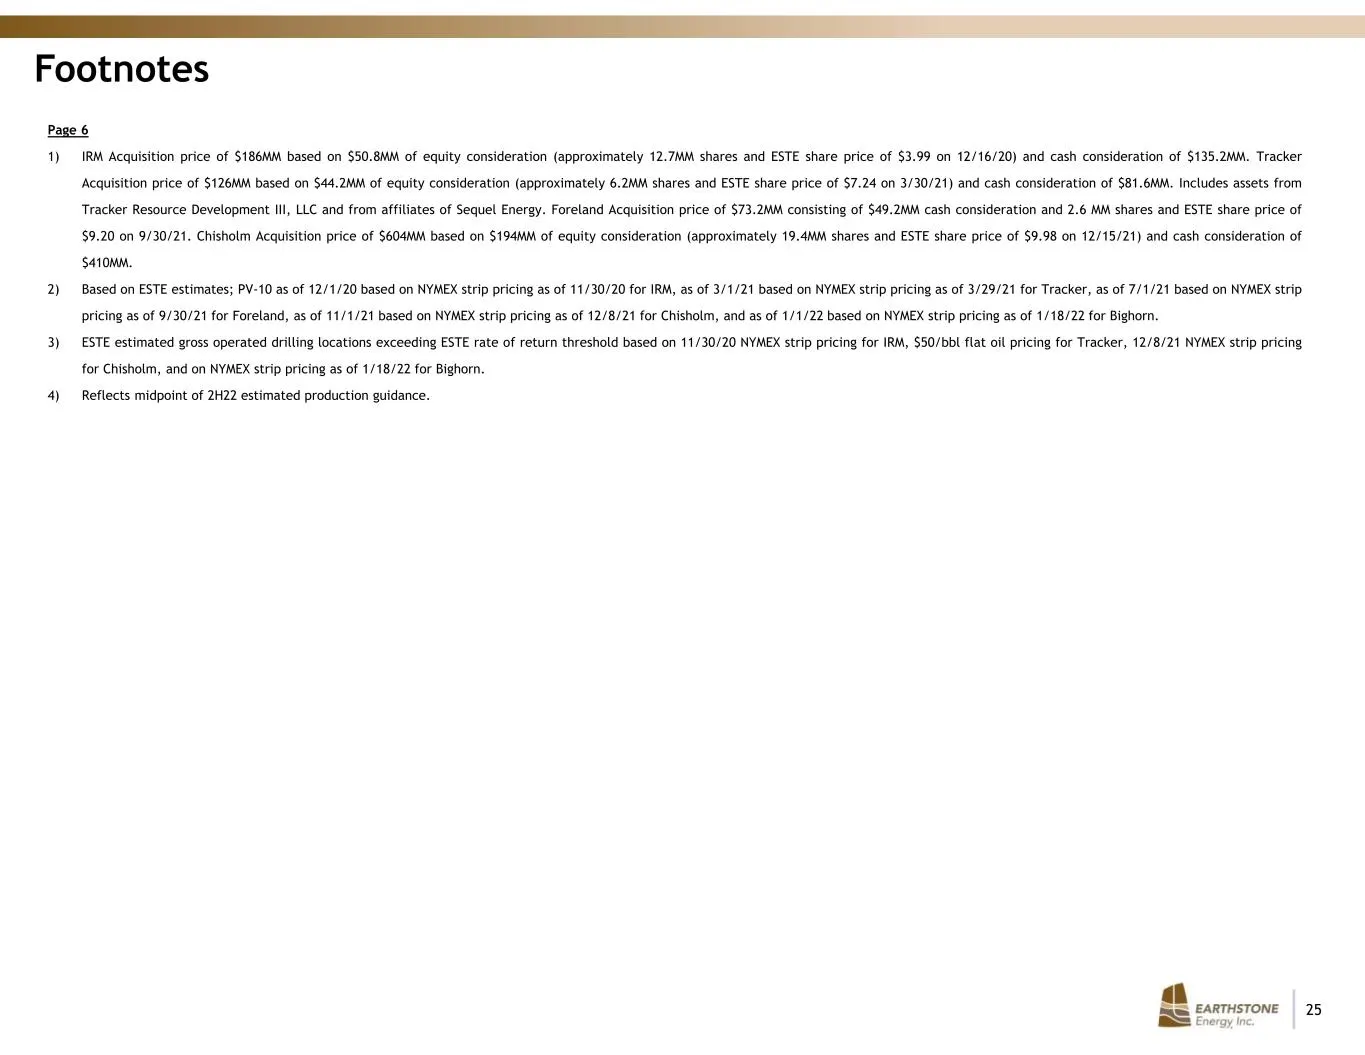
25 Footnotes Page 6 1) IRM Acquisition price of $186MM based on $50.8MM of equity consideration (approximately 12.7MM shares and ESTE share price of $3.99 on 12/16/20) and cash consideration of $135.2MM. Tracker Acquisition price of $126MM based on $44.2MM of equity consideration (approximately 6.2M
Source: SEC EDGAR · 8-K filed Feb 18, 2022
More decks from Earthstone Energy Inc
 Merger or Acquisition (August 2023)20 slides · Aug 23, 2023
 EnerCom Denver 202332 slides · Aug 14, 2023
 Q2 2023 Earnings Presentation25 slides · Aug 2, 2023
 Investor Presentation (June 2023)29 slides · Jun 20, 2023
 Merger or Acquisition (June 2023)16 slides · Jun 16, 2023
 Q1 2023 Earnings Presentation33 slides · May 3, 2023