Navistar International Corporation
Navistar International — Jefferies Annual Global Industrials Conference 2011
24 slides from Navistar International's conference presentation, Aug 9, 2011
Slide 1: Jefferies Annual Global Industrials
Exhibit 99.1 1 NYSE: NAV For more than 175 years we’ve been helping people from every corner of the world move the goods that move the welfare of entire nations. Jefferies Annual Global Industrials August 10th, 2011

Slide 2: Safe Harbor Statement & Other Cautionary Notes
2 2 Safe Harbor Statement & Other Cautionary Notes Information provided and statements contained in this presentation that are not purely historical are forward-looking statements within the meaning of Section 27A of the Securities Act of 1933, as amended, Section 21E of the Securities Exchange Act
Slide 3: Agenda
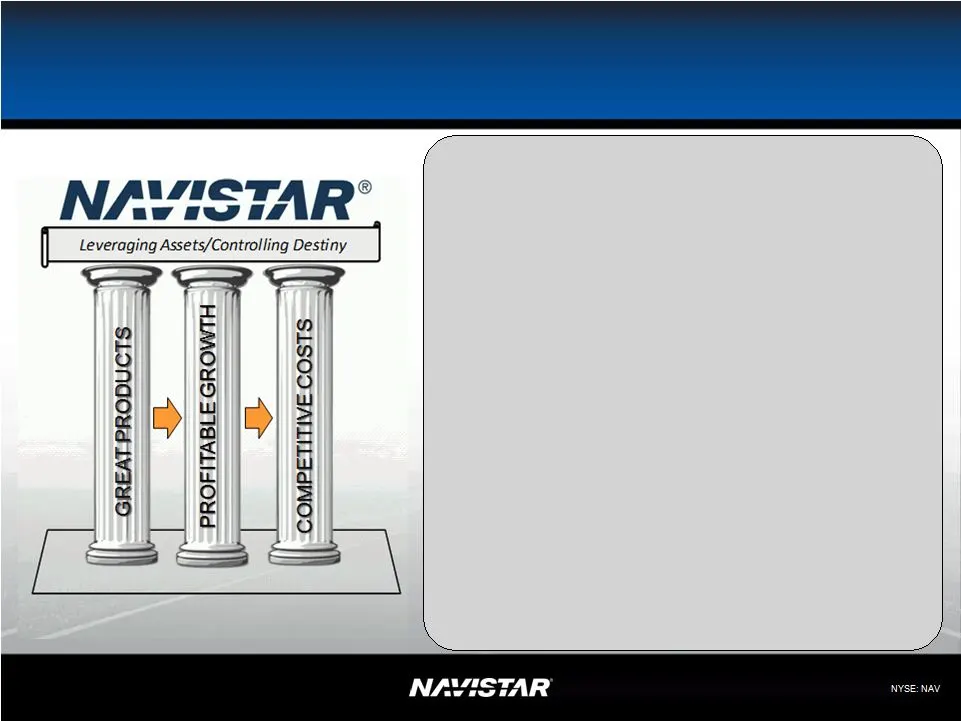
3 3 Agenda • Driving shareholder value • Three pillar strategy – Great products – Competitive cost structure – Profitable growth • 2011 Update – Operations – Financial guidance
Slide 4: Driving Shareholder Value
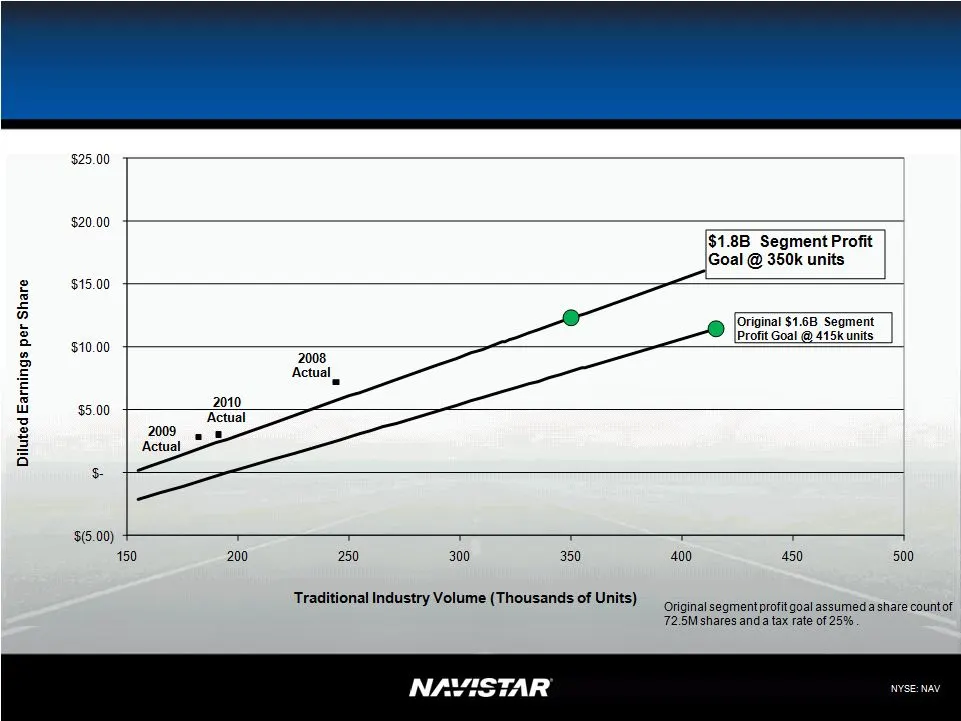
4 4 Driving Shareholder Value Note: This slide contains non-GAAP information, please see the REG G in appendix for a detailed reconciliation. 2011 FY Guidance does not include the impact of Engineering Integration; Valuation Allowance release; restructuring of Chatham, Workhorse and Monaco and impai
Slide 5: Leader in Products, Technology and Innovation
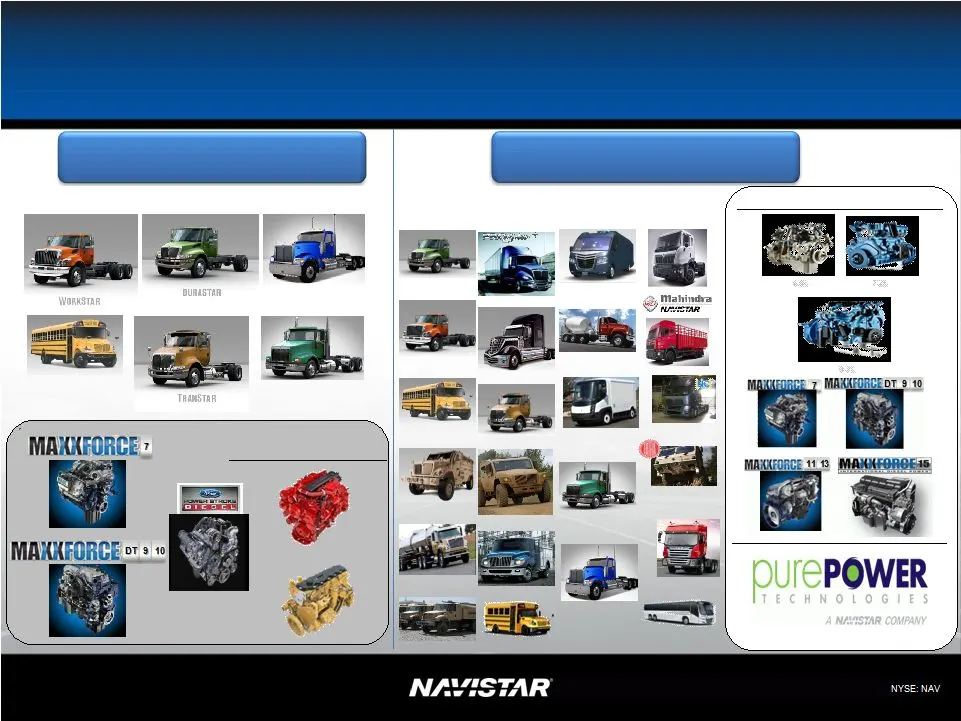
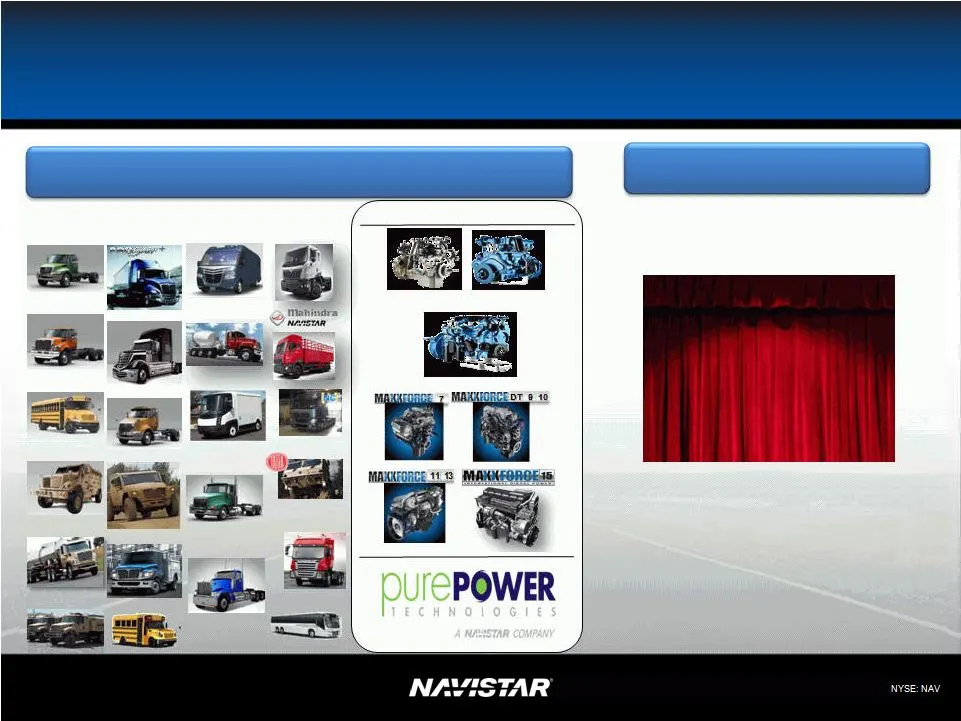
5 5 Leader in Products, Technology and Innovation 2007 Product Offerings 2011 Product Offerings – Well Positioned For the Future Purchased Engines 9900 SCHOOL BUS 9200 / 9400 Global Powertrain 7.2L 9.3L 4.8L
Slide 6: Leader in Products, Technology and Innovation: What's Next
6 6 Leader in Products, Technology and Innovation 2011 Product Offerings – Well Positioned For the Future What’s Next: Global Class 8 Truck Global Powertrain 7.2L 9.3L 4.8L
Slide 7: Competitive Cost Structure
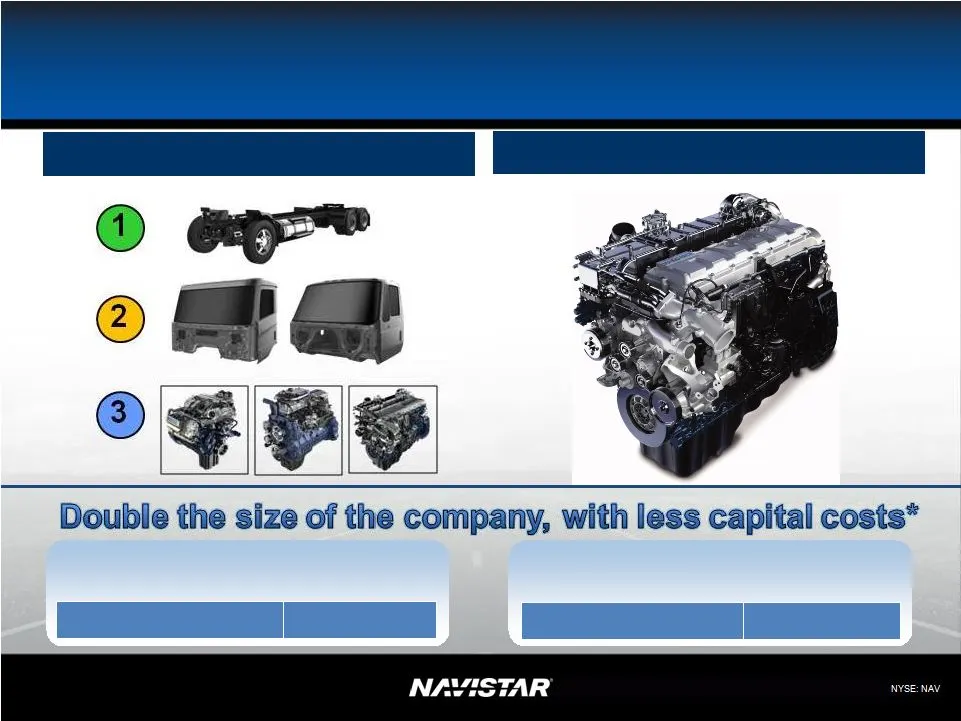
7 7 Competitive Cost Structure Leveraging Assets/Controlling Destiny Scale 1-2-3 13L/15L Cost Total (‘01 – ’05) $1,423M Total (‘06 – ’10) $1,103M *Capital expenditures excluding equity investments At $15 to $20+ Billion Company (Normal Industry) At $7 to $8 Billion Company
Slide 8
Slide 9: Great Products – Market Share (U.S. & Canada)
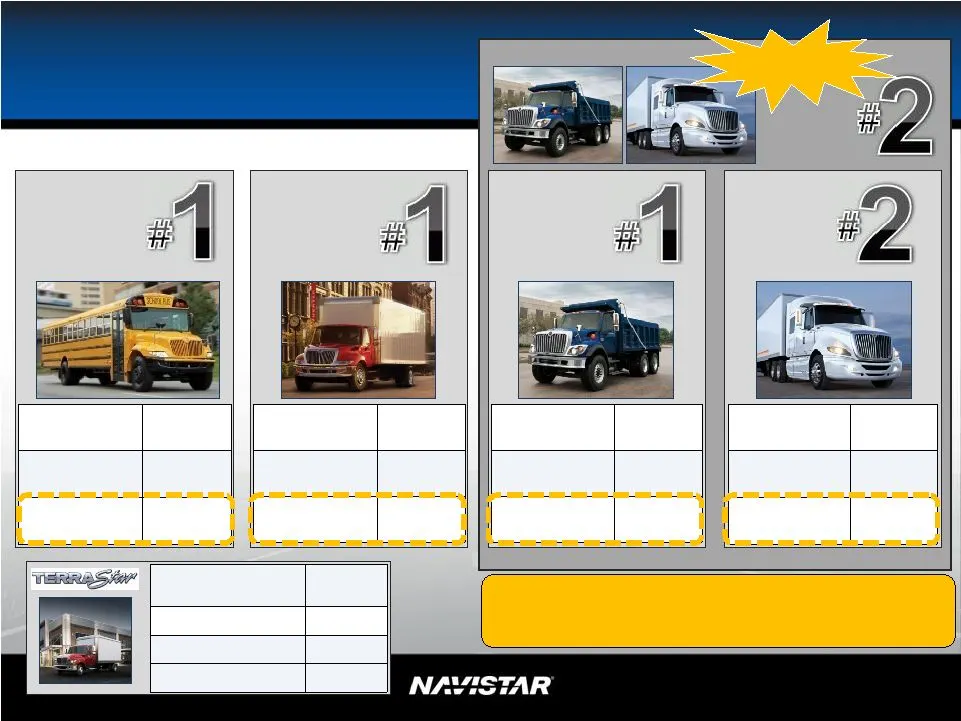
Great Products – Market Share (U.S. & Canada) 9 NYSE: NAV Medium Truck Severe Service Truck Heavy Truck FY09 61% FY10 59% JuneYTD11 47% FY09 35% FY10 38% JuneYTD11 39% FY09 34% FY10 33% JuneYTD11 33% FY09 25% FY10 24% JuneYTD11 16% Combined Class 8 School Bus Class 4-5 JuneYTD Industry 23K Navistar
Slide 10: Great Products – Growing Market Share with Increased Customer Experience
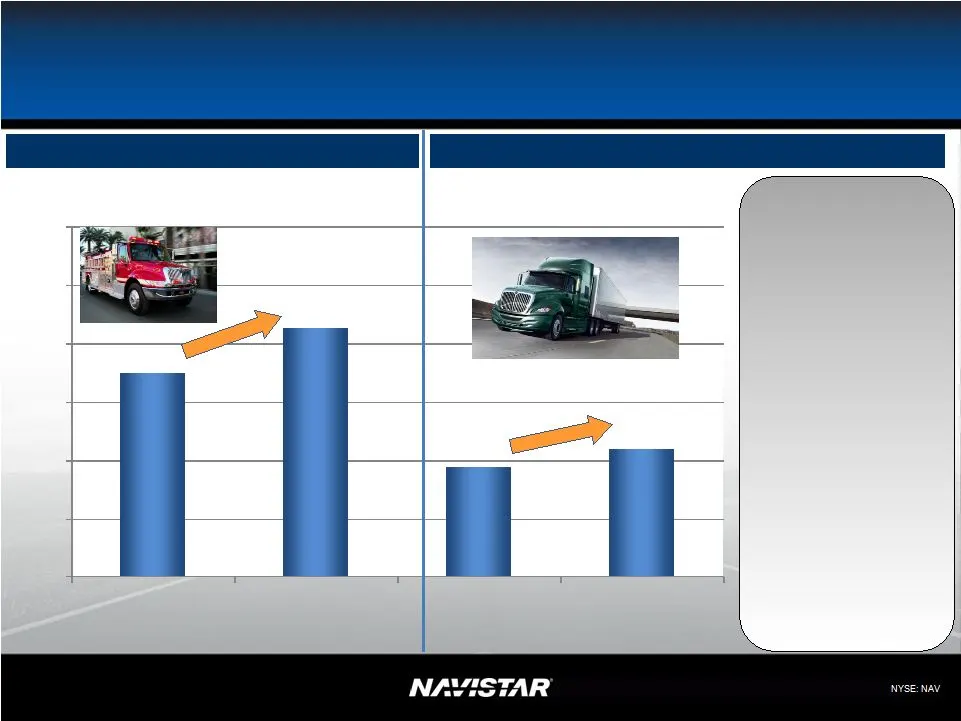
10 10 Great Products – Growing Market Share with Increased Customer Experience (U.S. & Canada) Class 6-7 Combined Class 8 35% 43% 19% 22% 0% 10% 20% 30% 40% 50% 60% Nov-Mar Apr-Jun Nov-Mar Apr-Jun Class 8 Strategy What We’ve Said • Convert to proprietary U.S. and Canada diesel engine • Transition in
Slide 11: U.S. and Canada Heavy Strategy – Launch of Derivative Products
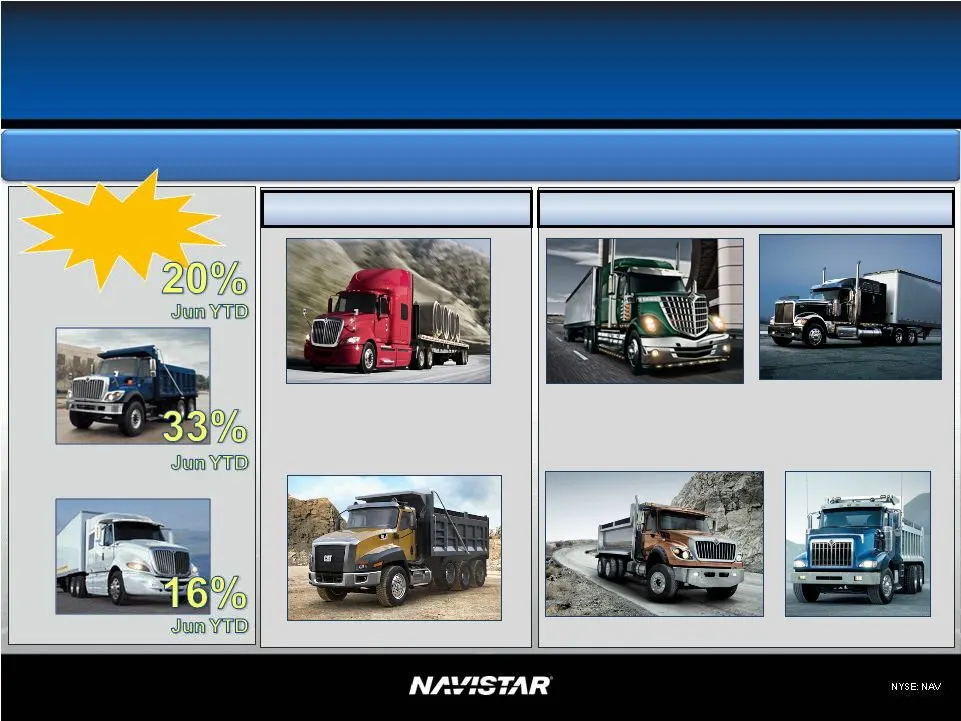
11 11 U.S. and Canada Heavy Strategy – Launch of Derivative Products Continue to Broaden Product Offering Severe Service Heavy ProStar ® with MaxxForce ® Sloped Nose WorkStar ® PayStar ® with MaxxForce ® LoneStar ® with 500HP MaxxForce ® 9900 with MaxxForce ® CAT CT660 Available now Expected Q1 201
Slide 12: Navistar Defense
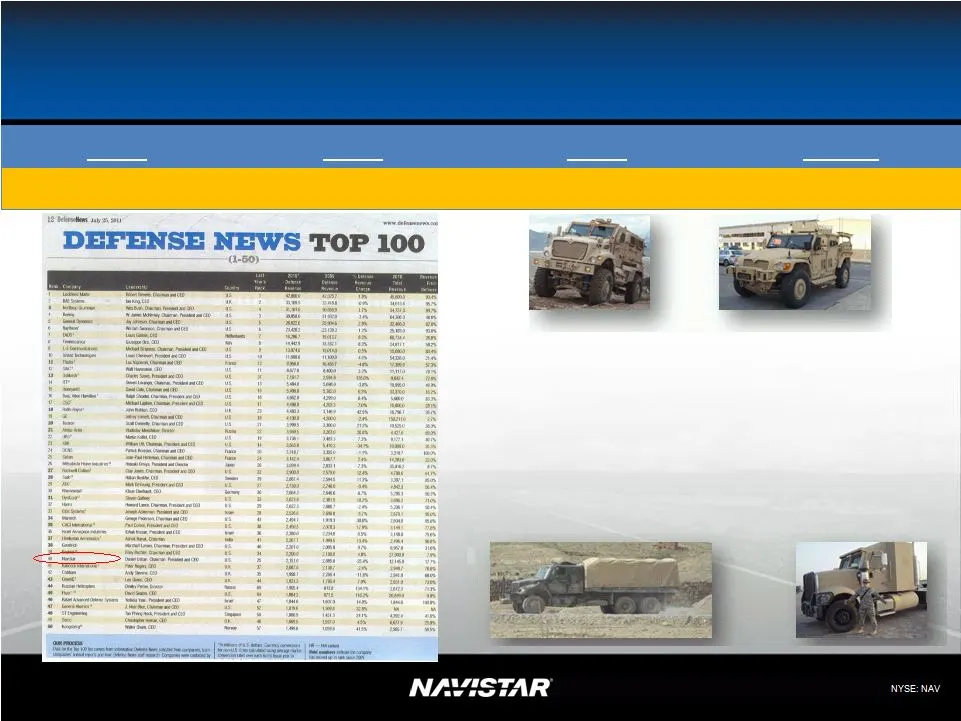
12 12 Navistar Defense 2008 2009 2010 2011+ • Era of efficiency – Government will look to industry for: • Higher quality • Lower cost • Quicker development • Sustainment of existing vehicle fleets will continue (increase) > $2B > $2B > $2B ~$1.9B
Slide 13: Differentiated Global Distribution
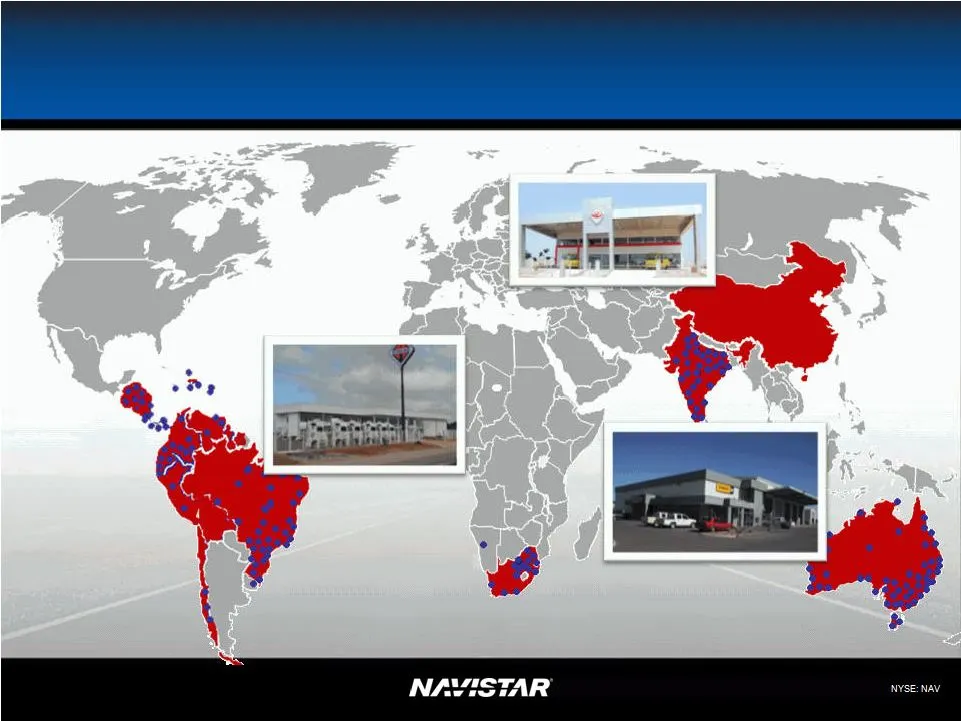
13 13 Differentiated Global Distribution Currently 410 branded sales or service points
Slide 14: Results – Vehicle Integration Drives Profitable Growth
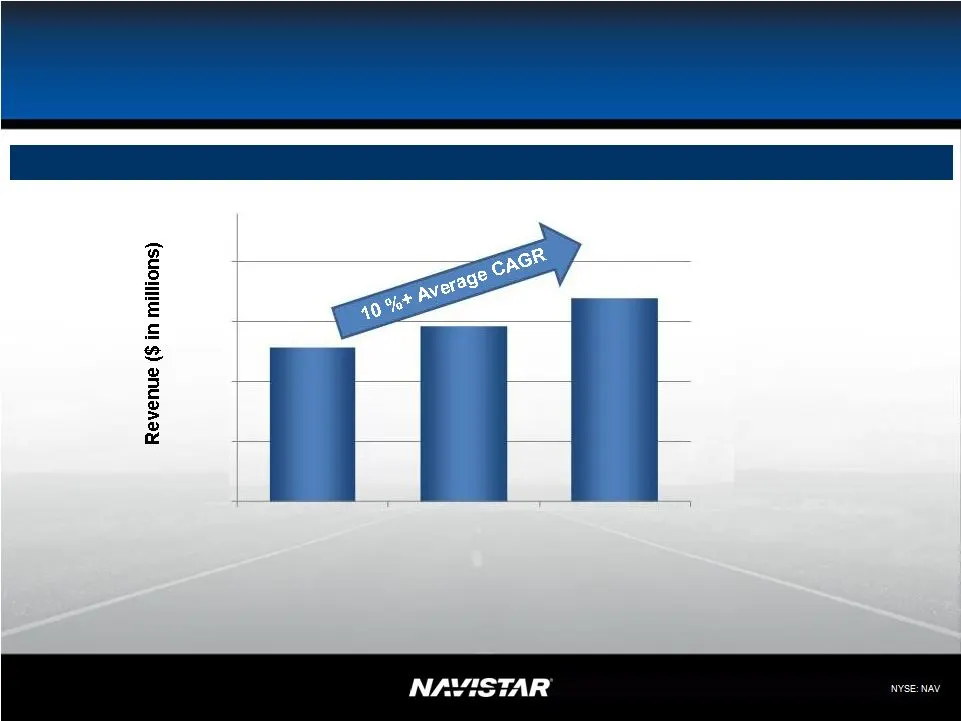
14 14 Results – Vehicle Integration Drives Profitable Growth North American Parts Sales (U.S., Canada, Mexico, excludes Military) $0 $500 $1,000 $1,500 $2,000 2009 2010 2011 Fcst
Slide 15
Slide 16: Maximize Profit While Protecting Markets
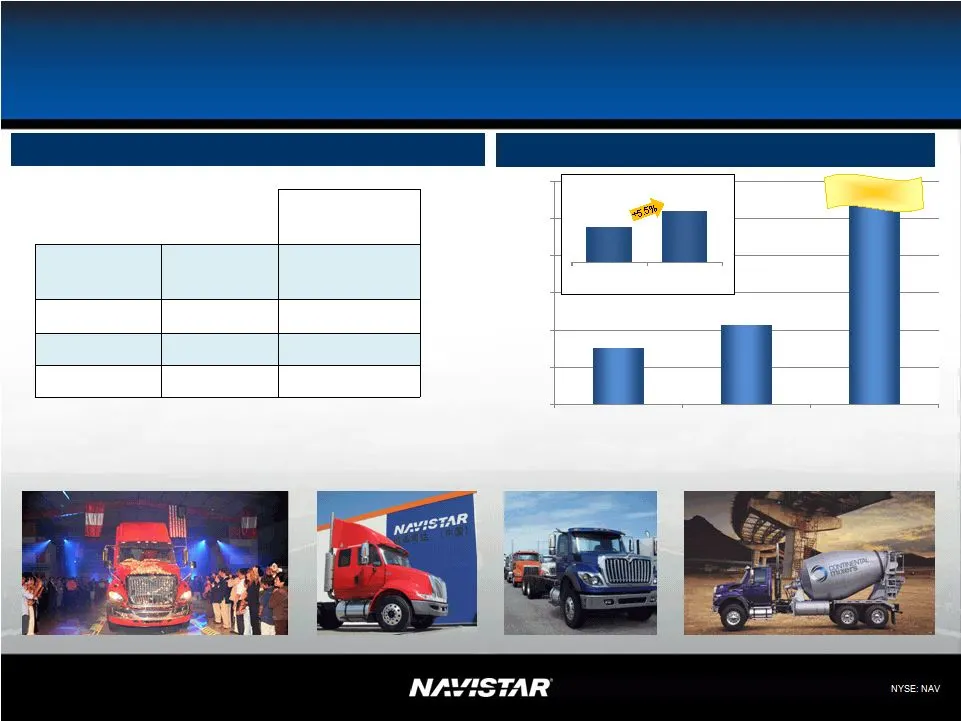
16 16 Maximize Profit While Protecting Markets Balance needs of customers with supplier capacity Global Truck: Latin America & Caribbean U.S. and Canada Combined Class 8 Retail Sales 3,000 4,300 2,000 4,000 6,000 8,000 10,000 12,000 FY 2010 FY 2011 YTD June FY 2011 FCST As reported on 6/7/2011 in Q2
Slide 17: What We Said vs. Today
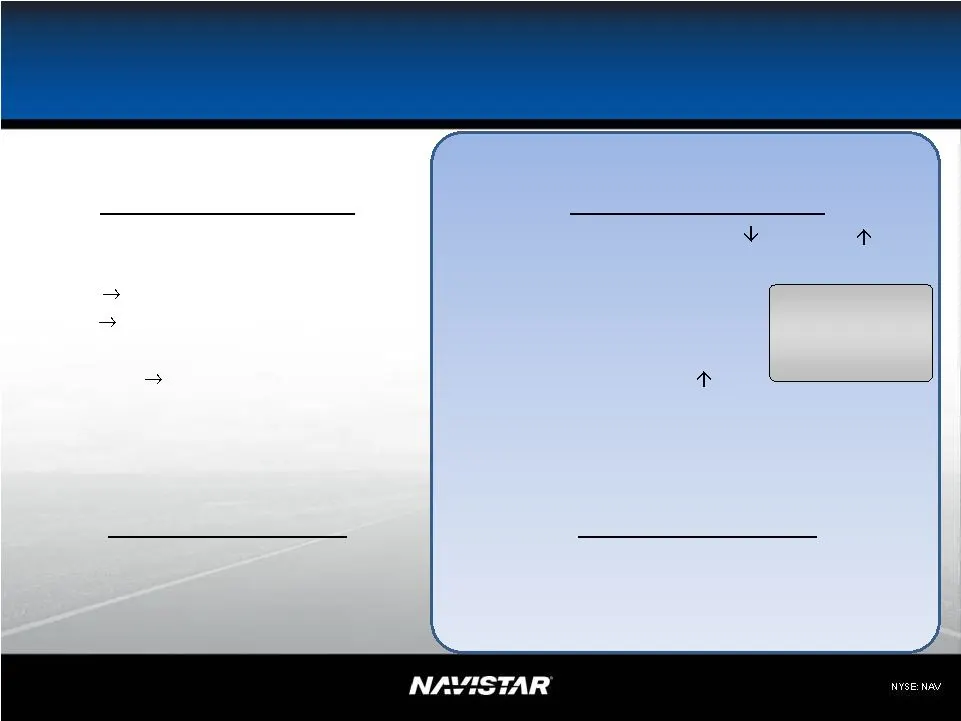
17 What We Said: Note: This slide contains non-GAAP information, please see the REG G in appendix for a detailed reconciliation. 2011 FY Guidance does not include the impact of Engineering Integration; Valuation Allowance release; restructuring of Chatham, Workhorse and Monaco and impairment charges
Slide 18: 2011 Financial Guidance
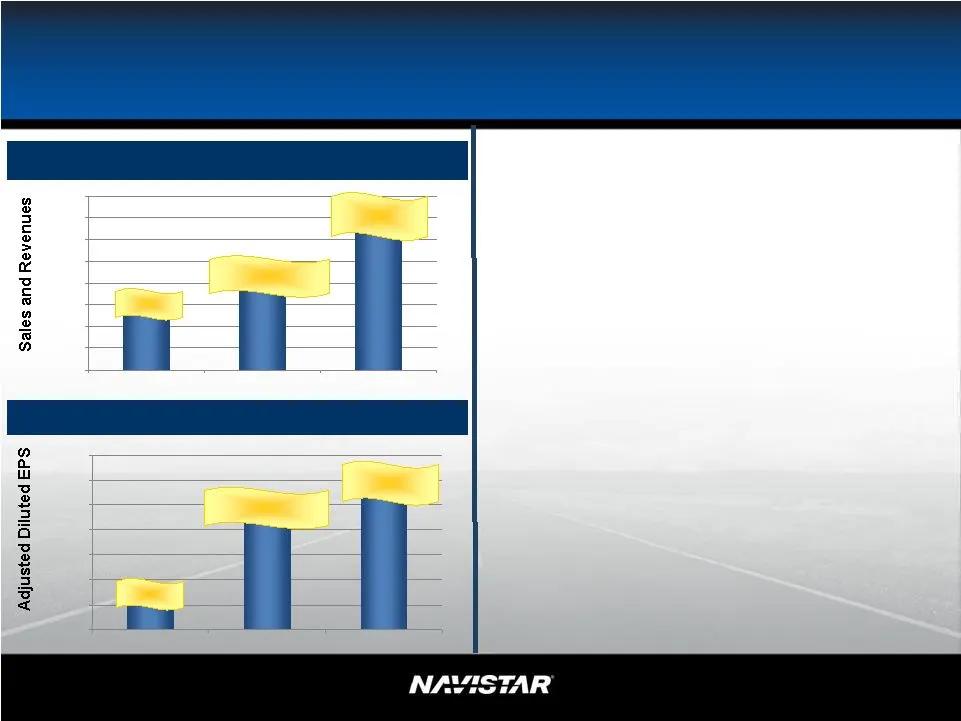
NYSE: NAV 18 18 2011 Financial Guidance Navistar Consolidated Revenues ($ in Billions) Navistar Adjusted Diluted EPS Note: This slide contains non-GAAP information, please see the REG G in appendix for a detailed reconciliation. 2011 FY Guidance does not include the impact of Engineering Integration
Slide 19: Driving Shareholder Value
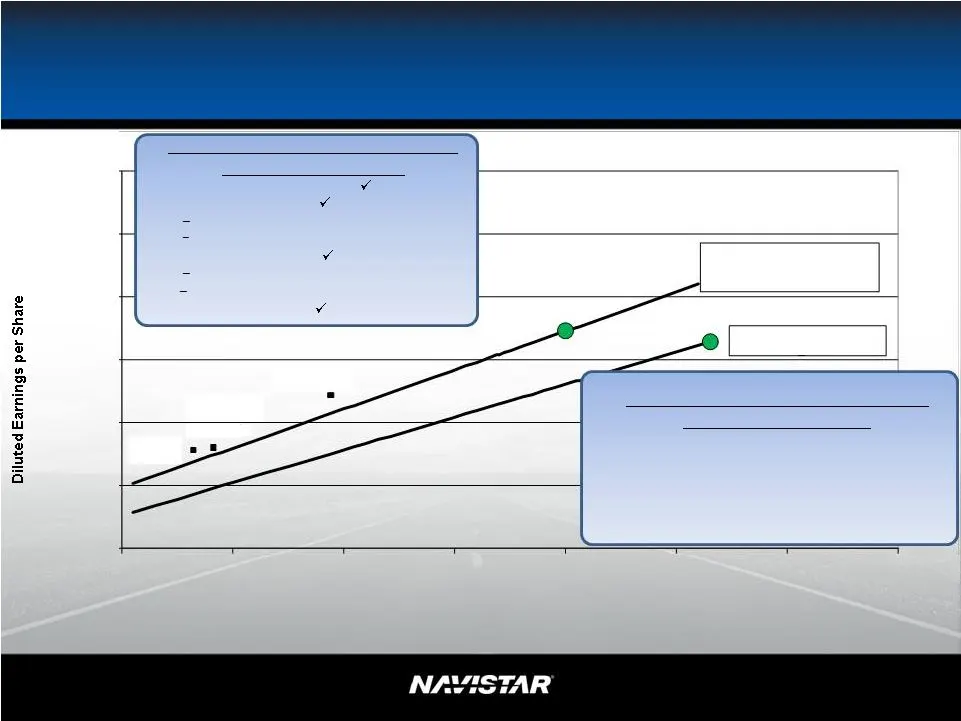
19 19 Driving Shareholder Value Note: This slide contains non-GAAP information, please see the REG G in appendix for a detailed reconciliation. 2011 FY Guidance does not include the impact of Engineering Integration; Valuation Allowance release; restructuring of Chatham, Workhorse and Monaco and imp

Slide 20: SEC Regulation G – Non-GAAP Reconciliation
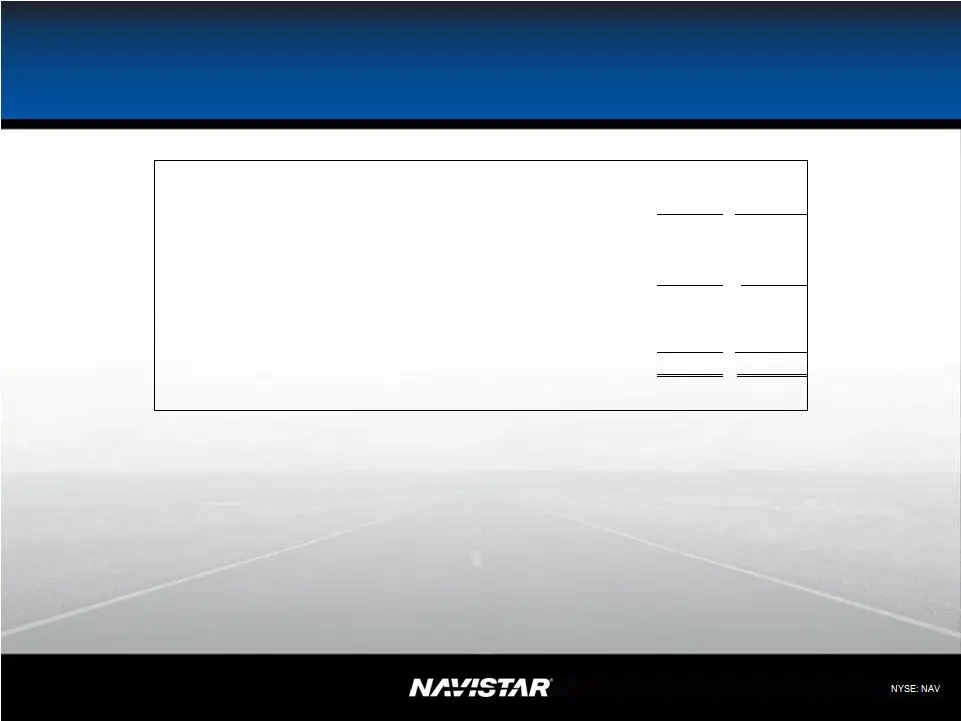
NYSE: NAV 20 20 SEC Regulation G – Non-GAAP Reconciliation Manufacturing Segment Results : We believe manufacturing segment results, which includes the segment results of our Truck, Engine, and Parts reporting segments, provide meaningful information of our core manufacturing business and therefore
Slide 21: SEC Regulation G – 2011 Guidance
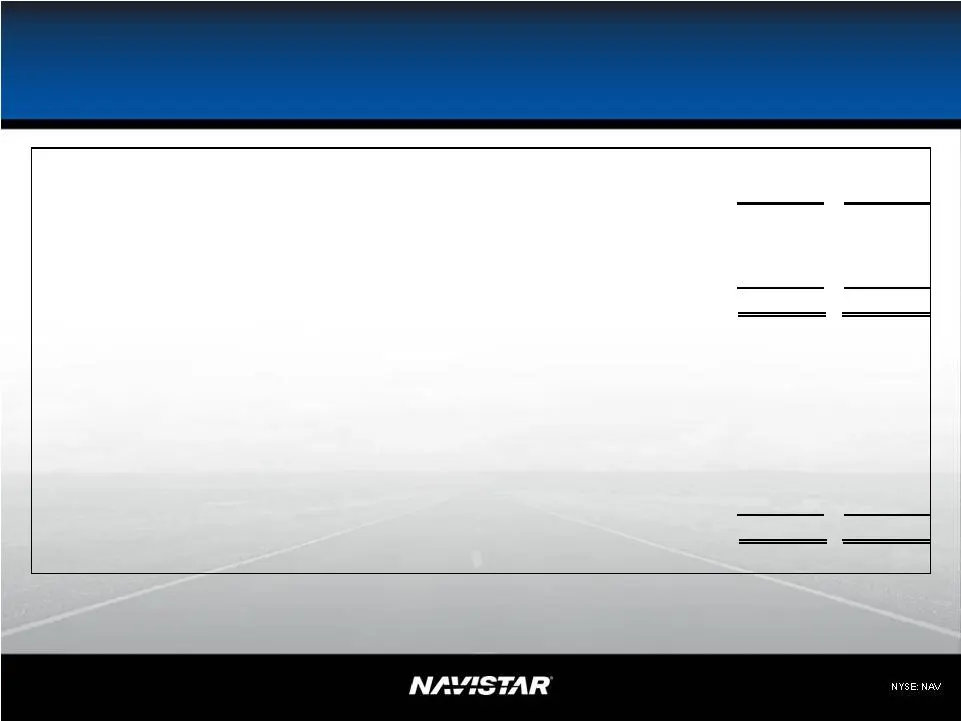
21 21 SEC Regulation G – 2011 Guidance Lower Upper (Dollars in Millions, except per share data) Net income attributable to Navistar International Corporation $ 190 $ 288 Plus: Engineering integration costs (A) Impairments and restructuring and related charges (B) Adjusted net income attributable to
Slide 22: SEC Regulation G – EPS vs. Traditional Industry
22 SEC Regulation G – EPS vs. Traditional Industry (A) Revised Target sales and revenues, net – Projections based on $17-18B of GAAP revenue and $2-3B of Non-GAAP revenue related to Navistar's share of non-consolidated affiliates. Original Target Revised Target U.S. & Canada Industry 414,500 350,000
Slide 23: SEC Regulation G – Fiscal Year Comparison
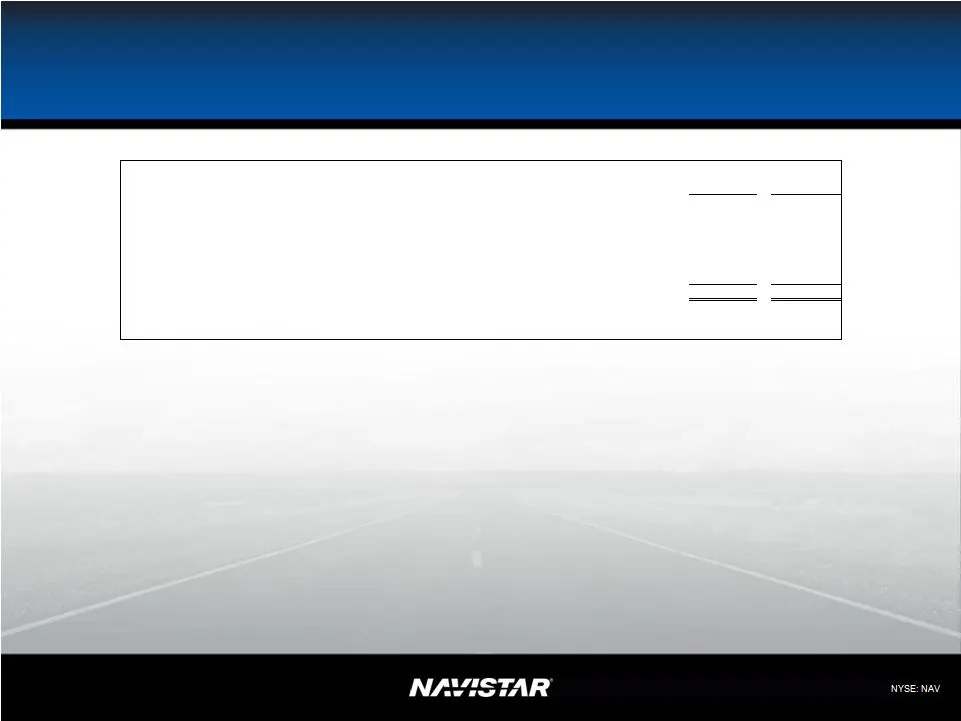
23 23 SEC Regulation G – Fiscal Year Comparison 2009 2008 (Dollars in Millions, except per share data) Net income attributable to Navistar International Corporation $ 320 $ 134 Plus: Ford settlement, restructuring and related charges (benefits) (A) (157) Impairment of property, plant, and equipment
Slide 24: SEC Regulation G – Six Months Ended April 30, 2011
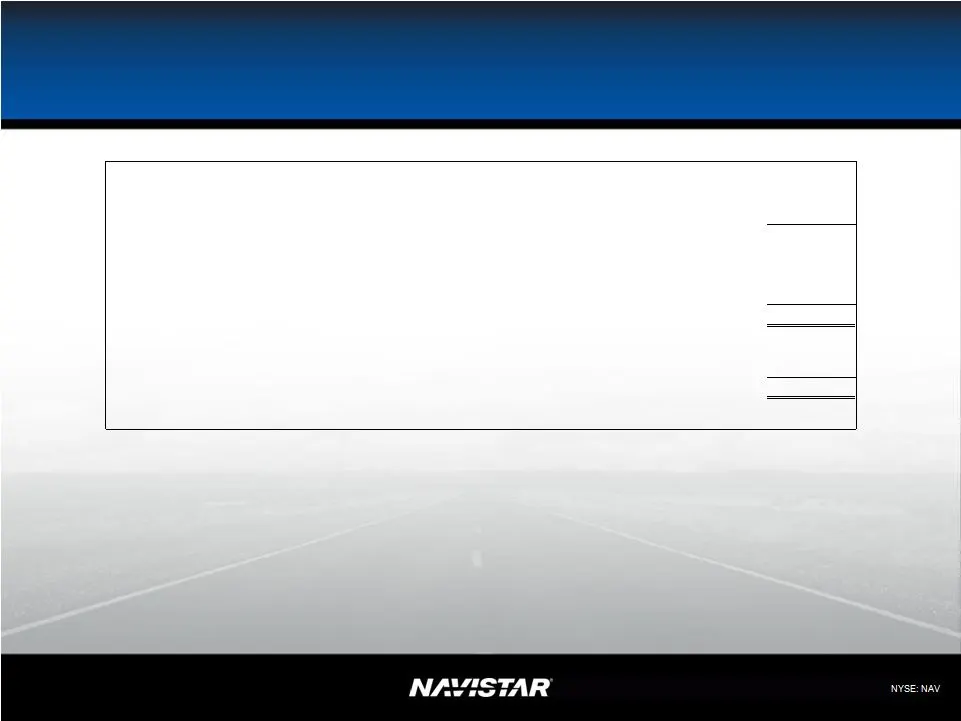
24 24 SEC Regulation G – Six Months Ended April 30, 2011 Six Months Ended April 30, 2011 (Dollars in Millions, except per share data) Net income attributable to Navistar International Corporation $ 68 Plus: Engineering integration costs (A) Adjusted net income attributable to Navistar International
Source: SEC EDGAR · 8-K filed Aug 9, 2011
More decks from Navistar International Corporation
 Q2 2021 Earnings Presentation20 slides · Jun 8, 2021
 Q1 2021 Earnings Presentation20 slides · Mar 9, 2021
 Q4 2020 Earnings Presentation22 slides · Dec 17, 2020
 Q3 2020 Earnings Presentation21 slides · Sep 9, 2020
 Q2 2020 Earnings Presentation21 slides · Jun 4, 2020
 Q1 2020 Earnings Presentation21 slides · Mar 4, 2020