Rexel SA · EURONEXT:RXL
Rexel SA — Q1 2013 Earnings Presentation
42 slides from Rexel SA's earnings presentation, May 2, 2013
Slide 1: Q1 2013 Results
Q1 2013 RESULTS May 2, 2013 Financial statements at March 31, 2013 were authorized for issue by the Management Board on April 24, 2013 and reviewed by the Supervisory Board held on April 30, 2013.

Slide 2: Results at a Glance
RESULTS AT A GLANCE ss inency = Notion
Slide 3: Resilient performance in the first quarter; full-year 2013 targets confirmed
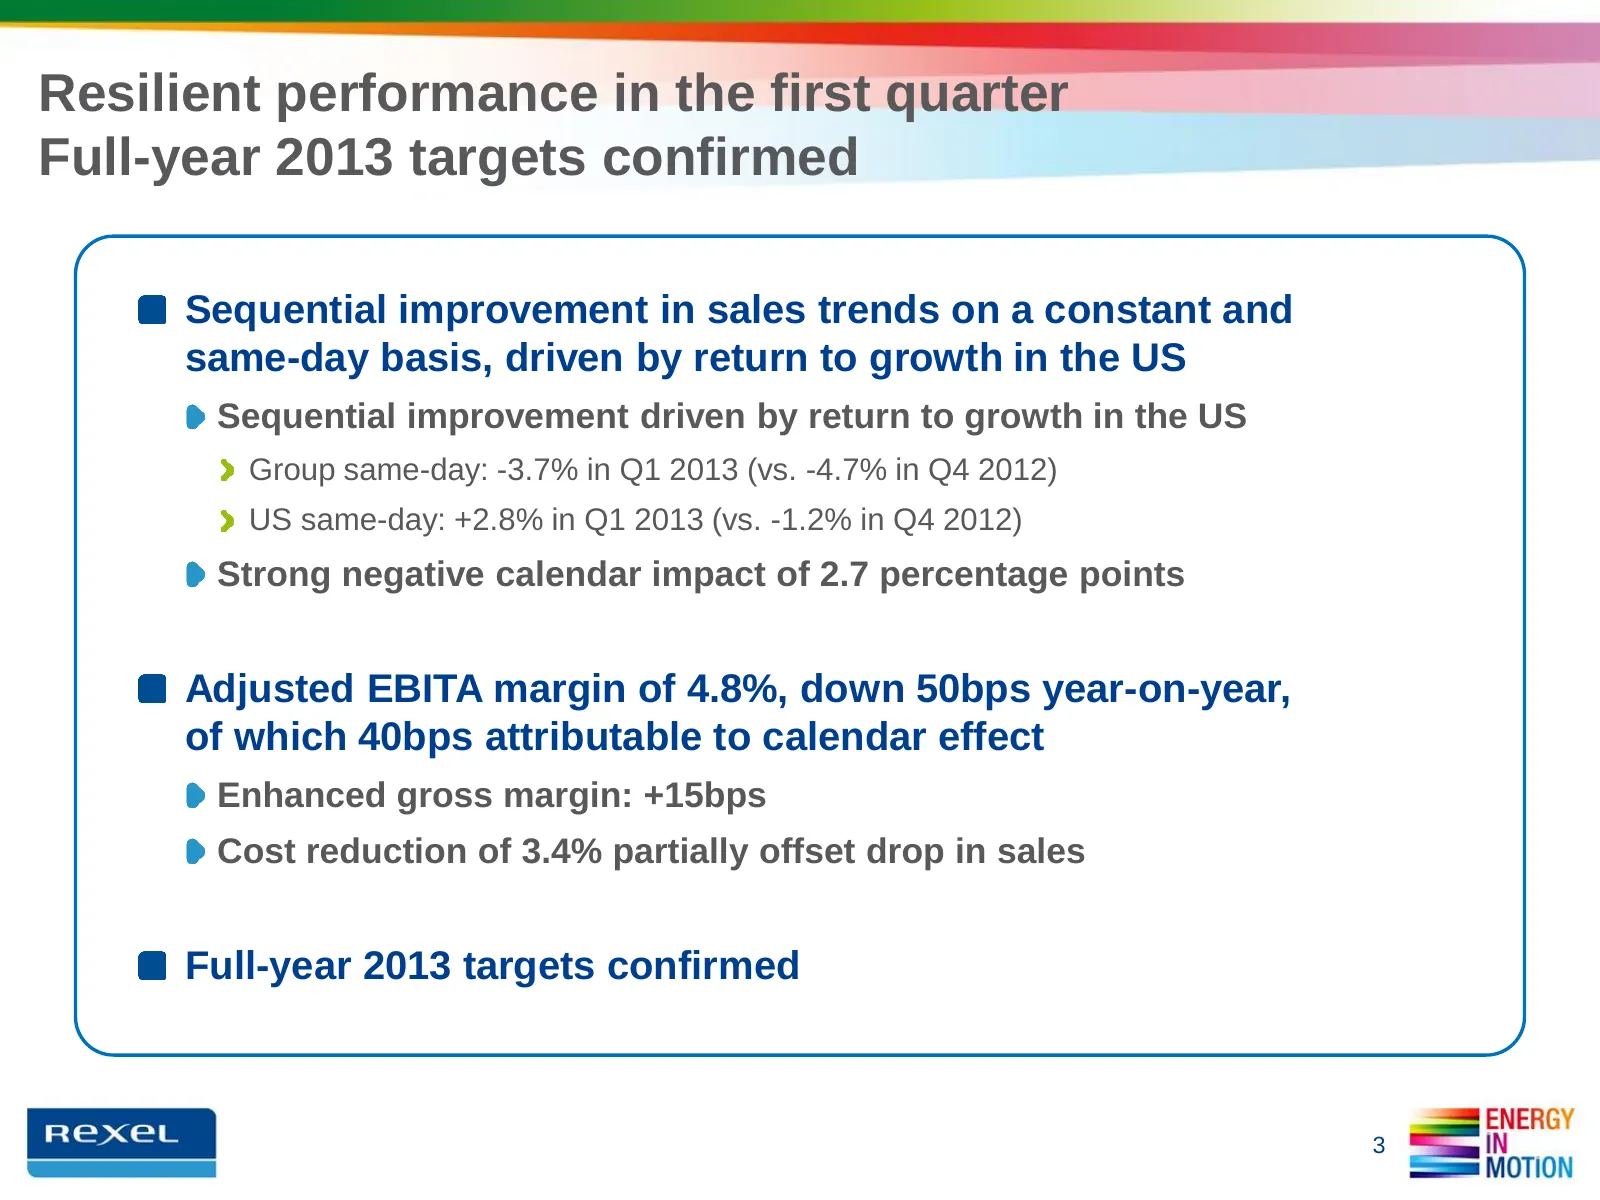
Resilient performance in the first quarter Full-year 2013 targets confirmed Sequential improvement in sales trends on a constant and same-day basis, driven by return to growth in the US Sequential improvement driven by return to growth in the US Group same-day: -3.7% in Q1 2013 (vs. -4.7% in Q4 2012
Slide 4: Europe: sequentially stable sales in a challenging environment
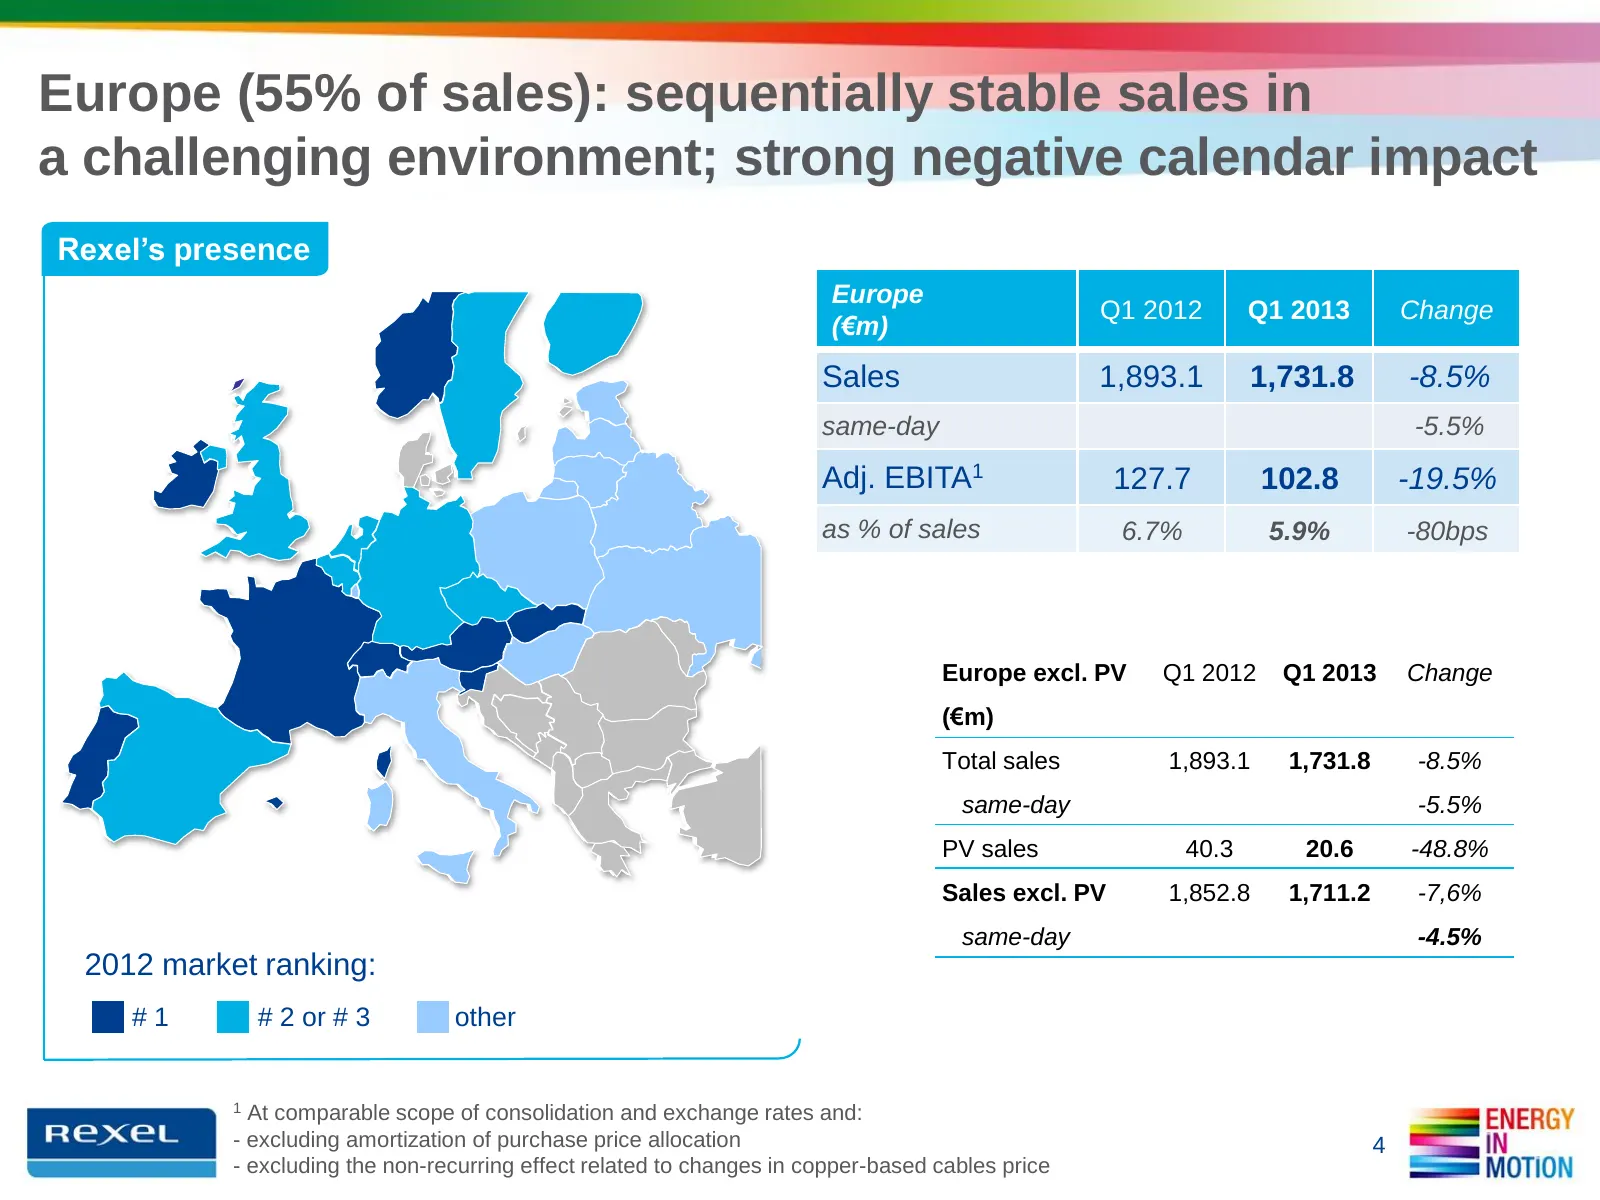
Europe (55% of sales): sequentially stable sales in a challenging environment; strong negative calendar impact Rexel’s presence Europe Q1 2012 Q1 2013 Change (€m) Sales 1,893.1 1,731.8 -8.5% same-day -5.5% Adj. EBITA1 127.7 102.8 -19.5% as % of sales 6.7% 5.9% -80bps Europe excl. PV Q1 2012 Q1 2013
Slide 5: Europe: Q1 2013 business highlights
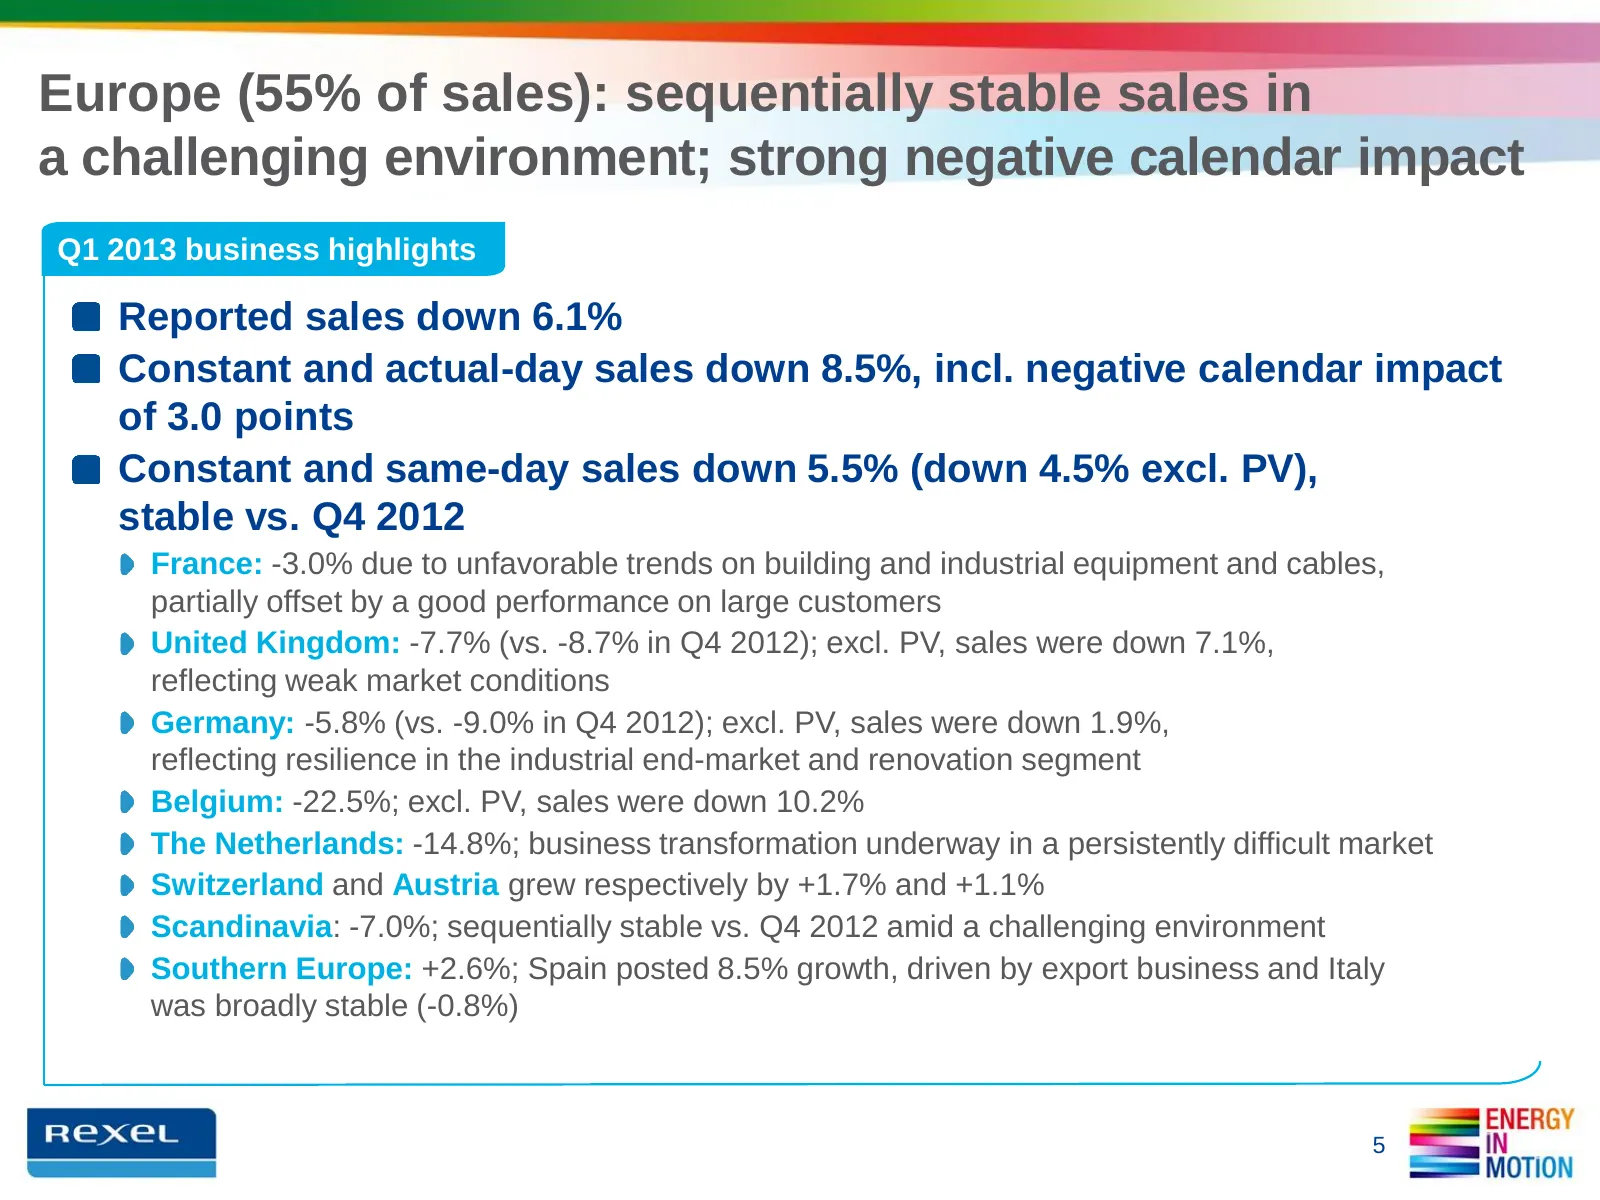
Europe (55% of sales): sequentially stable sales in a challenging environment; strong negative calendar impact Q1 2013 business highlights Reported sales down 6.1% Constant and actual-day sales down 8.5%, incl. negative calendar impact of 3.0 points Constant and same-day sales down 5.5% (down 4.5% e
Slide 6: North America: return to growth in the US and improved profitability
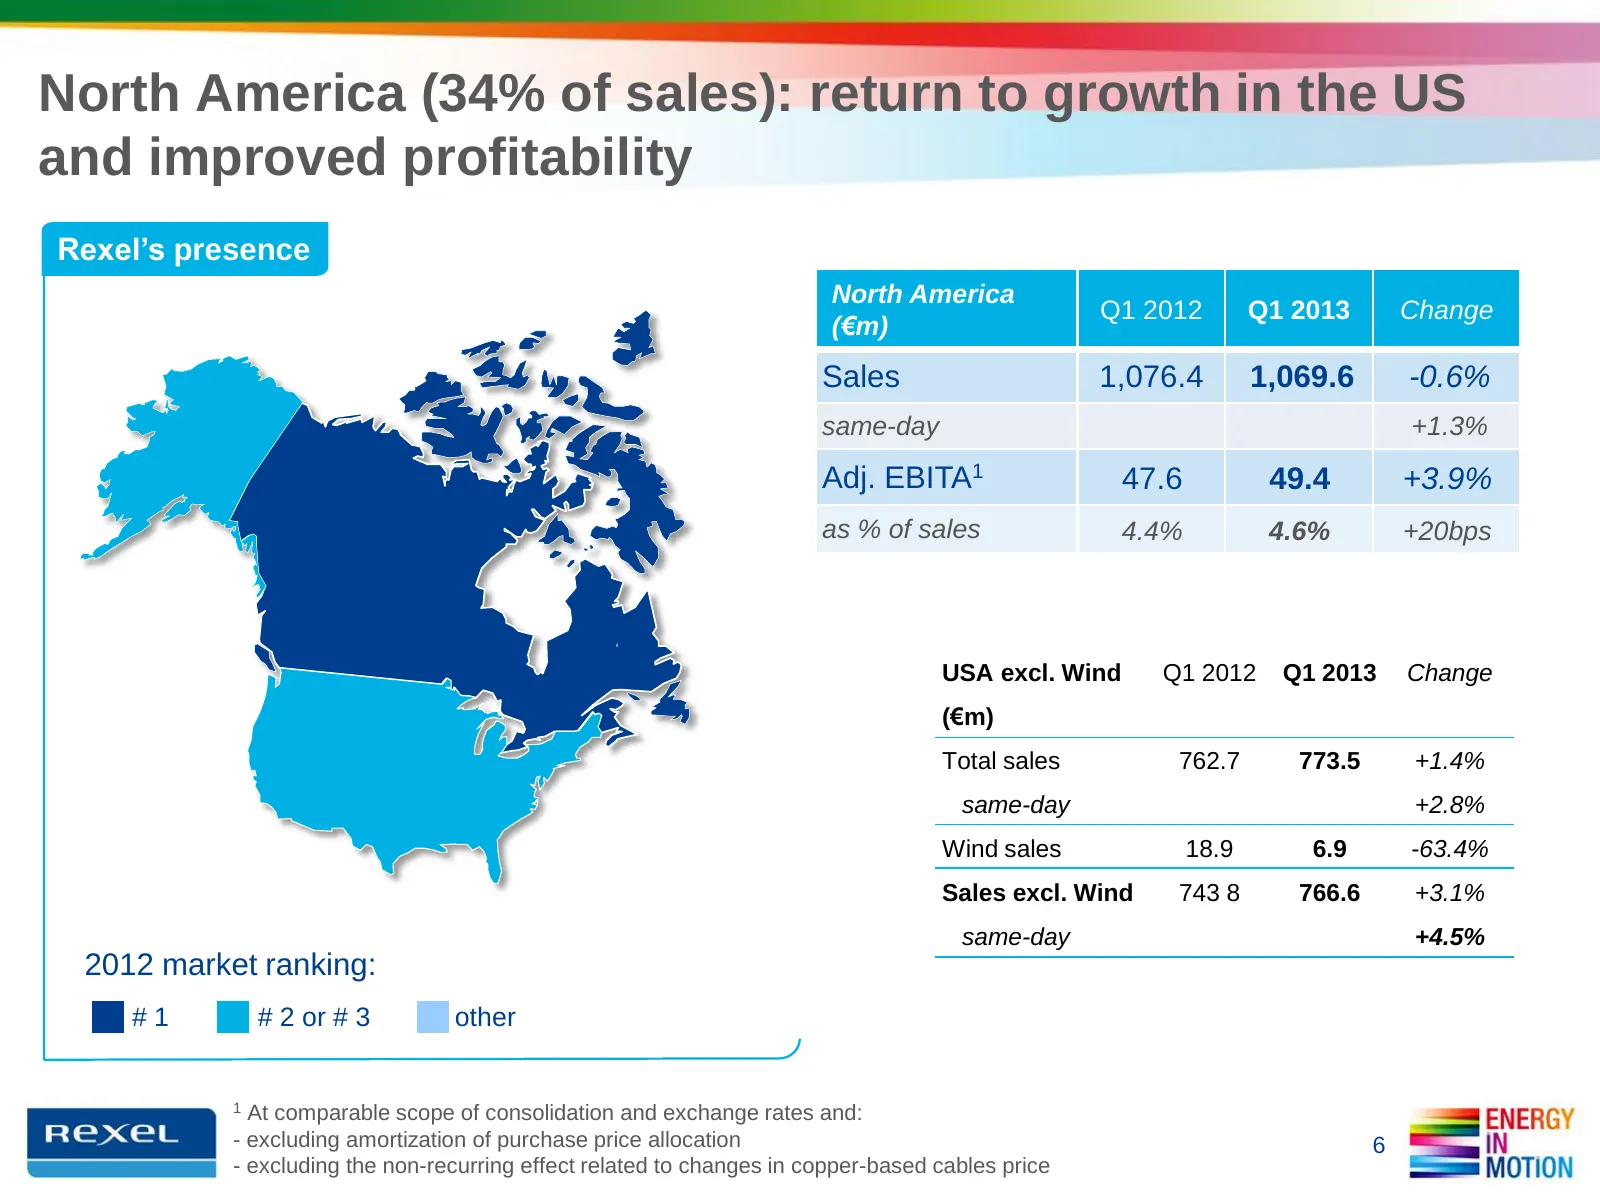
North America (34% of sales): return to growth in the US and improved profitability Rexel’s presence North America Q1 2012 Q1 2013 Change (€m) Sales 1,076.4 1,069.6 -0.6% same-day +1.3% Adj. EBITA1 47.6 49.4 +3.9% as % of sales 4.4% 4.6% +20bps USA excl. Wind Q1 2012 Q1 2013 Change (€m) Total sales
Slide 7: North America: Q1 2013 business highlights
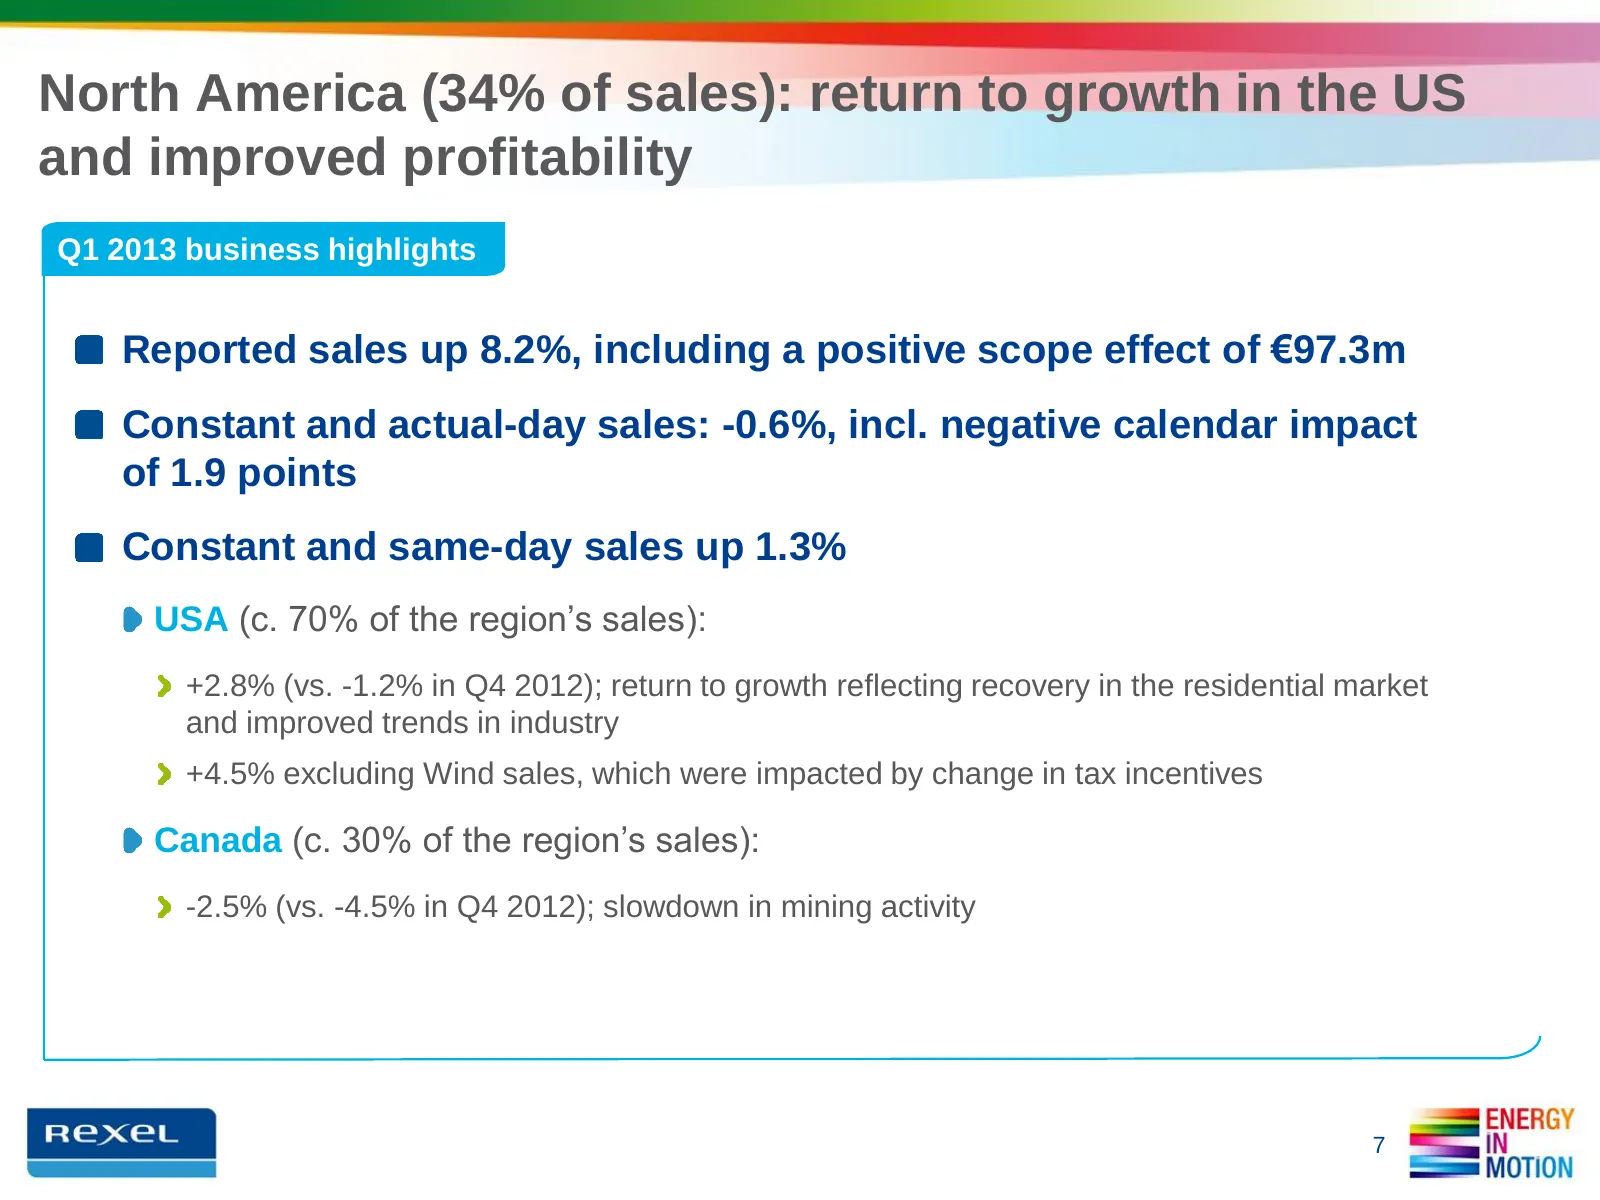
North America (34% of sales): return to growth in the US and improved profitability Q1 2013 business highlights Reported sales up 8.2%, including a positive scope effect of €97.3m Constant and actual-day sales: -0.6%, incl. negative calendar impact of 1.9 points Constant and same-day sales up 1.3% U
Slide 8: Asia-Pacific: growth in China excluding wind, weakness in Pacific
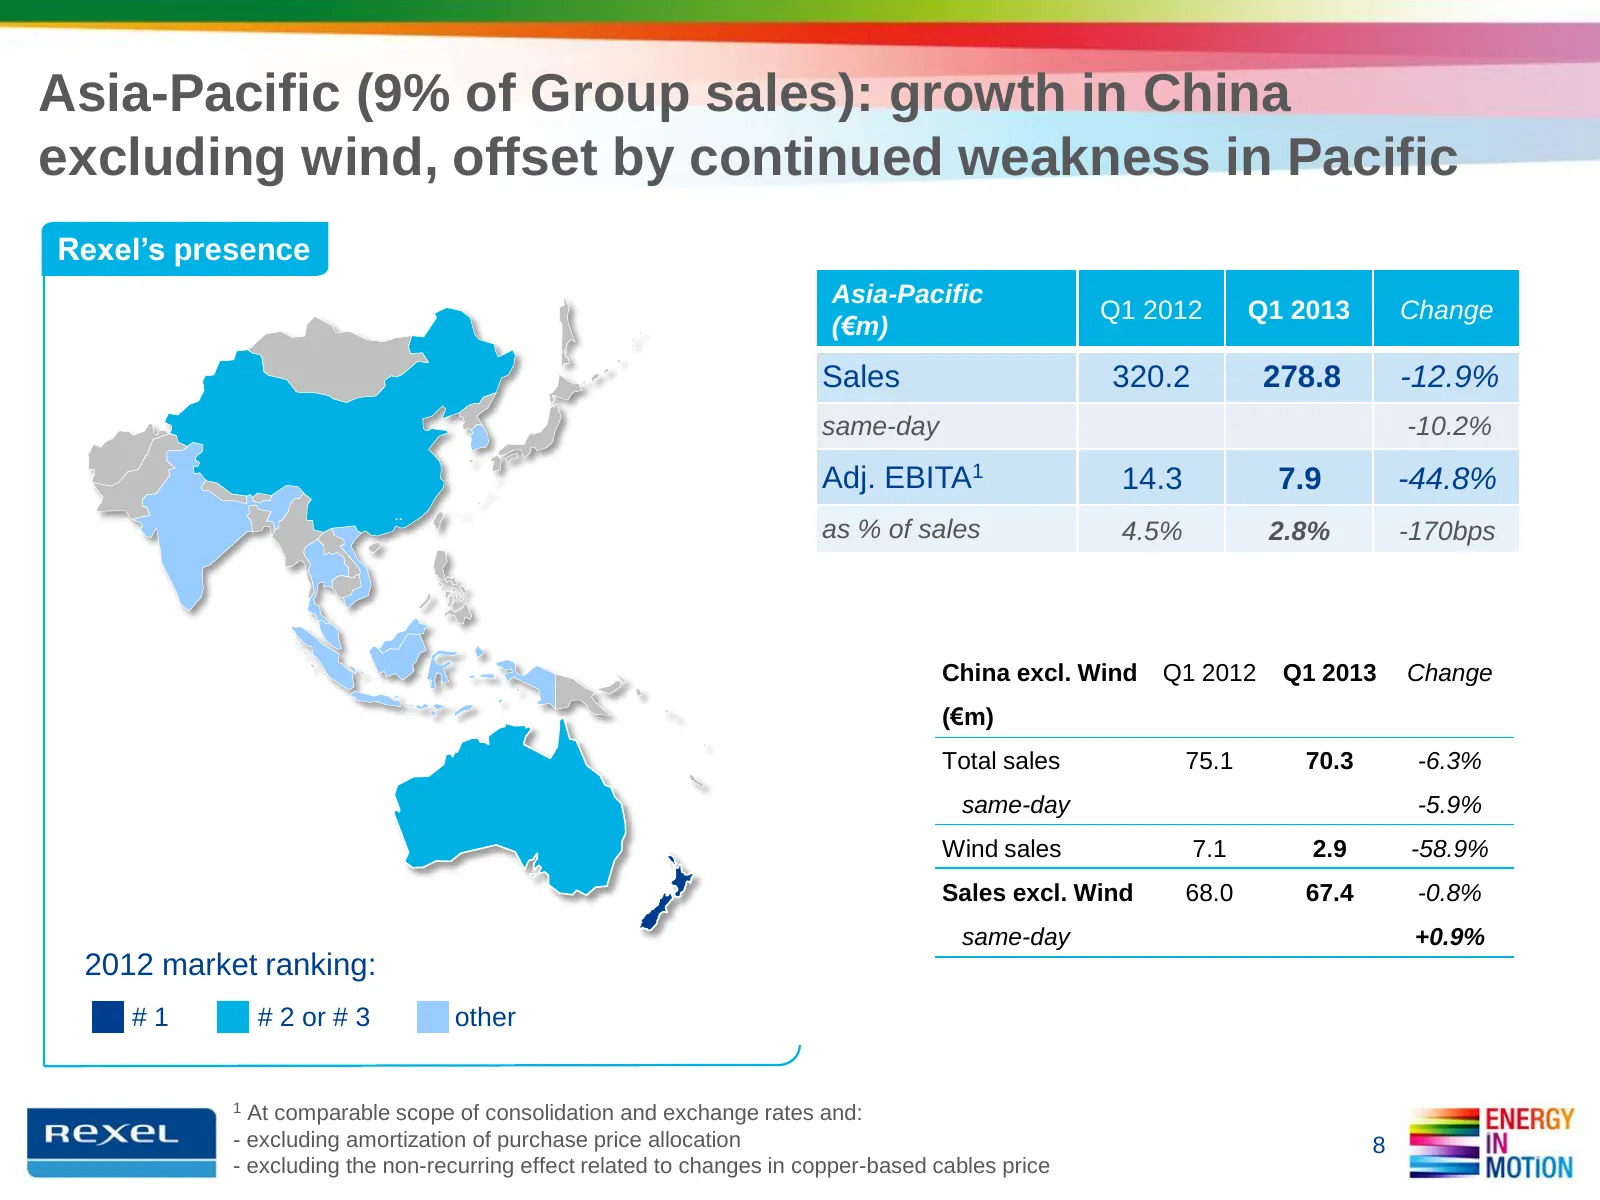
Asia-Pacific (9% of Group sales): growth in China excluding wind, offset by continued weakness in Pacific Rexel’s presence Asia-Pacific Q1 2012 Q1 2013 Change (€m) Sales 320.2 278.8 -12.9% same-day -10.2% Adj. EBITA1 14.3 7.9 -44.8% as % of sales 4.5% 2.8% -170bps China excl. Wind Q1 2012 Q1 2013 Ch
Slide 9: Asia-Pacific: Q1 2013 business highlights
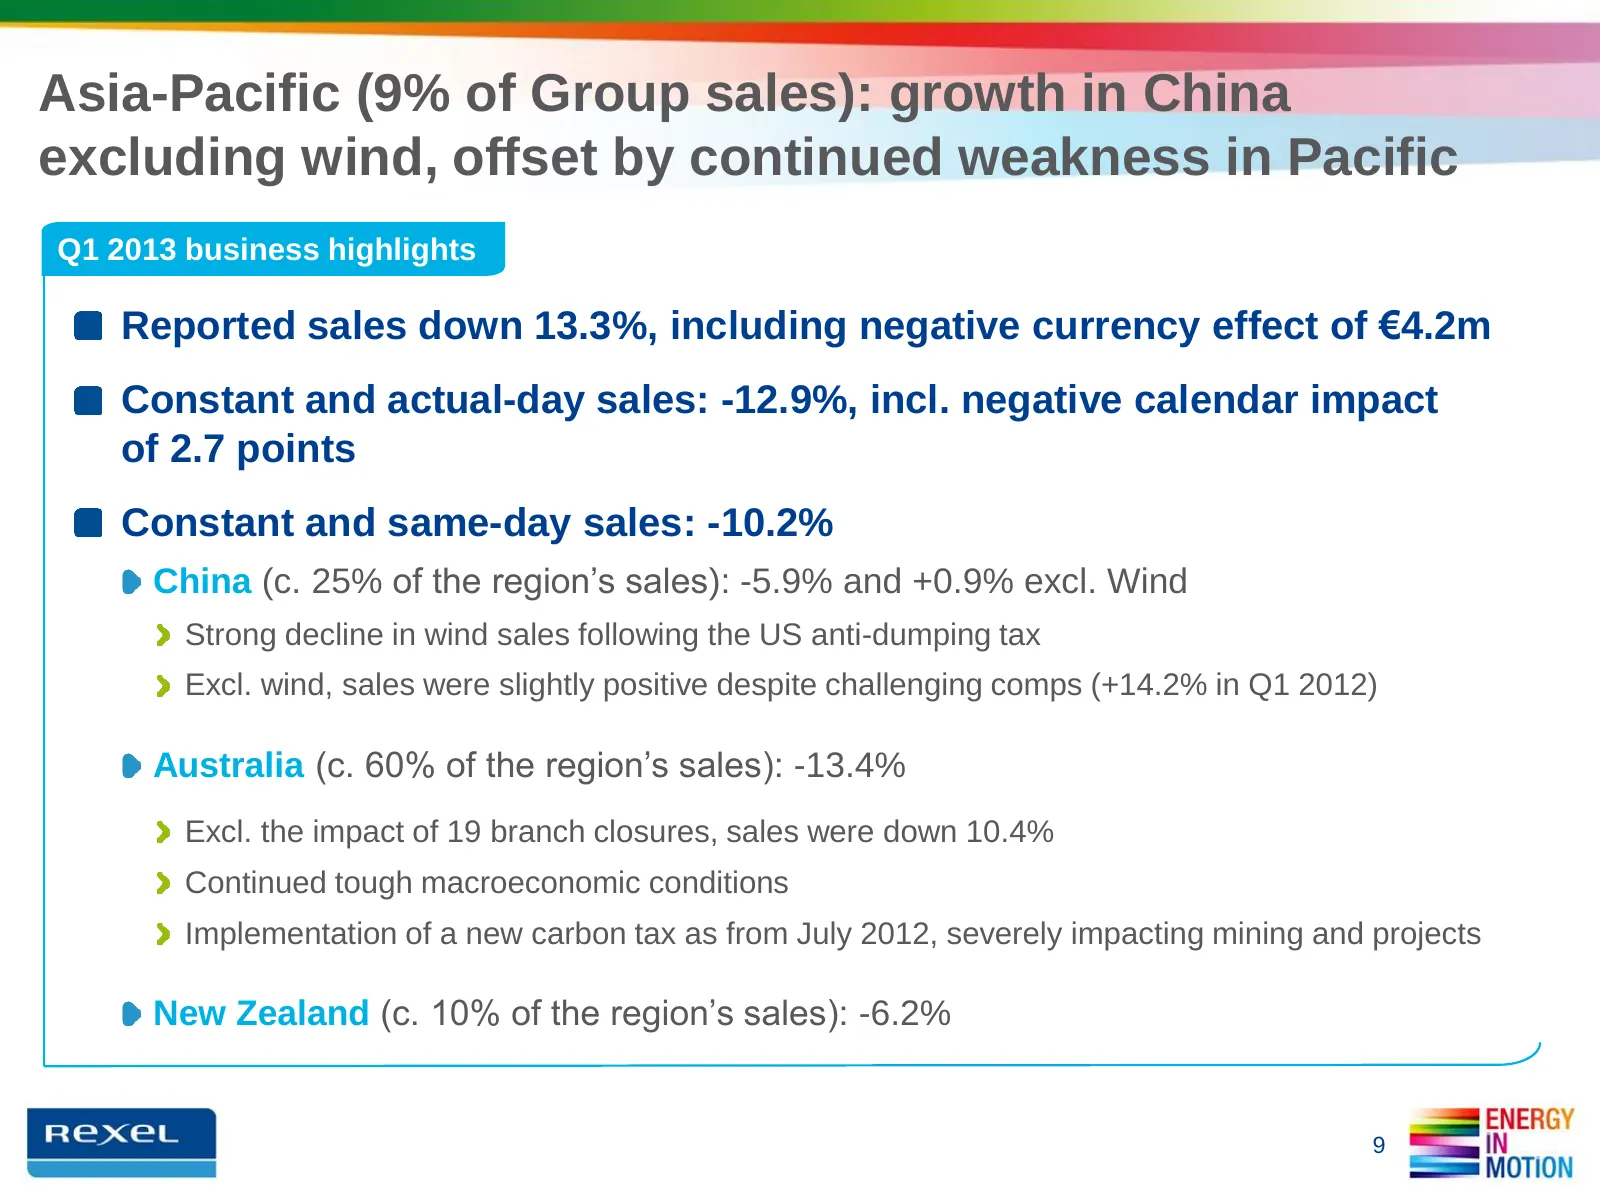
Asia-Pacific (9% of Group sales): growth in China excluding wind, offset by continued weakness in Pacific Q1 2013 business highlights Reported sales down 13.3%, including negative currency effect of €4.2m Constant and actual-day sales: -12.9%, incl. negative calendar impact of 2.7 points Constant an
Slide 10: Latin America: solid growth in Brazil and Peru
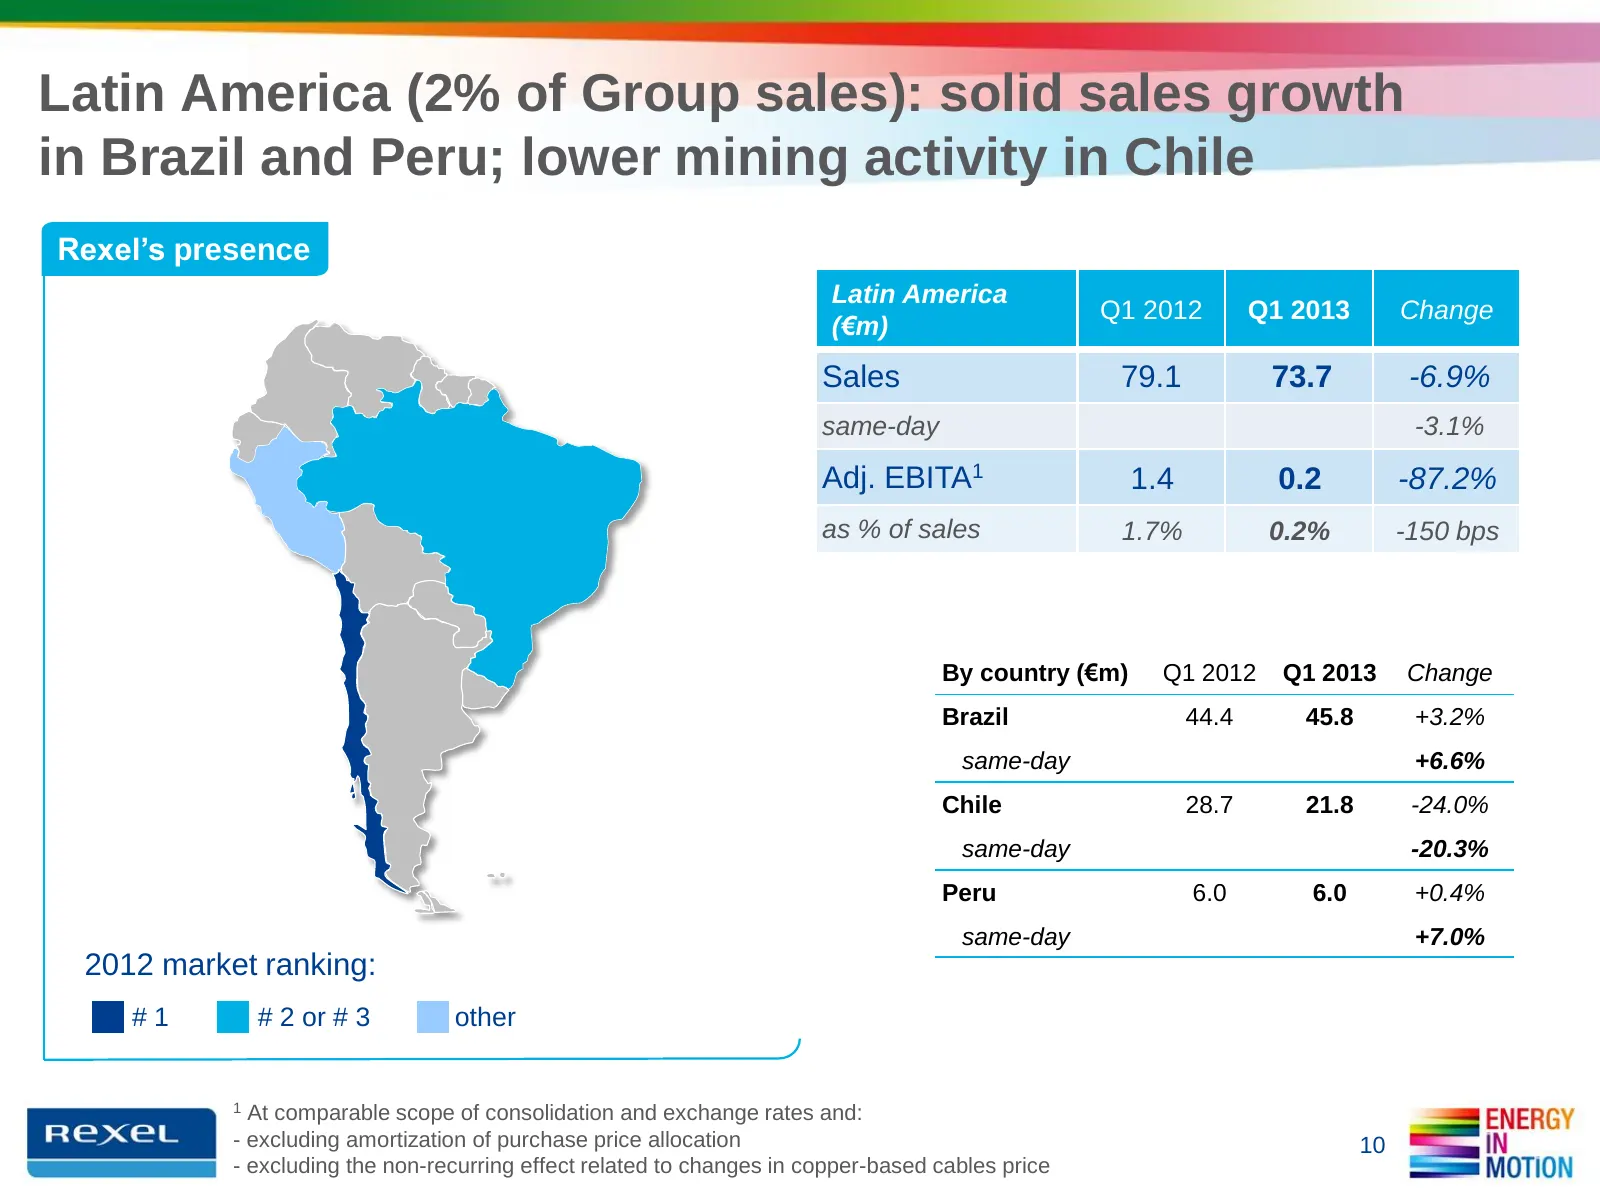
Latin America (2% of Group sales): solid sales growth in Brazil and Peru; lower mining activity in Chile Rexel’s presence Latin America Q1 2012 Q1 2013 Change (€m) Sales 79.1 73.7 -6.9% same-day -3.1% Adj. EBITA1 1.4 0.2 -87.2% as % of sales 1.7% 0.2% -150 bps By country (€m) Q1 2012 Q1 2013 Change
Slide 11: Latin America: Q1 2013 business highlights
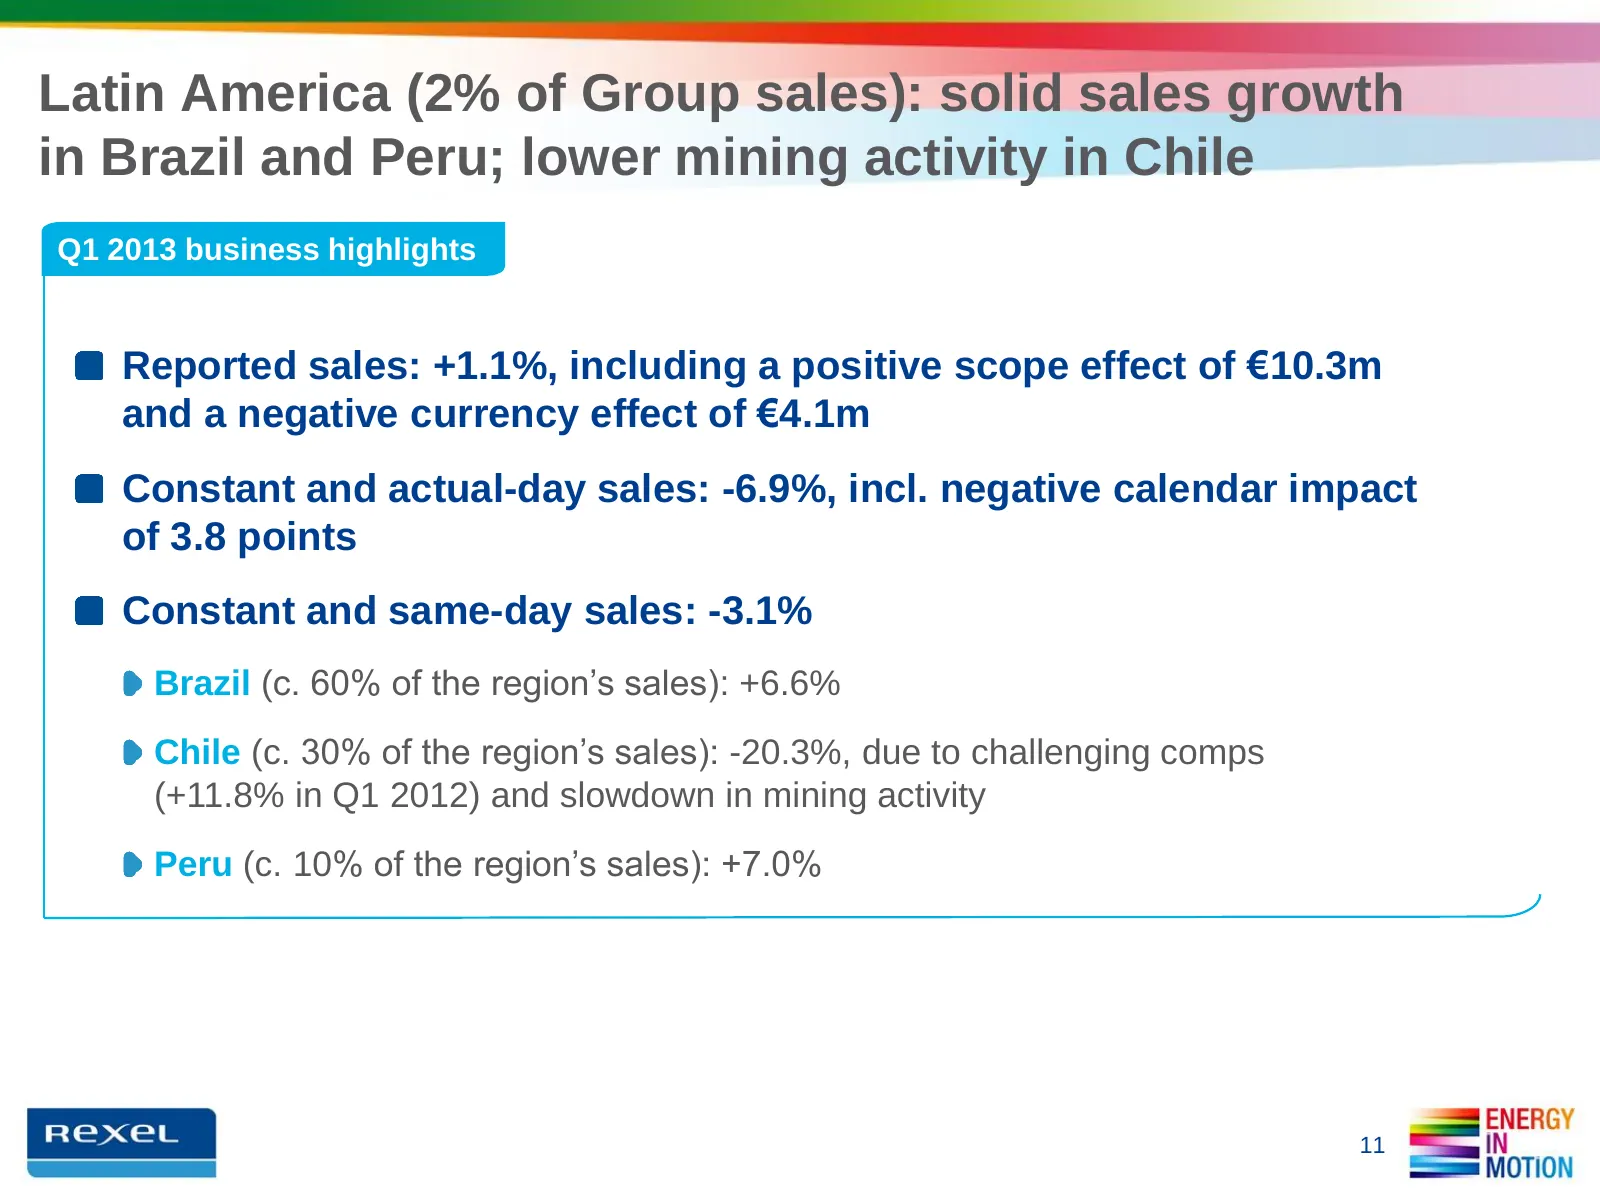
Latin America (2% of Group sales): solid sales growth in Brazil and Peru; lower mining activity in Chile Q1 2013 business highlights Reported sales: +1.1%, including a positive scope effect of €10.3m and a negative currency effect of €4.1m Constant and actual-day sales: -6.9%, incl. negative calenda

Slide 12: Financial Review
FINANCIAL REVIEW ss inency = Notion
Slide 13: Reported sales down 2.3%
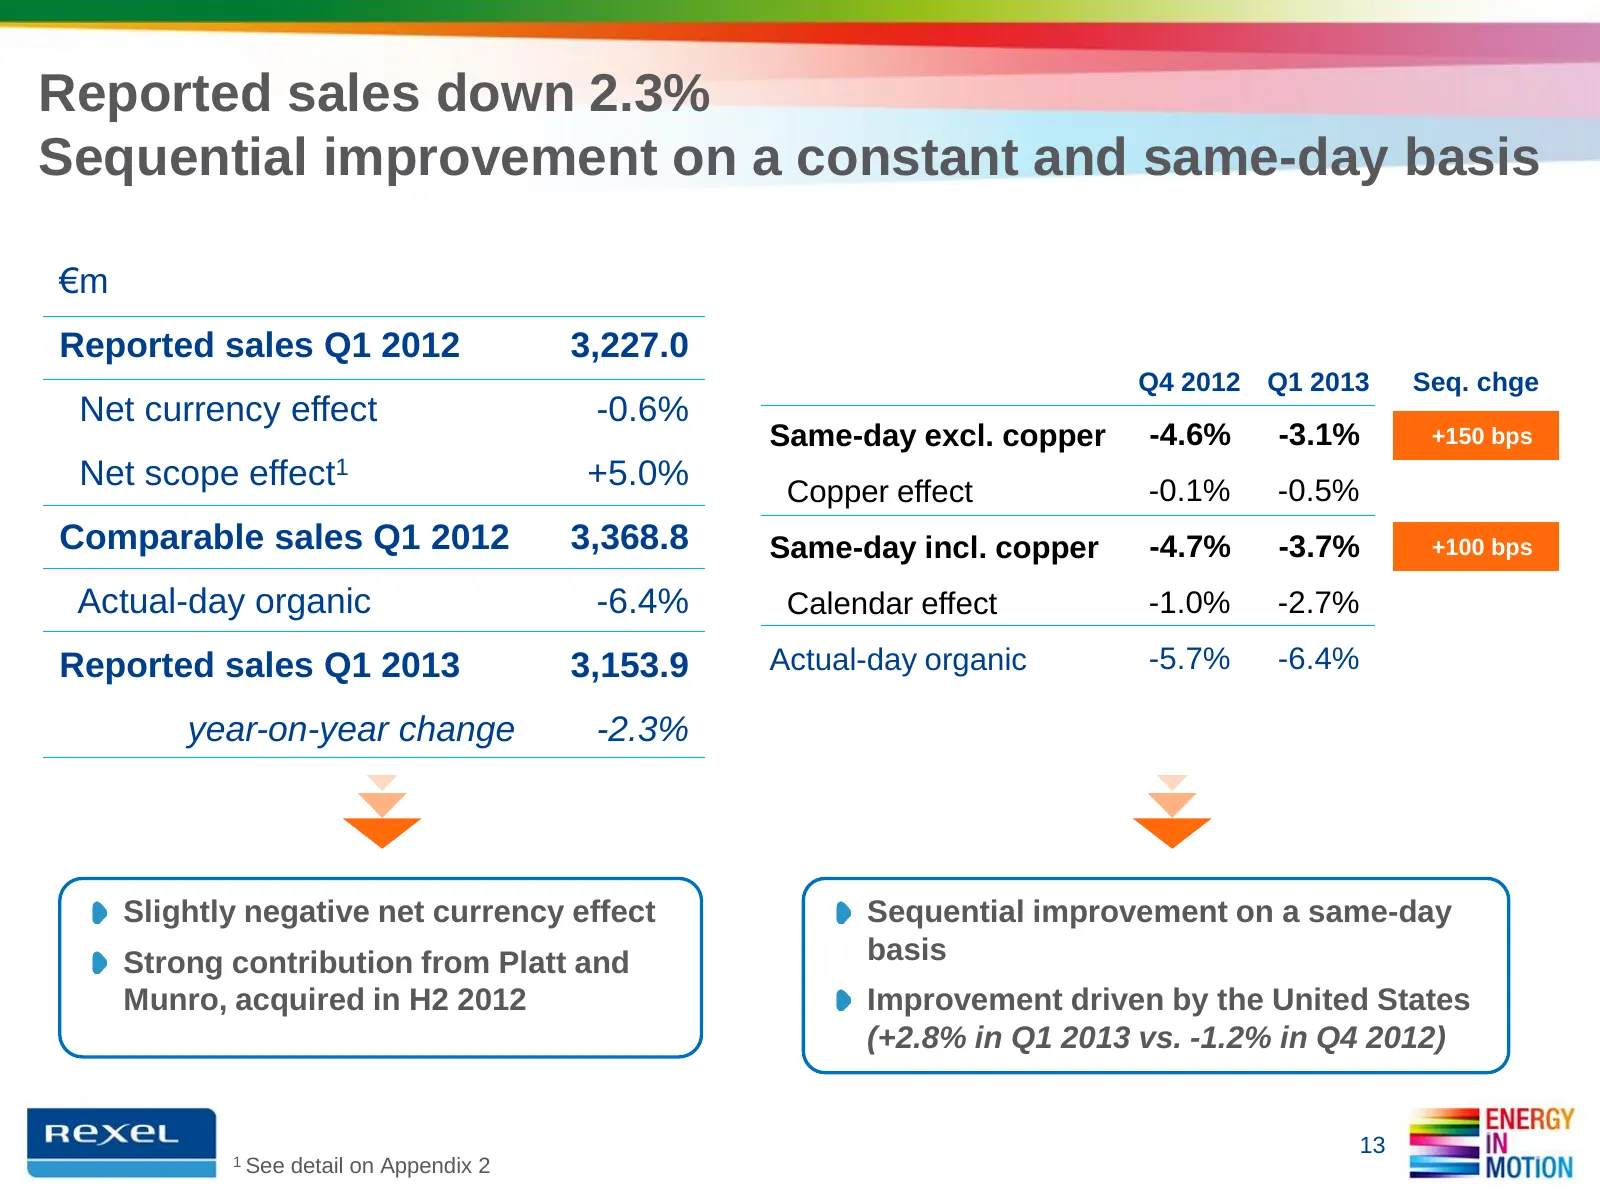
Reported sales down 2.3% Sequential improvement on a constant and same-day basis €m Reported sales Q1 2012 3,227.0 Q4 2012 Q1 2013 Seq. chge Net currency effect -0.6% Same-day excl. copper -4.6% -3.1% +150 bps Net scope effect1 +5.0% Copper effect -0.1% -0.5% Comparable sales Q1 2012 3,368.8 Same-da
Slide 14: Continuous gross margin enhancement
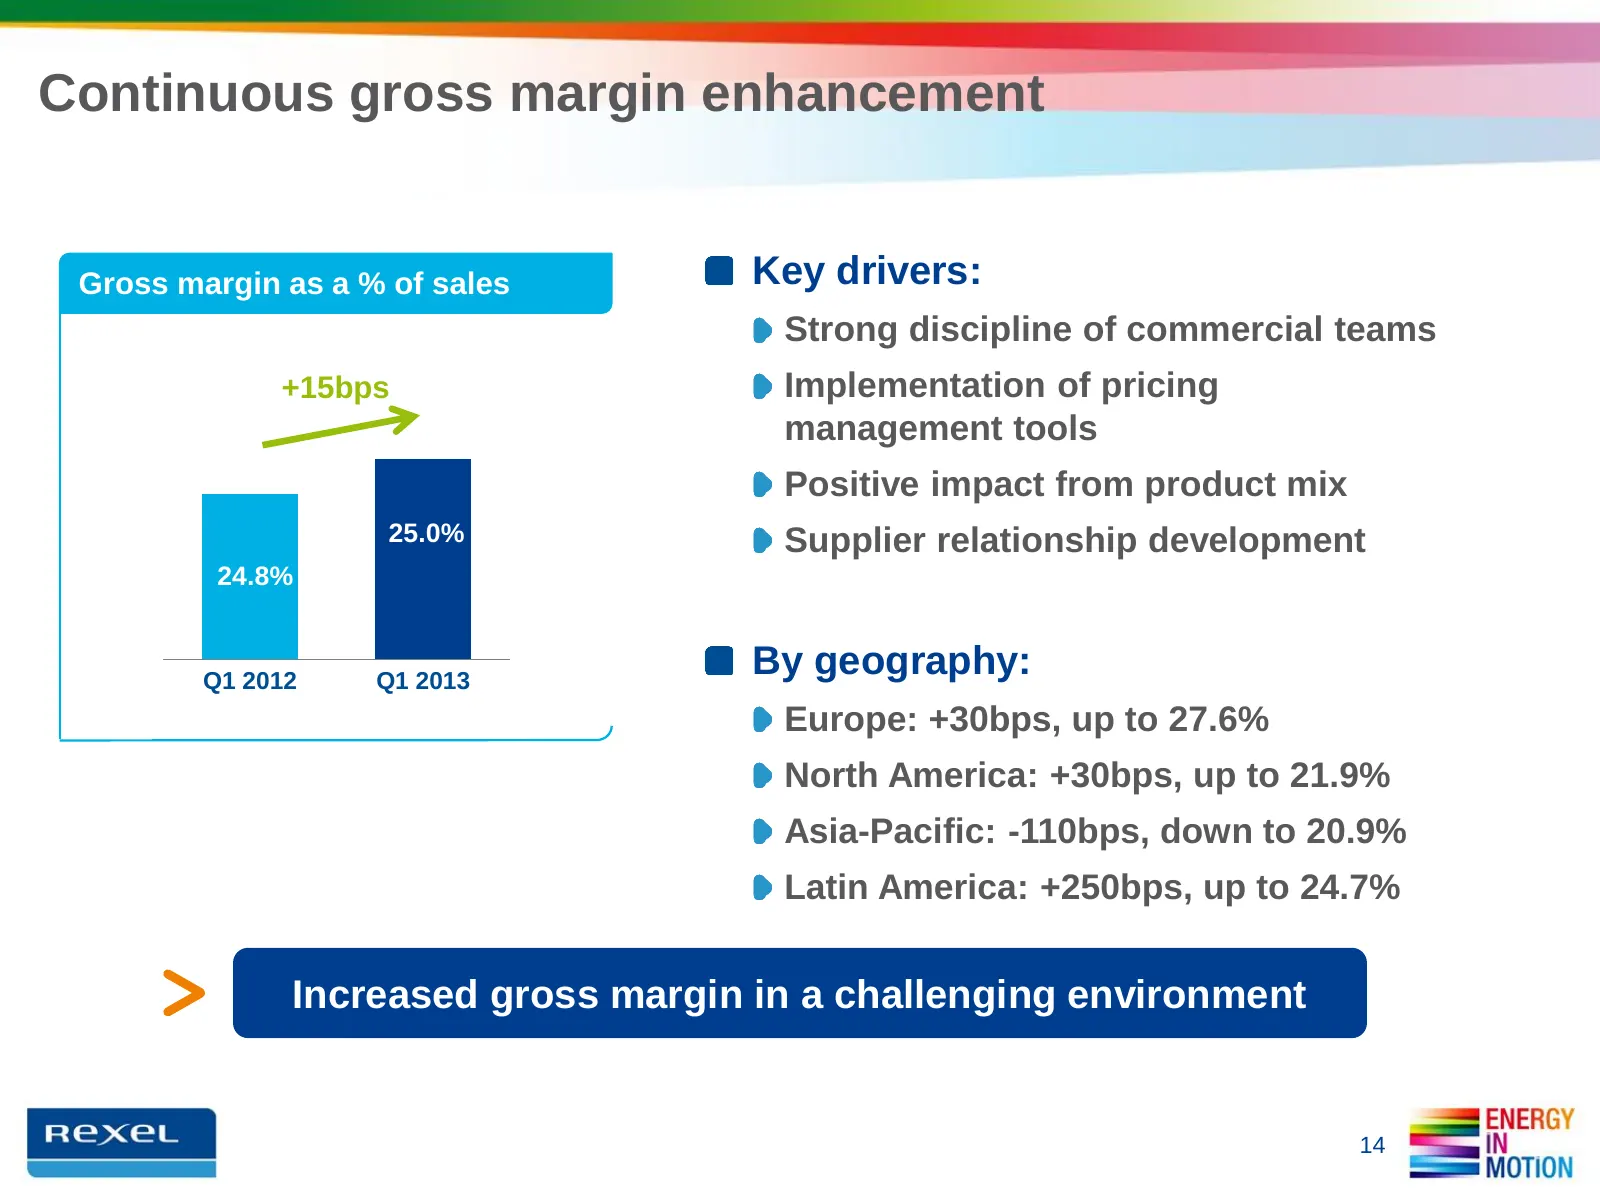
Continuous gross margin enhancement Gross margin as a % of sales Key drivers: Strong discipline of commercial teams +15bps Implementation of pricing management tools Positive impact from product mix 25.0% Supplier relationship development 24.8% Q1 2012 Q1 2013 By geography: Europe: +30bps, up to 27.
Slide 15: Resilient profitability excluding negative calendar impact
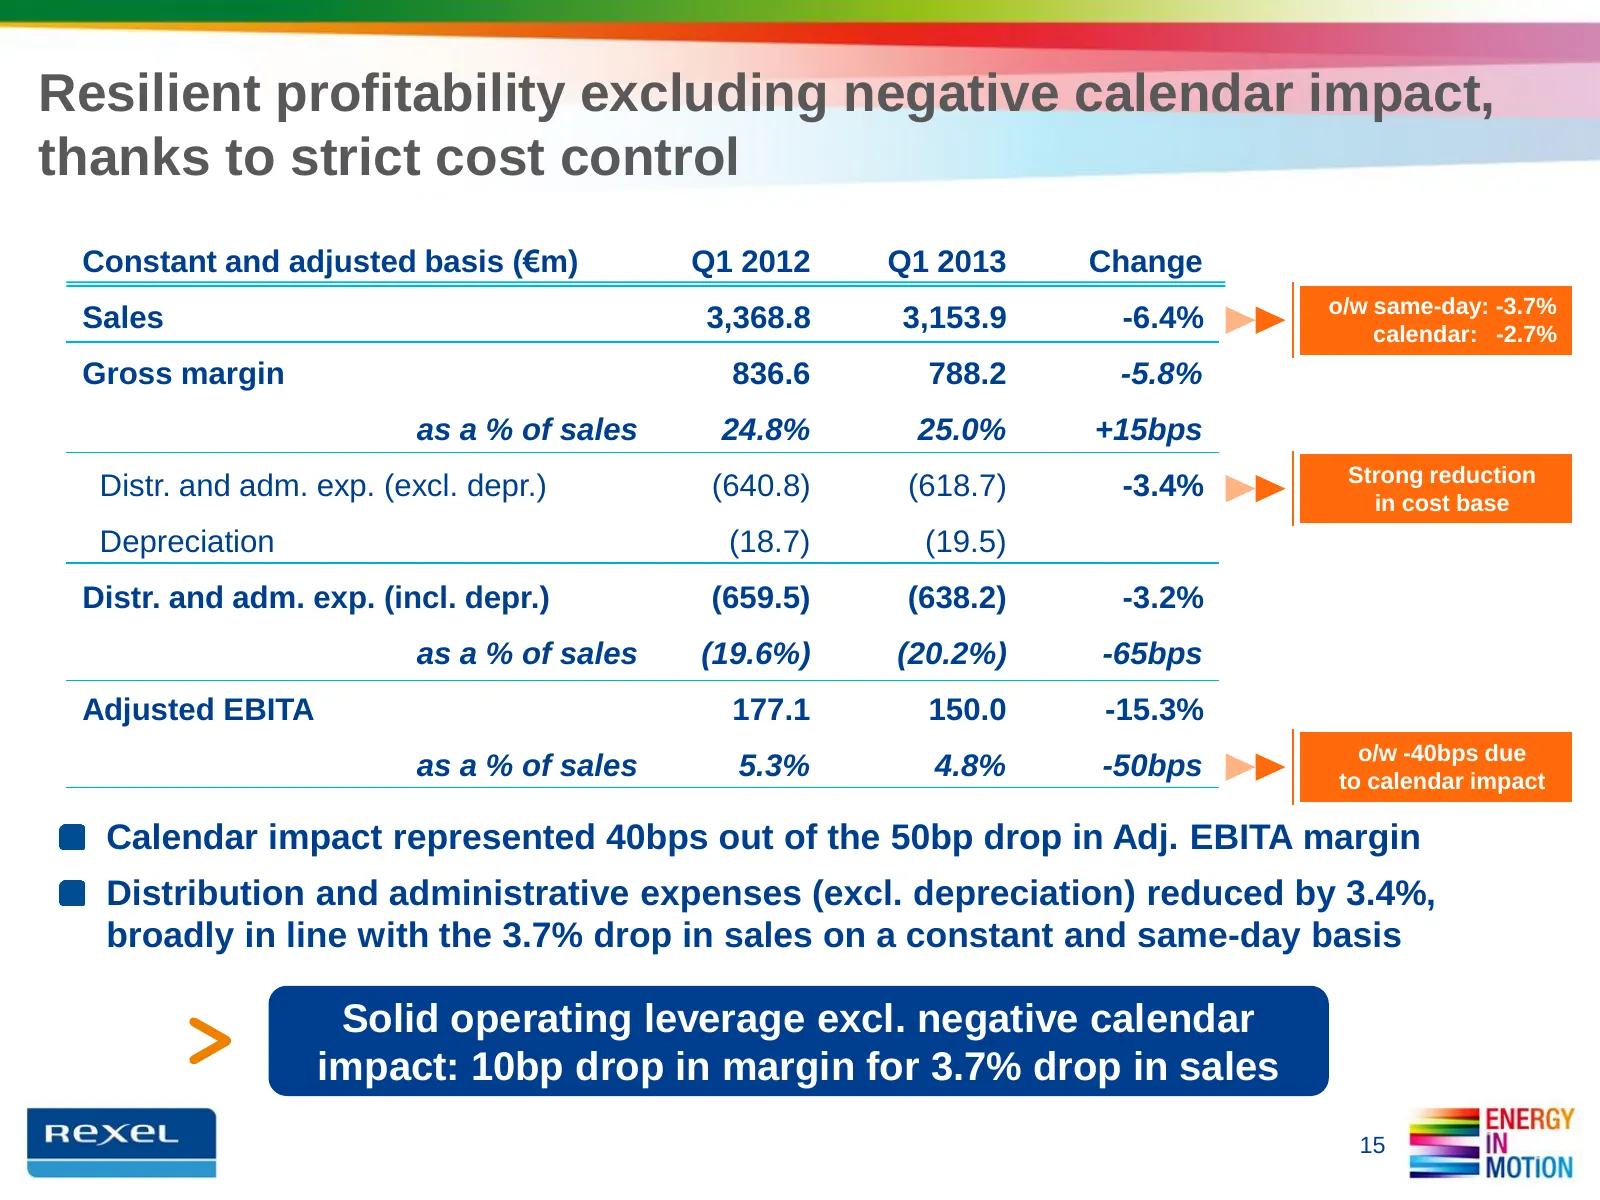
Resilient profitability excluding negative calendar impact, thanks to strict cost control Constant and adjusted basis (€m) Q1 2012 Q1 2013 Change o/w same-day: -3.7% Sales 3,368.8 3,153.9 -6.4% calendar: -2.7% Gross margin 836.6 788.2 -5.8% as a % of sales 24.8% 25.0% +15bps Strong reduction Distr.
Slide 16: Net income impacted by one-off financial expense and tax rate
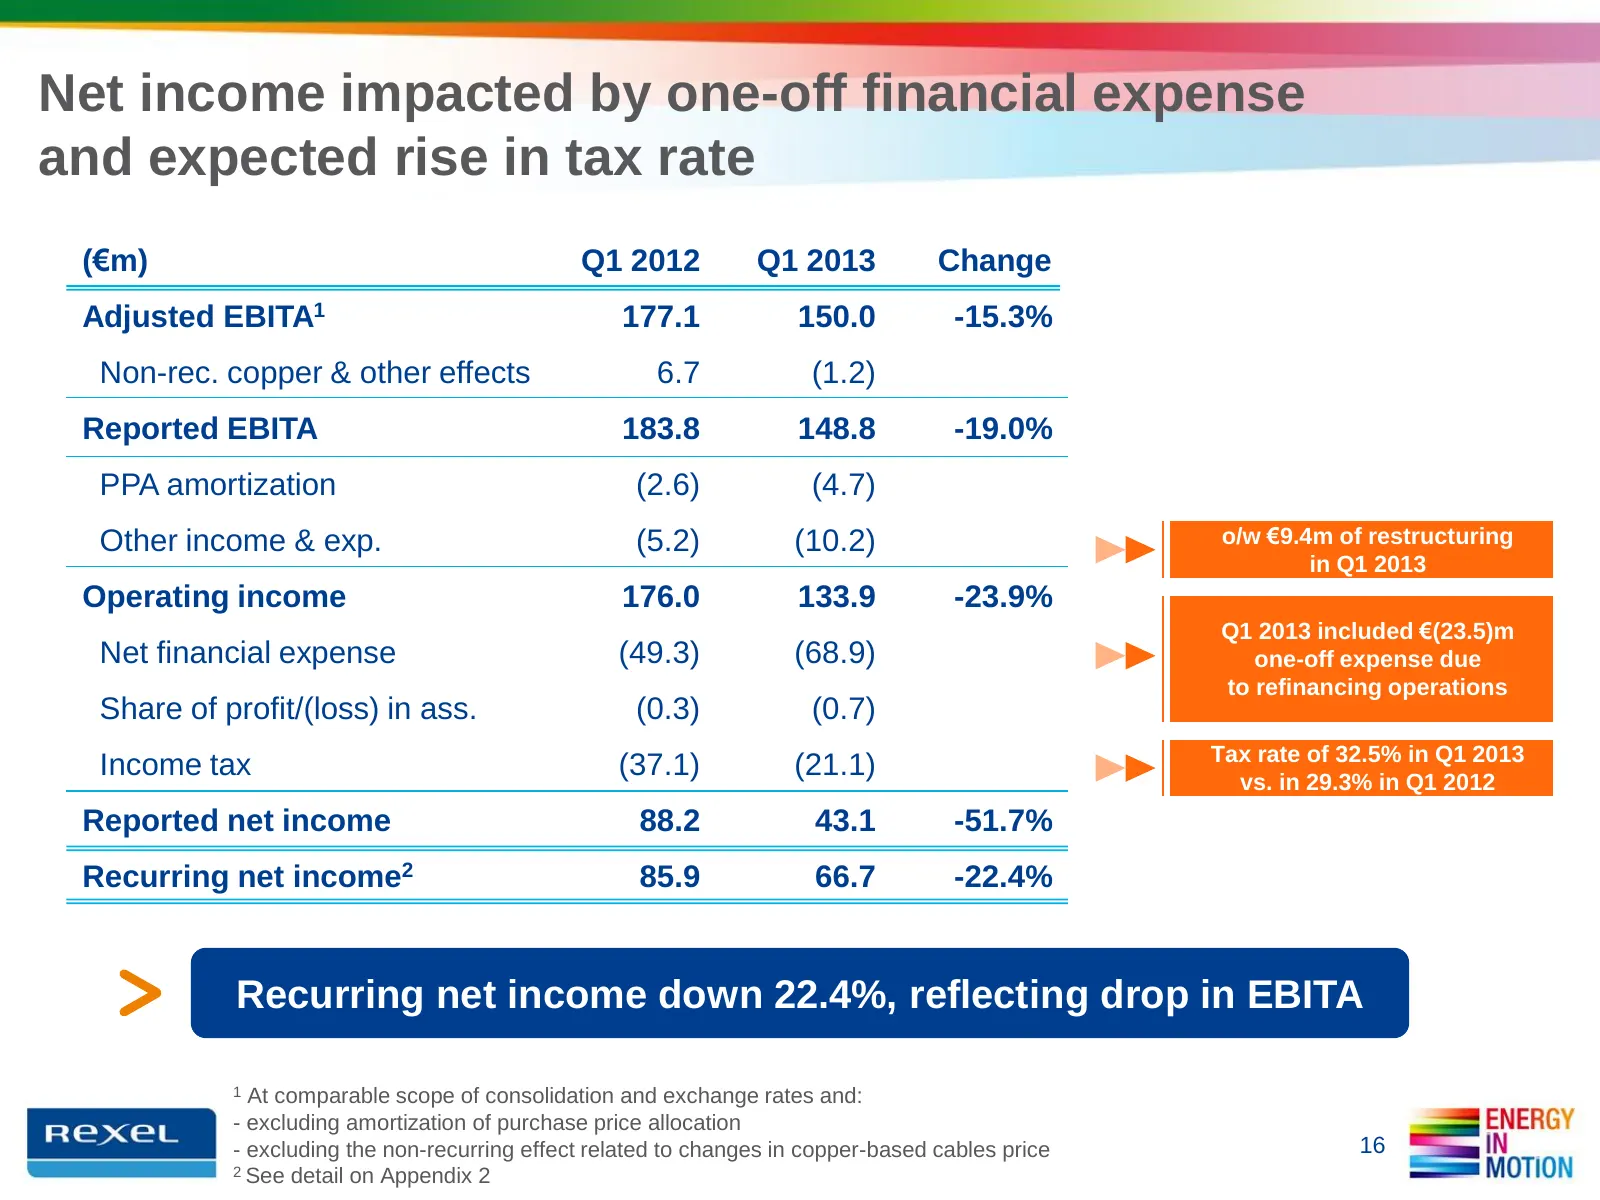
Net income impacted by one-off financial expense and expected rise in tax rate (€m) Q1 2012 Q1 2013 Change Adjusted EBITA1 177.1 150.0 -15.3% Non-rec. copper & other effects 6.7 (1.2) Reported EBITA 183.8 148.8 -19.0% PPA amortization (2.6) (4.7) Other income & exp. (5.2) (10.2) o/w €9.4m of restruc
Slide 17: FCF before interest and tax affected by calendar and logistics projects
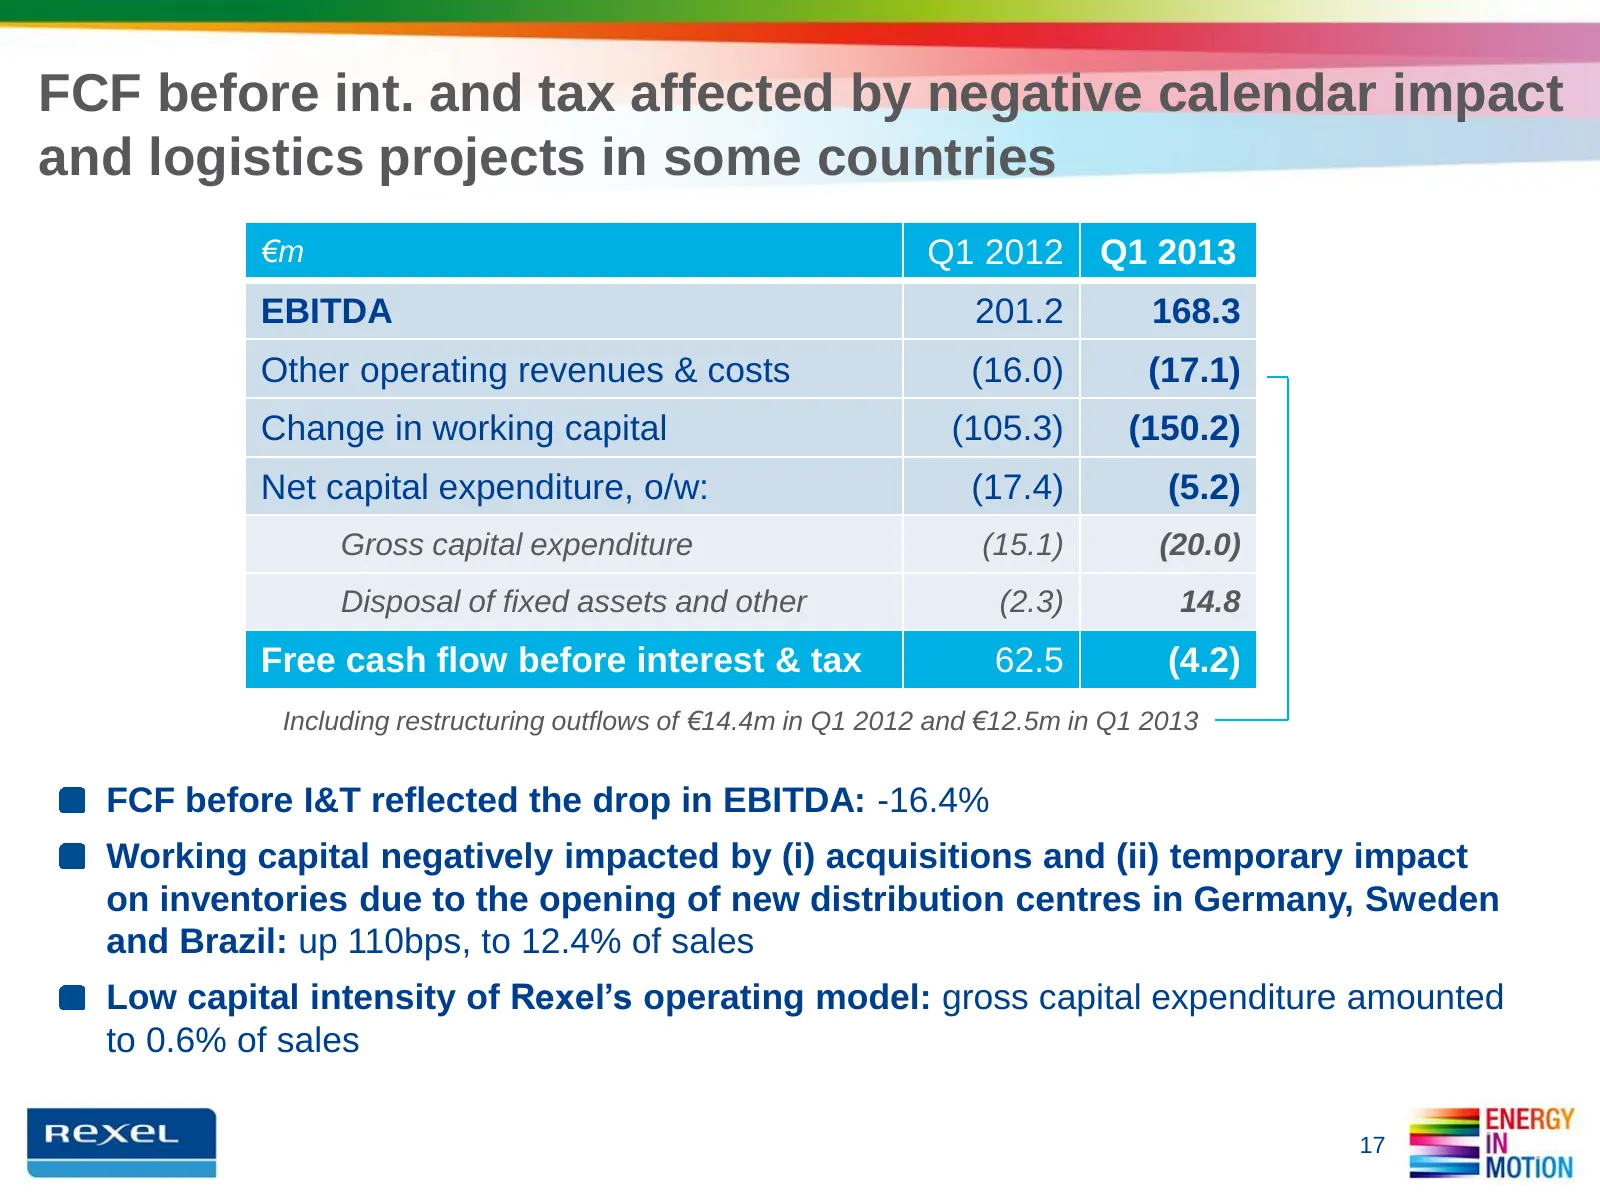
FCF before int. and tax affected by negative calendar impact and logistics projects in some countries €m Q1 2012 Q1 2013 EBITDA 201.2 168.3 Other operating revenues & costs (16.0) (17.1) Change in working capital (105.3) (150.2) Net capital expenditure, o/w: (17.4) (5.2) Gross capital expenditure (1
Slide 18: Rise in net debt due to seasonality of cash generation
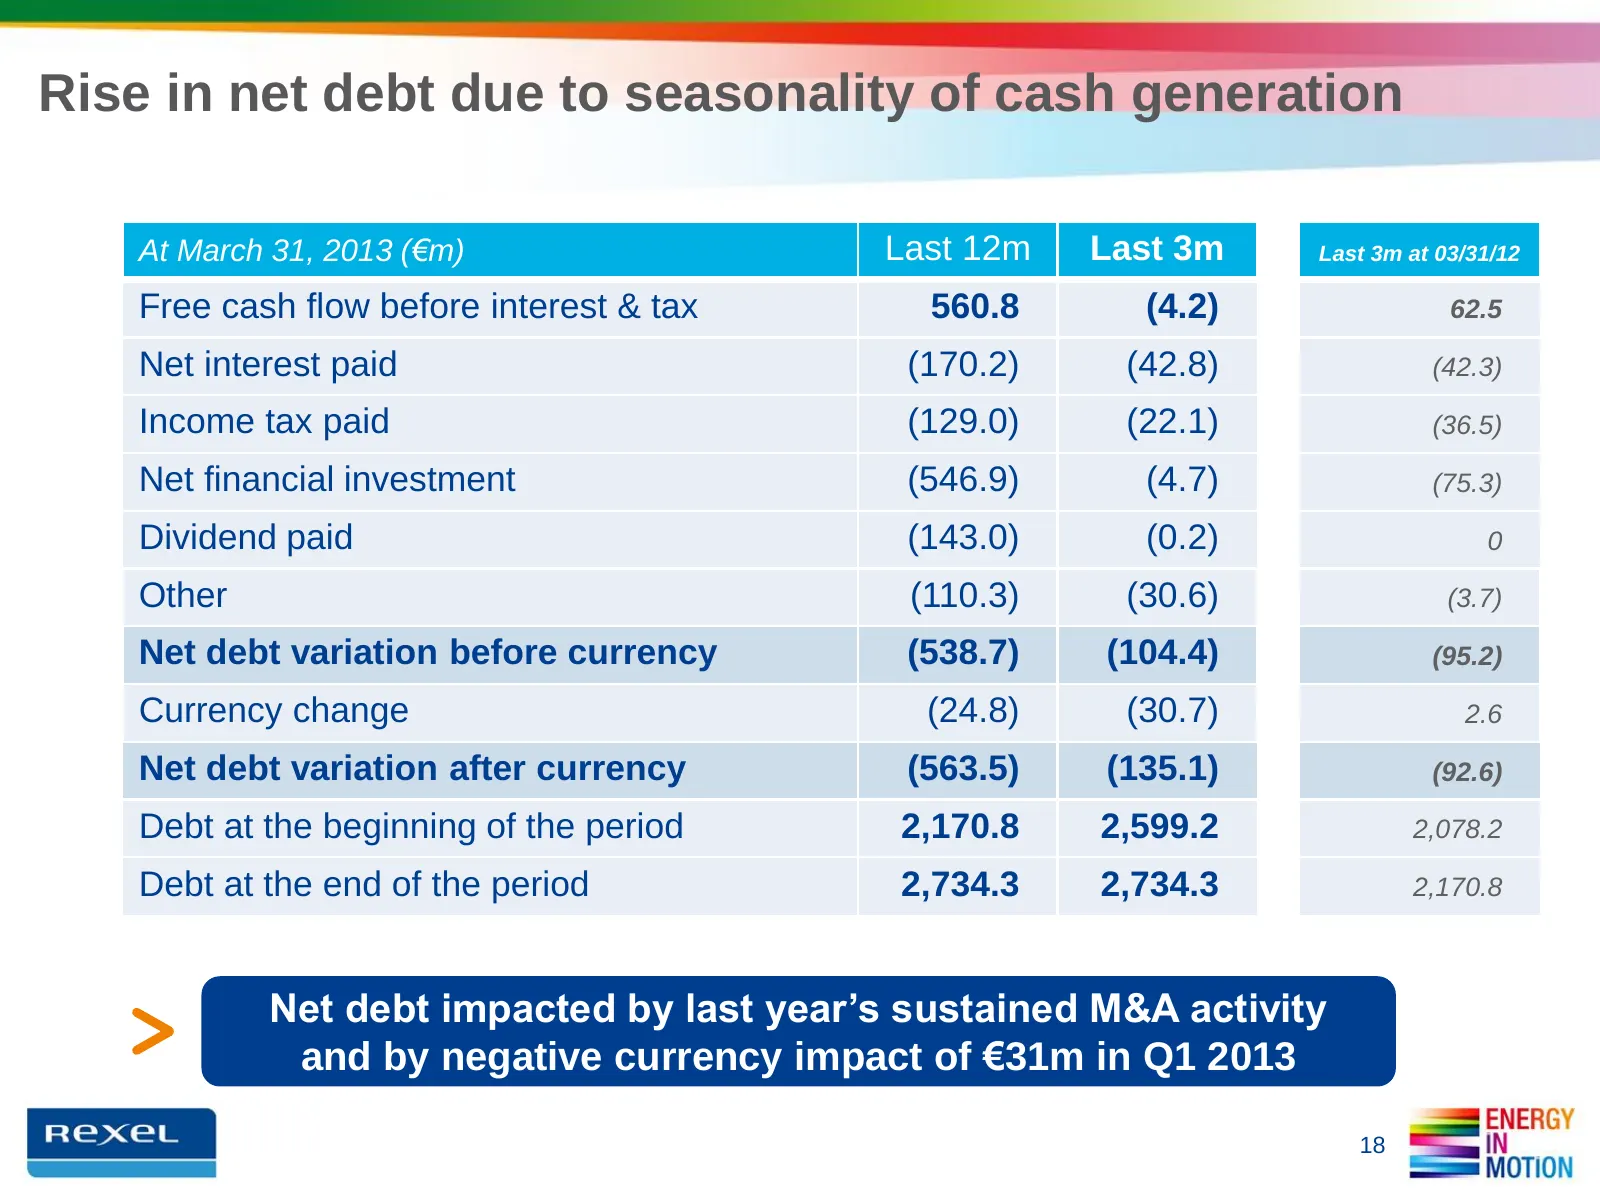
Rise in net debt due to seasonality of cash generation At March 31, 2013 (€m) Last 12m Last 3m Last 3m at 03/31/12 Free cash flow before interest & tax 560.8 (4.2) 62.5 Net interest paid (170.2) (42.8) (42.3) Income tax paid (129.0) (22.1) (36.5) Net financial investment (546.9) (4.7) (75.3) Dividen
Slide 19: Rexel boasts a solid financial structure
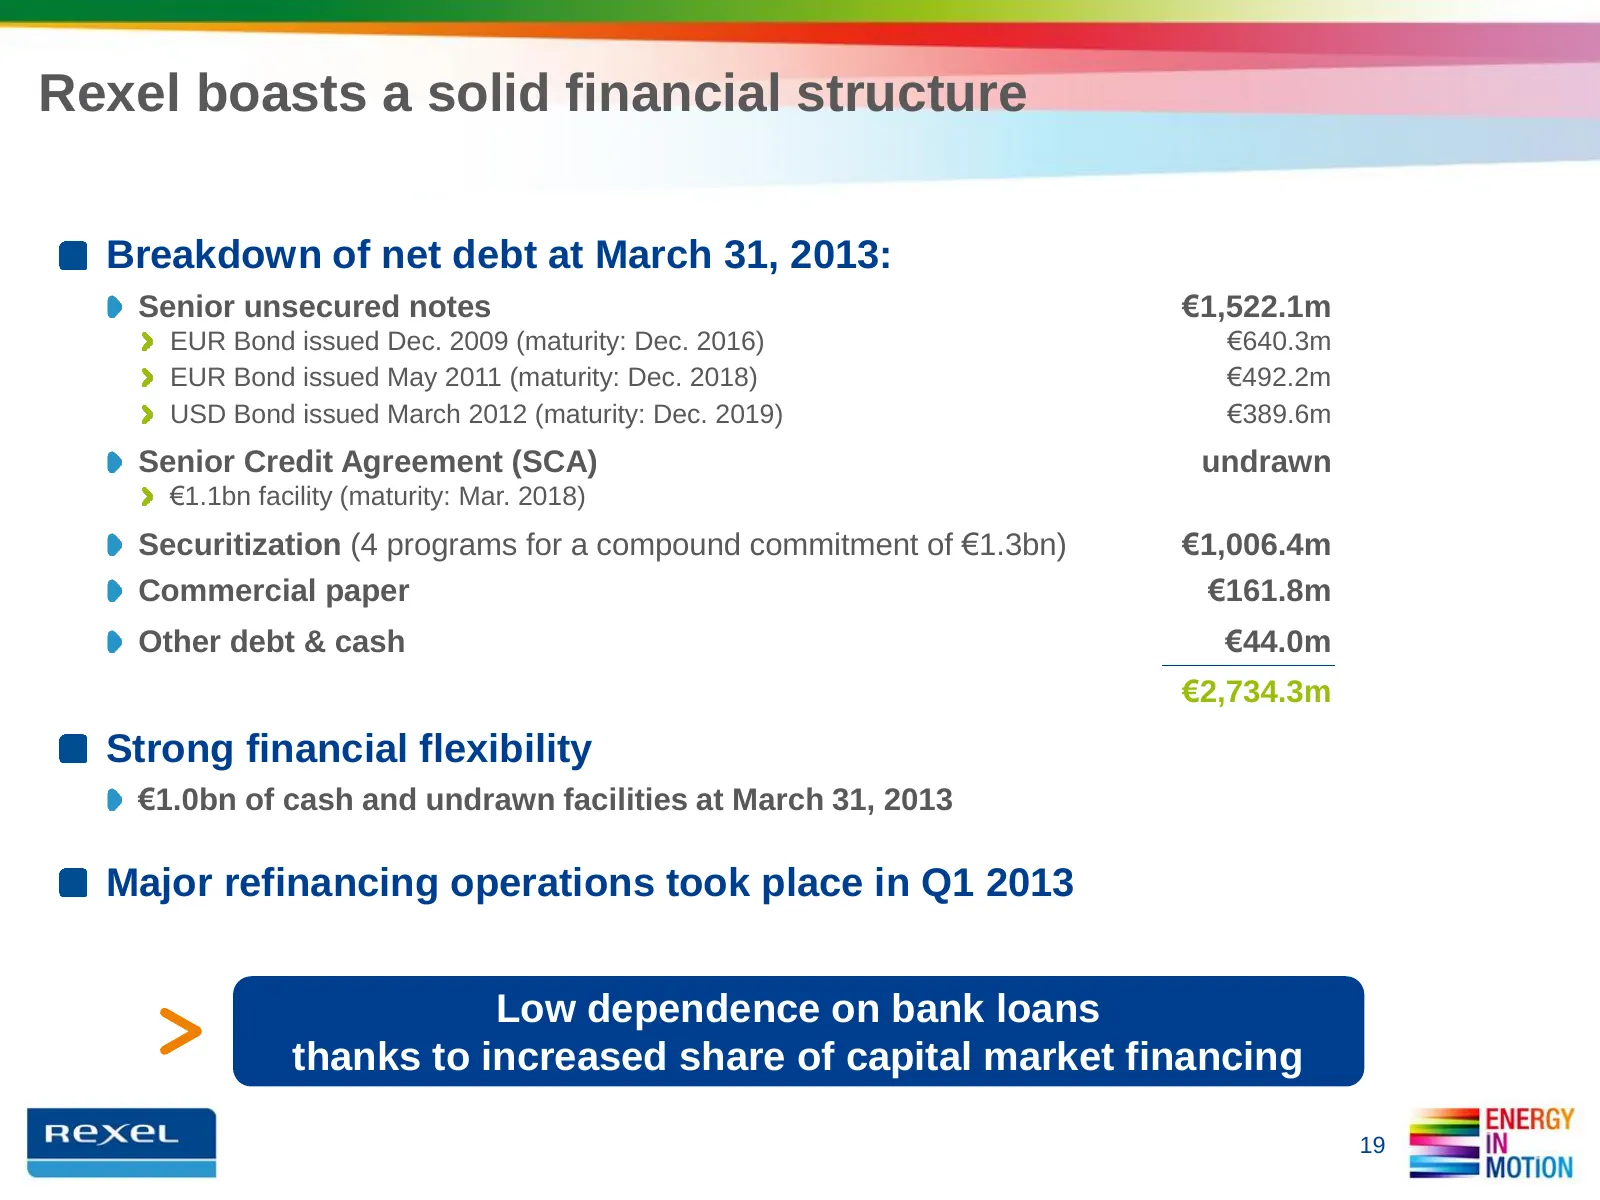
Rexel boasts a solid financial structure Breakdown of net debt at March 31, 2013: Senior unsecured notes €1,522.1m EUR Bond issued Dec. 2009 (maturity: Dec. 2016) €640.3m EUR Bond issued May 2011 (maturity: Dec. 2018) €492.2m USD Bond issued March 2012 (maturity: Dec. 2019) €389.6m Senior Credit Agr
Slide 20: Refinancing of the Senior Credit Agreement
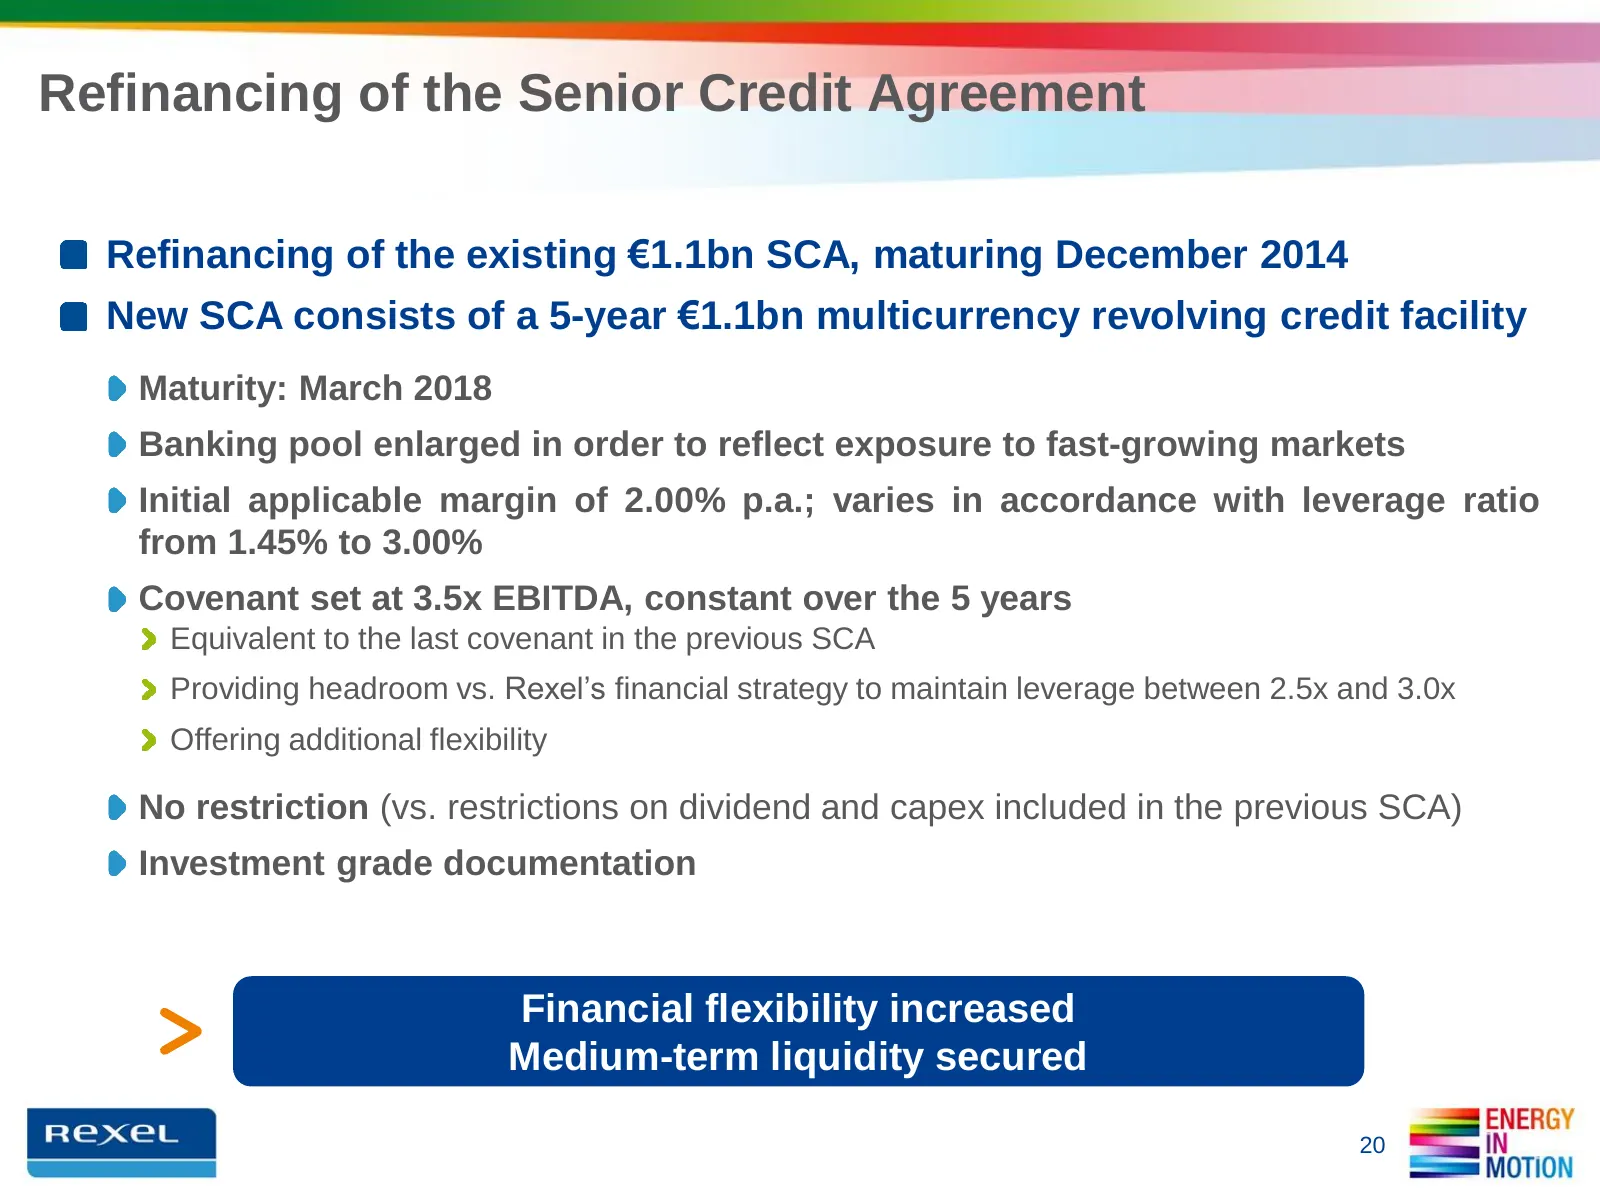
Refinancing of the Senior Credit Agreement Refinancing of the existing €1.1bn SCA, maturing December 2014 New SCA consists of a 5-year €1.1bn multicurrency revolving credit facility Maturity: March 2018 Banking pool enlarged in order to reflect exposure to fast-growing markets Initial applicable mar
Slide 21: Bond issuance in € and USD maturing 2020
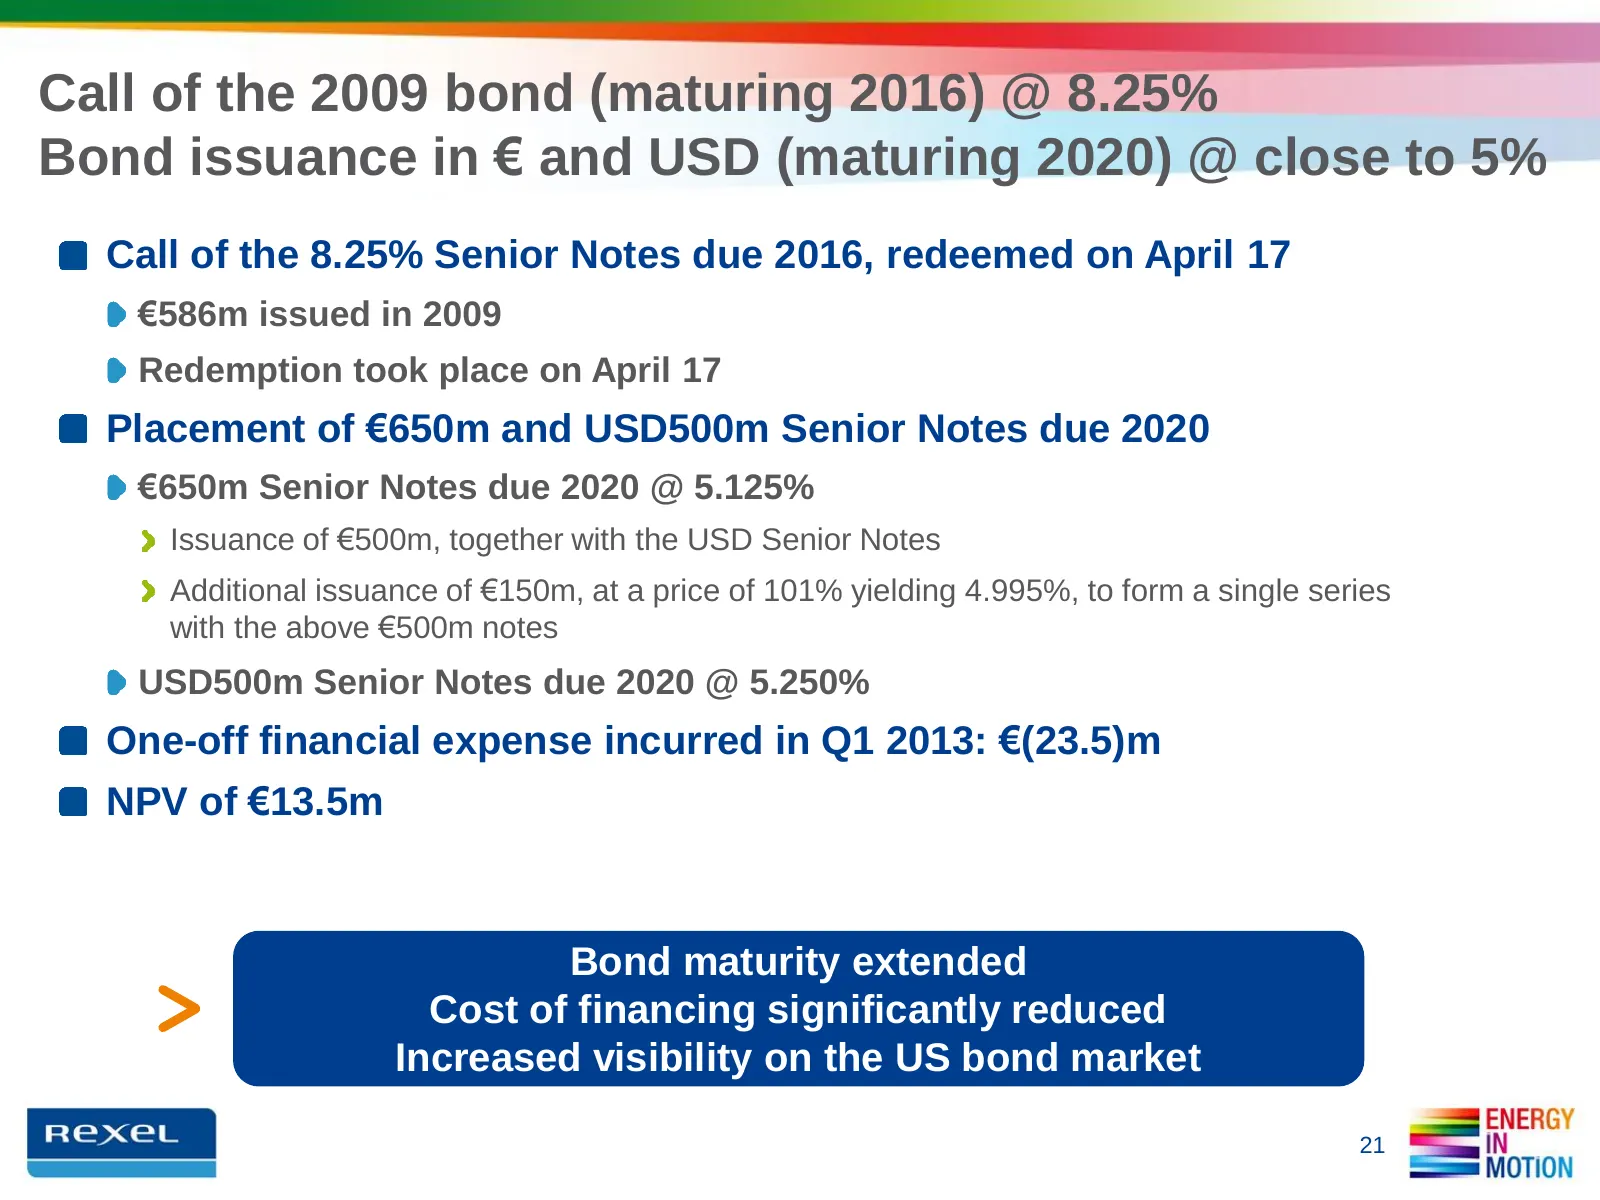
Call of the 2009 bond (maturing 2016) @ 8.25% Bond issuance in € and USD (maturing 2020) @ close to 5% Call of the 8.25% Senior Notes due 2016, redeemed on April 17 €586m issued in 2009 Redemption took place on April 17 Placement of €650m and USD500m Senior Notes due 2020 €650m Senior Notes due 2020
Slide 22: Enhanced debt profile
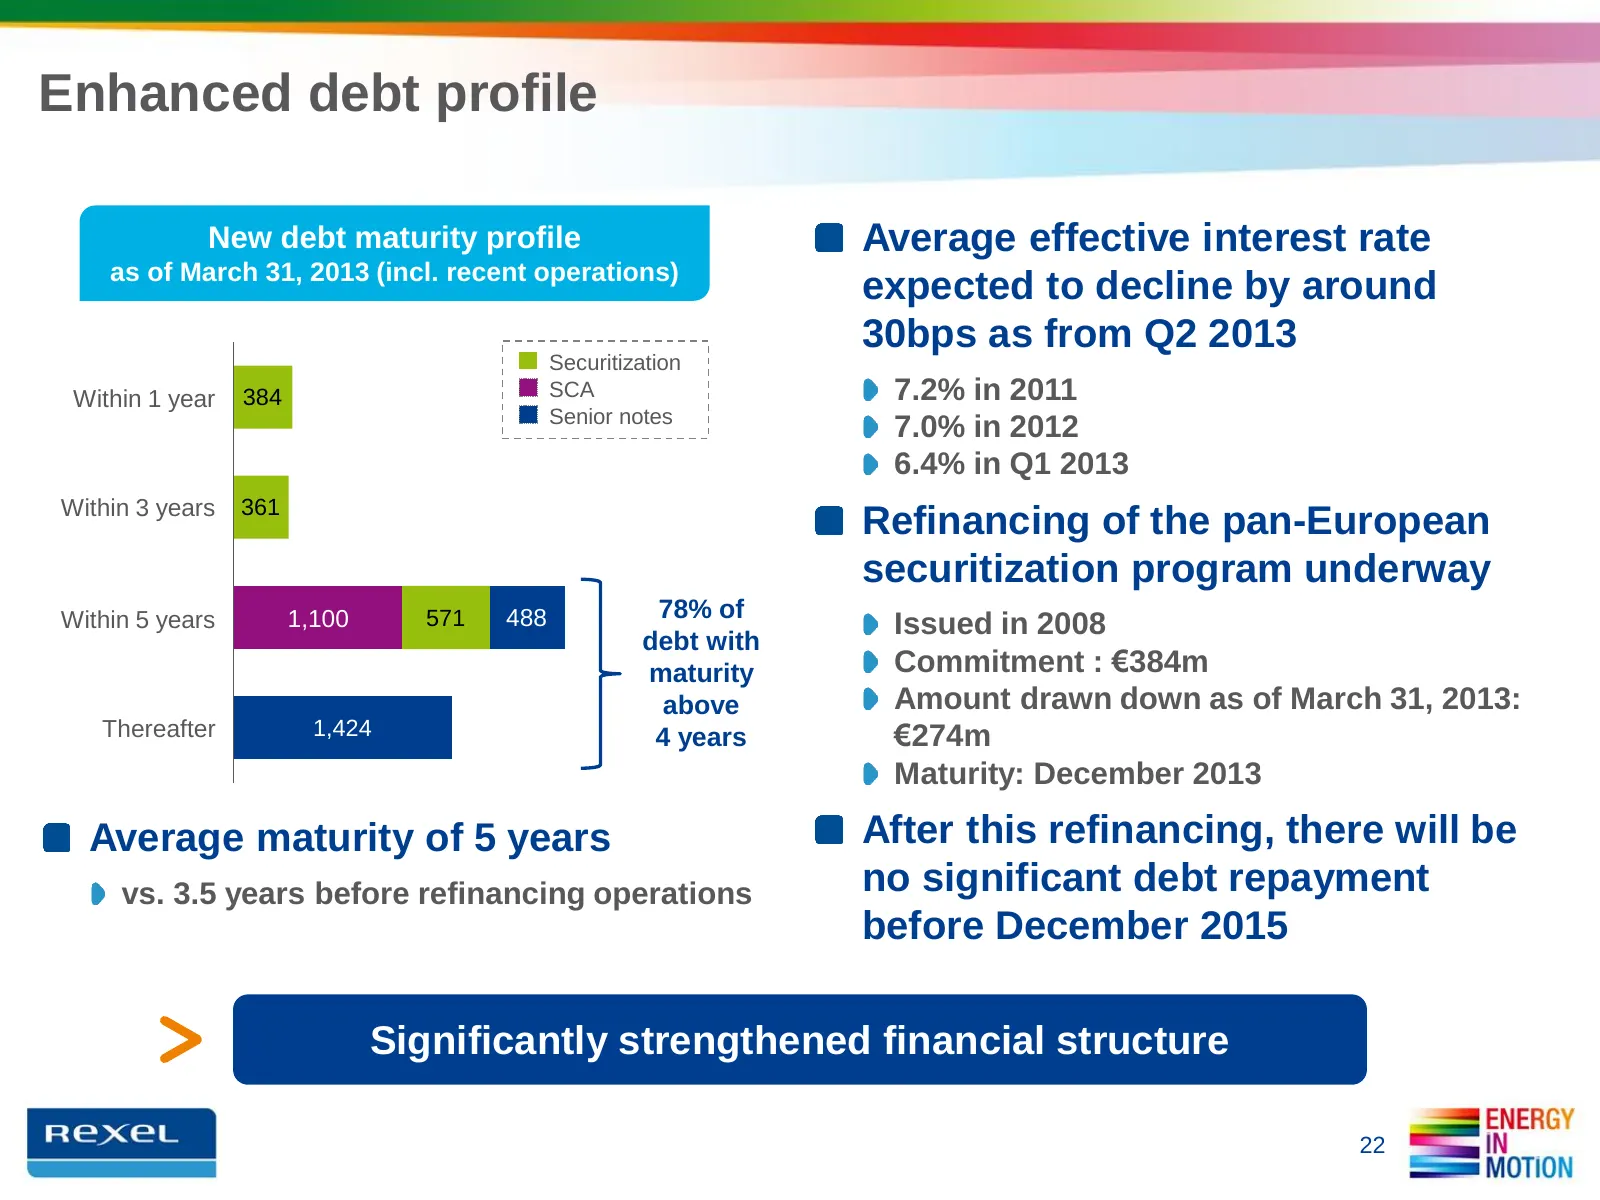
Enhanced debt profile New debt maturity profile Average effective interest rate as of March 31, 2013 (incl. recent operations) expected to decline by around 30bps as from Q2 2013 Securitization Within 1 year 384 SCA 7.2% in 2011 Senior notes 7.0% in 2012 6.4% in Q1 2013 Within 3 years 361 Refinancin

Slide 23: Outlook
OUTLOOK =a — = orion
Slide 24: Full-year 2013 targets confirmed
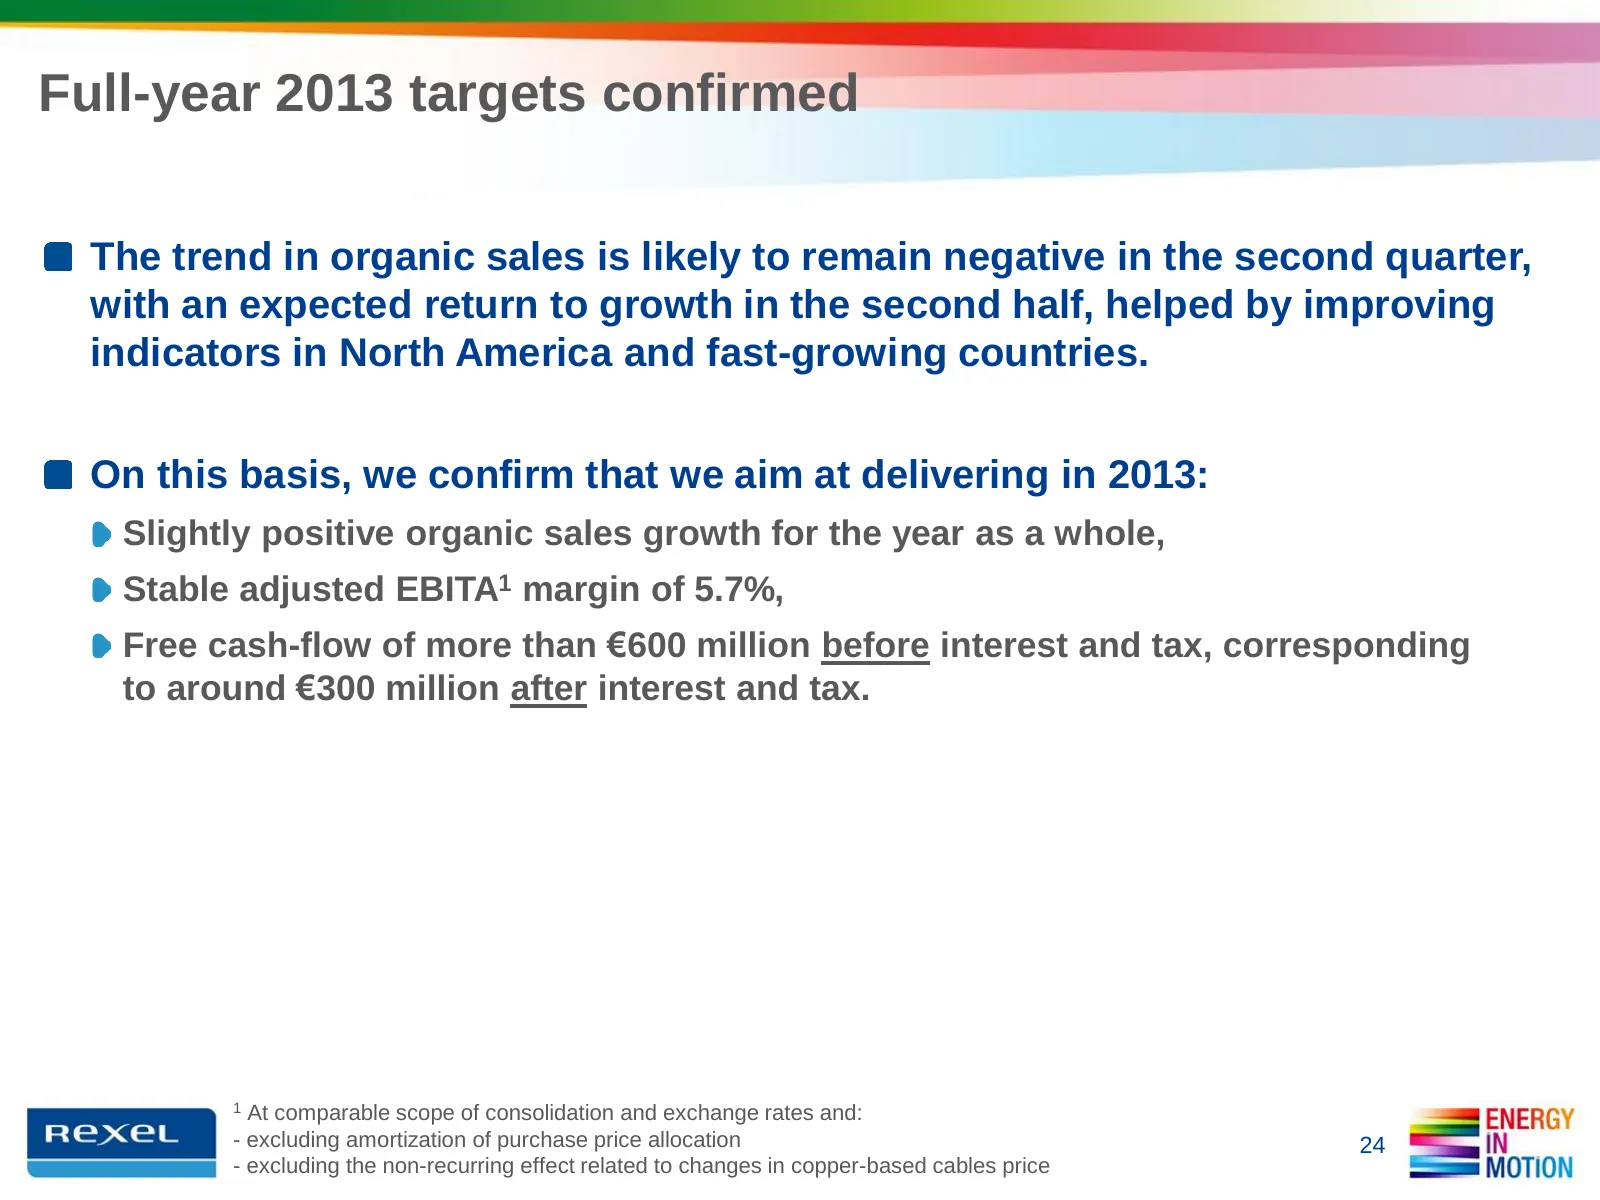
Full-year 2013 targets confirmed The trend in organic sales is likely to remain negative in the second quarter, with an expected return to growth in the second half, helped by improving indicators in North America and fast-growing countries. On this basis, we confirm that we aim at delivering in 201
Slide 25: Appendices
Rexel has elected for early adoption of revised IAS 19 “Employee Benefits” following its endorsement by EU on June 6th, 2012. The early adoption of this amendment improves information of the Group’s financial situation, in APPENDICES particular the presentation in the financial statements of the sur
Slide 26: Appendix 1: Segment reporting - Group
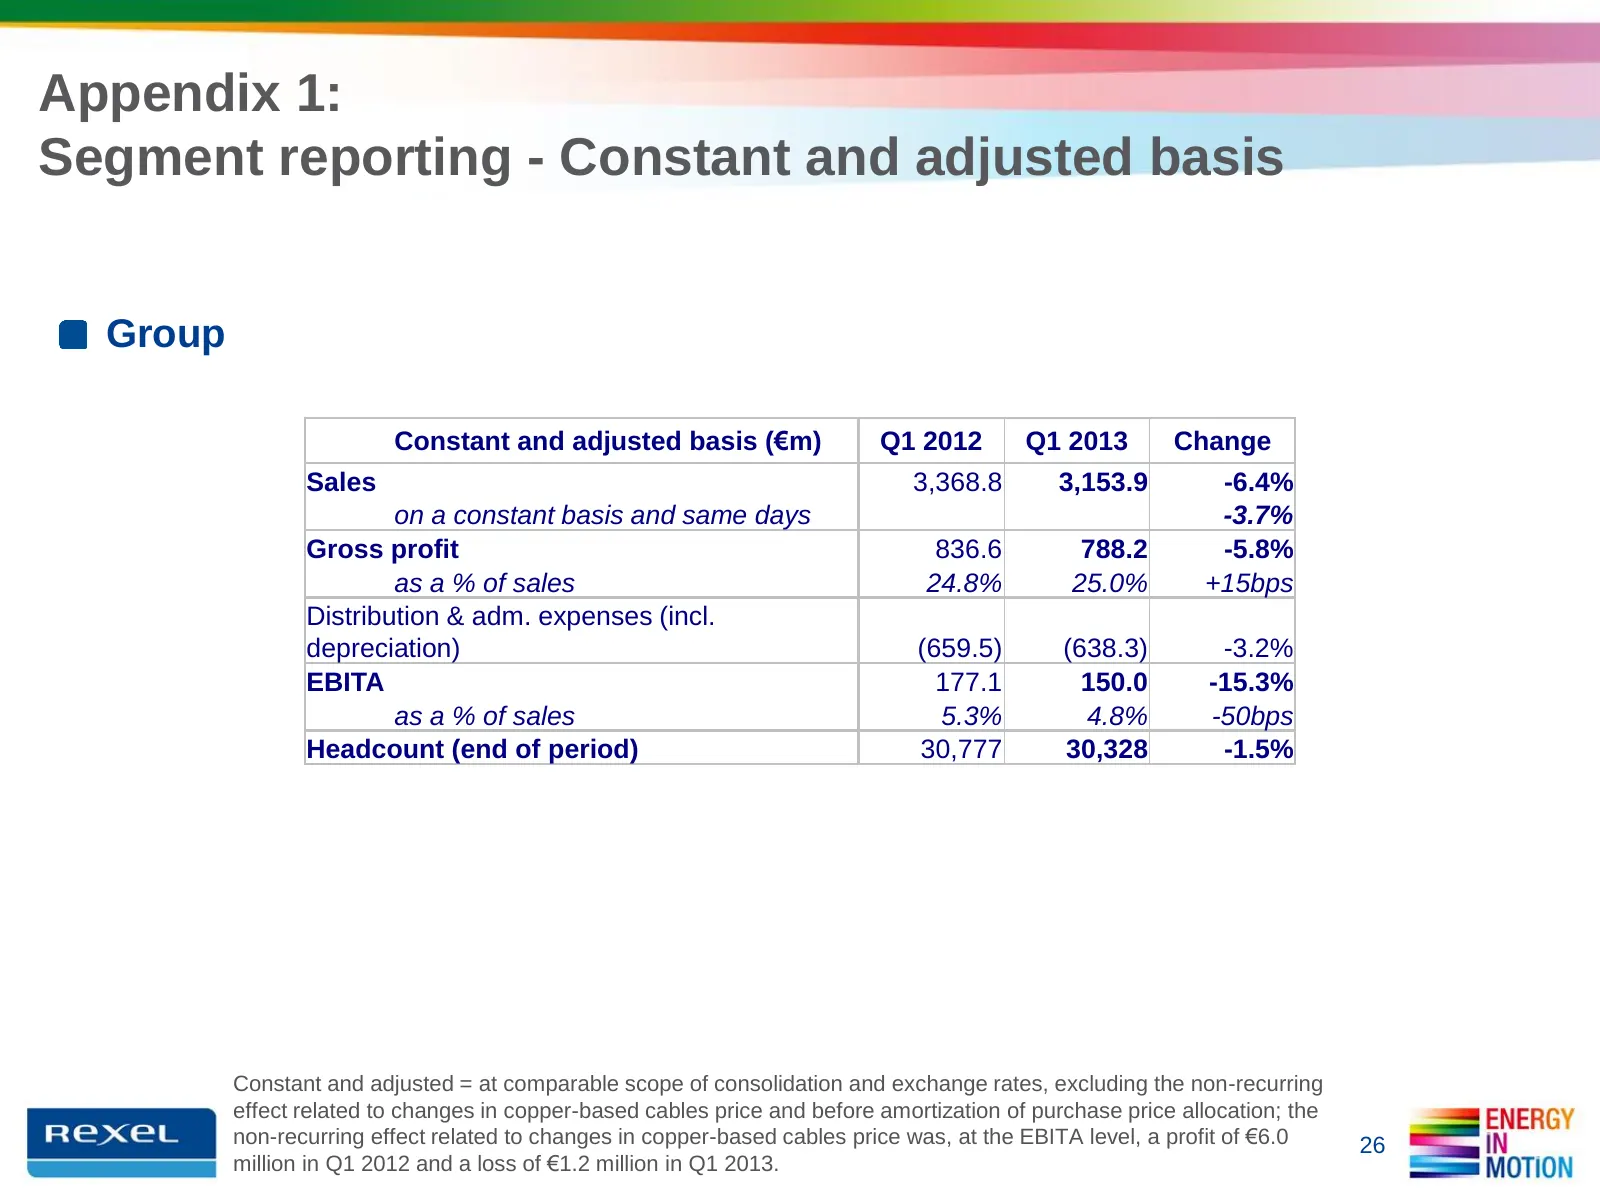
Appendix 1: Segment reporting - Constant and adjusted basis Group Constant and adjusted basis (€m) Q1 2012 Q1 2013 Change Sales 3,368.8 3,153.9 -6.4% on a constant basis and same days -3.7% Gross profit 836.6 788.2 -5.8% as a % of sales 24.8% 25.0% +15bps Distribution & adm. expenses (incl. deprecia
Slide 27: Appendix 1: Segment reporting - Europe
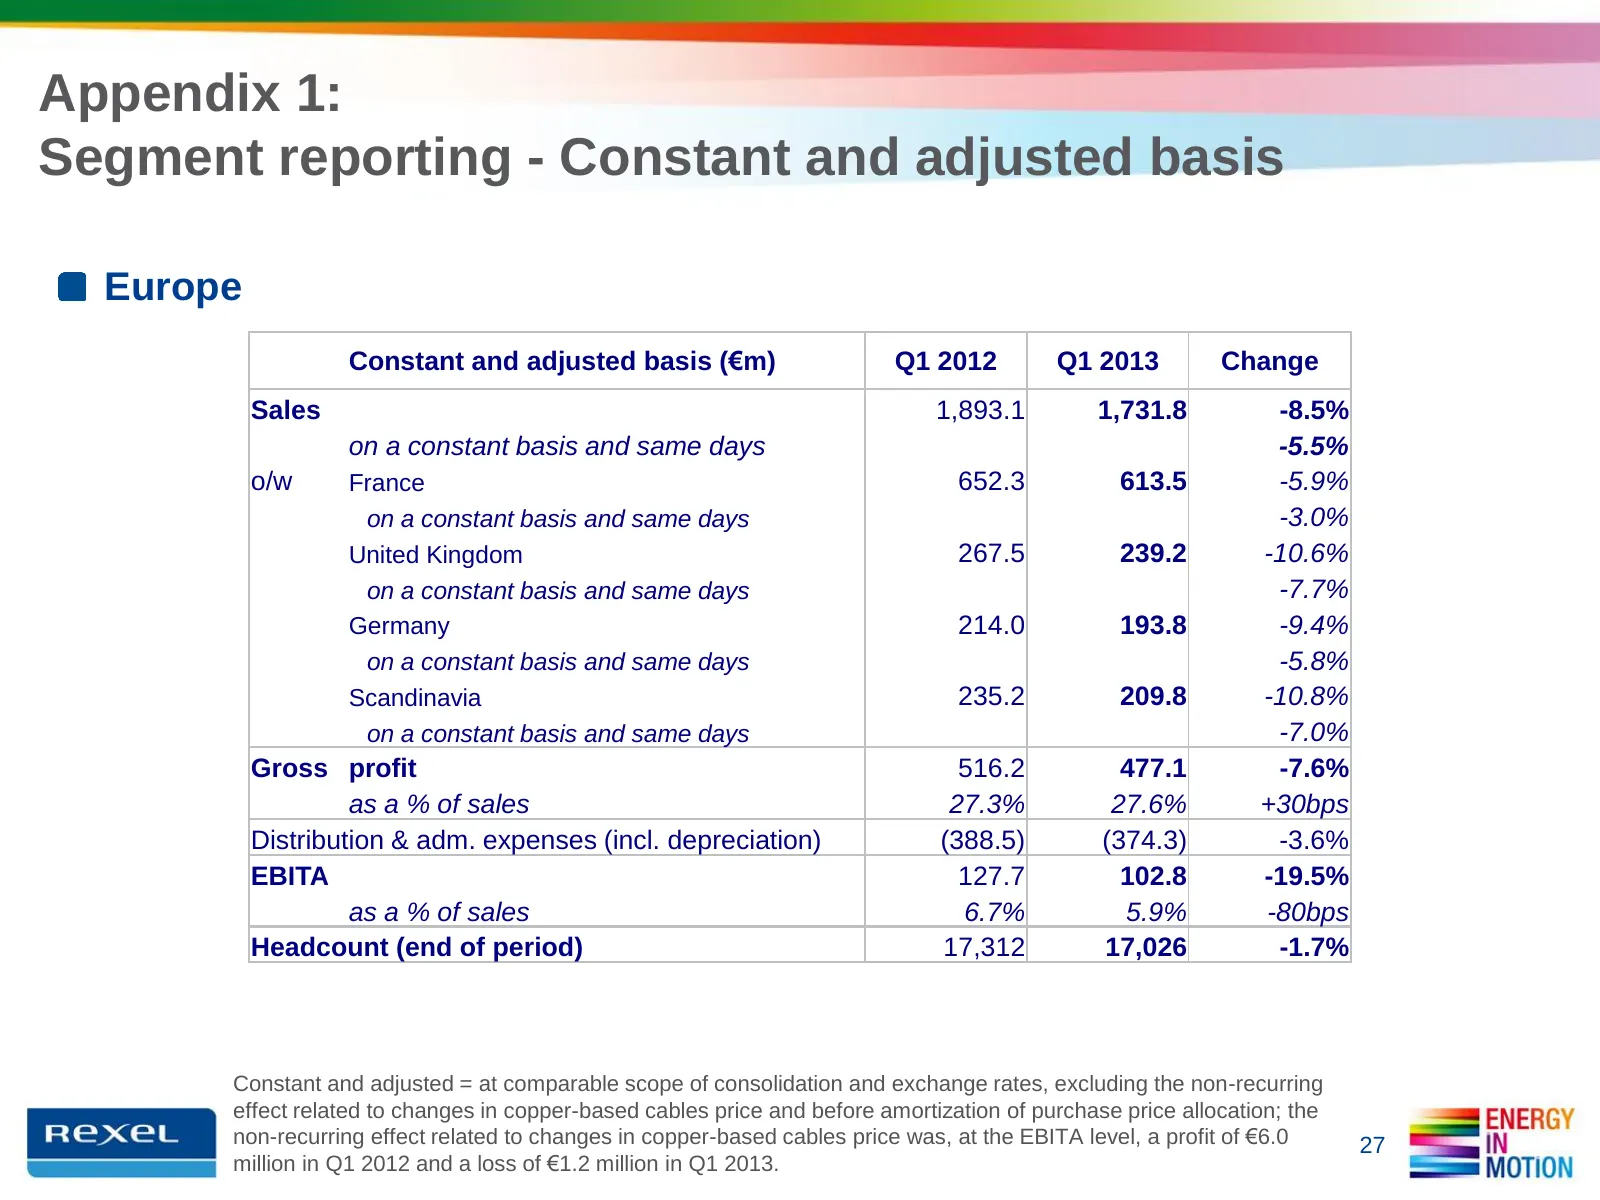
Appendix 1: Segment reporting - Constant and adjusted basis Europe Constant and adjusted basis (€m) Q1 2012 Q1 2013 Change Sales 1,893.1 1,731.8 -8.5% on a constant basis and same days -5.5% o/w France 652.3 613.5 -5.9% on a constant basis and same days -3.0% United Kingdom 267.5 239.2 -10.6% on a c
Slide 28: Appendix 1: Segment reporting - North America
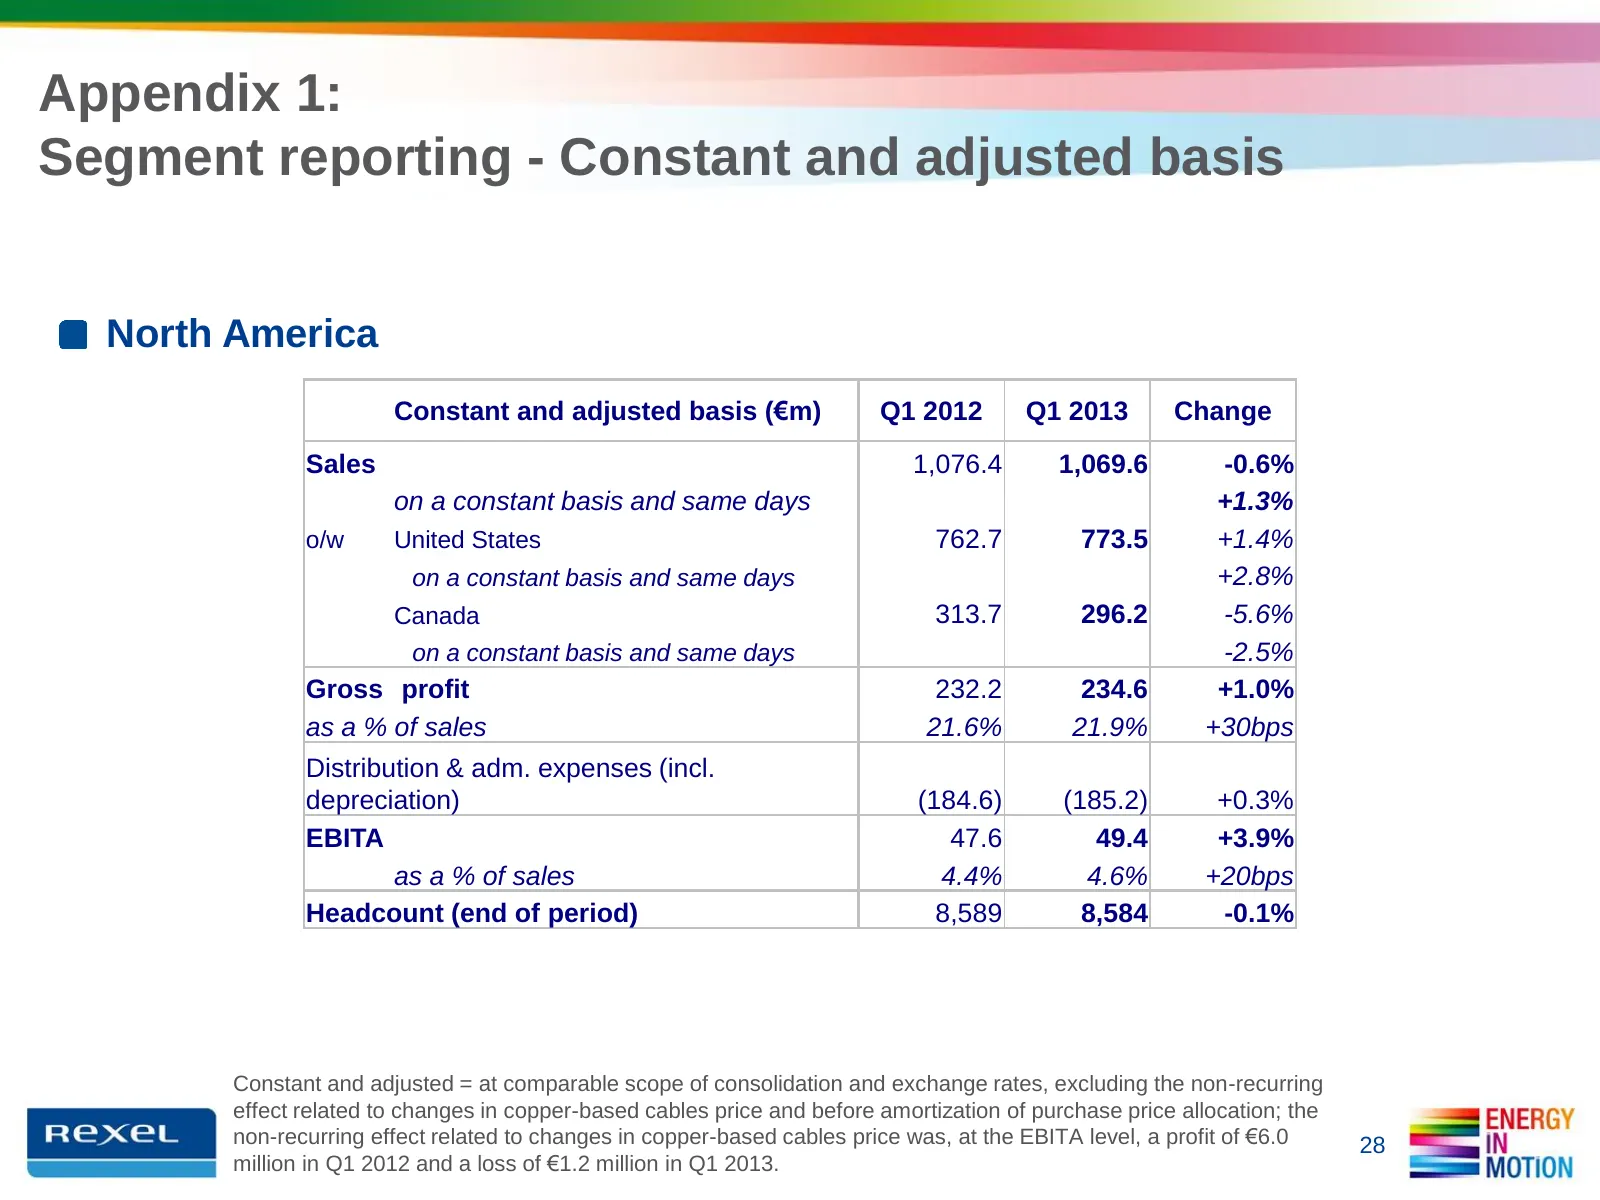
Appendix 1: Segment reporting - Constant and adjusted basis North America Constant and adjusted basis (€m) Q1 2012 Q1 2013 Change Sales 1,076.4 1,069.6 -0.6% on a constant basis and same days +1.3% o/w United States 762.7 773.5 +1.4% on a constant basis and same days +2.8% Canada 313.7 296.2 -5.6% o
Slide 29: Appendix 1: Segment reporting - Asia-Pacific
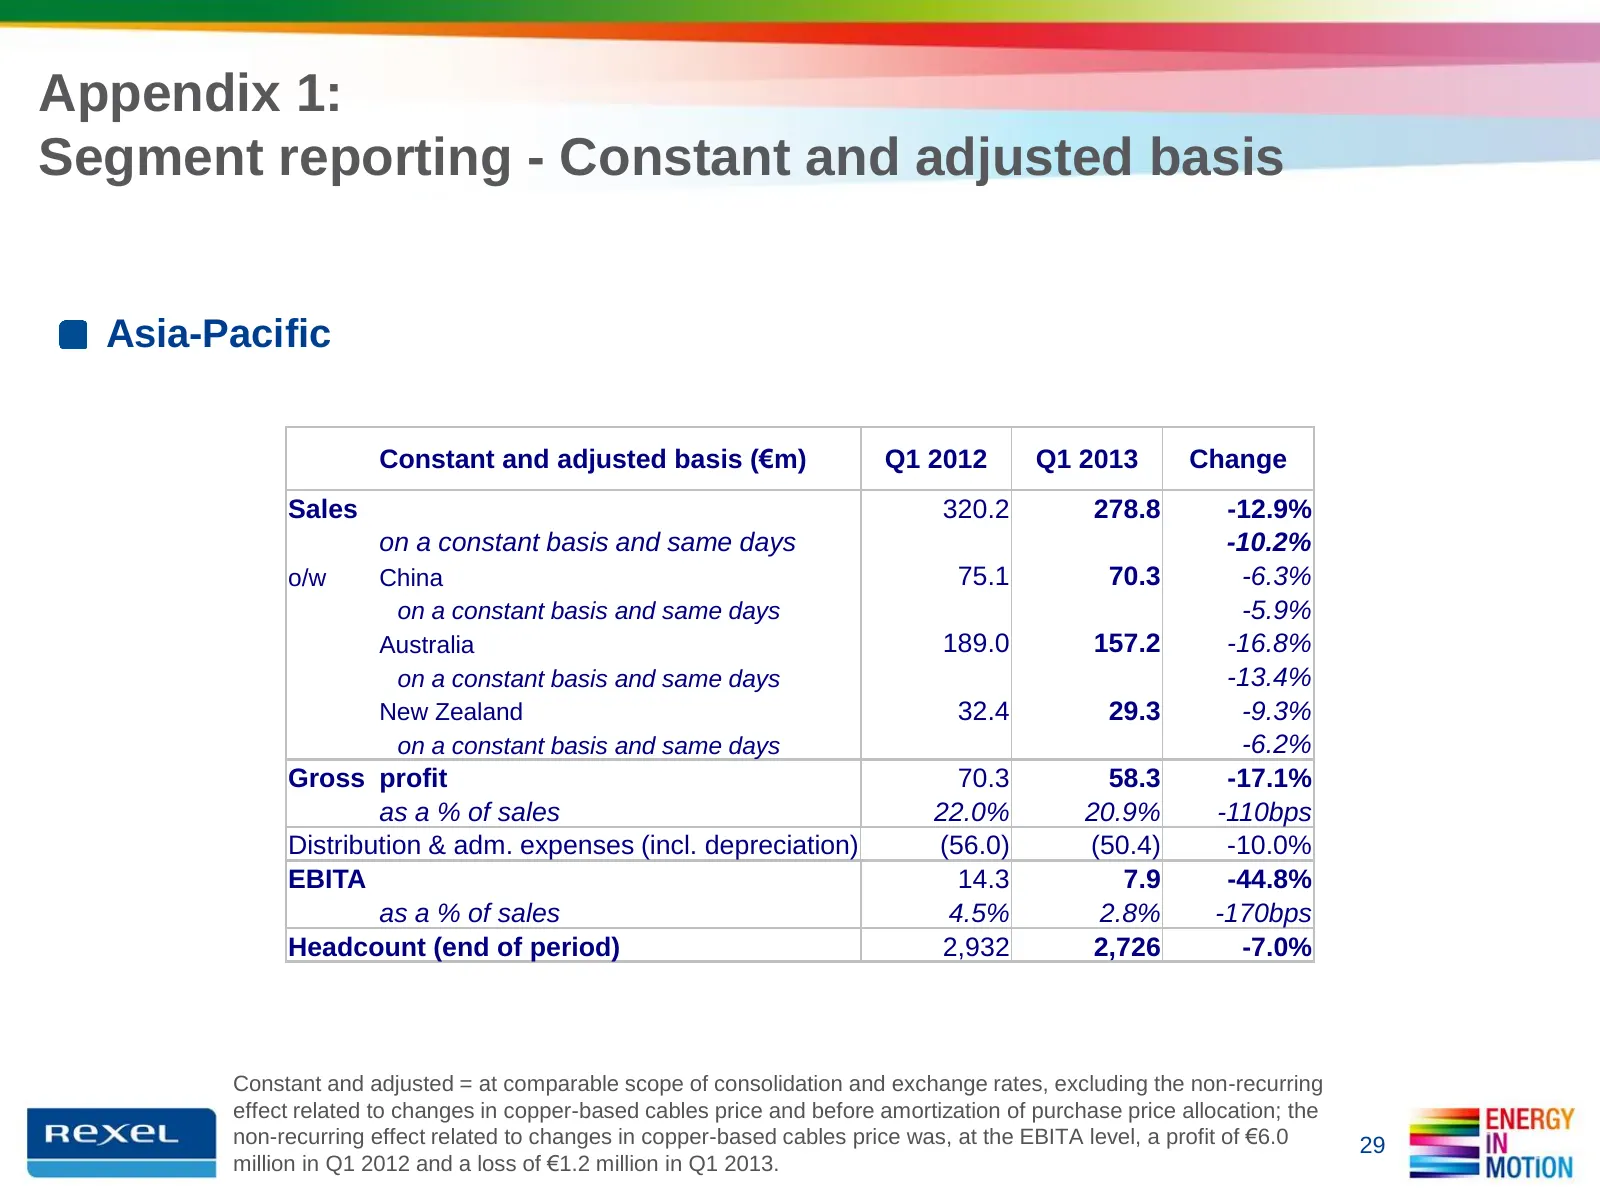
Appendix 1: Segment reporting - Constant and adjusted basis Asia-Pacific Constant and adjusted basis (€m) Q1 2012 Q1 2013 Change Sales 320.2 278.8 -12.9% on a constant basis and same days -10.2% o/w China 75.1 70.3 -6.3% on a constant basis and same days -5.9% Australia 189.0 157.2 -16.8% on a const
Slide 30: Appendix 1: Segment reporting - Latin America
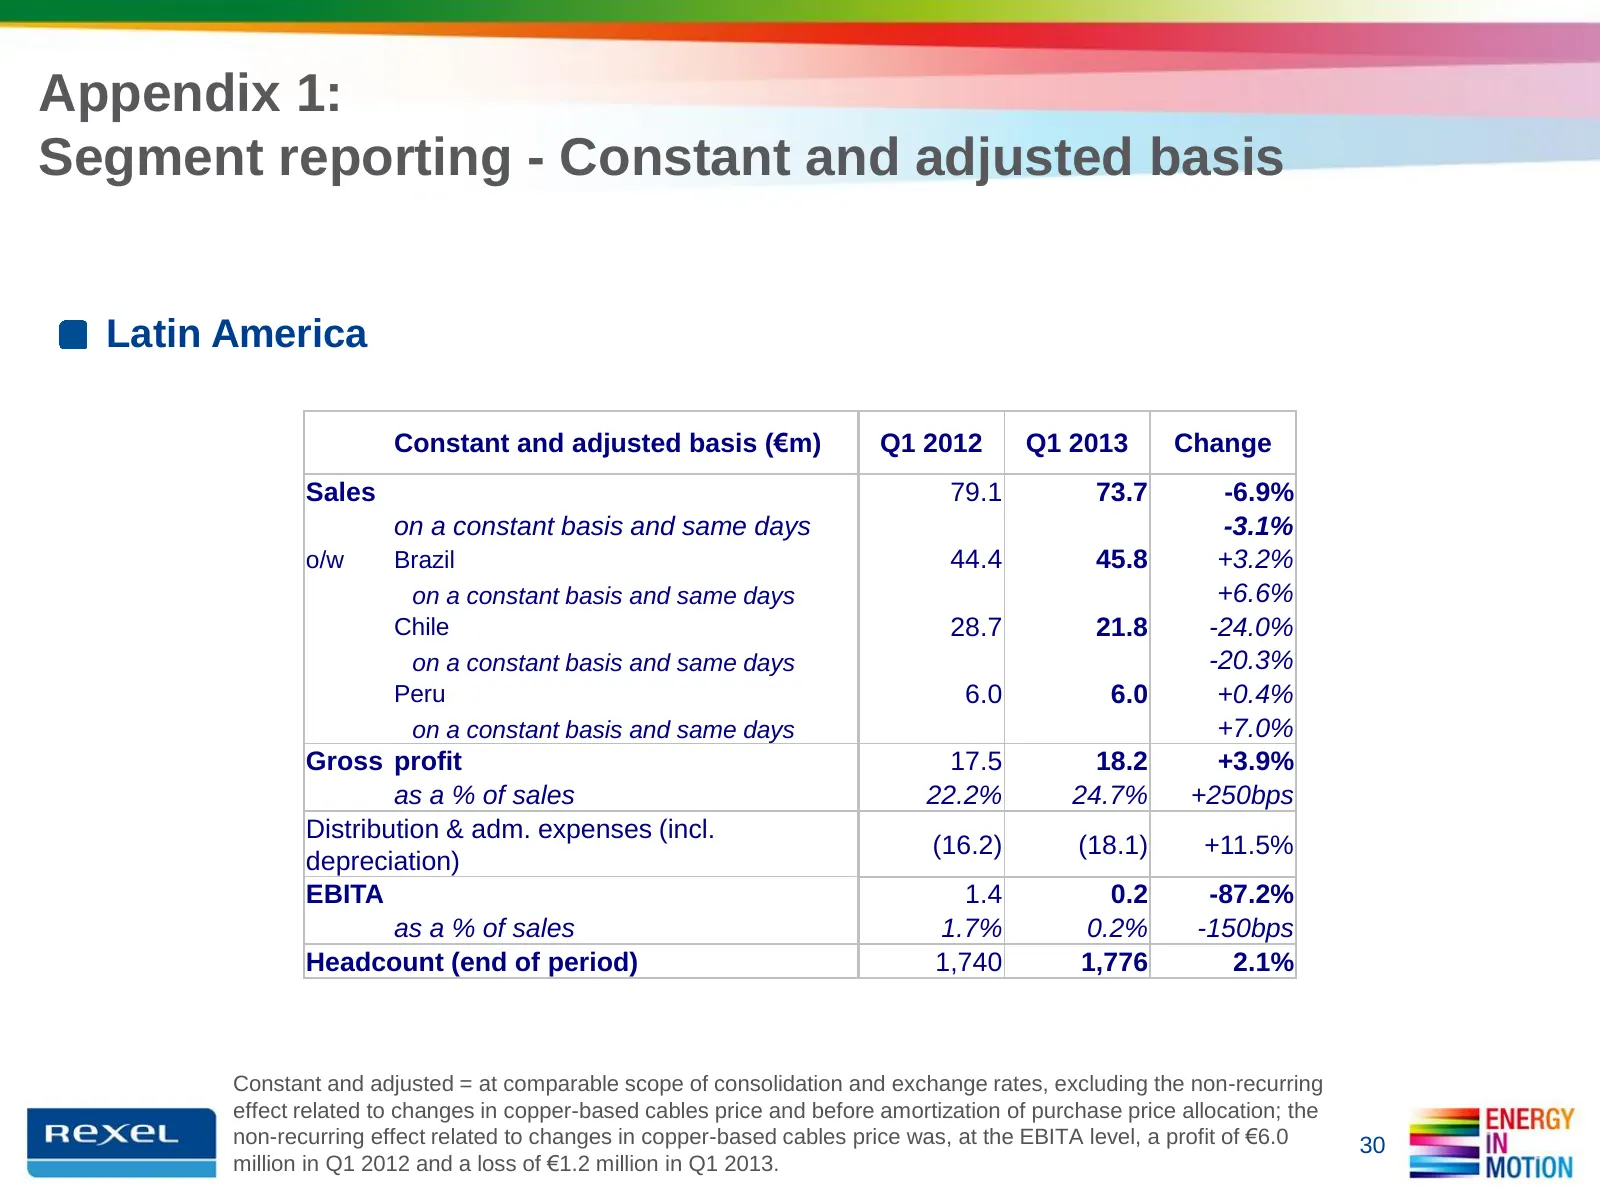
Appendix 1: Segment reporting - Constant and adjusted basis Latin America Constant and adjusted basis (€m) Q1 2012 Q1 2013 Change Sales 79.1 73.7 -6.9% on a constant basis and same days -3.1% o/w Brazil 44.4 45.8 +3.2% on a constant basis and same days +6.6% Chile 28.7 21.8 -24.0% on a constant basi
Slide 31: Appendix 2: Consolidated Income Statement
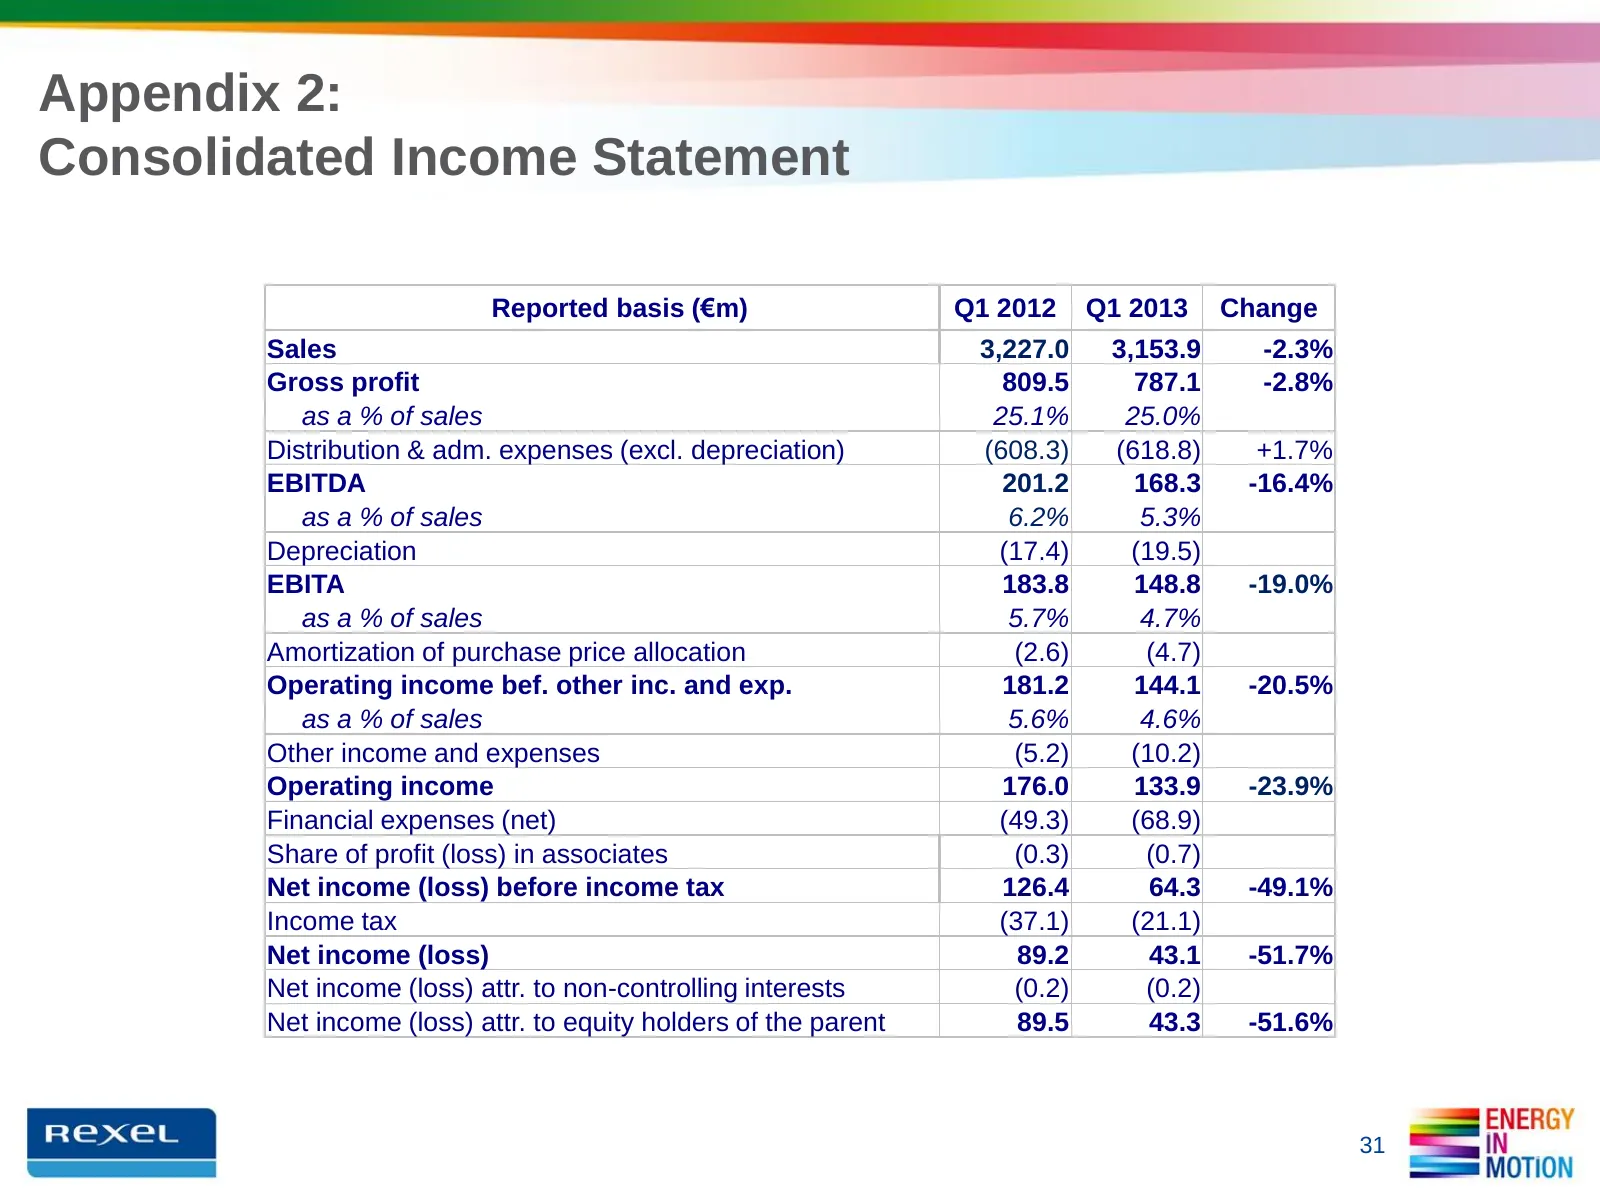
Appendix 2: Consolidated Income Statement Reported basis (€m) Q1 2012 Q1 2013 Change Sales 3,227.0 3,153.9 -2.3% Gross profit 809.5 787.1 -2.8% as a % of sales 25.1% 25.0% Distribution & adm. expenses (excl. depreciation) (608.3) (618.8) +1.7% EBITDA 201.2 168.3 -16.4% as a % of sales 6.2% 5.3% Depr
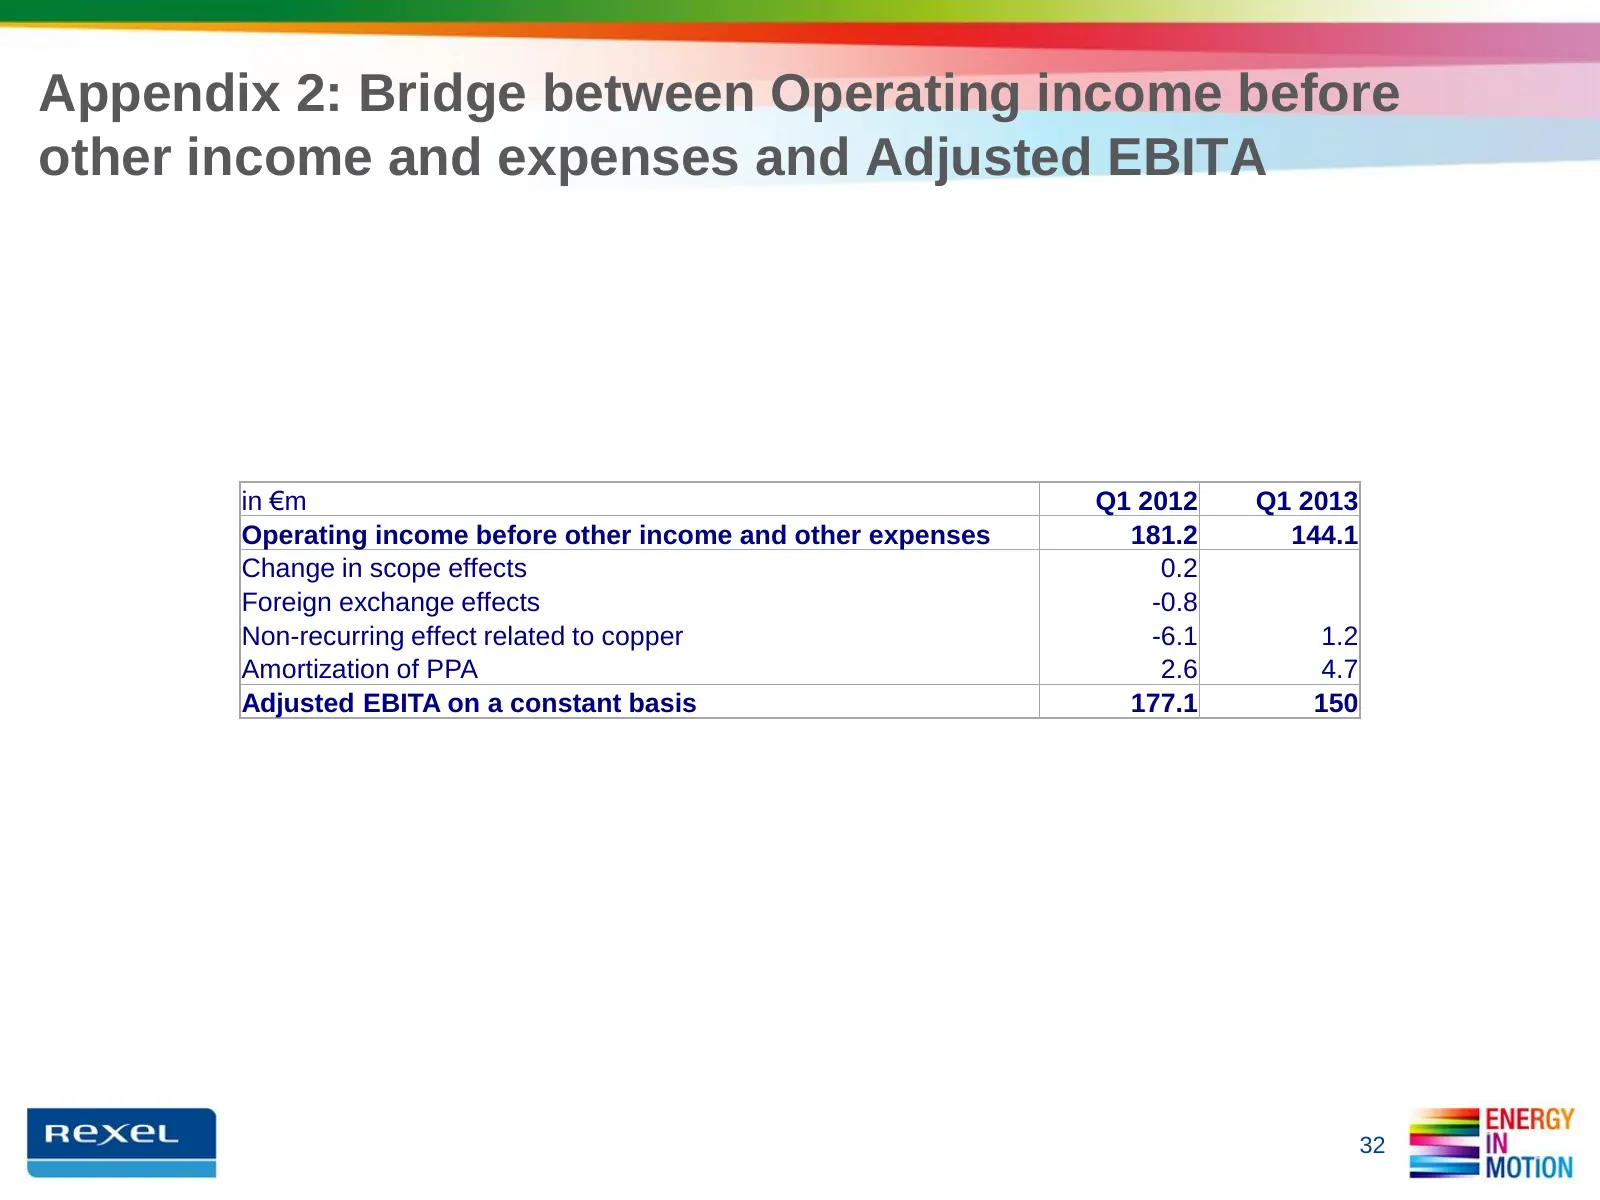
Slide 32: Appendix 2: Bridge to Adjusted EBITA
Appendix 2: Bridge between Operating income before other income and expenses and Adjusted EBITA in €m Q1 2012 Q1 2013 Operating income before other income and other expenses 181.2 144.1 Change in scope effects 0.2 Foreign exchange effects -0.8 Non-recurring effect related to copper -6.1 1.2 Amortiza
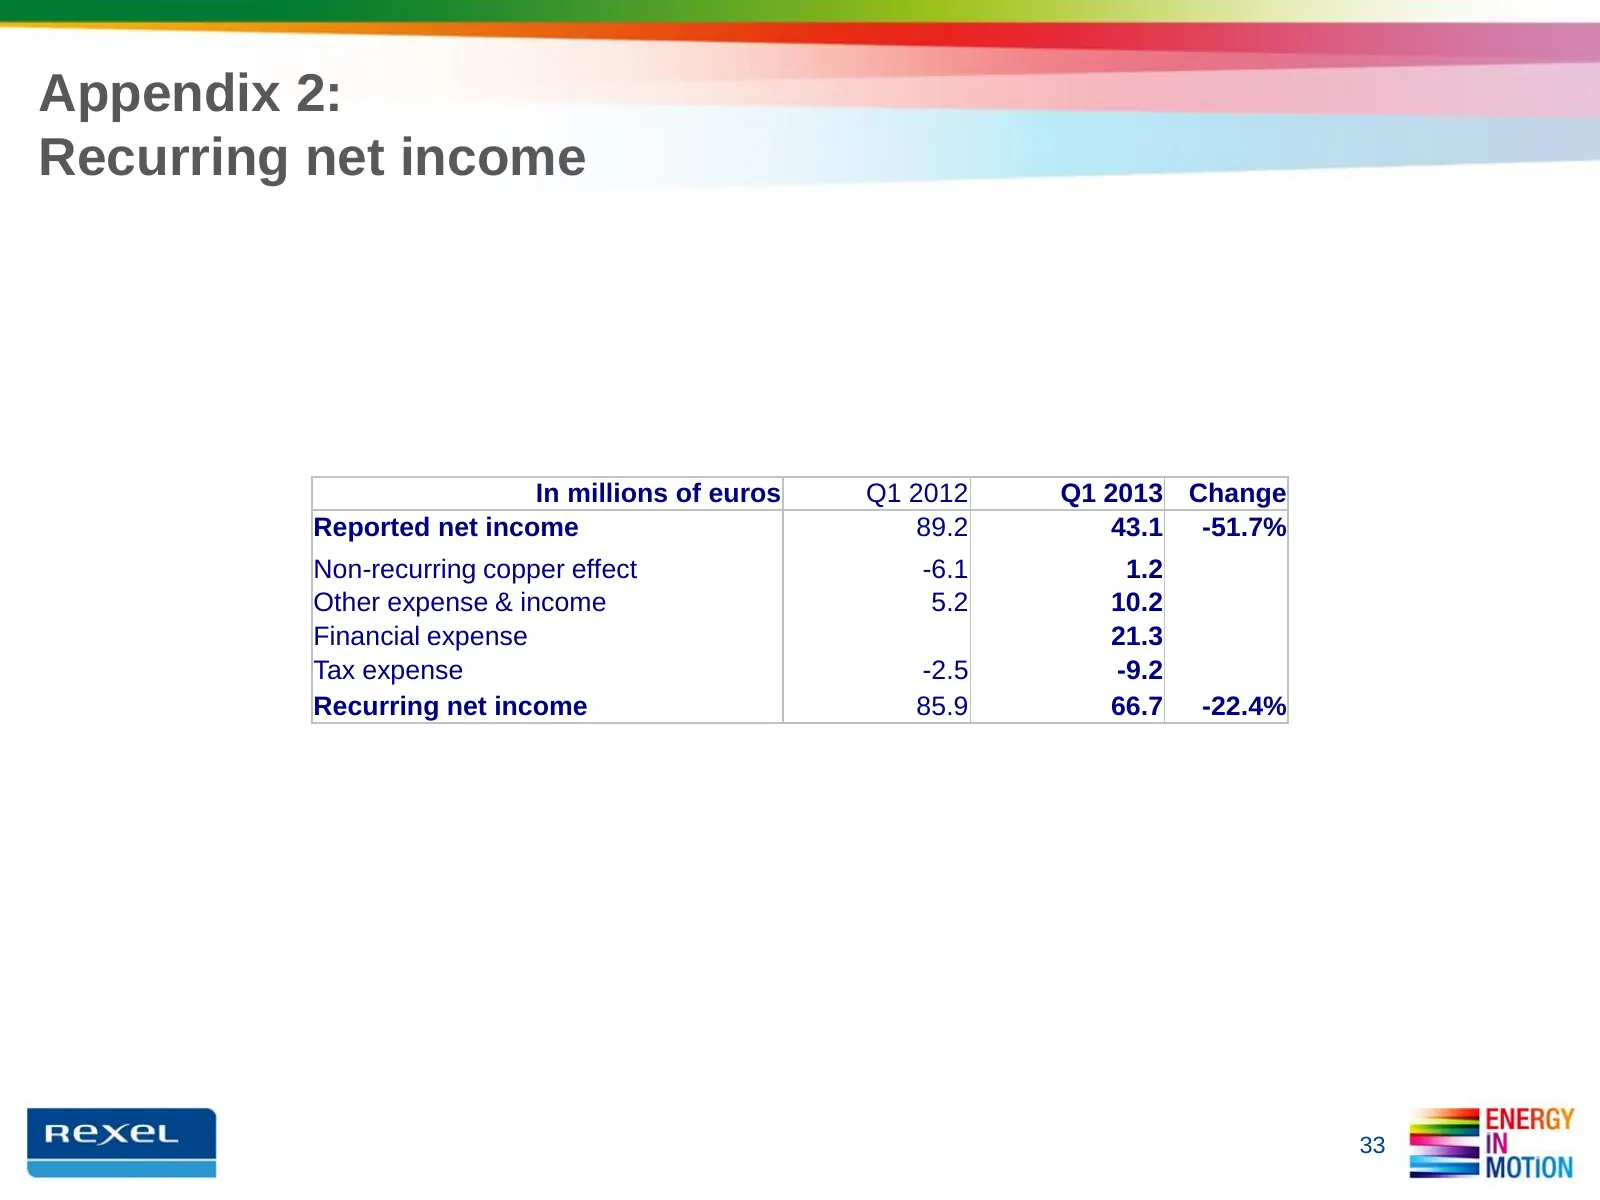
Slide 33: Appendix 2: Recurring net income
Appendix 2: Recurring net income In millions of euros Q1 2012 Q1 2013 Change Reported net income 89.2 43.1 -51.7% Non-recurring copper effect -6.1 1.2 Other expense & income 5.2 10.2 Financial expense 21.3 Tax expense -2.5 -9.2 Recurring net income 85.9 66.7 -22.4% 33
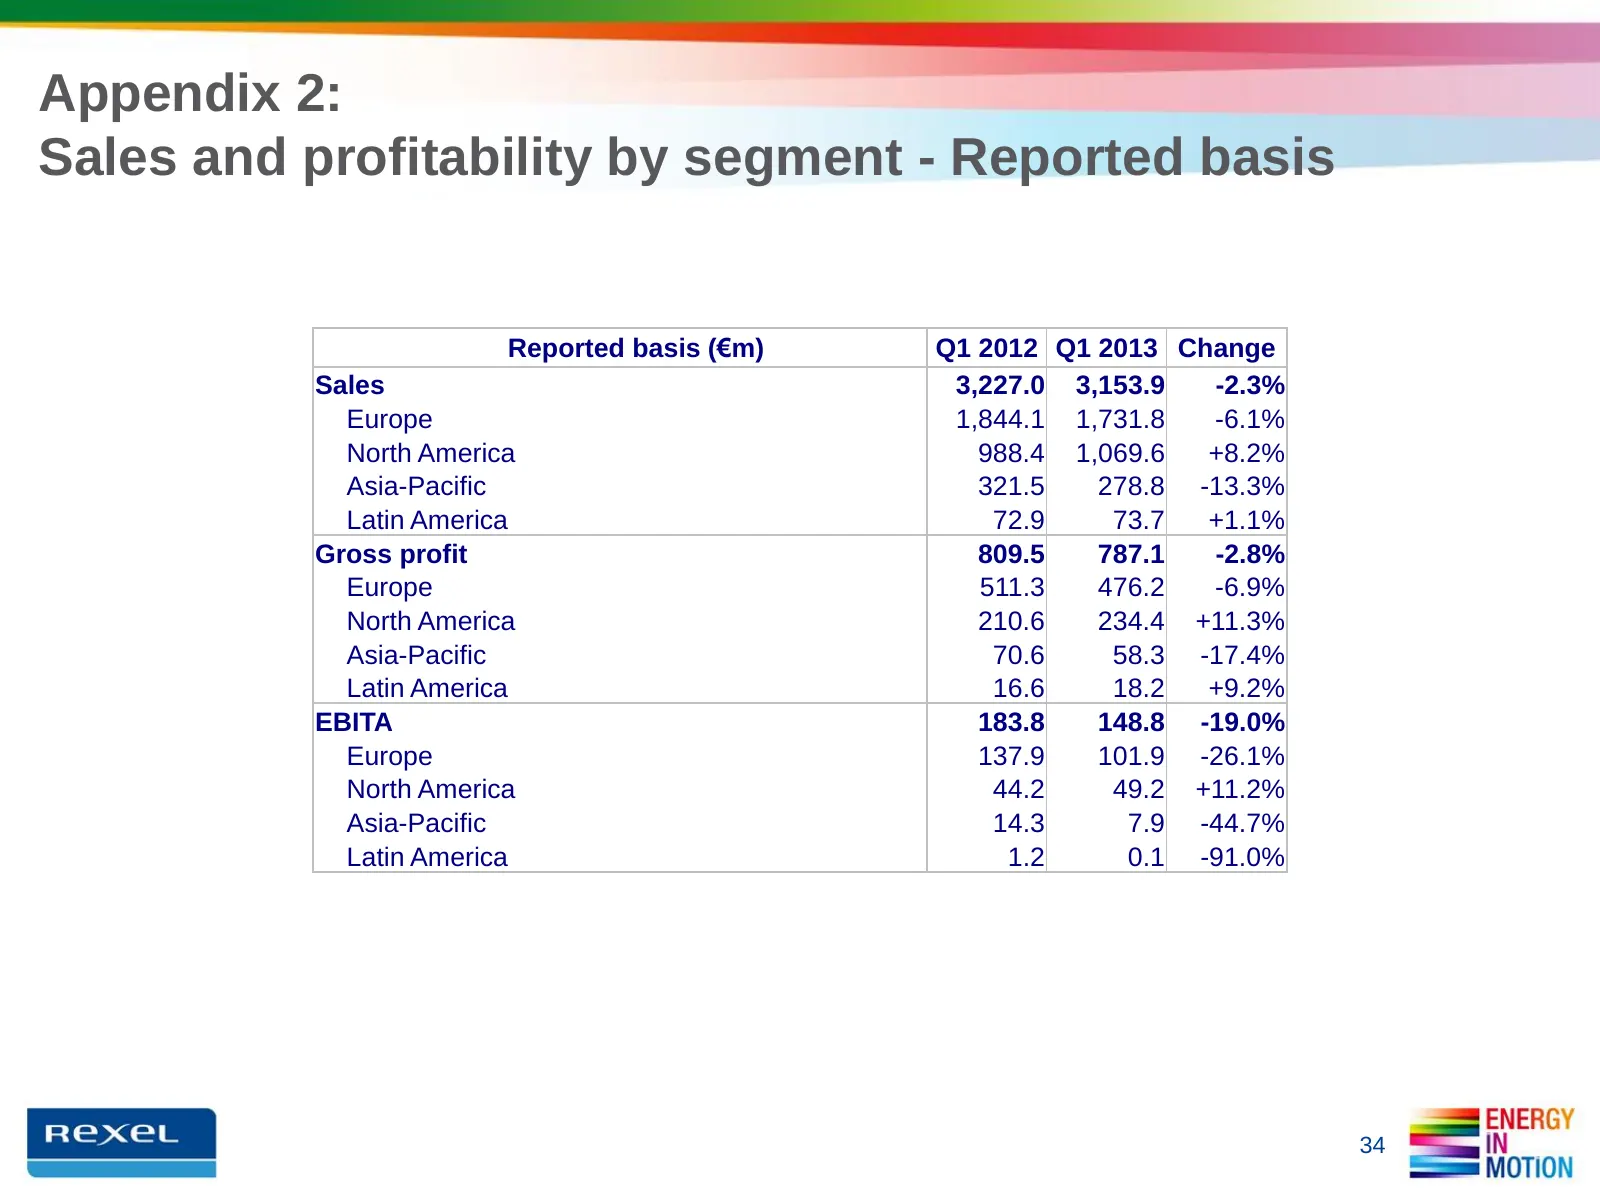
Slide 34: Appendix 2: Sales and profitability by segment - Reported basis
Appendix 2: Sales and profitability by segment - Reported basis Reported basis (€m) Q1 2012 Q1 2013 Change Sales 3,227.0 3,153.9 -2.3% Europe 1,844.1 1,731.8 -6.1% North America 988.4 1,069.6 +8.2% Asia-Pacific 321.5 278.8 -13.3% Latin America 72.9 73.7 +1.1% Gross profit 809.5 787.1 -2.8% Europe 51
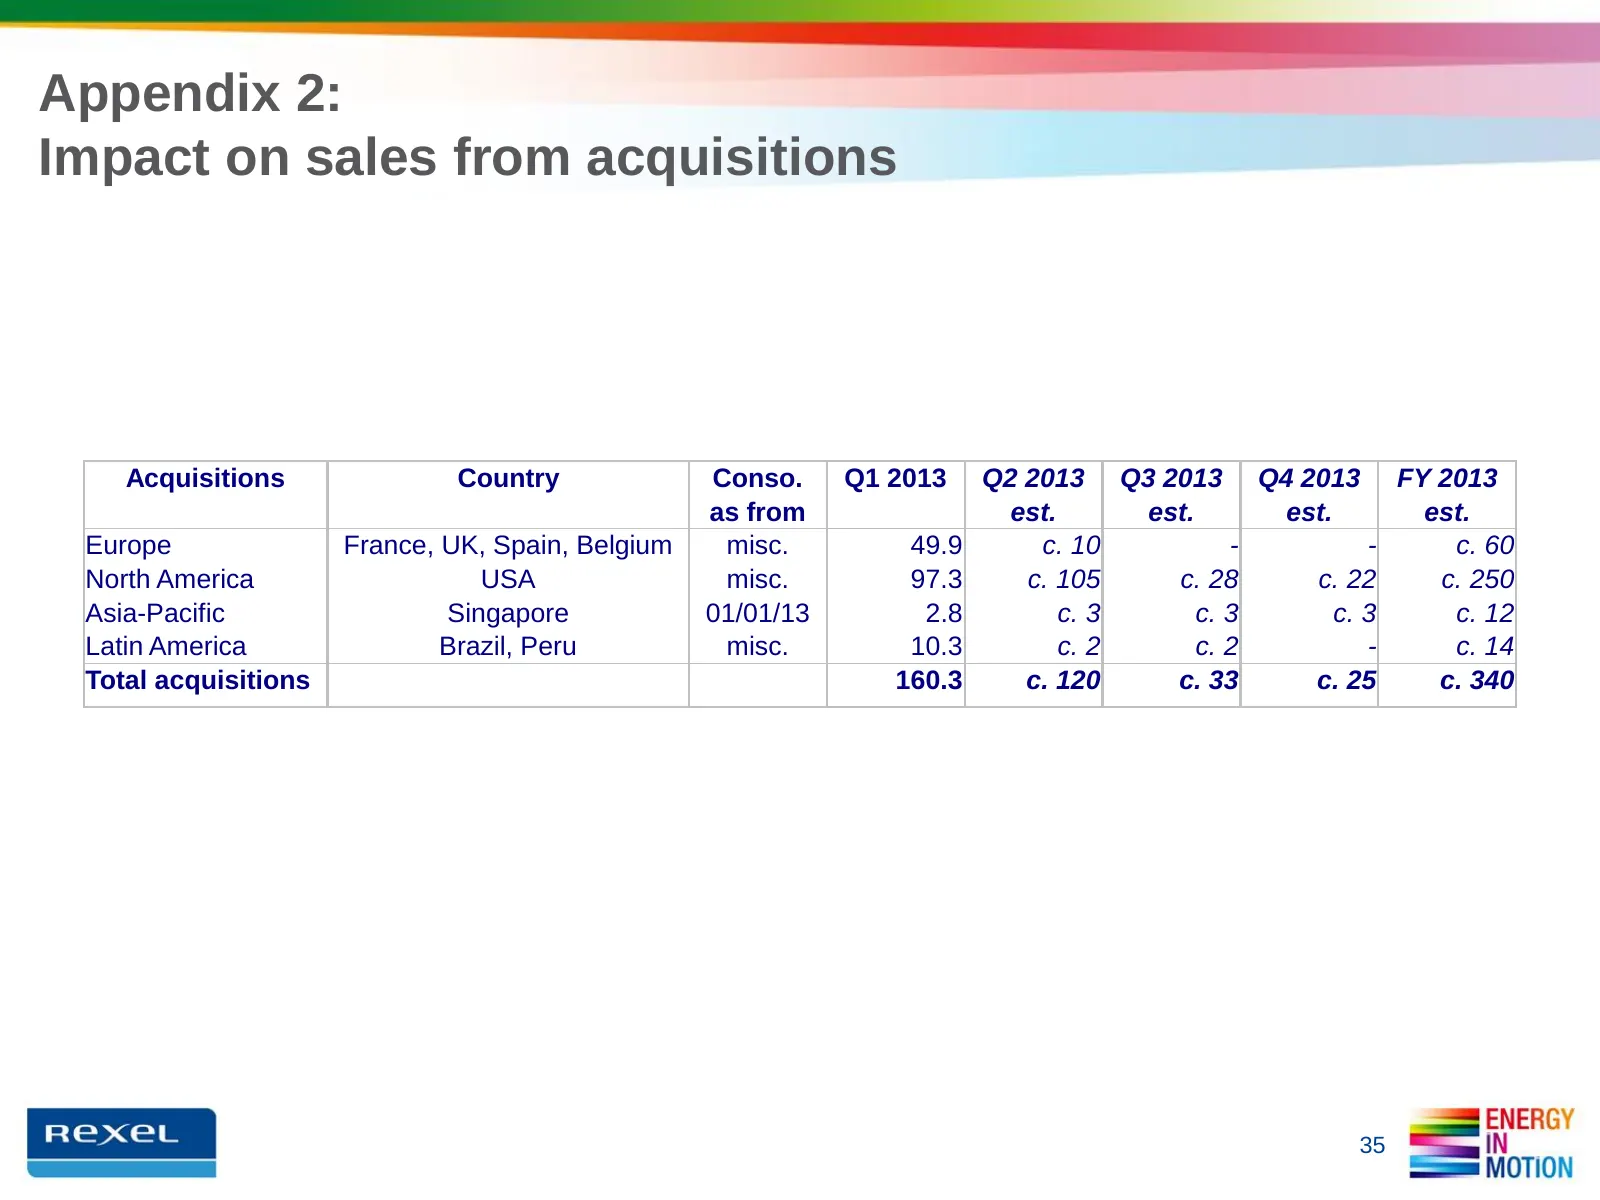
Slide 35: Appendix 2: Impact on sales from acquisitions
Appendix 2: Impact on sales from acquisitions Acquisitions Country Conso. Q1 2013 Q2 2013 Q3 2013 Q4 2013 FY 2013 as from est. est. est. est. Europe France, UK, Spain, Belgium misc. 49.9 c. 10 - - c. 60 North America USA misc. 97.3 c. 105 c. 28 c. 22 c. 250 Asia-Pacific Singapore 01/01/13 2.8 c. 3 c
Slide 36: Appendix 2: Consolidated Balance Sheet
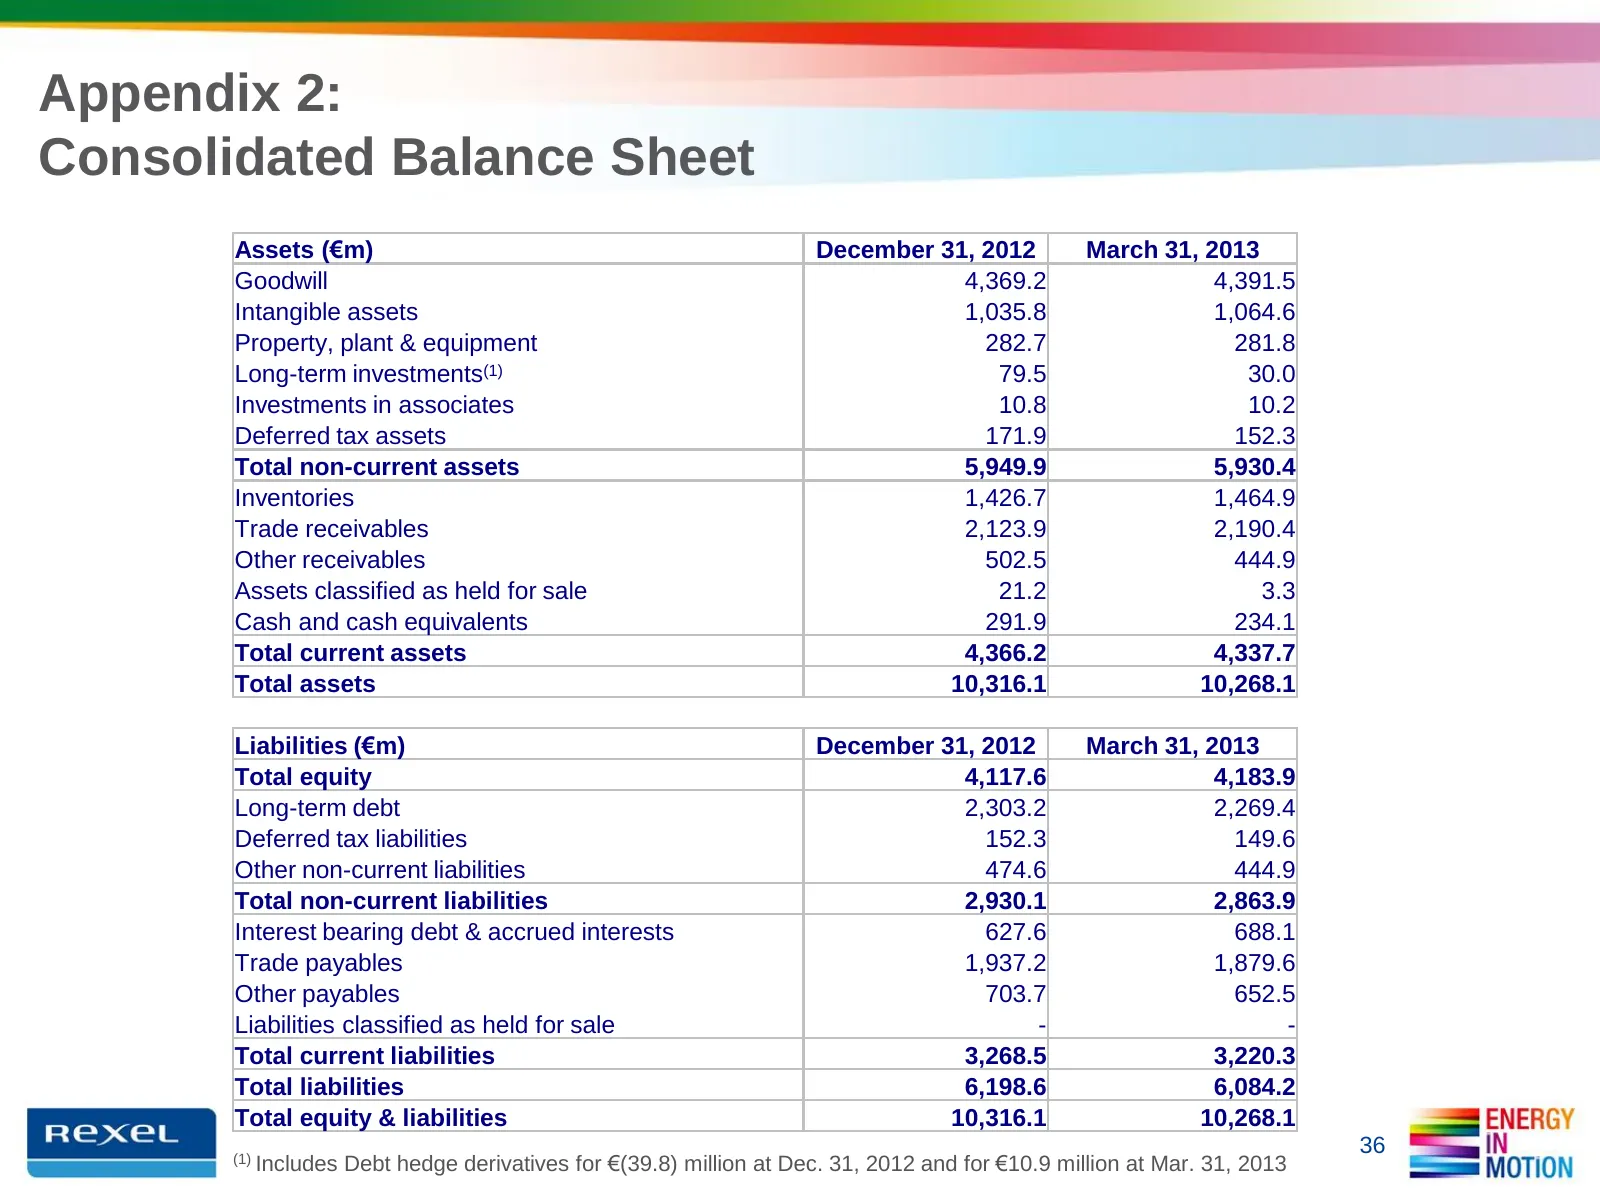
Appendix 2: Consolidated Balance Sheet Assets (€m) December 31, 2012 March 31, 2013 Goodwill 4,369.2 4,391.5 Intangible assets 1,035.8 1,064.6 Property, plant & equipment 282.7 281.8 Long-term investments(1) 79.5 30.0 Investments in associates 10.8 10.2 Deferred tax assets 171.9 152.3 Total non-curr
Slide 37: Appendix 2: Change in Net Debt
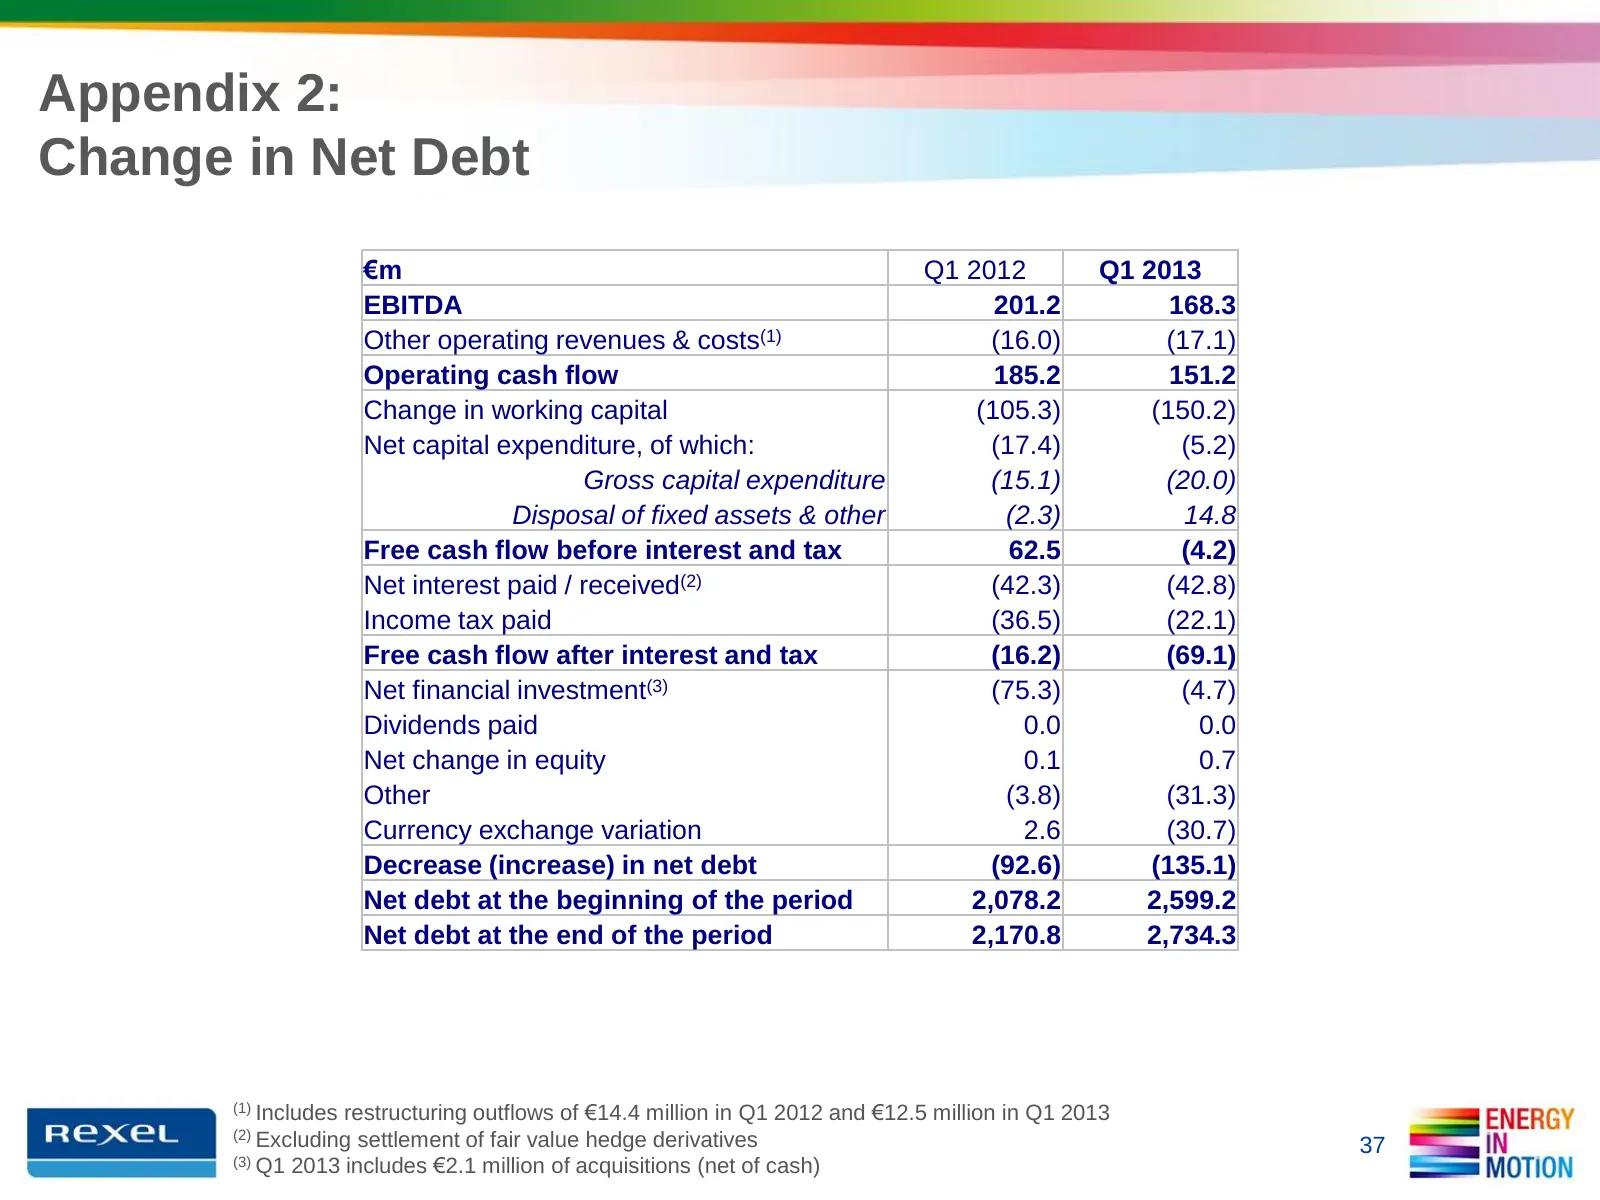
Appendix 2: Change in Net Debt €m Q1 2012 Q1 2013 EBITDA 201.2 168.3 Other operating revenues & costs(1) (16.0) (17.1) Operating cash flow 185.2 151.2 Change in working capital (105.3) (150.2) Net capital expenditure, of which: (17.4) (5.2) Gross capital expenditure (15.1) (20.0) Disposal of fixed a
Slide 38: Appendix 3: Working Capital
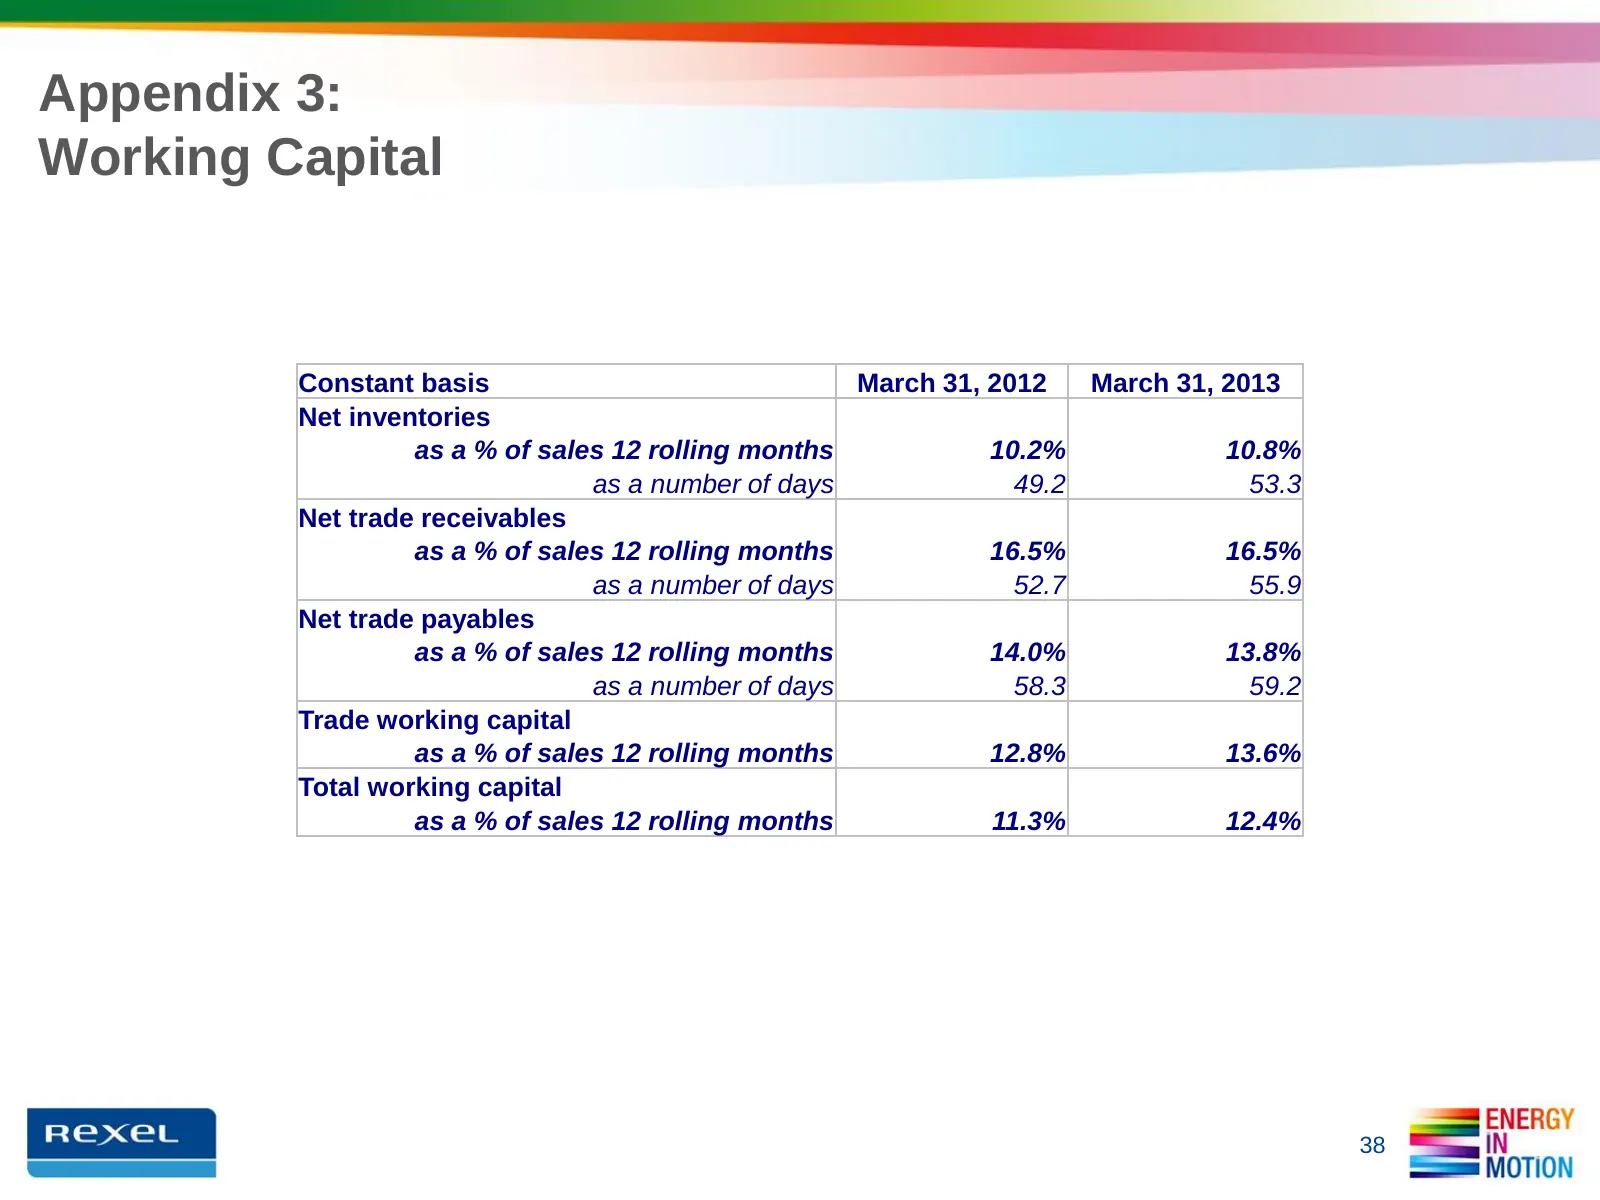
Appendix 3: Working Capital Constant basis March 31, 2012 March 31, 2013 Net inventories as a % of sales 12 rolling months 10.2% 10.8% as a number of days 49.2 53.3 Net trade receivables as a % of sales 12 rolling months 16.5% 16.5% as a number of days 52.7 55.9 Net trade payables as a % of sales 12
Slide 39: Appendix 4: Headcount & Branch Evolution
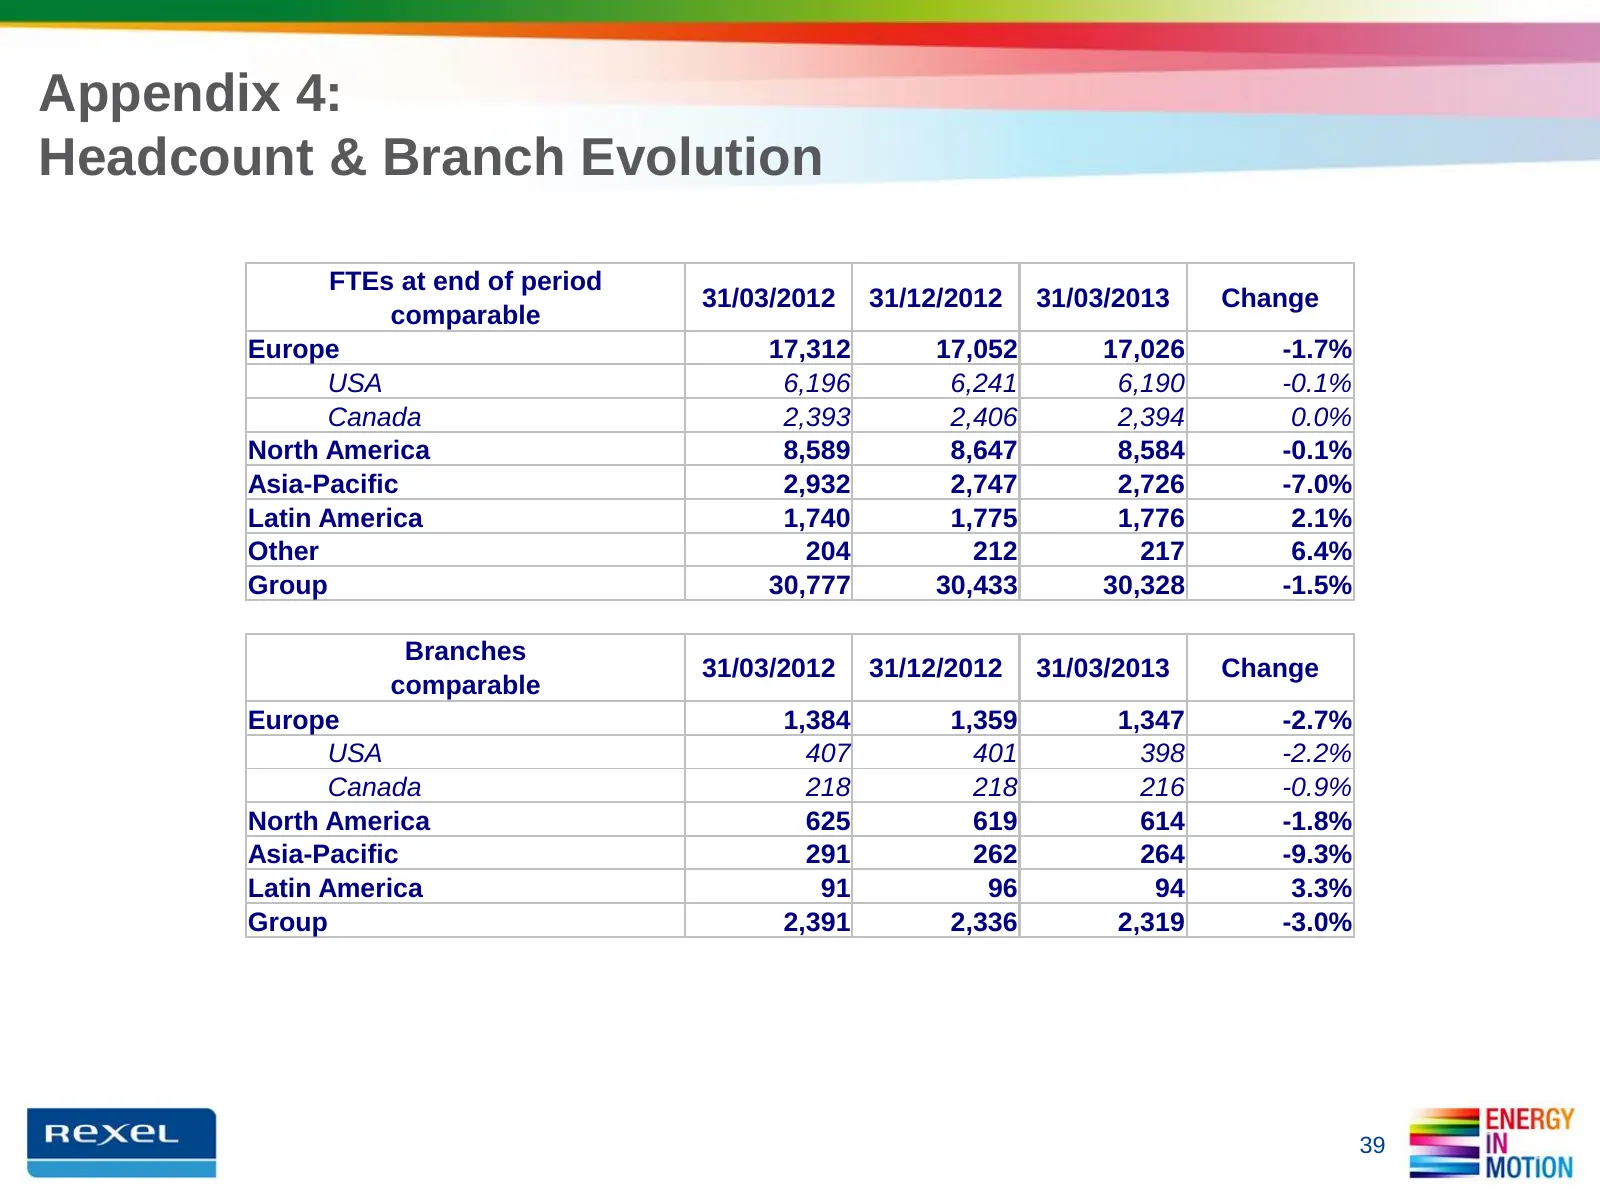
Appendix 4: Headcount & Branch Evolution FTEs at end of period 31/03/2012 31/12/2012 31/03/2013 Change comparable Europe 17,312 17,052 17,026 -1.7% USA 6,196 6,241 6,190 -0.1% Canada 2,393 2,406 2,394 0.0% North America 8,589 8,647 8,584 -0.1% Asia-Pacific 2,932 2,747 2,726 -7.0% Latin America 1,740
Slide 40: Appendix 5: Three-month Copper Price Evolution
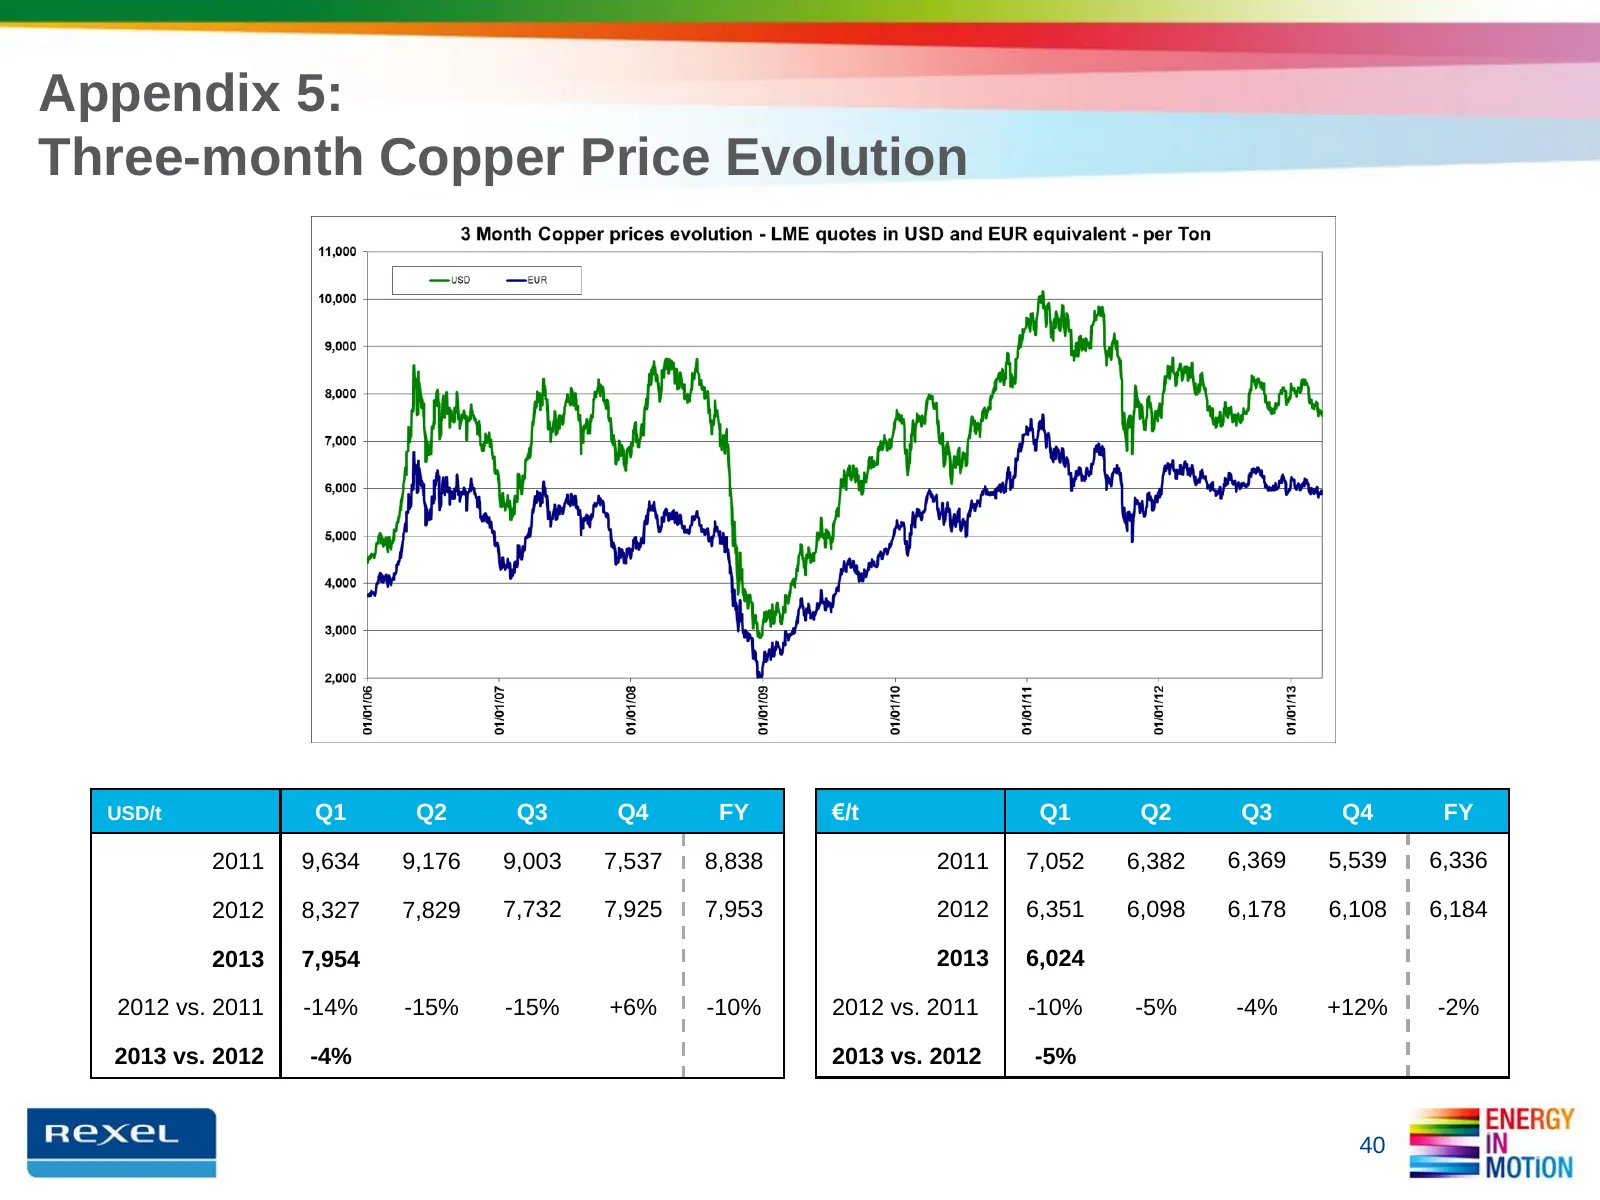
Appendix 5: Three-month Copper Price Evolution USD/t Q1 Q2 Q3 Q4 FY €/t Q1 Q2 Q3 Q4 FY 2011 9,634 9,176 9,003 7,537 8,838 2011 7,052 6,382 6,369 5,539 6,336 2012 8,327 7,829 7,732 7,925 7,953 2012 6,351 6,098 6,178 6,108 6,184 2013 7,954 2013 6,024 2012 vs. 2011 -14% -15% -15% +6% -10% 2012 vs. 2011
Slide 41: Appendix 6: Calendar impact
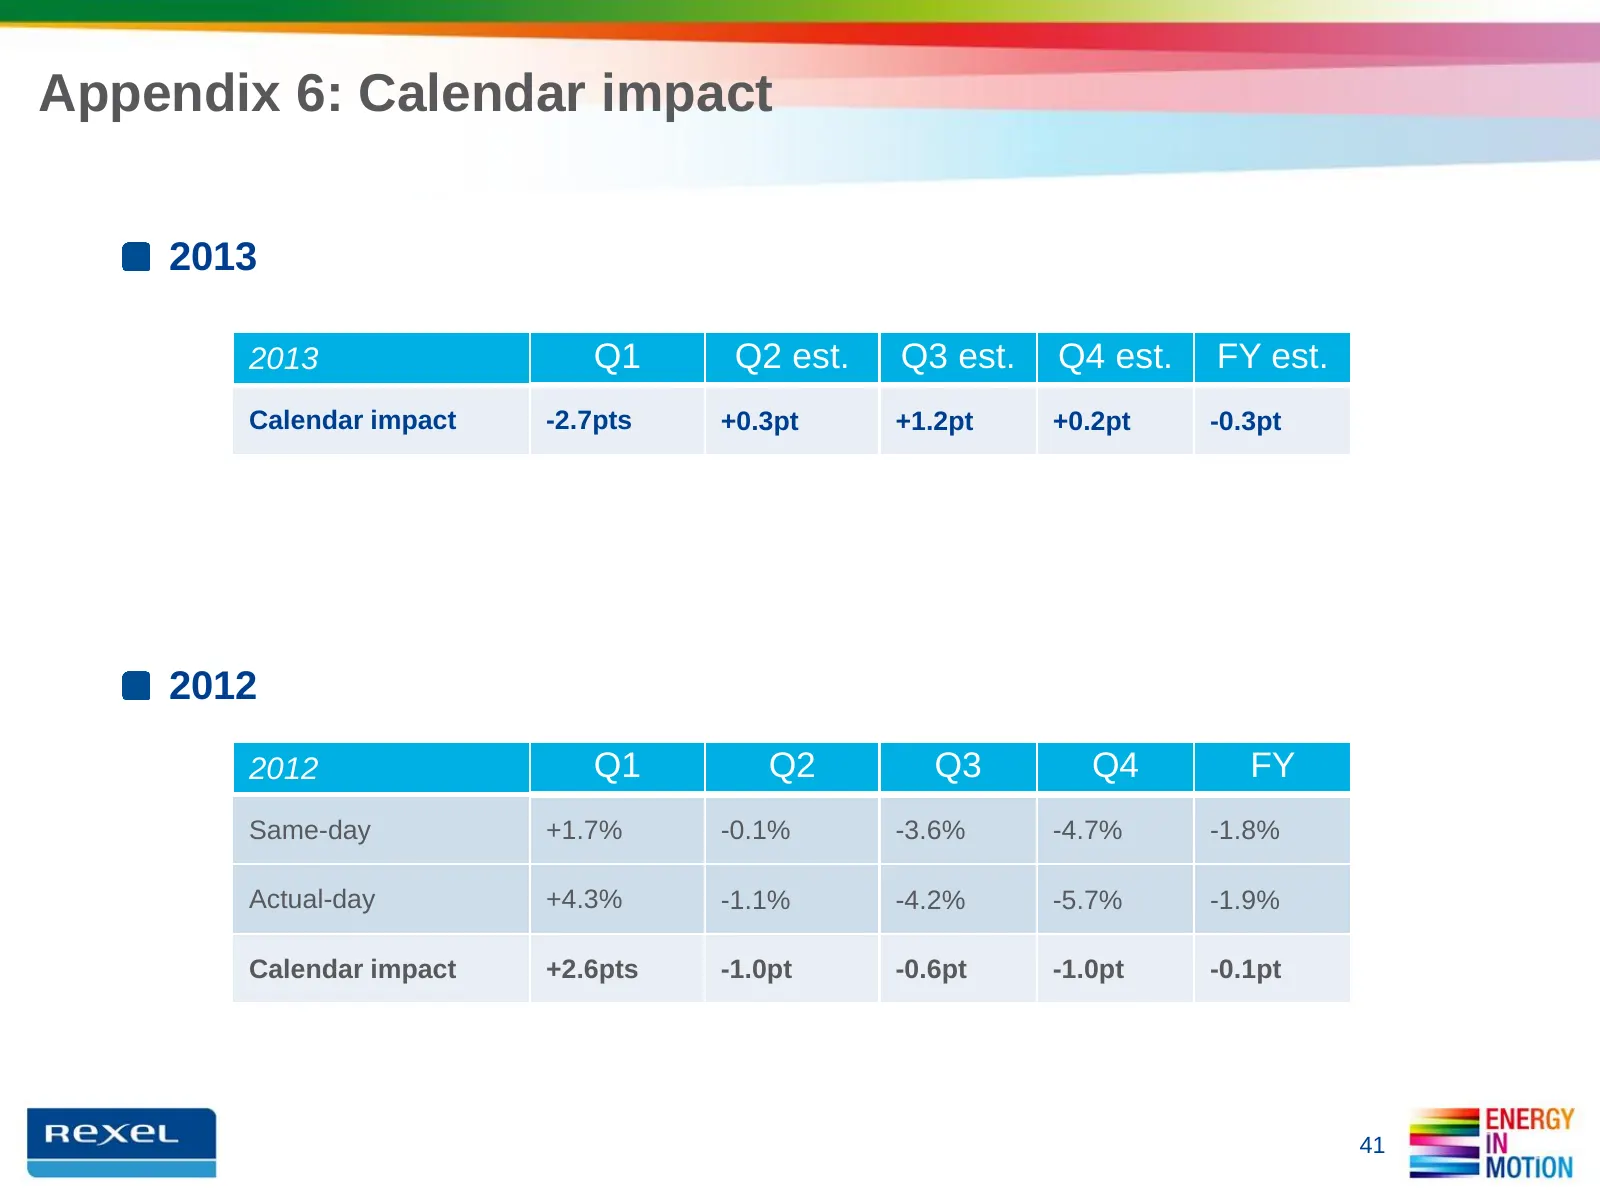
Appendix 6: Calendar impact 2013 2013 Q1 Q2 est. Q3 est. Q4 est. FY est. Calendar impact -2.7pts +0.3pt +1.2pt +0.2pt -0.3pt 2012 2012 Q1 Q2 Q3 Q4 FY Same-day +1.7% -0.1% -3.6% -4.7% -1.8% Actual-day +4.3% -1.1% -4.2% -5.7% -1.9% Calendar impact +2.6pts -1.0pt -0.6pt -1.0pt -0.1pt 41
Slide 42: Disclaimer
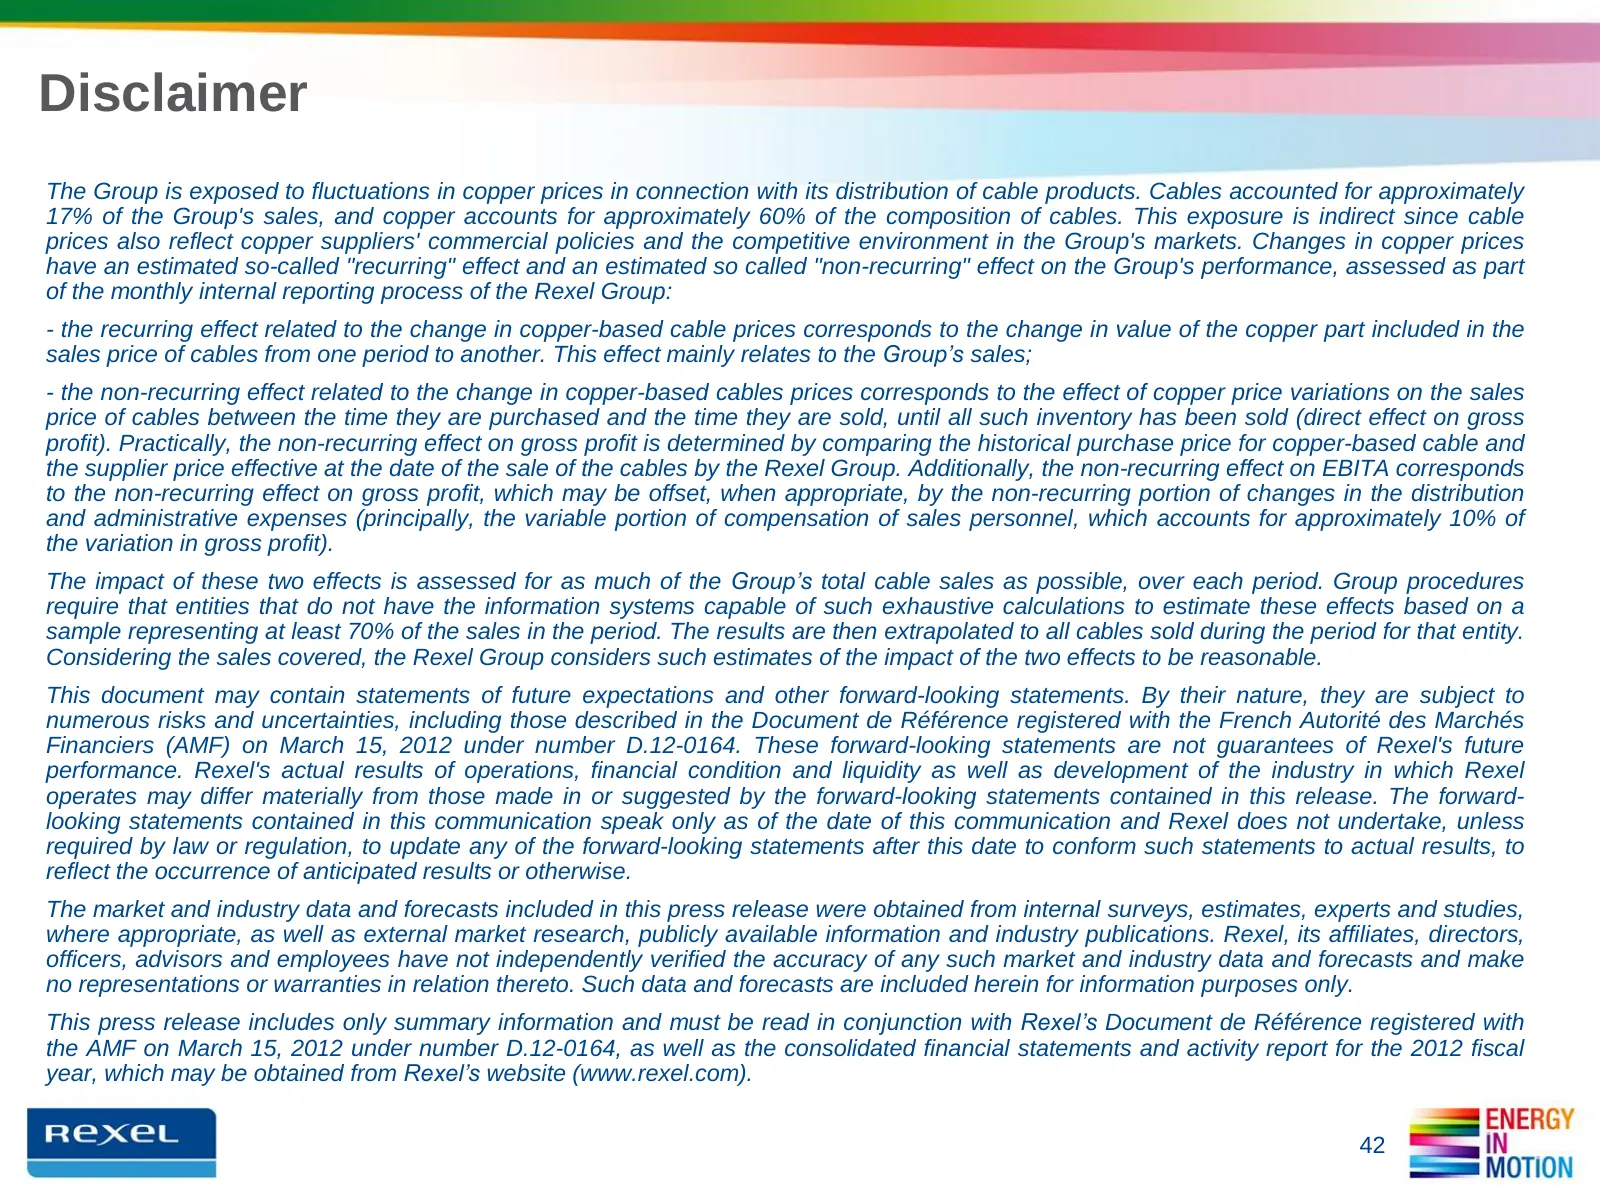
Disclaimer The Group is exposed to fluctuations in copper prices in connection with its distribution of cable products. Cables accounted for approximately 17% of the Group's sales, and copper accounts for approximately 60% of the composition of cables. This exposure is indirect since cable prices al
Source: Internet Archive copy of rexel.com
More decks from Rexel SA
 Q3 2026 Earnings Presentation13 slides · Oct 22, 2026
 Q2 2026 Earnings Presentation24 slides · Jul 27, 2026
 FY 2025 Earnings Presentation31 slides · Feb 11, 2026
 Q3 2025 Earnings Presentation15 slides · Oct 15, 2025
 Q2 2025 Earnings Presentation20 slides · Jul 28, 2025
 Q1 2025 Earnings Presentation16 slides · Apr 29, 2025