K+s AG · XETR:SDF
K+s — K+S Aktiengesellschaft — Investor Day (December 2010)
32 slides from K+s's investor day presentation, Dec 8, 2010
Slide 1: Capital Markets Day: Salt Perspectives
Capital Markets Day Salt Perspectives Karl Mielke CEO K+S North America Salt Holdings LLC Berlin, 8 December 2010 Experience growth.
Slide 2: Content
Salt Content A. Salt Market Environment B. The K+S Salt Business C. K+S’ Position in Competitive Environment D. Growth Perspectives & Strategy December 2010 K+S Group 1
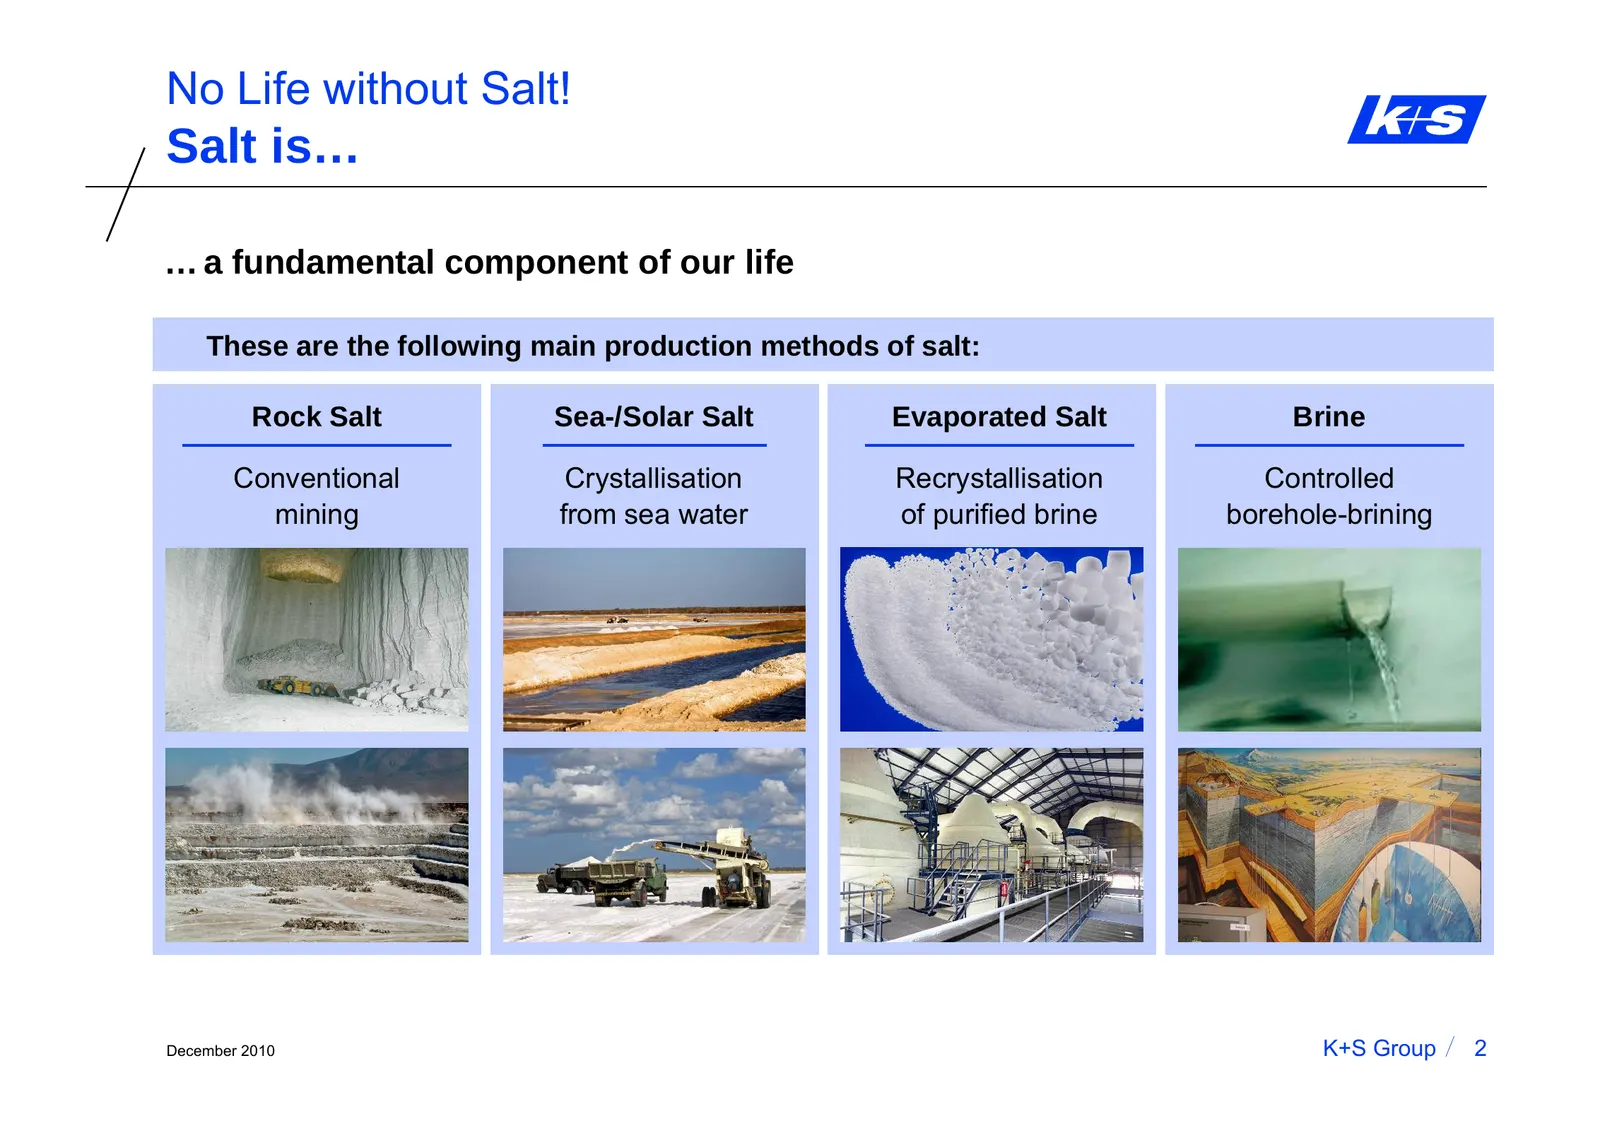
Slide 3: No Life without Salt!
No Life without Salt! Salt is… … a fundamental component of our life These are the following main production methods of salt: Rock Salt Sea-/Solar Salt Evaporated Salt Brine Conventional Crystallisation Recrystallisation Controlled mining from sea water of purified brine borehole-brining December 20
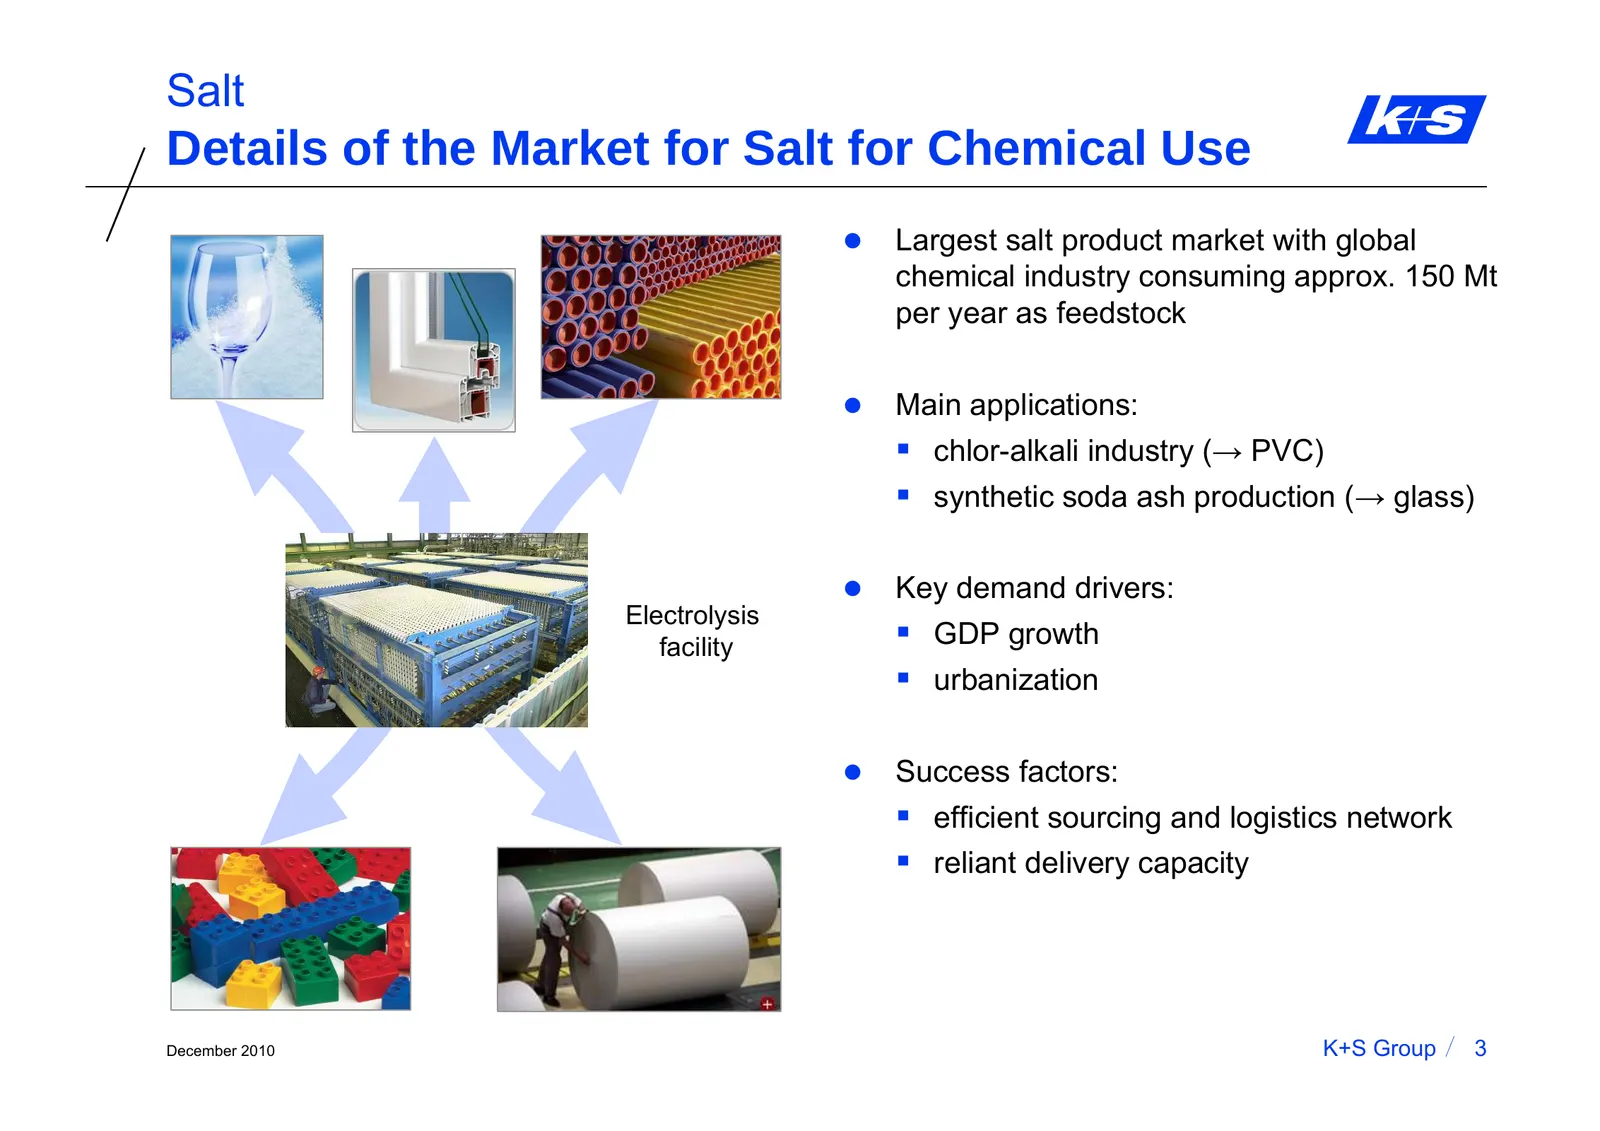
Slide 4: Details of the Market for Salt for Chemical Use
Salt Details of the Market for Salt for Chemical Use z Largest salt product market with global chemical industry consuming approx. 150 Mt per year as feedstock z Main applications: chlor-alkali industry (→ PVC) synthetic soda ash production (→ glass) z Key demand drivers: Electrolysis facility
Slide 5: Details of the De-icing Salt Market
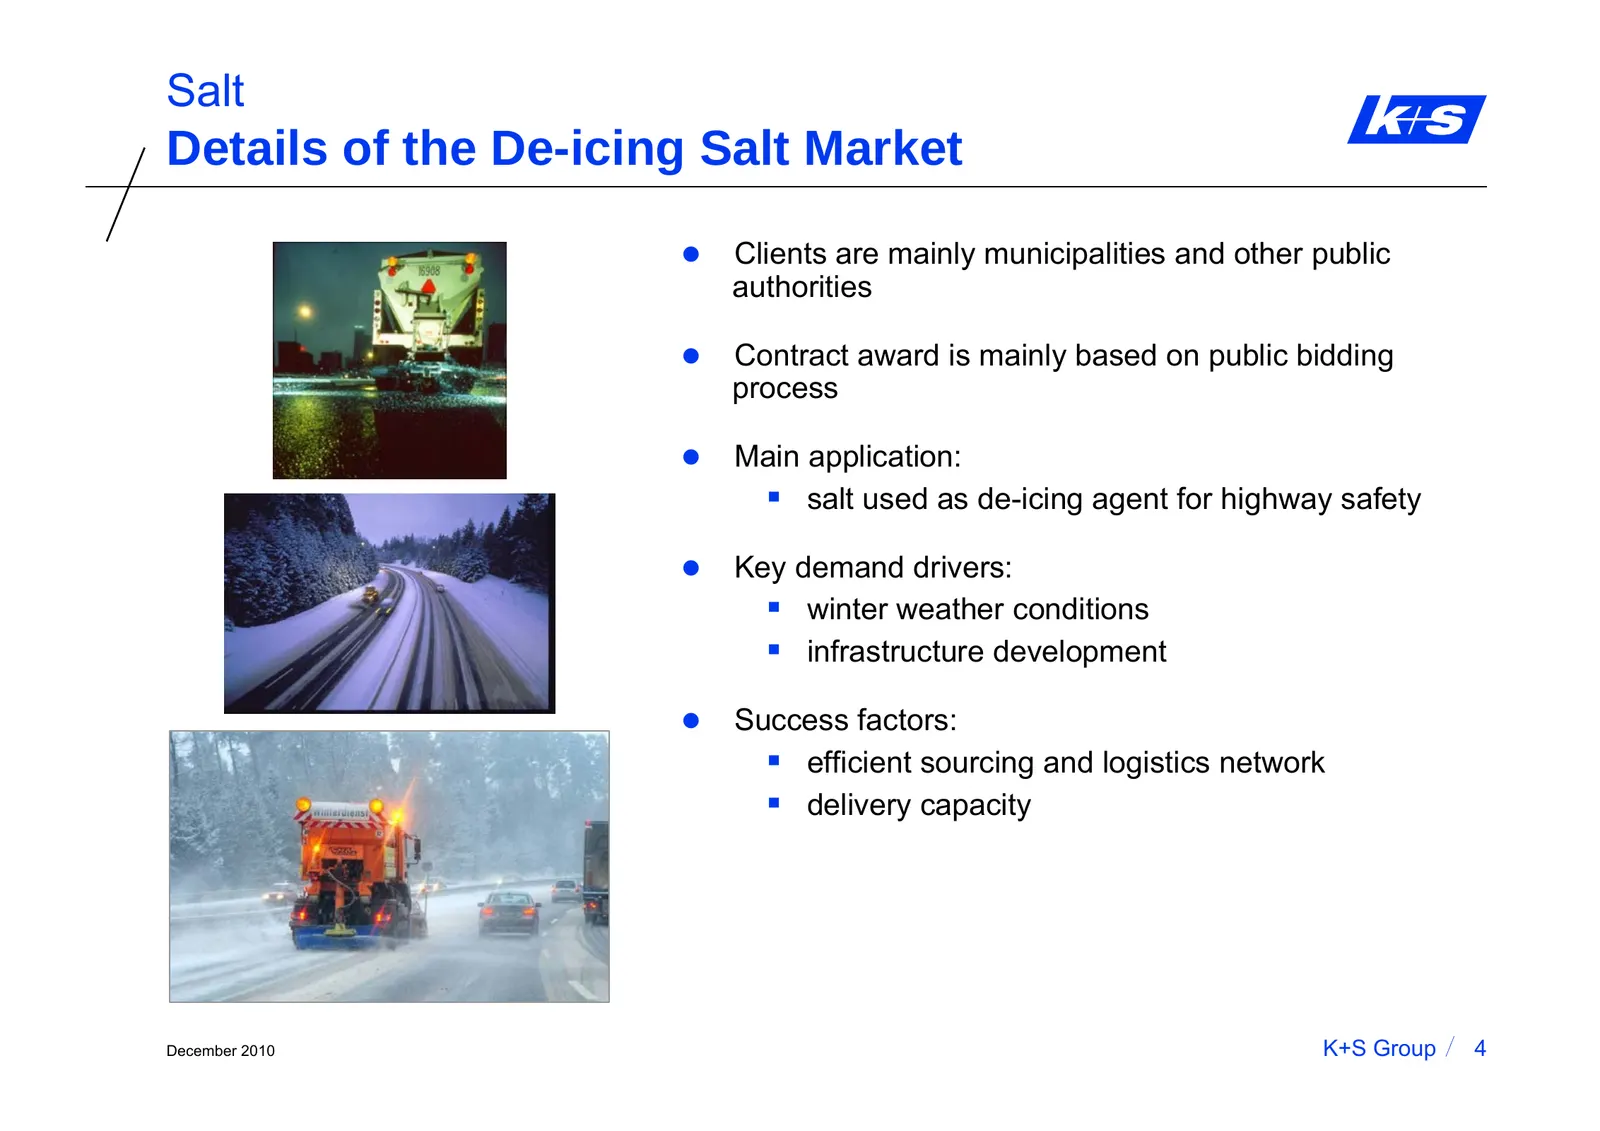
Salt Details of the De-icing Salt Market z Clients are mainly municipalities and other public authorities z Contract award is mainly based on public bidding process z Main application: salt used as de-icing agent for highway safety z Key demand drivers: winter weather conditions infrastructure
Slide 6: Details of De-icing Salt Bidding Processes
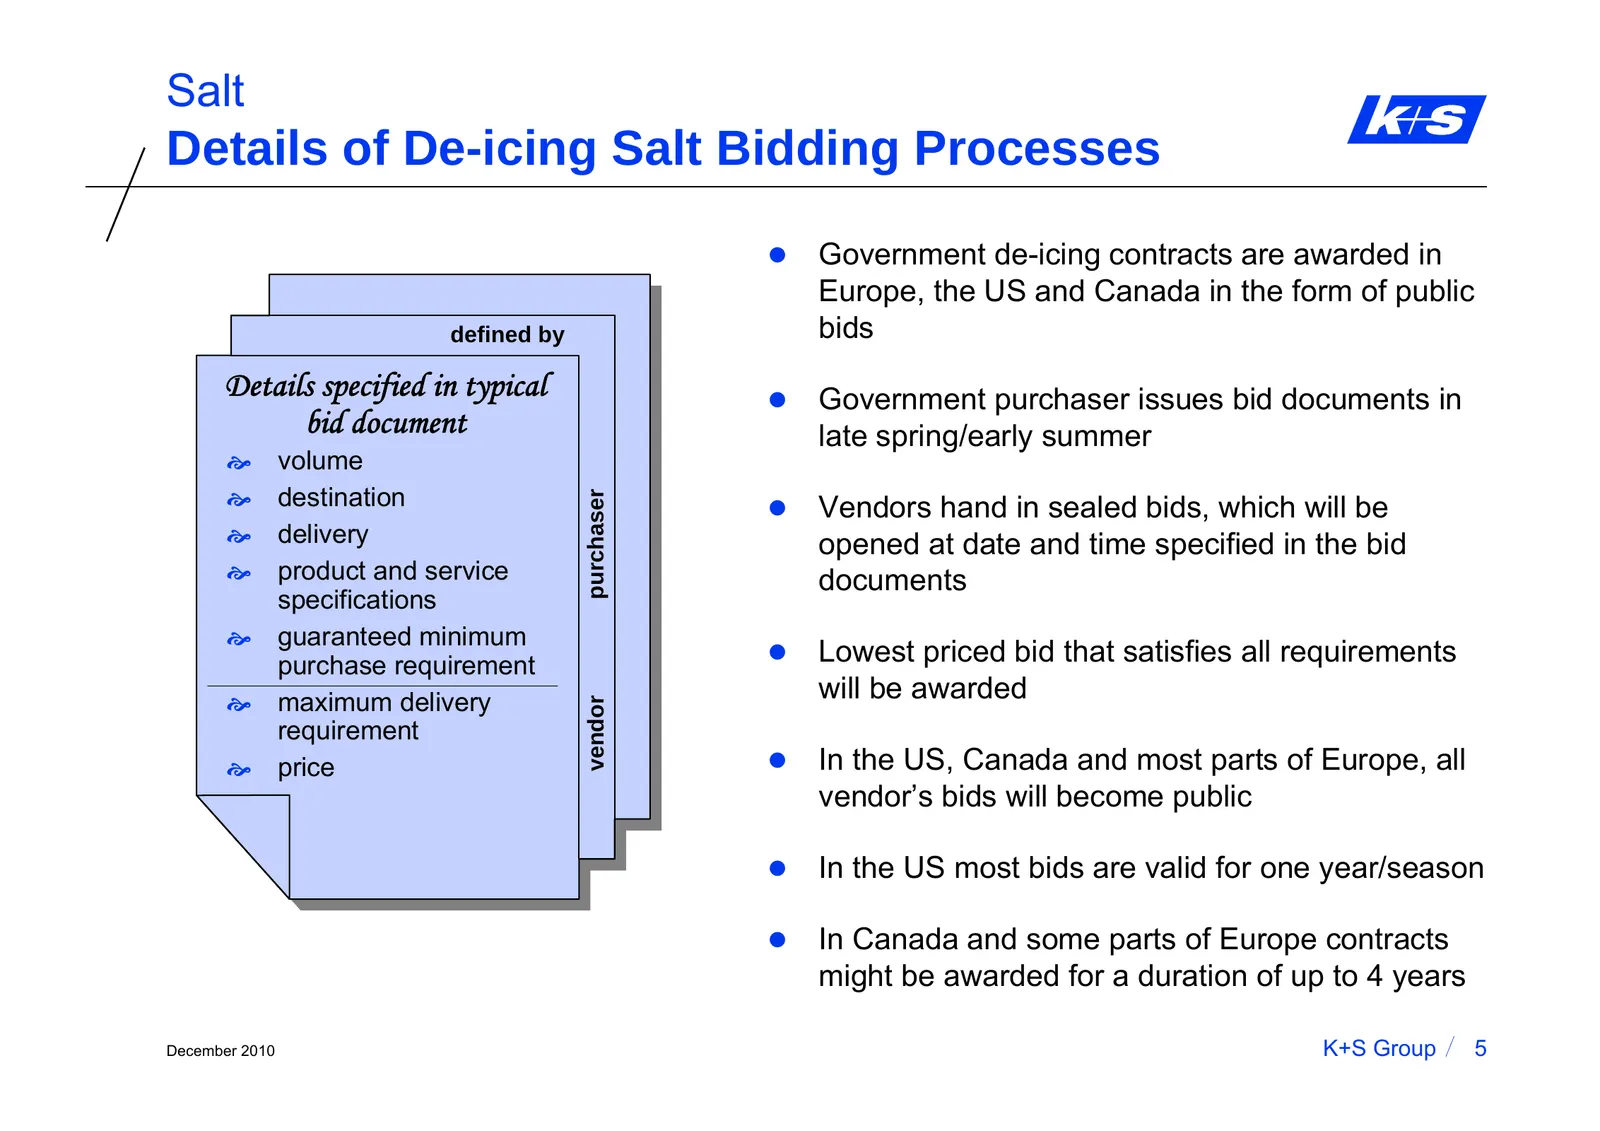
Salt Details of De-icing Salt Bidding Processes z Government de-icing contracts are awarded in Europe, the US and Canada in the form of public defined by bids Details specified in typical z Government purchaser issues bid documents in bid document late spring/early summer [ volume [ destination purc
Slide 7: Details of the Food Grade Salt Market
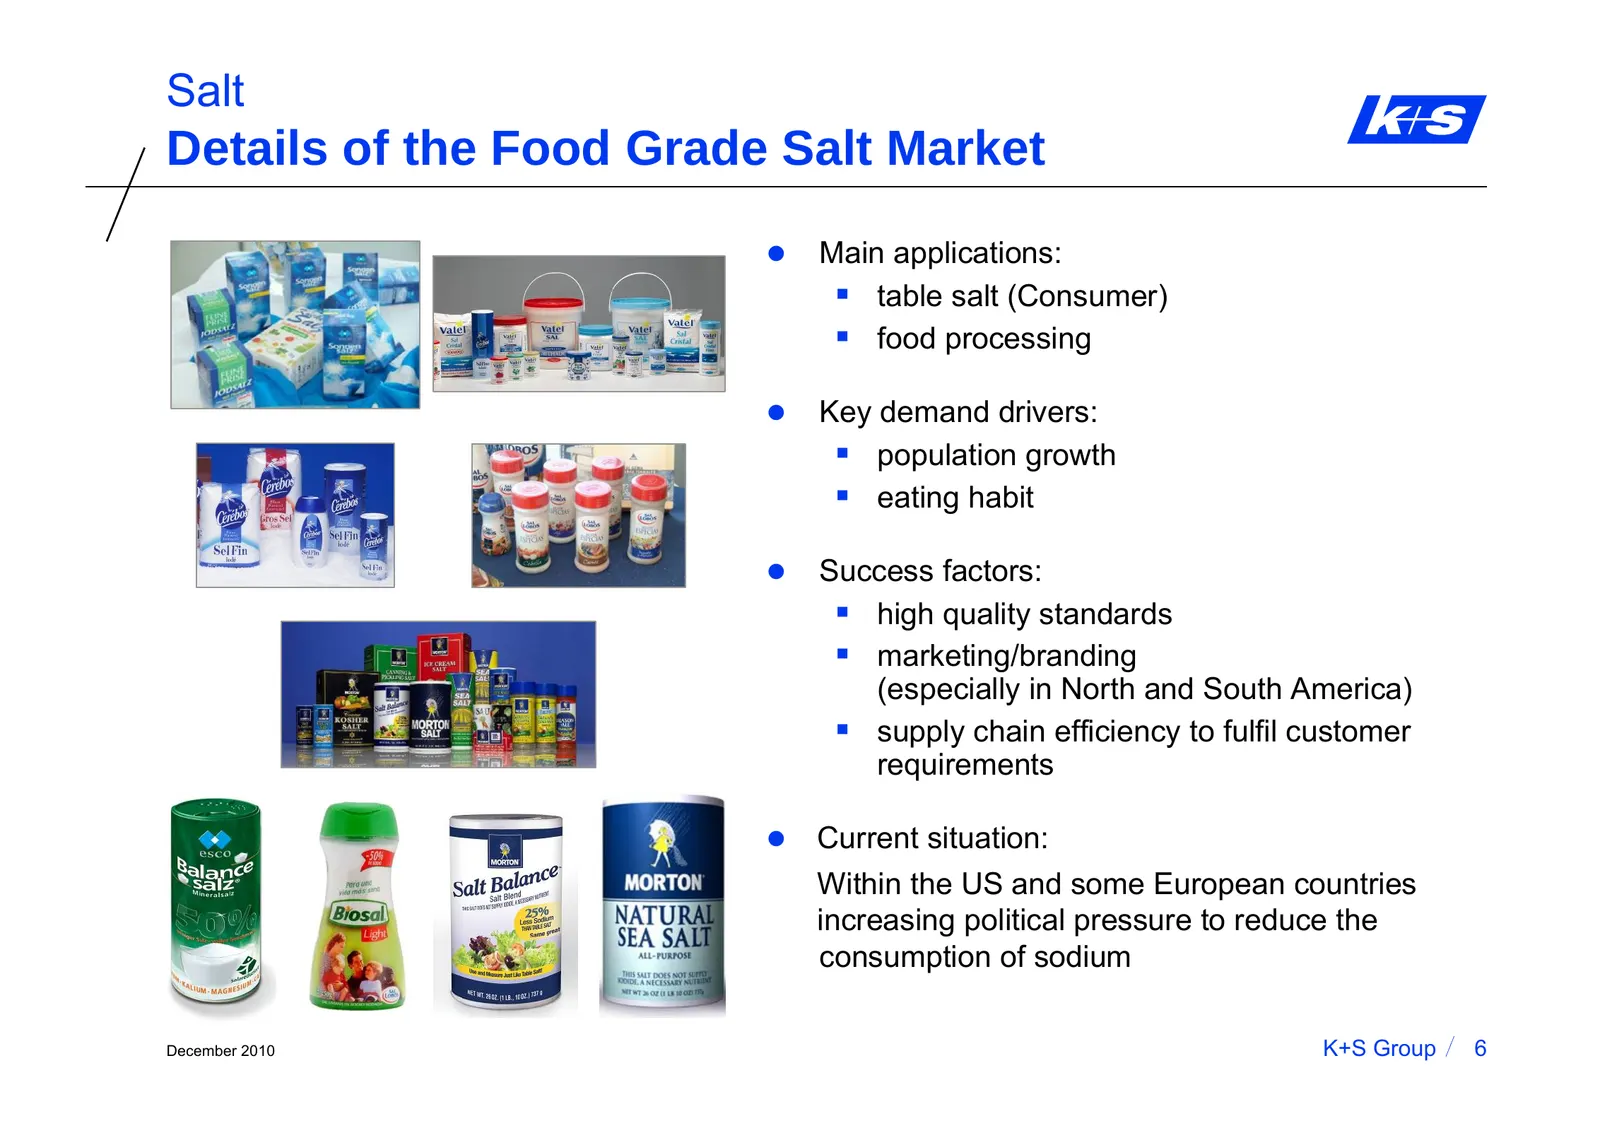
Salt Details of the Food Grade Salt Market z Main applications: table salt (Consumer) food processing z Key demand drivers: population growth eating habit z Success factors: high quality standards marketing/branding (especially in North and South America) supply chain efficiency to ful
Slide 8: Industrial/Other Applications of Salt
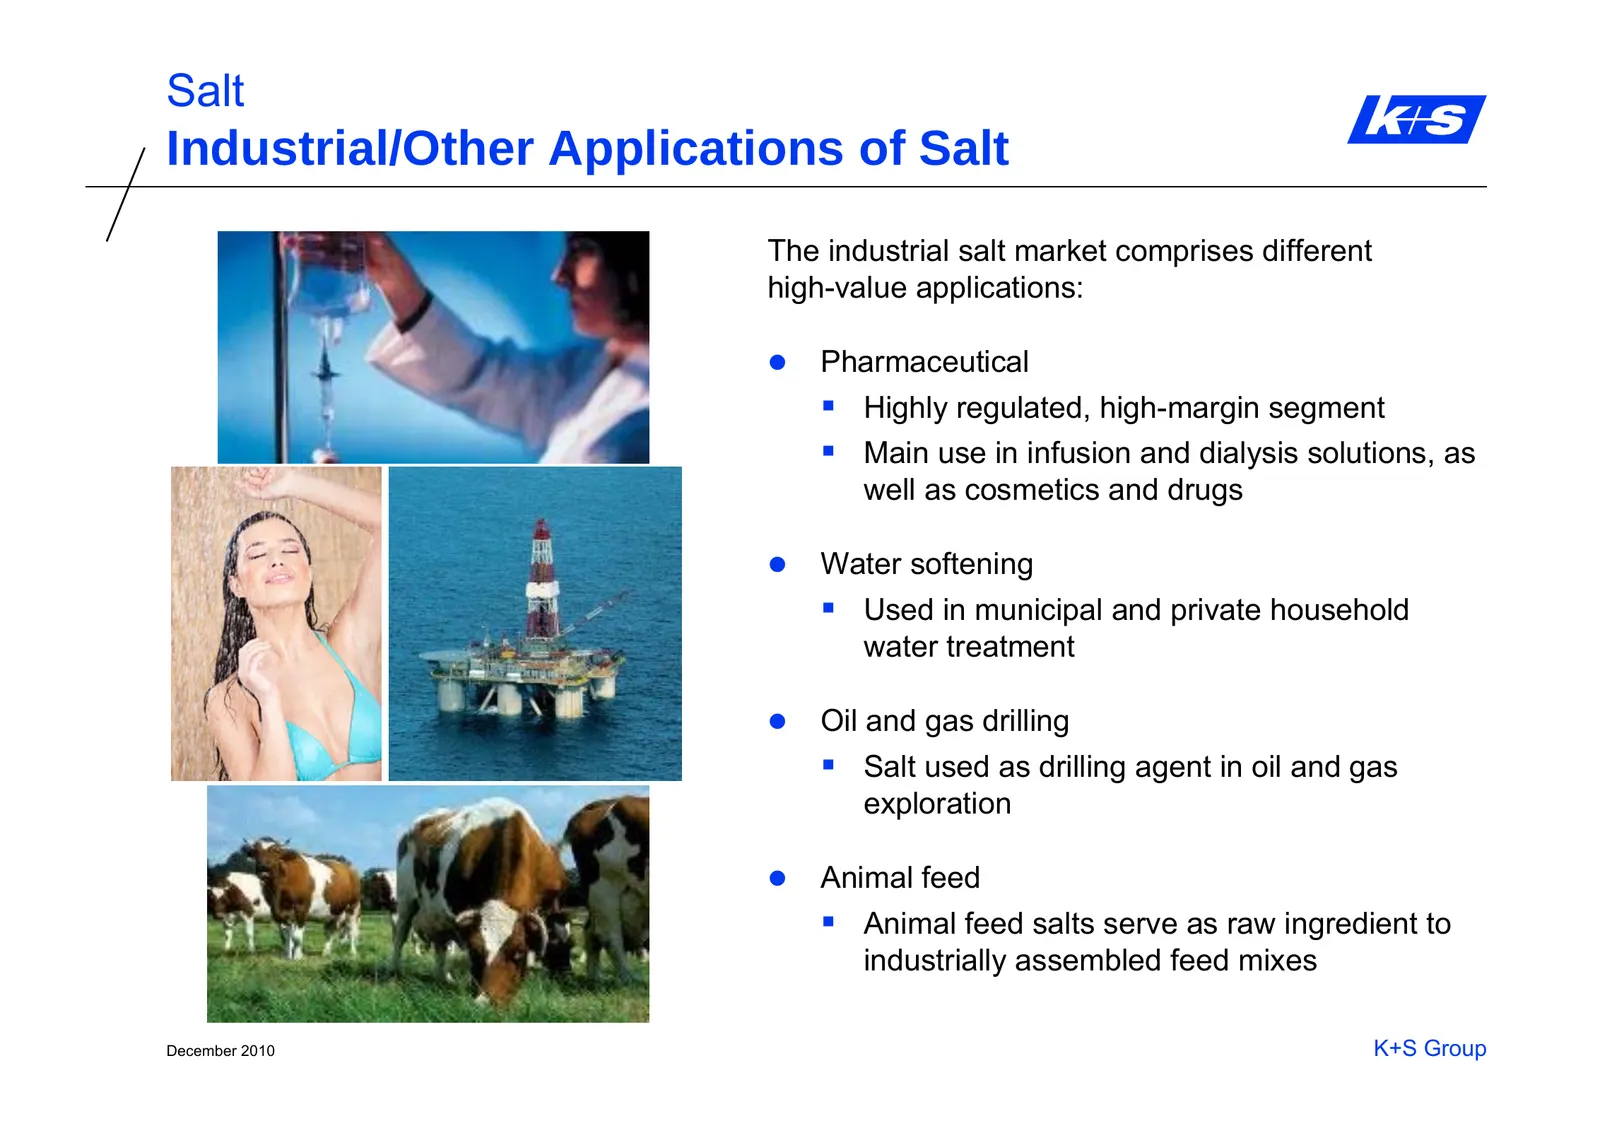
Salt Industrial/Other Applications of Salt The industrial salt market comprises different high-value applications: z Pharmaceutical Highly regulated, high-margin segment Main use in infusion and dialysis solutions, as well as cosmetics and drugs z Water softening Used in municipal and private
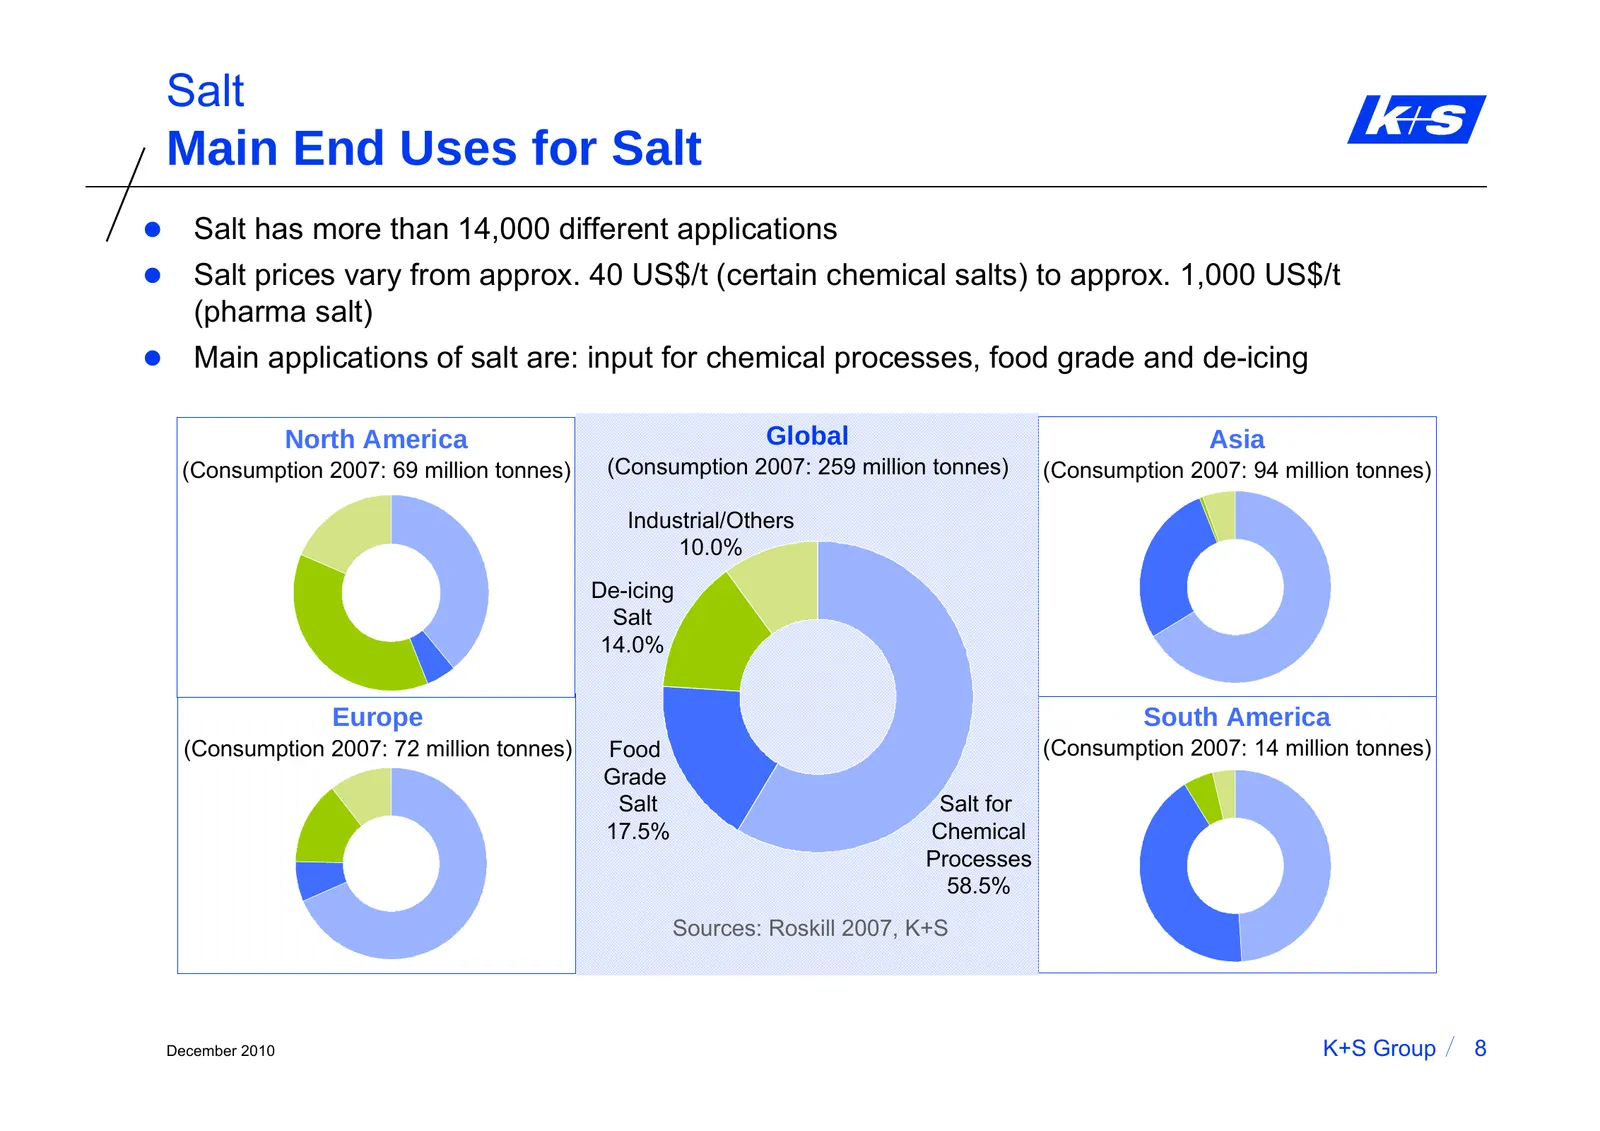
Slide 9: Main End Uses for Salt
Salt Main End Uses for Salt z Salt has more than 14,000 different applications z Salt prices vary from approx. 40 US$/t (certain chemical salts) to approx. 1,000 US$/t (pharma salt) z Main applications of salt are: input for chemical processes, food grade and de-icing North America Global Asia (Cons
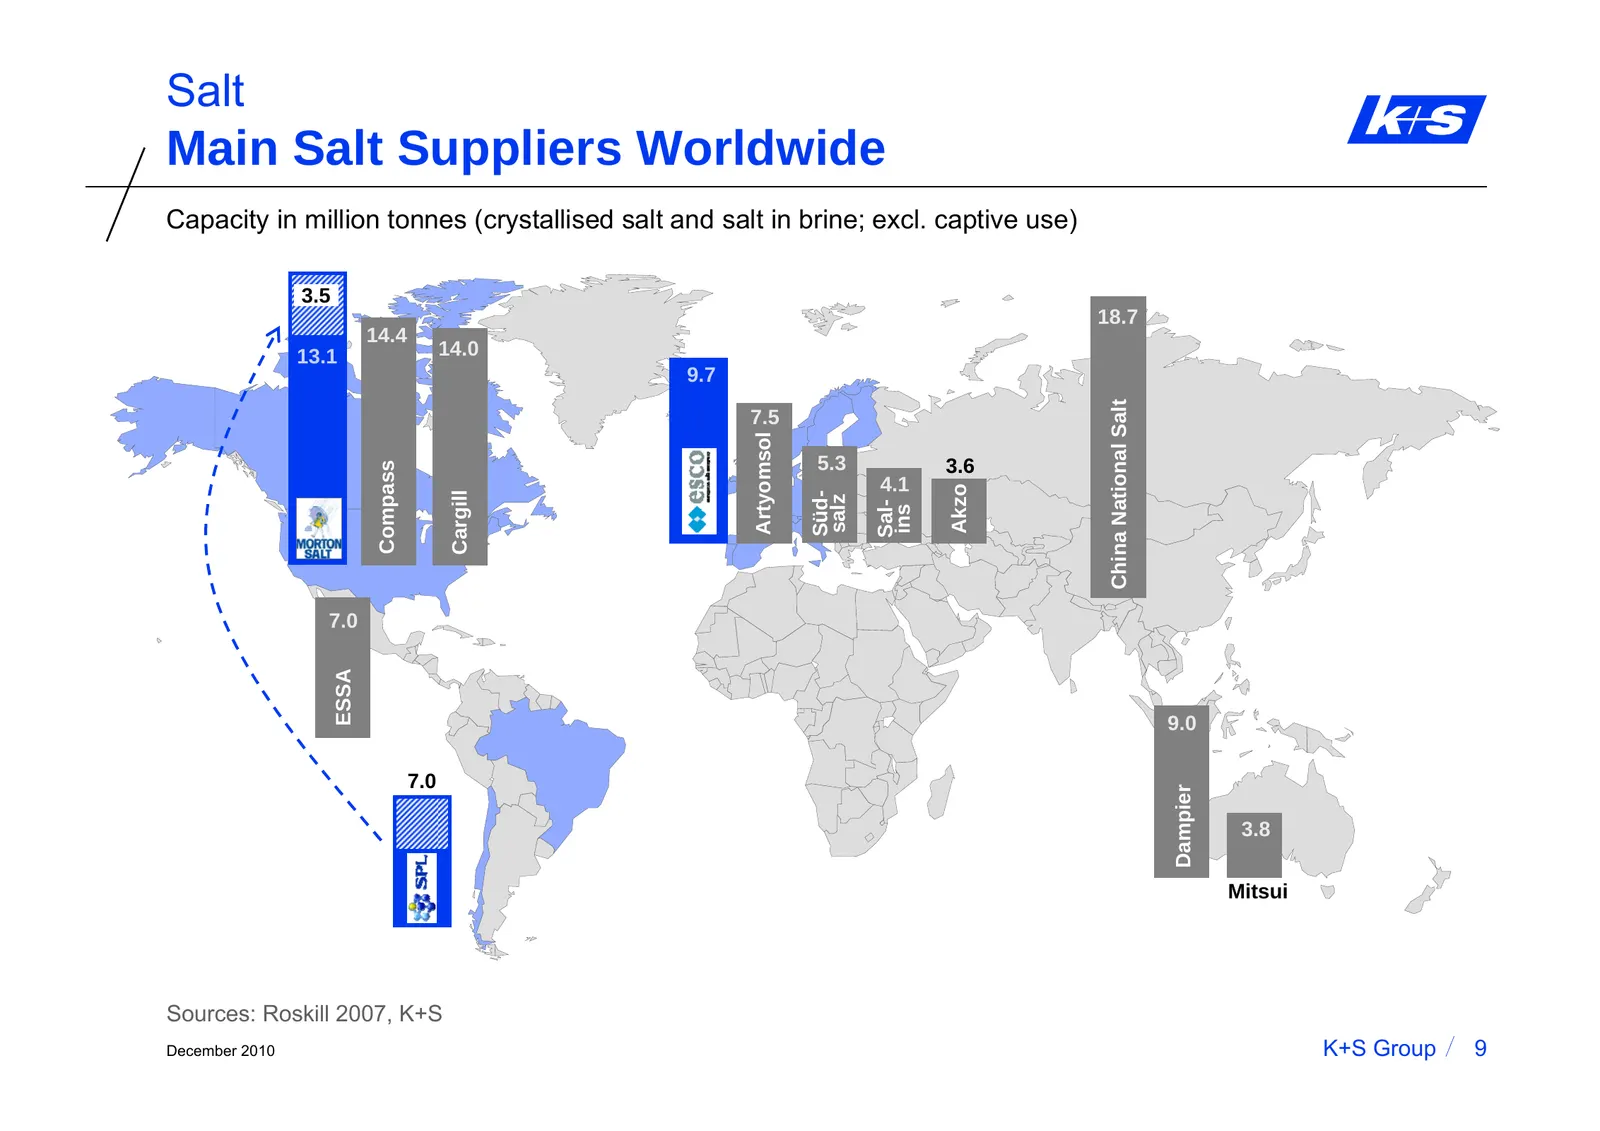
Slide 10: Main Salt Suppliers Worldwide
Salt Main Salt Suppliers Worldwide Capacity in million tonnes (crystallised salt and salt in brine; excl. captive use) 3.5 18.7 14.4 13.1 14.0 9.7 China National Salt 7.5 Artyomsol 5.3 3.6 Compass 4.1 Akzo Cargill Süd- salz Sal- ins 7.0 ESSA 9.0 7.0 Dampier 3.8 Mitsui Sources: Roskill 2007, K+S Dece
Slide 11: Content
Salt Content A. Salt Market Environment B. The K+S Salt Business C. K+S’ Position in Competitive Environment C. Growth Perspectives & Strategy December 2010 K+S Group 10
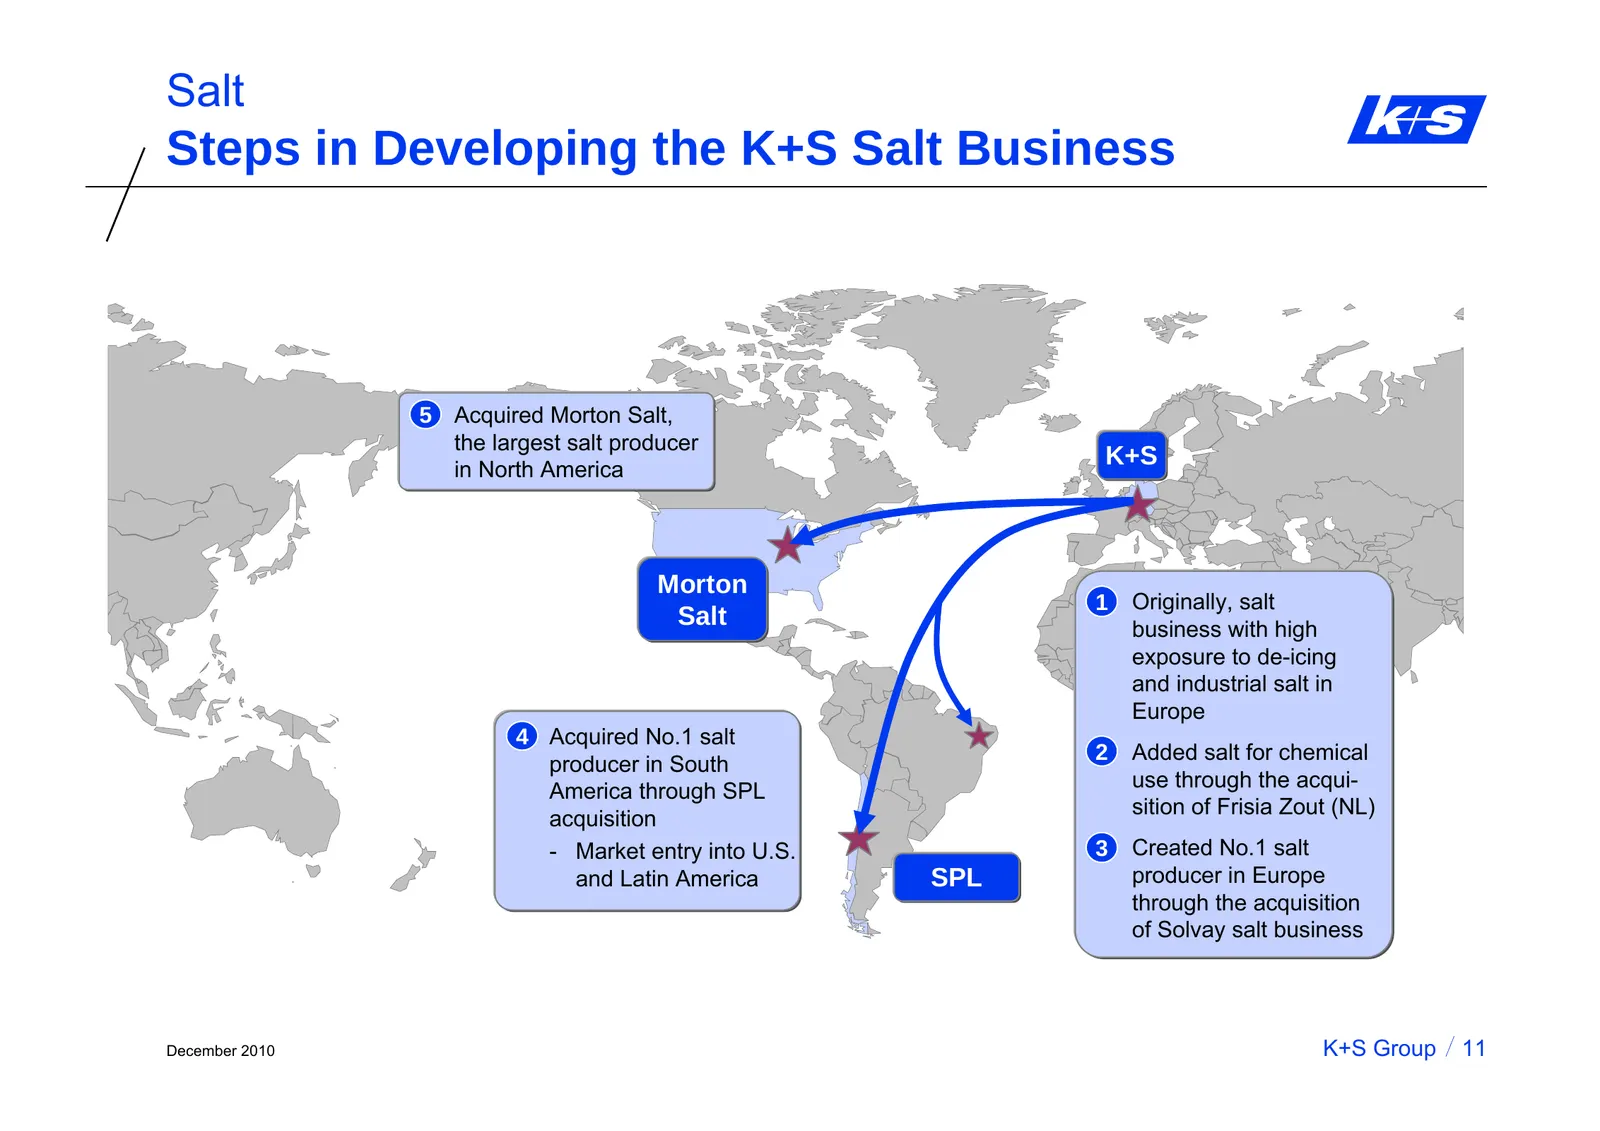
Slide 12: Steps in Developing the K+S Salt Business
Salt Steps in Developing the K+S Salt Business 5 Acquired Morton Salt, the largest salt producer in North America K+S Morton 1 Originally, salt Salt business with high exposure to de-icing and industrial salt in Europe 4 Acquired No.1 salt 2 Added salt for chemical producer in South use through the
Slide 13: Strong presence in attractive de-icing regions
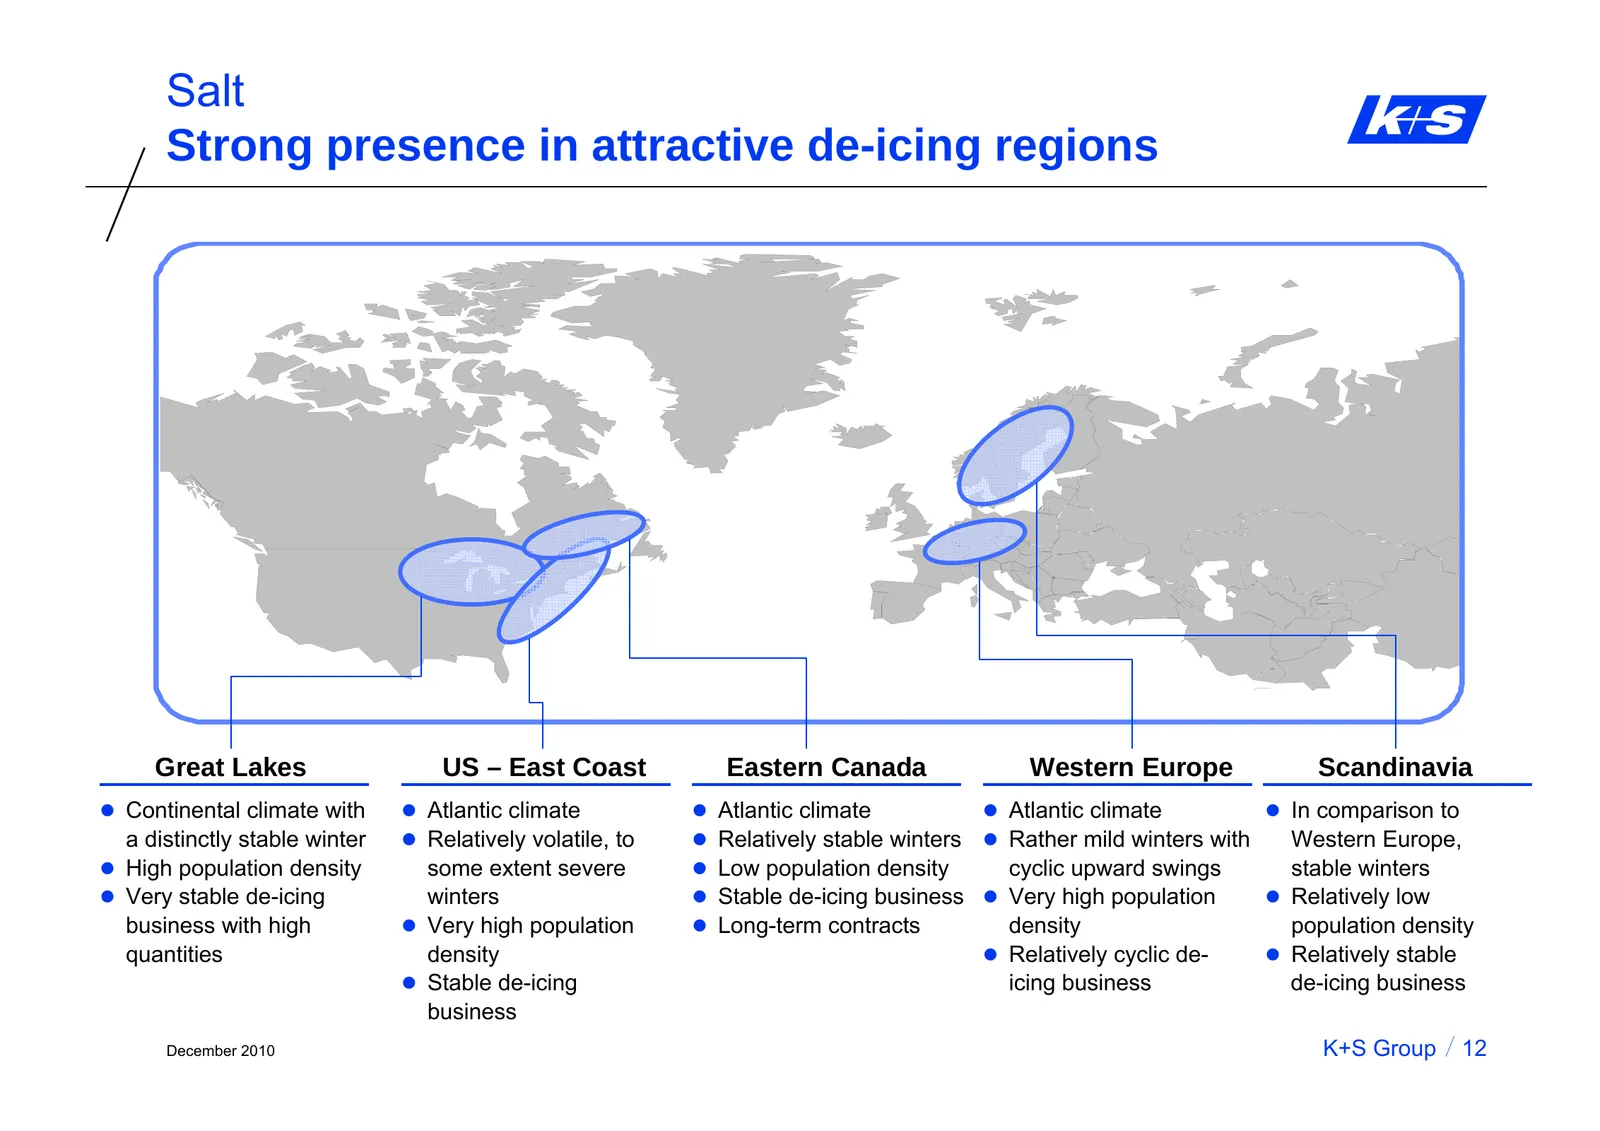
Salt Strong presence in attractive de-icing regions Great Lakes US – East Coast Eastern Canada Western Europe Scandinavia z Continental climate with z Atlantic climate z Atlantic climate z Atlantic climate z In comparison to a distinctly stable winter z Relatively volatile, to z Relatively stable wi
Slide 14: Balanced Product and Regional Portfolio
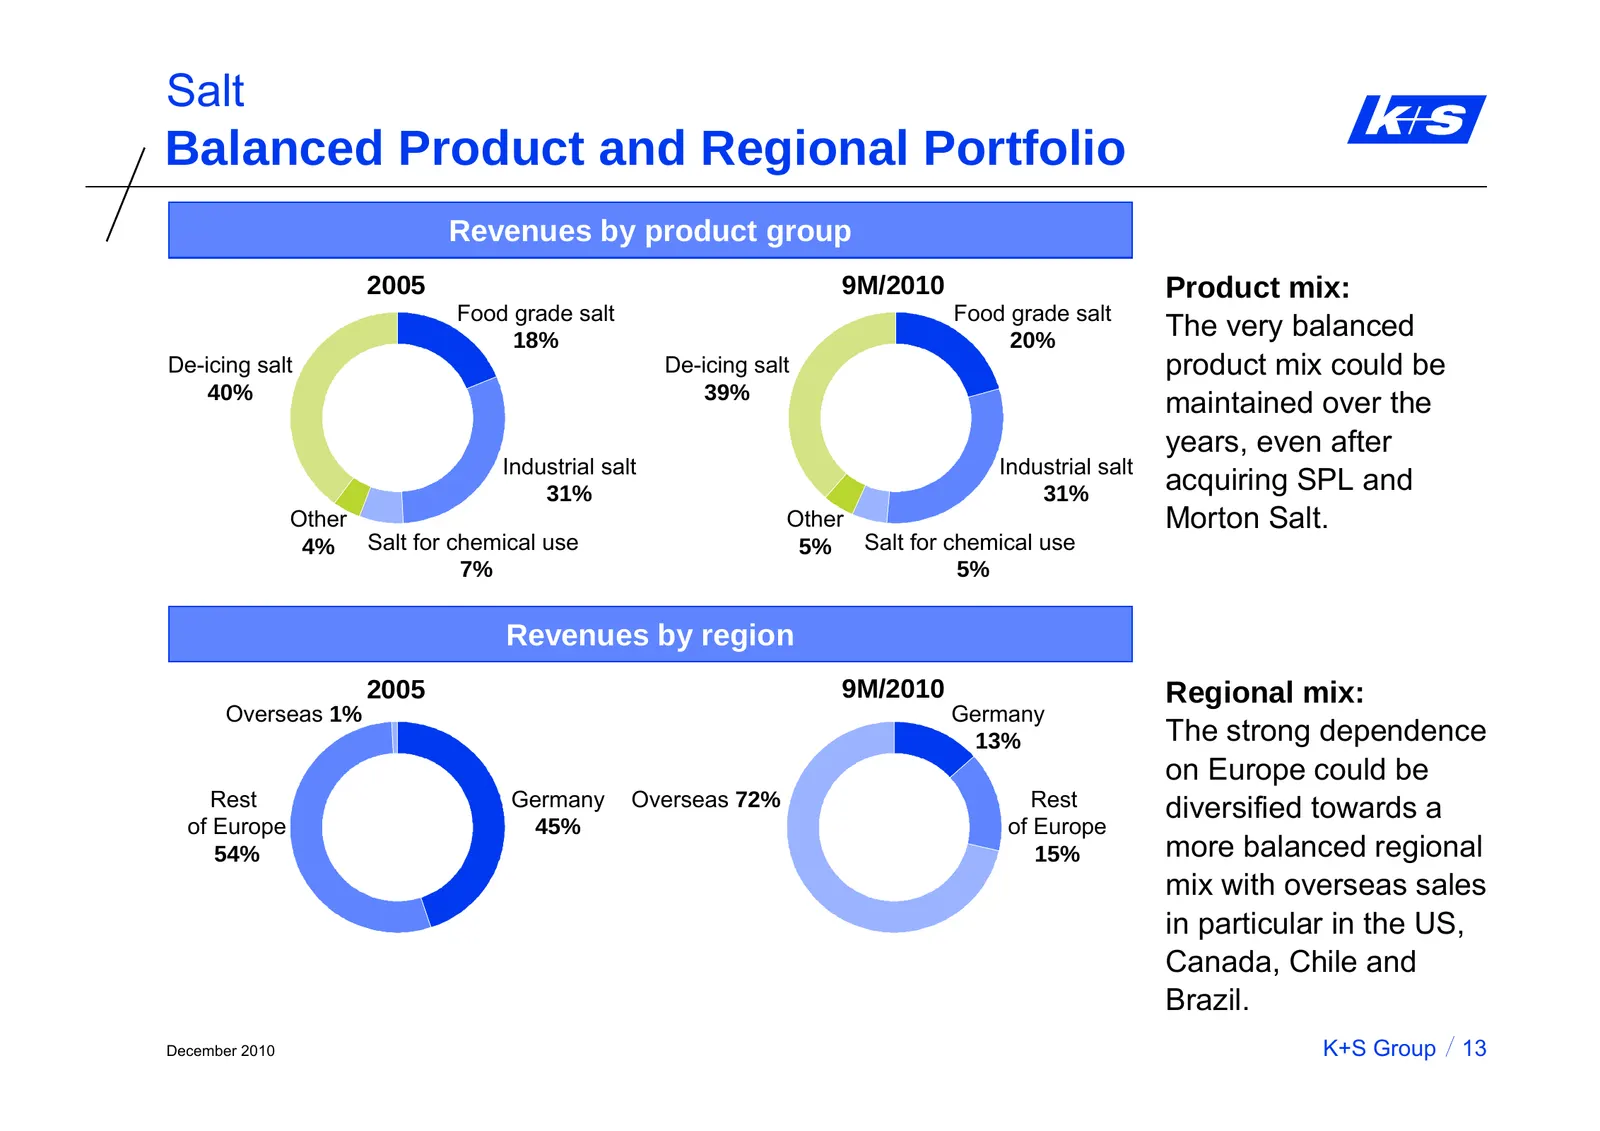
Salt Balanced Product and Regional Portfolio Revenues by product group 2005 9M/2010 Product mix: Food grade salt Food grade salt 18% 20% The very balanced De-icing salt De-icing salt product mix could be 40% 39% maintained over the years, even after Industrial salt Industrial salt 31% 31% acquiring
Slide 15: Mitigation of Volatility in De-icing Business
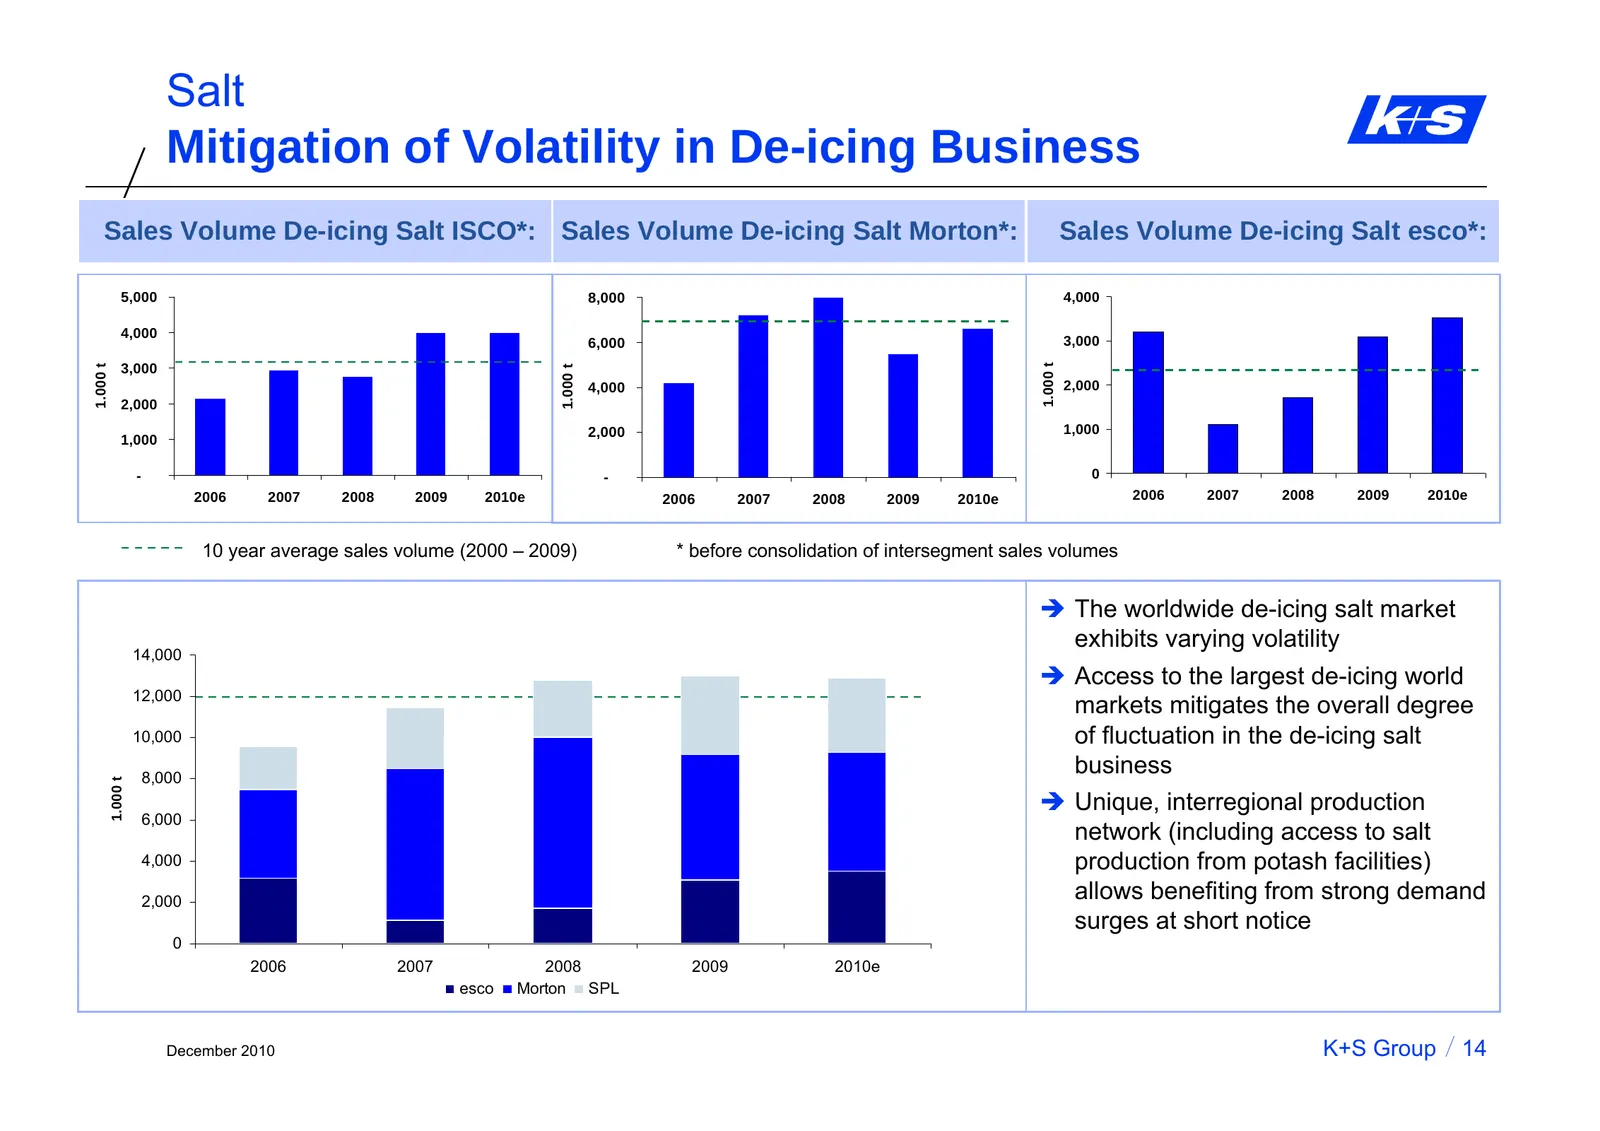
Salt Mitigation of Volatility in De-icing Business Sales Volume De-icing Salt ISCO*: Sales Volume De-icing Salt Morton*: Sales Volume De-icing Salt esco*: 5,000 8,000 4,000 4,000 6,000 3,000 1.000 t 1.000 t 3,000 1.000 t 4,000 2,000 2,000 2,000 1,000 1,000 - - 0 2006 2007 2008 2009 2010e 2006 2007 2
Slide 16: Morton Salt Reduces Earnings Volatility
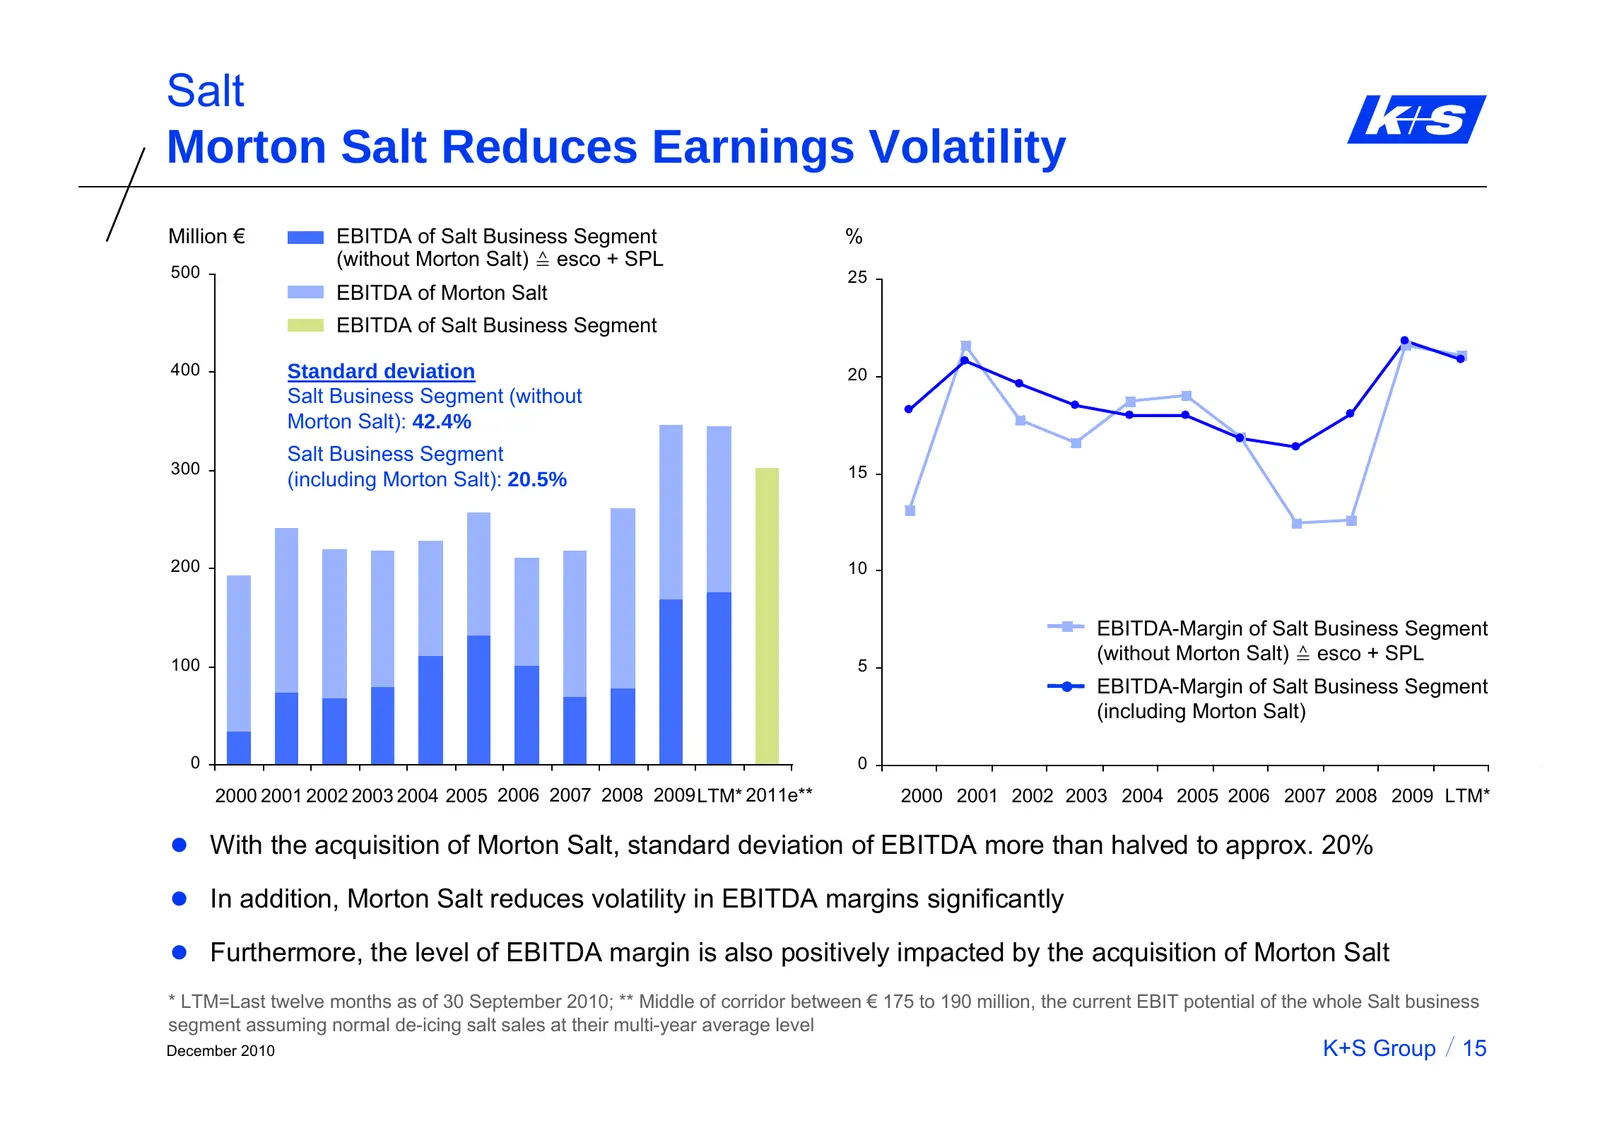
Salt Morton Salt Reduces Earnings Volatility Million € EBITDA of Salt Business Segment % (without Morton Salt) ≙ esco + SPL 500 25 EBITDA of Morton Salt EBITDA of Salt Business Segment 400 Standard deviation 20 Salt Business Segment (without Morton Salt): 42.4% Salt Business Segment 300 15 (includin
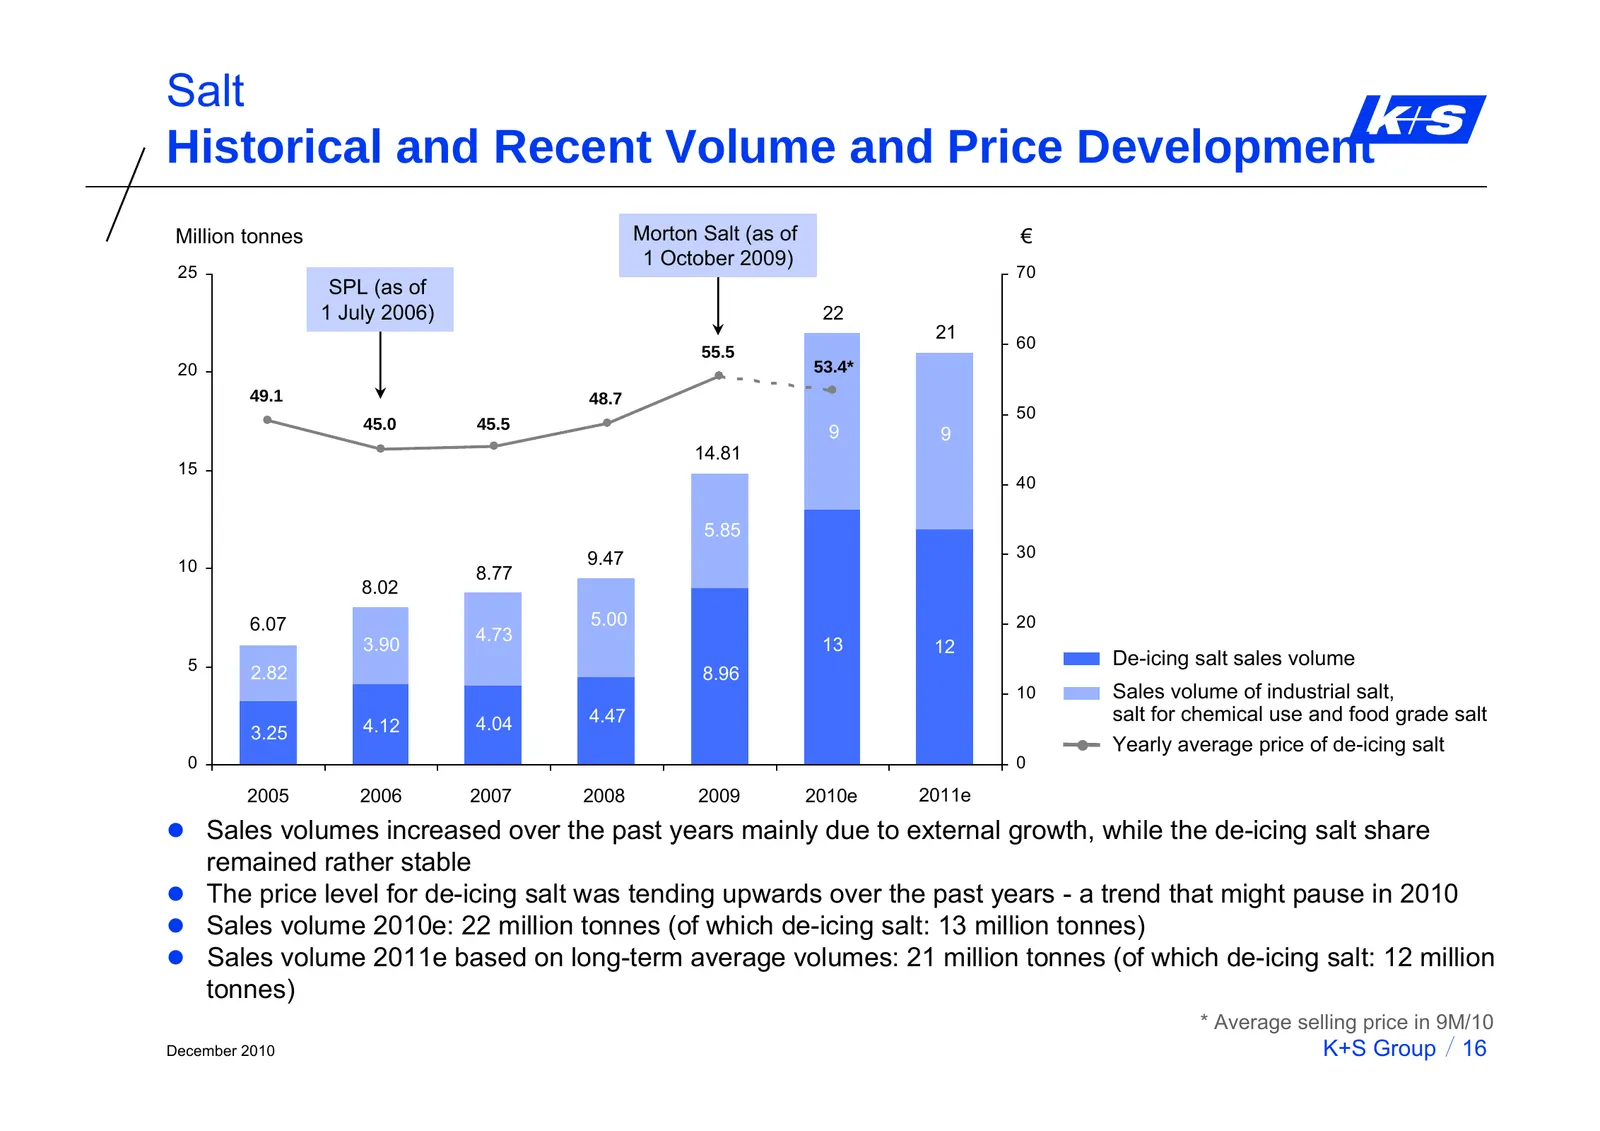
Slide 17: Historical and Recent Volume and Price Development
Salt Historical and Recent Volume and Price Development Million tonnes Morton Salt (as of € 1 October 2009) 25 70 SPL (as of 1 July 2006) 22 21 60 55.5 20 53.4* 9 49.1 48.7 50 45.0 45.5 9 9 14.81 15 40 5.85 5.85 9.47 30 10 8.77 8.02 6.07 5.00 20 4.73 3.90 13 12 5 De-icing salt sales volume 2.82 8.96
Slide 18: Cost Situation
Salt Cost Situation z Personnel y Annual work-time accounts in Germany make high degree of flexibility possible y Performance-related salary component, in Germany applicable to all employees y Personnel exchange with Potash and Magnesium Business Segment possible y Seasonal adjustment of workforce i
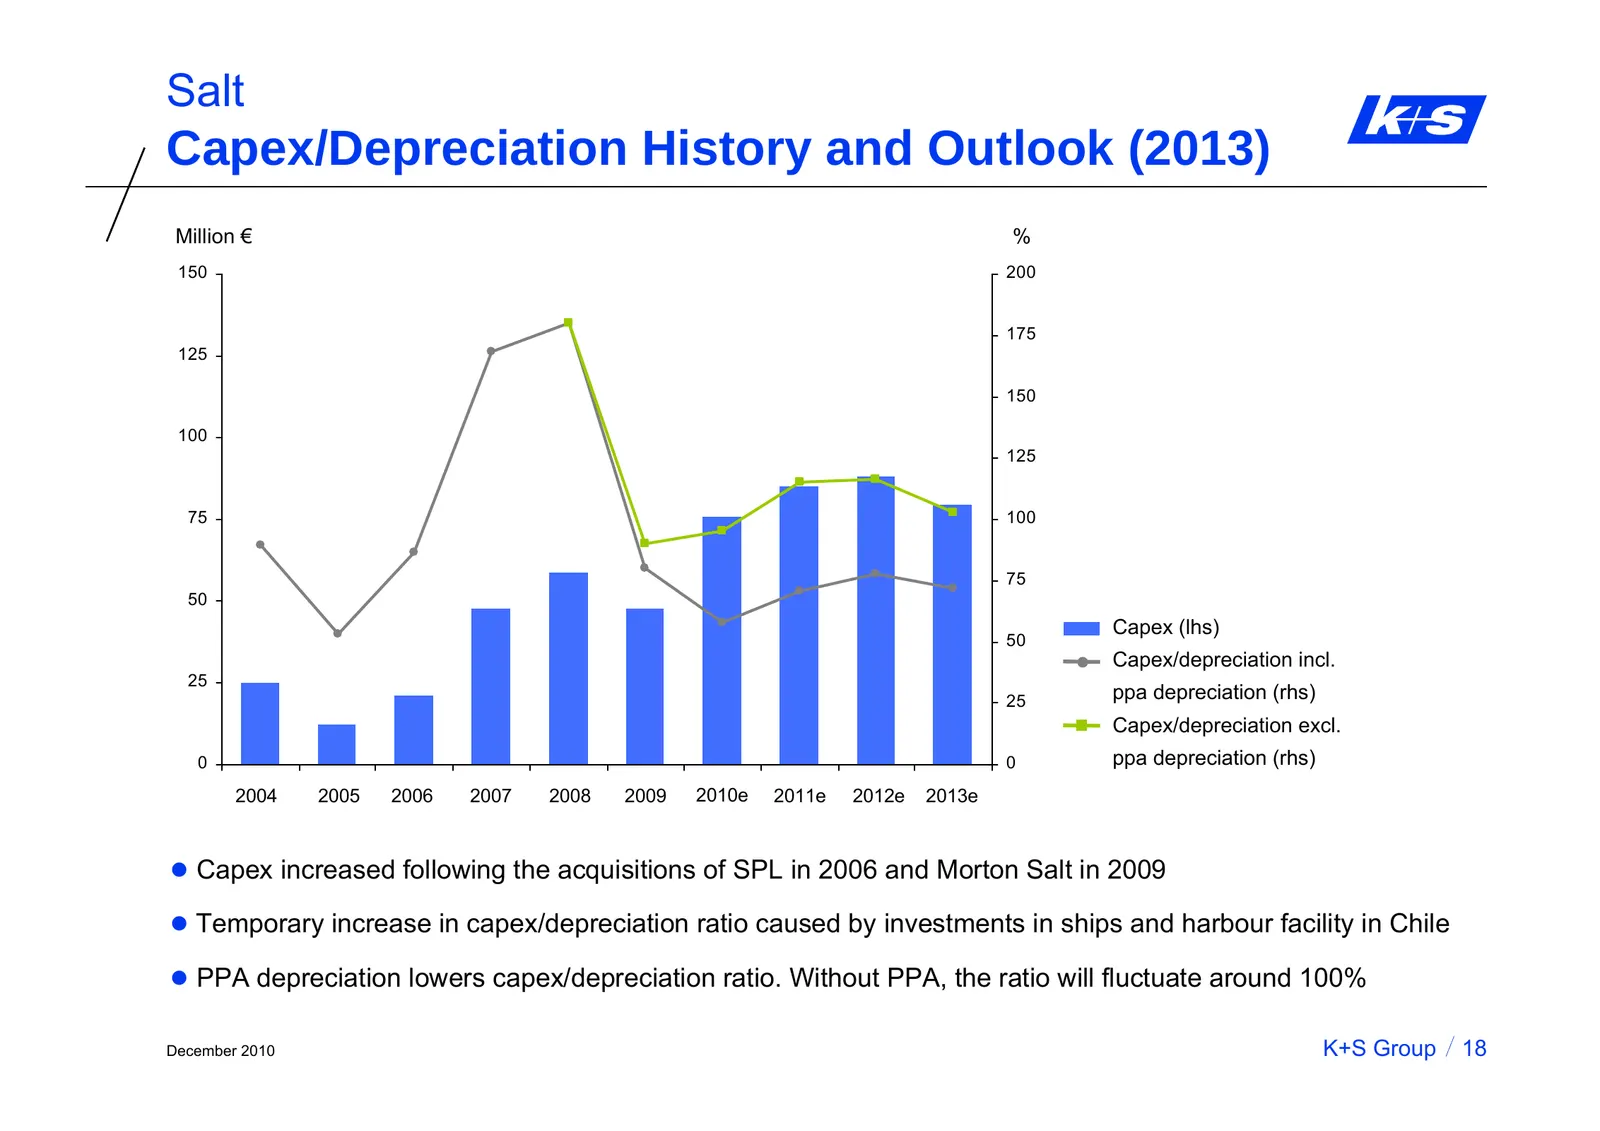
Slide 19: Capex/Depreciation History and Outlook (2013)
Salt Capex/Depreciation History and Outlook (2013) Million € % 150 200 175 125 150 100 125 75 100 75 50 Capex (lhs) 50 Capex/depreciation incl. 25 25 ppa depreciation (rhs) Capex/depreciation excl. 0 0 ppa depreciation (rhs) 2004 2005 2006 2007 2008 2009 2010e 2011e 2012e 2013e z Capex increased fol
Slide 20: Content
Salt Content A. Salt Market Environment B. The K+S Salt Business C. K+S’ Position in Competitive Environment D. Growth Perspectives & Strategy December 2010 K+S Group 19
Slide 21: Competitive advantage
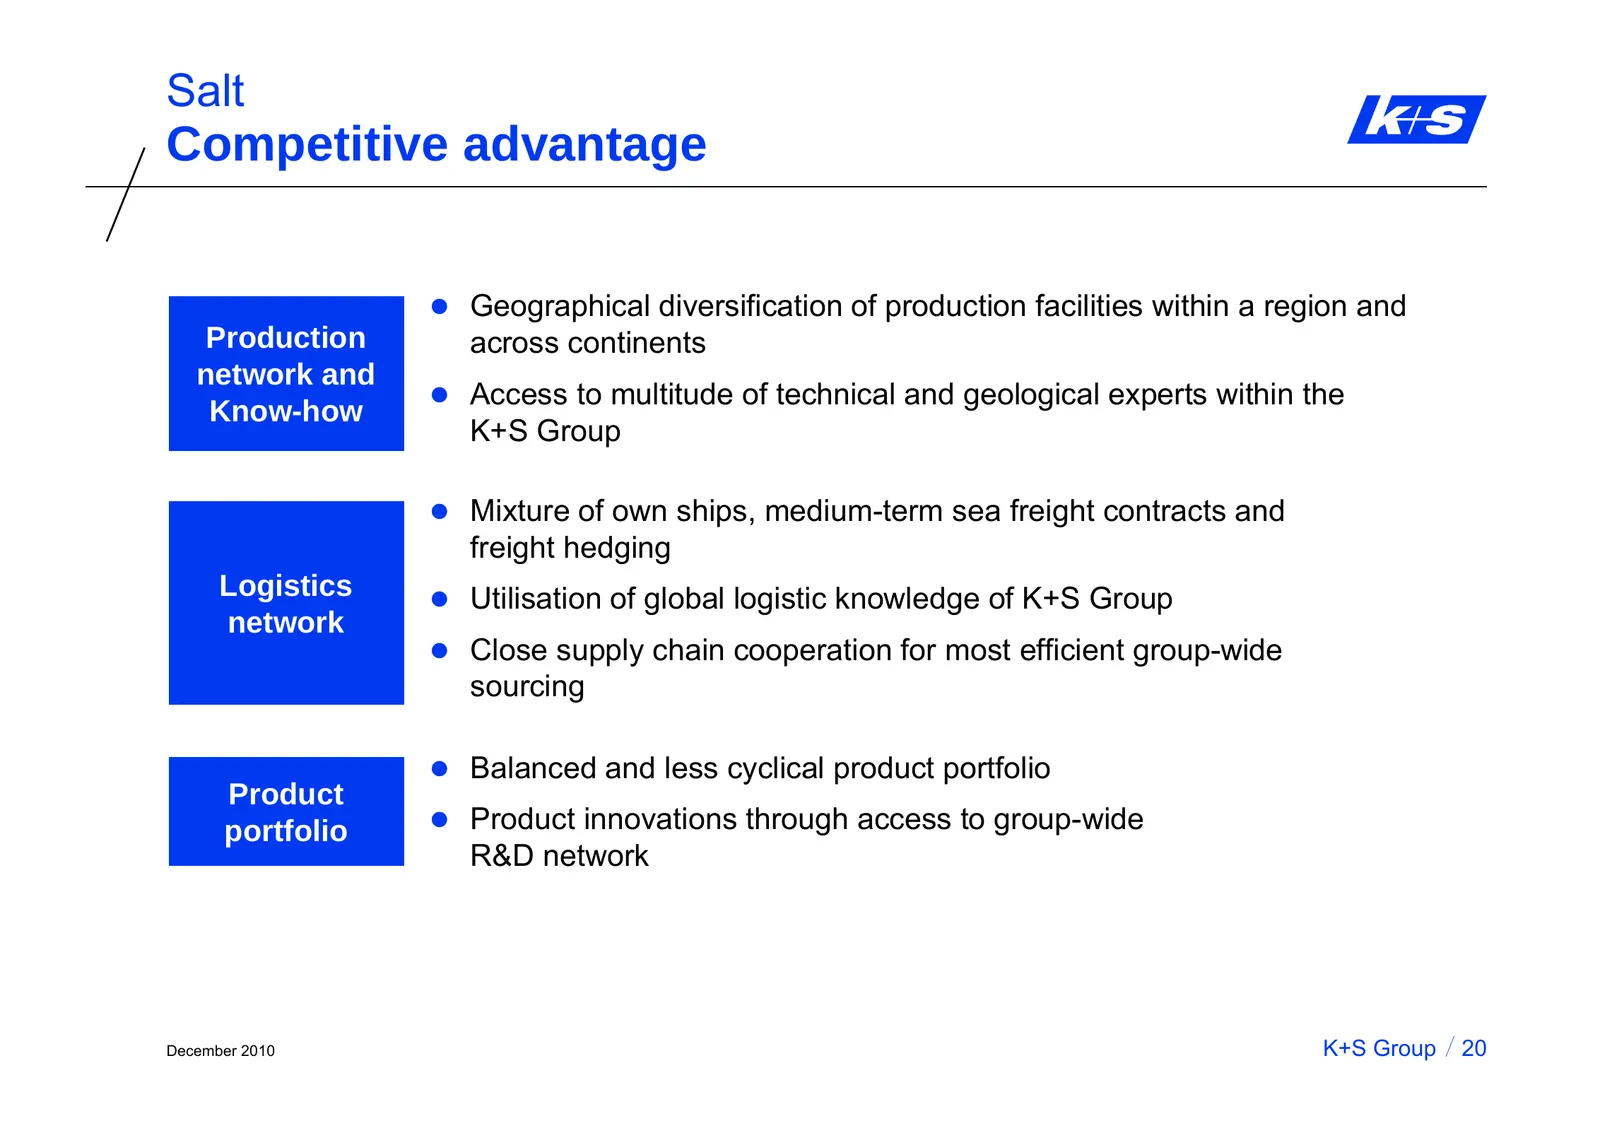
Salt Competitive advantage z Geographical diversification of production facilities within a region and Production across continents network and z Access to multitude of technical and geological experts within the Know-how K+S Group z Mixture of own ships, medium-term sea freight contracts and freigh
Slide 22: Unique Production Network / Excellence in Logistics
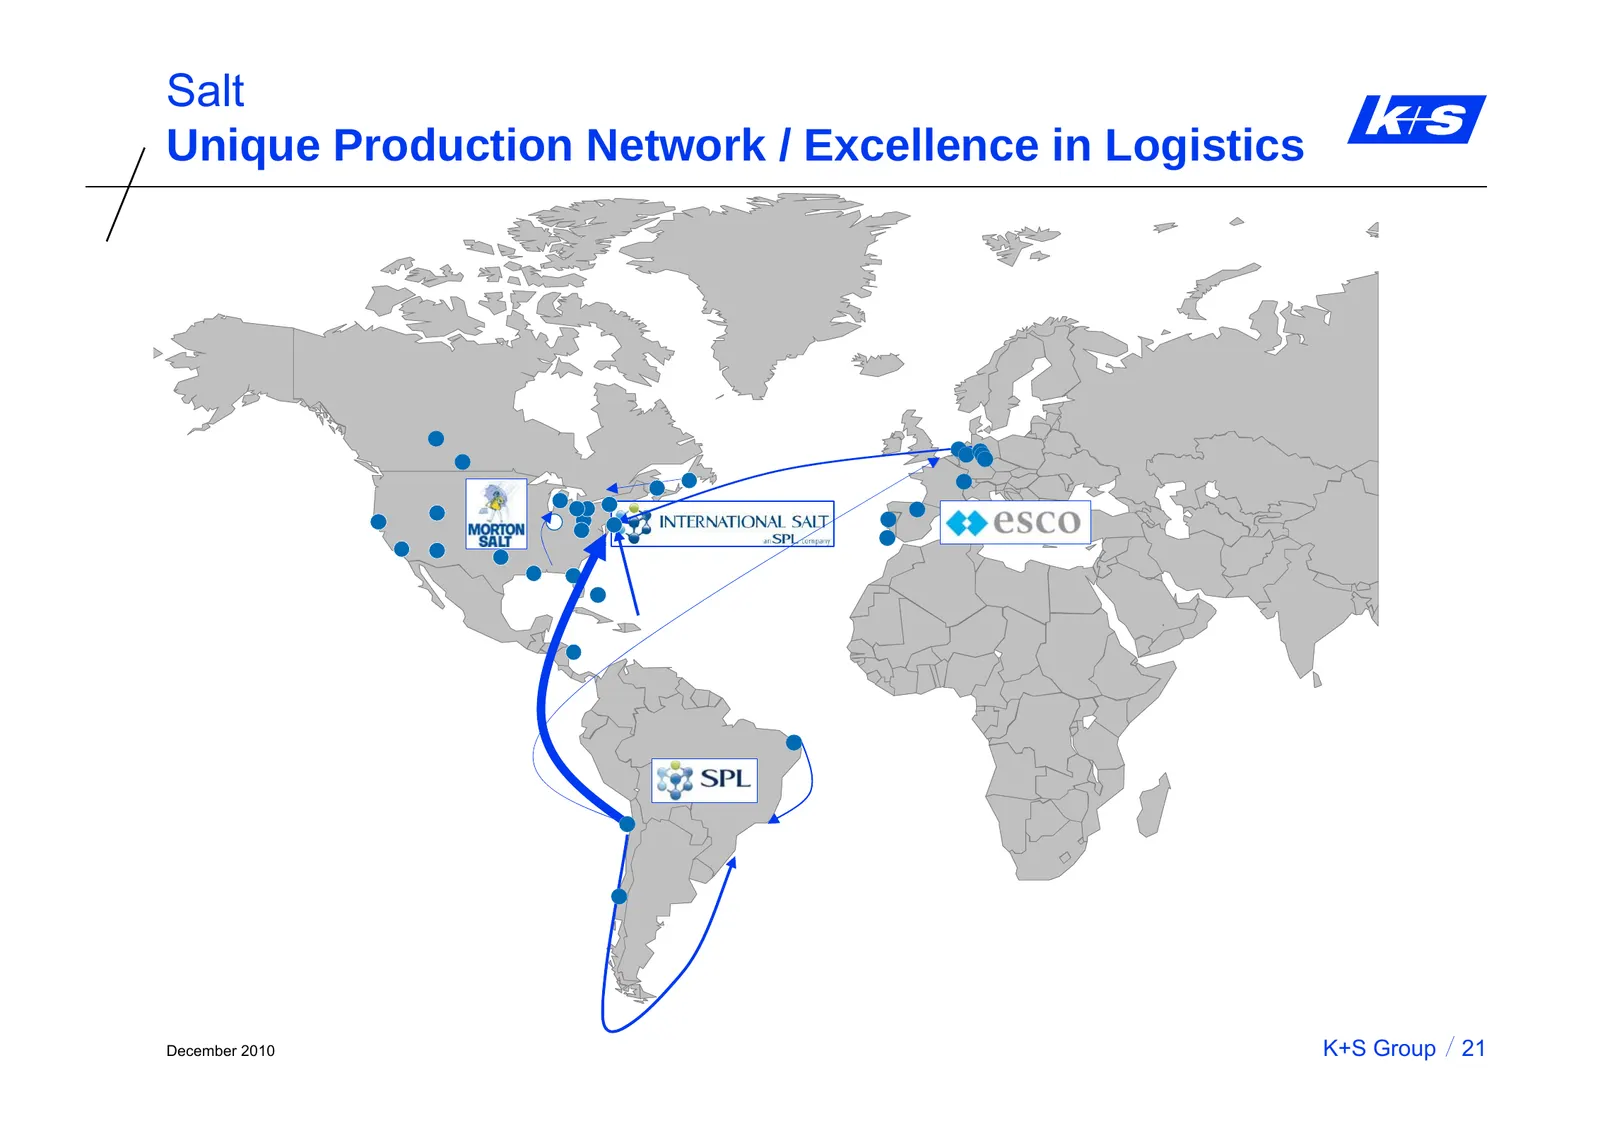
Salt Unique Production Network / Excellence in Logistics December 2010 K+S Group 21
Slide 23: Comparison of Portfolios with Competitors
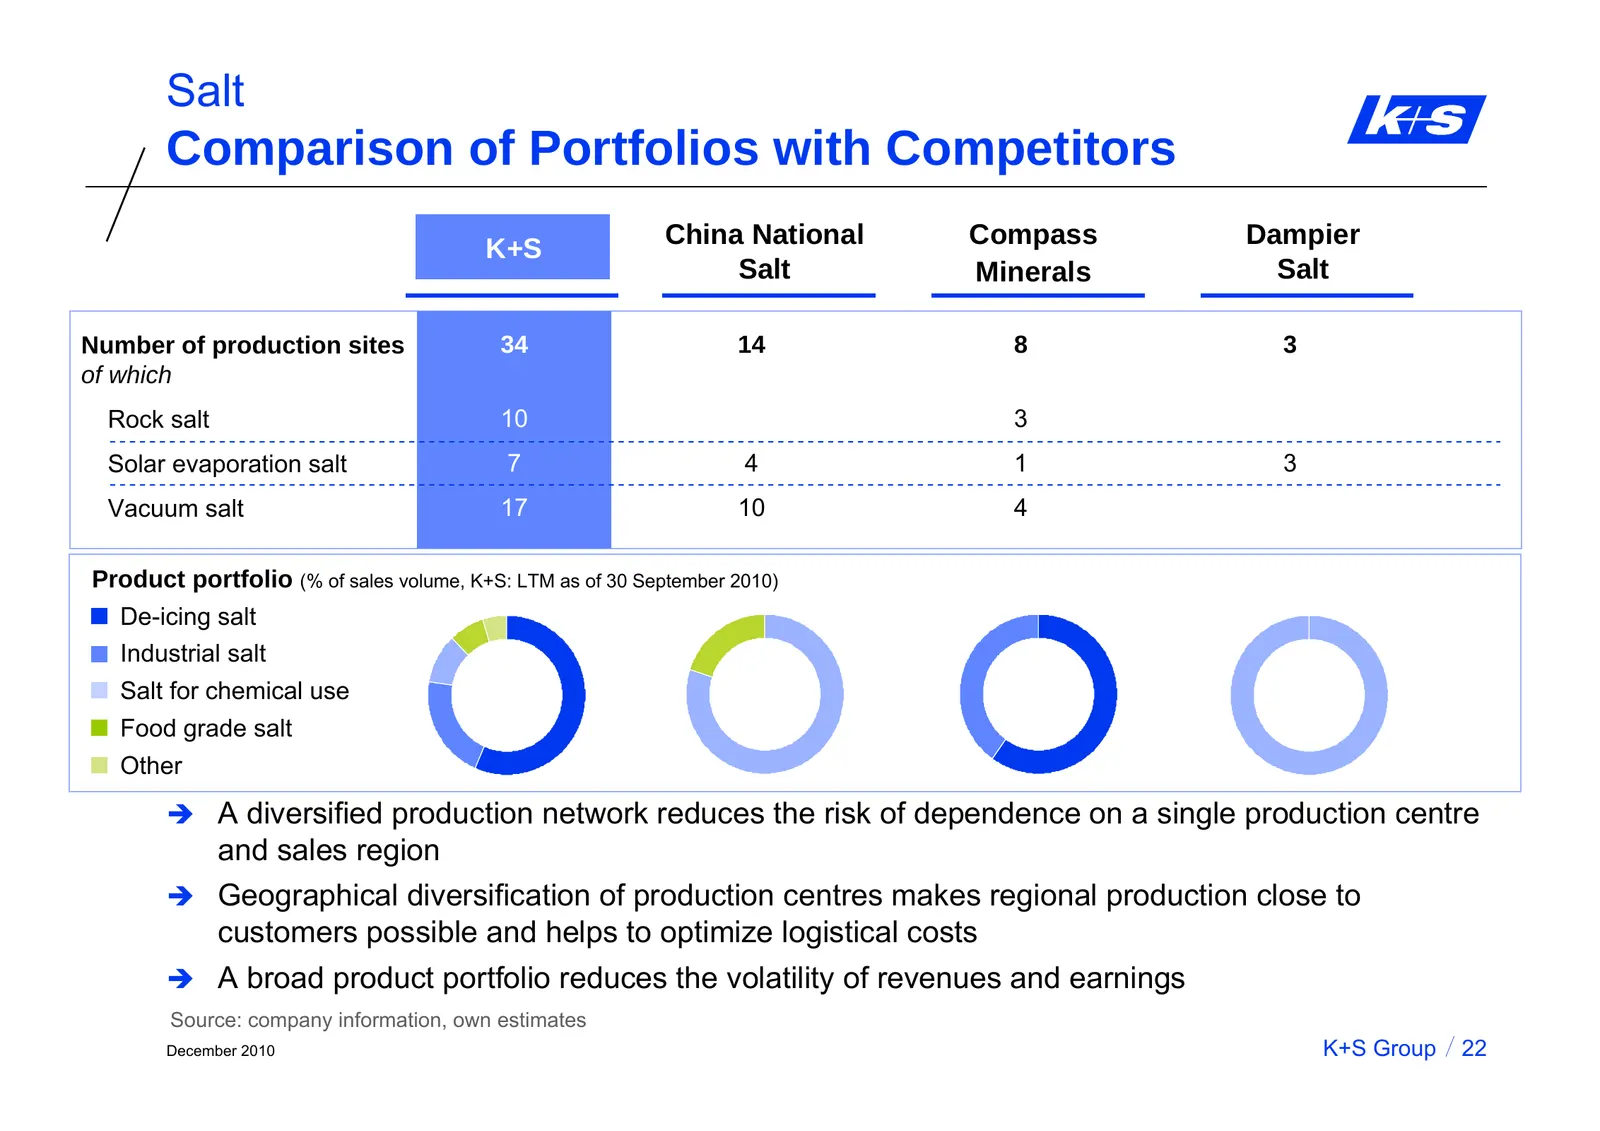
Salt Comparison of Portfolios with Competitors China National Compass Dampier K+S Salt Minerals Salt Number of production sites 34 14 8 3 of which Rock salt 10 3 Solar evaporation salt 7 4 1 3 Vacuum salt 17 10 4 Product portfolio (% of sales volume, K+S: LTM as of 30 September 2010) De-icing salt I
Slide 24: Content
Salt Content A. Salt Market Environment B. The K+S Salt Business C. K+S’ Position in Competitive Environment D. Growth Perspectives & Strategy December 2010 K+S Group 23
Slide 25: Regional Growth Perspectives – North America
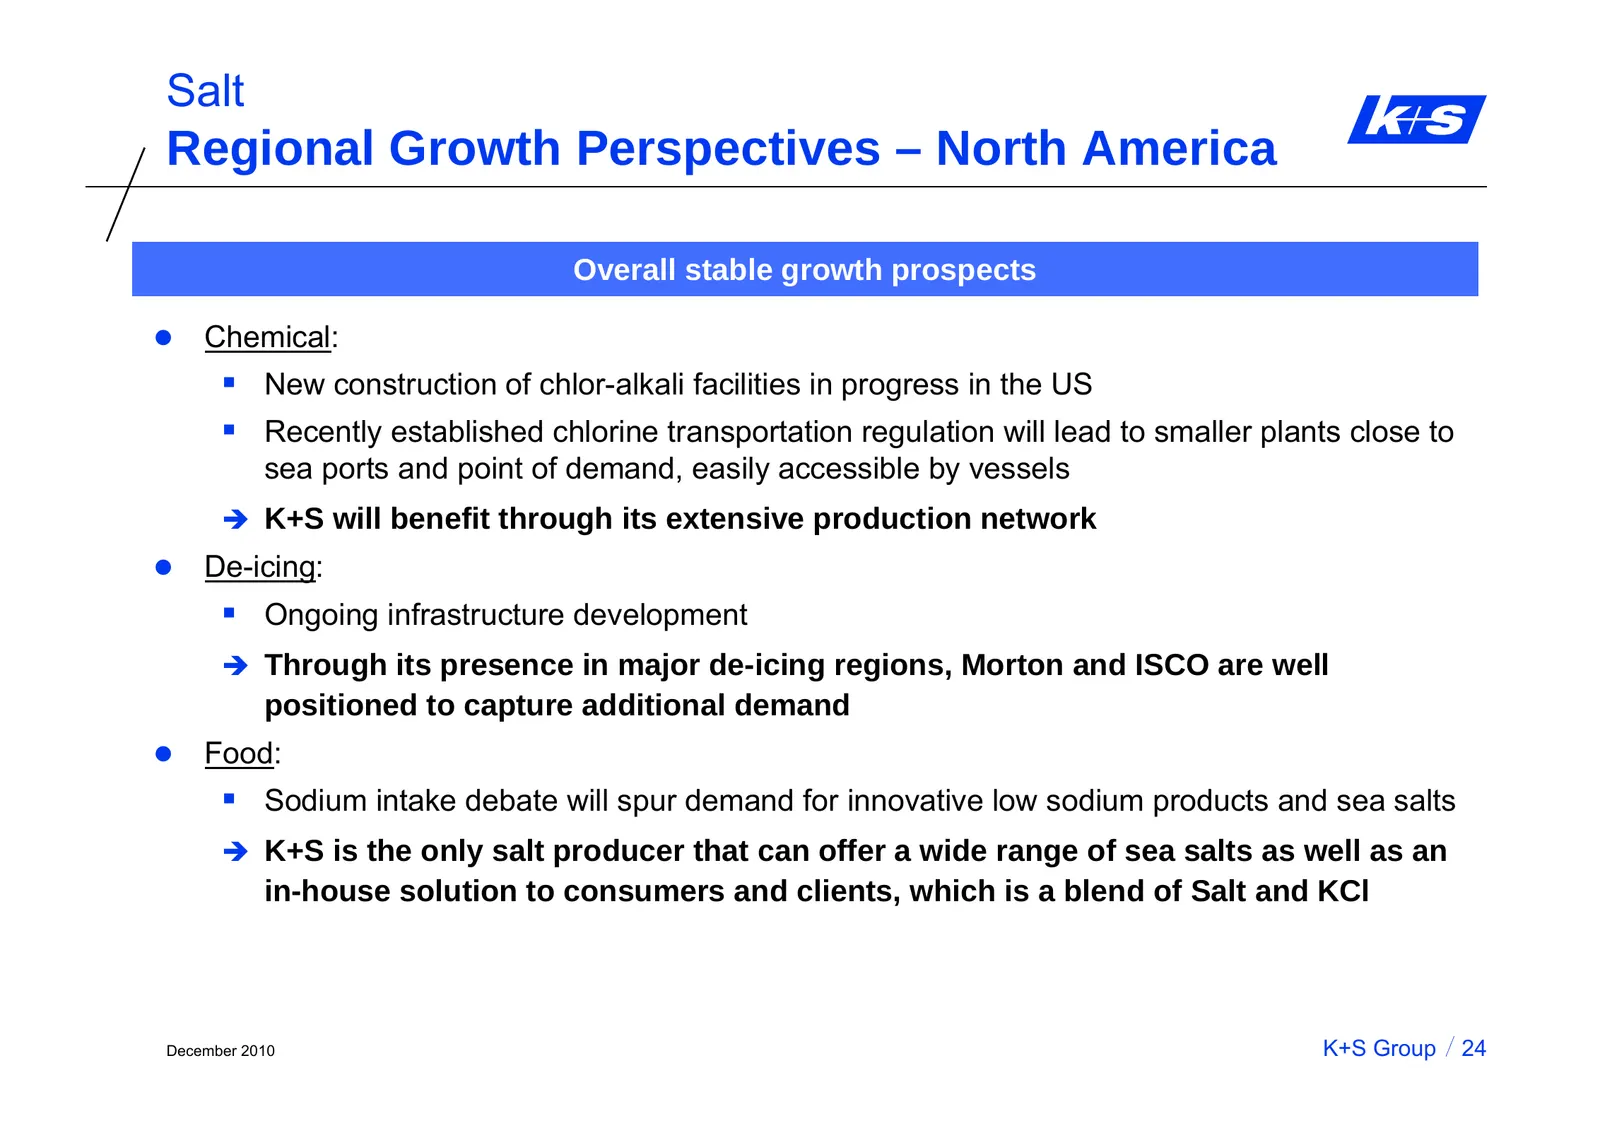
Salt Regional Growth Perspectives – North America Overall stable growth prospects z Chemical: New construction of chlor-alkali facilities in progress in the US Recently established chlorine transportation regulation will lead to smaller plants close to sea ports and point of demand, easily acces
Slide 26: Regional Growth Perspectives – Europe
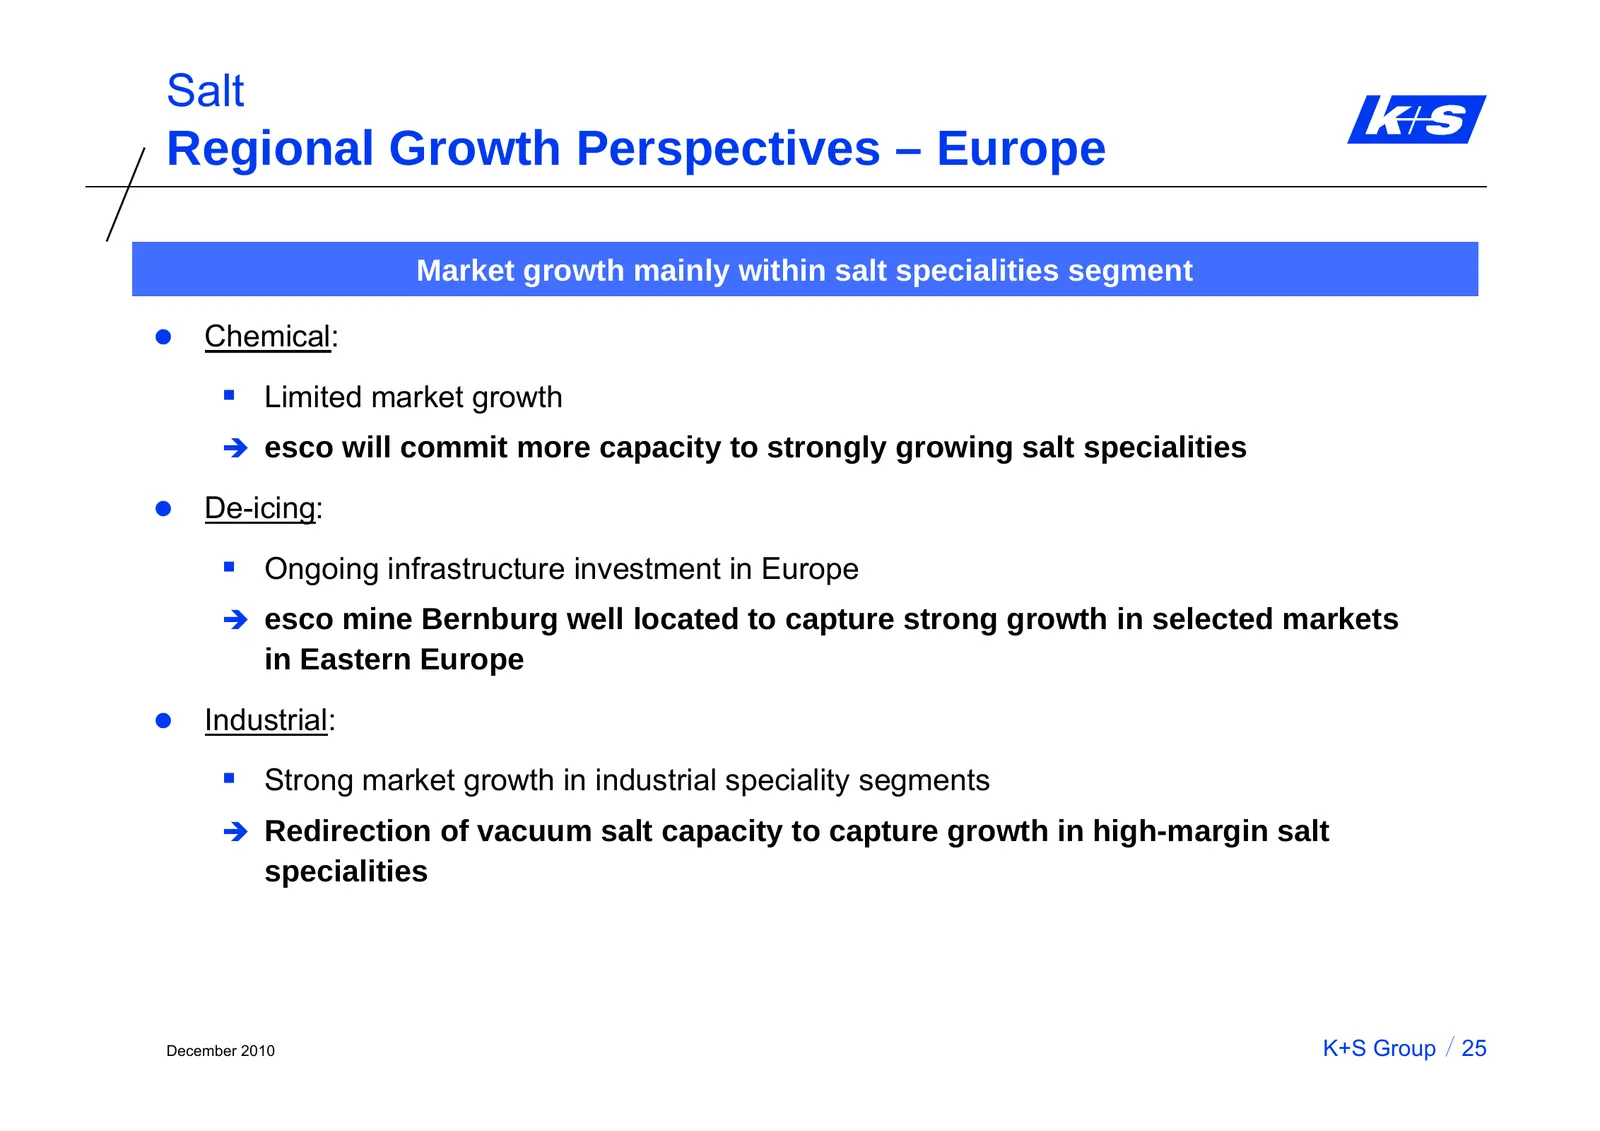
Salt Regional Growth Perspectives – Europe Market growth mainly within salt specialities segment z Chemical: Limited market growth Î esco will commit more capacity to strongly growing salt specialities z De-icing: Ongoing infrastructure investment in Europe Î esco mine Bernburg well located to c
Slide 27: Regional Growth Perspectives – South America
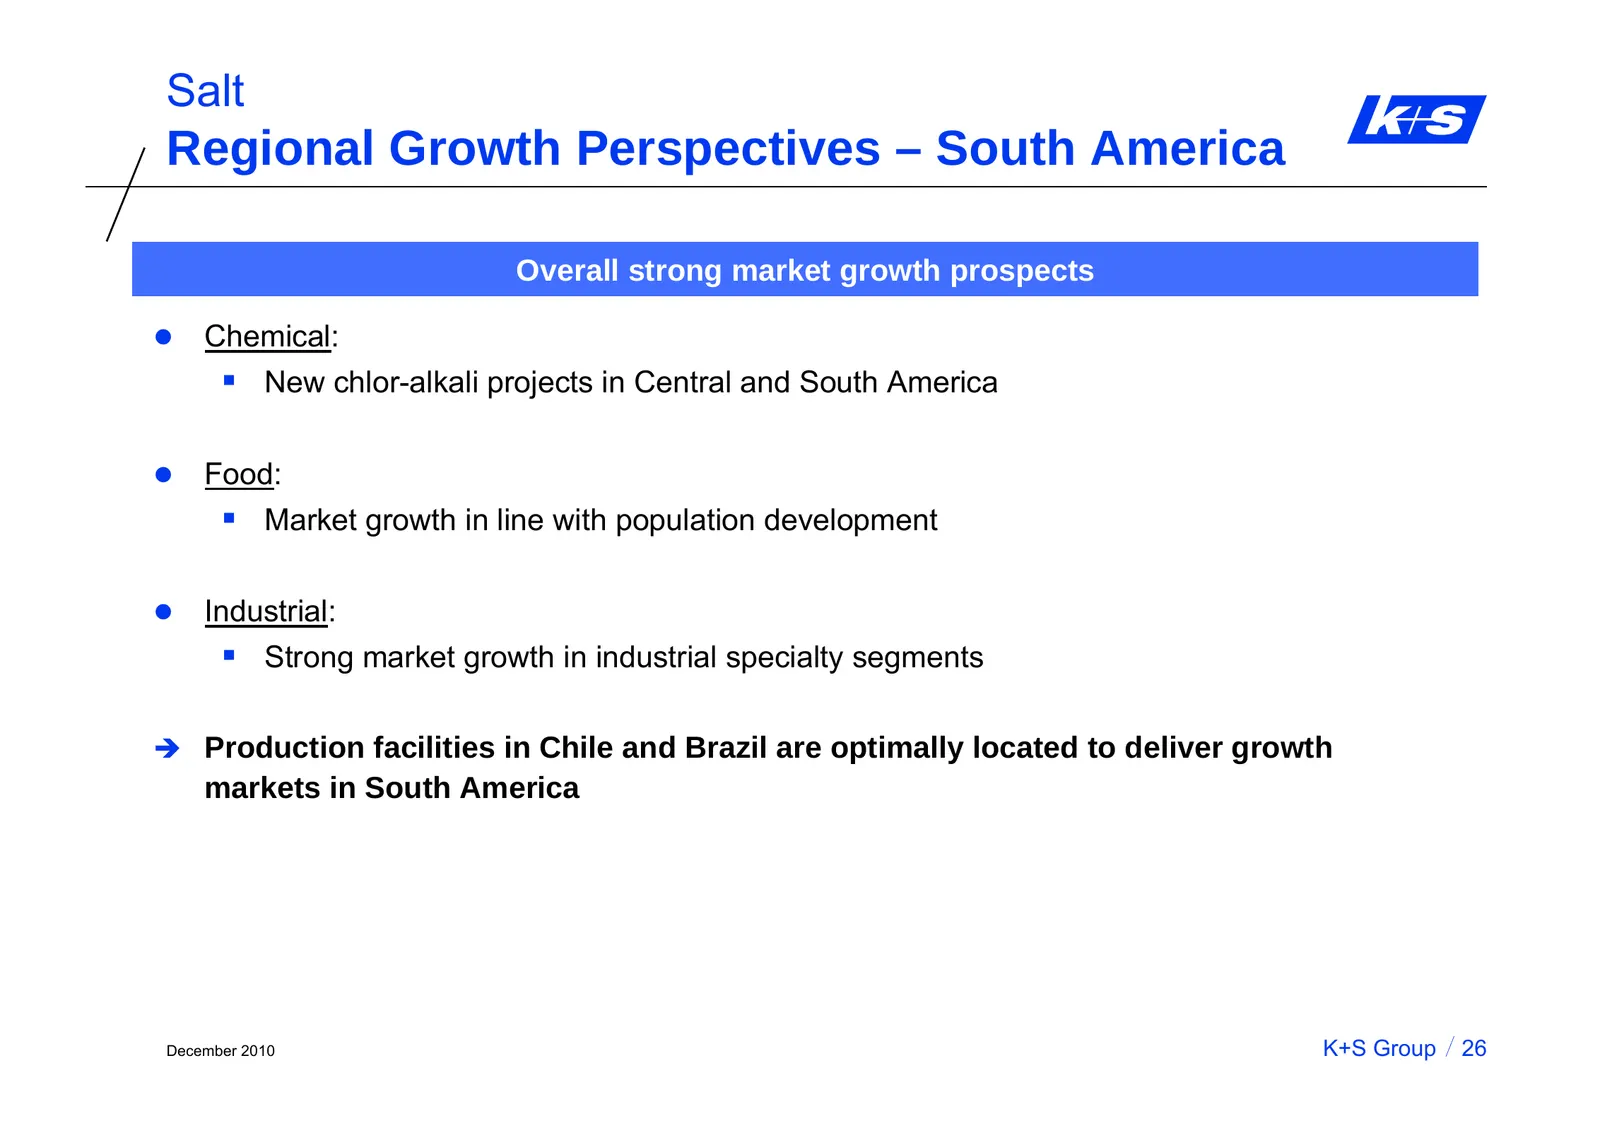
Salt Regional Growth Perspectives – South America Overall strong market growth prospects z Chemical: New chlor-alkali projects in Central and South America z Food: Market growth in line with population development z Industrial: Strong market growth in industrial specialty segments Î Production
Slide 28: Regional Growth Perspectives – Asia
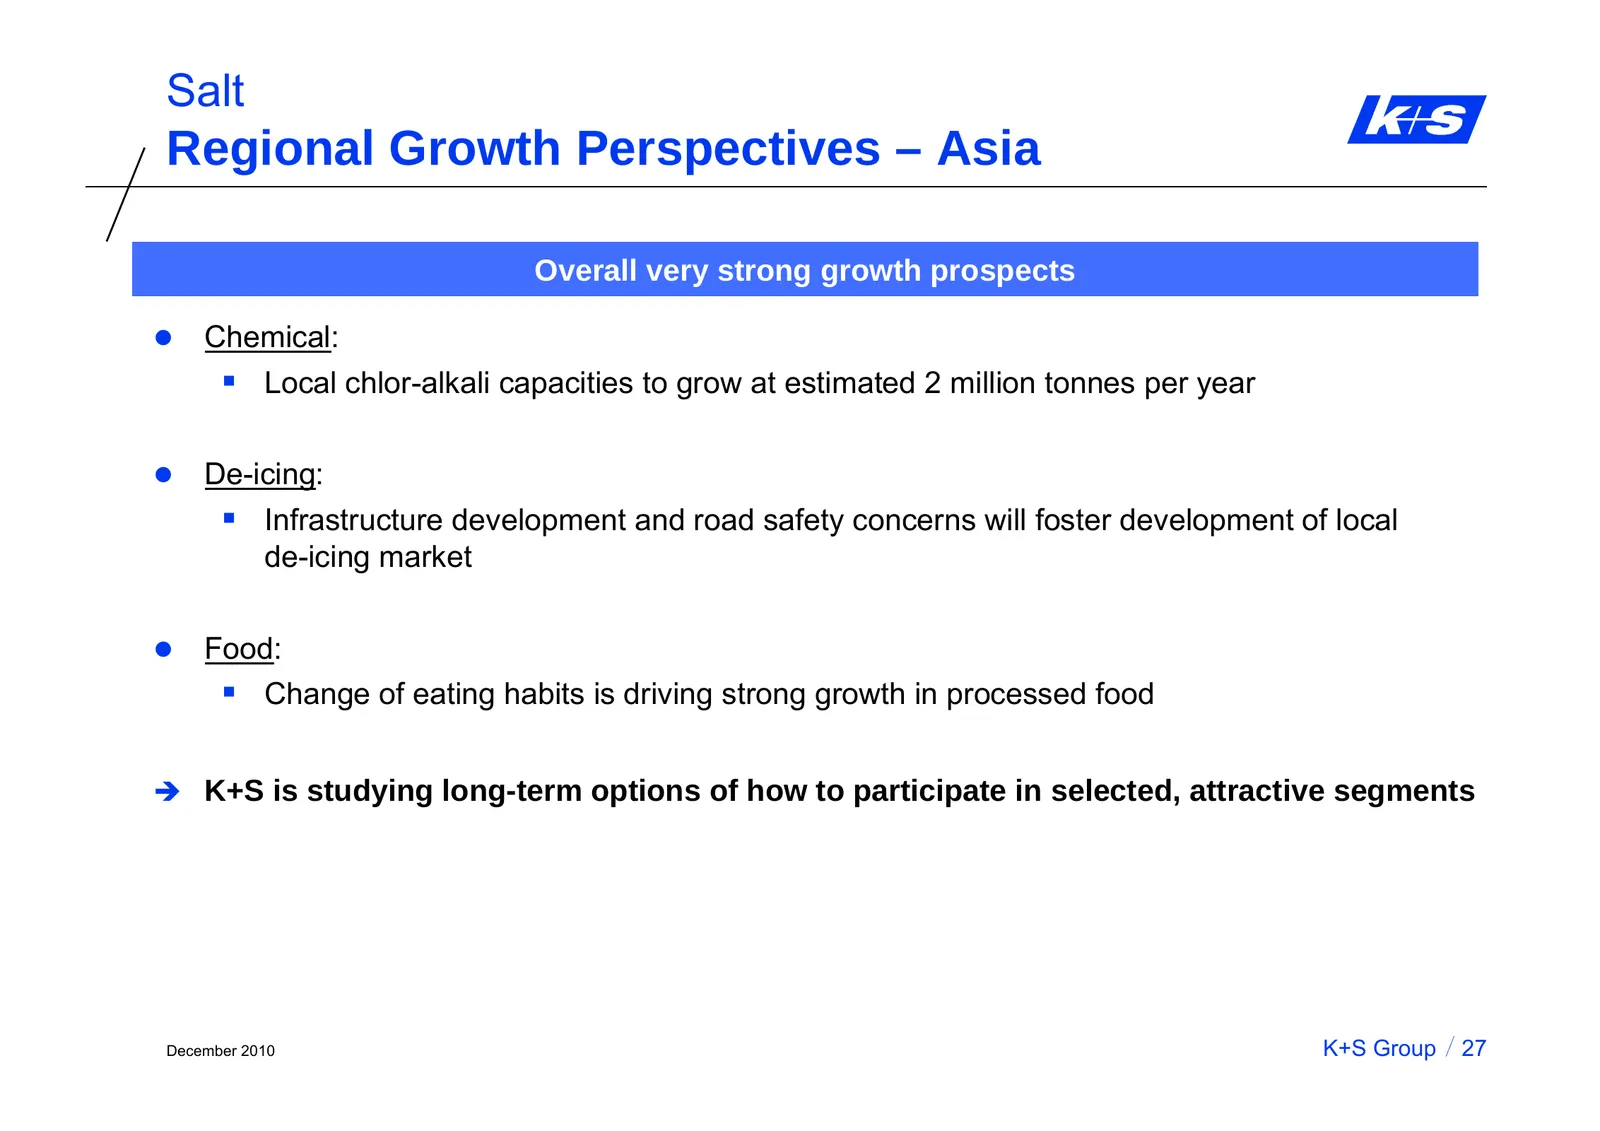
Salt Regional Growth Perspectives – Asia Overall very strong growth prospects z Chemical: Local chlor-alkali capacities to grow at estimated 2 million tonnes per year z De-icing: Infrastructure development and road safety concerns will foster development of local de-icing market z Food: Change
Slide 29: Current and Medium-term EBIT Potential
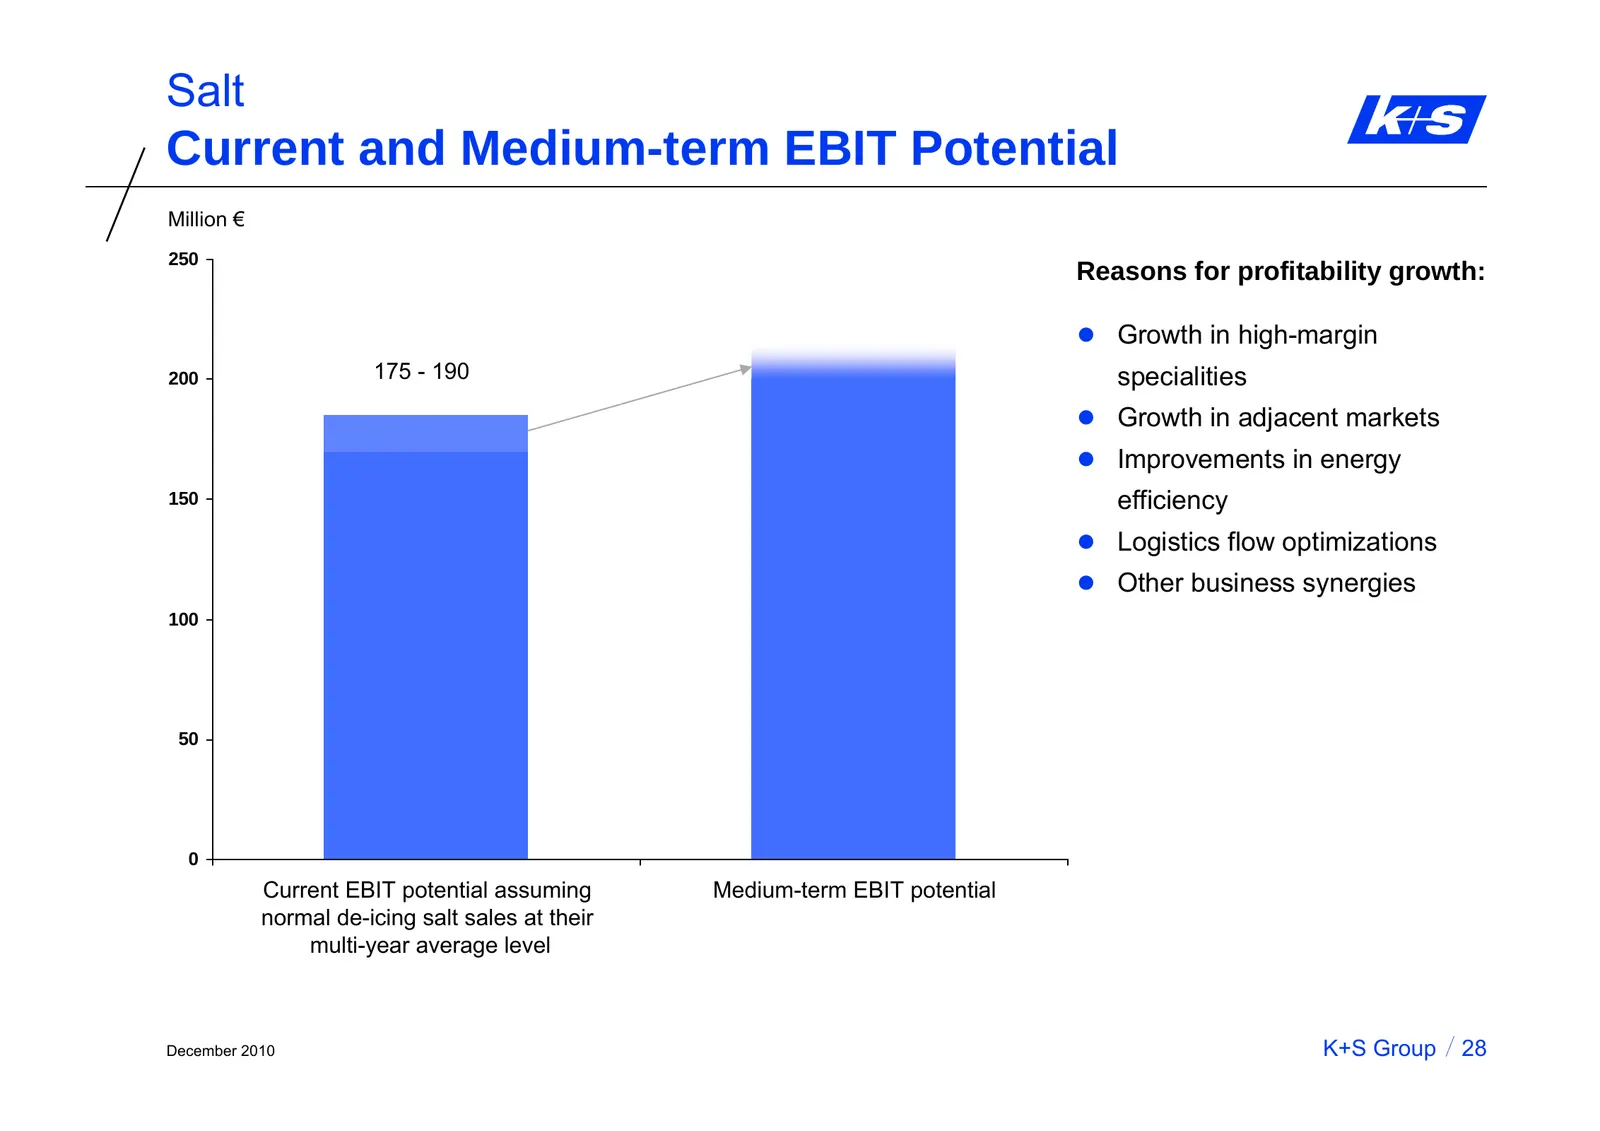
Salt Current and Medium-term EBIT Potential Million € 250 Reasons for profitability growth: z Growth in high-margin 200 175 - 190 specialities z Growth in adjacent markets z Improvements in energy 150 efficiency z Logistics flow optimizations z Other business synergies 100 50 0 Current EBIT potentia
Slide 30: Strategy of the Salt Business Segment
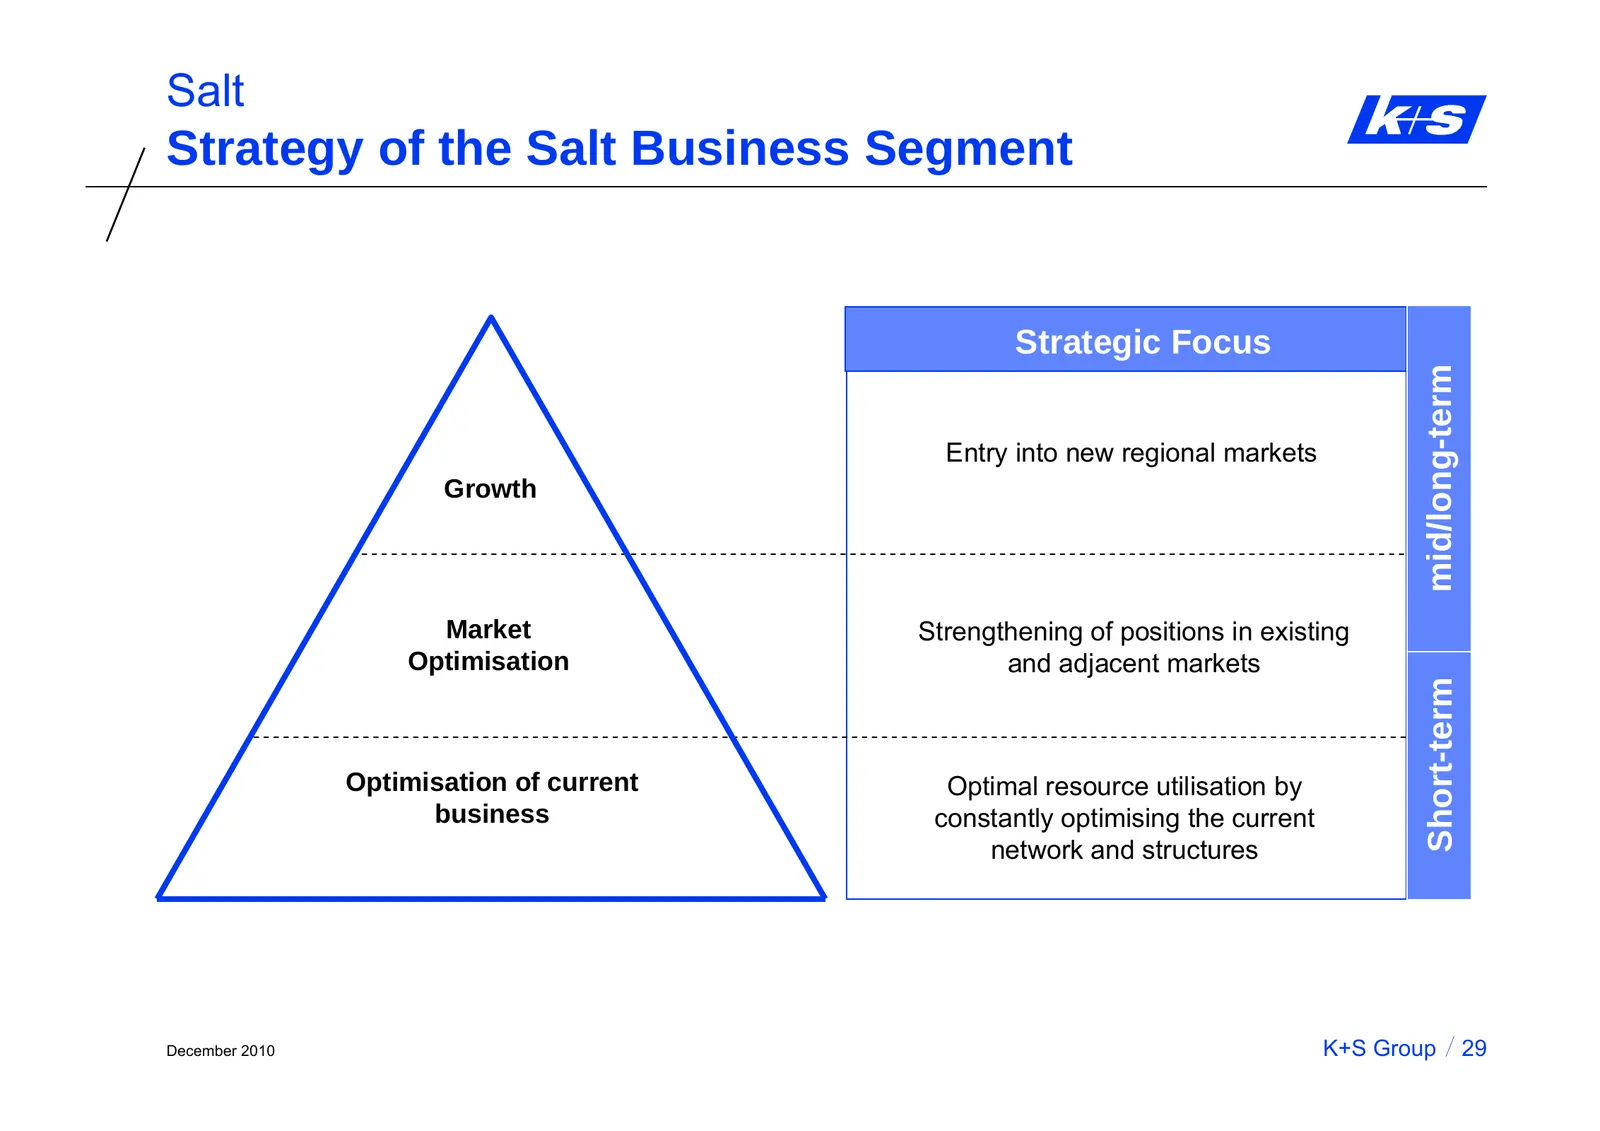
Salt Strategy of the Salt Business Segment Strategic Focus mid/long-term Entry into new regional markets Growth Market Strengthening of positions in existing Optimisation and adjacent markets Short-term Optimisation of current Optimal resource utilisation by business constantly optimising the curren
Slide 31: Forward-Looking Statements
K+S Group Forward-Looking Statements This presentation contains facts and forecasts that relate to the future development of the K+S Group and its companies. The forecasts are estimates that we have made on the basis of all the information available to us at this moment in time. Should the assumptio
Slide 32: K+S Aktiengesellschaft contact details
K+S Aktiengesellschaft Bertha-von-Suttner-Straße 7 34131 Kassel | Germany phone: +49 (0)561 / 9301-0 fax: +49 (0)561 / 9301-1753 Investor Relations phone: +49 (0)561 / 9301-1100 fax: +49 (0)561 / 9301-2425 email: investor-relations@k-plus-s.com Internet: www.k-plus-s.com Experience growth.
Source: Internet Archive copy of k-plus-s.com
More decks from K+s AG
 Investor Presentation (October 2026)100 slides · October 2026
 Q2 2026 Earnings Presentation9 slides · Aug 12, 2026
 Investor Presentation (August 2026)102 slides · August 2026
 Q1 2026 Earnings Presentation11 slides · May 11, 2026
 Investor Presentation (May 2026)89 slides · May 2026
 Q4 2025 Earnings Presentation11 slides · Mar 13, 2026