Osisko Gold Group Inc. · TSXV:OGG
Osisko Gold — Investor Presentation (November 2026)
48 slides from Osisko Gold's investor presentation, November 2026
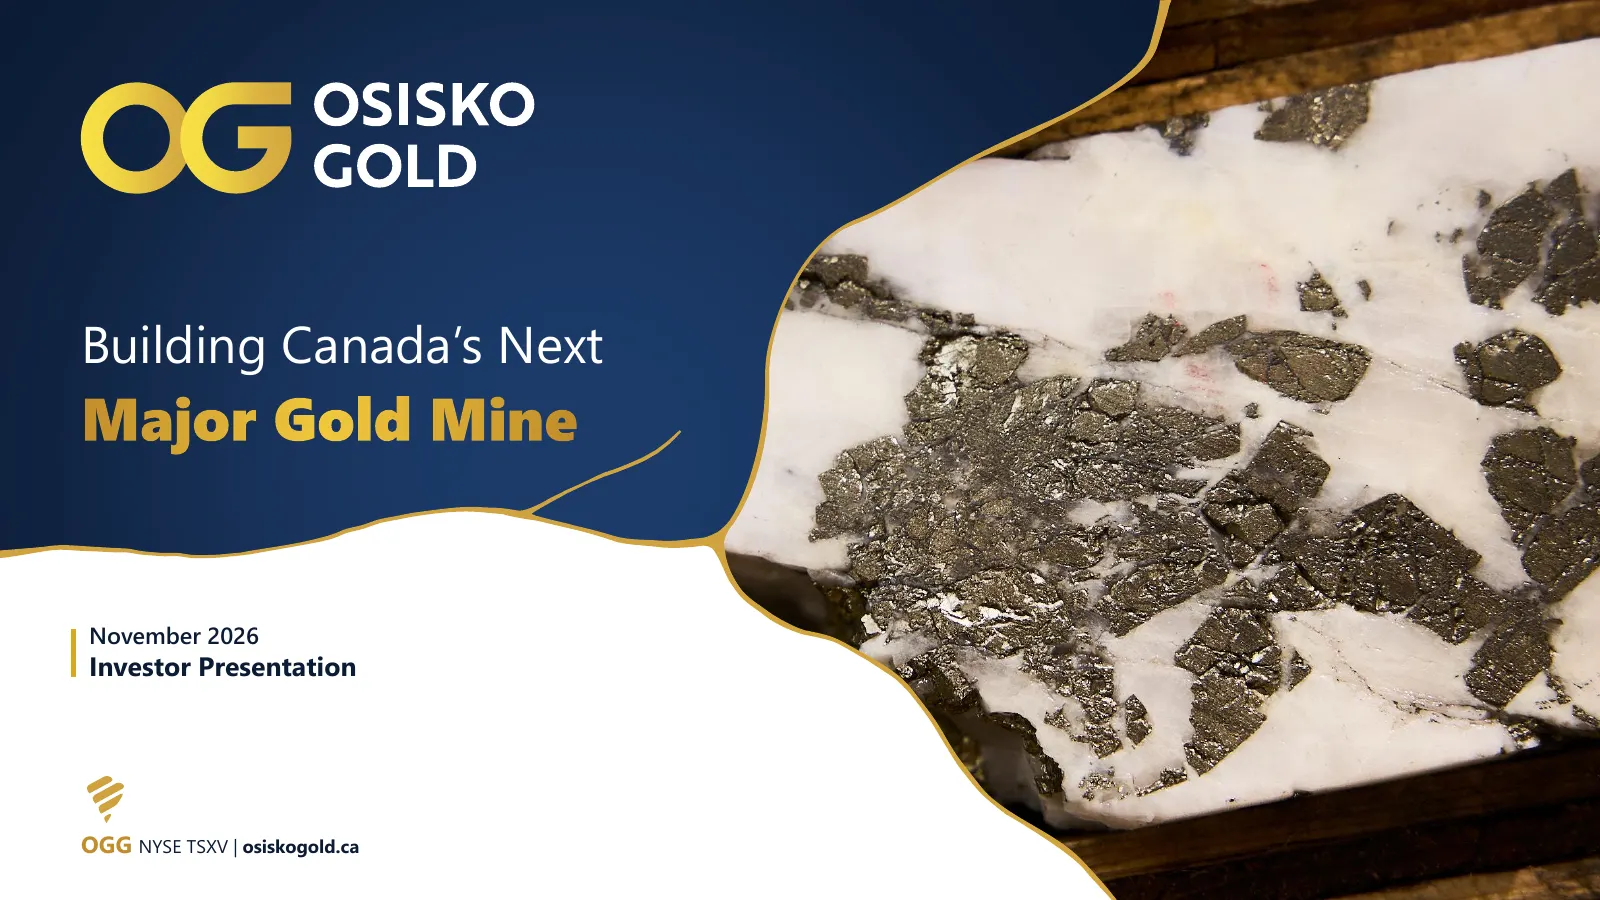
Slide 1: Building Canada's Next Major Gold Mine
Building Canada’s Next Major Gold Mine November 2026 Investor Presentation OGG NYSE TSXV | osiskogold.ca
Slide 2: Cautionary Statements
2 Cautionary Statements CAUTIONARY STATEMENT REGARDING FORWARD-LOOKING INFORMATION that affect Osisko Gold and its business. Certain statements contained in this presentation (this "Presentation") may be deemed "forward-looking statements" within the meaning of the United States Private Such risks a
Slide 3: Cautionary Statements
3 Cautionary Statements CAUTIONARY NOTE TO U.S. INVESTORS ACCURACY AND RELIABILITY OF MARKET, INDUSTRY AND THIRD-PARTY INFORMATION As a foreign private issuer under U.S. securities laws that files reports under the Canada-U.S. multijurisdictional disclosure system, the Company is permitted to Certai
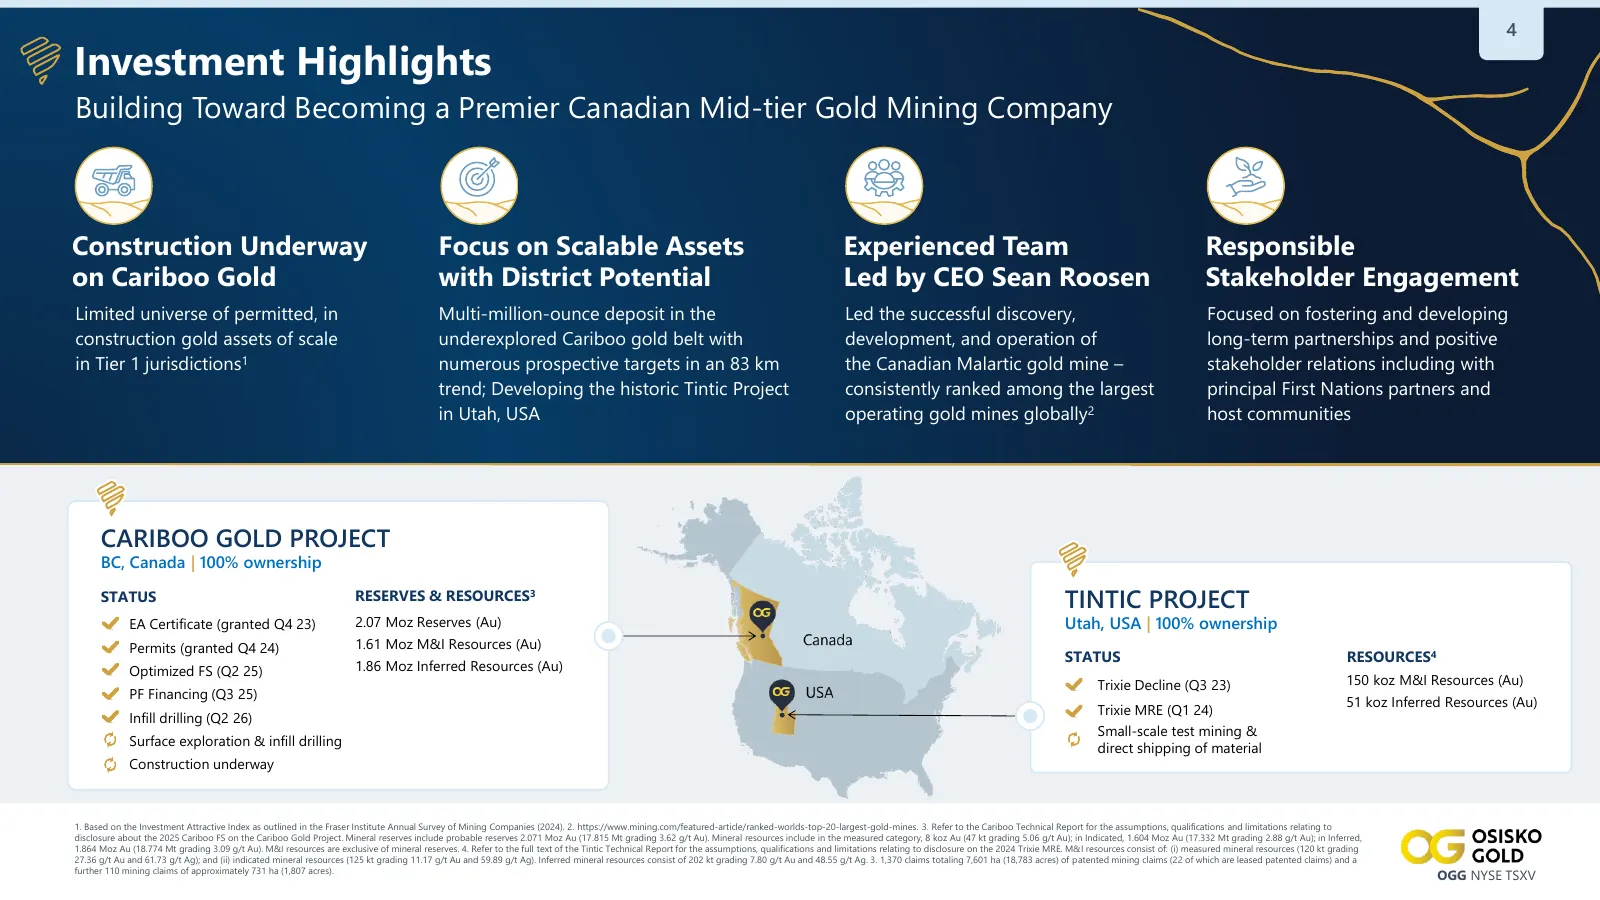
Slide 4: Investment Highlights
4 Investment Highlights Building Toward Becoming a Premier Canadian Mid-tier Gold Mining Company Construction Underway Focus on Scalable Assets Experienced Team Responsible on Cariboo Gold with District Potential Led by CEO Sean Roosen Stakeholder Engagement Limited universe of permitted, in Multi-m
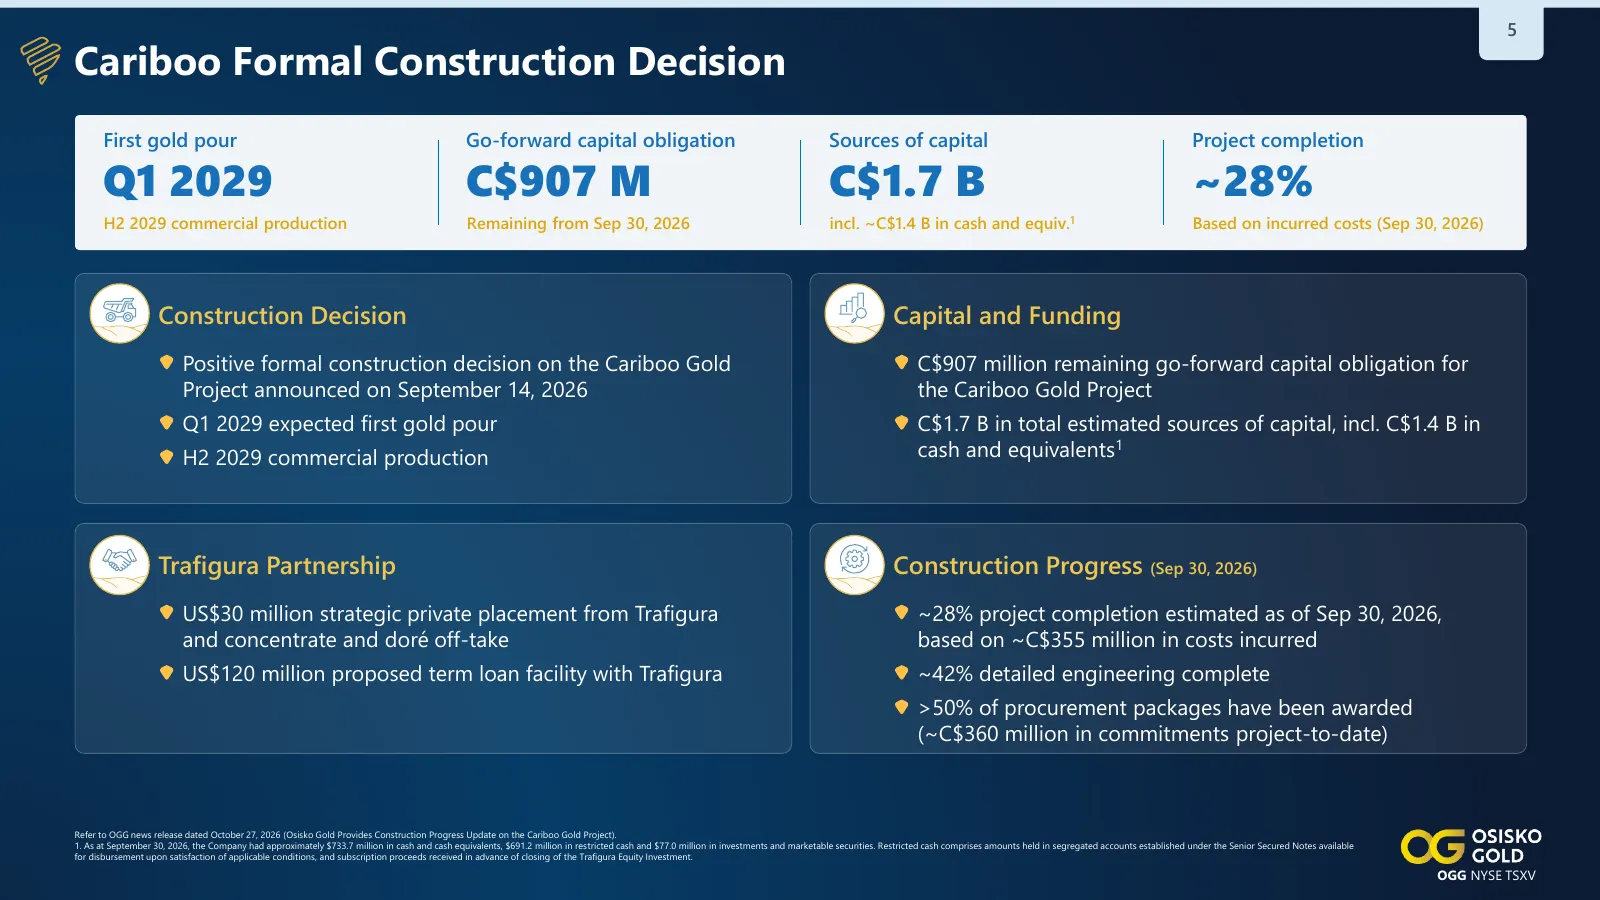
Slide 5: Cariboo Formal Construction Decision
5 Cariboo Formal Construction Decision First gold pour Go-forward capital obligation Sources of capital Project completion Q1 2029 C$907 M C$1.7 B ~28% H2 2029 commercial production Remaining from Sep 30, 2026 incl. ~C$1.4 B in cash and equiv.1 Based on incurred costs (Sep 30, 2026) 1 Construction D
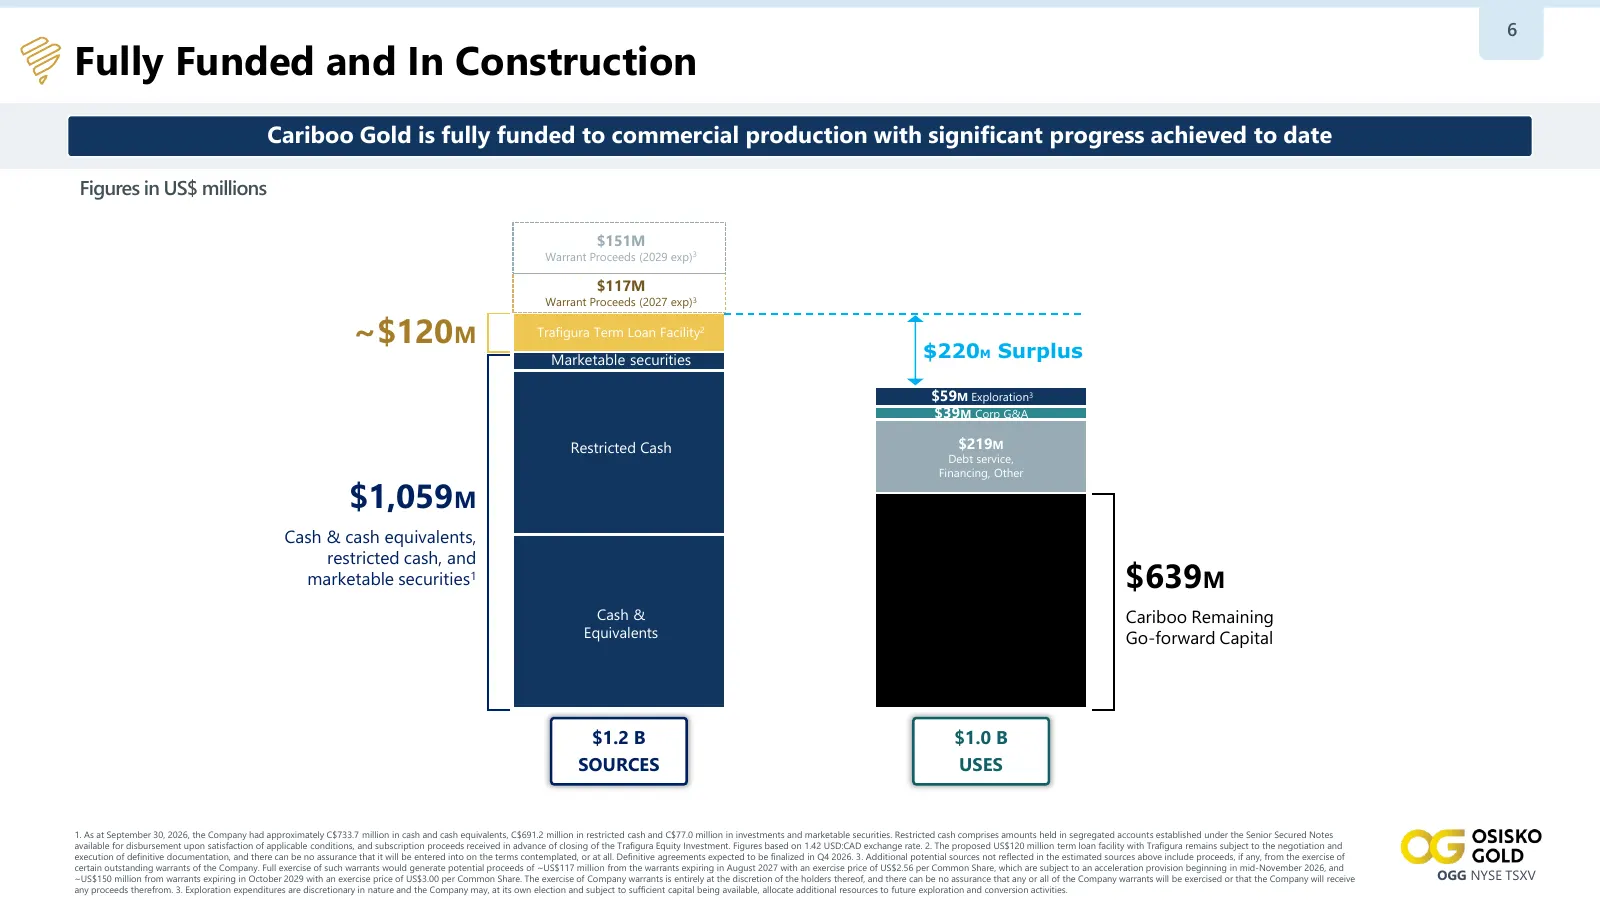
Slide 6: Fully Funded and In Construction
6 Fully Funded and In Construction Cariboo Gold is fully funded to commercial production with significant progress achieved to date Figures in US$ millions $151M Warrant Proceeds (2029 exp)3 $117M Warrant Proceeds (2027 exp)3 ~$120M Trafigura Term Loan Facility2 $220M Surplus Marketable securities $
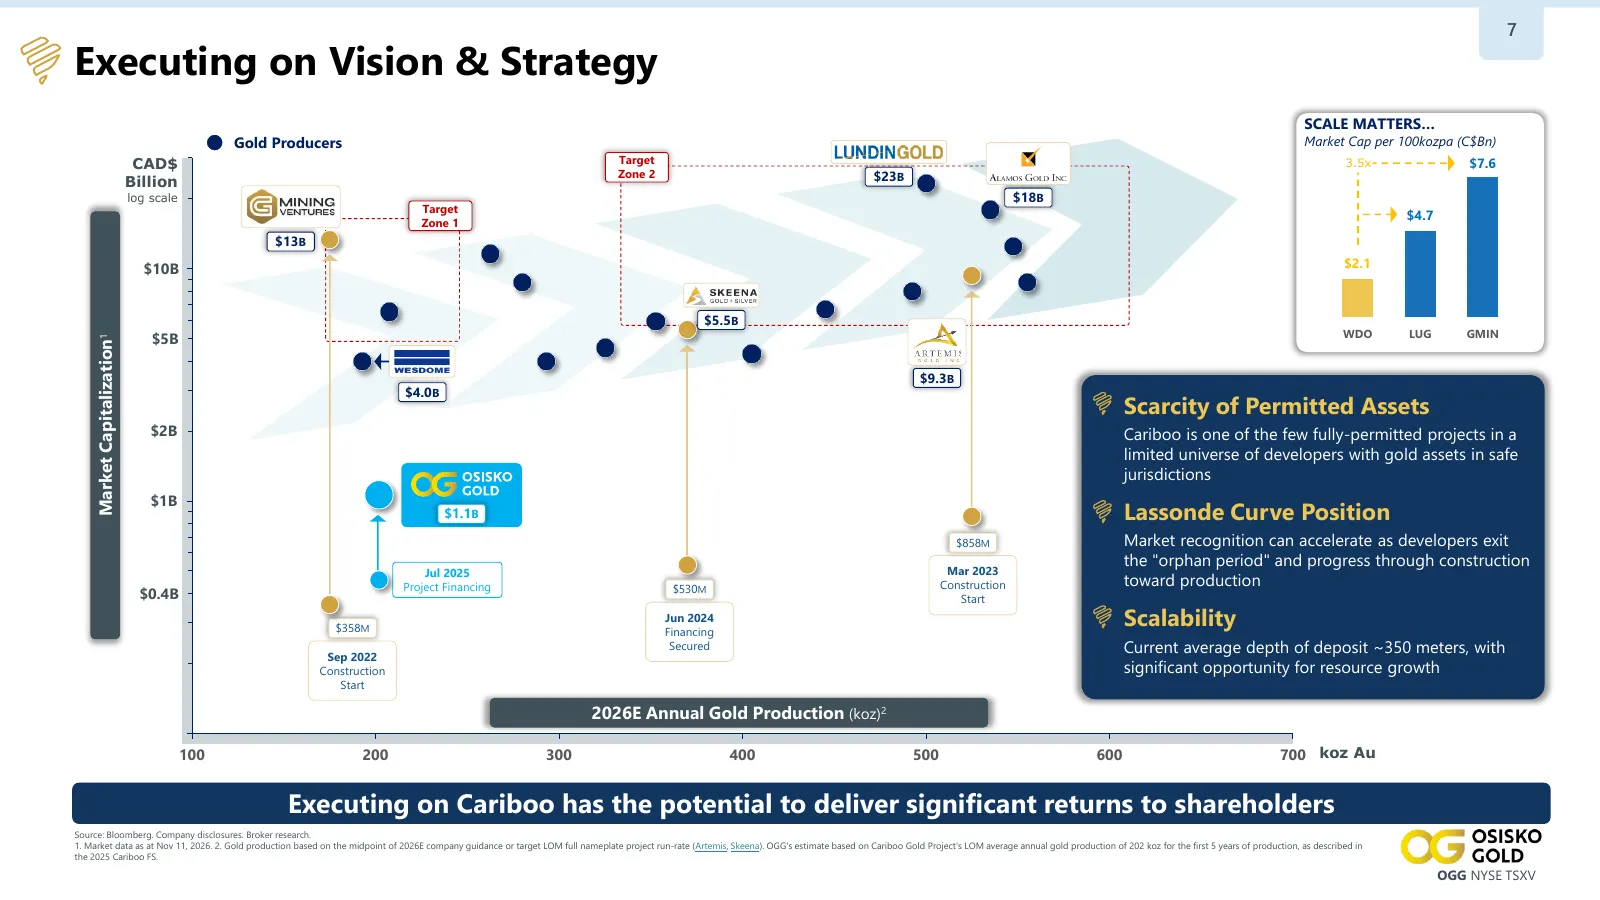
Slide 7: Executing on Vision & Strategy
7 Executing on Vision & Strategy SCALE MATTERS… Gold Producers Market Cap per 100kozpa (C$Bn) CAD$ Target 3.5x $7.6 Zone 2 $23B Billion log scale $18B Target Zone 1 $4.7 $13B $10B $2.1 $5.5B WDO LUG GMIN $5B Market Capitalization1 $9.3B $4.0B Scarcity of Permitted Assets $2B Cariboo is one of the fe
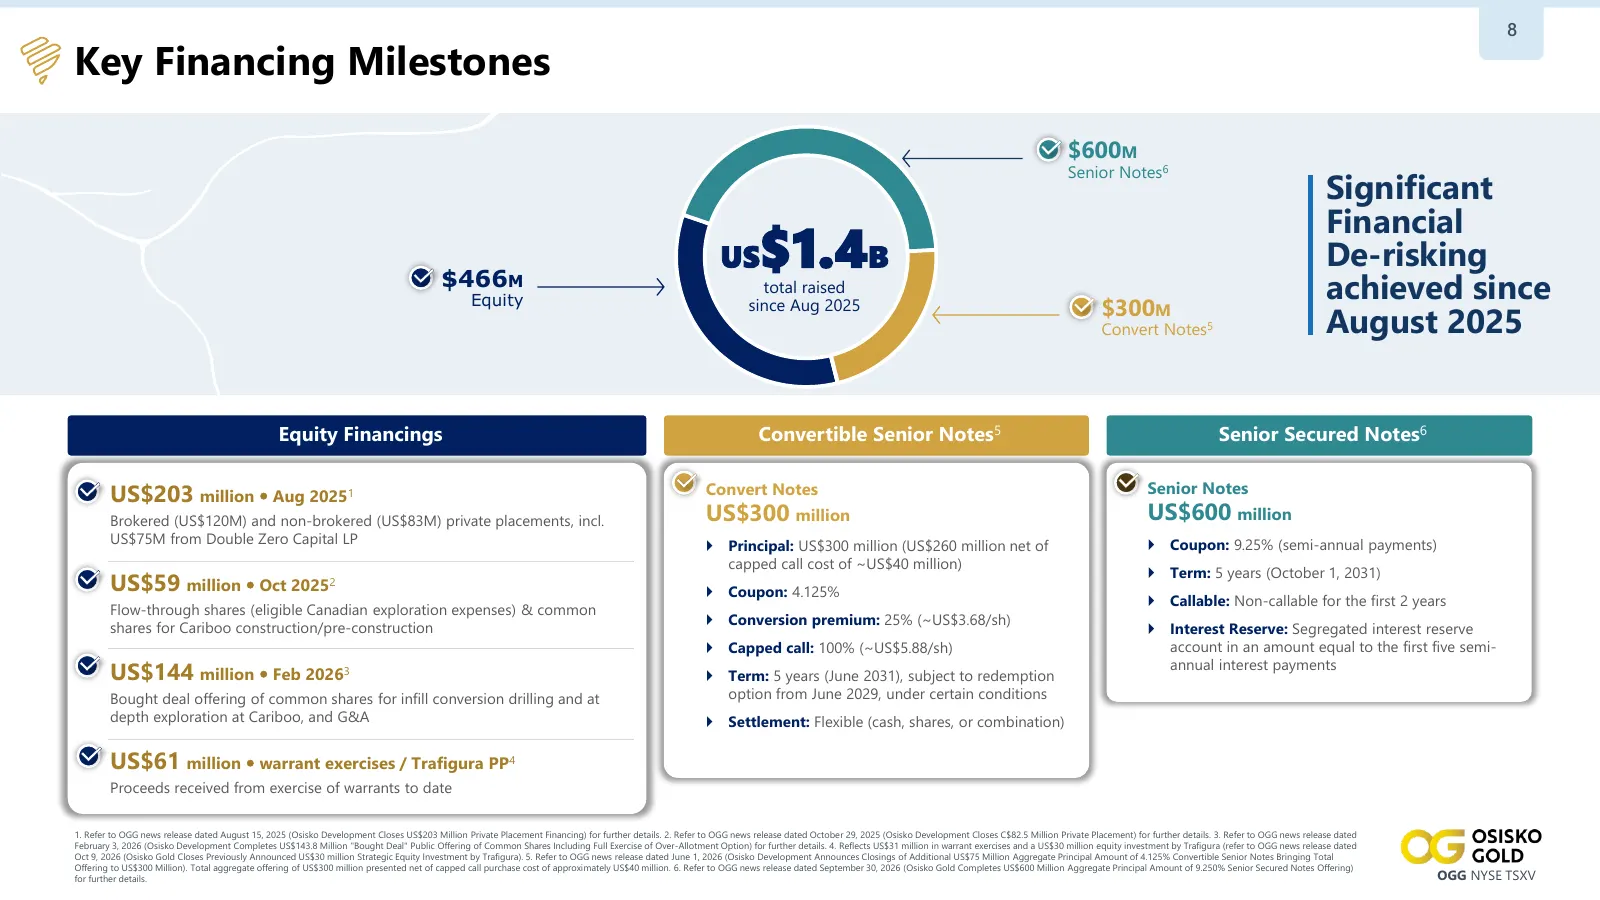
Slide 8: Key Financing Milestones
8 Key Financing Milestones $600M Senior Notes6 Significant Financial US $1.4B De-risking $466M Equity total raised since Aug 2025 $300M achieved since Convert Notes5 August 2025 Equity Financings Convertible Senior Notes5 Senior Secured Notes6 US$203 million Aug 20251 Convert Notes Senior Notes Br
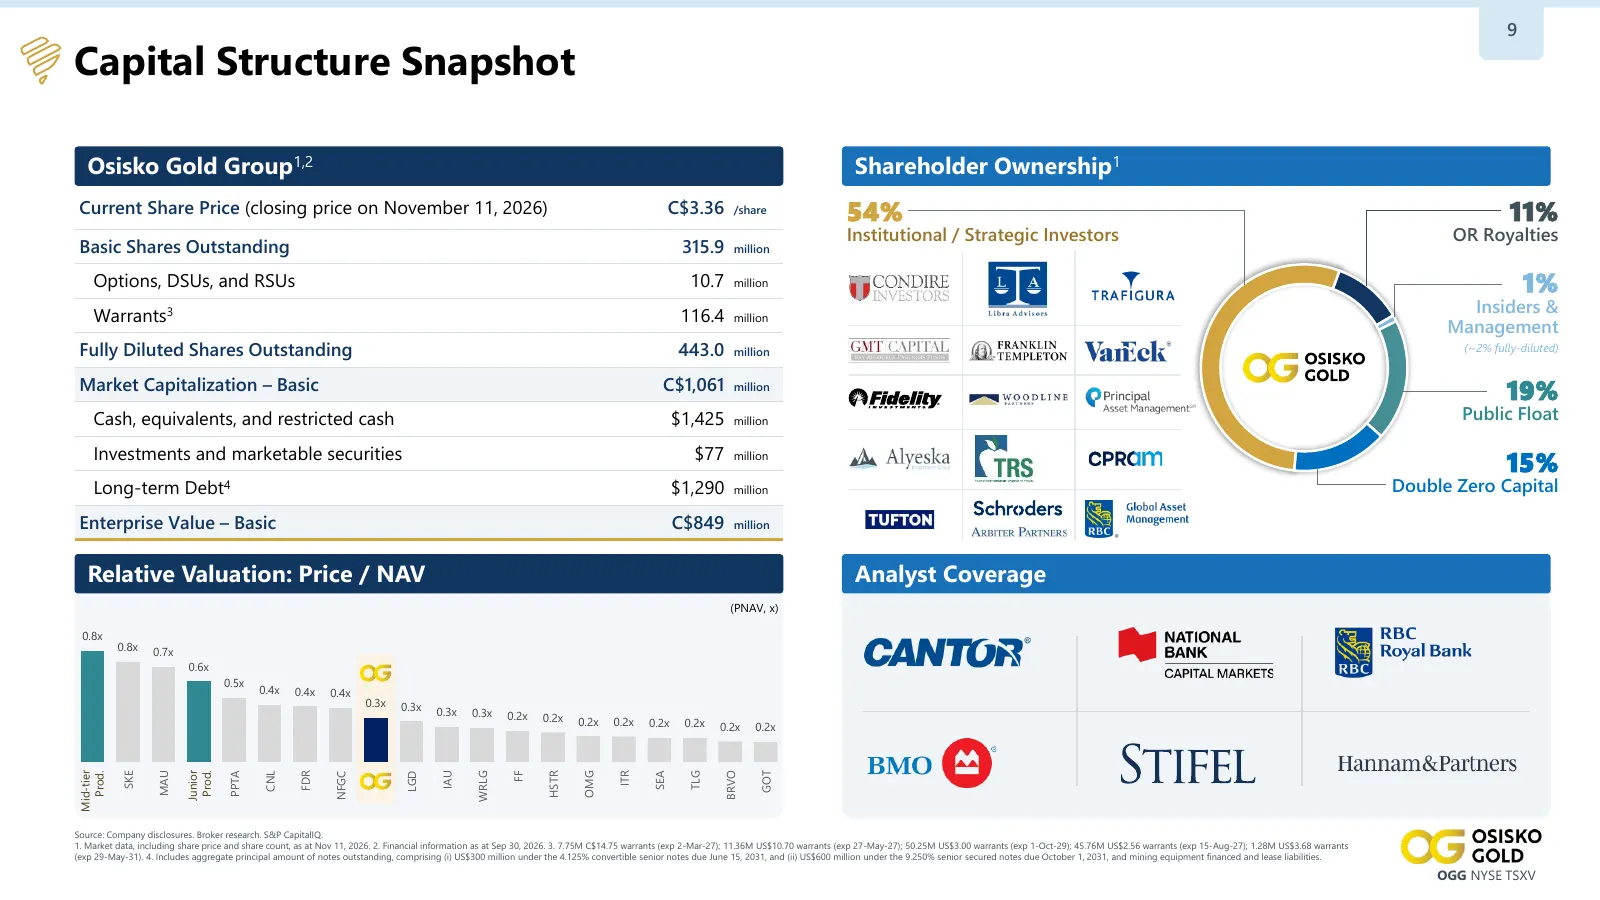
Slide 9: Capital Structure Snapshot
9 Capital Structure Snapshot Osisko Gold Group1,2 Shareholder Ownership1 Current Share Price (closing price on November 11, 2026) C$3.36 /share 54% 11% Institutional / Strategic Investors OR Royalties Basic Shares Outstanding 315.9 million Options, DSUs, and RSUs 10.7 million 1% Warrants3 116.4 mill
Slide 10: Cariboo Gold Project
10 Cariboo Gold Project British Columbia, Canada 100% Ownership WATCH VIDEO VIRTUAL TOUR VIRTUAL TOUR WATCH VIDEO OGG NYSE TSXV | osiskogold.ca
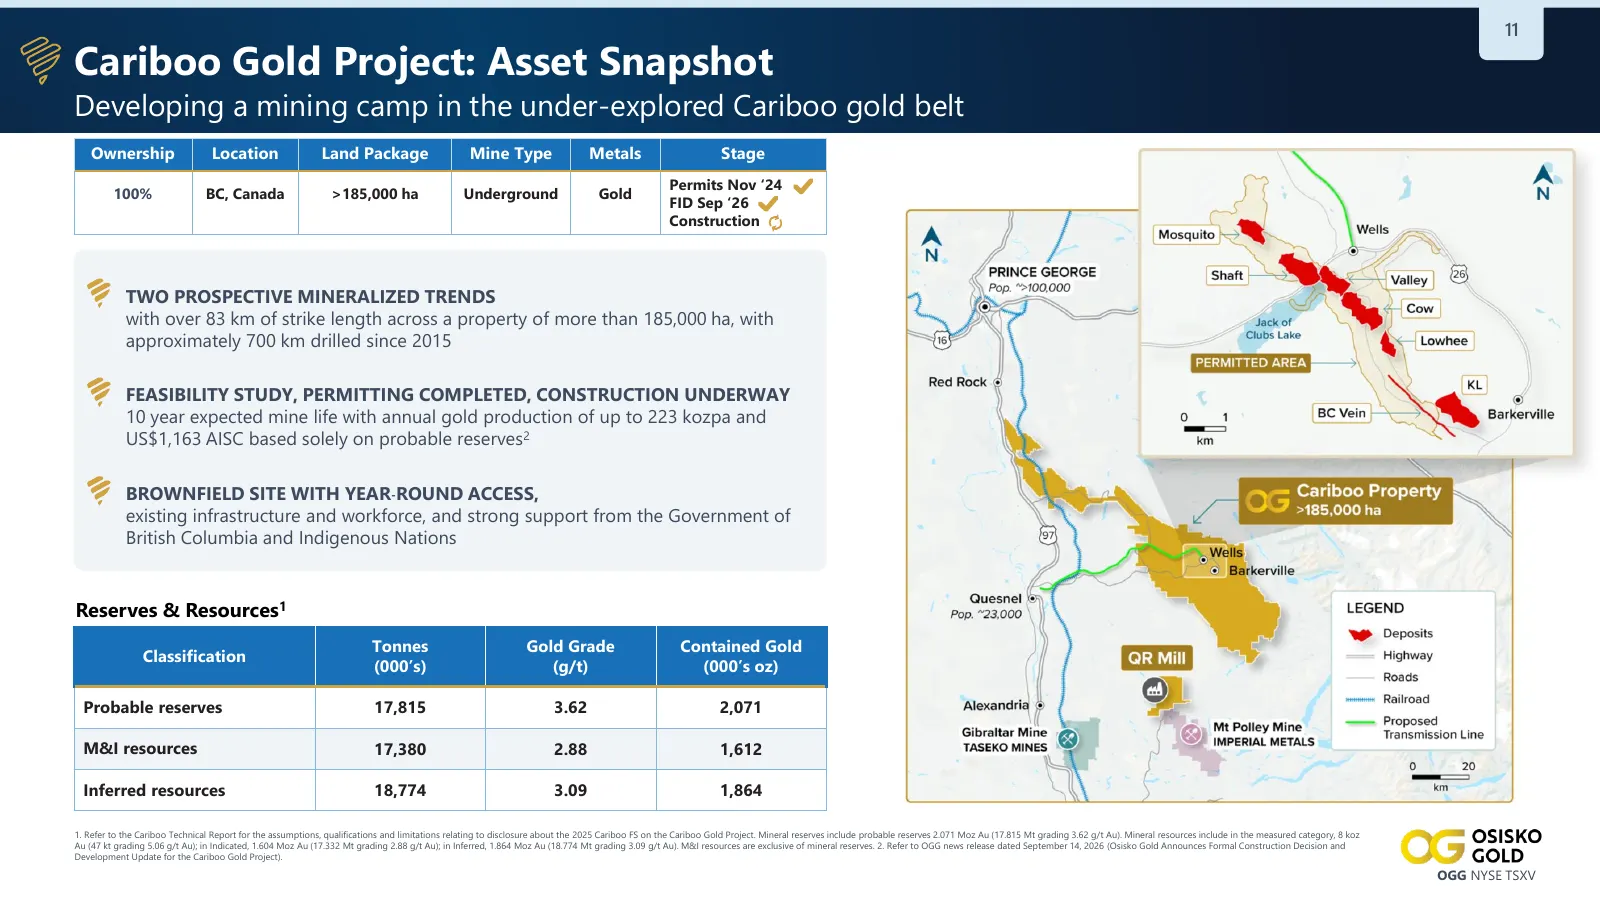
Slide 11: Cariboo Gold Project: Asset Snapshot
11 Cariboo Gold Project: Asset Snapshot Developing a mining camp in the under-explored Cariboo gold belt Ownership Location Land Package Mine Type Metals Stage Permits Nov ‘24 100% BC, Canada >185,000 ha Underground Gold FID Sep ‘26 Construction TWO PROSPECTIVE MINERALIZED TRENDS with over 83 km of
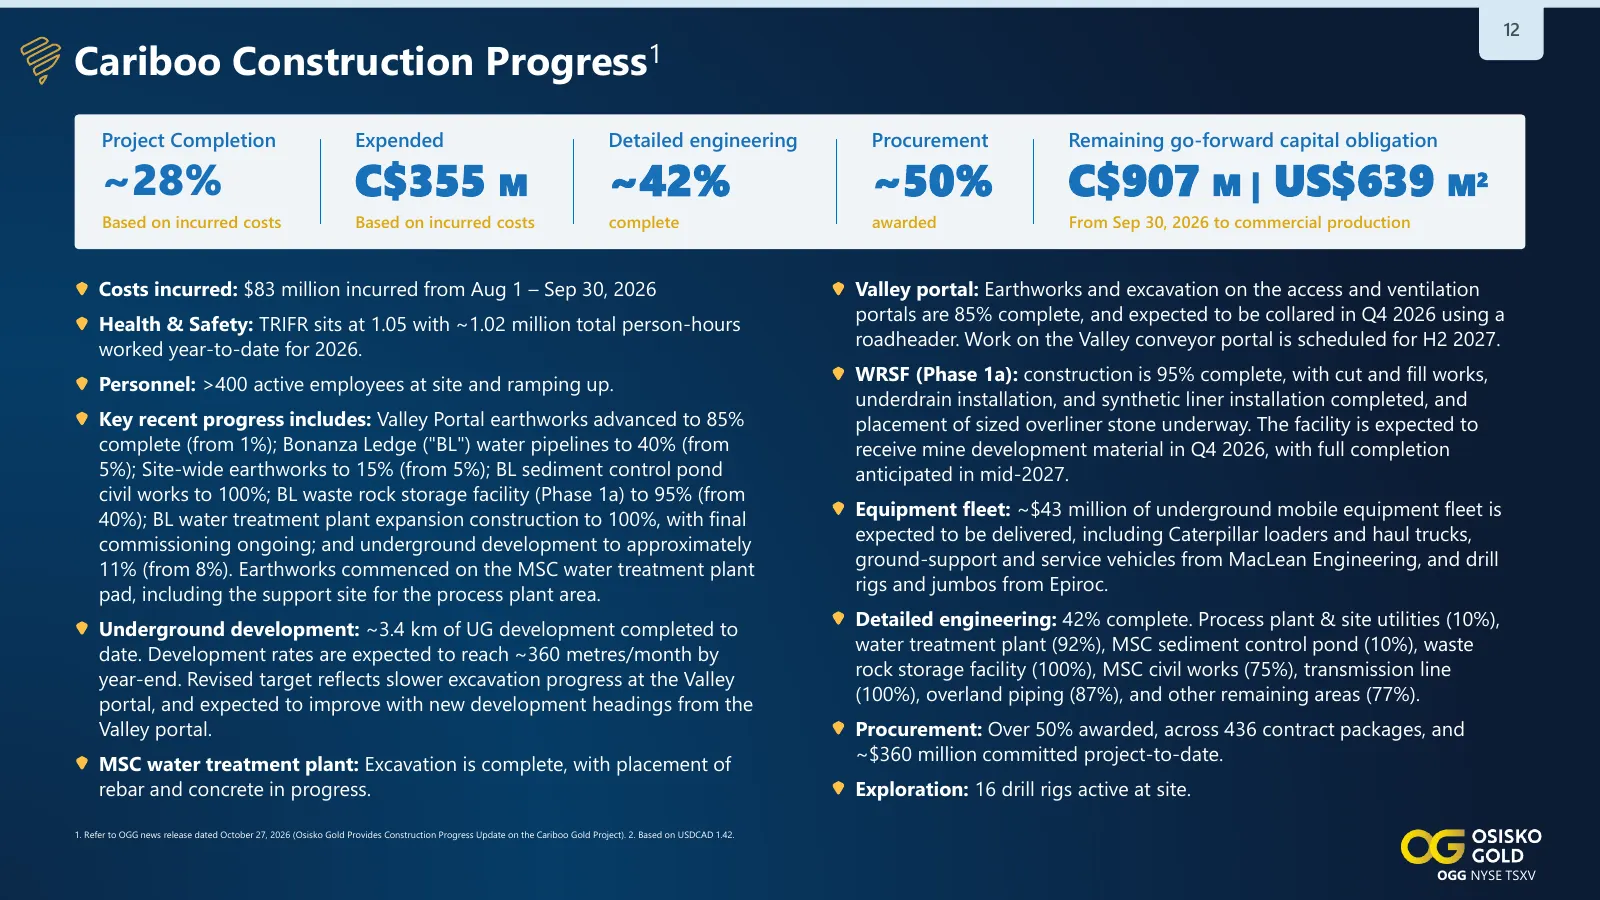
Slide 12: Cariboo Construction Progress
12 Cariboo Construction Progress1 Project Completion Expended Detailed engineering Procurement Remaining go-forward capital obligation ~28% C$355 M ~42% ~50% C$907 M | US$639 M2 Based on incurred costs Based on incurred costs complete awarded From Sep 30, 2026 to commercial production Costs incurred
Slide 13: Project Regional Setting
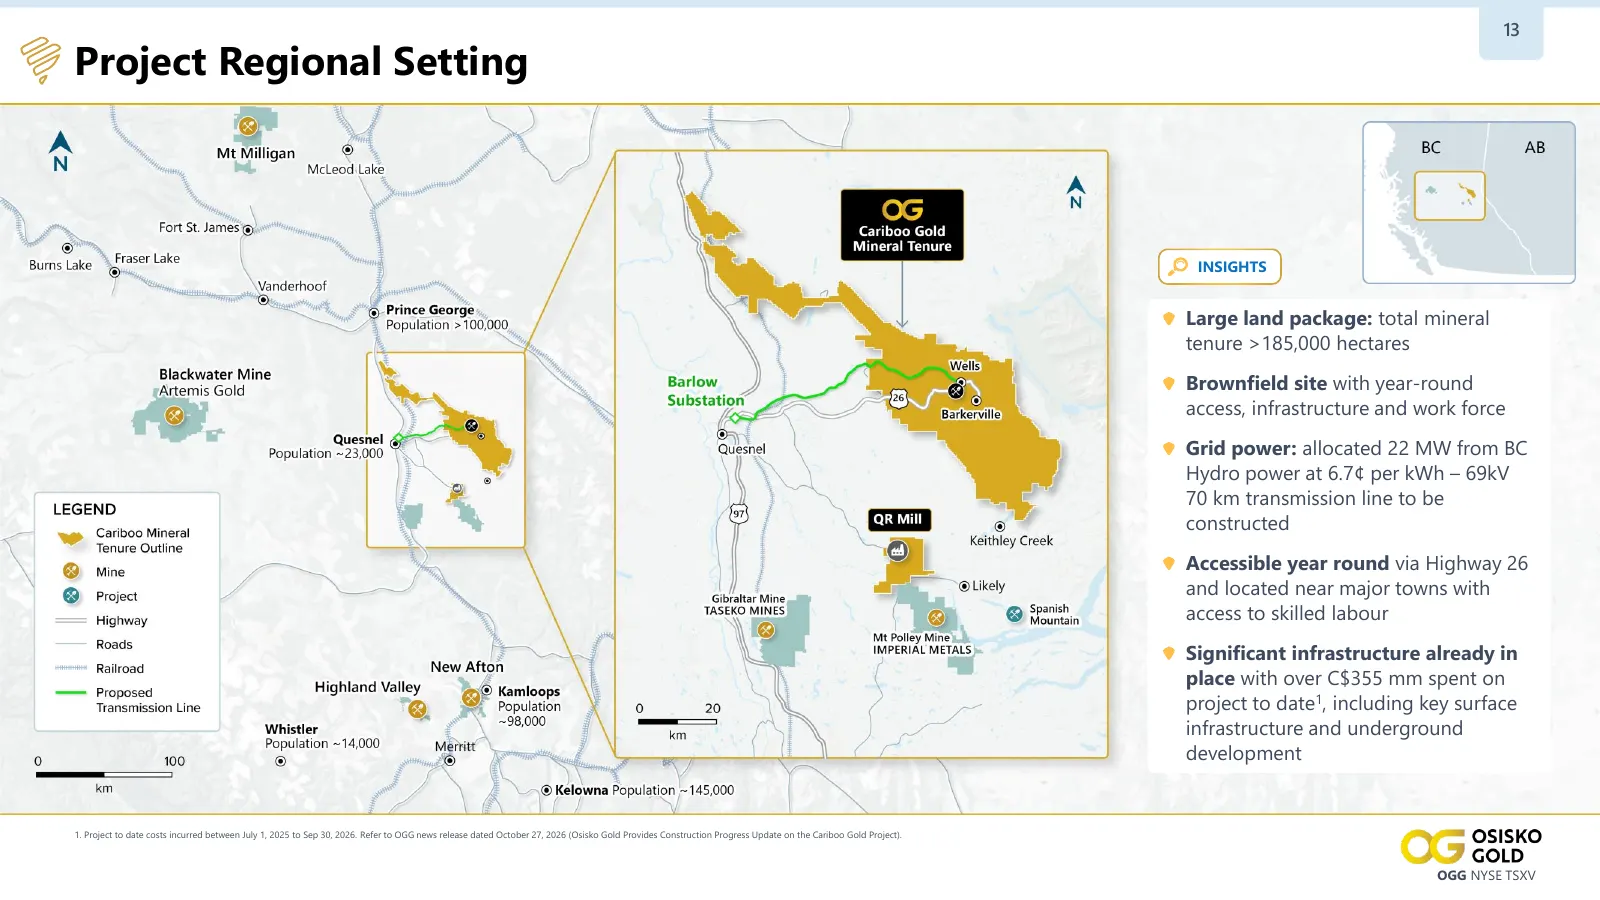
13 Project Regional Setting INSIGHTS Large land package: total mineral tenure >185,000 hectares Brownfield site with year-round access, infrastructure and work force Grid power: allocated 22 MW from BC Hydro power at 6.7¢ per kWh – 69kV 70 km transmission line to be constructed Accessible year round
Slide 14: 2026 Go-forward Capital Update
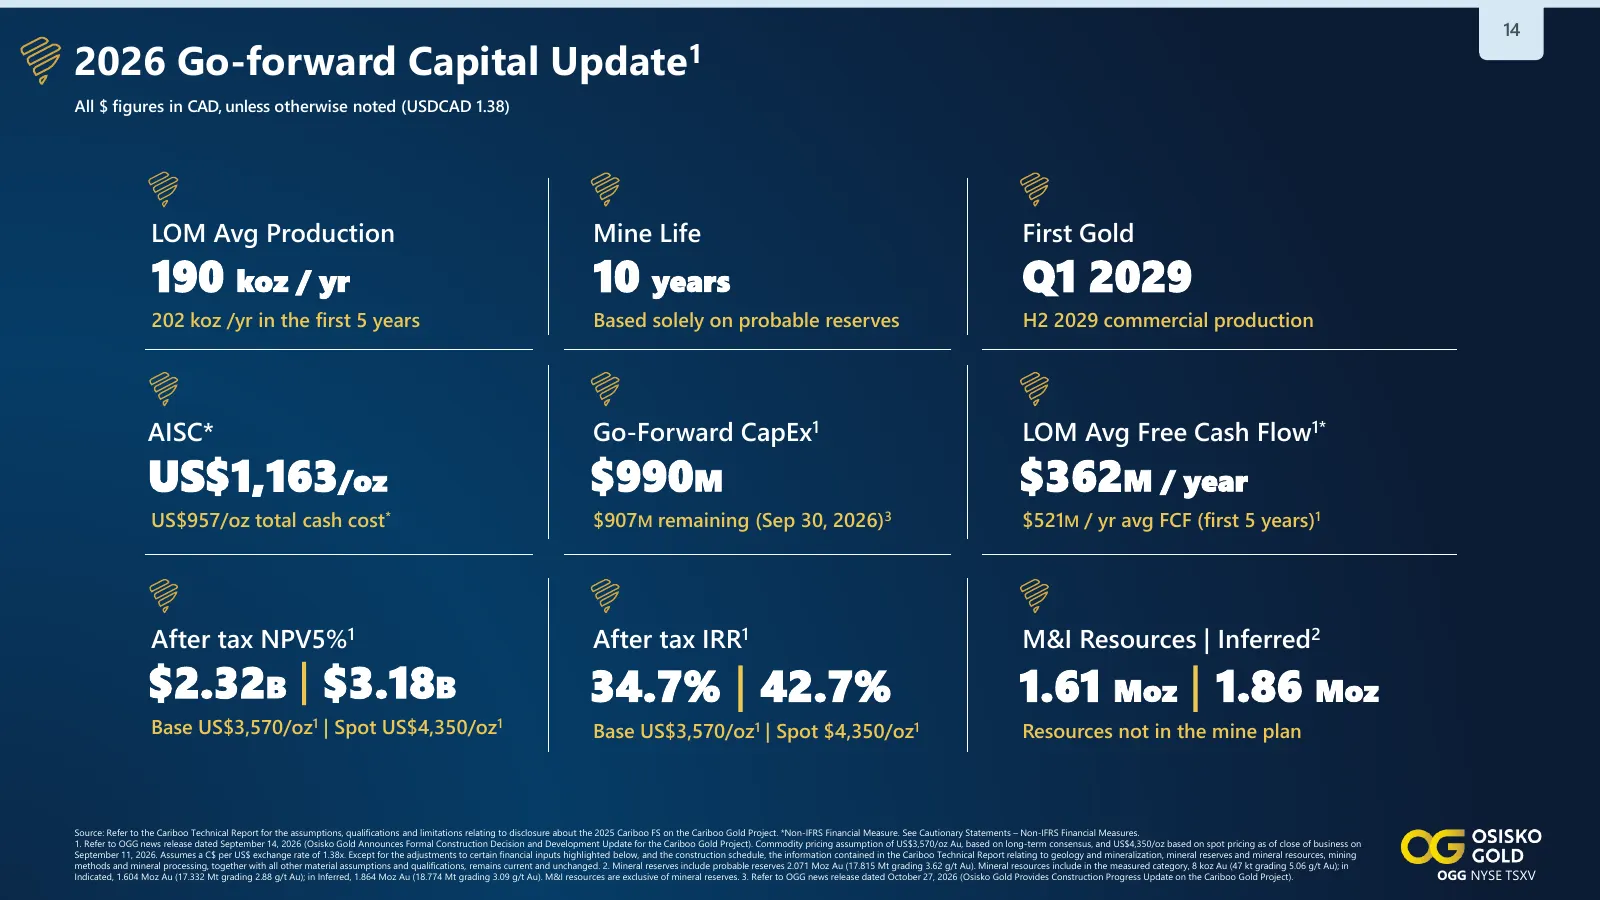
14 2026 Go-forward Capital Update1 All $ figures in CAD, unless otherwise noted (USDCAD 1.38) LOM Avg Production Mine Life First Gold 190 koz / yr 10 years Q1 2029 202 koz /yr in the first 5 years Based solely on probable reserves H2 2029 commercial production AISC* Go-Forward CapEx1 LOM Avg Free Ca
Slide 15: Cariboo Path to Commercial Production
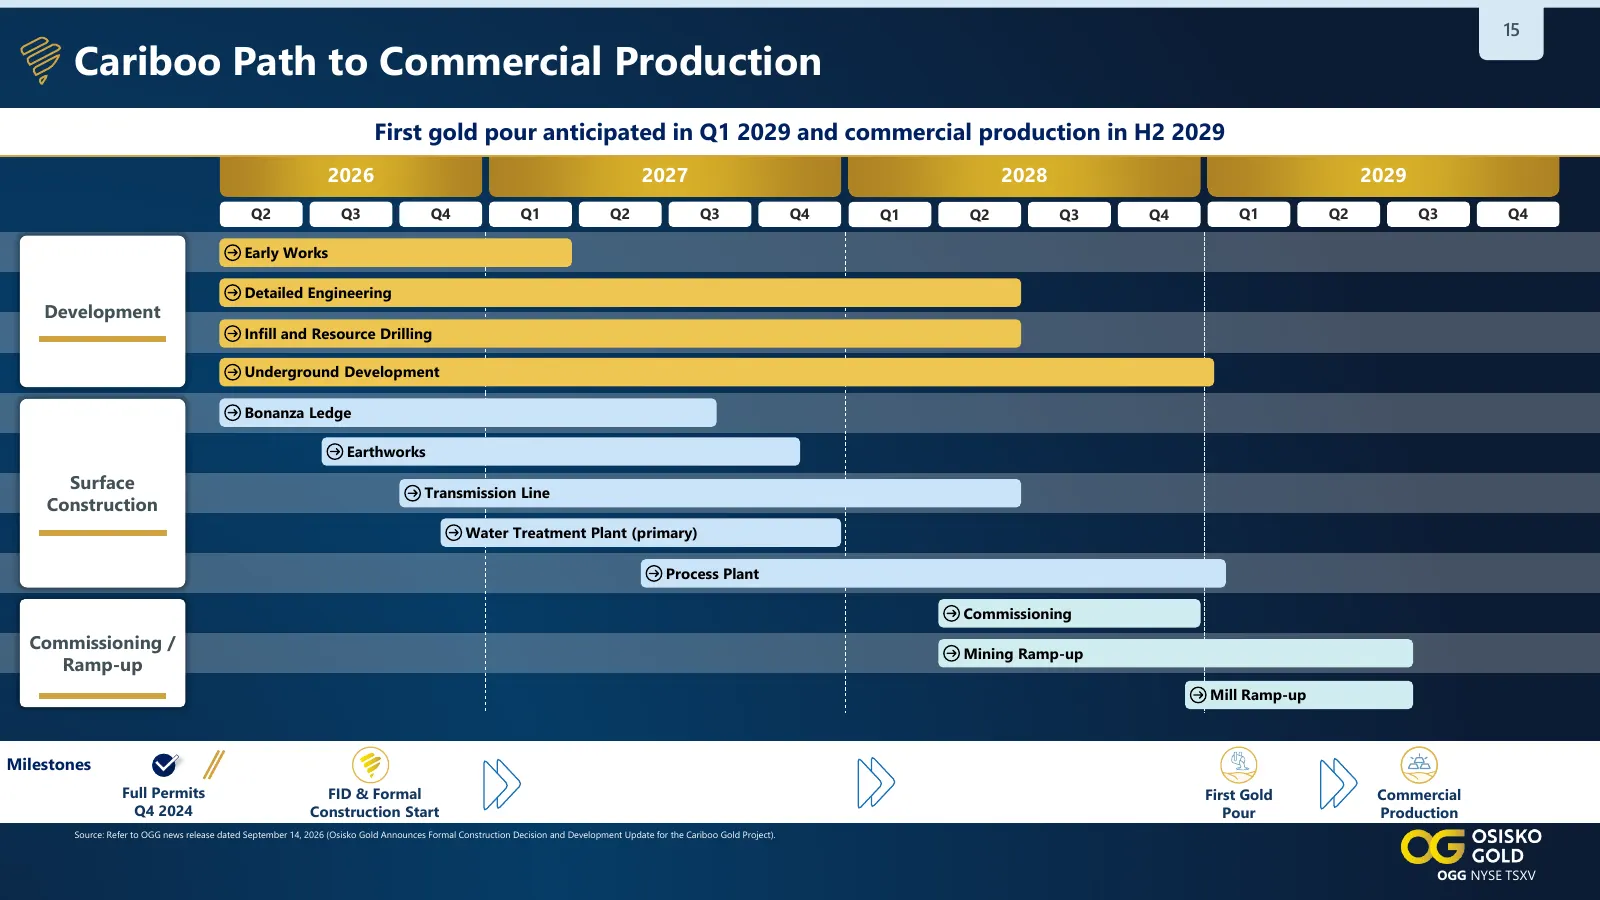
15 Cariboo Path to Commercial Production First gold pour anticipated in Q1 2029 and commercial production in H2 2029 2026 2027 2028 2029 Q2 Q3 Q4 Q1 Q2 Q3 Q4 Q1 Q2 Q3 Q4 Q1 Q2 Q3 Q4 Early Works Detailed Engineering Development Infill and Resource Drilling Underground Development Bonanza Ledge Earthw
Slide 16: Mine Site Complex – Construction Progress
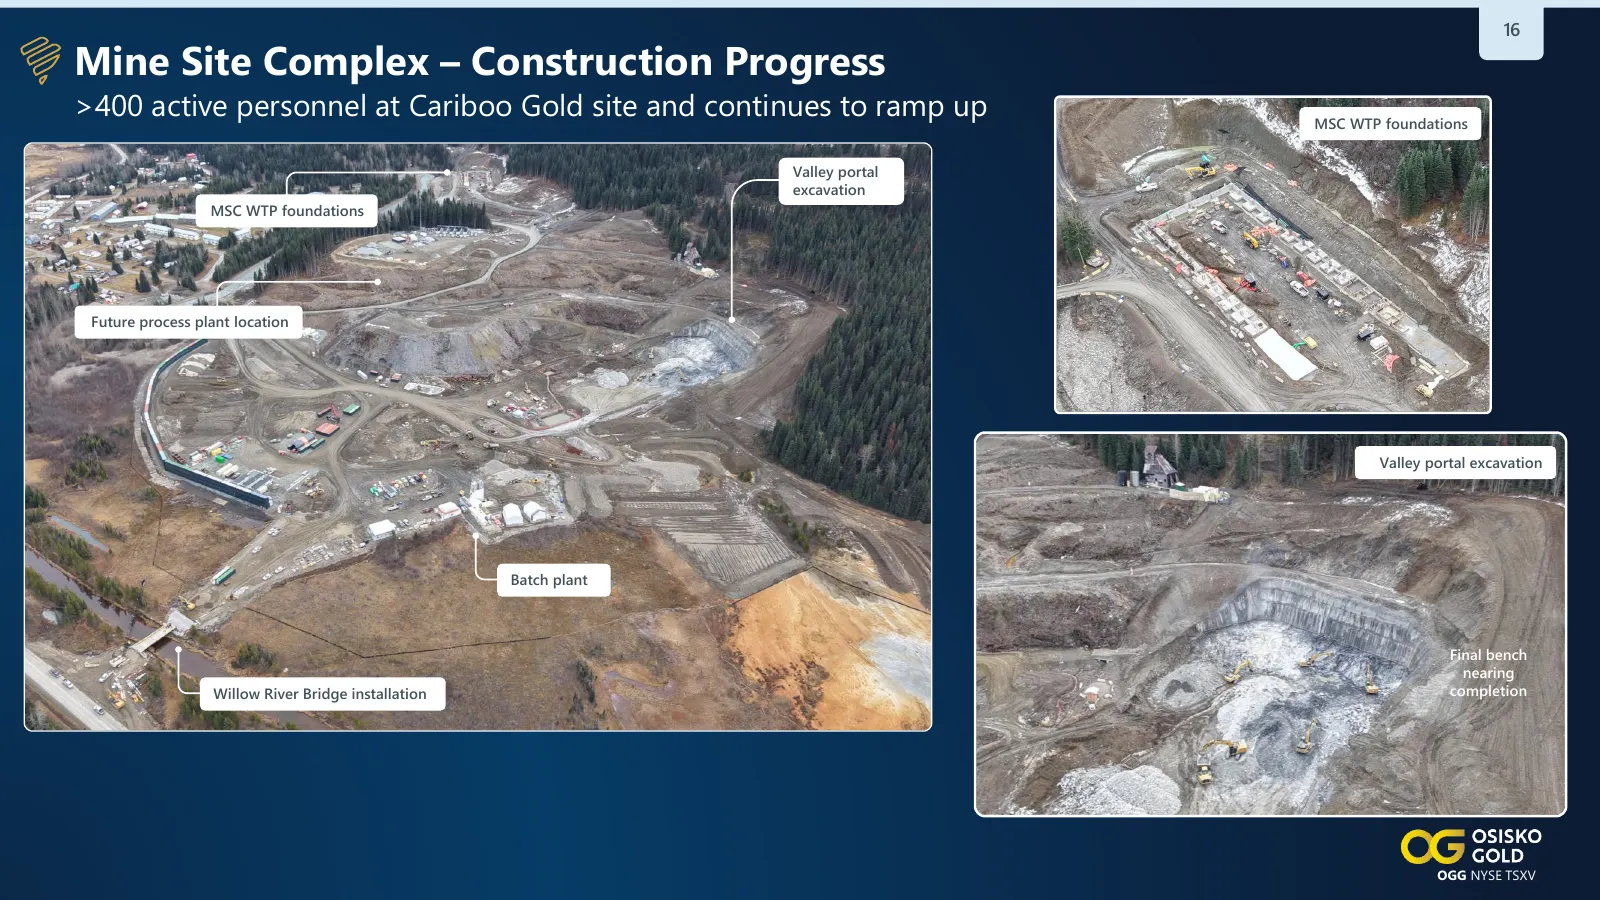
16 Mine Site Complex – Construction Progress >400 active personnel at Cariboo Gold site and continues to ramp up MSC WTP foundations Valley portal excavation MSC WTP foundations Future process plant location Valley portal excavation Batch plant Final bench nearing Willow River Bridge installation co
Slide 17: Bonanza Ledge – Construction Progress
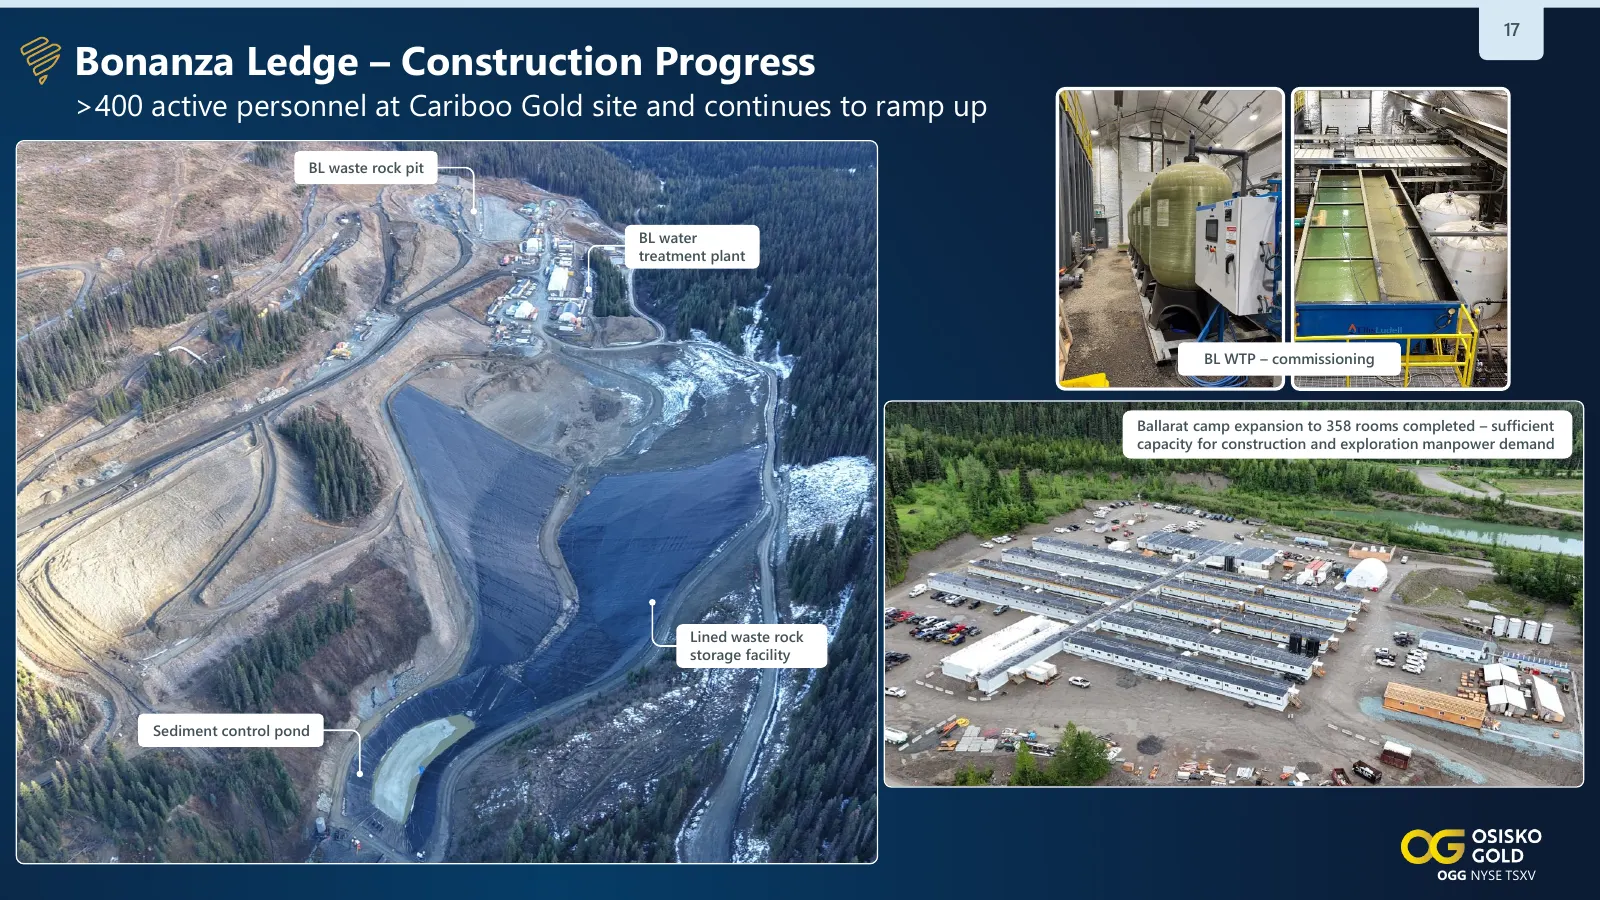
17 Bonanza Ledge – Construction Progress >400 active personnel at Cariboo Gold site and continues to ramp up BL waste rock pit BL water treatment plant BL WTP – commissioning Ballarat camp expansion to 358 rooms completed – sufficient capacity for construction and exploration manpower demand Lined w
Slide 18: Underground Development – Construction Progress
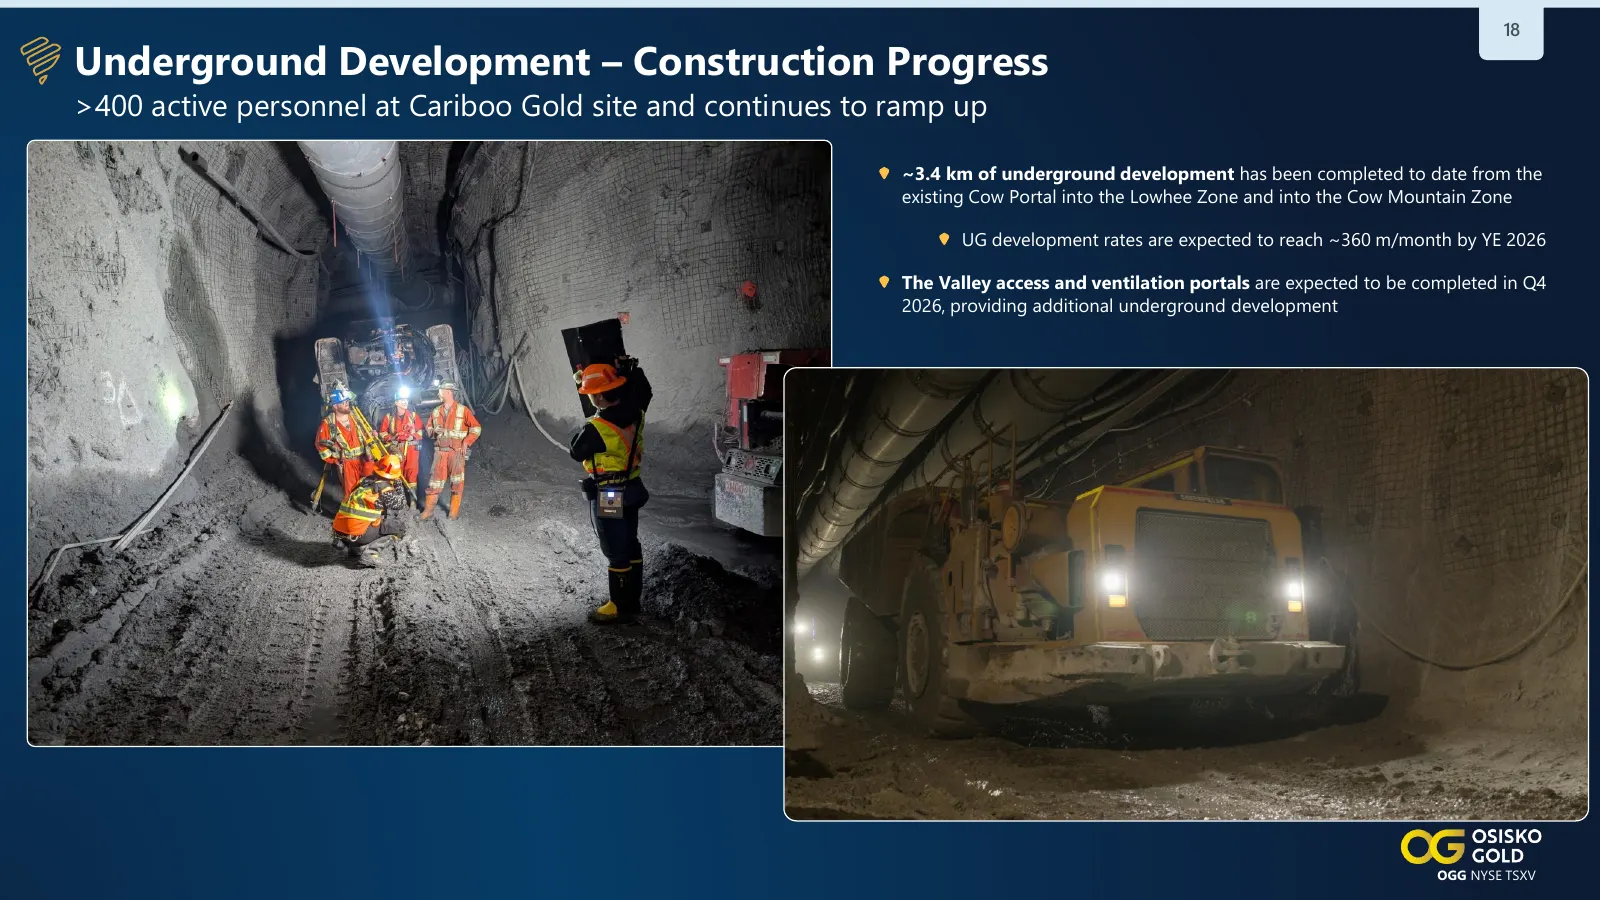
18 Underground Development – Construction Progress >400 active personnel at Cariboo Gold site and continues to ramp up ~3.4 km of underground development has been completed to date from the existing Cow Portal into the Lowhee Zone and into the Cow Mountain Zone UG development rates are expected to r
Slide 19: 2026 go-forward capital update
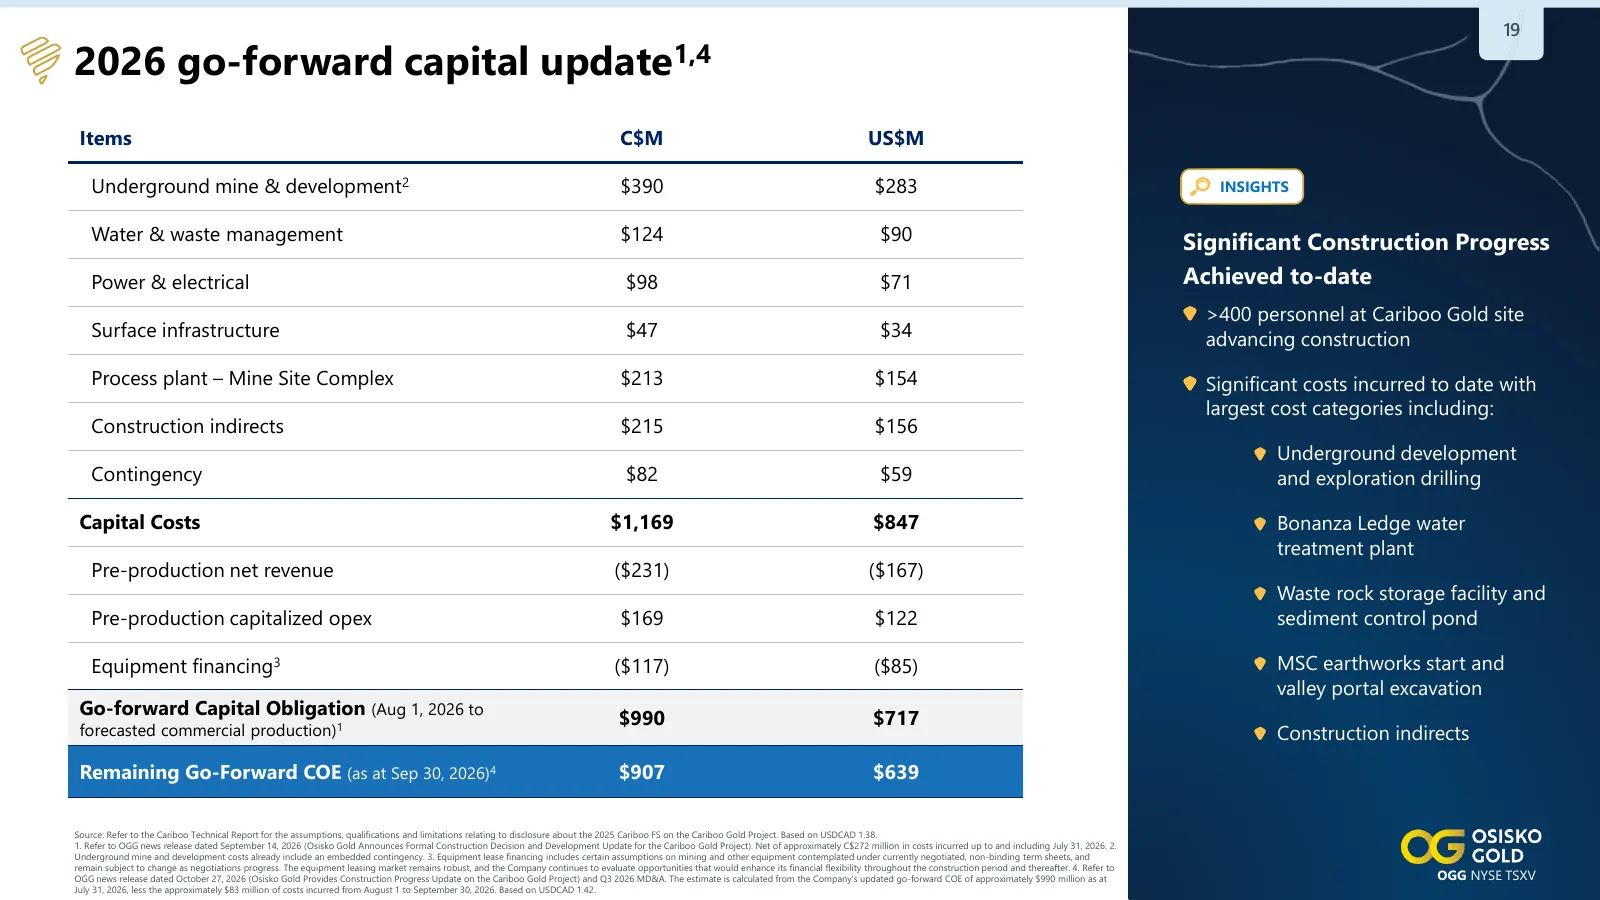
19 2026 go-forward capital update1,4 Items C$M US$M Underground mine & development2 $390 $283 INSIGHTS Water & waste management $124 $90 Significant Construction Progress Power & electrical $98 $71 Achieved to-date >400 personnel at Cariboo Gold site Surface infrastructure $47 $34 advancing construc
Slide 20: 2025 Feasibility Production Profile
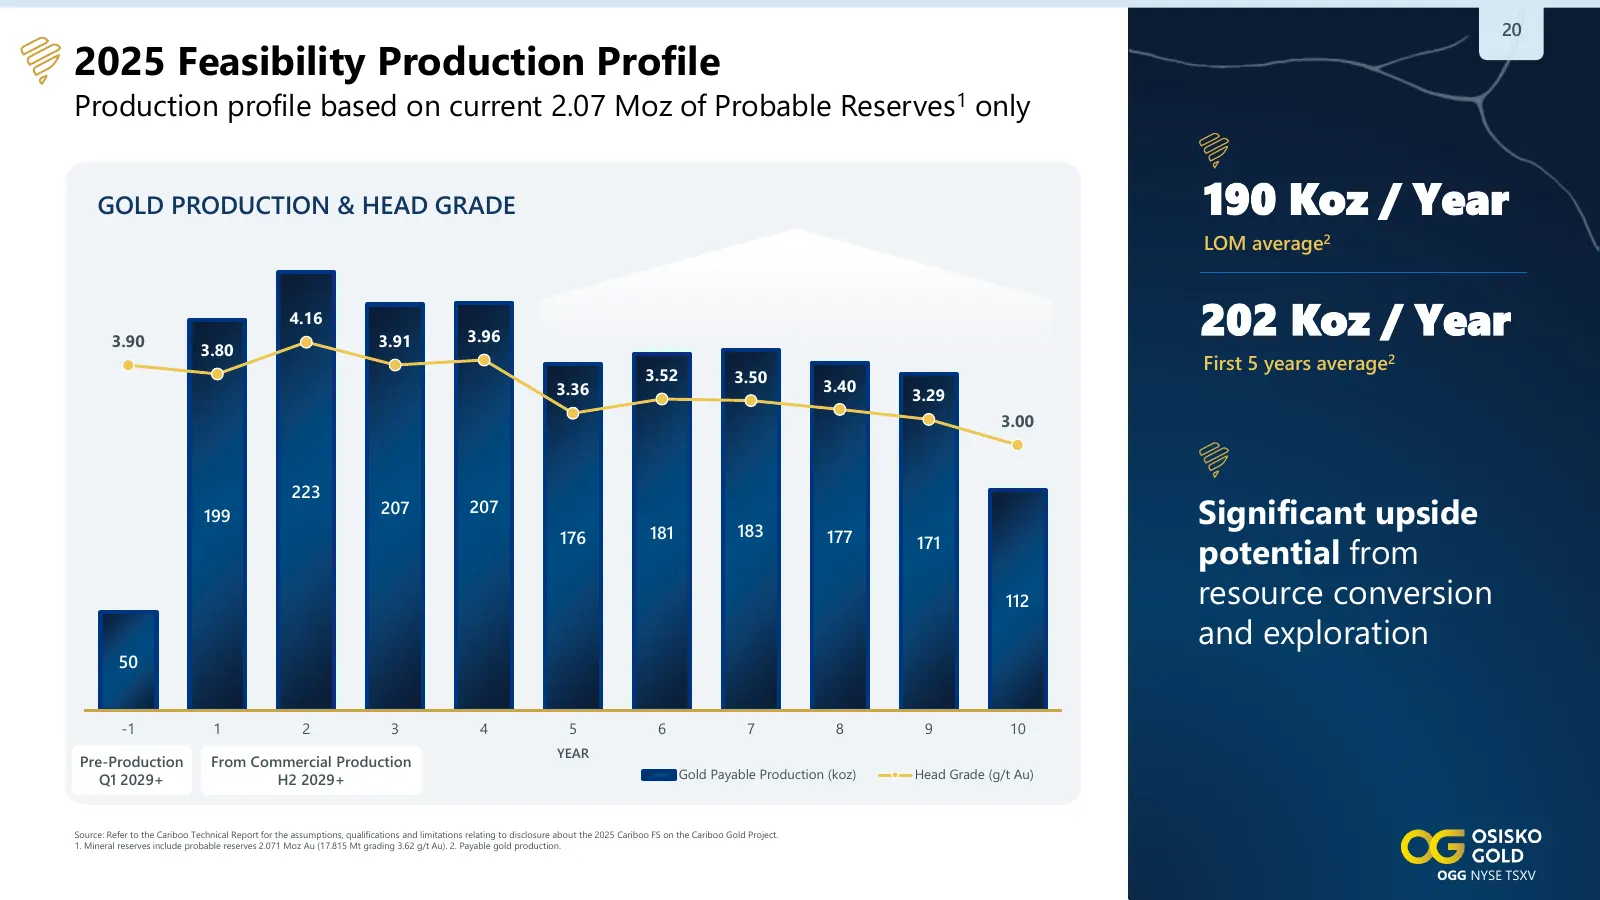
20 2025 Feasibility Production Profile Production profile based on current 2.07 Moz of Probable Reserves1 only GOLD PRODUCTION & HEAD GRADE 190 Koz / Year LOM average2 3.90 3.80 4.16 3.91 3.96 202 Koz / Year First 5 years average2 3.52 3.50 3.36 3.40 3.29 3.00 223 199 207 207 181 183 Significant ups
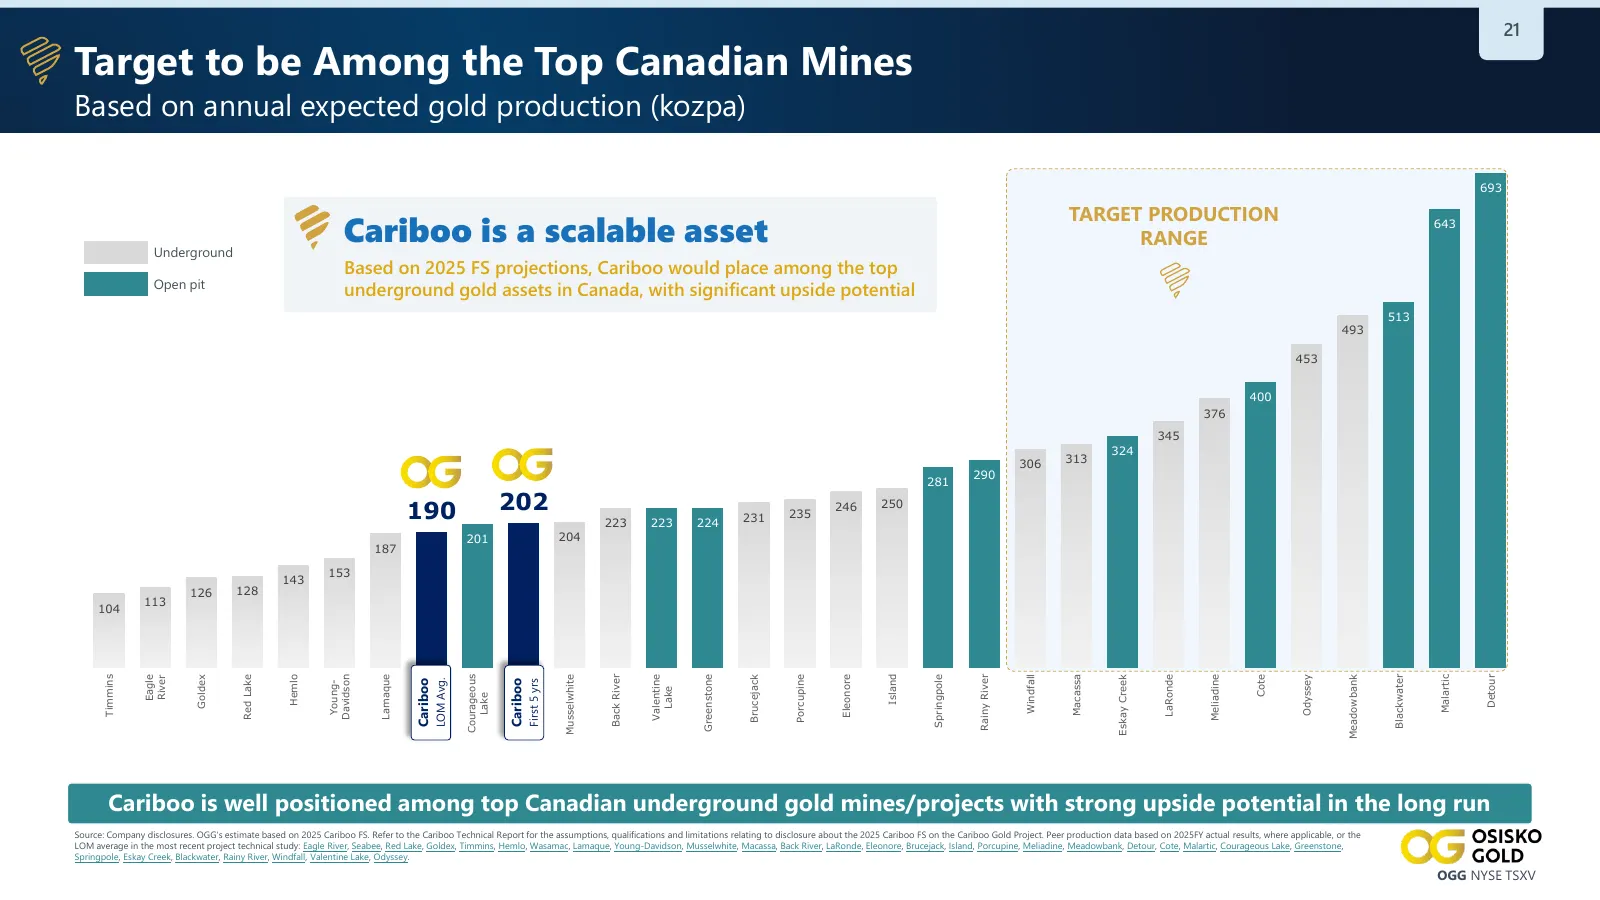
Slide 21: Target to be Among the Top Canadian Mines
21 Target to be Among the Top Canadian Mines Based on annual expected gold production (kozpa) 693 TARGET PRODUCTION Underground Cariboo is a scalable asset RANGE 643 Based on 2025 FS projections, Cariboo would place among the top Open pit underground gold assets in Canada, with significant upside po
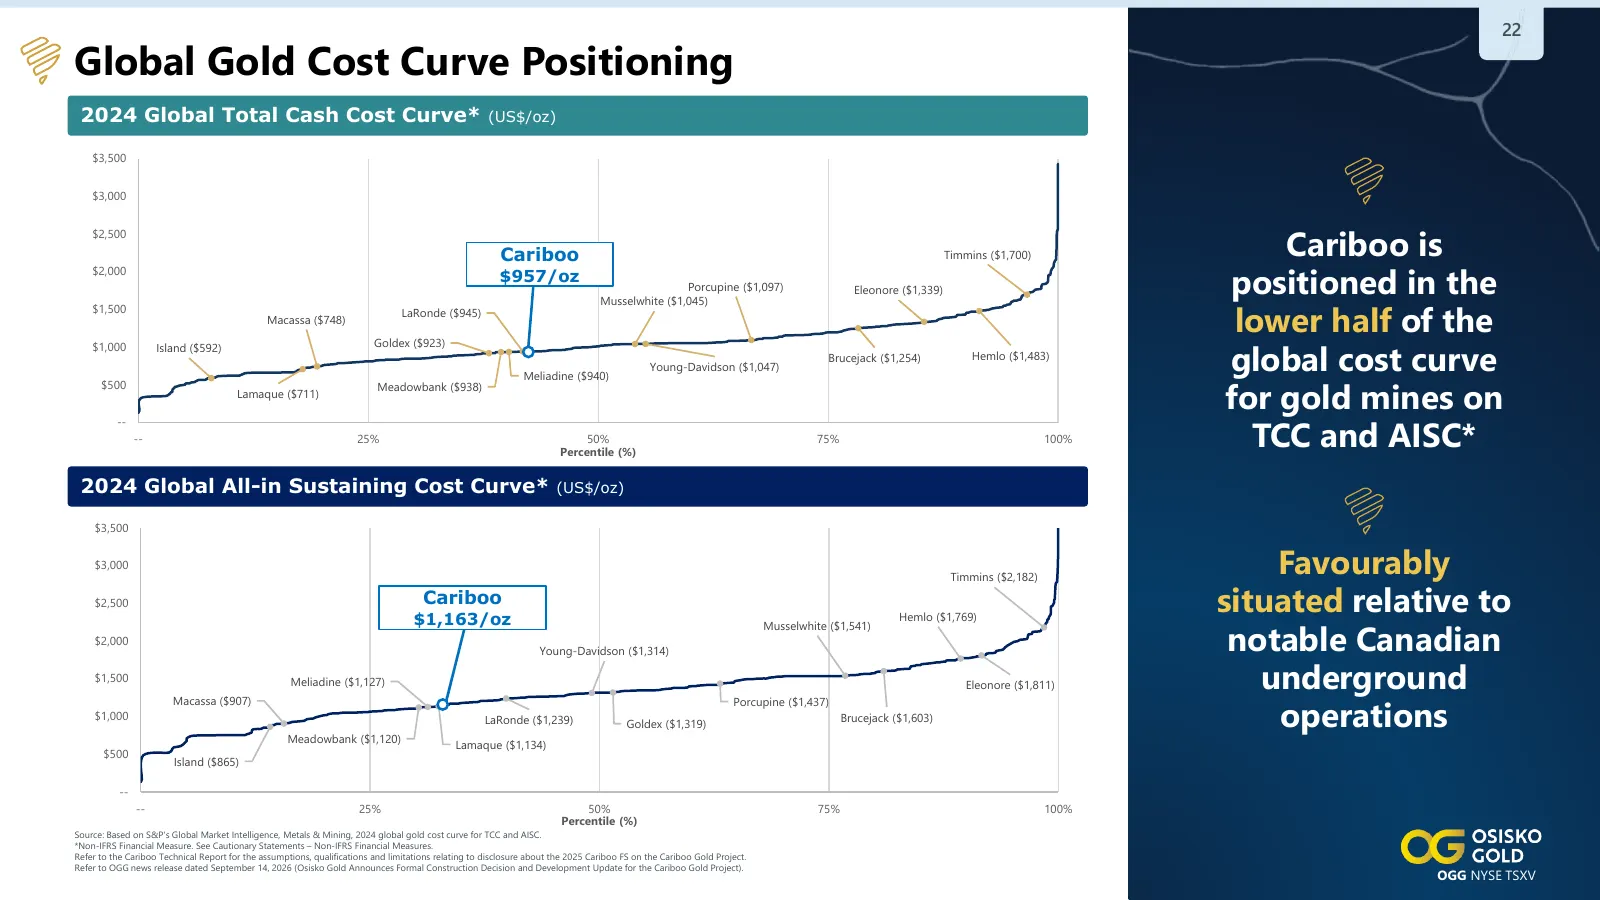
Slide 22: Global Gold Cost Curve Positioning
22 Global Gold Cost Curve Positioning 2024 Global Total Cash Cost Curve* (US$/oz) $3,500 $3,000 Cariboo is $2,500 Cariboo Cariboo ($947) Timmins ($1,700) positioned in the $2,000 $957/oz Porcupine ($1,097) Eleonore ($1,339) Musselwhite ($1,045) lower half of the $1,500 LaRonde ($945) Macassa ($748)
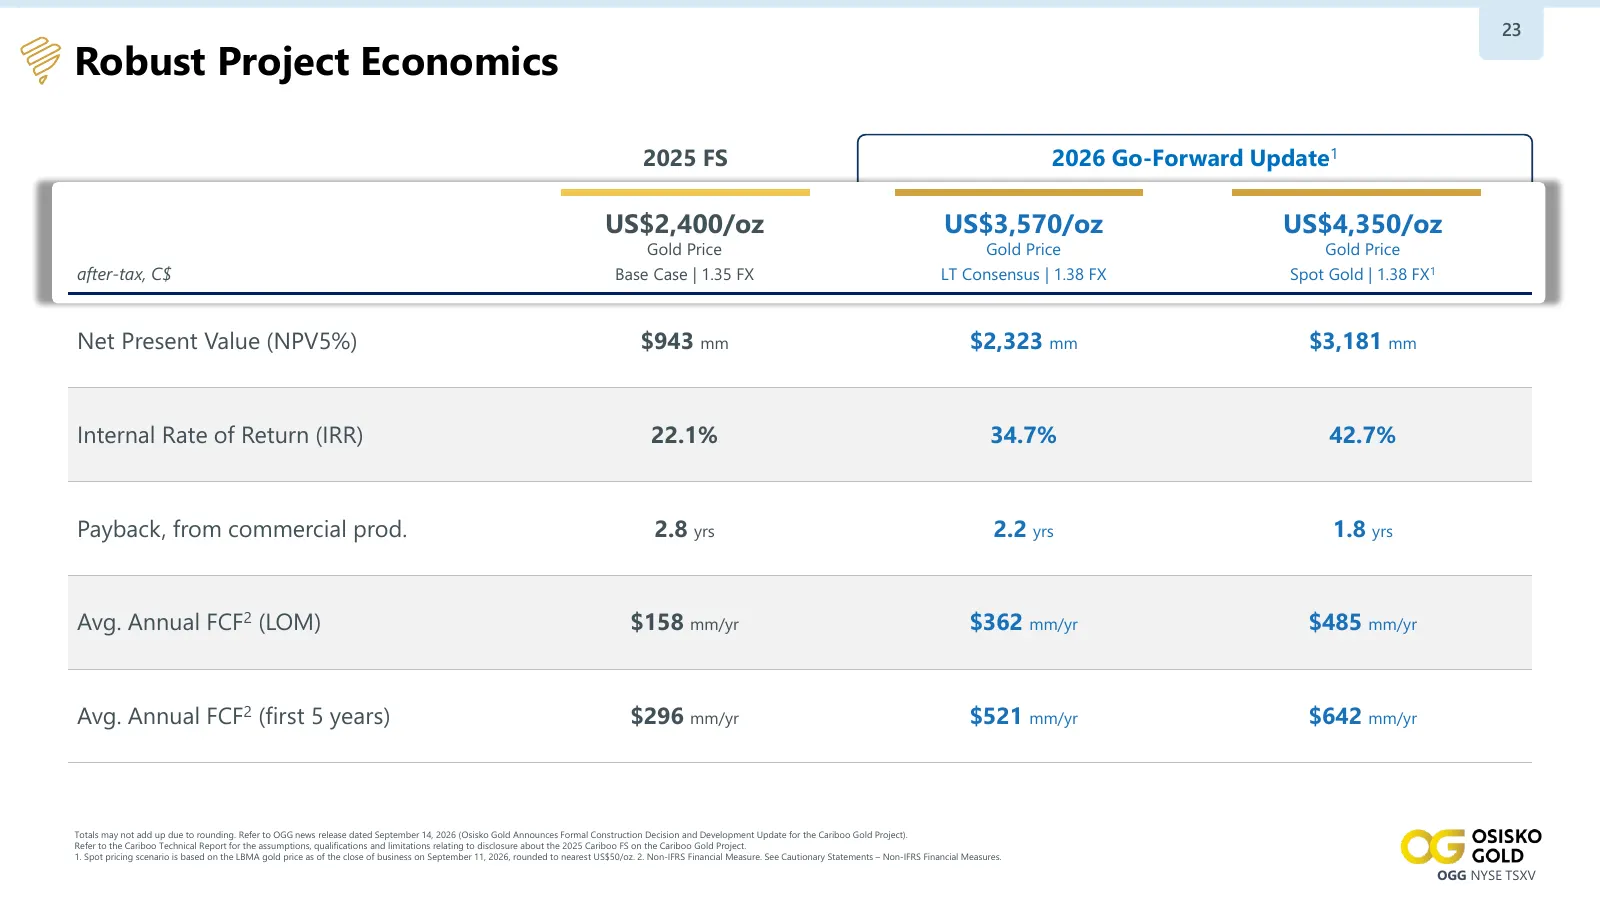
Slide 23: Robust Project Economics
23 Robust Project Economics 2025 FS 2026 Go-Forward Update1 US$2,400/oz US$3,570/oz US$4,350/oz Gold Price Gold Price Gold Price after-tax, C$ Base Case | 1.35 FX LT Consensus | 1.38 FX Spot Gold | 1.38 FX1 Net Present Value (NPV5%) $943 mm $2,323 mm $3,181 mm Internal Rate of Return (IRR) 22.1% 34.
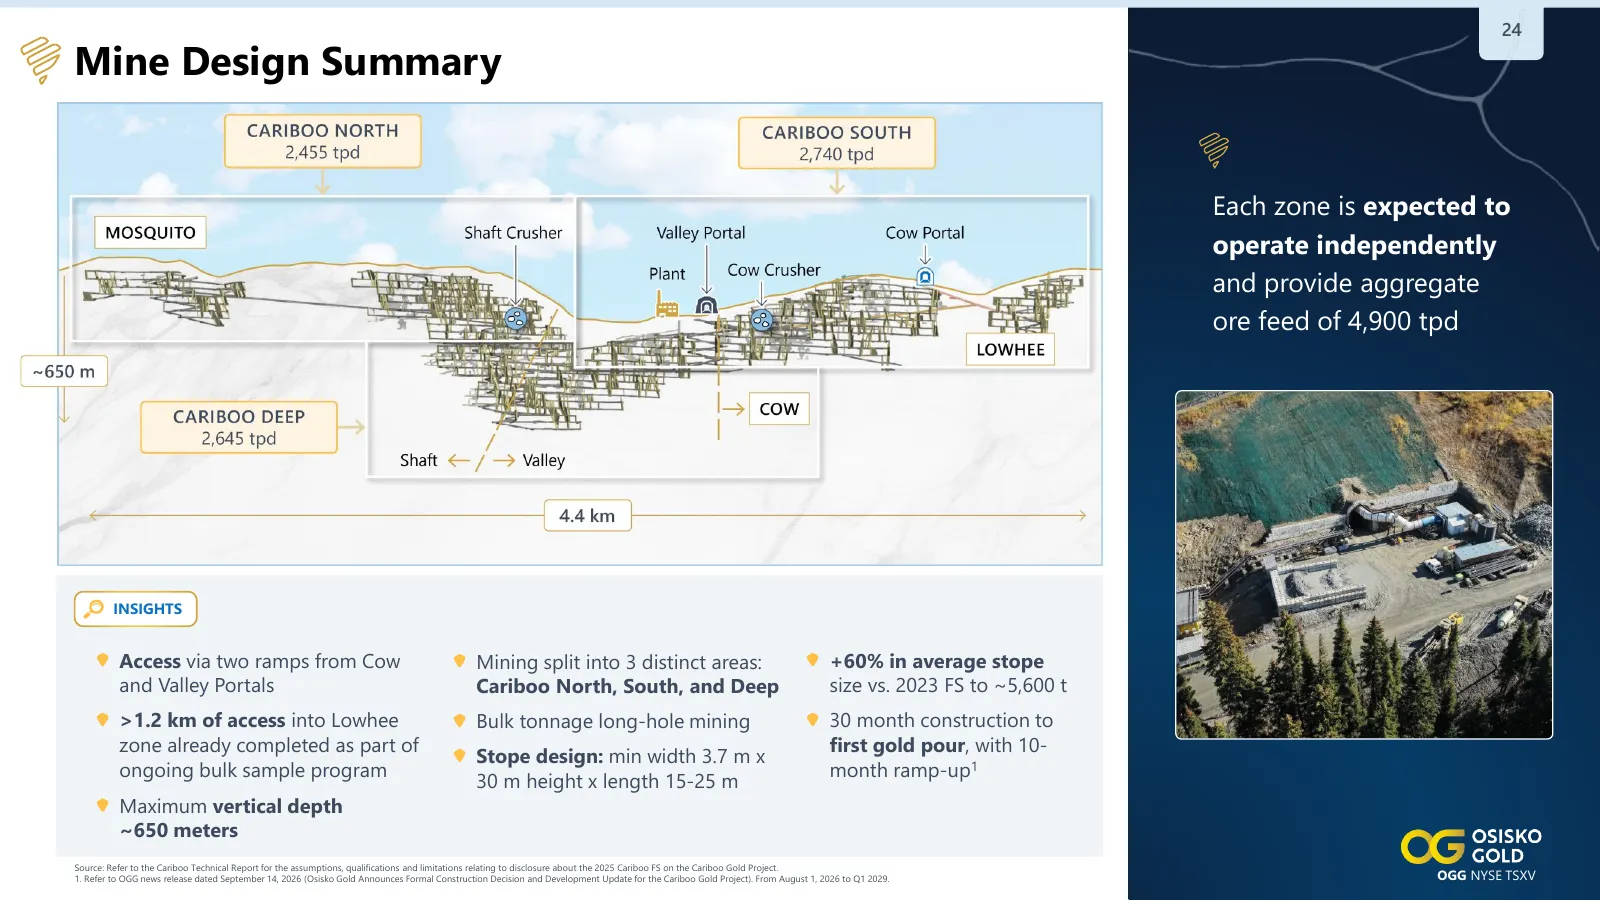
Slide 24: Mine Design Summary
24 Mine Design Summary Each zone is expected to operate independently and provide aggregate ore feed of 4,900 tpd INSIGHTS Access via two ramps from Cow Mining split into 3 distinct areas: +60% in average stope and Valley Portals Cariboo North, South, and Deep size vs. 2023 FS to ~5,600 t >1.2 km of
Slide 25: Proposed Conceptual Mine Site Layout
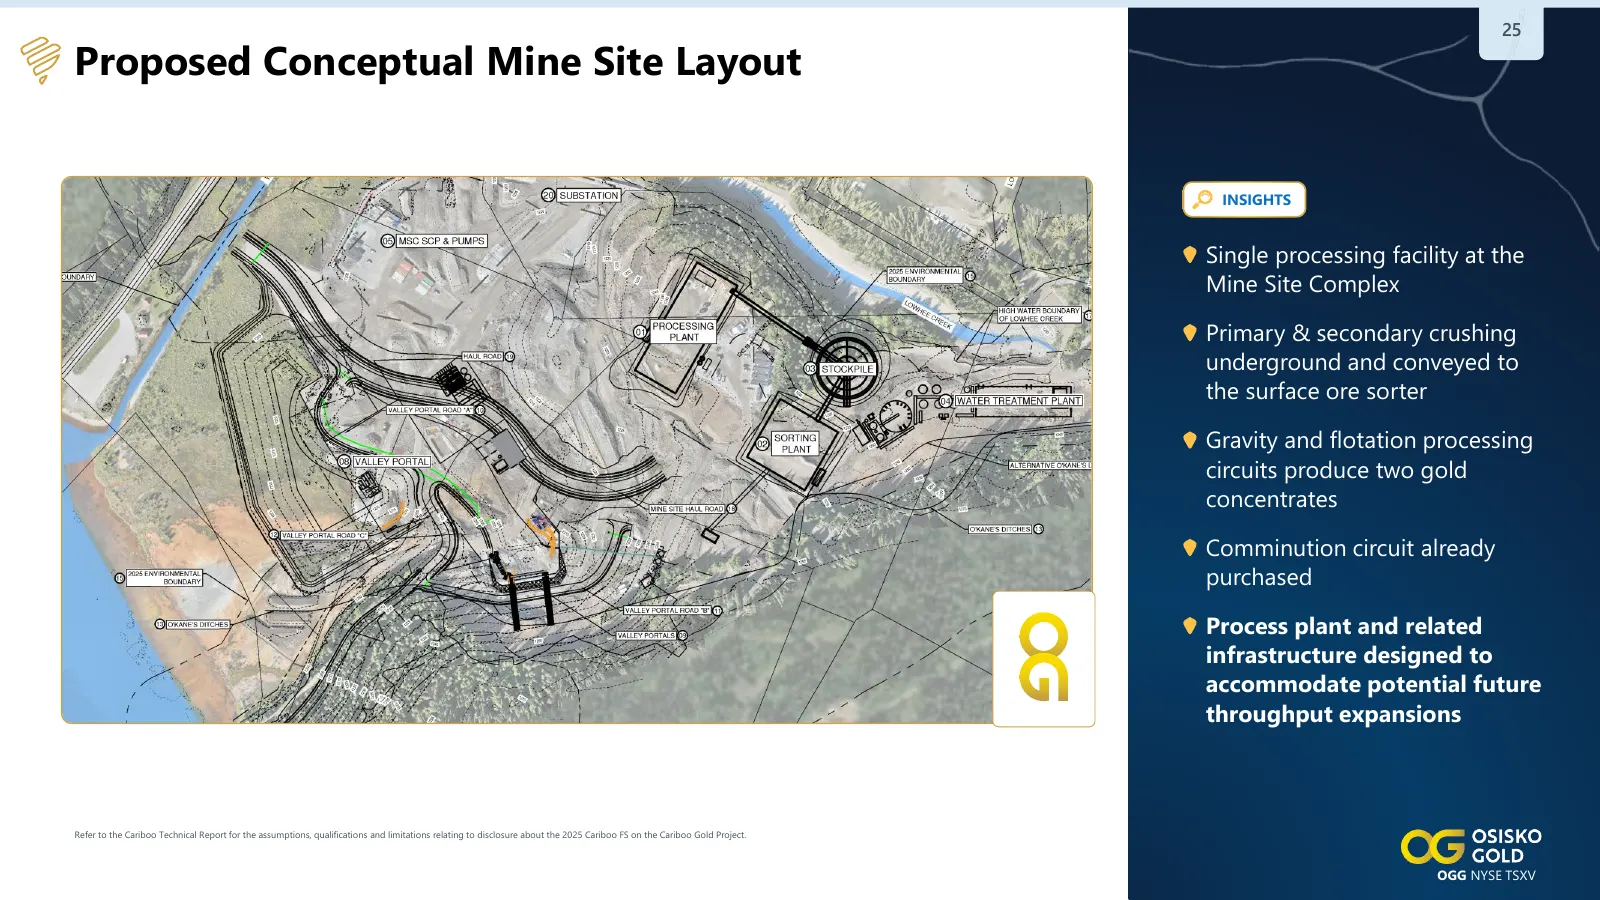
25 Proposed Conceptual Mine Site Layout INSIGHTS Single processing facility at the Mine Site Complex Primary & secondary crushing underground and conveyed to the surface ore sorter Gravity and flotation processing circuits produce two gold concentrates Comminution circuit already purchased Process p
Slide 26: Mineral Reserves and Resources
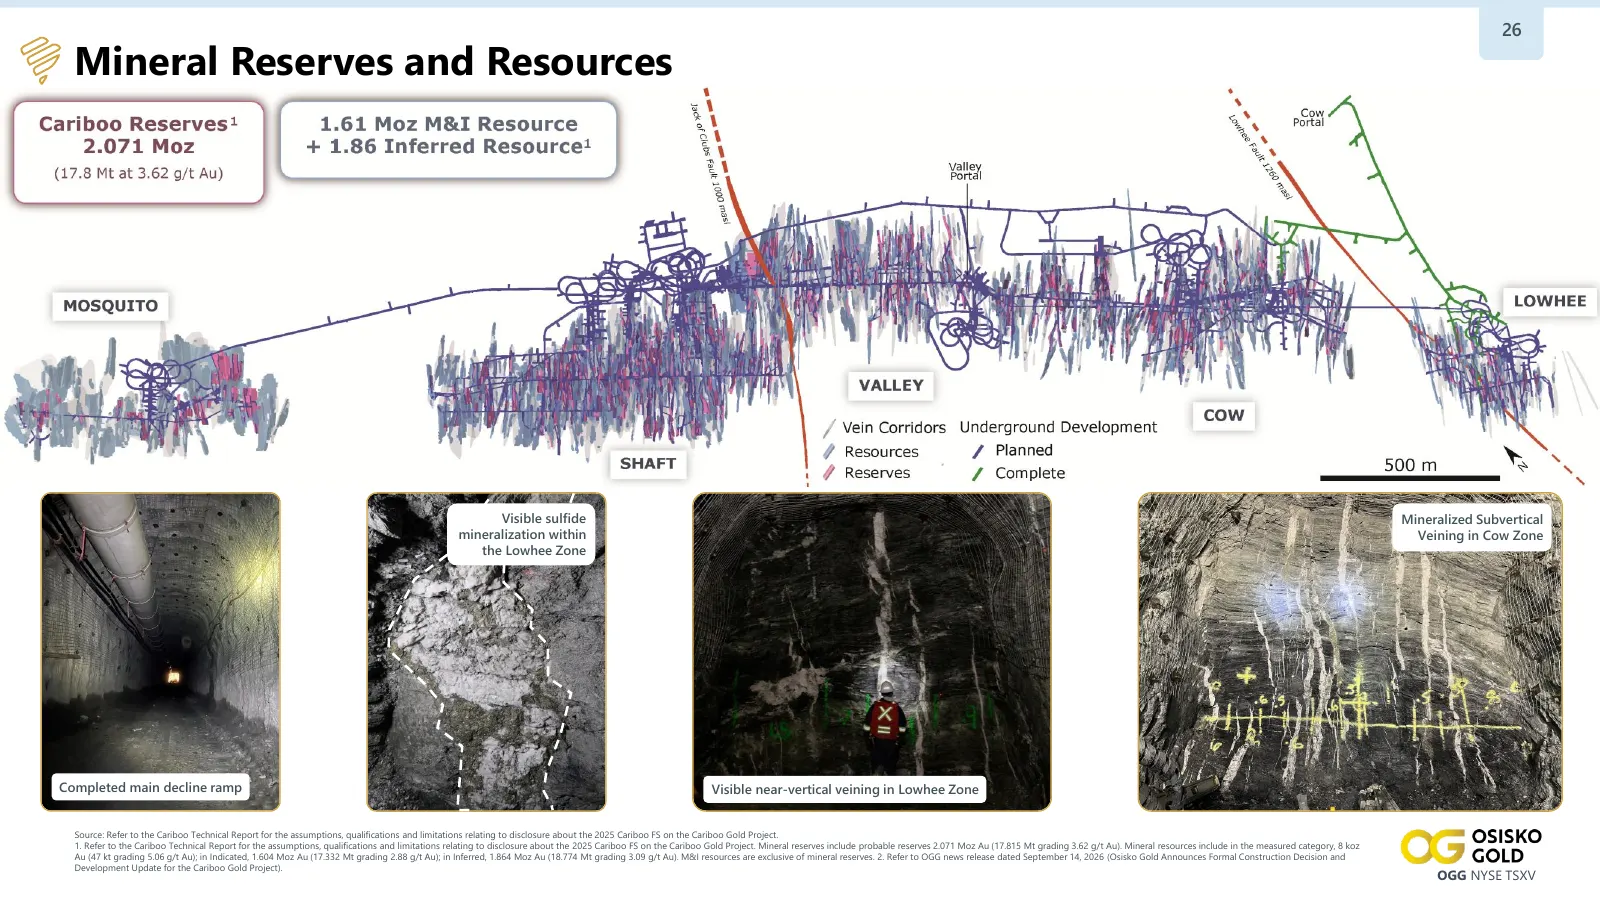
26 Mineral Reserves and Resources Visible sulfide Mineralized Subvertical mineralization within Veining in Cow Zone the Lowhee Zone Completed main decline ramp Visible near-vertical veining in Lowhee Zone Source: Refer to the Cariboo Technical Report for the assumptions, qualifications and limitatio
Slide 27: Lowhee Zone Underground
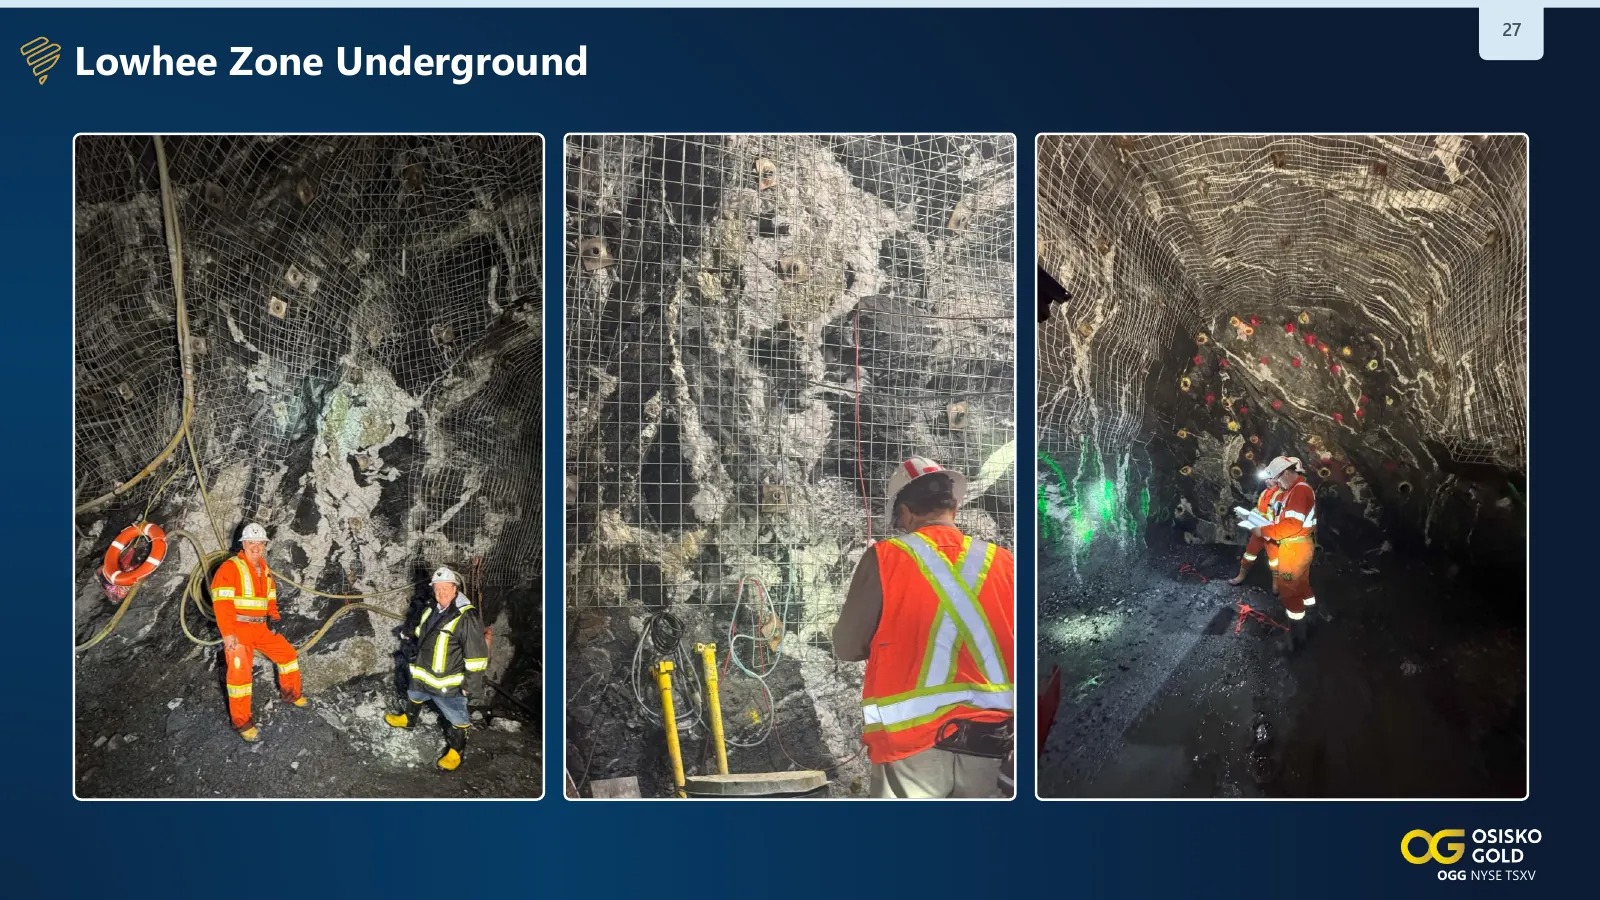
27 Lowhee Zone Underground OGG NYSE TSXV
Slide 28: Mineralization Favorable to Ore Sorting
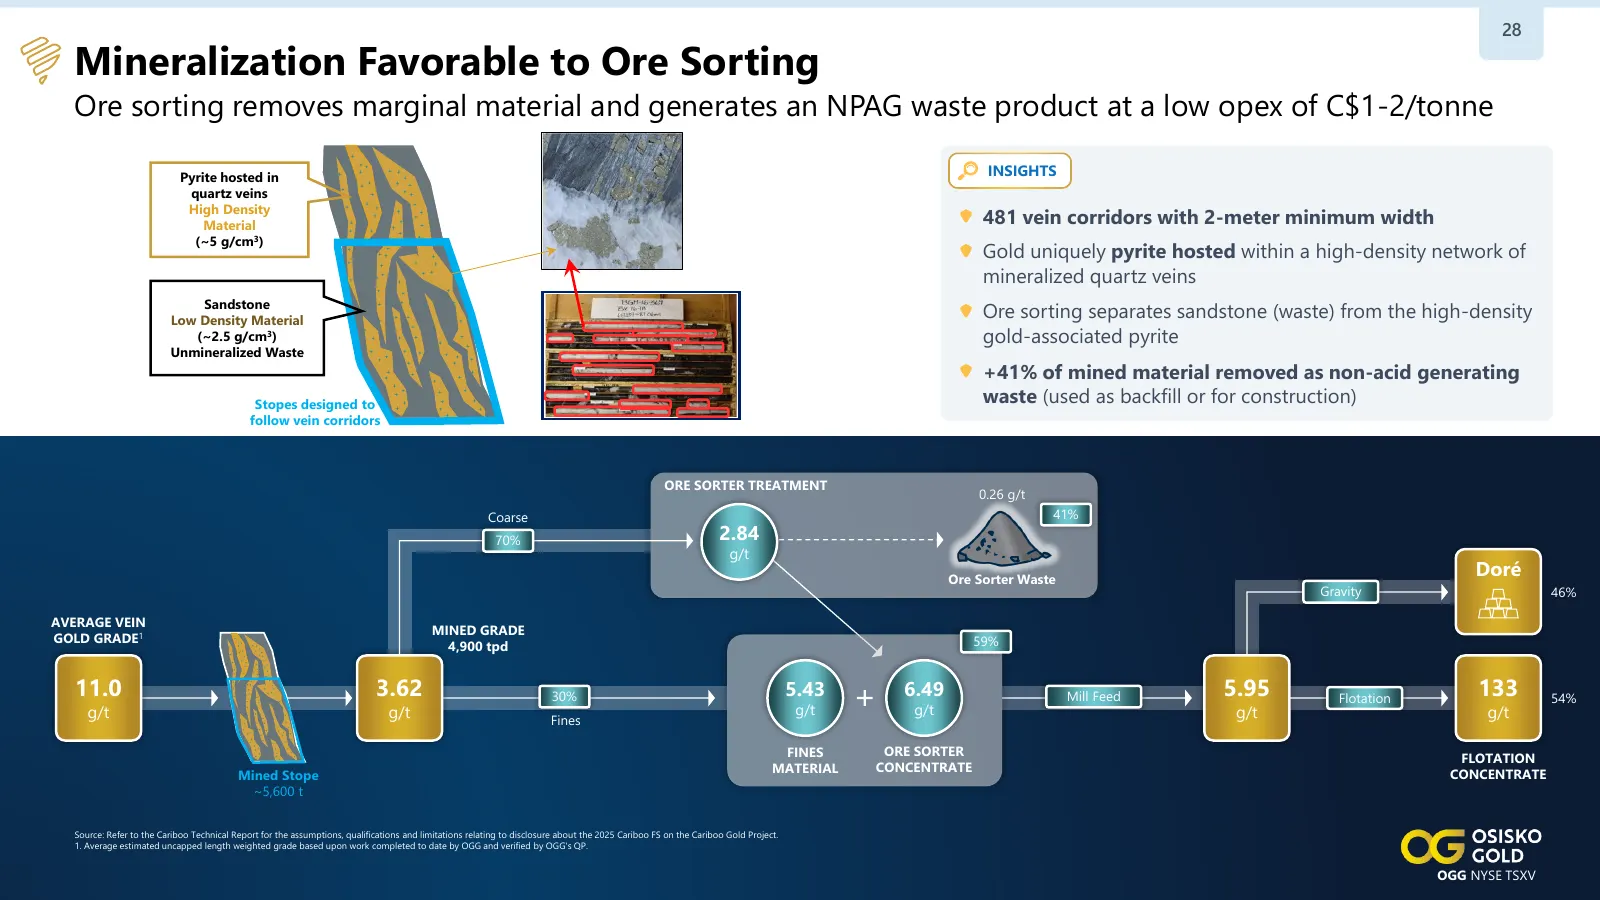
28 Mineralization Favorable to Ore Sorting Ore sorting removes marginal material and generates an NPAG waste product at a low opex of C$1-2/tonne Pyrite hosted in INSIGHTS quartz veins High Density Material 481 vein corridors with 2-meter minimum width (~5 g/cm3) Gold uniquely pyrite hosted within a
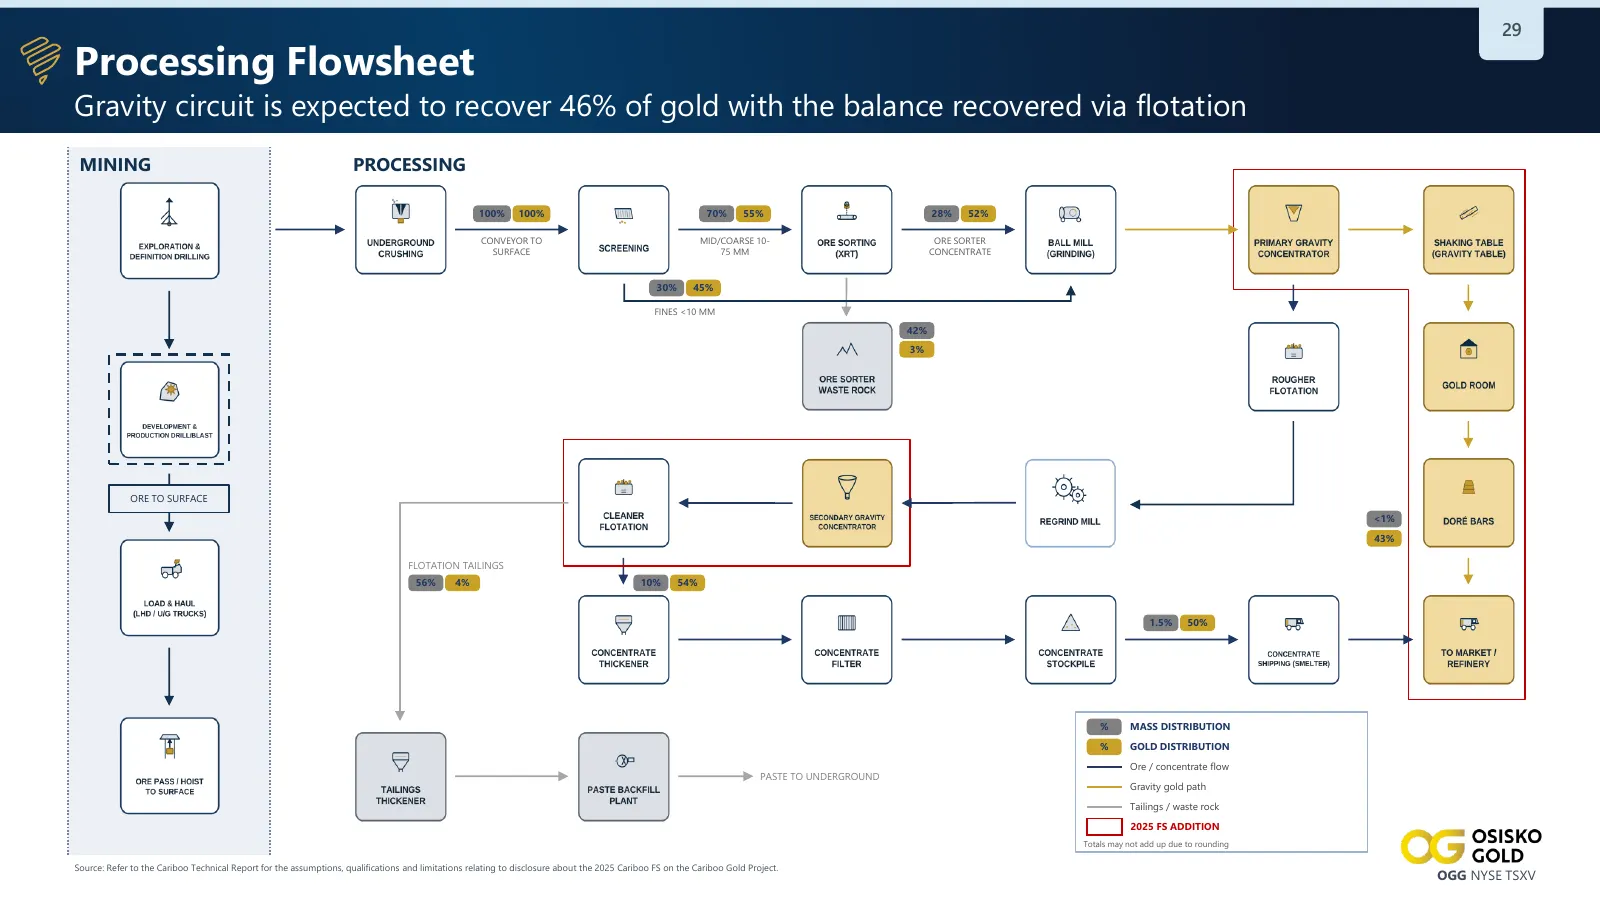
Slide 29: Processing Flowsheet
29 Processing Flowsheet Gravity circuit is expected to recover 46% of gold with the balance recovered via flotation MINING PROCESSING 100% 100% 70% 55% 28% 52% CONVEYOR TO MID/COARSE 10- ORE SORTER SURFACE 75 MM CONCENTRATE 30% 45% FINES <10 MM 42% 3% ORE TO SURFACE <1% 43% FLOTATION TAILINGS 56% 4%
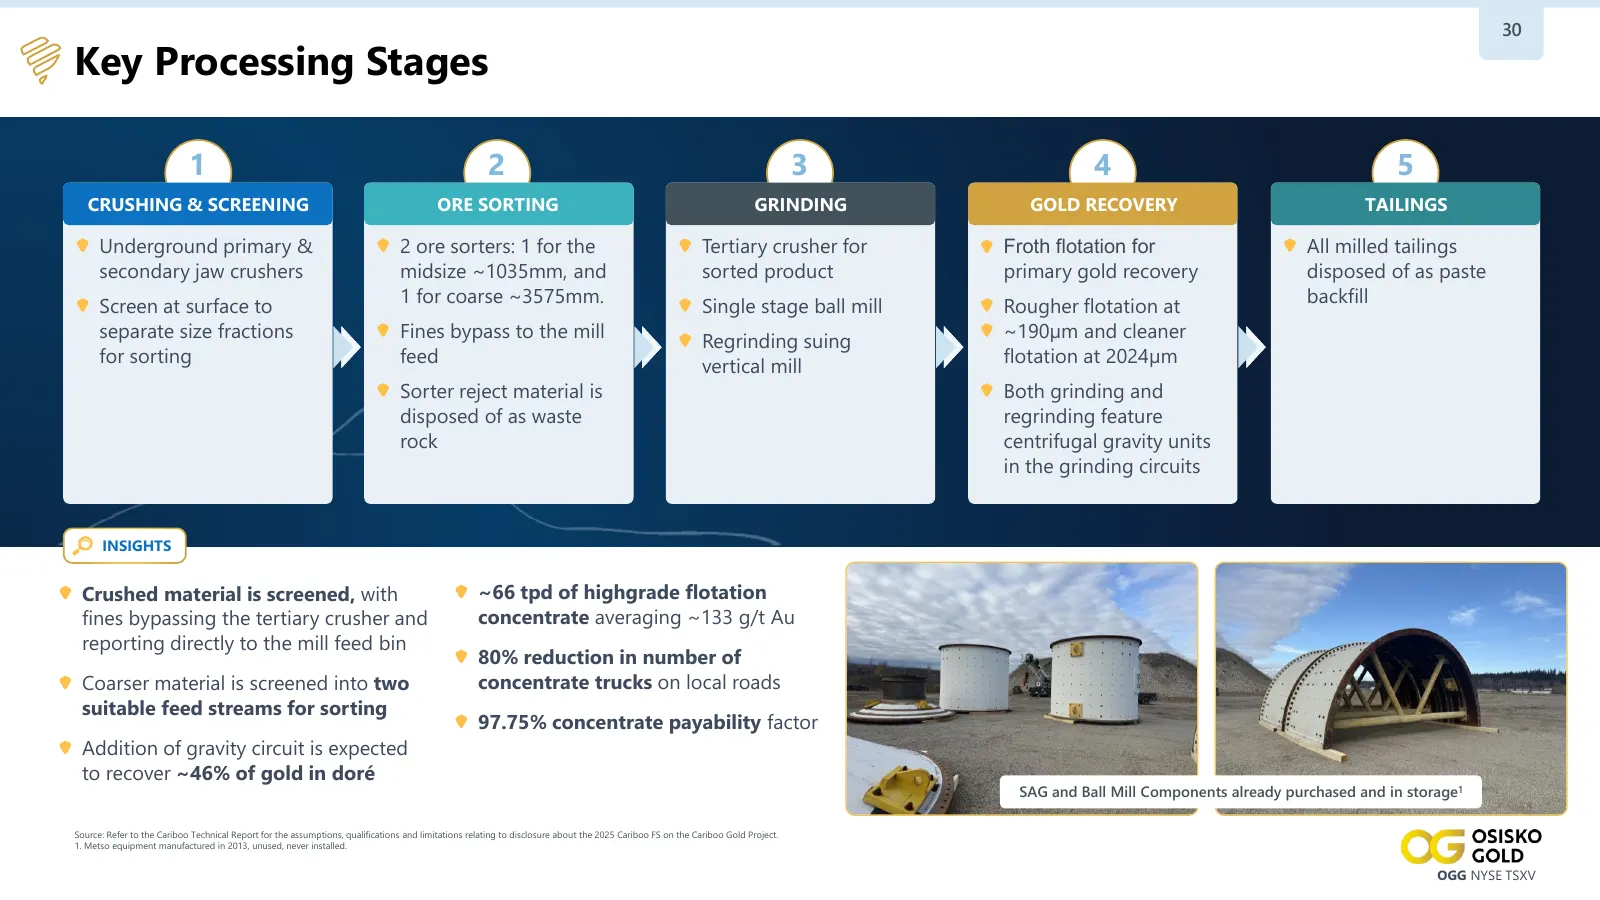
Slide 30: Key Processing Stages
30 Key Processing Stages 1 2 3 4 5 CRUSHING & SCREENING ORE SORTING GRINDING GOLD RECOVERY TAILINGS Underground primary & 2 ore sorters: 1 for the Tertiary crusher for Froth flotation for All milled tailings secondary jaw crushers midsize ~1035mm, and sorted product primary gold recovery disposed of
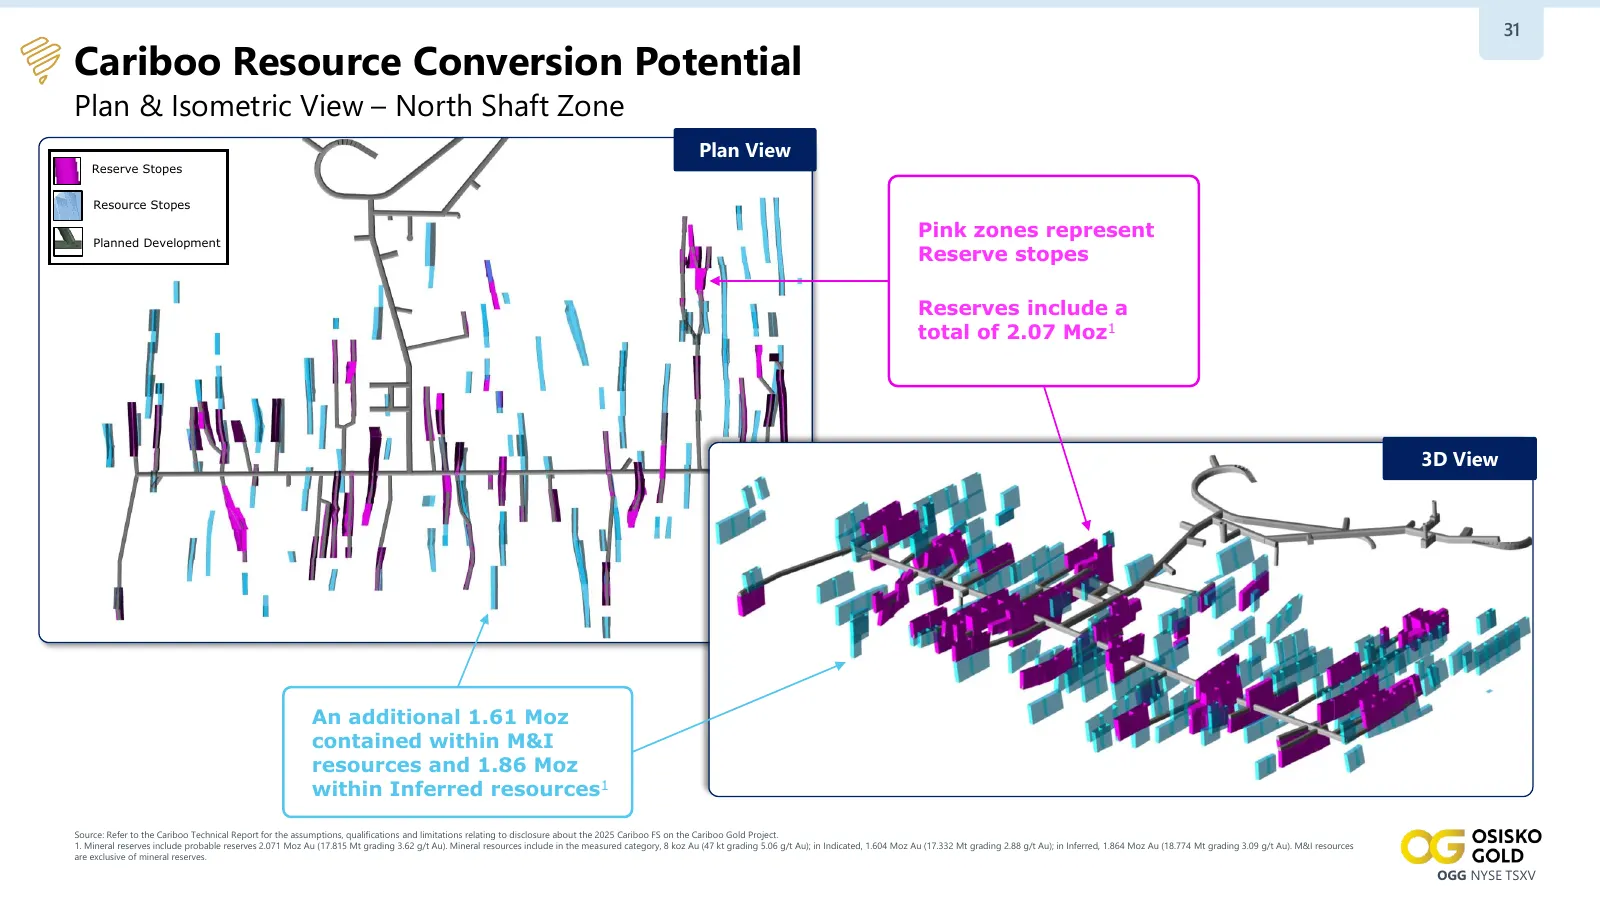
Slide 31: Cariboo Resource Conversion Potential
31 Cariboo Resource Conversion Potential Plan & Isometric View – North Shaft Zone Plan View Reserve Stopes Resource Stopes Planned Development Pink zones represent Reserve stopes Reserves include a total of 2.07 Moz1 3D View An additional 1.61 Moz contained within M&I resources and 1.86 Moz within I
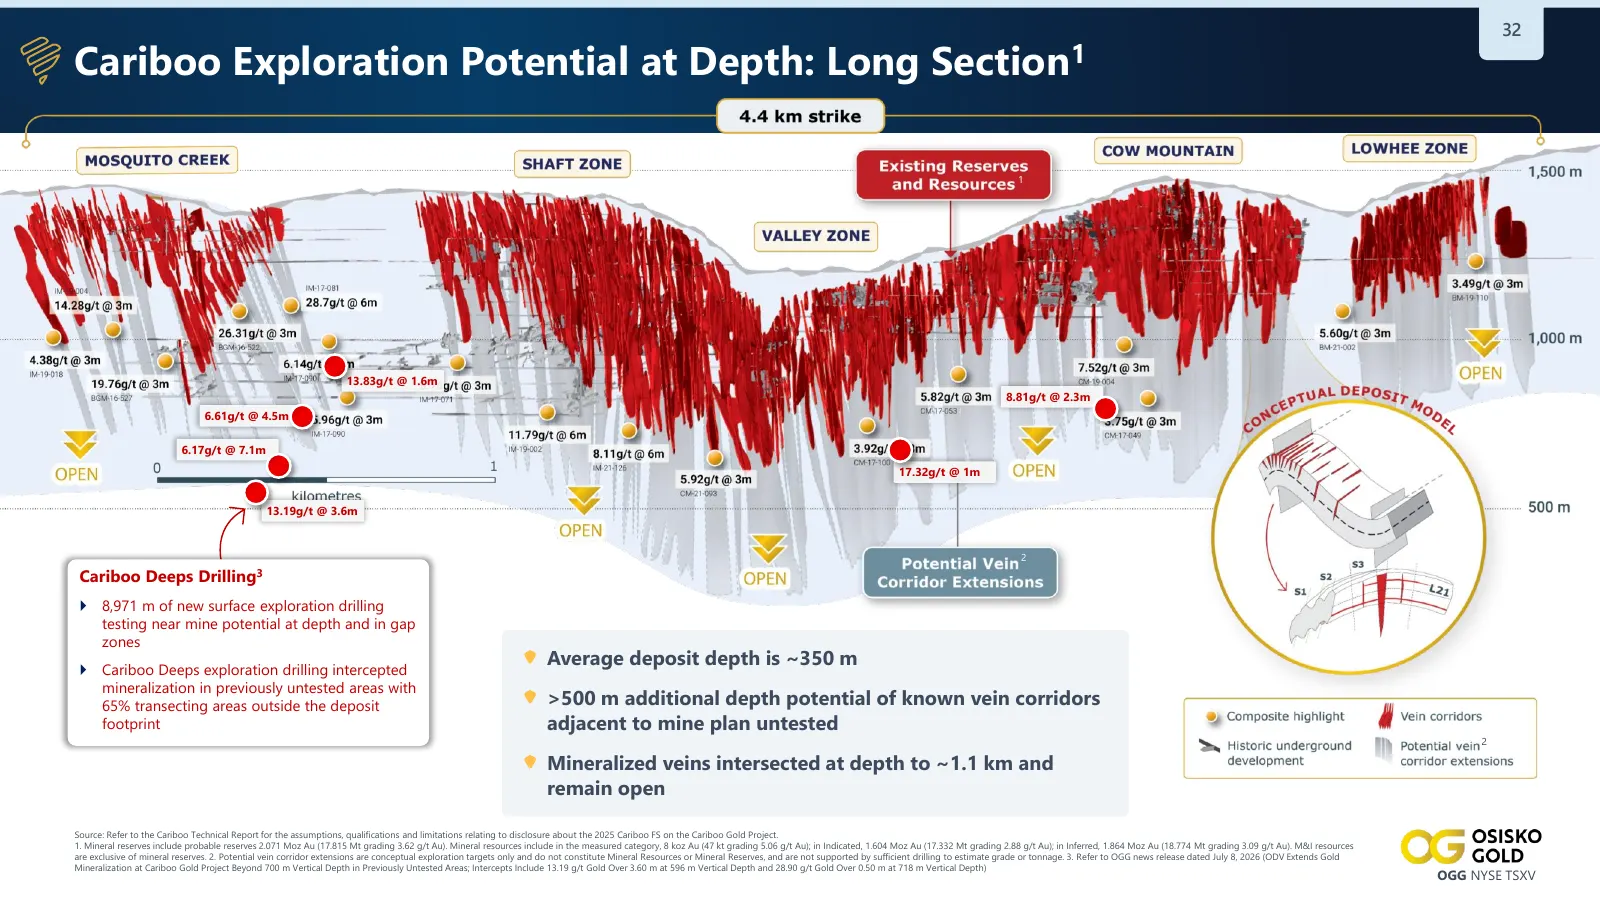
Slide 32: Cariboo Exploration Potential at Depth: Long Section
32 Cariboo Exploration Potential at Depth: Long Section1 1 13.83g/t @ 1.6m 8.81g/t @ 2.3m 6.61g/t @ 4.5m 6.17g/t @ 7.1m 17.32g/t @ 1m 13.19g/t @ 3.6m 2 Cariboo Deeps Drilling3 8,971 m of new surface exploration drilling testing near mine potential at depth and in gap zones Average deposit depth is
Slide 33: A Potential Generational District
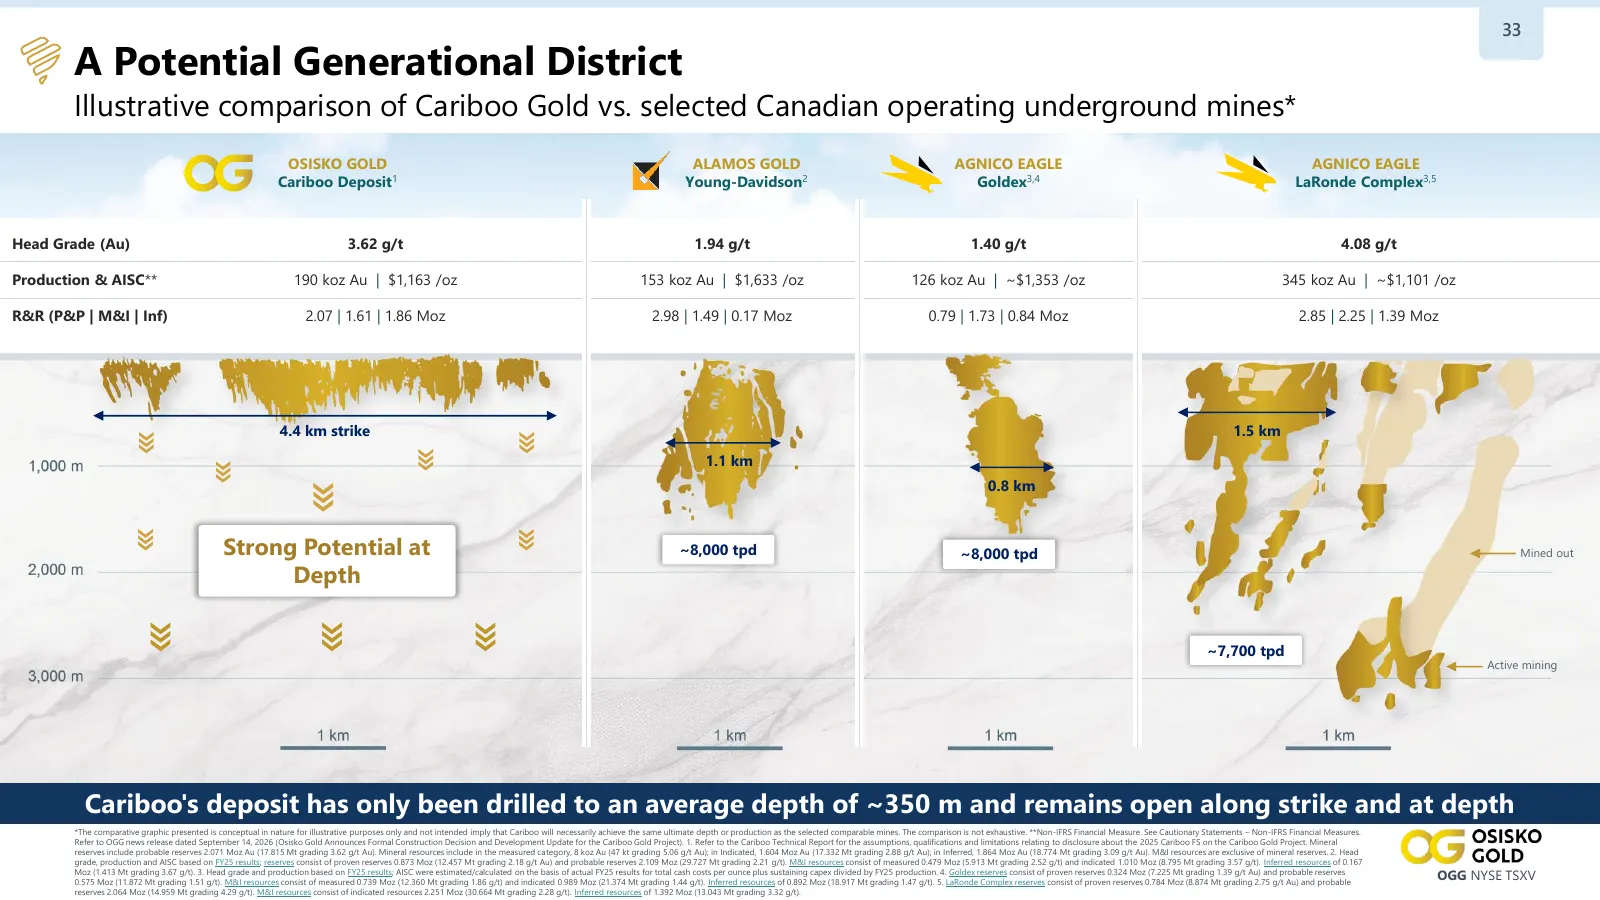
33 A Potential Generational District Illustrative comparison of Cariboo Gold vs. selected Canadian operating underground mines* OSISKO GOLD ALAMOS GOLD AGNICO EAGLE AGNICO EAGLE Cariboo Deposit1 Young-Davidson2 Goldex3,4 LaRonde Complex3,5 Head Grade (Au) 3.62 g/t 1.94 g/t 1.40 g/t 4.08 g/t Producti
Slide 34: An Emerging Mineralized System at Proserpine
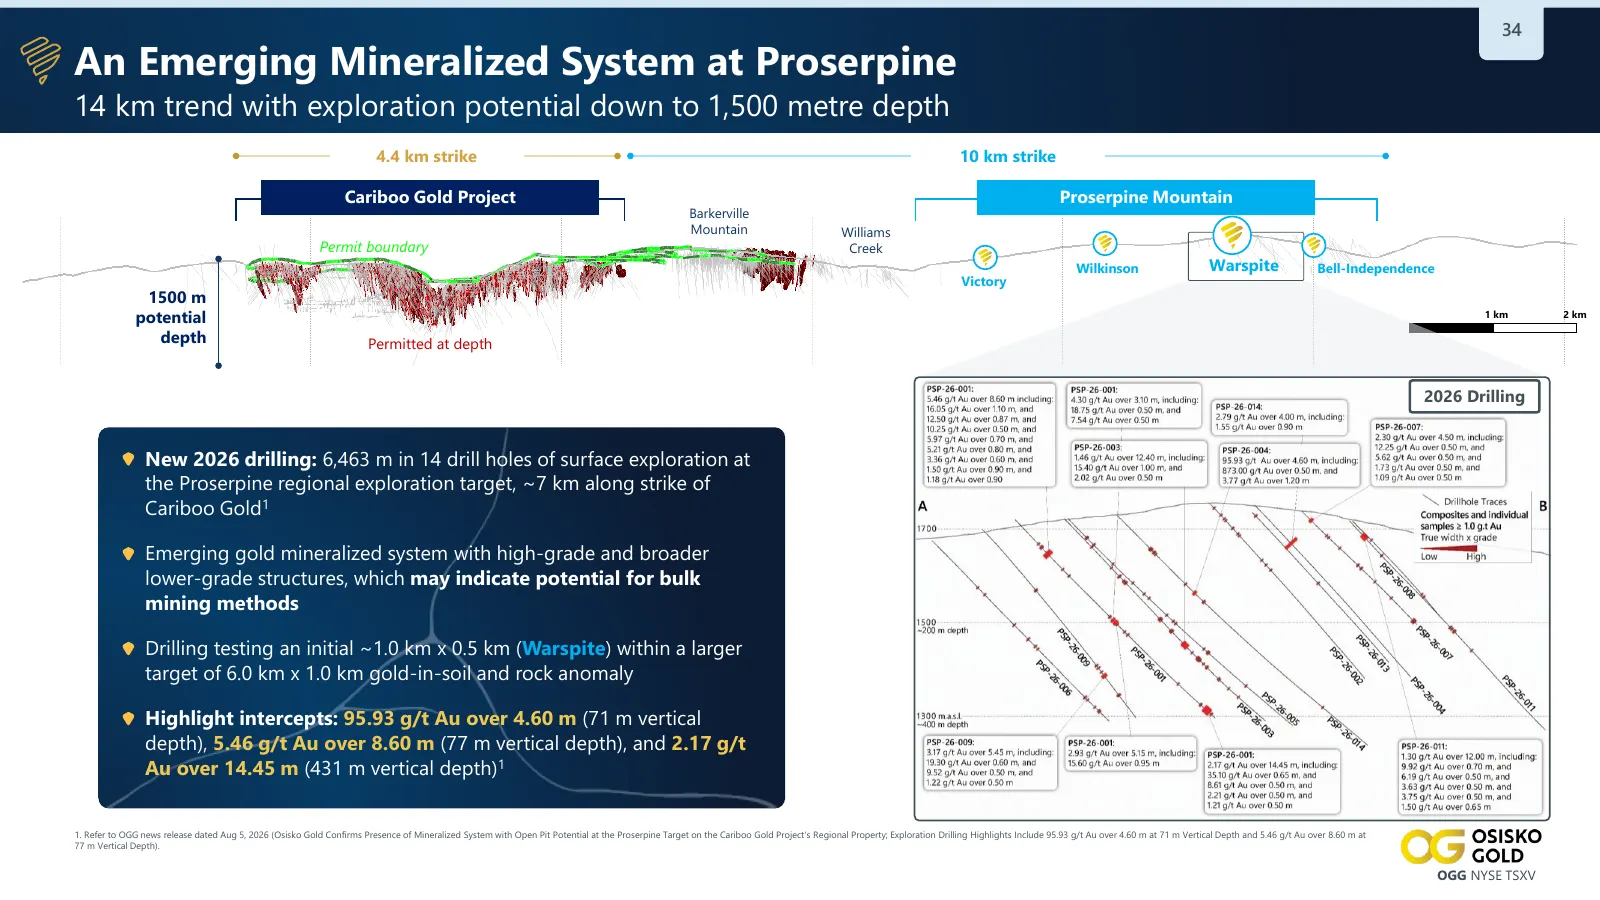
34 An Emerging Mineralized System at Proserpine 14 km trend with exploration potential down to 1,500 metre depth 4.4 km strike 10 km strike Cariboo Gold Project Proserpine Mountain Barkerville Mountain Williams Permit boundary Creek Wilkinson Warspite Bell-Independence Victory 1500 m potential 1 km
Slide 35: Cariboo Regional Upside
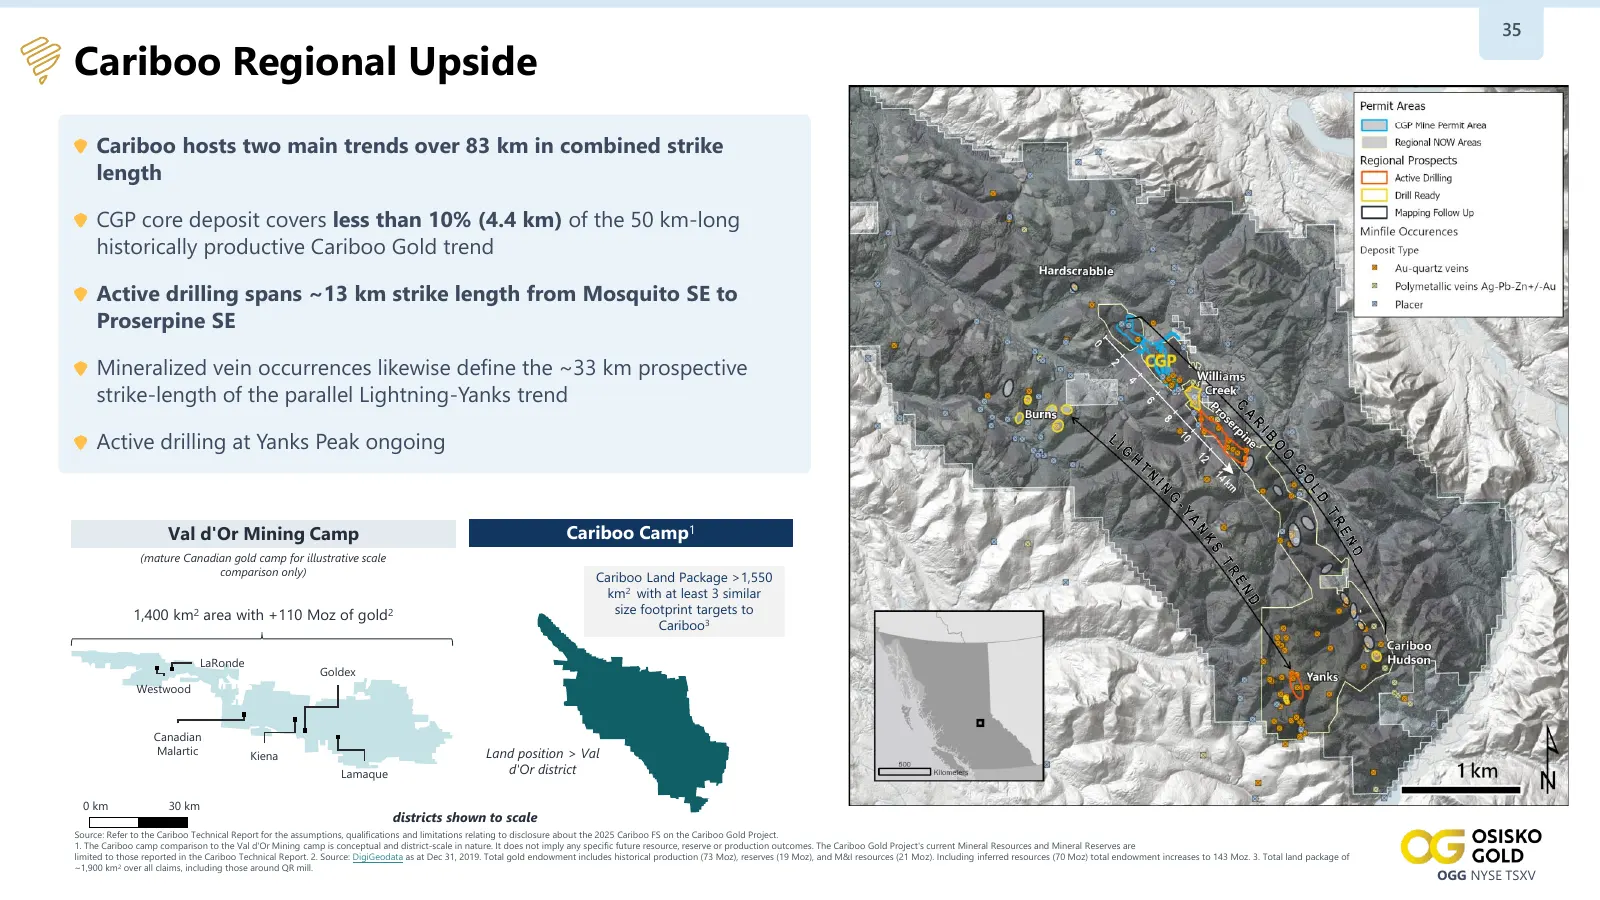
35 Cariboo Regional Upside Cariboo hosts two main trends over 83 km in combined strike length CGP core deposit covers less than 10% (4.4 km) of the 50 km-long historically productive Cariboo Gold trend Active drilling spans ~13 km strike length from Mosquito SE to Proserpine SE Mineralized vein occu
Slide 36: Tintic Project
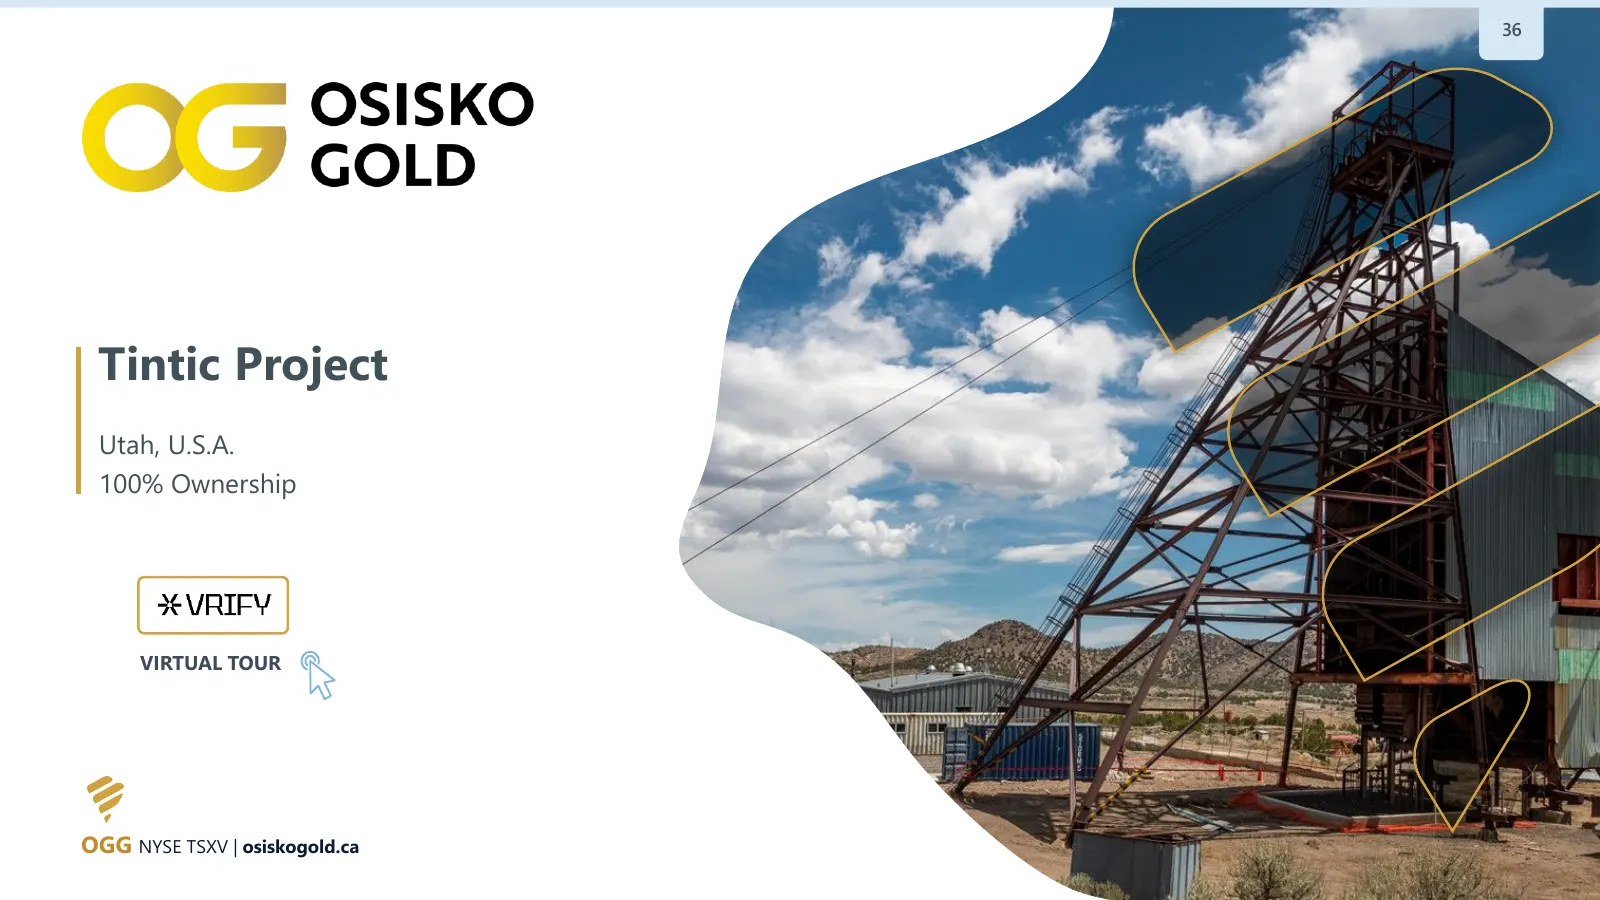
36 Tintic Project Utah, U.S.A. 100% Ownership VIRTUAL TOUR VIRTUAL TOUR OGG NYSE TSXV | osiskogold.ca
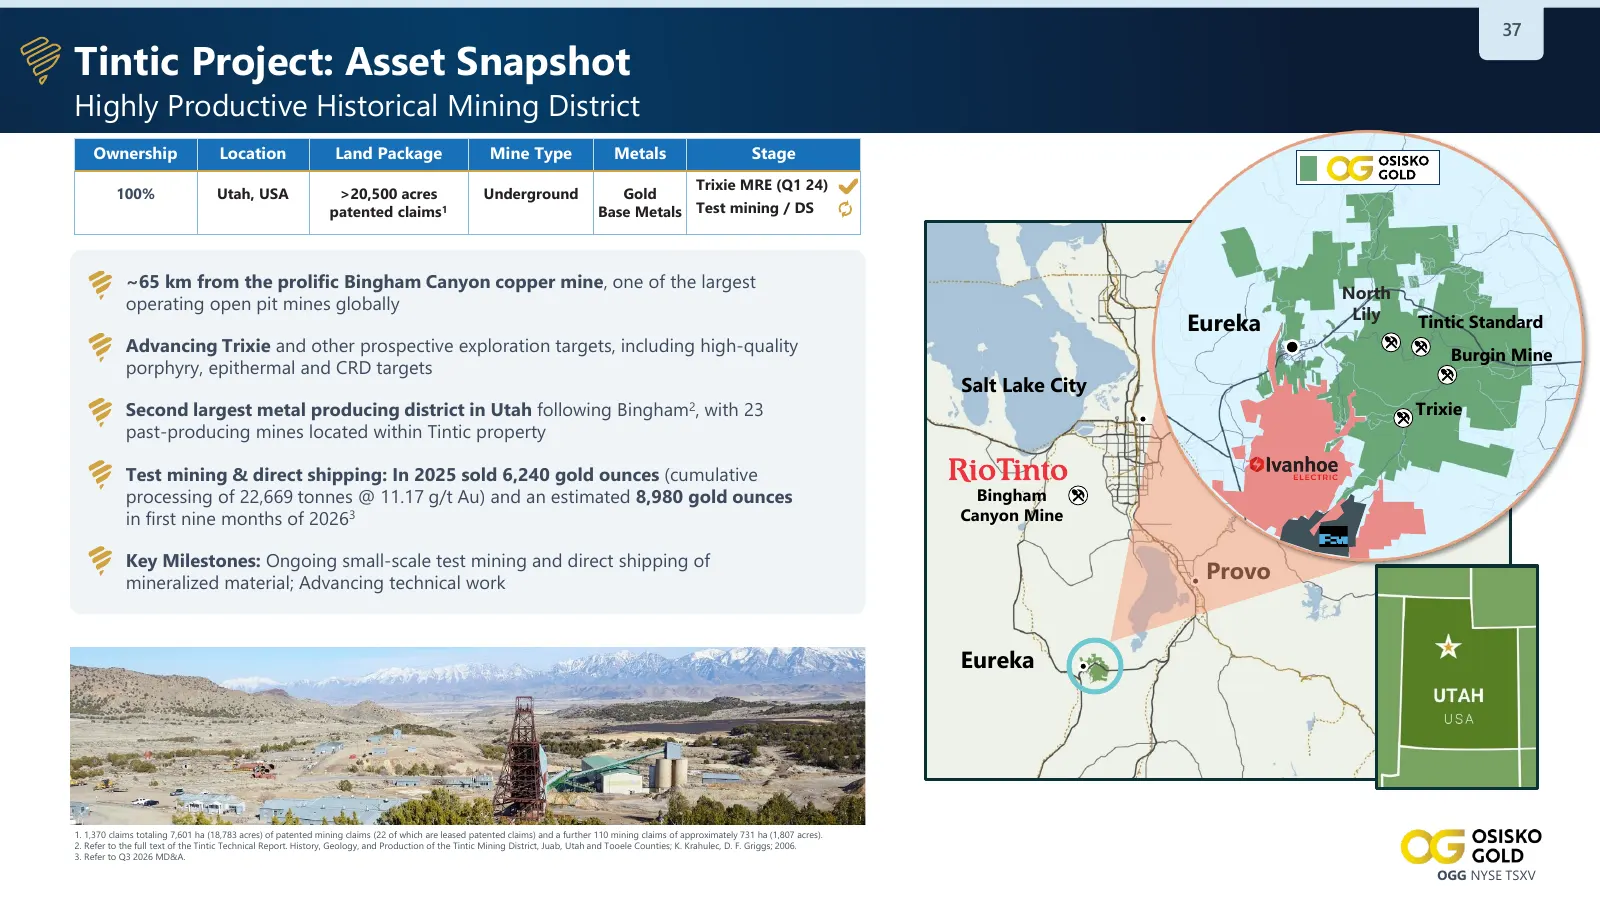
Slide 37: Tintic Project: Asset Snapshot
37 Tintic Project: Asset Snapshot Highly Productive Historical Mining District Ownership Location Land Package Mine Type Metals Stage Trixie MRE (Q1 24) 100% Utah, USA >20,500 acres Underground Gold patented claims1 Base Metals Test mining / DS ~65 km from the prolific Bingham Canyon copper mine, on
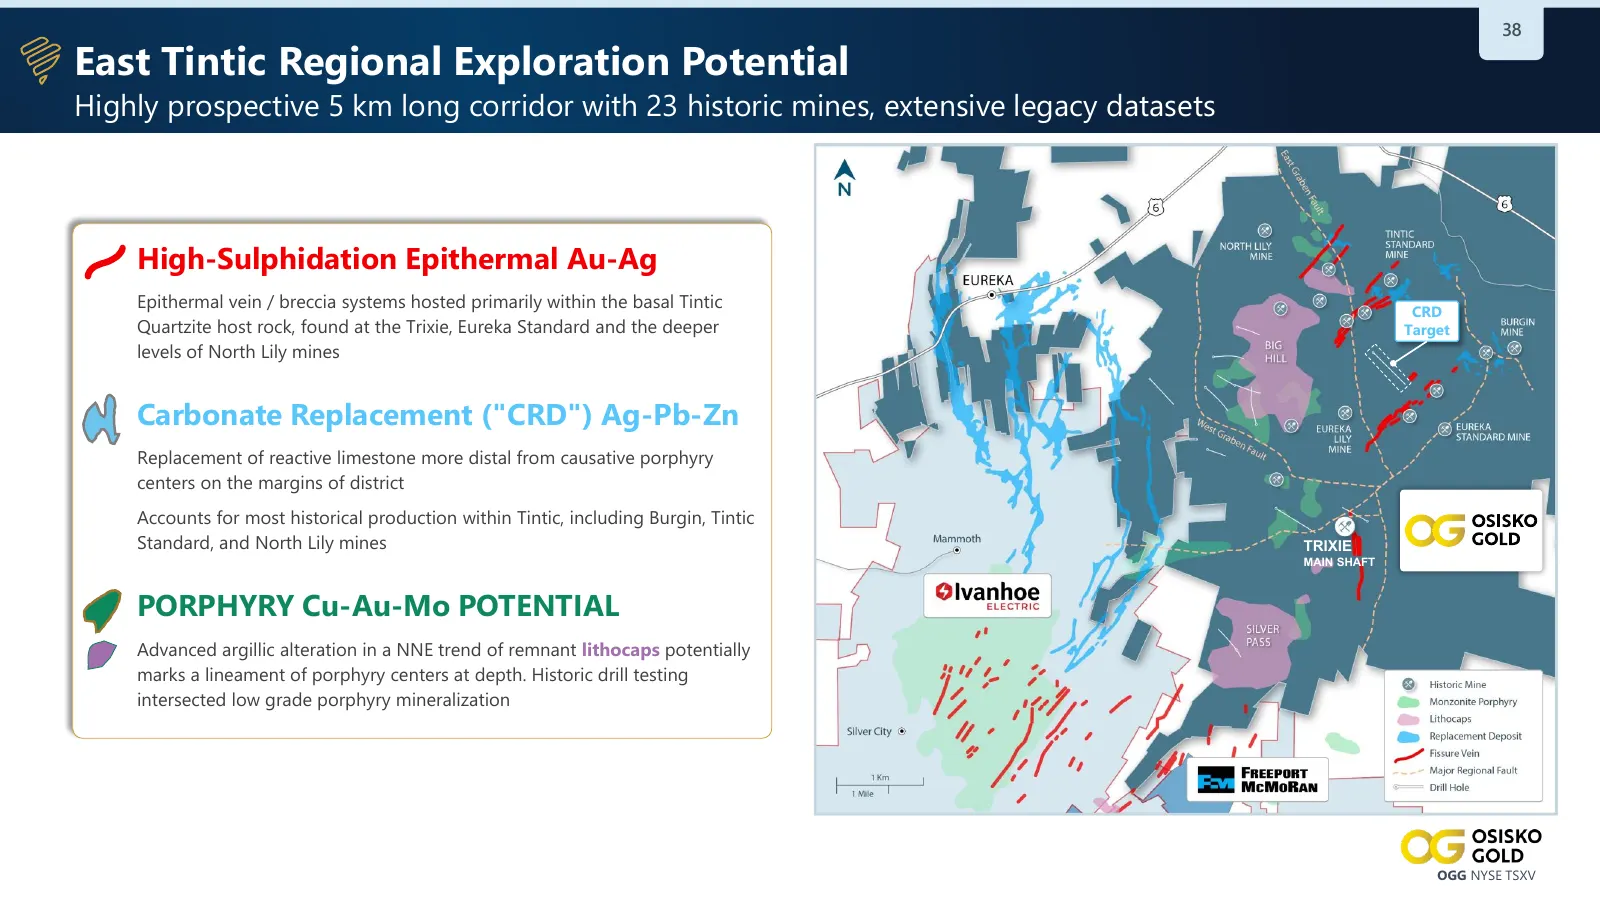
Slide 38: East Tintic Regional Exploration Potential
38 East Tintic Regional Exploration Potential Highly prospective 5 km long corridor with 23 historic mines, extensive legacy datasets High-Sulphidation Epithermal Au-Ag Epithermal vein / breccia systems hosted primarily within the basal Tintic CRD Quartzite host rock, found at the Trixie, Eureka Sta
Slide 39: Appendix
OSISKO GOLD APPENDIX OSISKO GOLD OGG NYSE TSXV
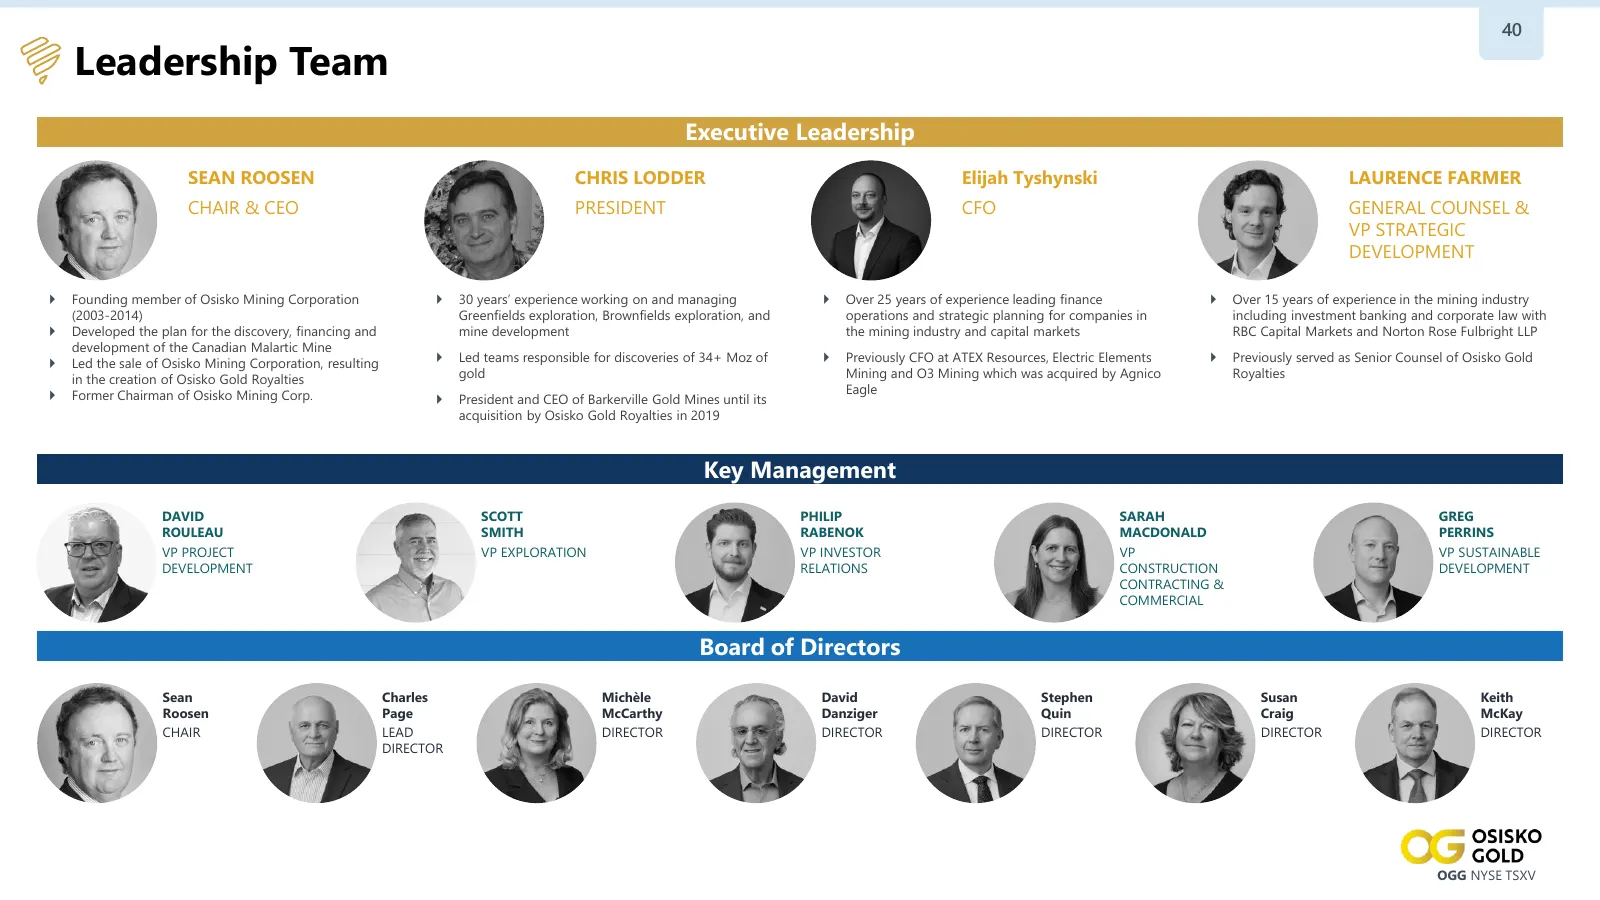
Slide 40: Leadership Team
40 Leadership Team Executive Leadership SEAN ROOSEN CHRIS LODDER Elijah Tyshynski LAURENCE FARMER CHAIR & CEO PRESIDENT CFO GENERAL COUNSEL & VP STRATEGIC DEVELOPMENT Founding member of Osisko Mining Corporation 30 years’ experience working on and managing Over 25 years of experience leading f
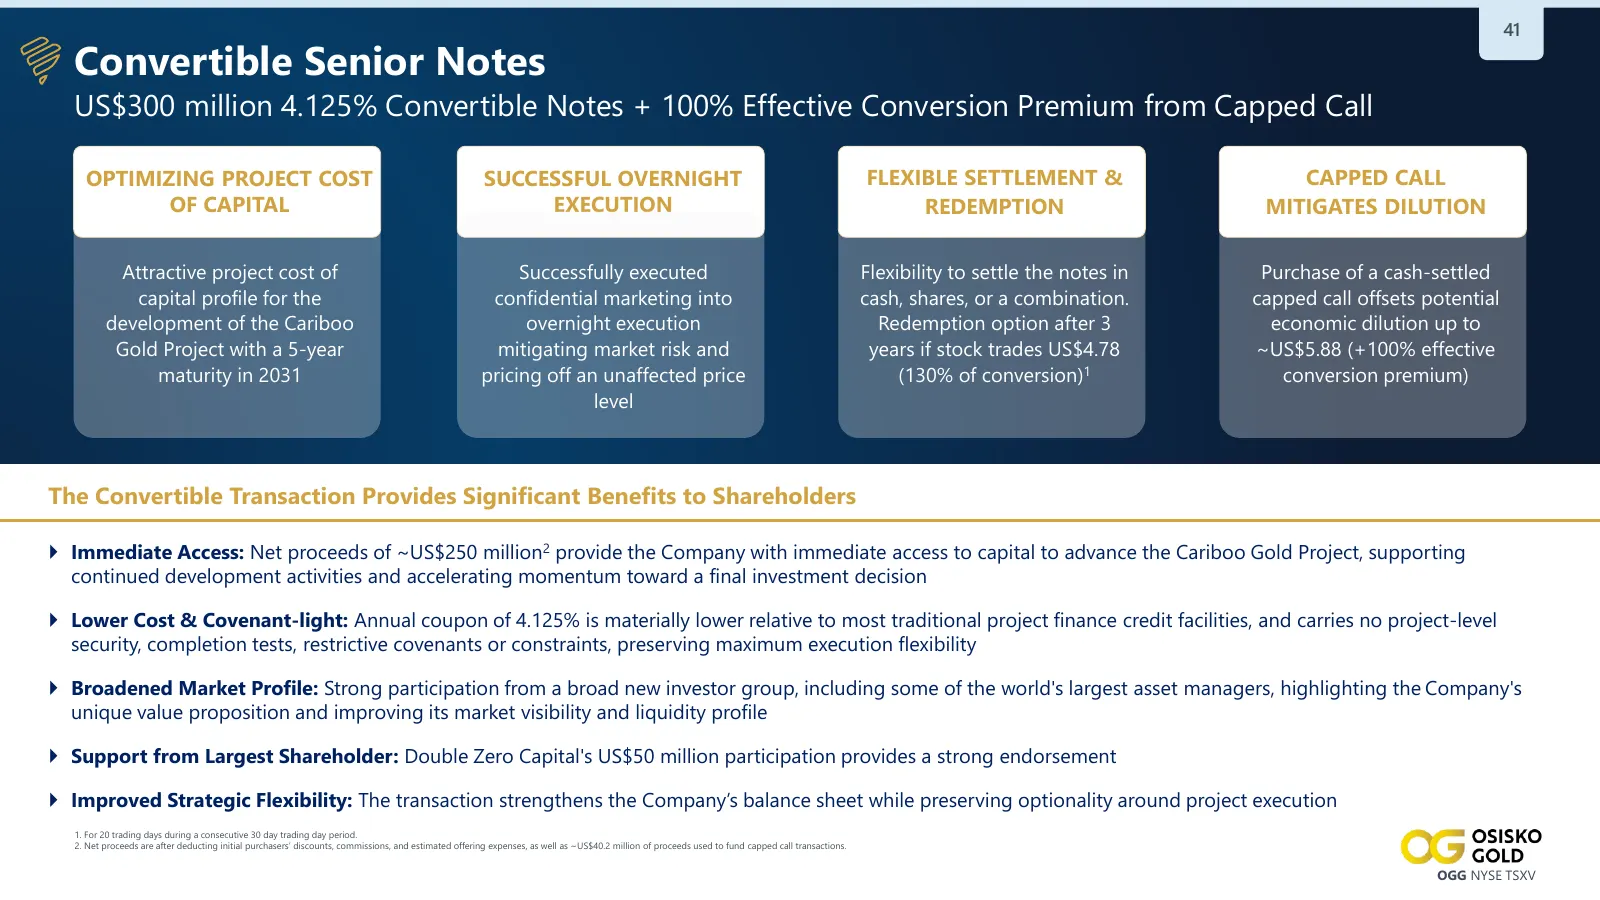
Slide 41: Convertible Senior Notes
41 Convertible Senior Notes US$300 million 4.125% Convertible Notes + 100% Effective Conversion Premium from Capped Call OPTIMIZING PROJECT COST SUCCESSFUL OVERNIGHT FLEXIBLE SETTLEMENT & CAPPED CALL OF CAPITAL EXECUTION REDEMPTION MITIGATES DILUTION Attractive project cost of Successfully executed
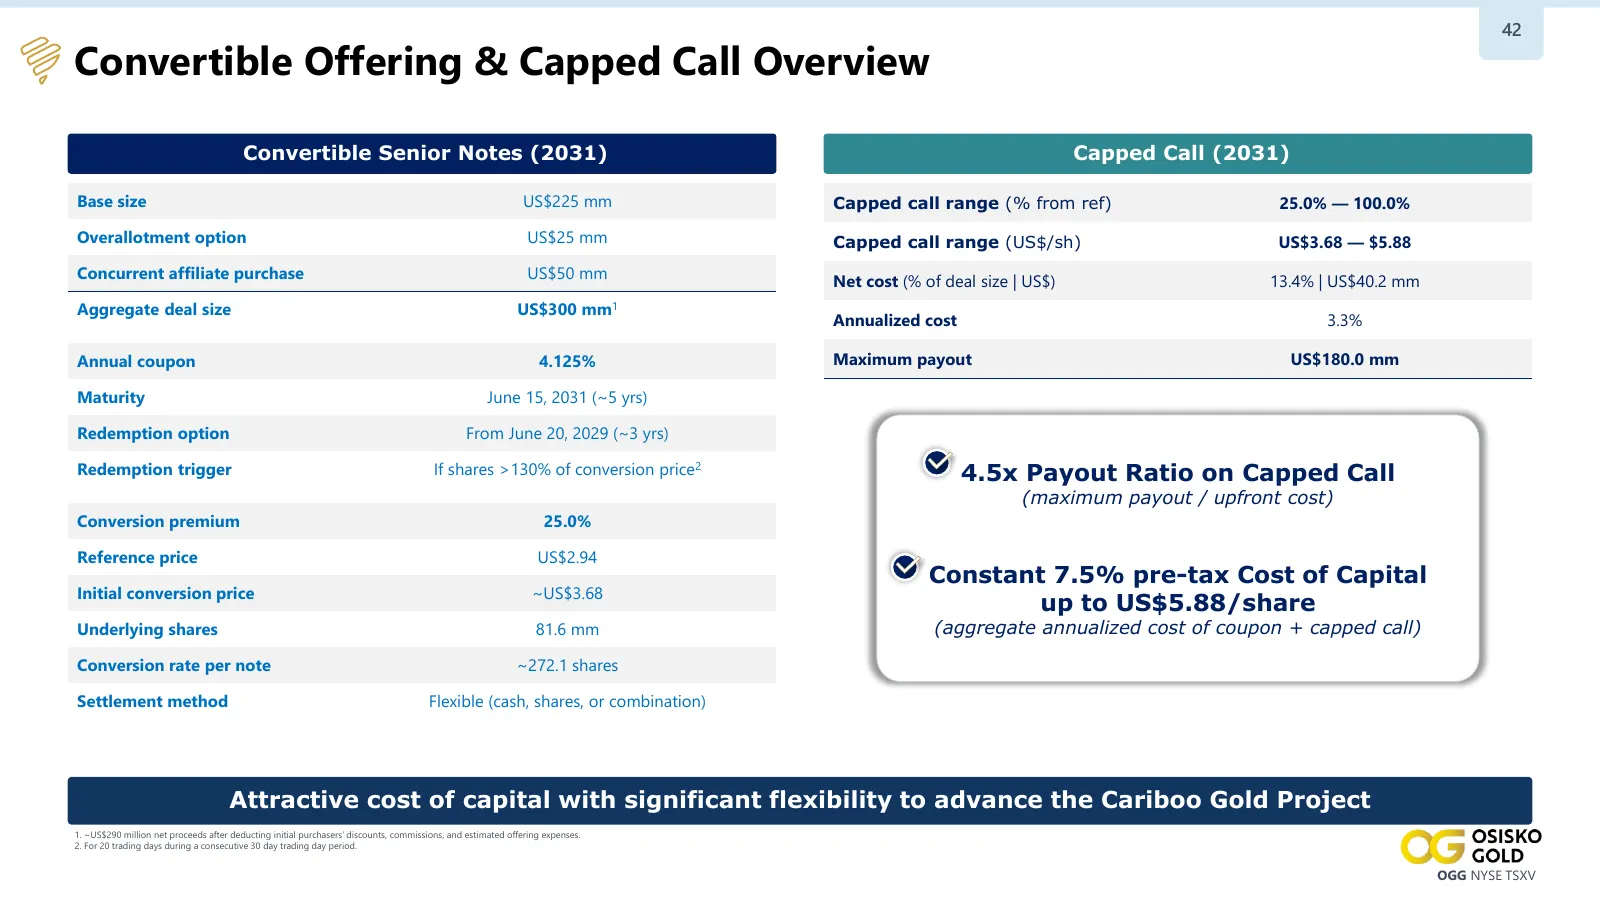
Slide 42: Convertible Offering & Capped Call Overview
42 Convertible Offering & Capped Call Overview Convertible Senior Notes (2031) Capped Call (2031) Base size US$225 mm Capped call range (% from ref) 25.0% — 100.0% Overallotment option US$25 mm Capped call range (US$/sh) US$3.68 — $5.88 Concurrent affiliate purchase US$50 mm Net cost (% of deal size
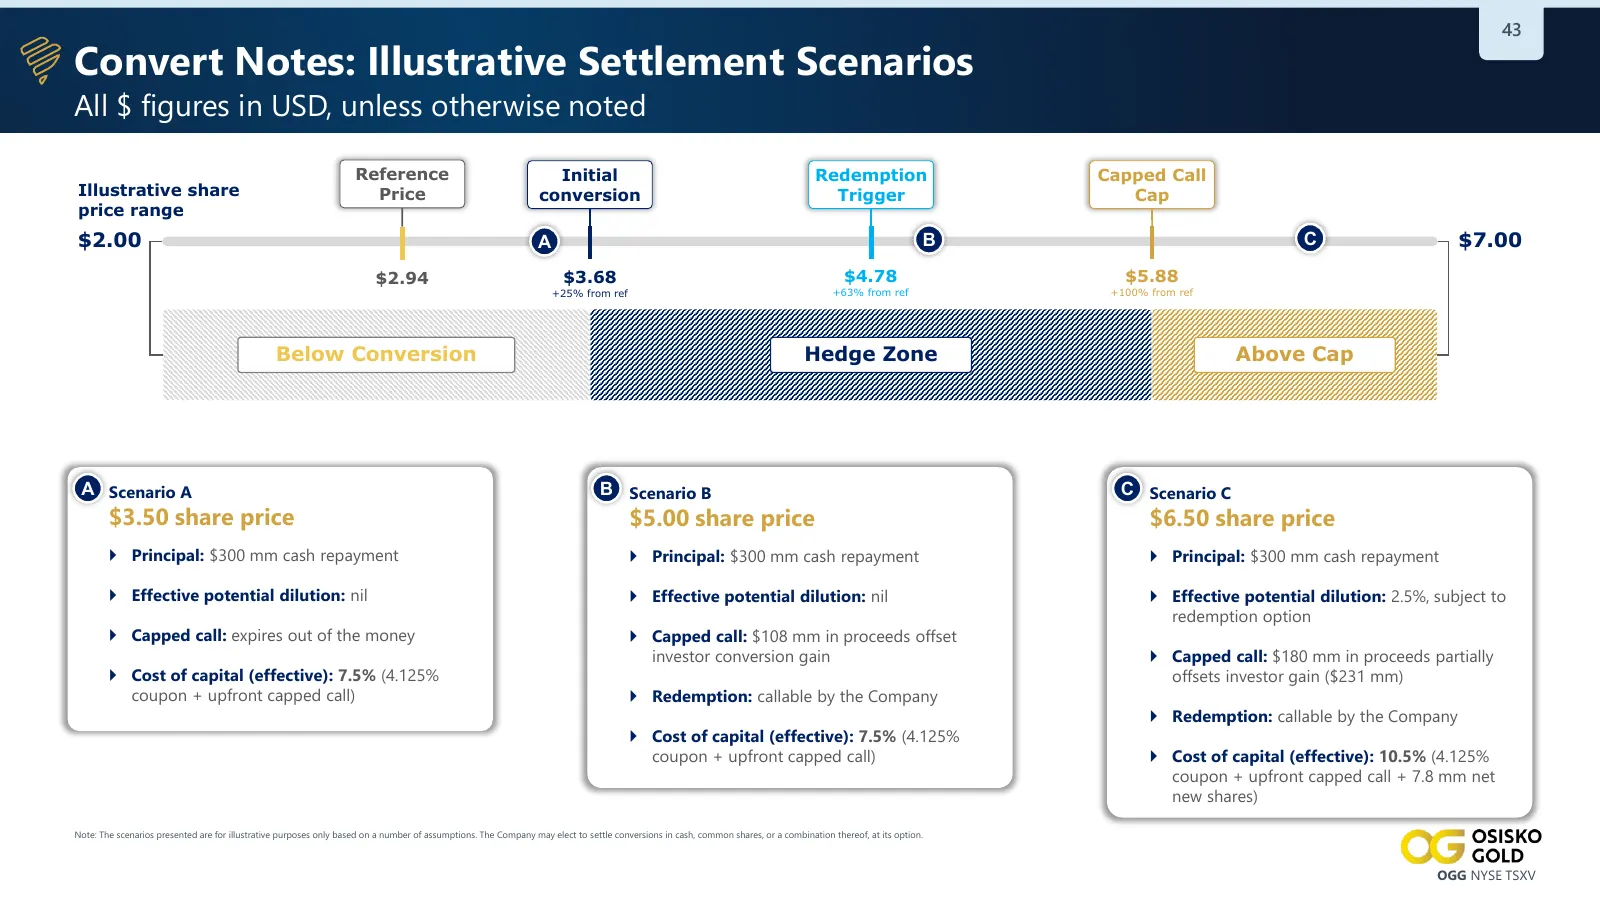
Slide 43: Convert Notes: Illustrative Settlement Scenarios
43 Convert Notes: Illustrative Settlement Scenarios All $ figures in USD, unless otherwise noted Reference Initial Redemption Capped Call Illustrative share Price conversion Trigger Cap price range $2.00 A B C $7.00 $2.94 $3.68 $4.78 $5.88 +25% from ref +63% from ref +100% from ref Below Conversion
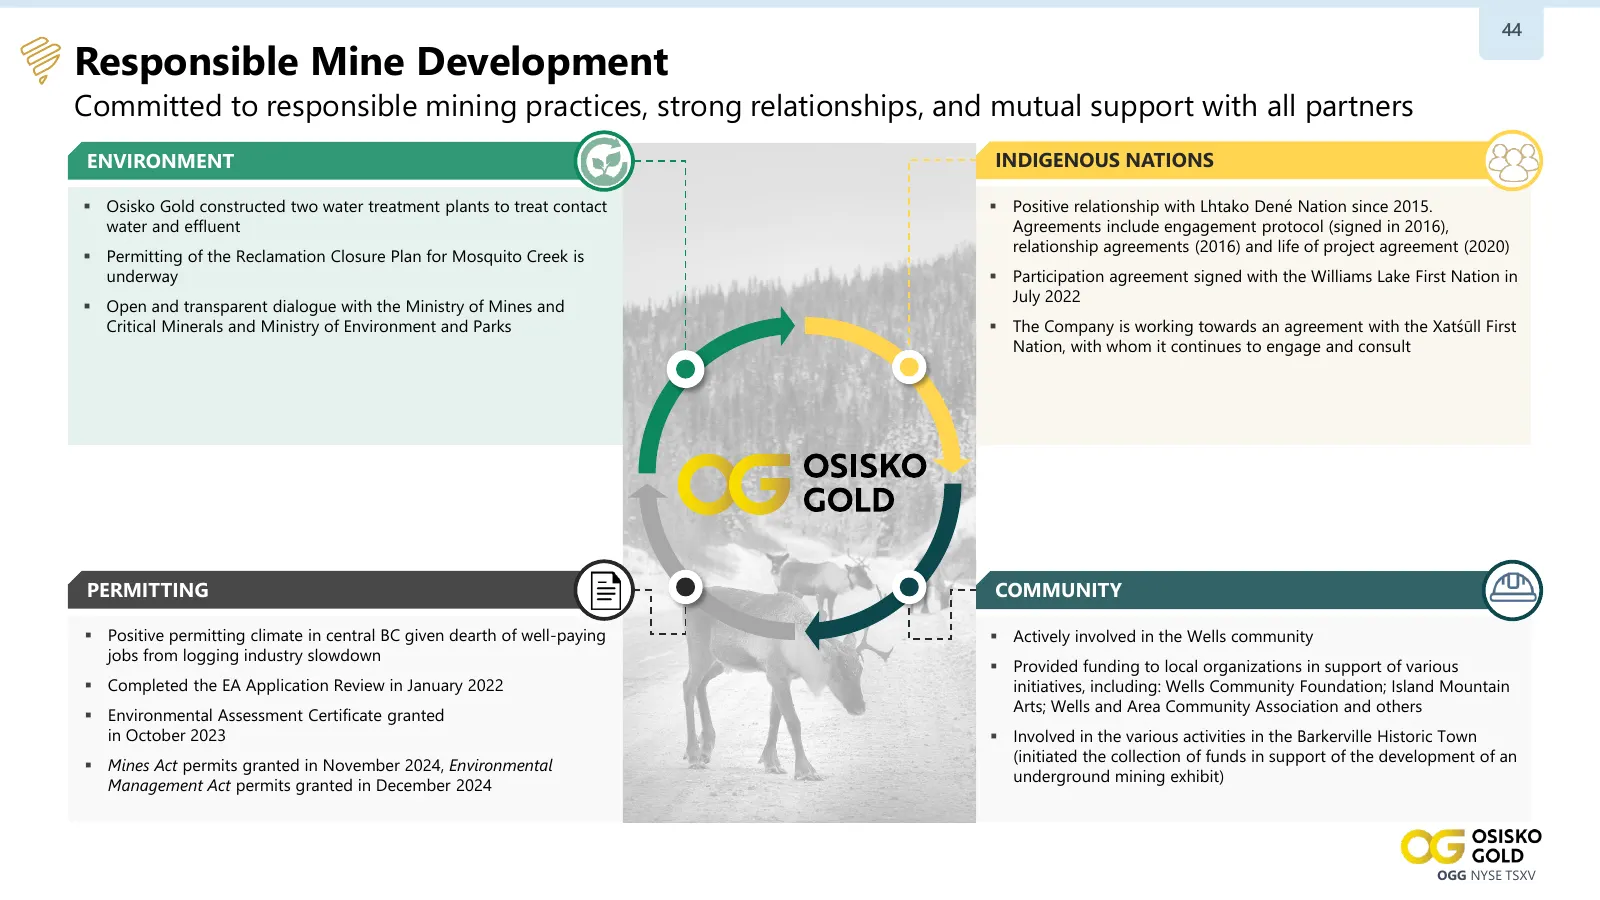
Slide 44: Responsible Mine Development
44 Responsible Mine Development Committed to responsible mining practices, strong relationships, and mutual support with all partners ENVIRONMENT INDIGENOUS NATIONS ▪ Osisko Gold constructed two water treatment plants to treat contact ▪ Positive relationship with Lhtako Dené Nation since 2015. water
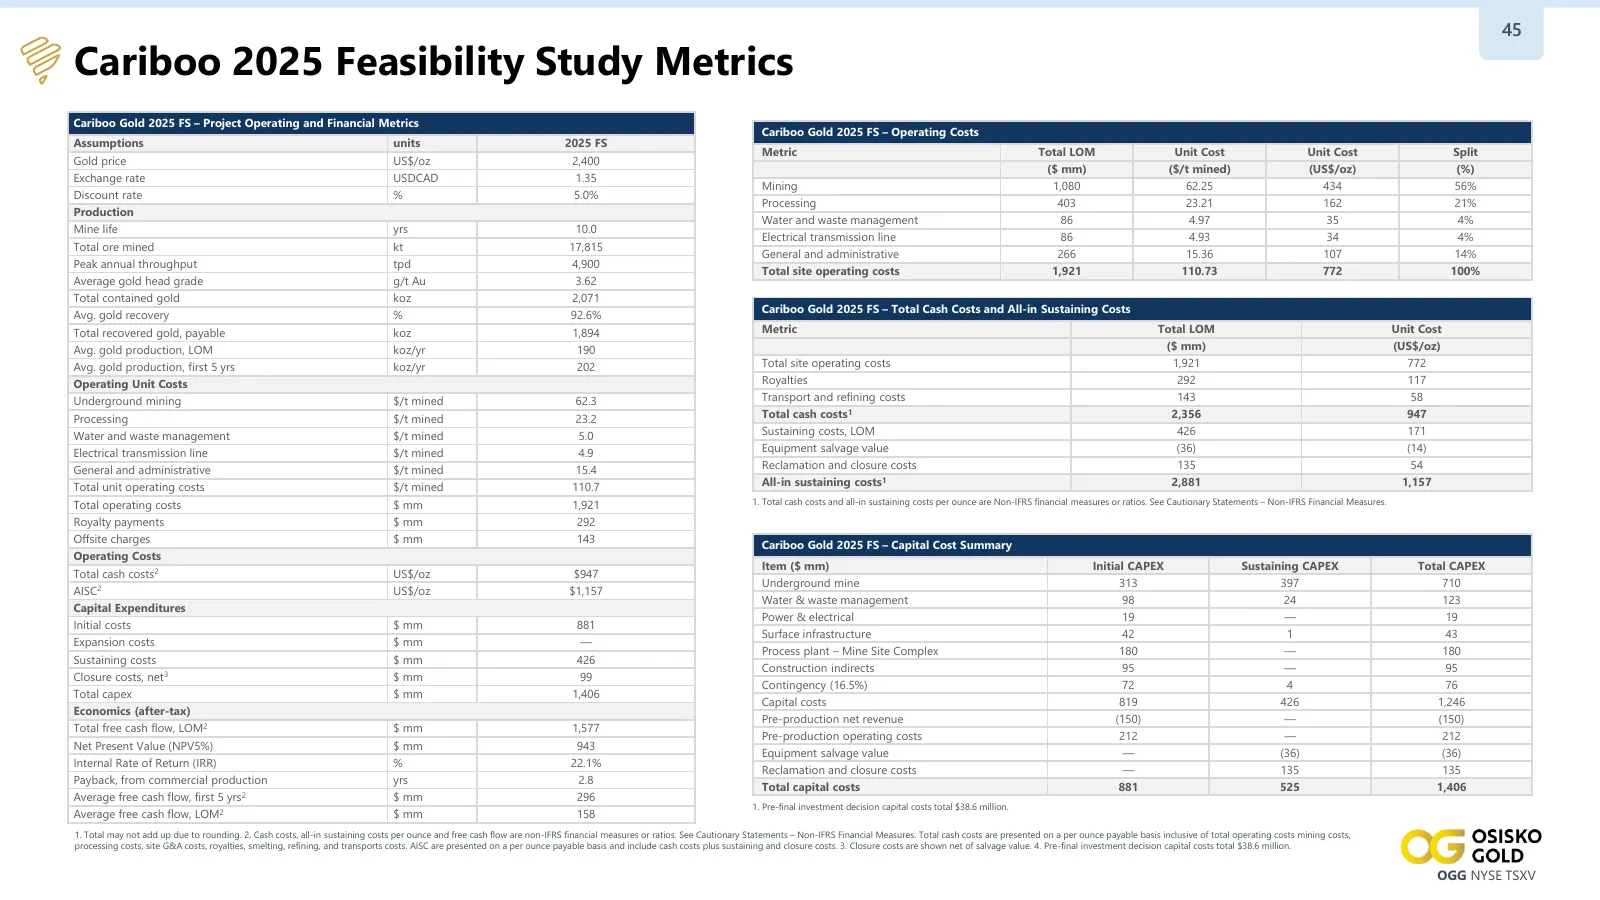
Slide 45: Cariboo 2025 Feasibility Study Metrics
45 Cariboo 2025 Feasibility Study Metrics Cariboo Gold 2025 FS – Project Operating and Financial Metrics Cariboo Gold 2025 FS – Operating Costs Assumptions units 2025 FS Metric Total LOM Unit Cost Unit Cost Split Gold price US$/oz 2,400 ($ mm) ($/t mined) (US$/oz) (%) Exchange rate USDCAD 1.35 Minin
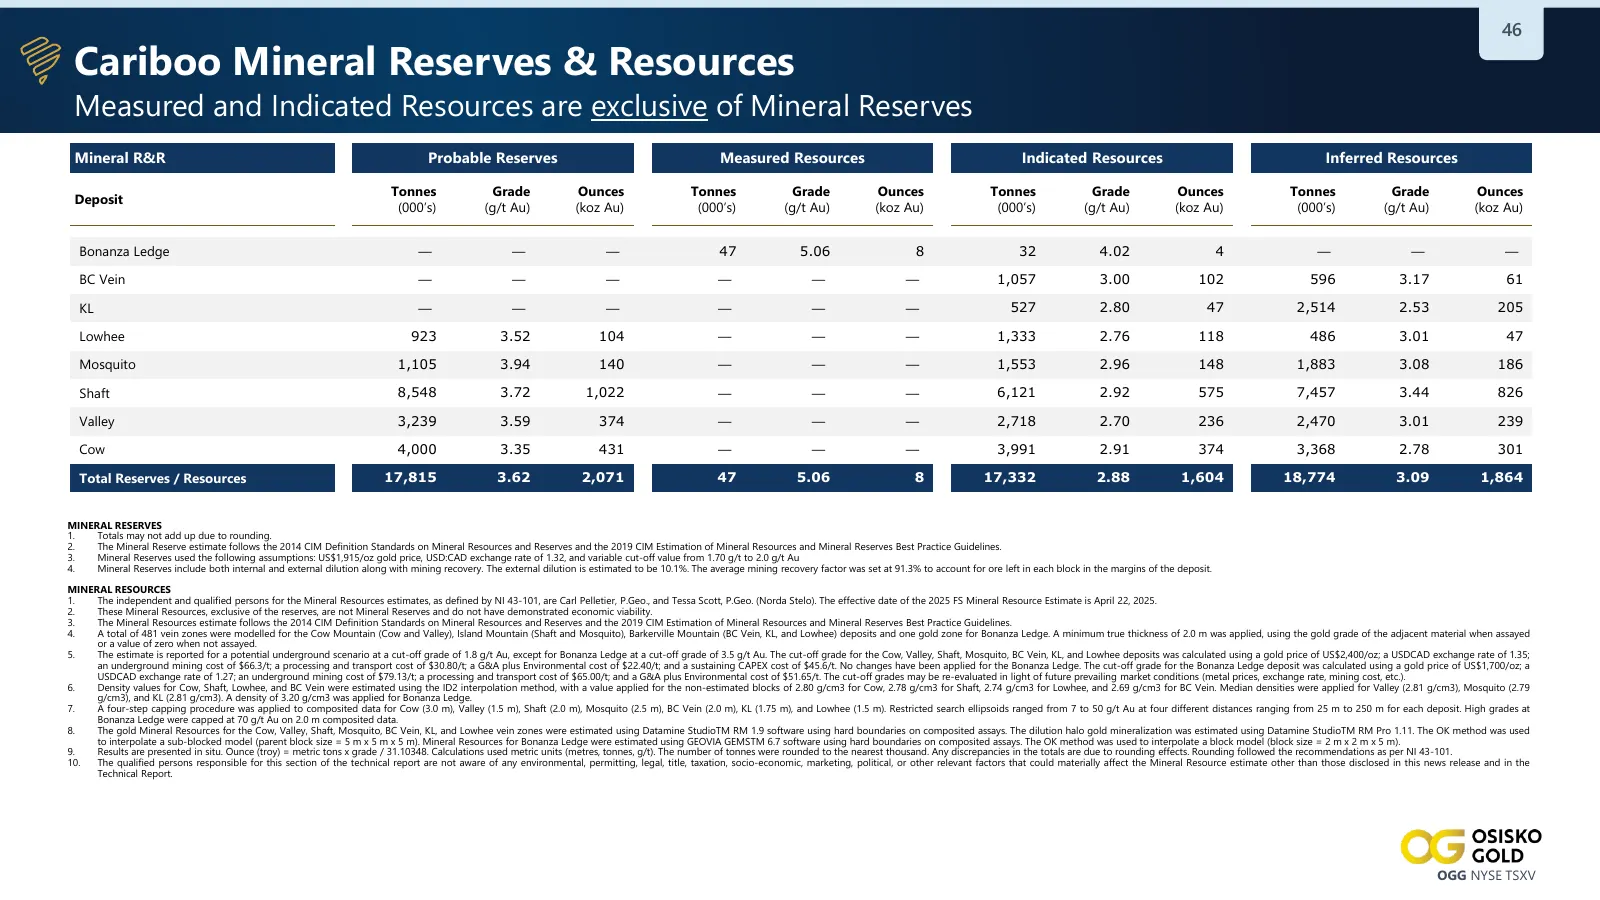
Slide 46: Cariboo Mineral Reserves & Resources
46 Cariboo Mineral Reserves & Resources Measured and Indicated Resources are exclusive of Mineral Reserves Mineral R&R Probable Reserves Measured Resources Indicated Resources Inferred Resources Tonnes Grade Ounces Tonnes Grade Ounces Tonnes Grade Ounces Tonnes Grade Ounces Deposit (000’s) (g/t Au)
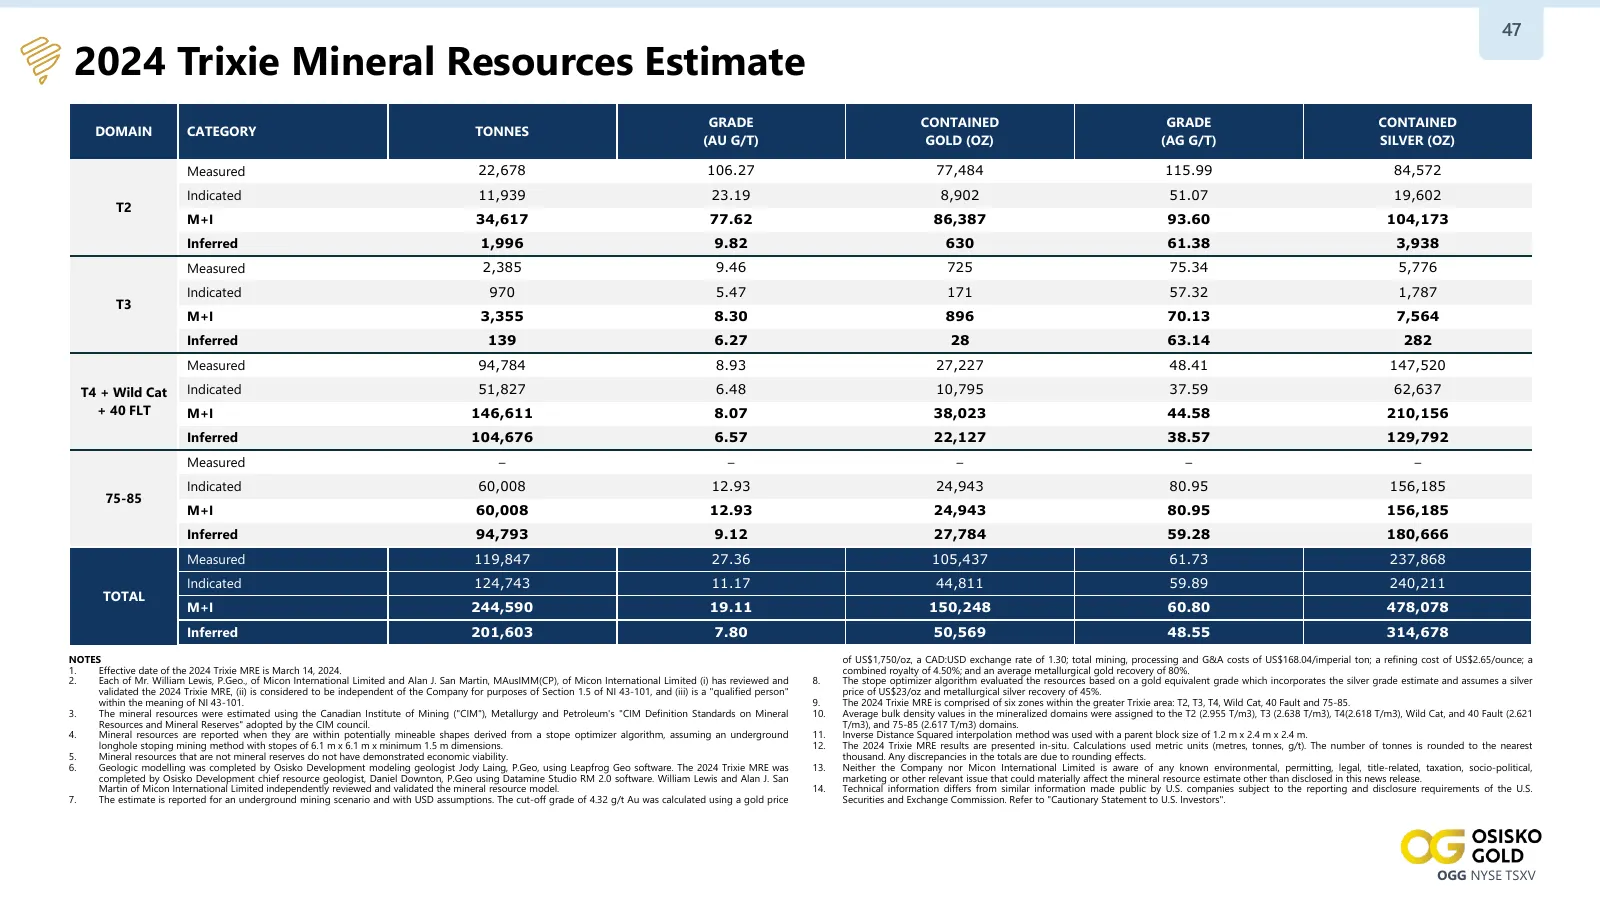
Slide 47: 2024 Trixie Mineral Resources Estimate
47 2024 Trixie Mineral Resources Estimate GRADE CONTAINED GRADE CONTAINED DOMAIN CATEGORY TONNES (AU G/T) GOLD (OZ) (AG G/T) SILVER (OZ) Measured 22,678 106.27 77,484 115.99 84,572 Indicated 11,939 23.19 8,902 51.07 19,602 T2 M+I 34,617 77.62 86,387 93.60 104,173 Inferred 1,996 9.82 630 61.38 3,938
Slide 48: Investor Relations Contact
48 PHILIP RABENOK, VICE PRESIDENT, INVESTOR RELATIONS prabenok@osiskogold.ca | +1 (437) 423 3644 OGG NYSE TSXV | osiskogold.ca OGG NYSE TSXV
Source: company website
More decks from Osisko Gold Group Inc.
 Investor Presentation (October 2026)48 slides · October 2026
 Investor Presentation (October 2026)48 slides · October 2026
 Investor Presentation (September 2026)48 slides · September 2026
 Debt Investor Presentation (June 2026)15 slides · June 2026
 Investor Presentation (March 2026)44 slides · March 2026
 Investor Presentation (March 2026)9 slides · March 2026