Aryzta AG · SIX:ARYN
Aryzta — FY2014 Earnings Presentation
50 slides from Aryzta's earnings presentation, Sep 29, 2014
Slide 1: ARYZTA AG FY 2014 Results
ARYZTA AG FY 2014 Results 29 September 2014
Slide 2: Forward Looking Statement
Forward Looking Statement This document contains forward looking statements which reflect management’s current views and estimates. The forward looking statements involve certain risks and uncertainties that could cause actual results to differ materially from those contained in the forward looking
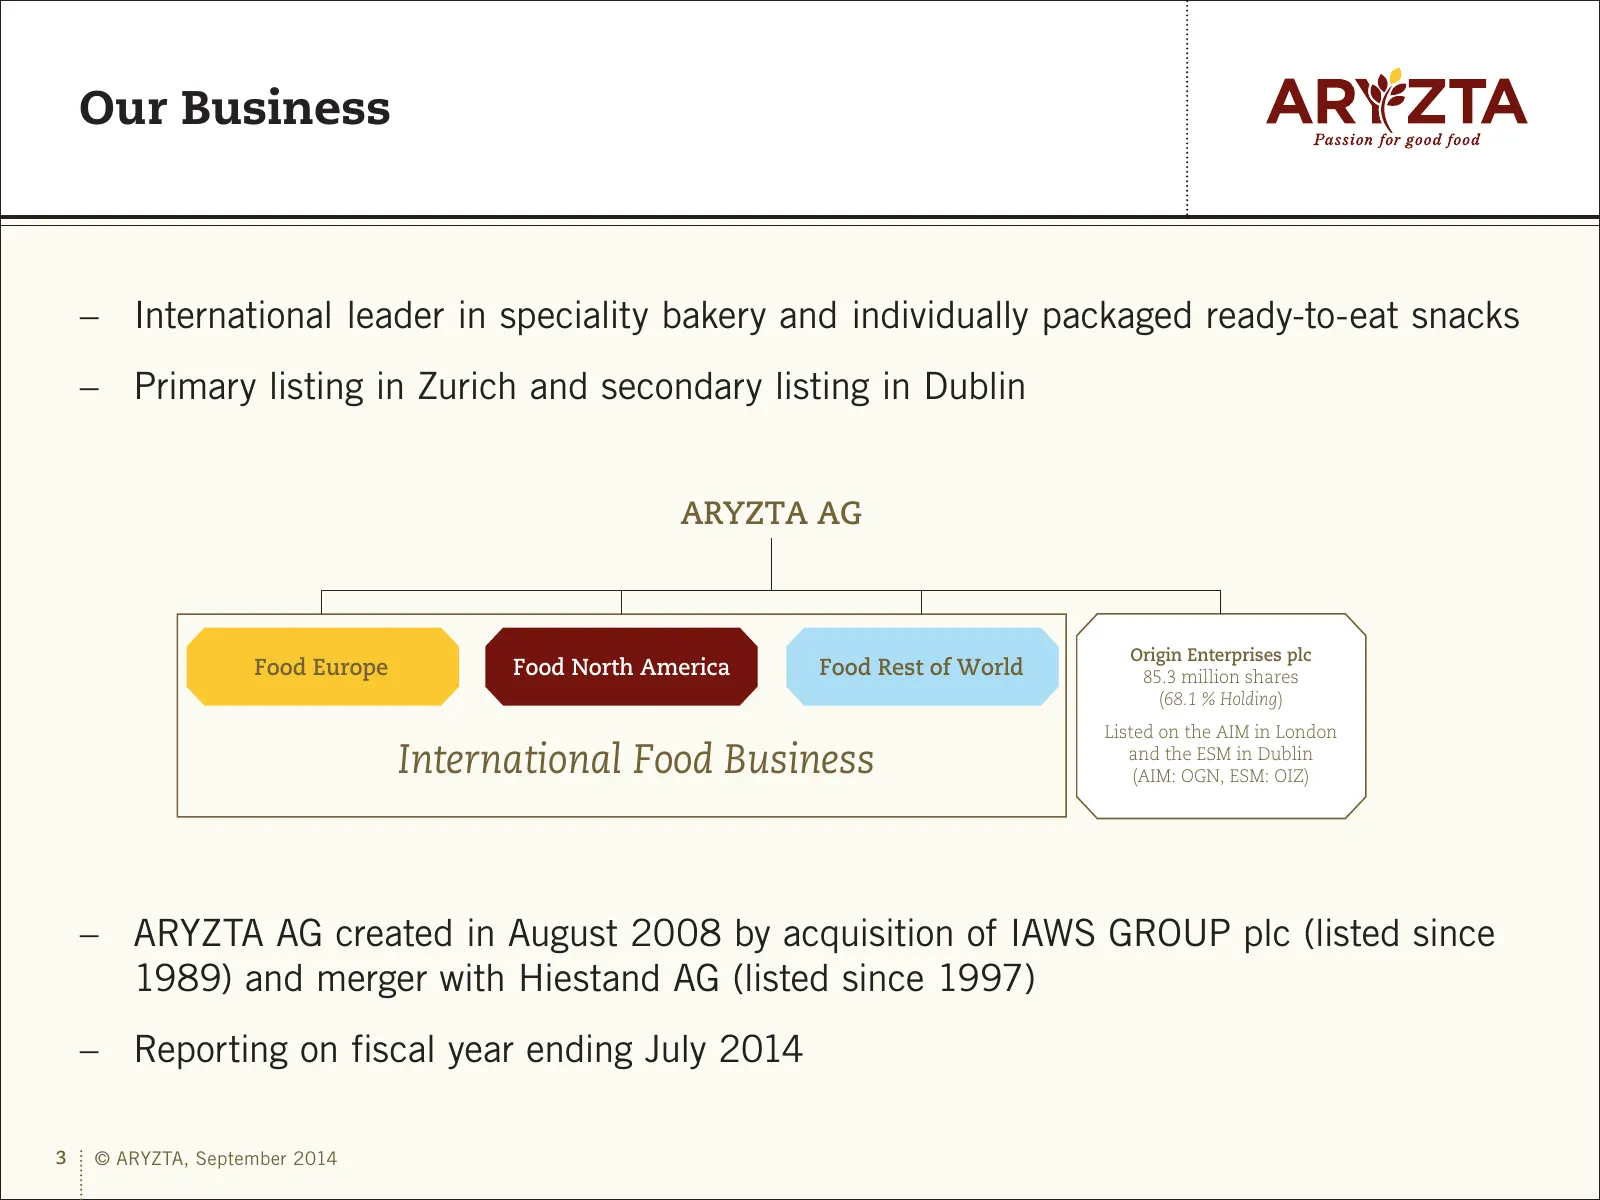
Slide 3: Our Business
Our Business –– International leader in speciality bakery and individually packaged ready-to-eat snacks –– Primary listing in Zurich and secondary listing in Dublin ARYZTA AG Origin Enterprises plc Origin Enterprises plc Food Europe Food North America Food Rest of World 85.3 million shares (68.1 % H
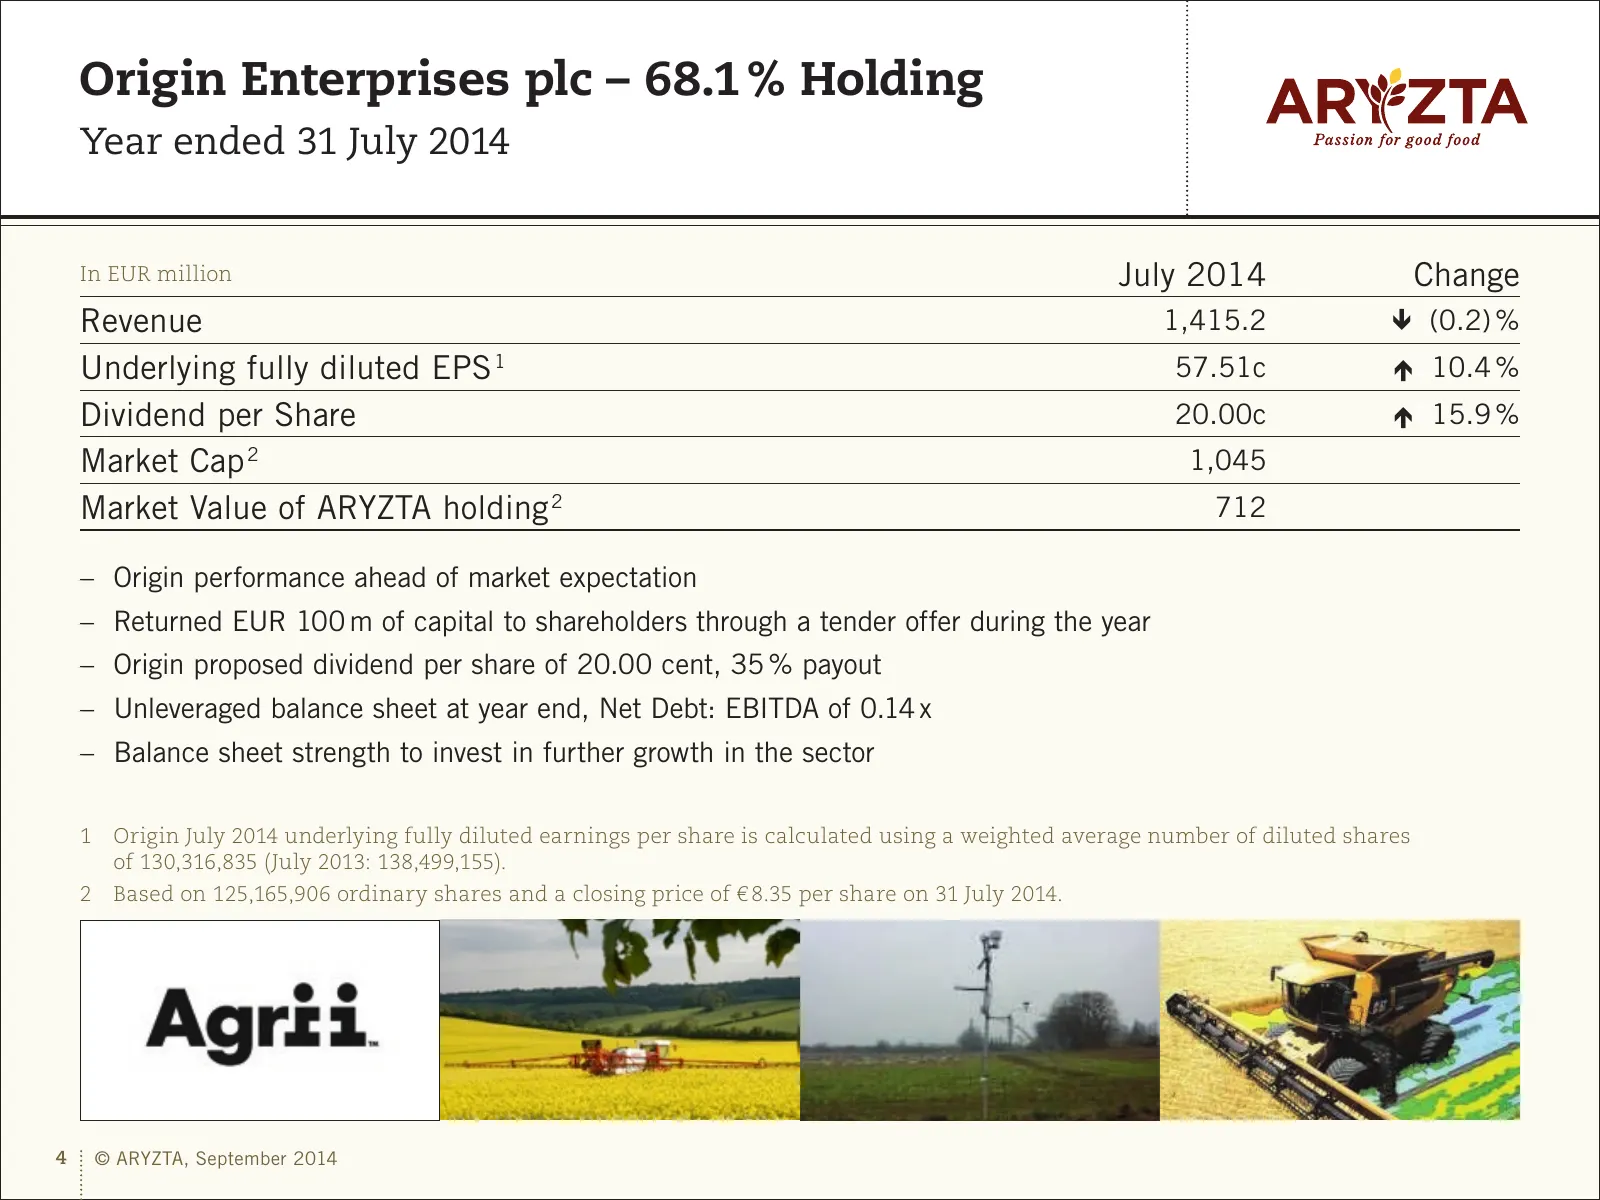
Slide 4: Origin Enterprises plc – 68.1 % Holding
Origin Enterprises plc – 68.1 % Holding Year ended 31 July 2014 In EUR million July 2014 Change Revenue 1,415.2 0(0.2) % Underlying fully diluted EPS 1 57.51c 010.4 % Dividend per Share 20.00c 015.9 % Market Cap 2 1,045 Market Value of ARYZTA holding 2 712 –– Origin performance ahead of market ex
Slide 5: ARYZTA Food Group Repositioning Since September 2011
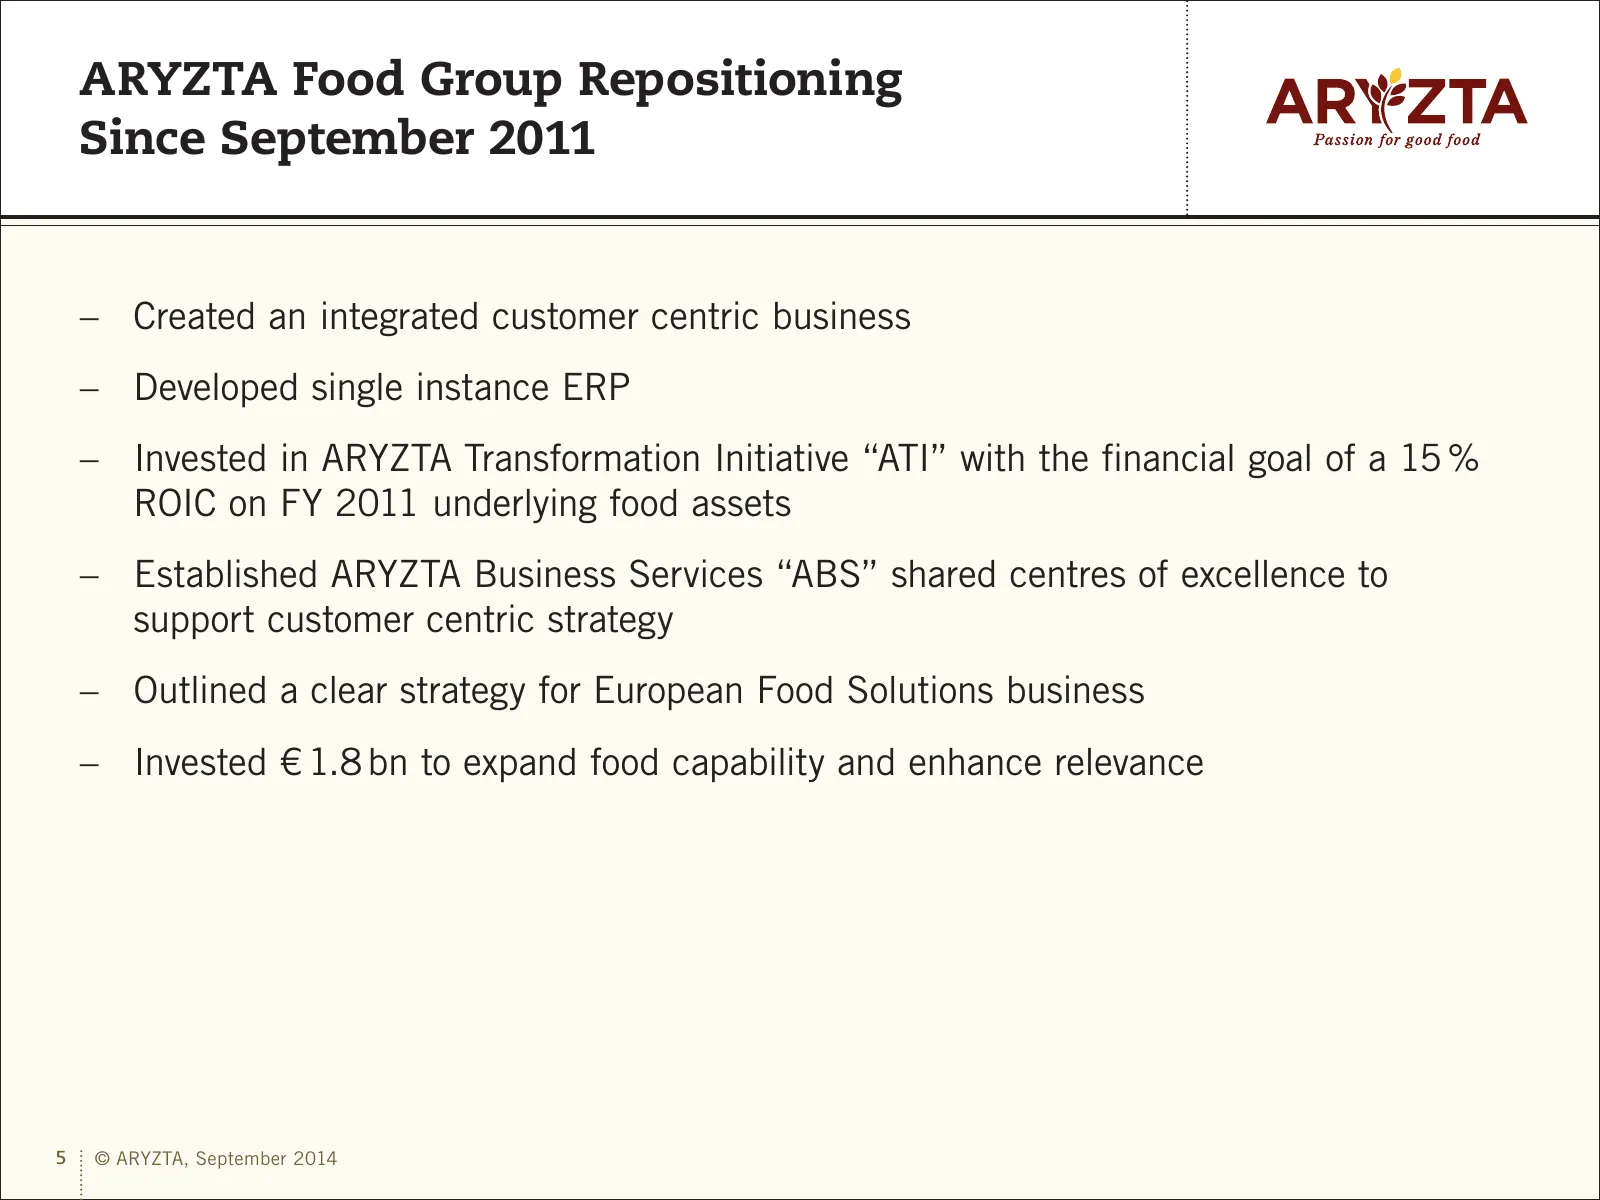
ARYZTA Food Group Repositioning Since September 2011 –– Created an integrated customer centric business –– Developed single instance ERP –– Invested in ARYZTA Transformation Initiative “ATI” with the financial goal of a 15 % ROIC on FY 2011 underlying food assets –– Established ARYZTA Business Servi
Slide 6: Repositioned Food Group Revenue Profile
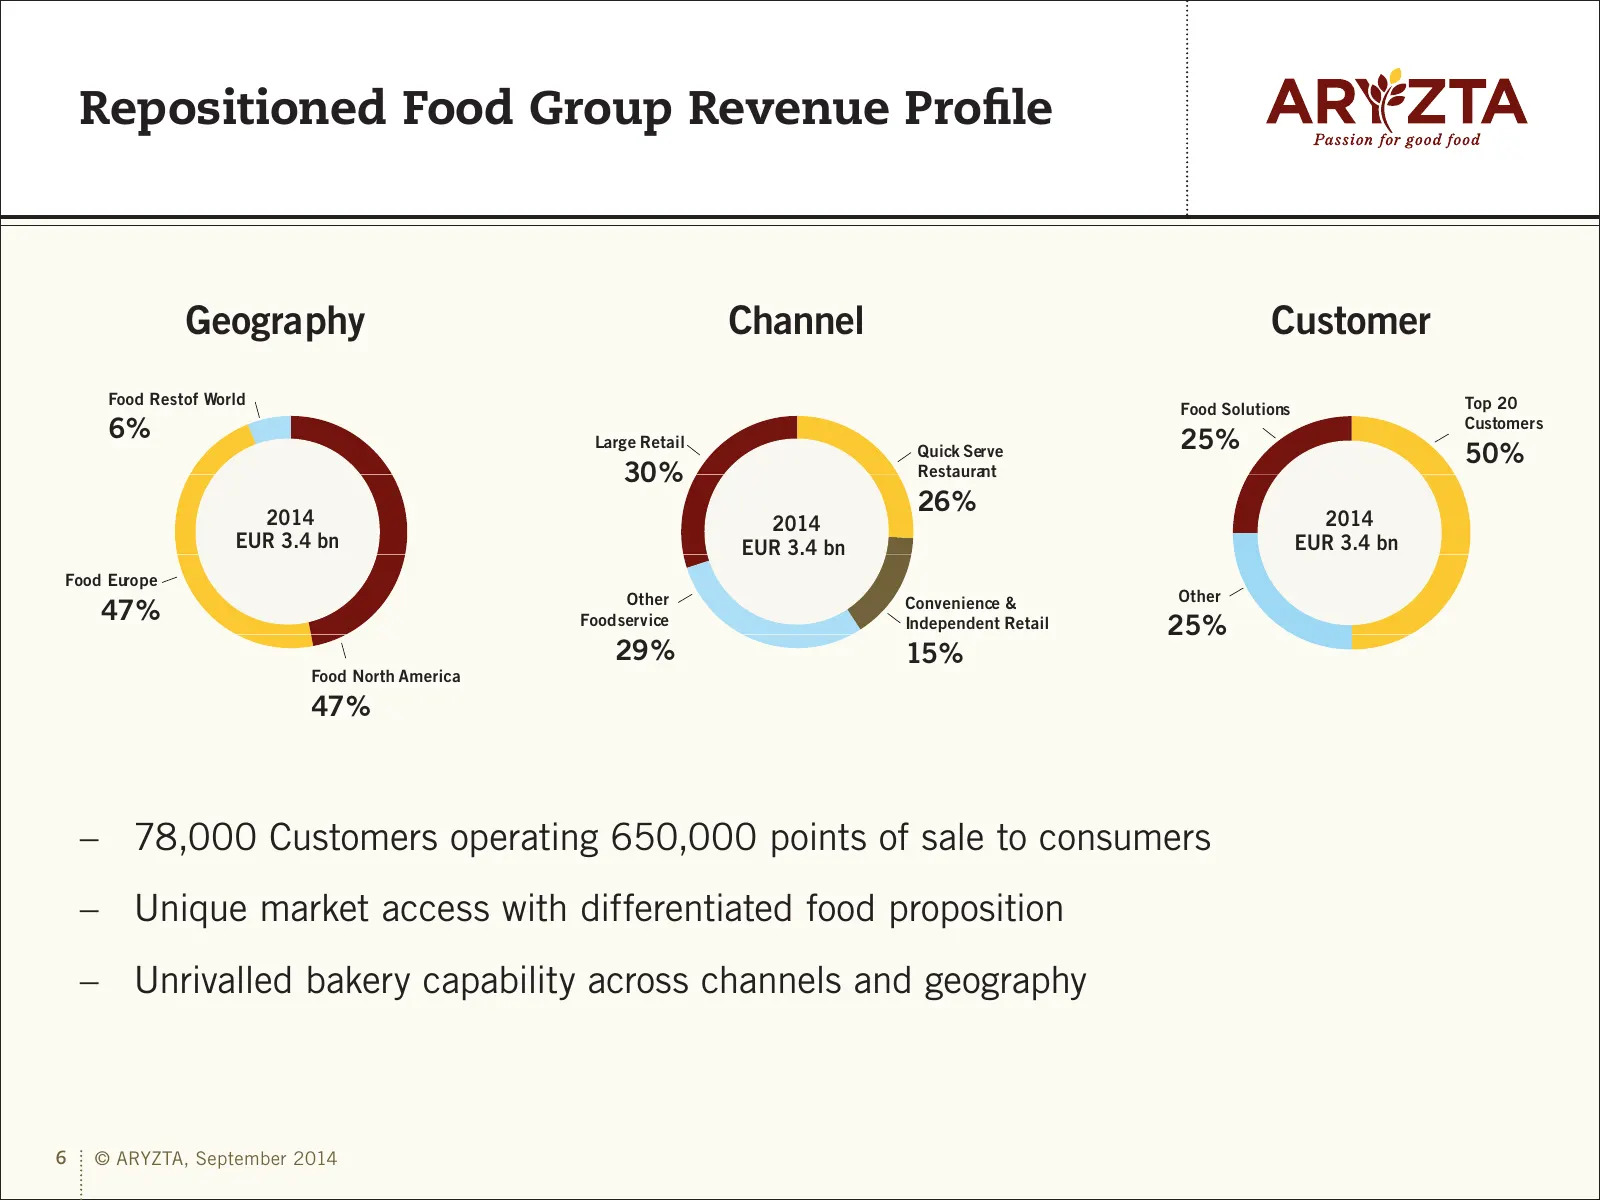
Repositioned Food Group Revenue Profile Geography Channel Customer Food Restof World Top 20 Food Solutions 6% Large Retail 25% Customers Quick Serve 50% 30 % Restaurant 2014 26% 2014 2014 EUR 3.4 bn EUR 3.4 bn EUR 3.4 bn Food Europe Other Other 47 % Convenience & Foodservice Independent Retail 25% 2
Slide 7: Key Customer Partnership Model
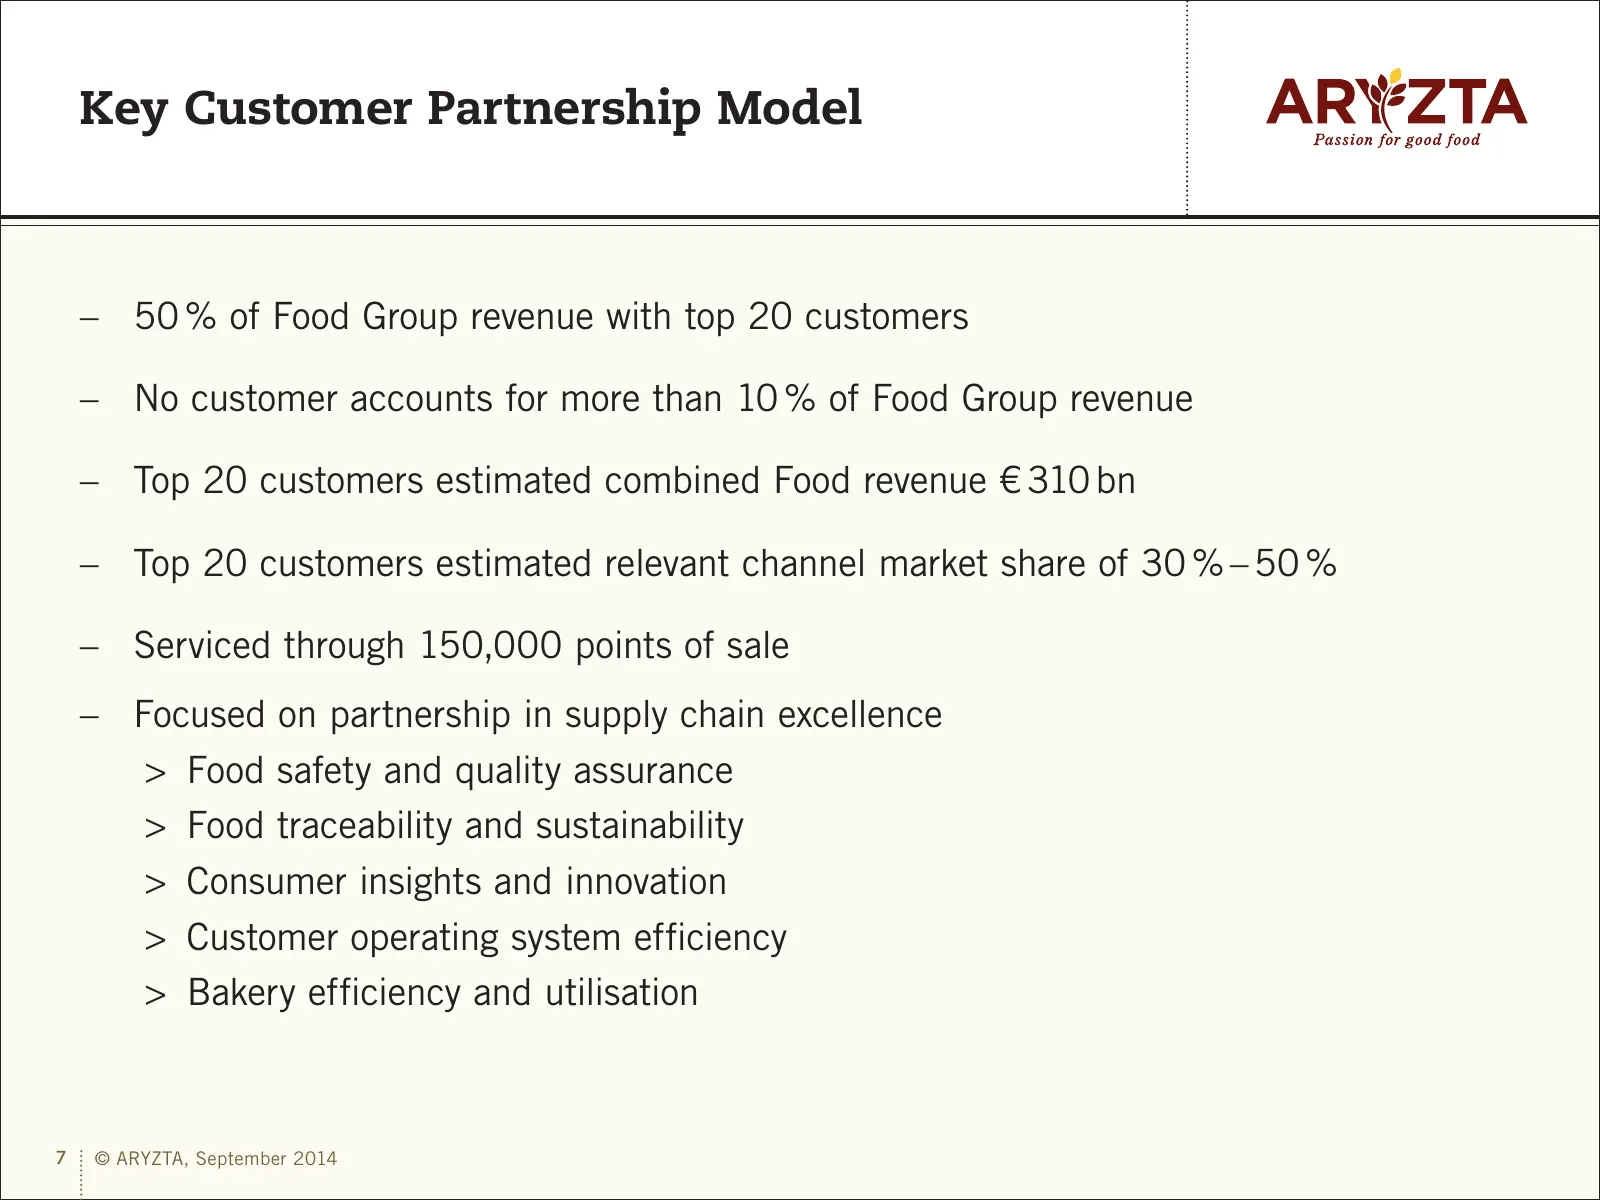
Key Customer Partnership Model –– 50 % of Food Group revenue with top 20 customers –– No customer accounts for more than 10 % of Food Group revenue –– Top 20 customers estimated combined Food revenue € 310 bn –– Top 20 customers estimated relevant channel market share of 30 % – 50 % –– Serviced thro
Slide 8: New strategy for European Food Solutions Business
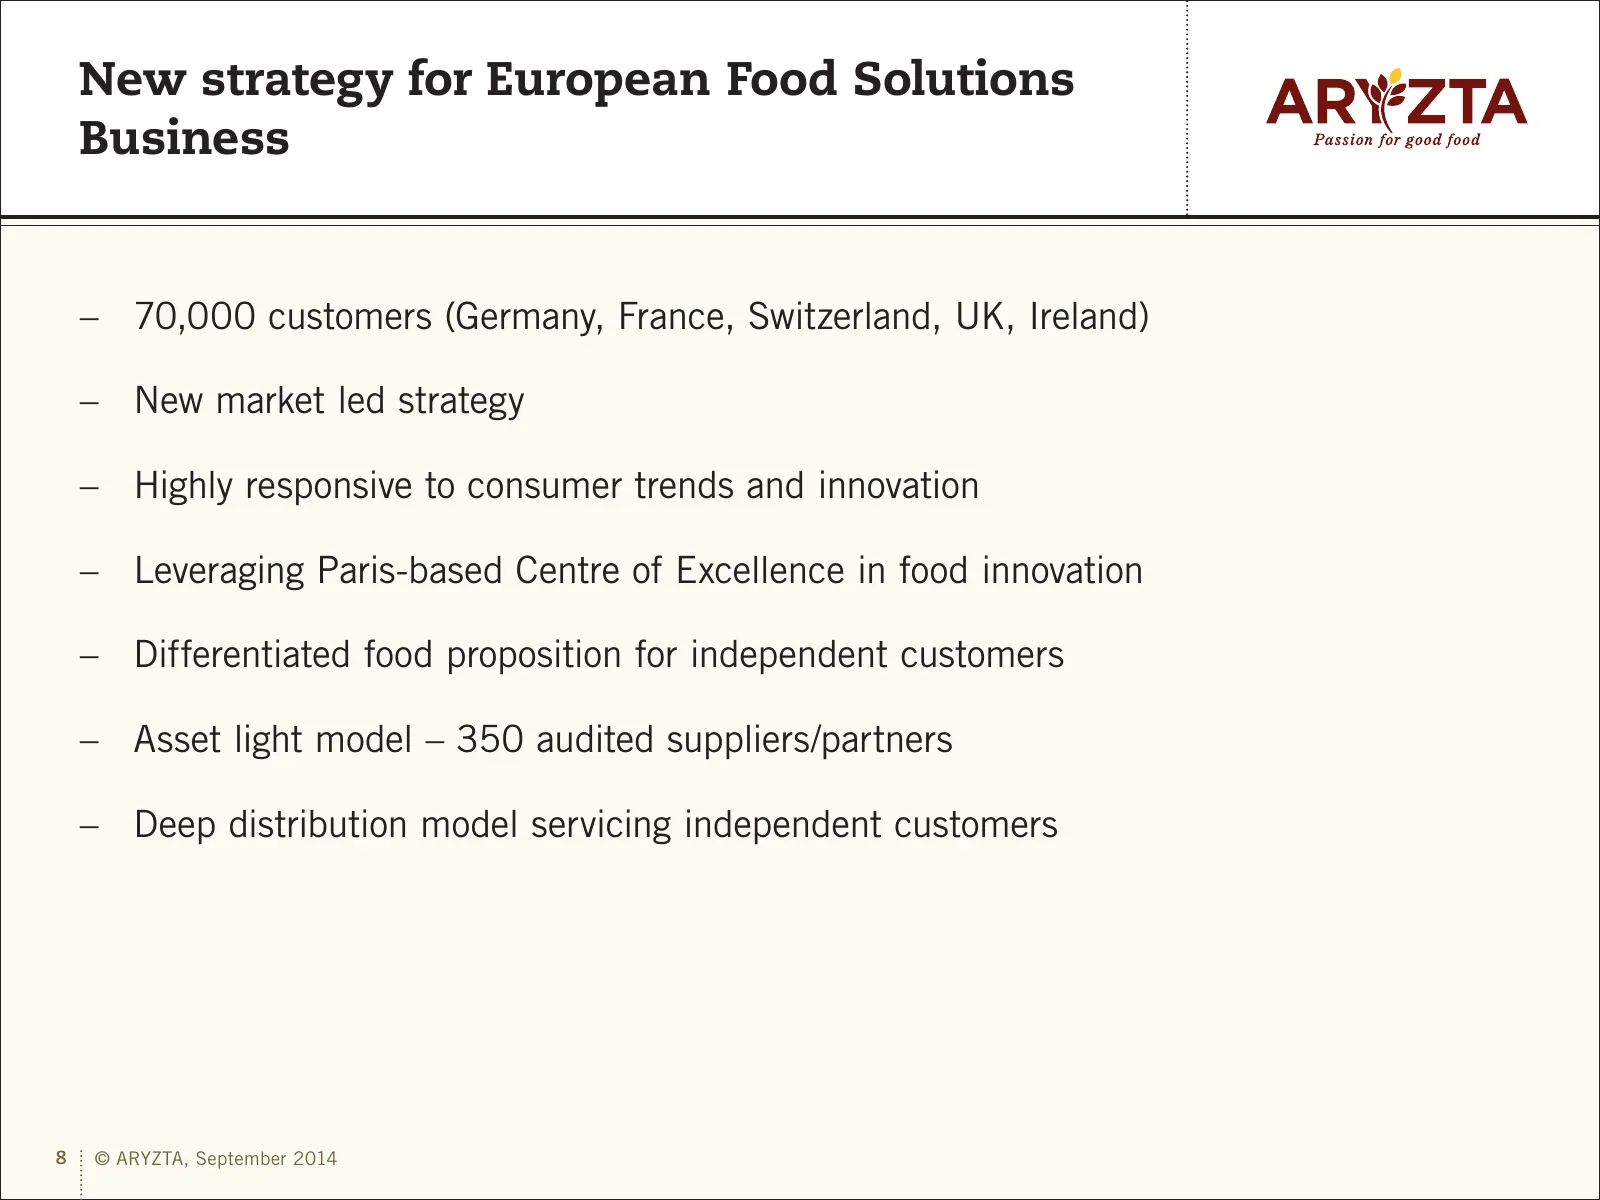
New strategy for European Food Solutions Business –– 70,000 customers (Germany, France, Switzerland, UK, Ireland) –– New market led strategy –– Highly responsive to consumer trends and innovation –– Leveraging Paris-based Centre of Excellence in food innovation –– Differentiated food proposition for
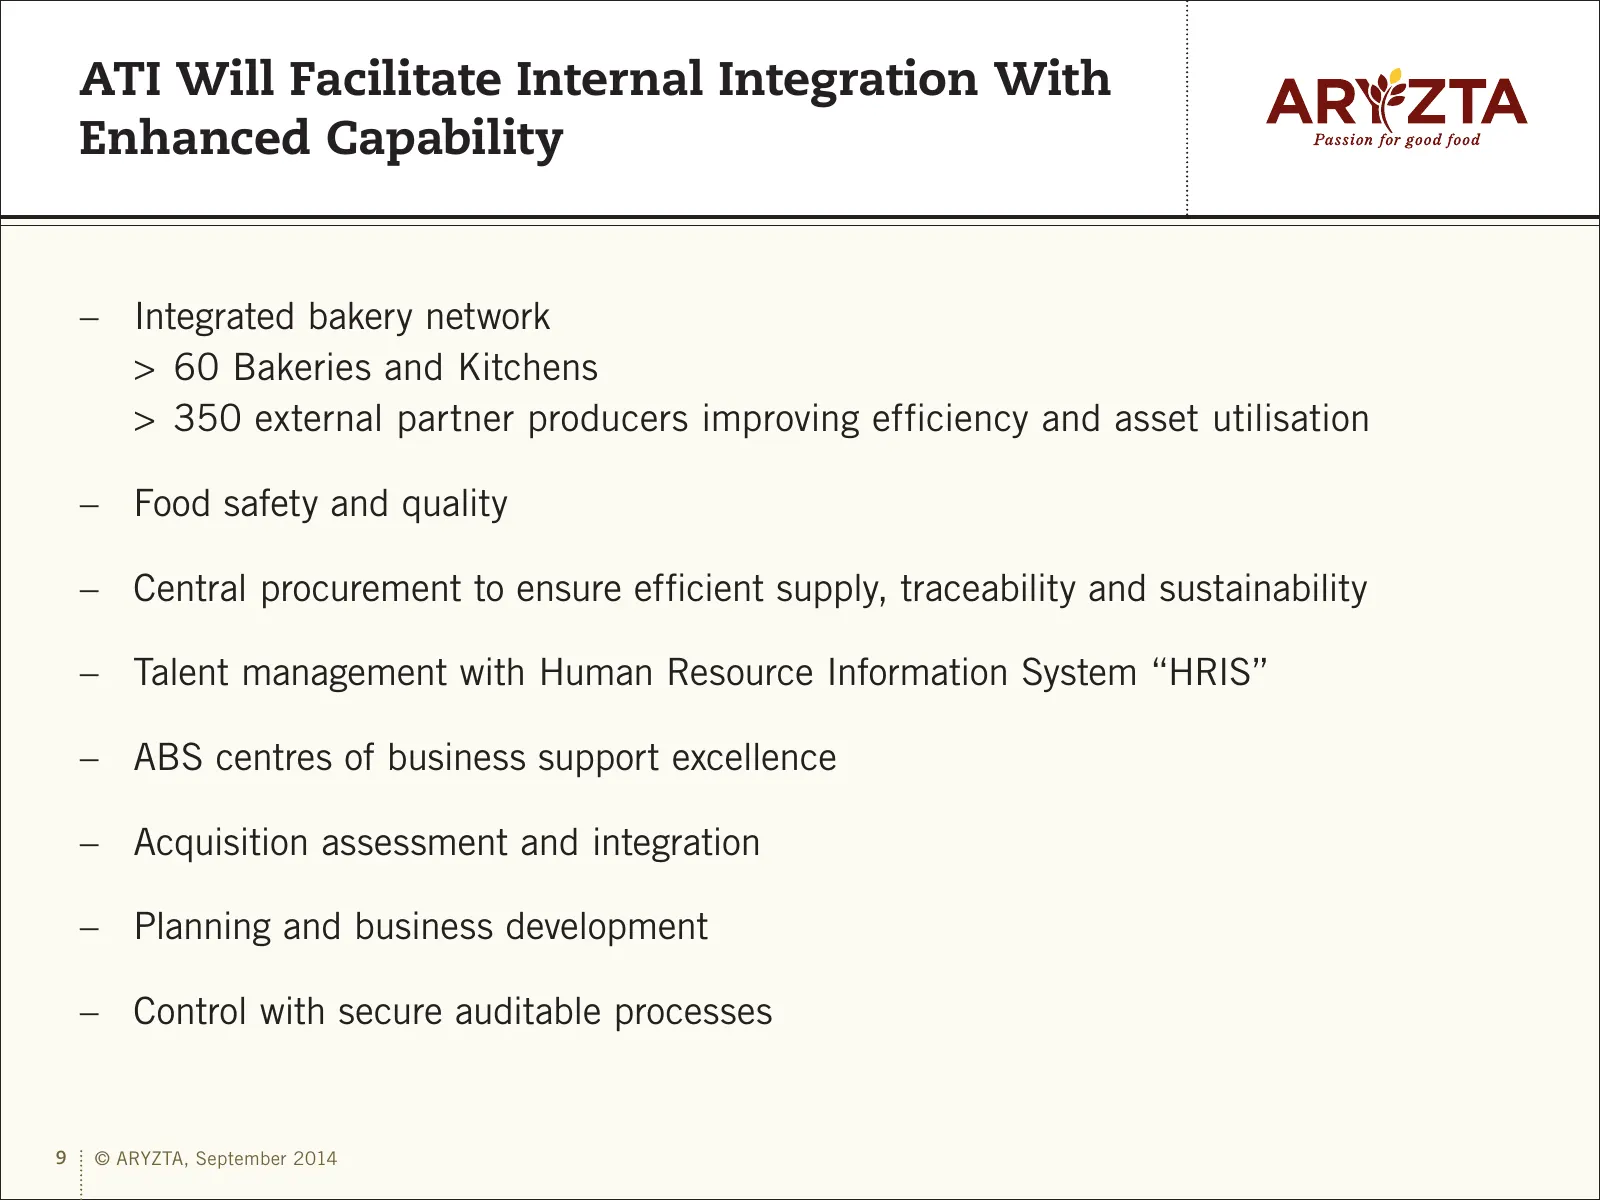
Slide 9: ATI Will Facilitate Internal Integration With Enhanced Capability
ATI Will Facilitate Internal Integration With Enhanced Capability –– Integrated bakery network >> 60 Bakeries and Kitchens >> 350 external partner producers improving efficiency and asset utilisation –– Food safety and quality –– Central procurement to ensure efficient supply, traceability and susta
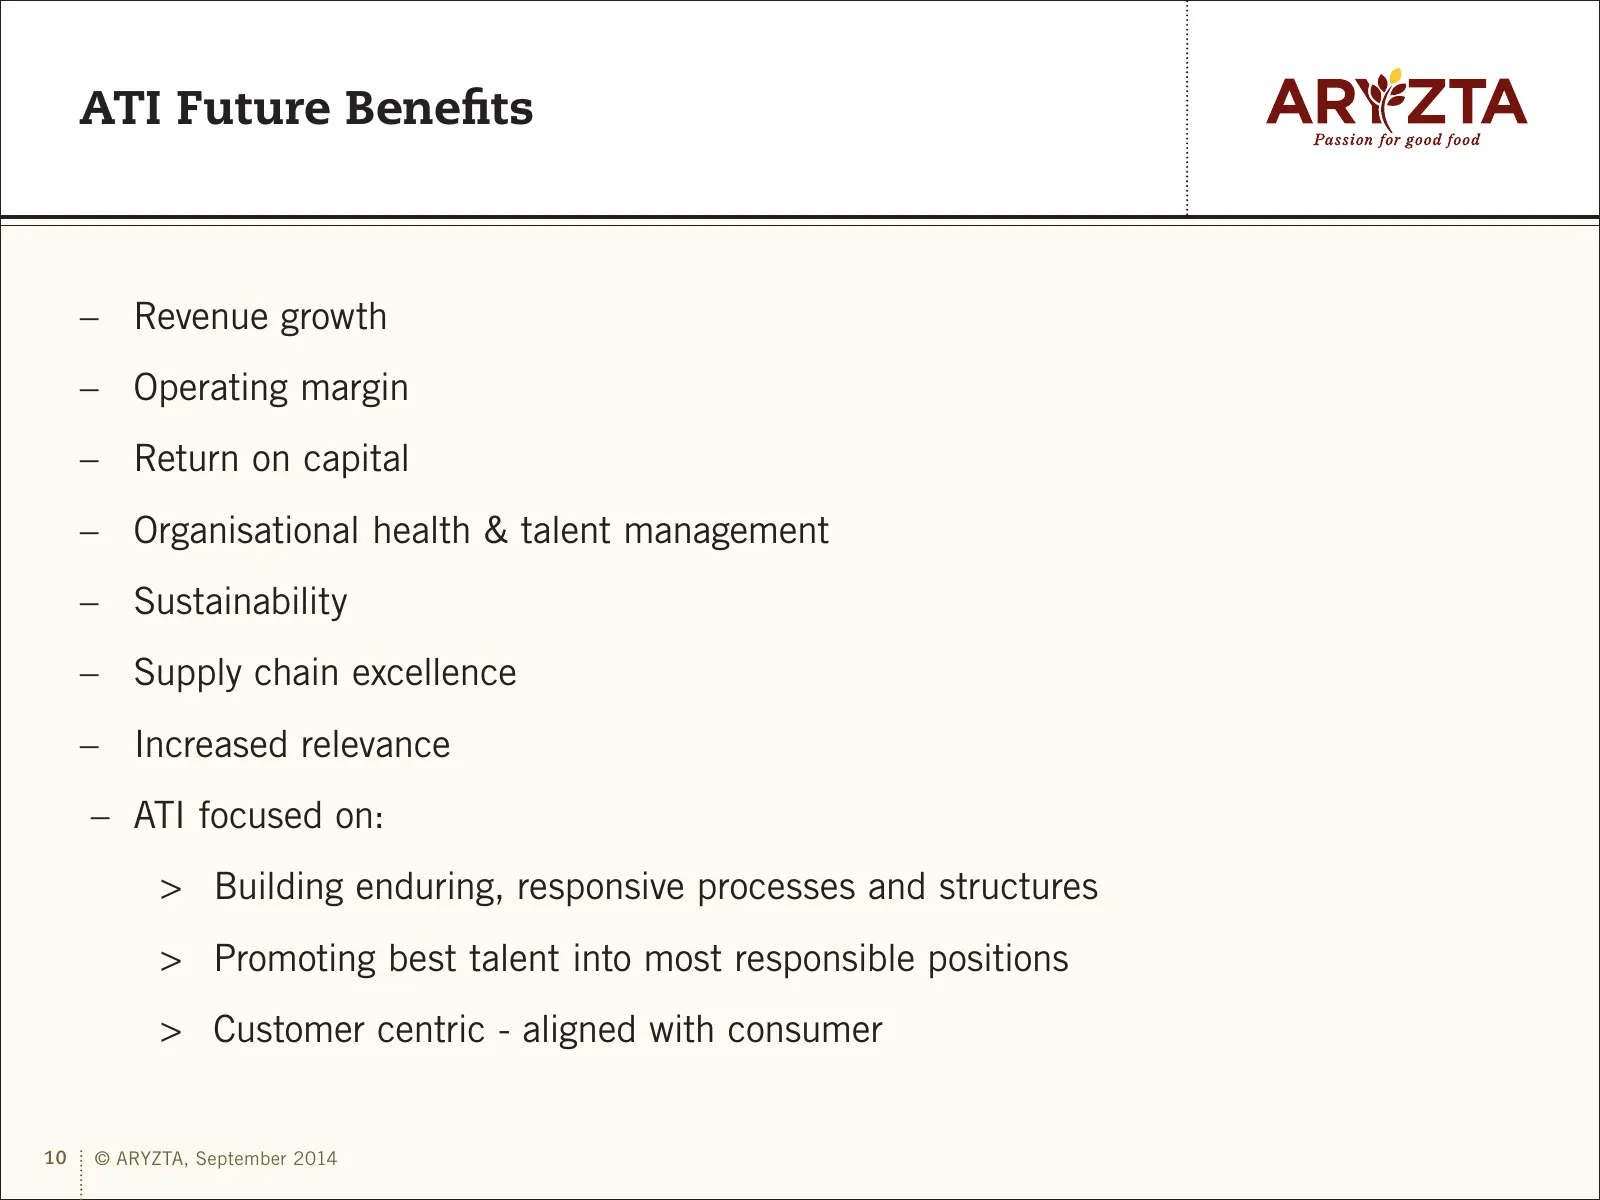
Slide 10: ATI Future Benefits
ATI Future Benefits –– Revenue growth –– Operating margin –– Return on capital –– Organisational health & talent management –– Sustainability –– Supply chain excellence –– Increased relevance –– ATI focused on: >> Building enduring, responsive processes and structures >> Promoting best talent into m
Slide 11: ARYZTA Group Financial and Business Review
ARYZTA Group Financial and Business Review 11 © ARYZTA, September 2014
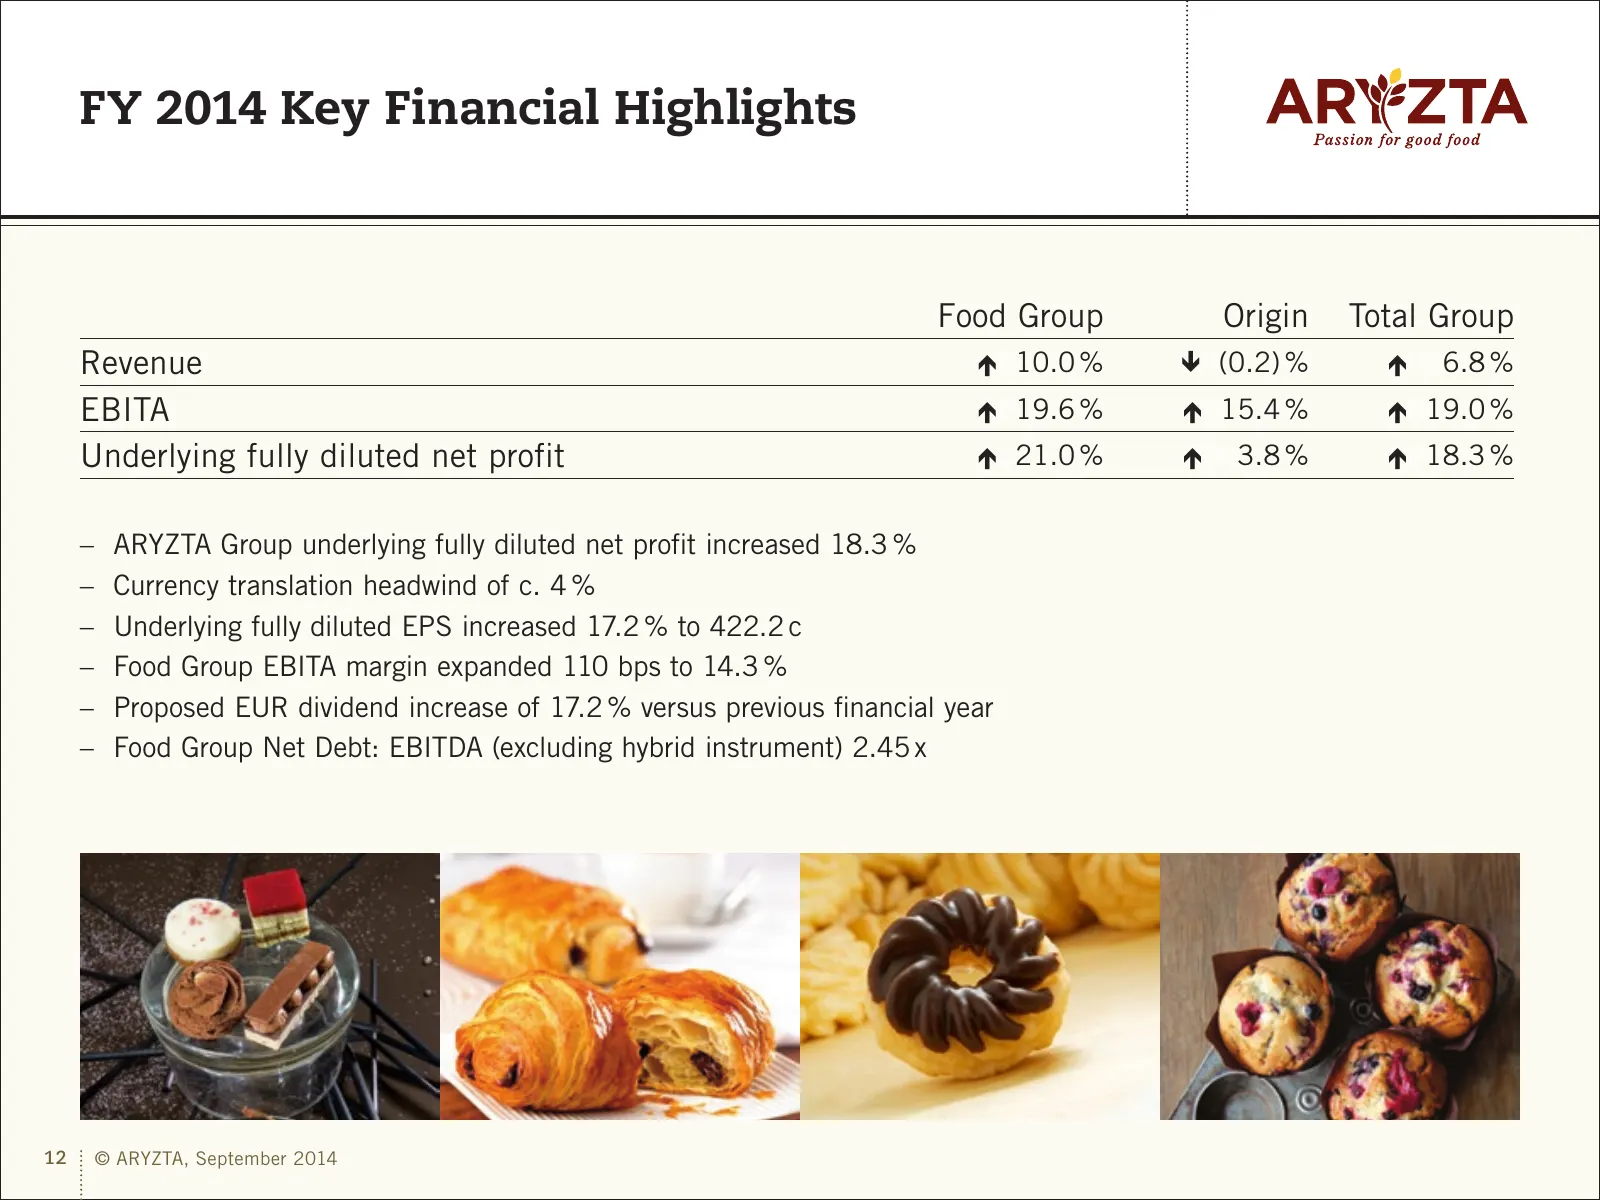
Slide 12: FY 2014 Key Financial Highlights
FY 2014 Key Financial Highlights Food Group Origin Total Group Revenue 010.0 % 0(0.2) % 006.8 % EBITA 019.6 % 015.4 % 019.0 % Underlying fully diluted net profit 021.0 % 003.8 % 018.3 % –– ARYZTA Group underlying fully diluted net profit increased 18.3 % –– Currency translation headwind of
Slide 13: ARYZTA Group – Income Statement
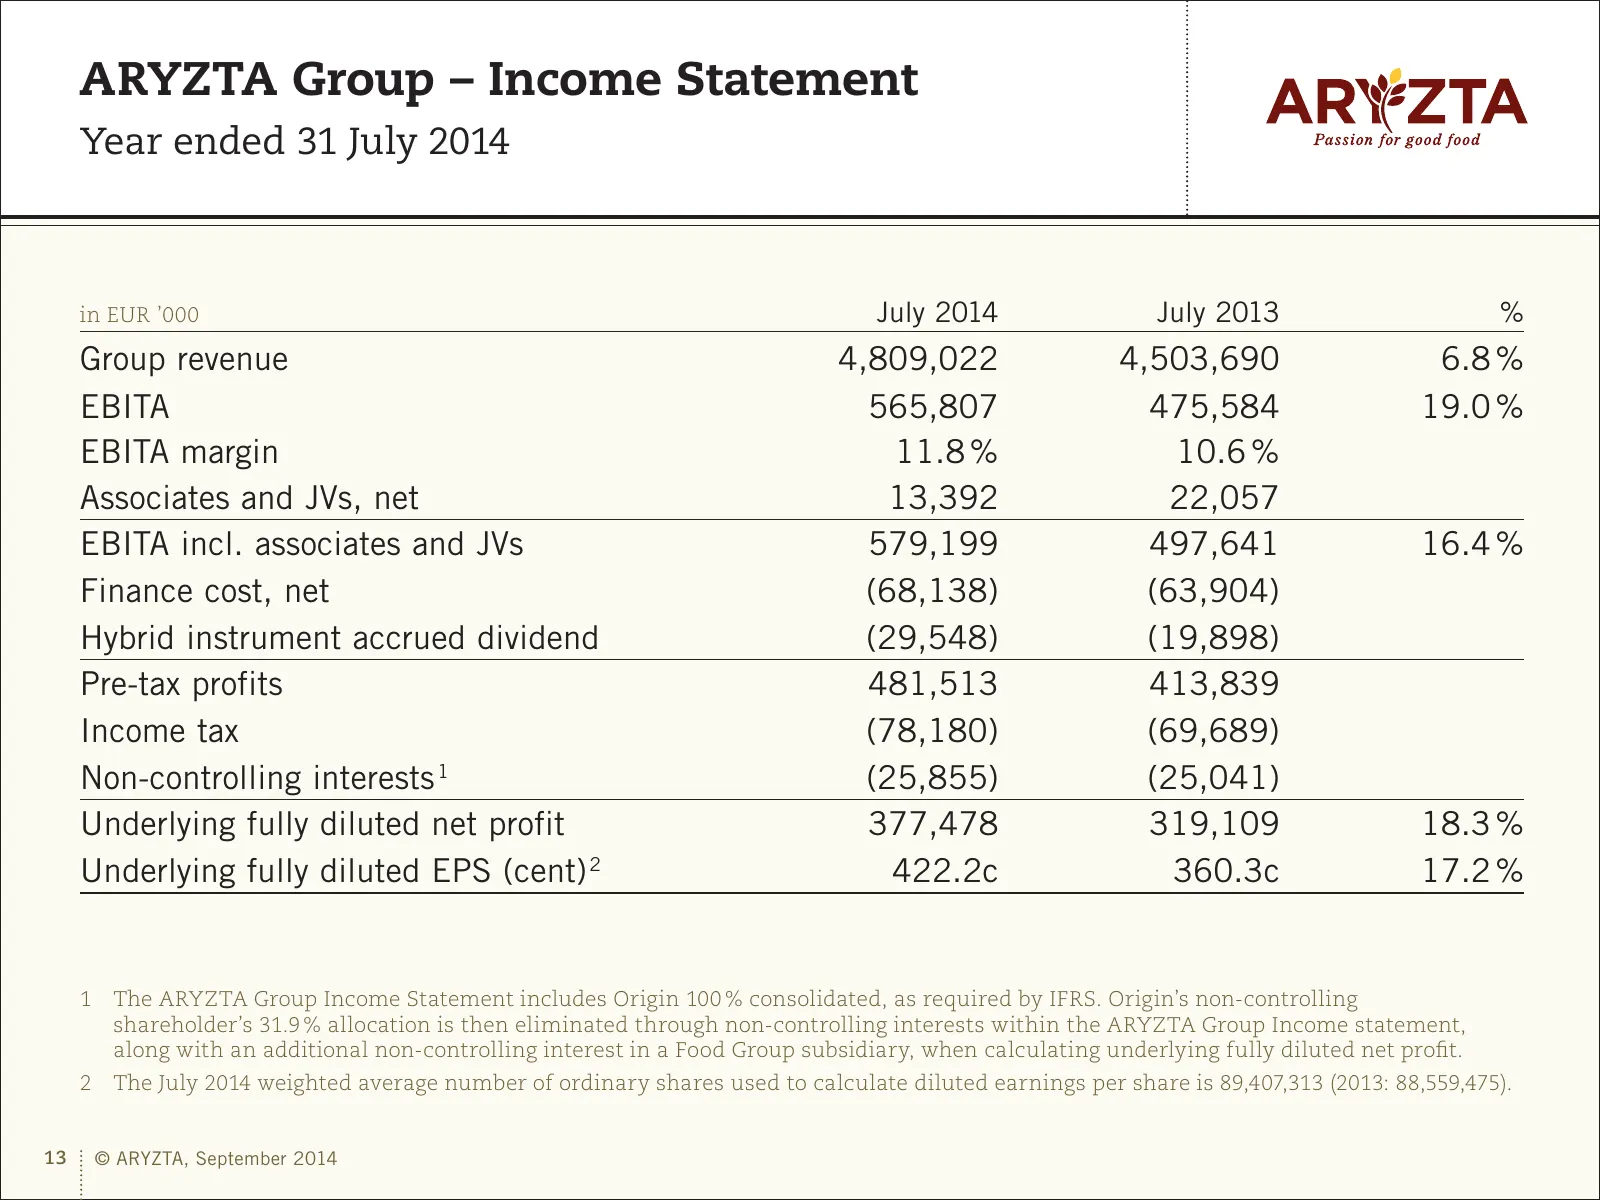
ARYZTA Group – Income Statement Year ended 31 July 2014 in EUR ’000 July 2014 July 2013 % Group revenue 4,809,022 4,503,690 6.8 % EBITA 565,807 475,584 19.0 % EBITA margin 11.8 % 10.6 % Associates and JVs, net 13,392 22,057 EBITA incl. associates and JVs 579,199 497,641 16.4 % Finance cost, net (68,
Slide 14: ARYZTA Group – Underlying Revenue Growth
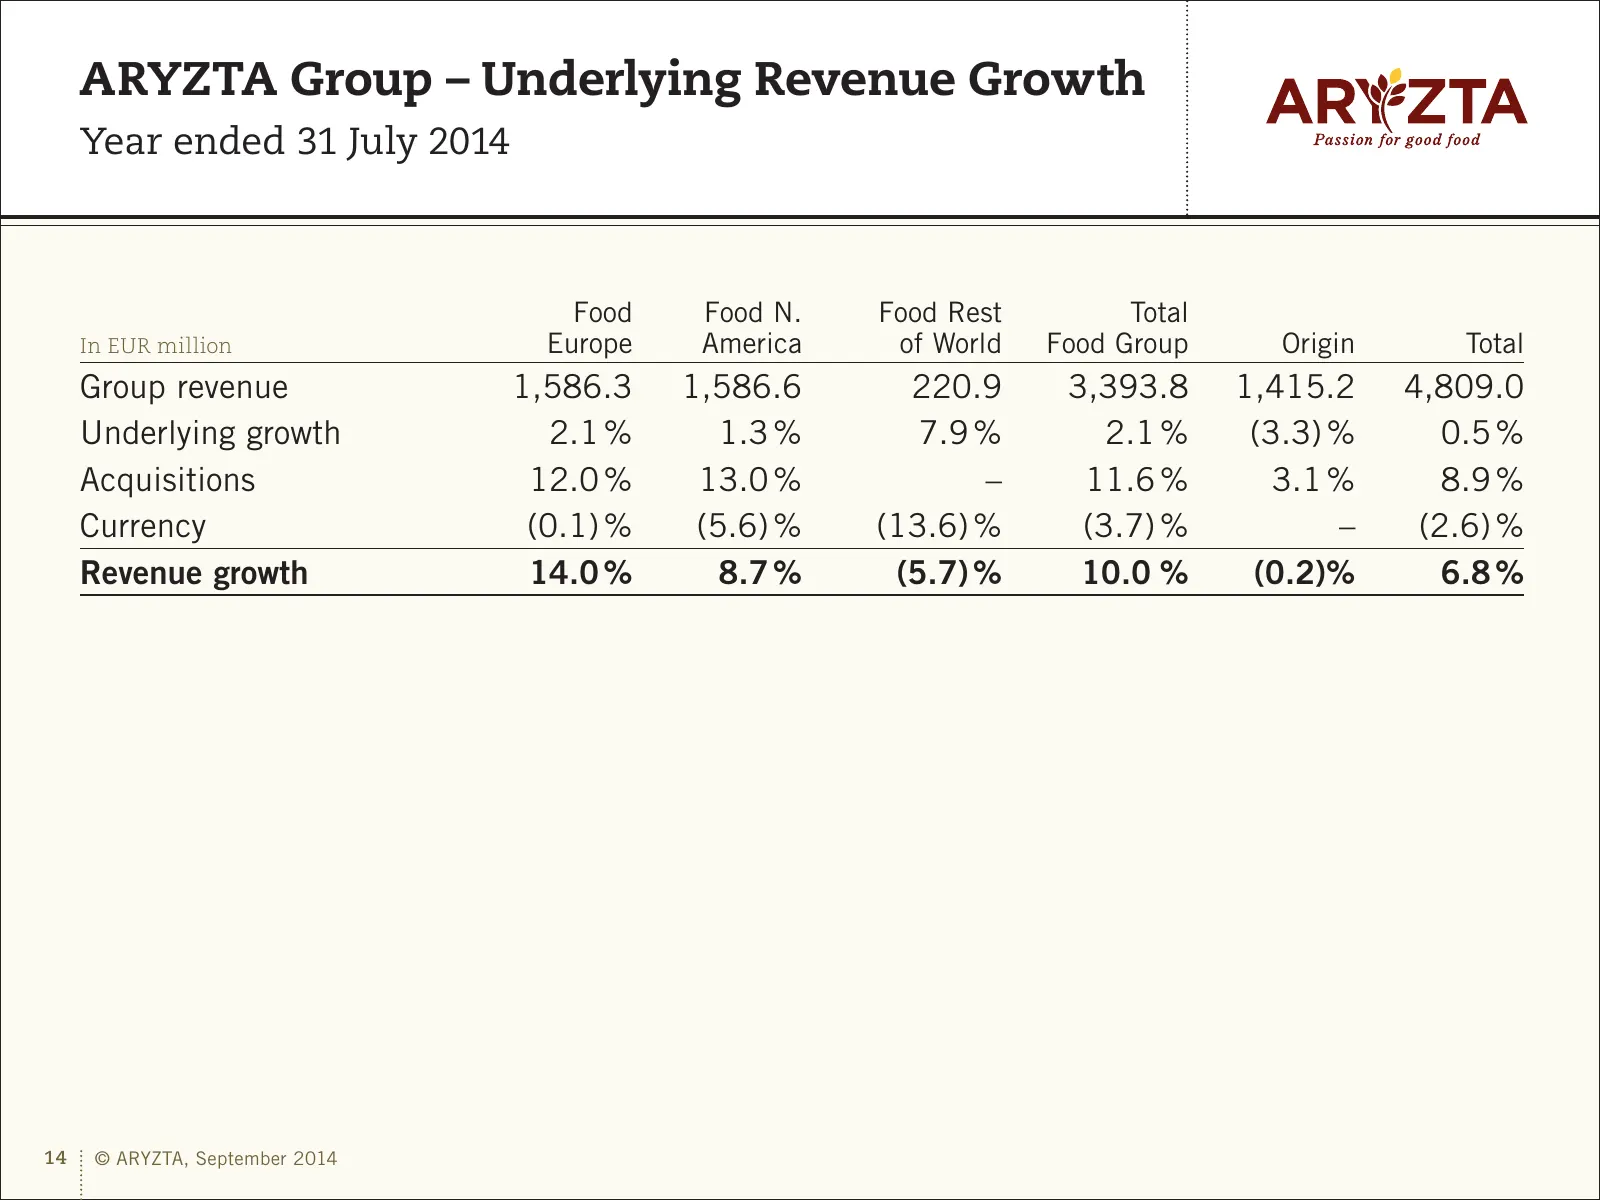
ARYZTA Group – Underlying Revenue Growth Year ended 31 July 2014 Food Food N. Food Rest Total In EUR million Europe America of World Food Group Origin Total Group revenue 1,586.3 1,586.6 220.9 3,393.8 1,415.2 4,809.0 Underlying growth 2.1 % 1.3 % 7.9 % 2.1 % (3.3) % 0.5 % Acquisitions 12.0 % 13.0 %
Slide 15: ARYZTA Group – Segmental EBITA
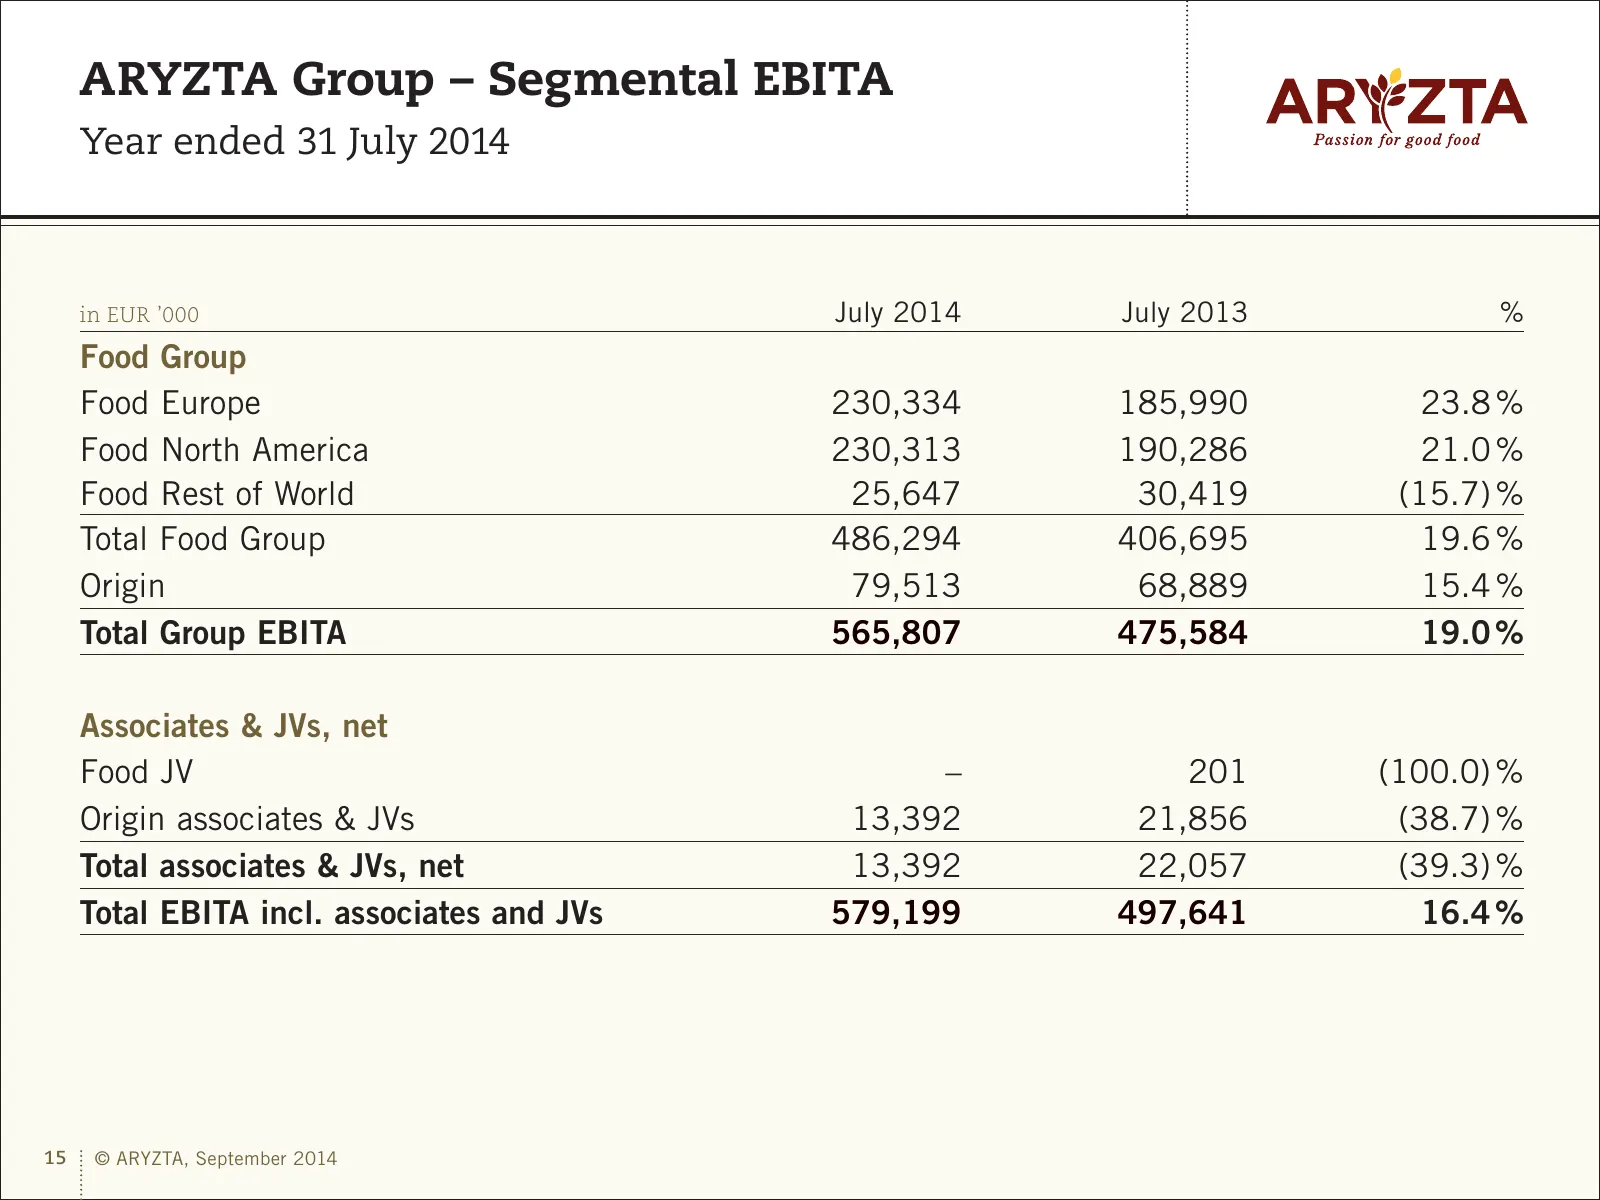
ARYZTA Group – Segmental EBITA Year ended 31 July 2014 in EUR ’000 July 2014 July 2013 % Food Group Food Europe 230,334 185,990 23.8 % Food North America 230,313 190,286 21.0 % Food Rest of World 25,647 30,419 (15.7) % Total Food Group 486,294 406,695 19.6 % Origin 79,513 68,889 15.4 % Total Group E
Slide 16: Food Group – Income Statement
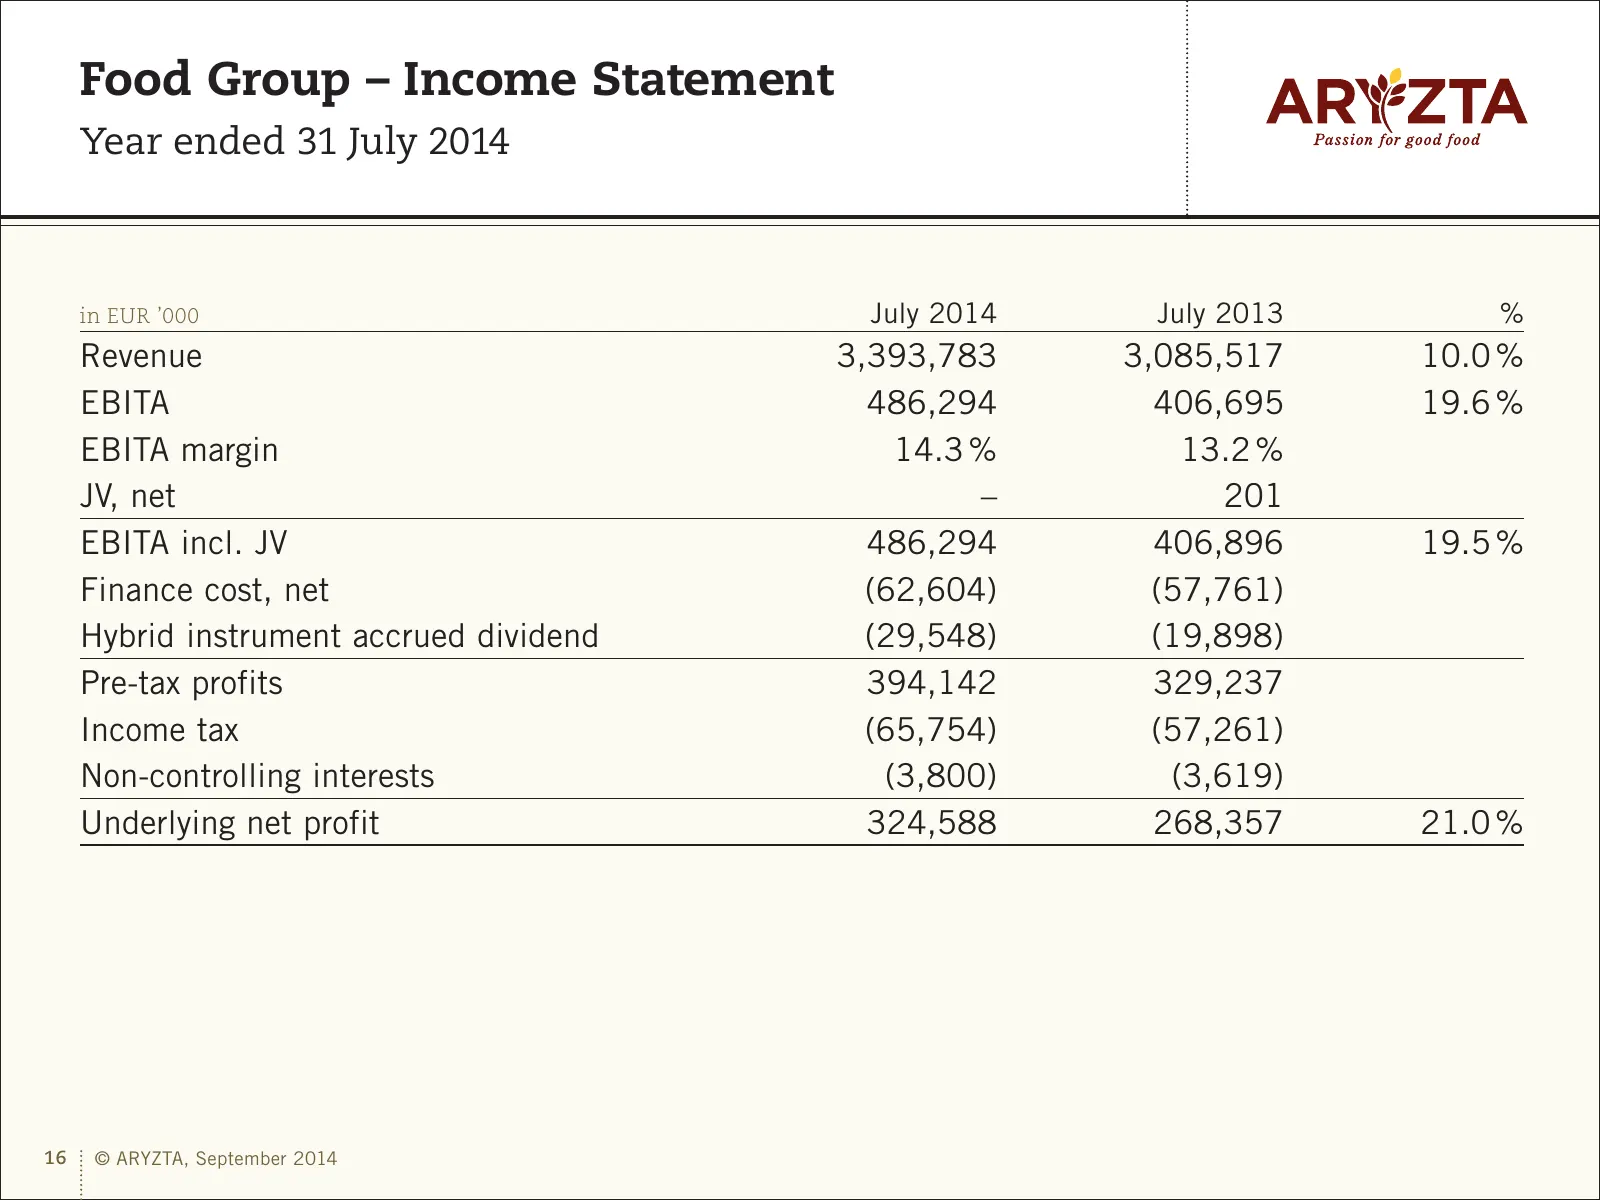
Food Group – Income Statement Year ended 31 July 2014 in EUR ’000 July 2014 July 2013 % Revenue 3,393,783 3,085,517 10.0 % EBITA 486,294 406,695 19.6 % EBITA margin 14.3 % 13.2 % JV, net – 201 EBITA incl. JV 486,294 406,896 19.5 % Finance cost, net (62,604) (57,761) Hybrid instrument accrued dividen
Slide 17: Food Group – Cash Generation
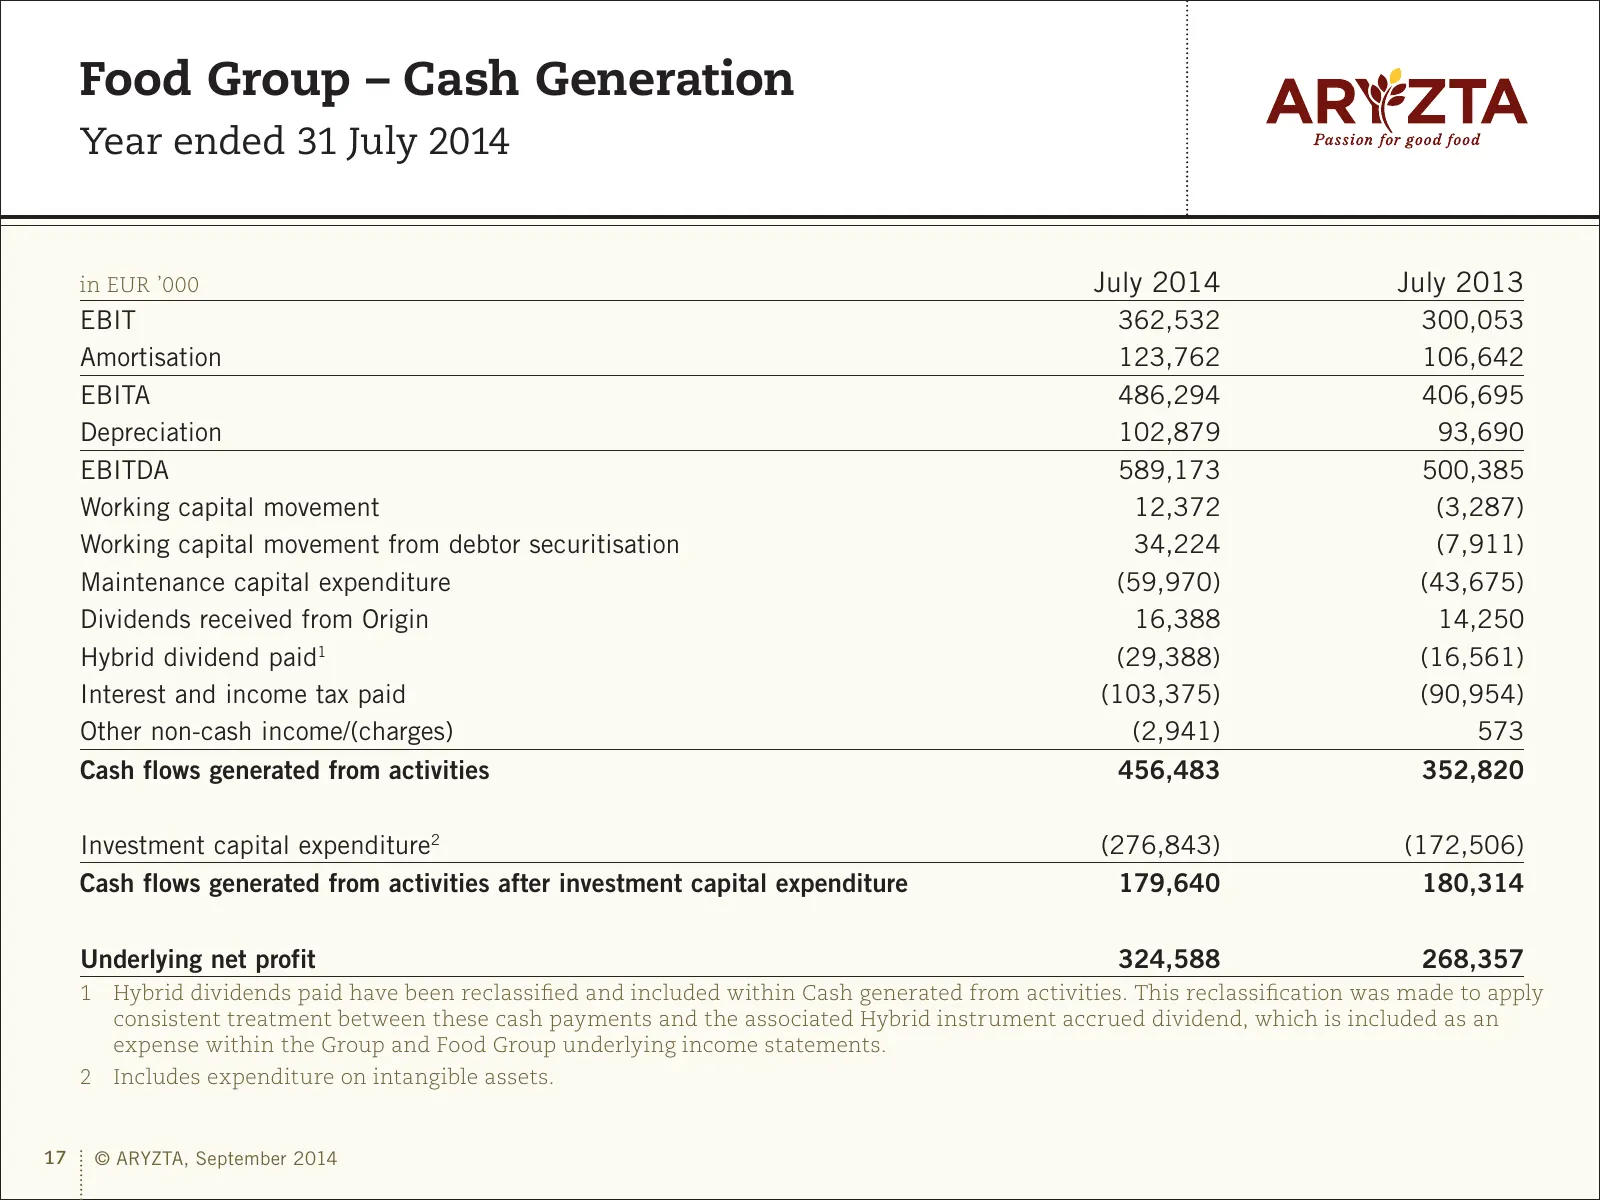
Food Group – Cash Generation Year ended 31 July 2014 in EUR ’000 July 2014 July 2013 EBIT 362,532 300,053 Amortisation 123,762 106,642 EBITA 486,294 406,695 Depreciation 102,879 93,690 EBITDA 589,173 500,385 Working capital movement 12,372 (3,287) Working capital movement from debtor securitisation
Slide 18: Food Group Net Debt and Investment Activity
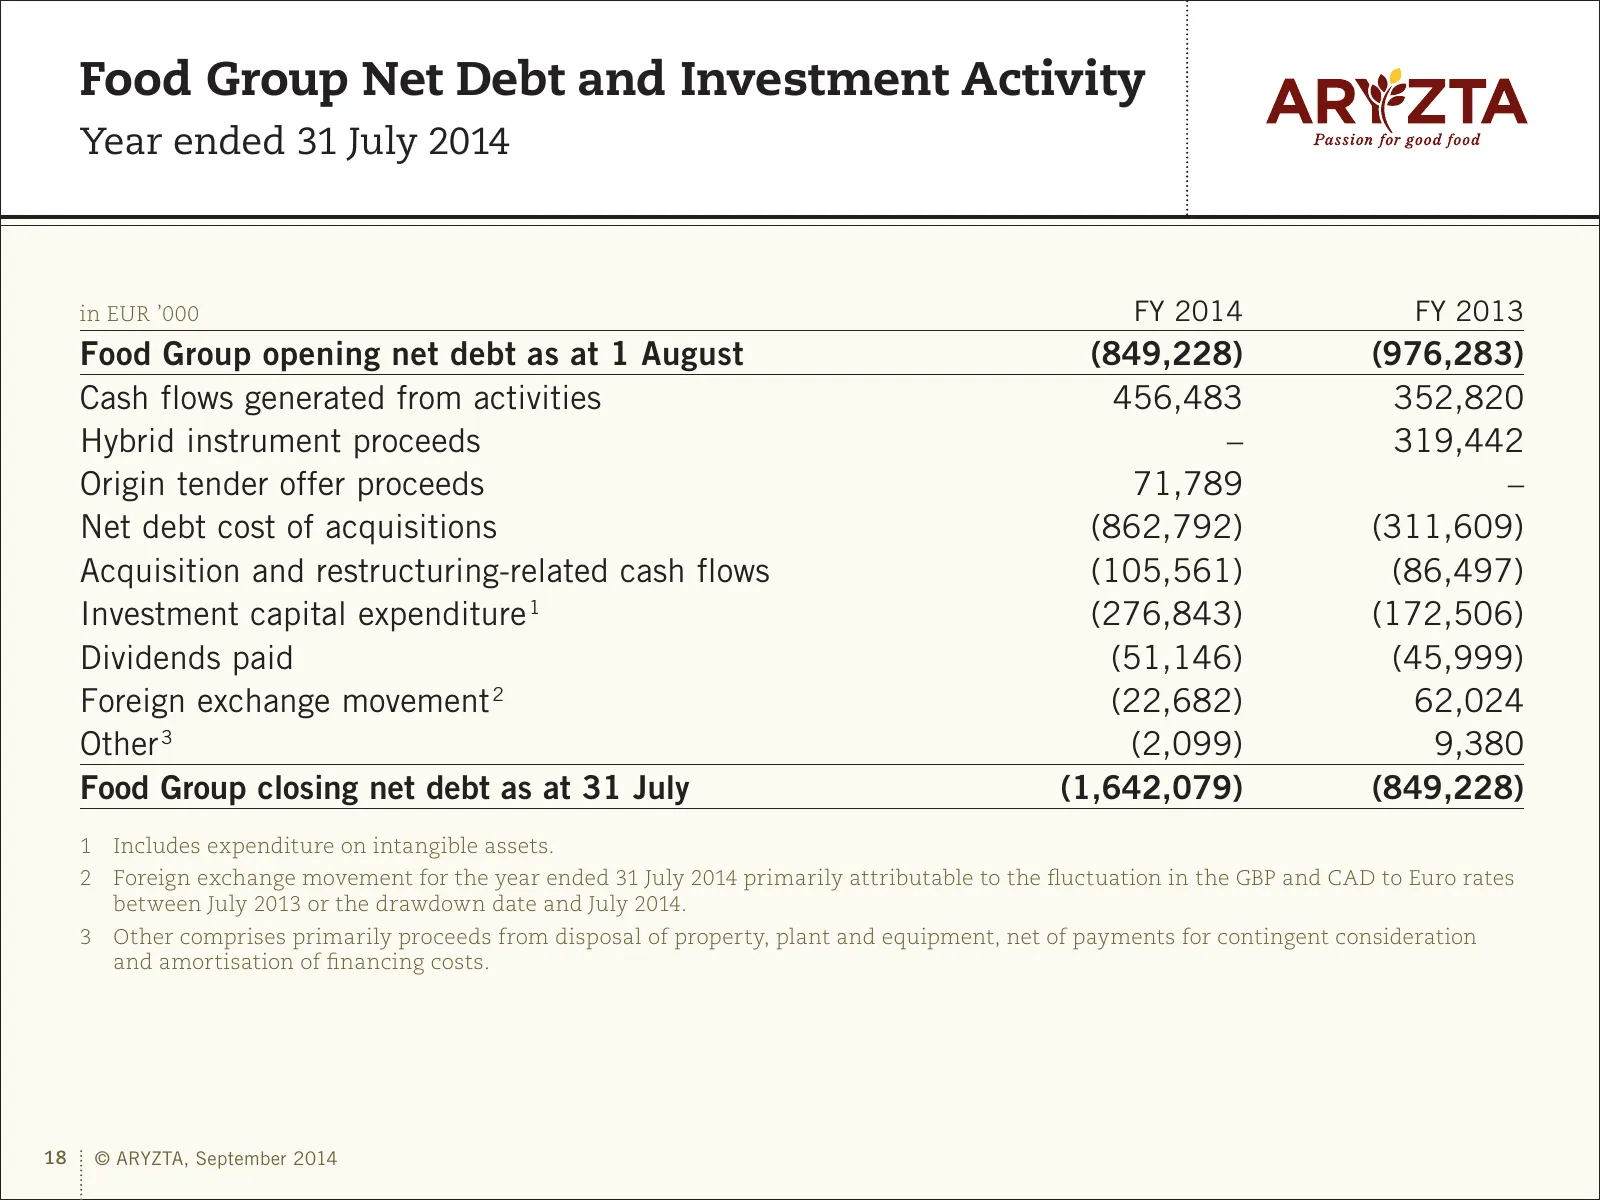
Food Group Net Debt and Investment Activity Year ended 31 July 2014 in EUR ’000 FY 2014 FY 2013 Food Group opening net debt as at 1 August (849,228) (976,283) Cash flows generated from activities 456,483 352,820 Hybrid instrument proceeds – 319,442 Origin tender offer proceeds 71,789 – Net debt cost
Slide 19: Food Group Financing
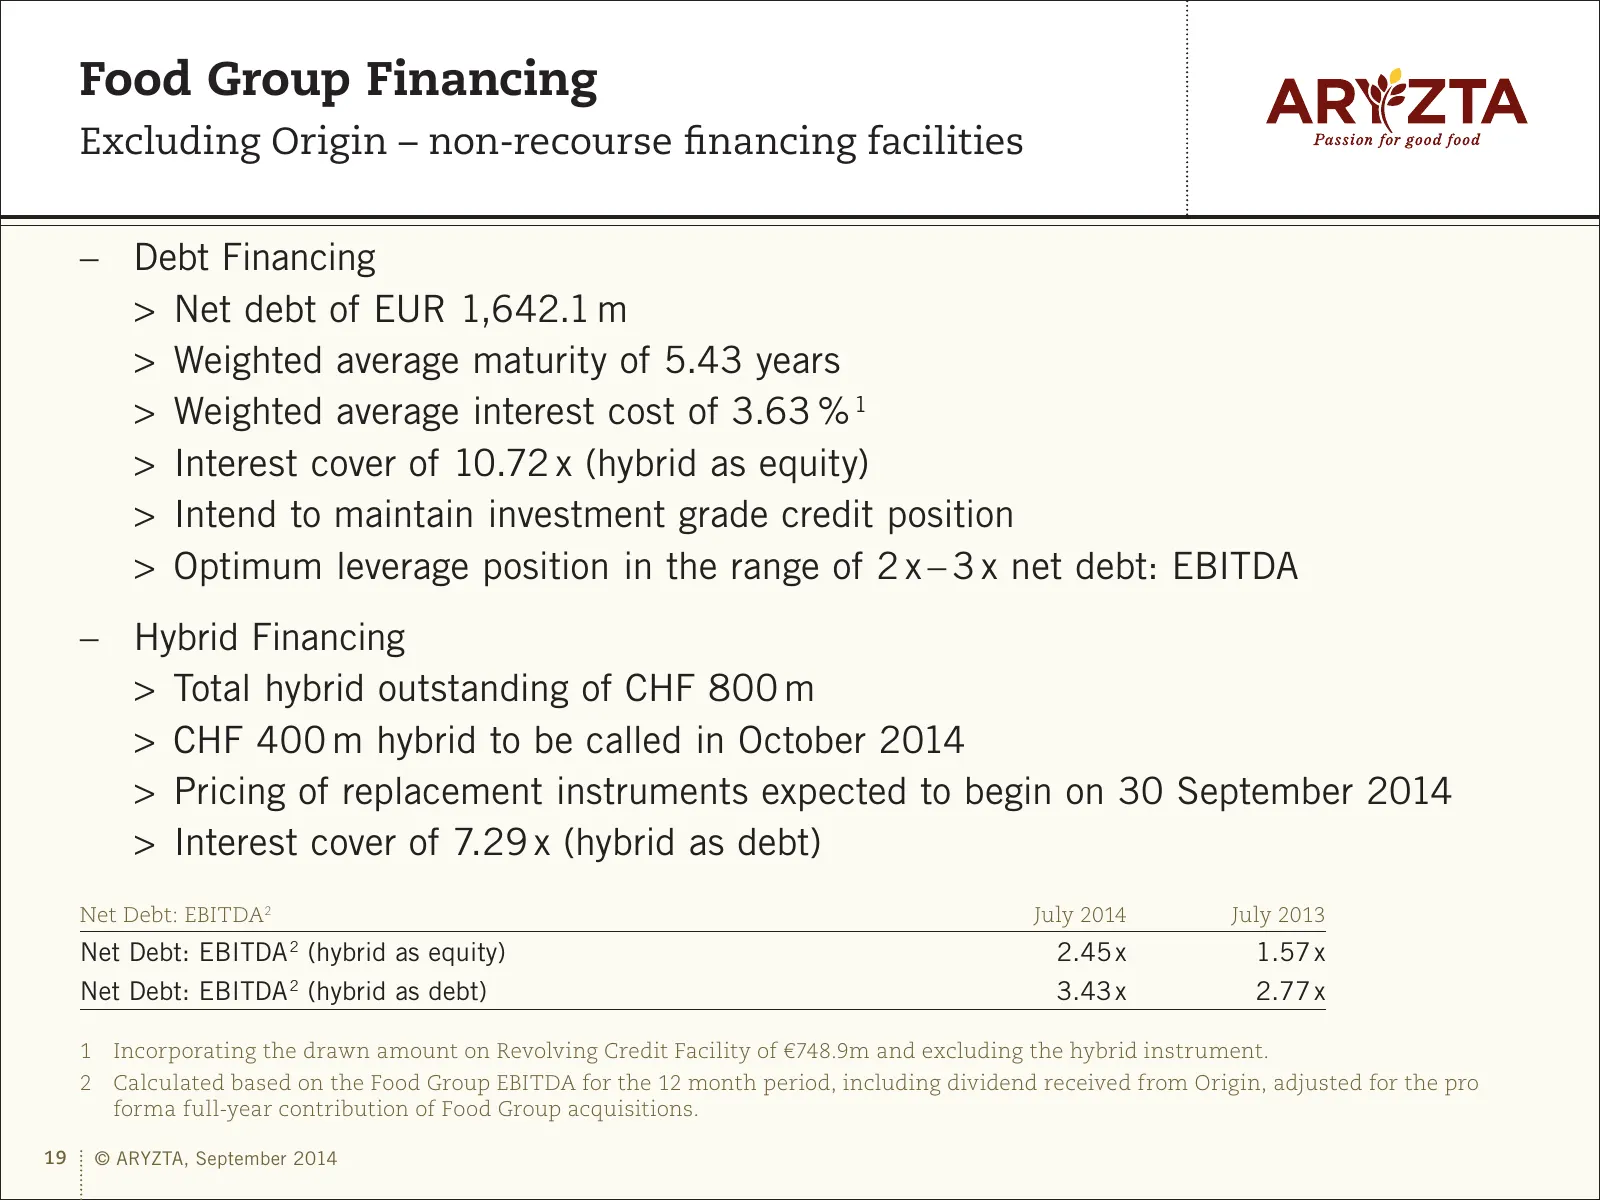
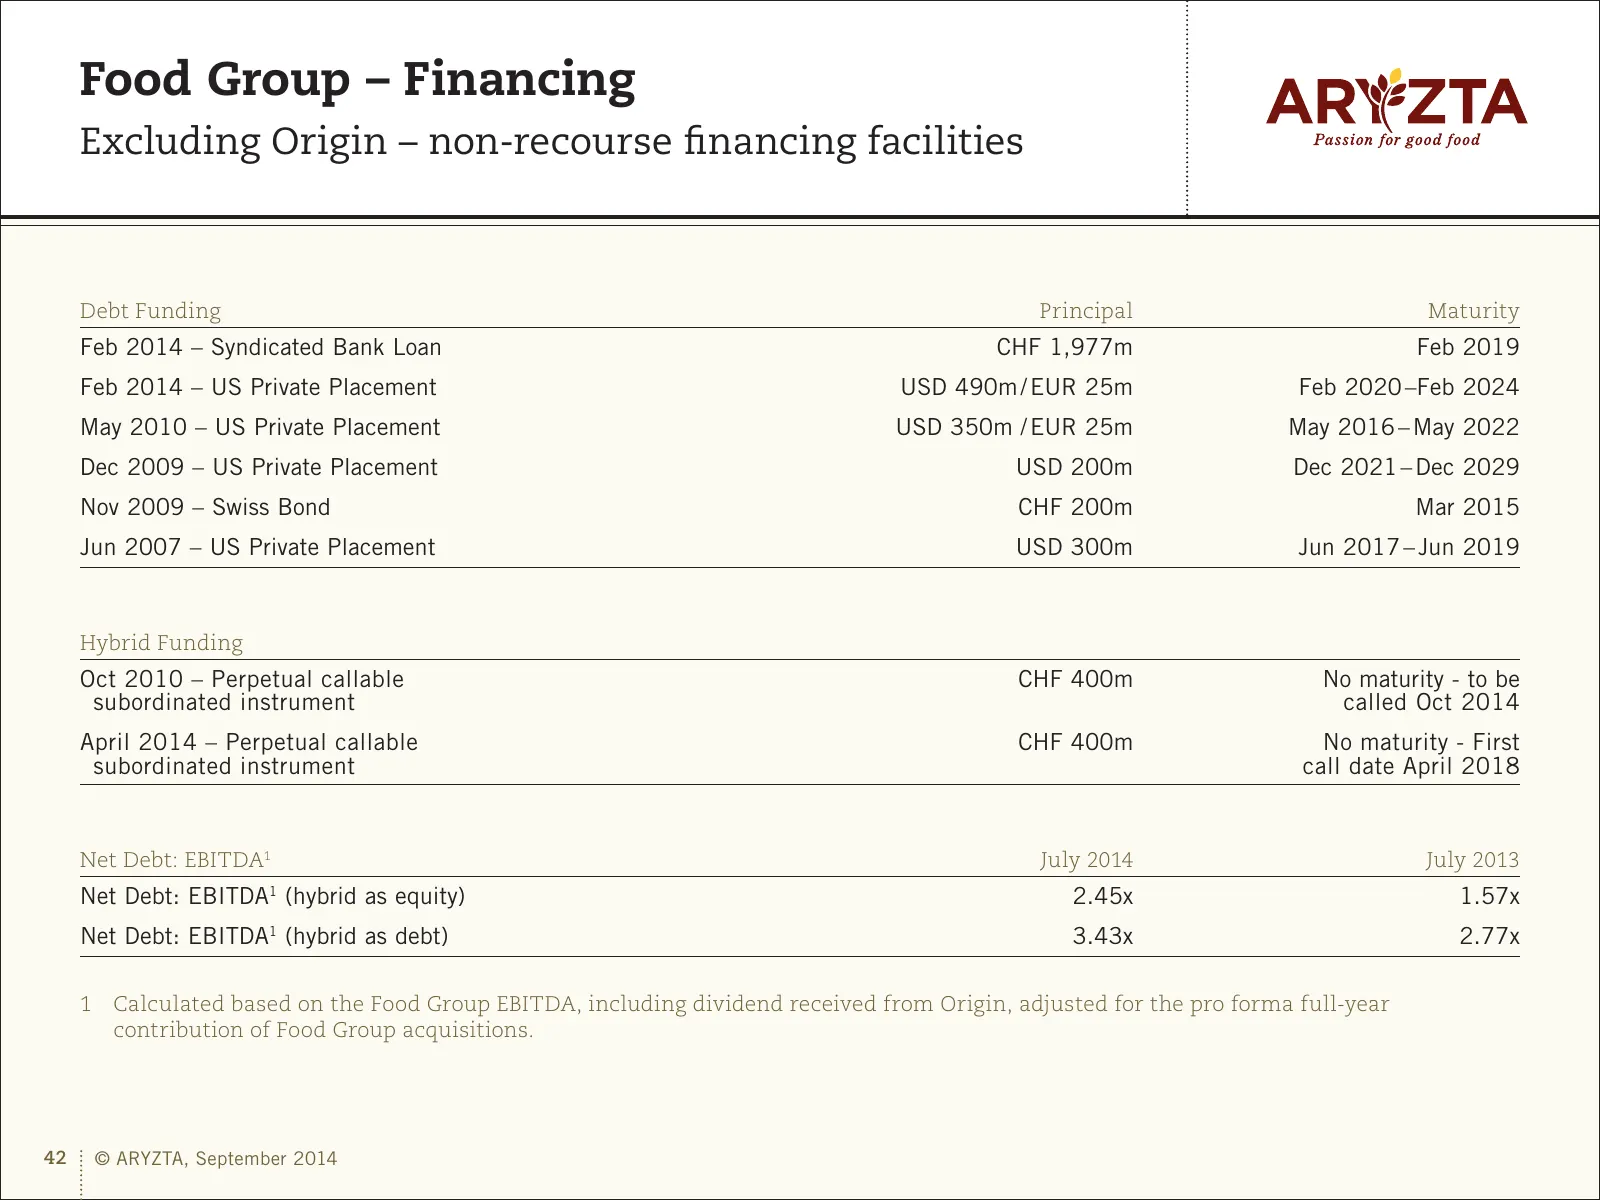
Food Group Financing Excluding Origin – non-recourse financing facilities –– Debt Financing >> Net debt of EUR 1,642.1 m >> Weighted average maturity of 5.43 years >> Weighted average interest cost of 3.63 % 1 >> Interest cover of 10.72 x (hybrid as equity) >> Intend to maintain investment grade cre
Slide 20: ARYZTA Transformation Initiative
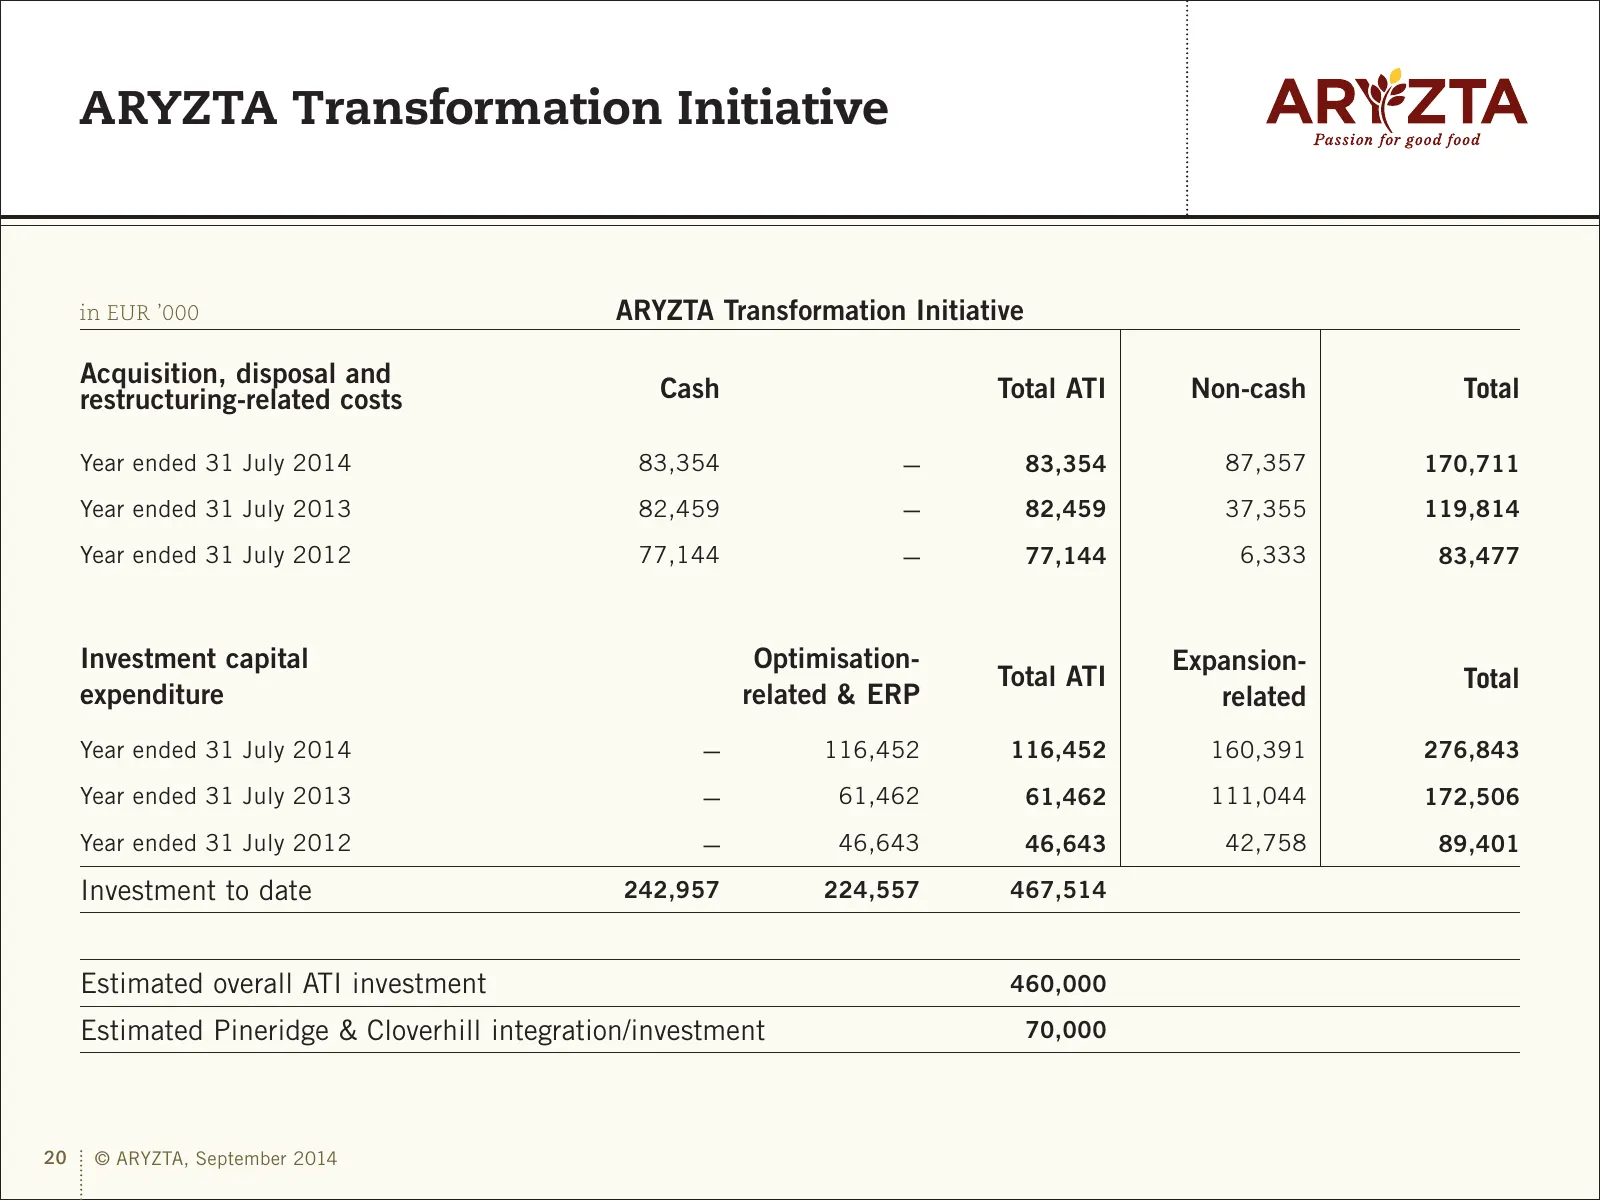
ARYZTA Transformation Initiative in EUR ’000 ARYZTA Transformation Initiative Acquisition, disposal and restructuring-related costs Cash Total ATI Non-cash Total Year ended 31 July 2014 83,354 – 83,354 87,357 170,711 Year ended 31 July 2013 82,459 – 82,459 37,355 119,814 Year ended 31 July 2012 77,1
Slide 21: Food Group Underlying ROIC
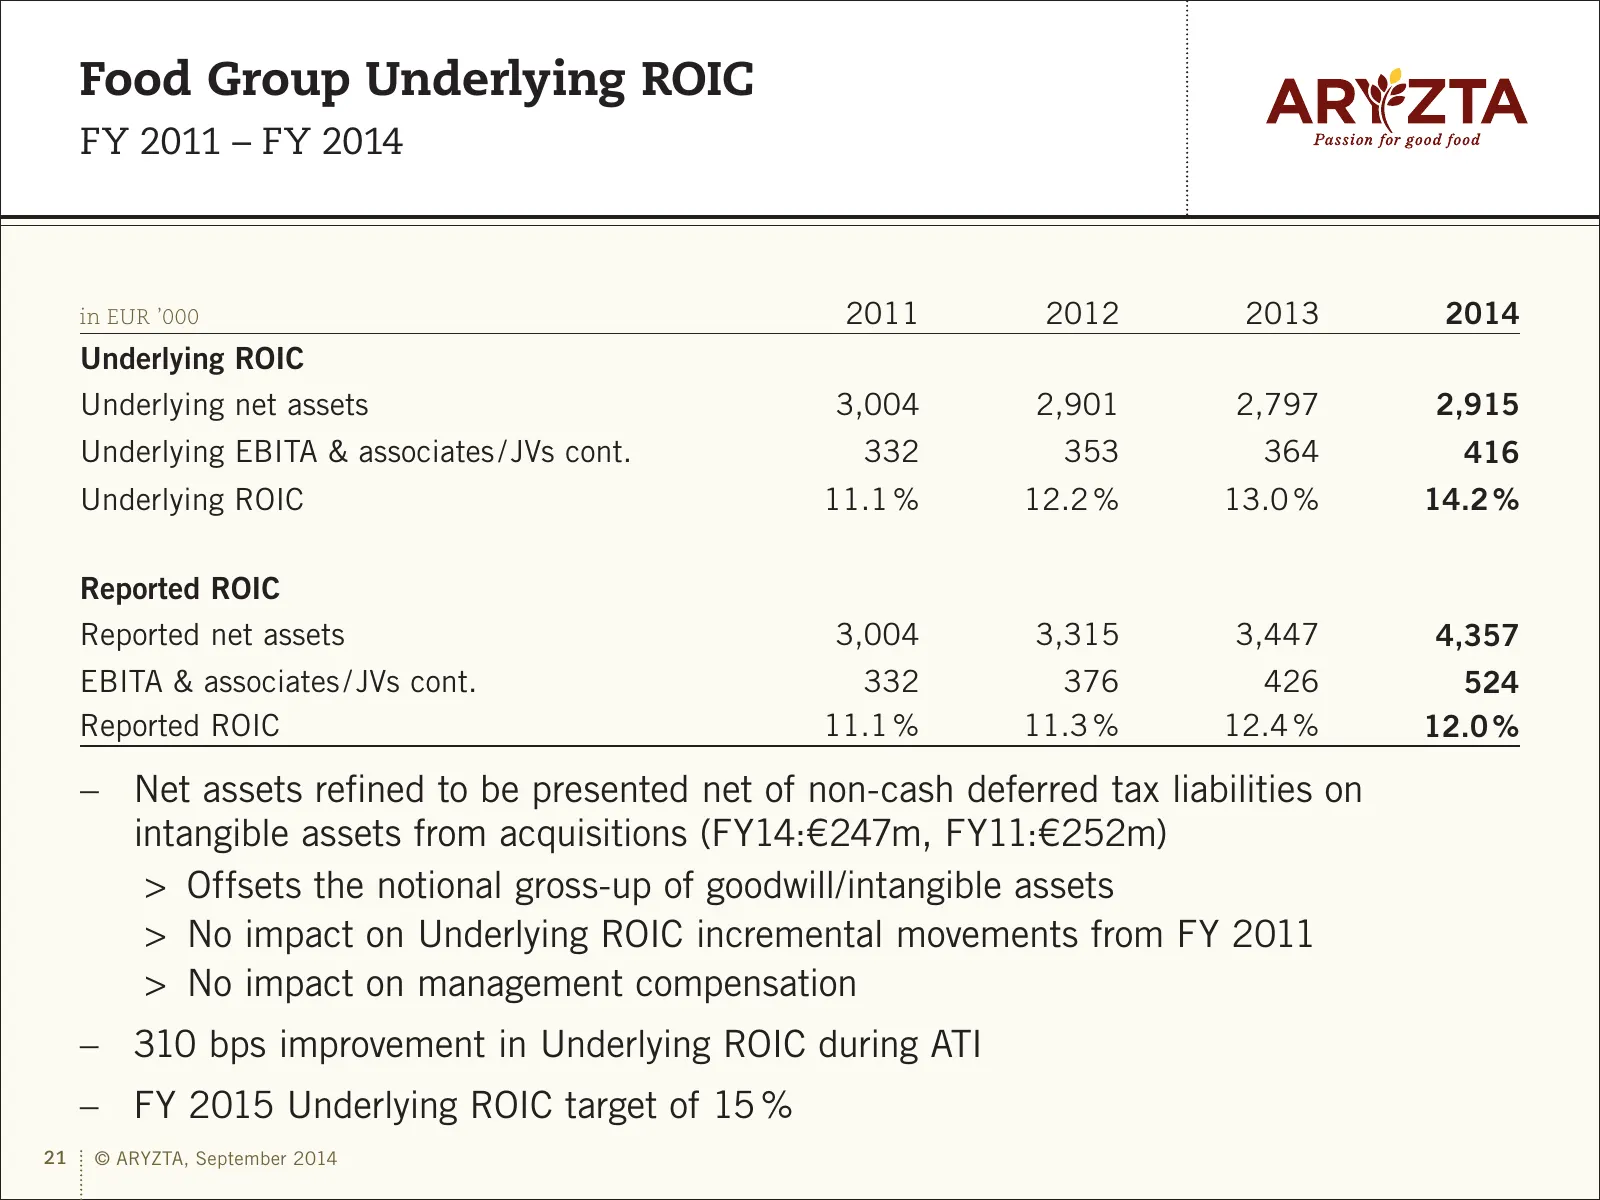
Food Group Underlying ROIC FY 2011 – FY 2014 in EUR ’000 2011 2012 2013 2014 Underlying ROIC Underlying net assets 3,004 2,901 2,797 2,915 Underlying EBITA & associates / JVs cont. 332 353 364 416 Underlying ROIC 11.1 % 12.2 % 13.0 % 14.2 % Reported ROIC Reported net assets 3,004 3,315 3,447 4,357 E
Slide 22: Food Europe – Largest Bakery Business Focused on Specialty Food
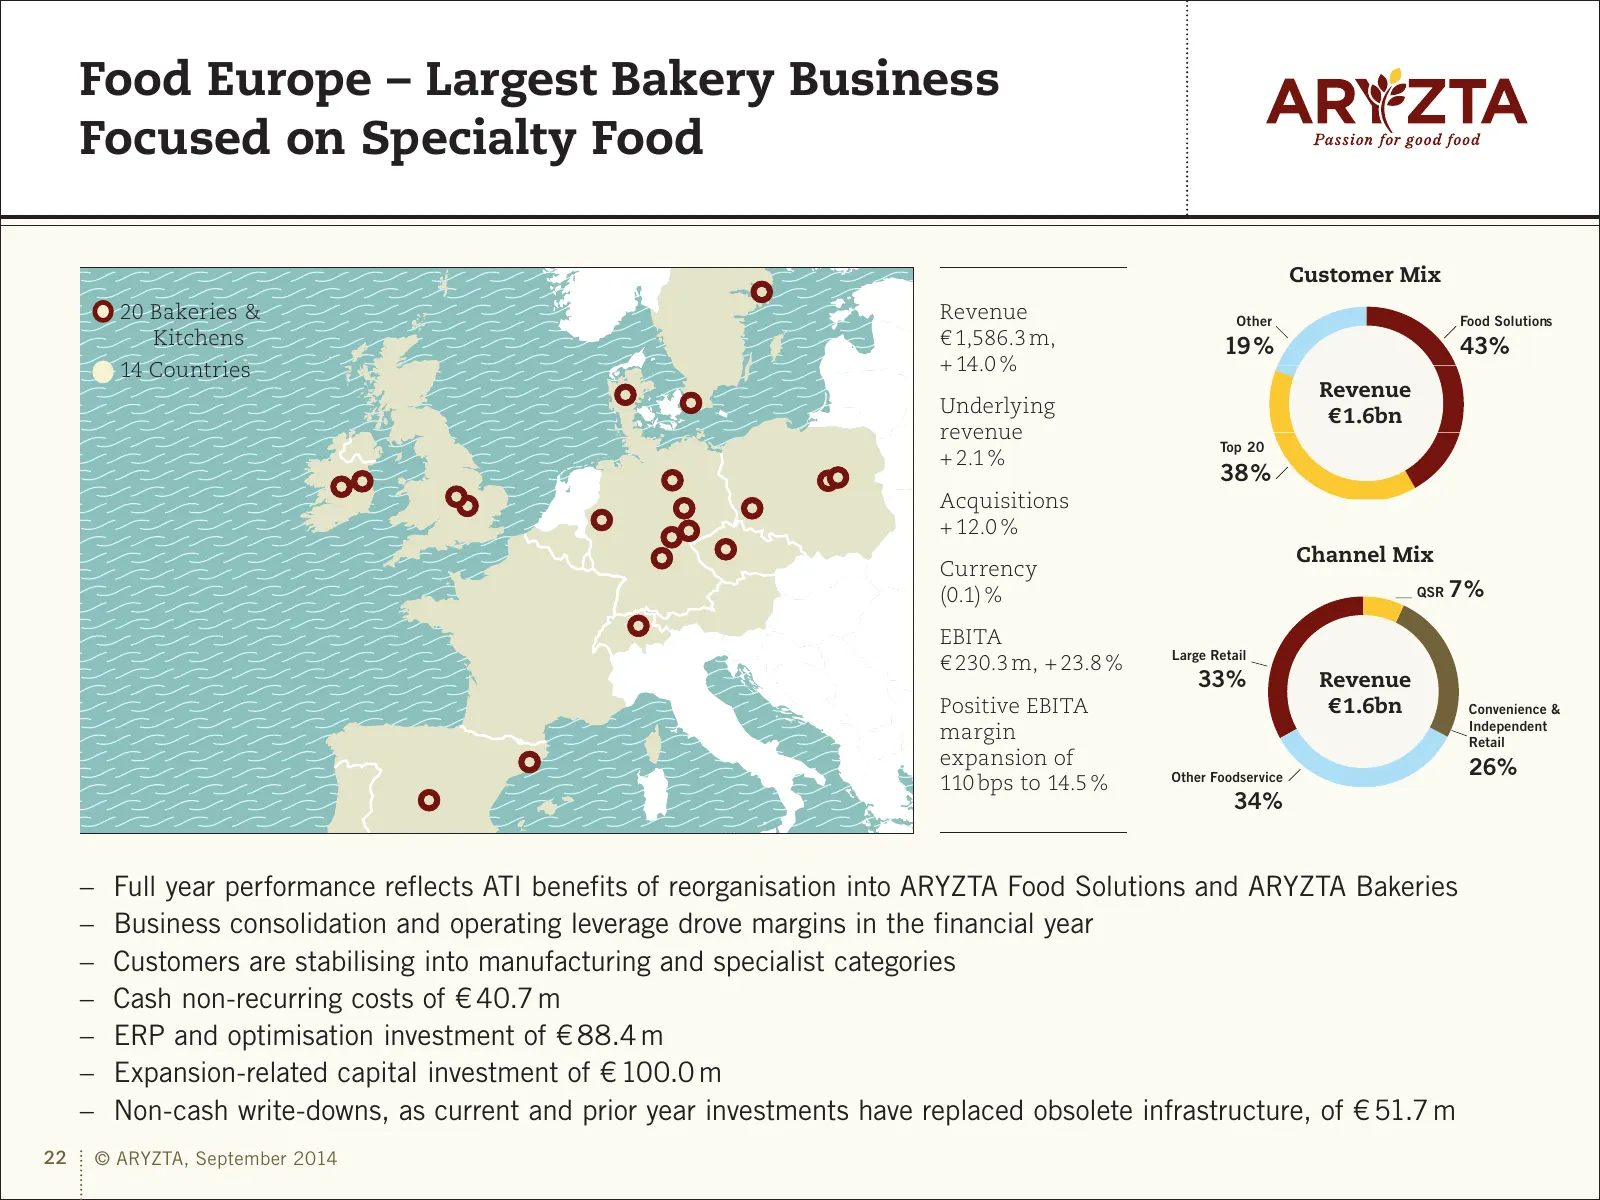
Food Europe – Largest Bakery Business Focused on Specialty Food Customer Mix 20 Bakeries & Revenue Other Food Solutions Kitchens € 1,586.3 m, 19 % 43% 14 Countries + 14.0 % Revenue Underlying € 1.6bn revenue Top 20 + 2.1 % 38 % Acquisitions + 12.0 % Channel Mix Currency (0.1) % QSR 7% EBITA Large Re
Slide 23: Food North America – Largest Bakery Business outside the Bakery Aisle
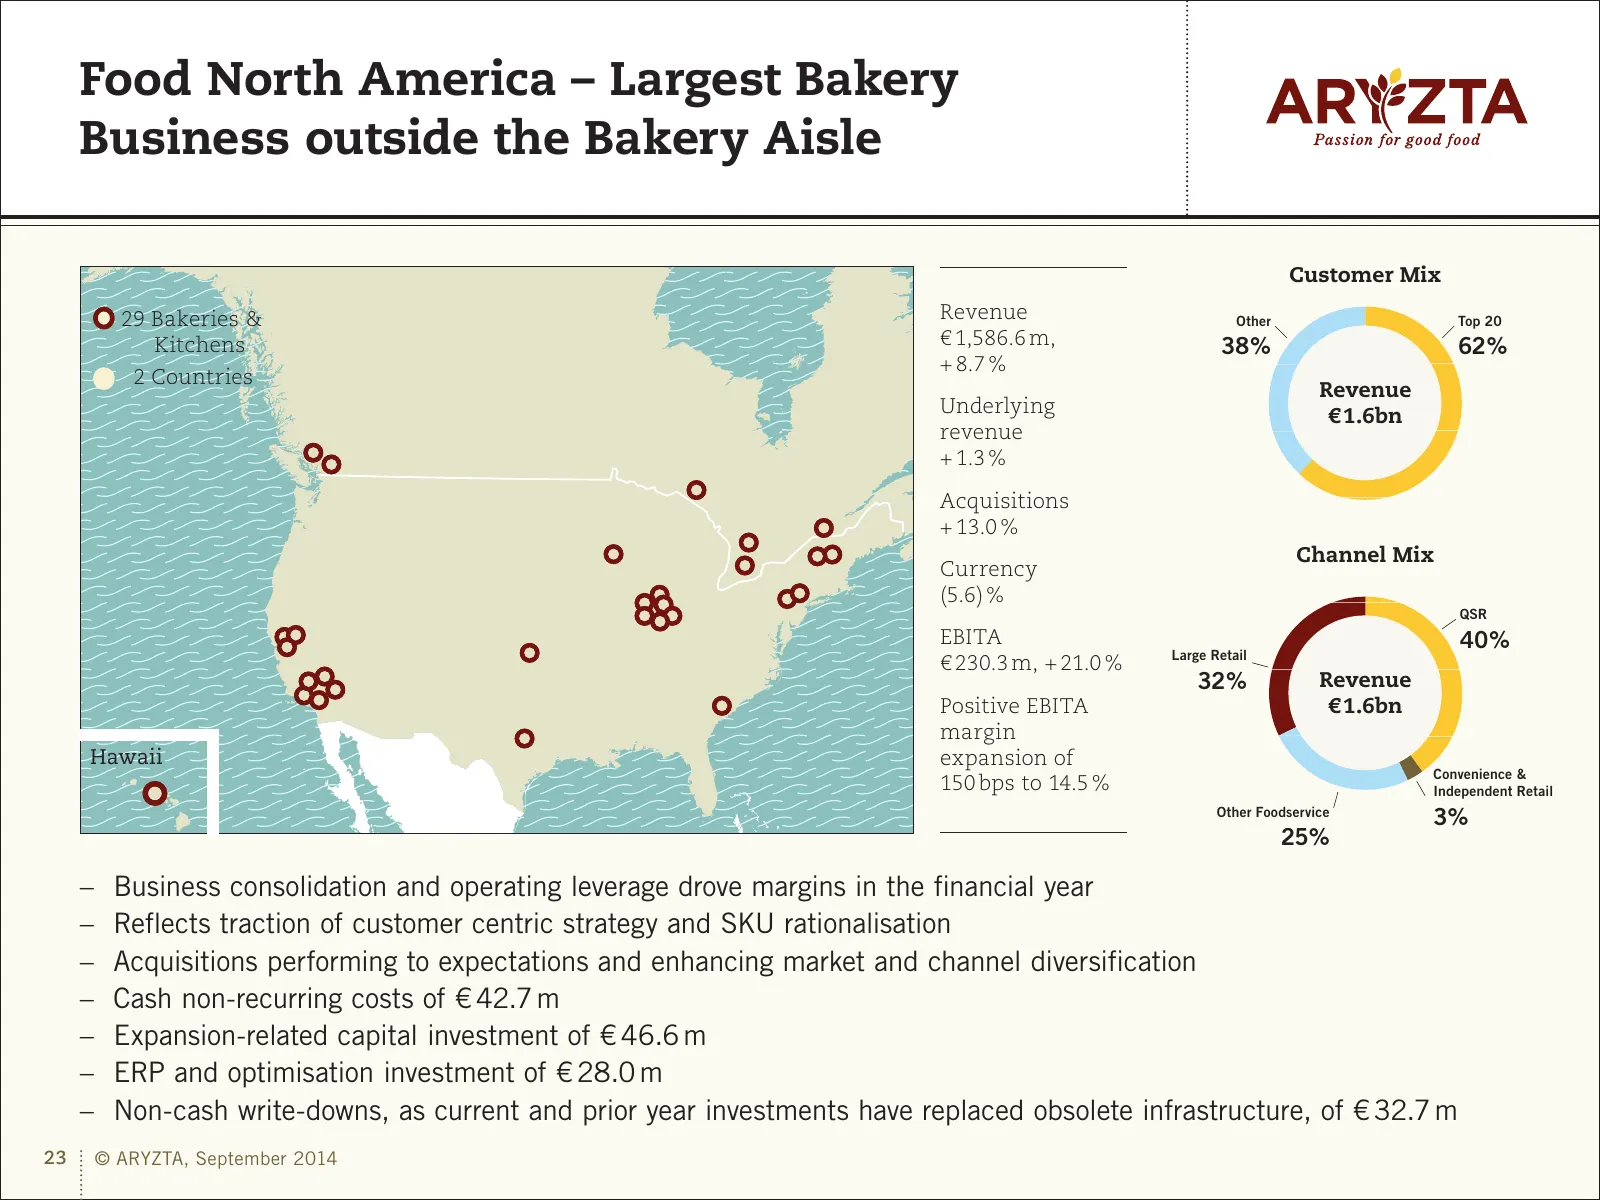
Food North America – Largest Bakery Business outside the Bakery Aisle Customer Mix 29 Bakeries & Revenue Other Top 20 Kitchens € 1,586.6 m, 38% 62% + 8.7 % 2 Countries Revenue Underlying € 1.6bn revenue + 1.3 % Acquisitions + 13.0 % Channel Mix Currency (5.6) % QSR EBITA 40% Large Retail € 230.3 m,
Slide 24: Food Rest of World – Bakery Partner Providing Niche Bakery Solutions
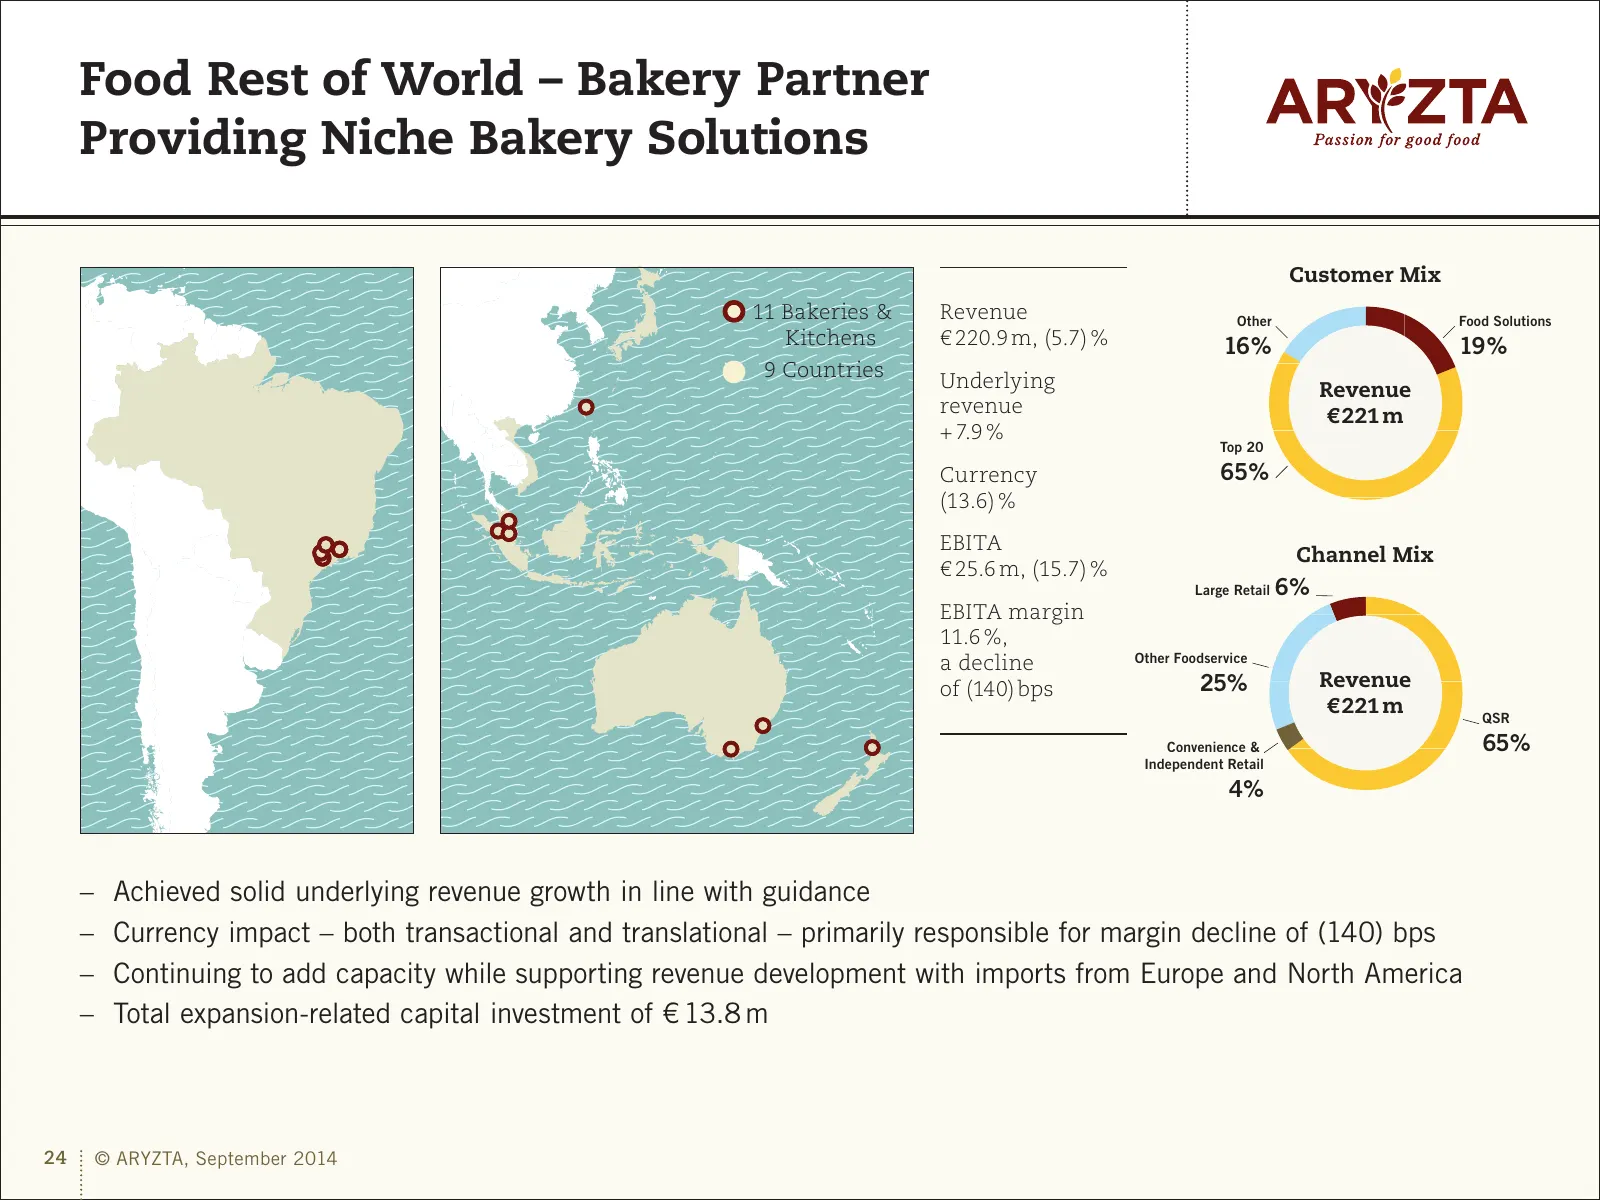
Food Rest of World – Bakery Partner Providing Niche Bakery Solutions Customer Mix 11 Bakeries & Revenue Other Food Solutions Kitchens € 220.9 m, (5.7) % 16% 19% 9 Countries Underlying Revenue revenue € 221 m + 7.9 % Top 20 Currency 65% (13.6) % EBITA Channel Mix € 25.6 m, (15.7) % Large Retail 6% EB
Slide 25: Food Group Underlying Revenue Growth
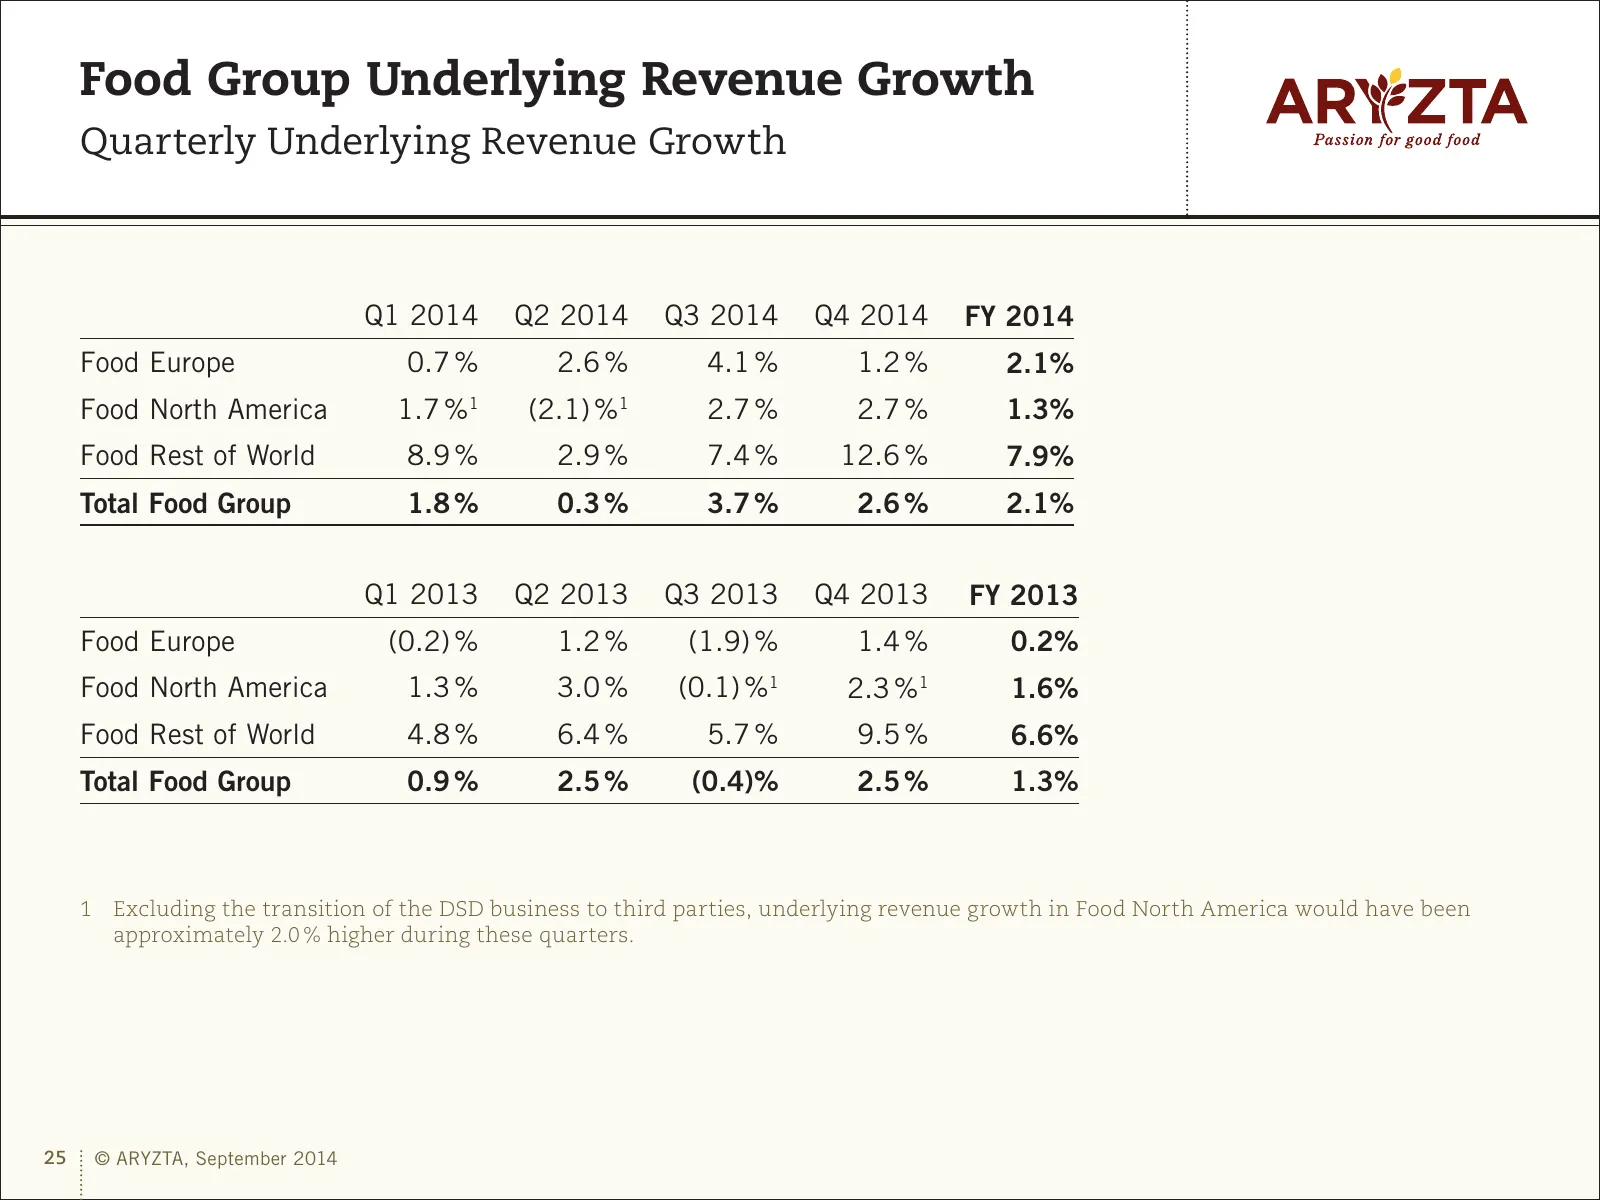
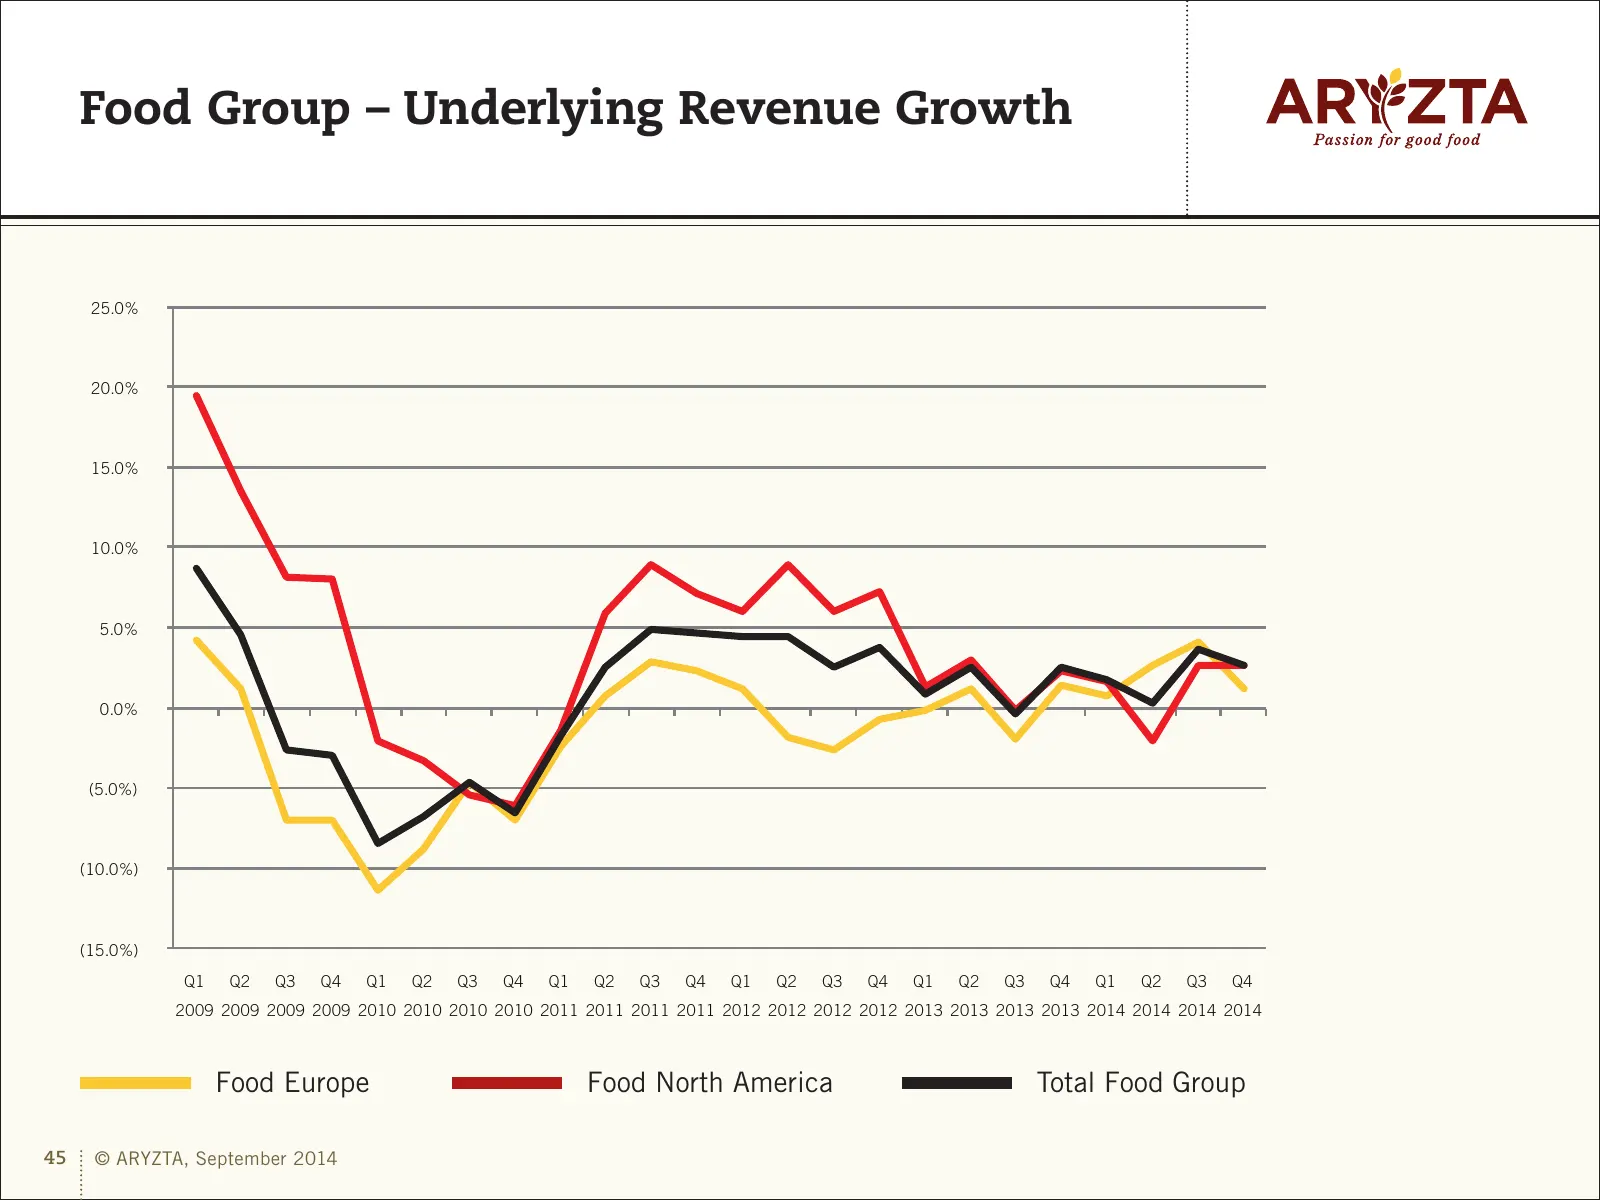
Food Group Underlying Revenue Growth Quarterly Underlying Revenue Growth Q1 2014 Q2 2014 Q3 2014 Q4 2014 FY 2014 Food Europe 0.7 % 2.6 % 4.1 % 1.2 % 2.1% Food North America 1.7 %1 (2.1) %1 2.7 % 2.7 % 1.3% Food Rest of World 8.9 % 2.9 % 7.4 % 12.6 % 7.9% Total Food Group 1.8 % 0.3 % 3.7 % 2.6 % 2.1%
Slide 26: Dividend
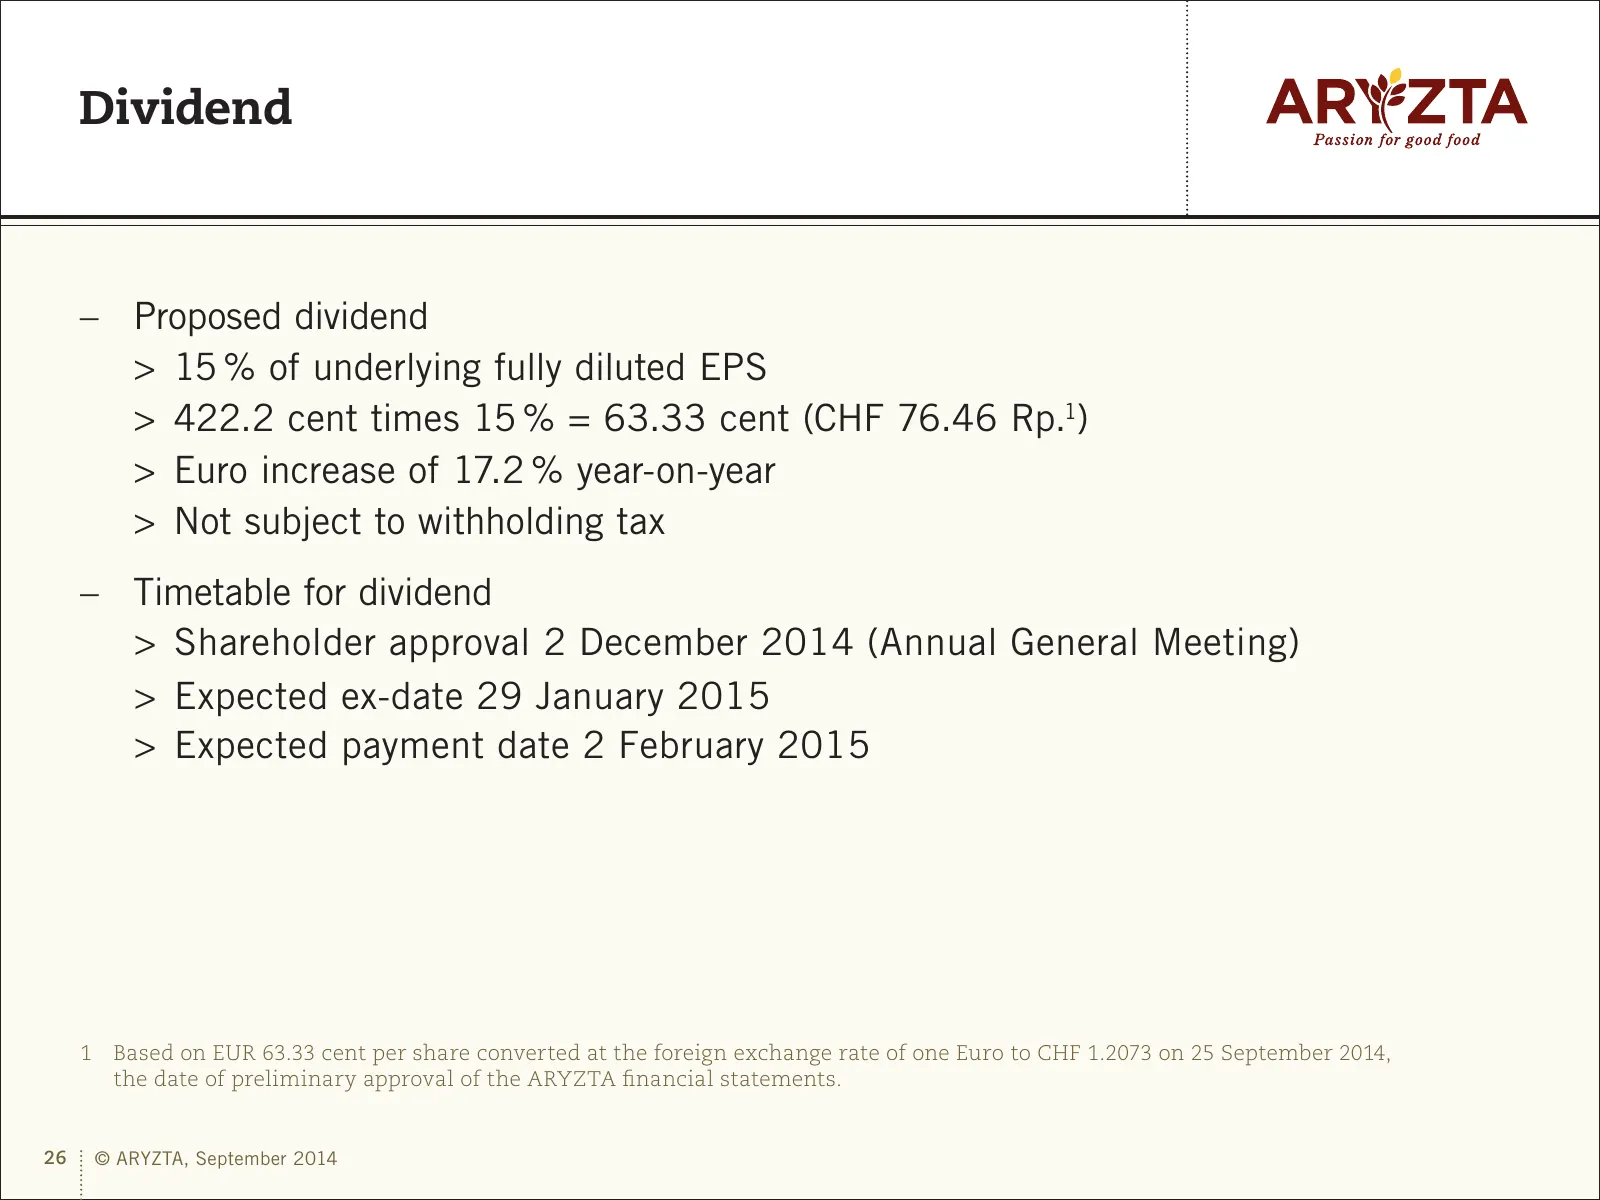
Dividend –– Proposed dividend >> 15 % of underlying fully diluted EPS >> 422.2 cent times 15 % = 63.33 cent (CHF 76.46 Rp.1) >> Euro increase of 17.2 % year-on-year >> Not subject to withholding tax –– Timetable for dividend > Shareholder approval 2 December 2014 (Annual General Meeting) > Expected
Slide 27: Food Group FY 2015 Financial Metrics
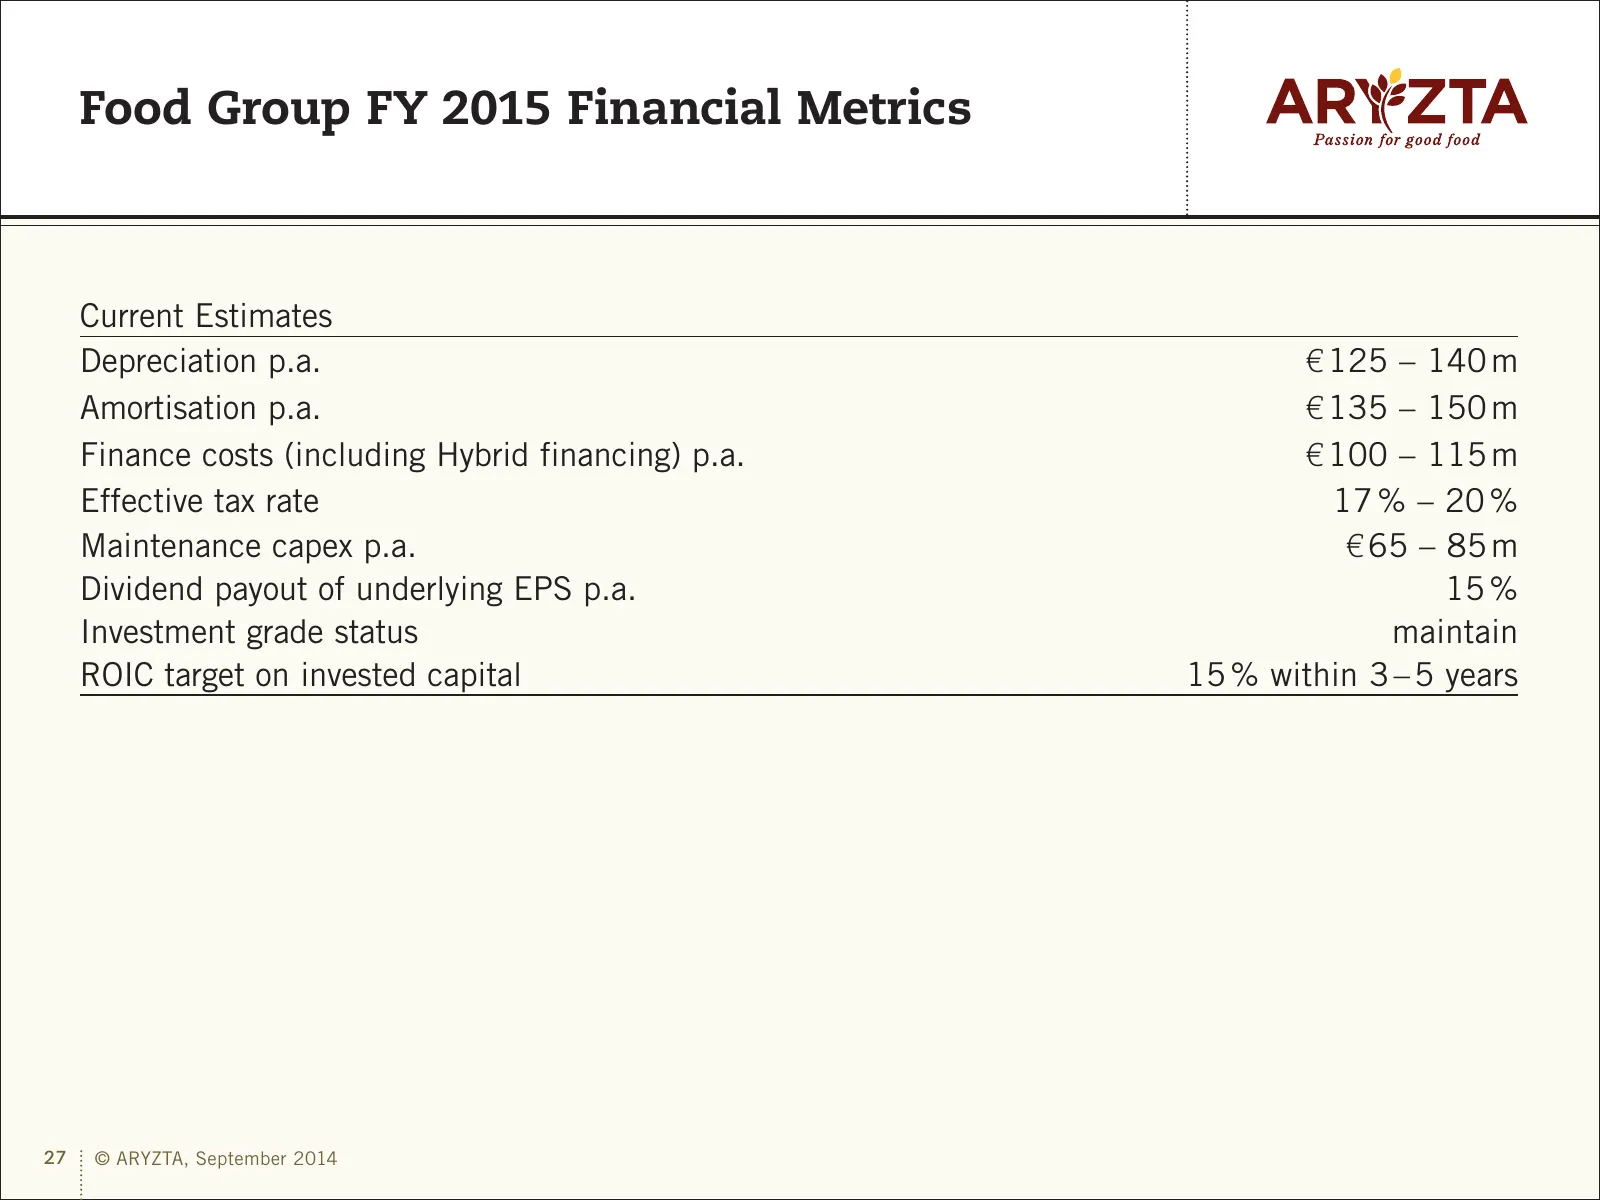
Food Group FY 2015 Financial Metrics Current Estimates Depreciation p.a. € 125 – 140 m Amortisation p.a. € 135 – 150 m Finance costs (including Hybrid financing) p.a. € 100 – 115 m Effective tax rate 17 % – 20 % Maintenance capex p.a. € 65 – 85 m Dividend payout of underlying EPS p.a. 15 % Investmen
Slide 28: Food Group – Five Year KPIs
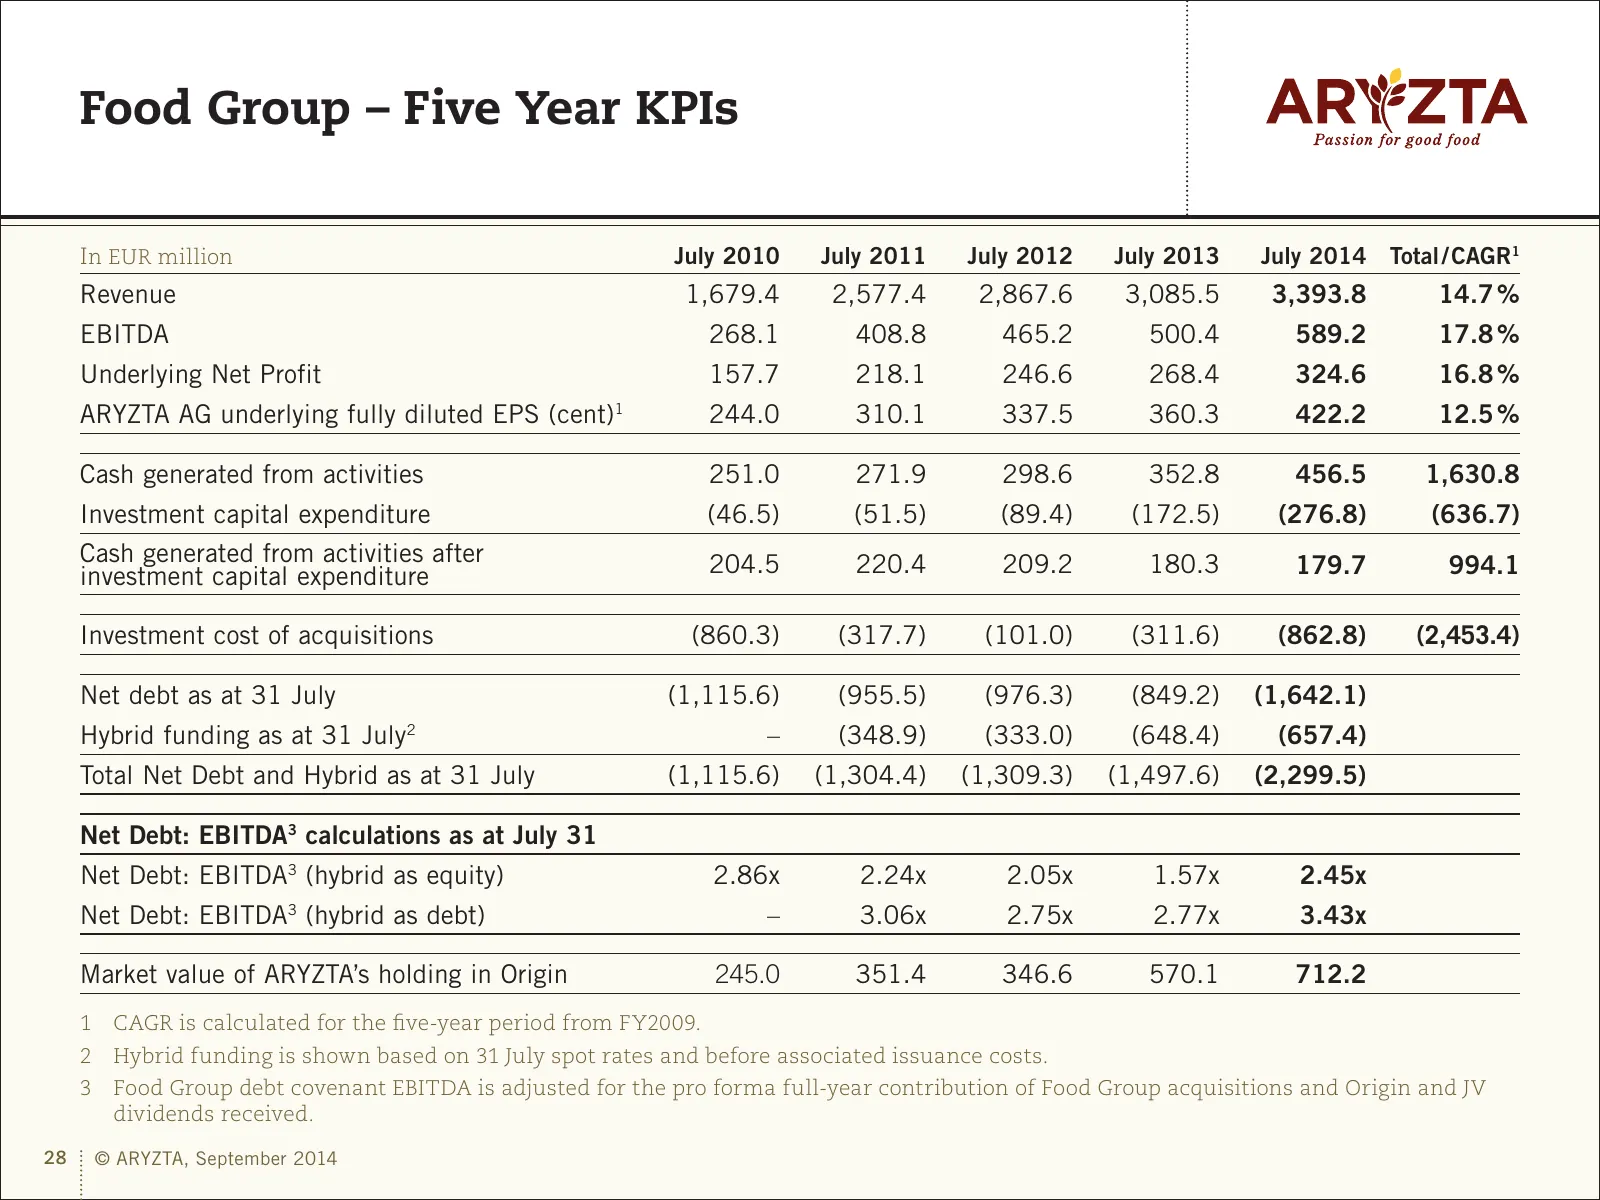
Food Group – Five Year KPIs In EUR million July 2010 July 2011 July 2012 July 2013 July 2014 Total / CAGR1 Revenue 1,679.4 2,577.4 2,867.6 3,085.5 3,393.8 14.7 % EBITDA 268.1 408.8 465.2 500.4 589.2 17.8 % Underlying Net Profit 157.7 218.1 246.6 268.4 324.6 16.8 % ARYZTA AG underlying fully diluted
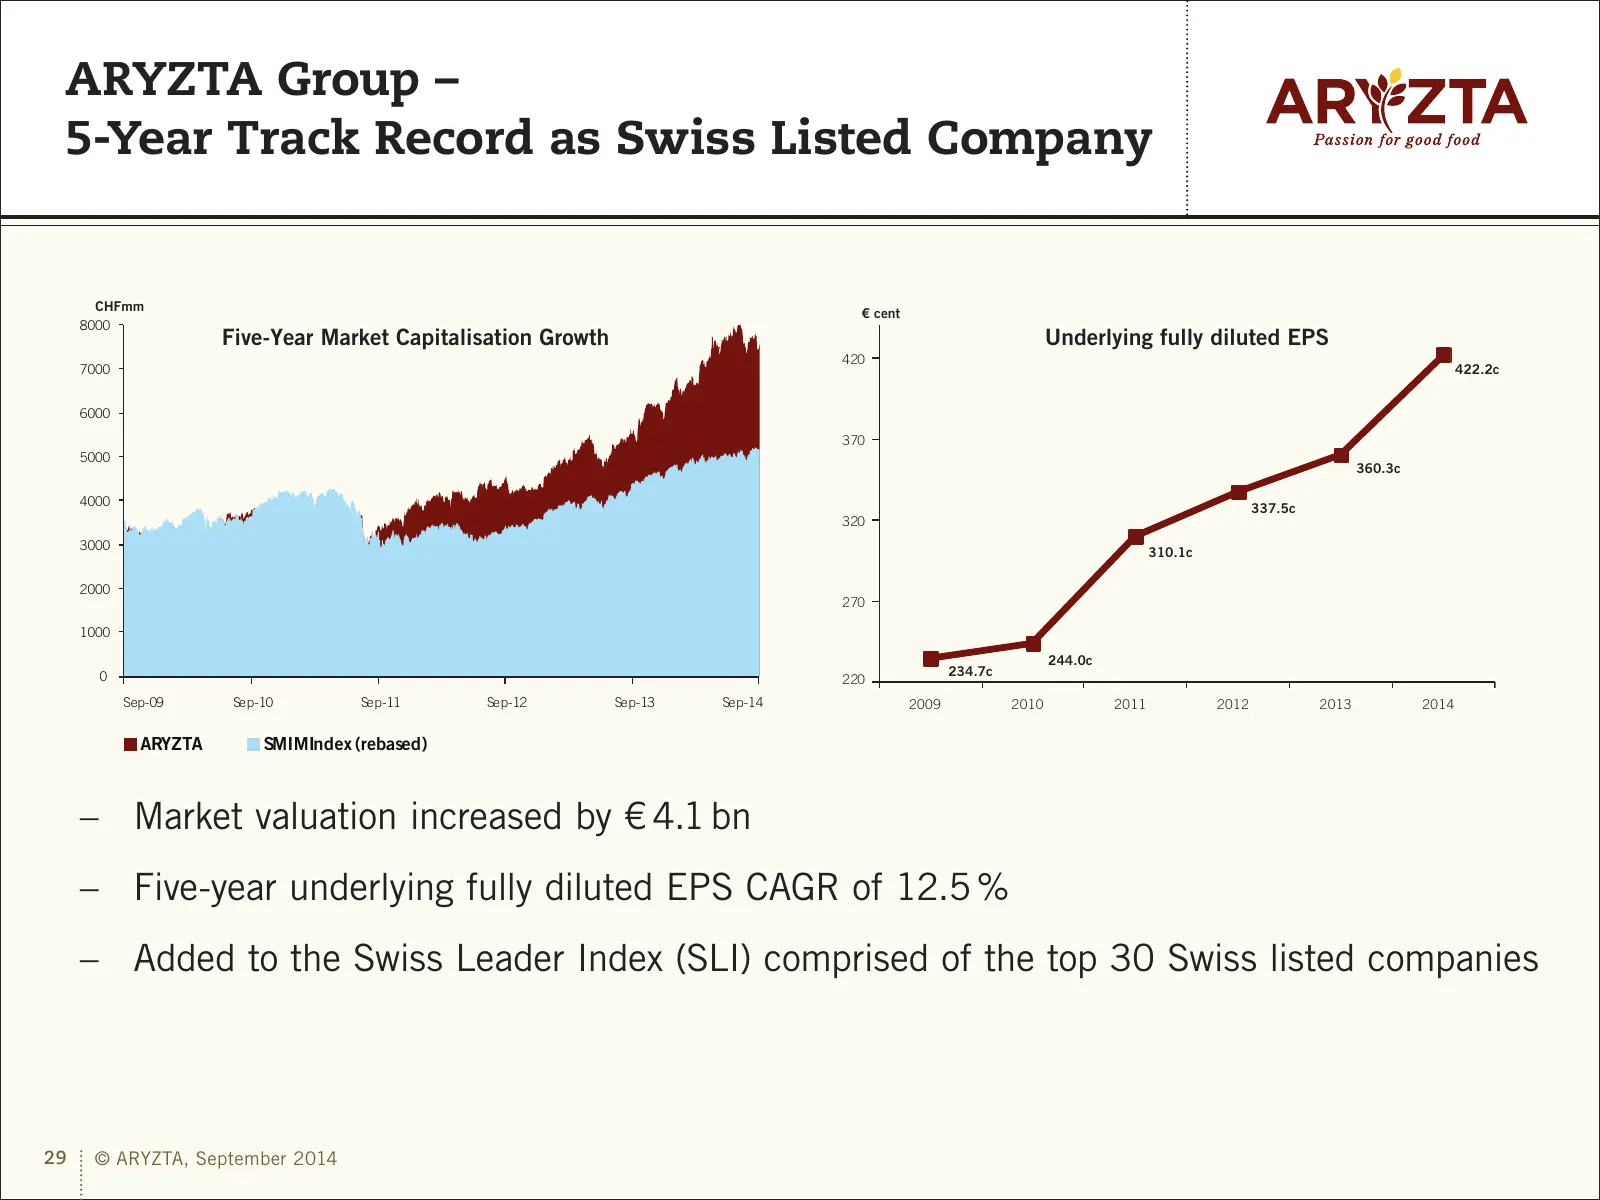
Slide 29: ARYZTA Group – 5-Year Track Record as Swiss Listed Company
ARYZTA Group – 5-Year Track Record as Swiss Listed Company CHFmm € cent 8000 Five-Year Market Capitalisation Growth Underlying fully diluted EPS 420 7000 422.2c 6000 370 5000 360.3c 4000 337.5c 320 3000 310.1c 2000 270 1000 244.0c 0 234.7c 220 Sep-09 Sep-10 Sep-11 Sep-12 Sep-13 Sep-14 2009 2010 2011
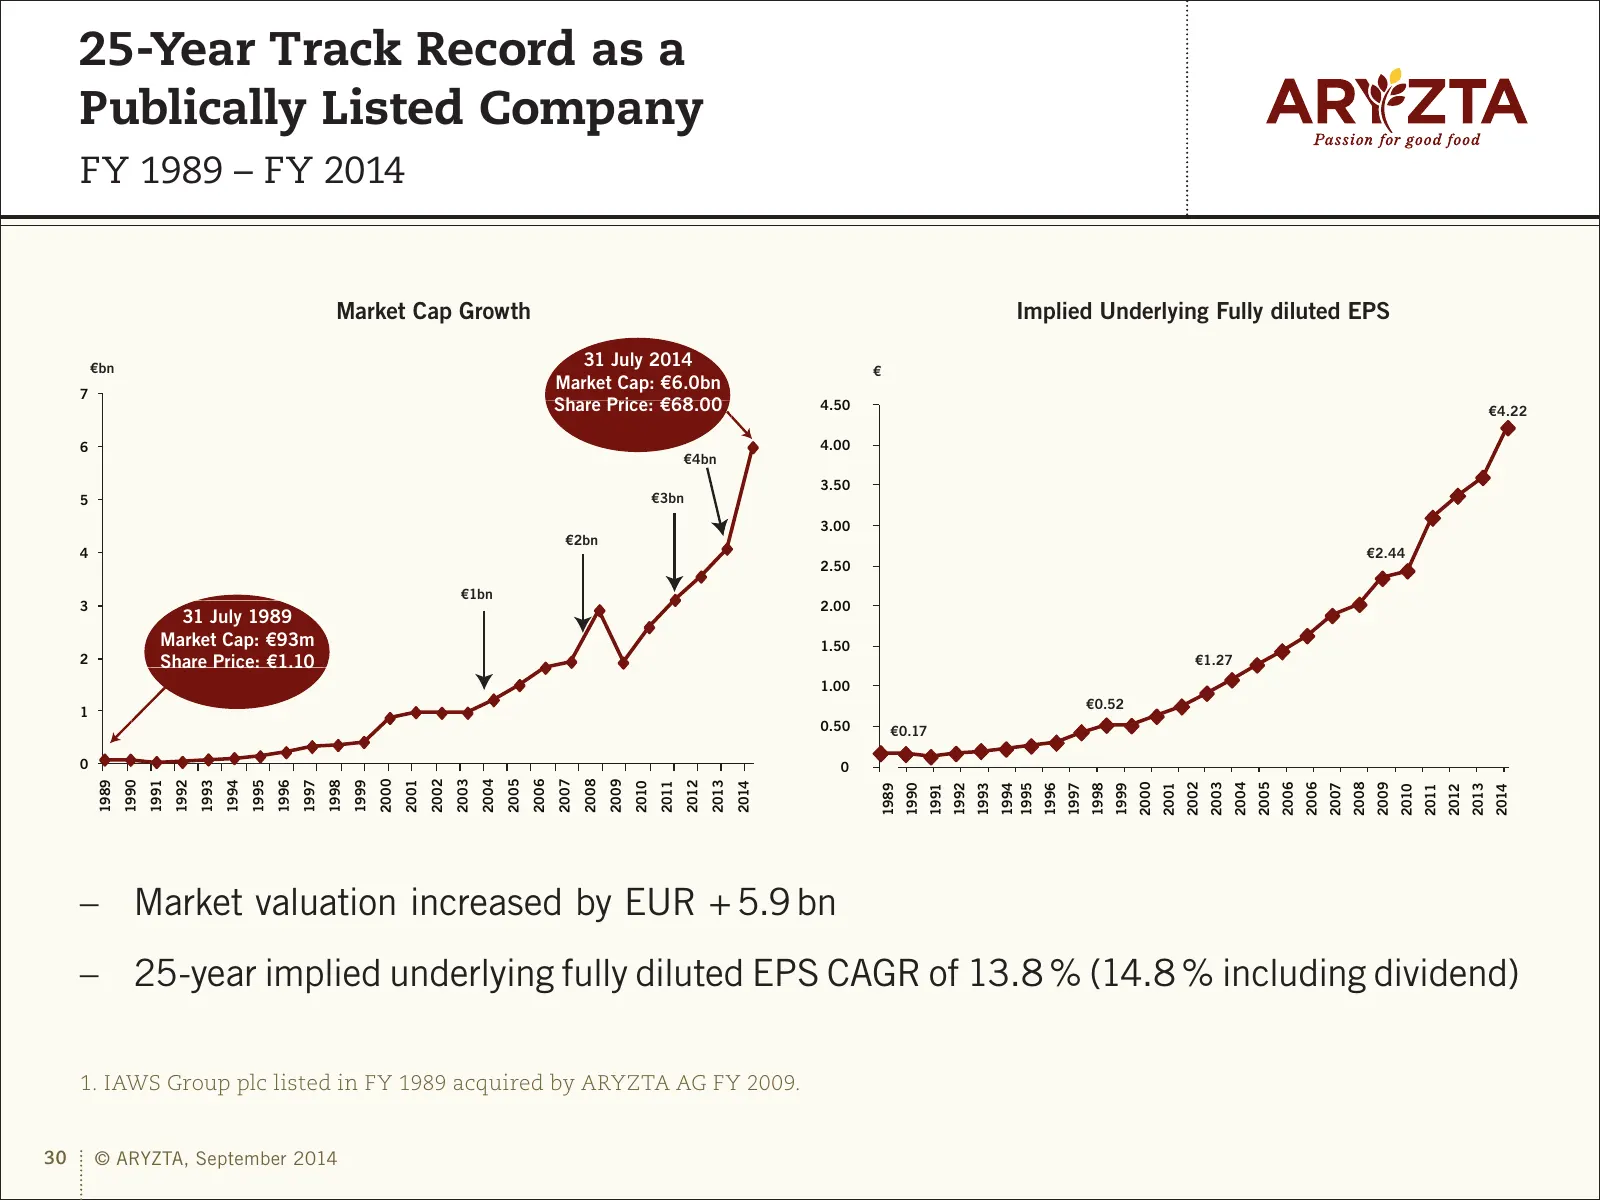
Slide 30: 25-Year Track Record as a Publically Listed Company
25-Year Track Record as a Publically Listed Company FY 1989 – FY 2014 Market Cap Growth Implied Underlying Fully diluted EPS €bn 31 July 2014 € Market Cap: €6.0bn 7 Share Price: €68.00 4.50 €4.22 6 4.00 €4bn 3.50 5 €3bn 3.00 €2bn 4 €2.44 2.50 €1bn 3 2.00 31 July 1989 Market Cap: €93m 1.50 2 Share Pr
Slide 31: Medium Term Outlook
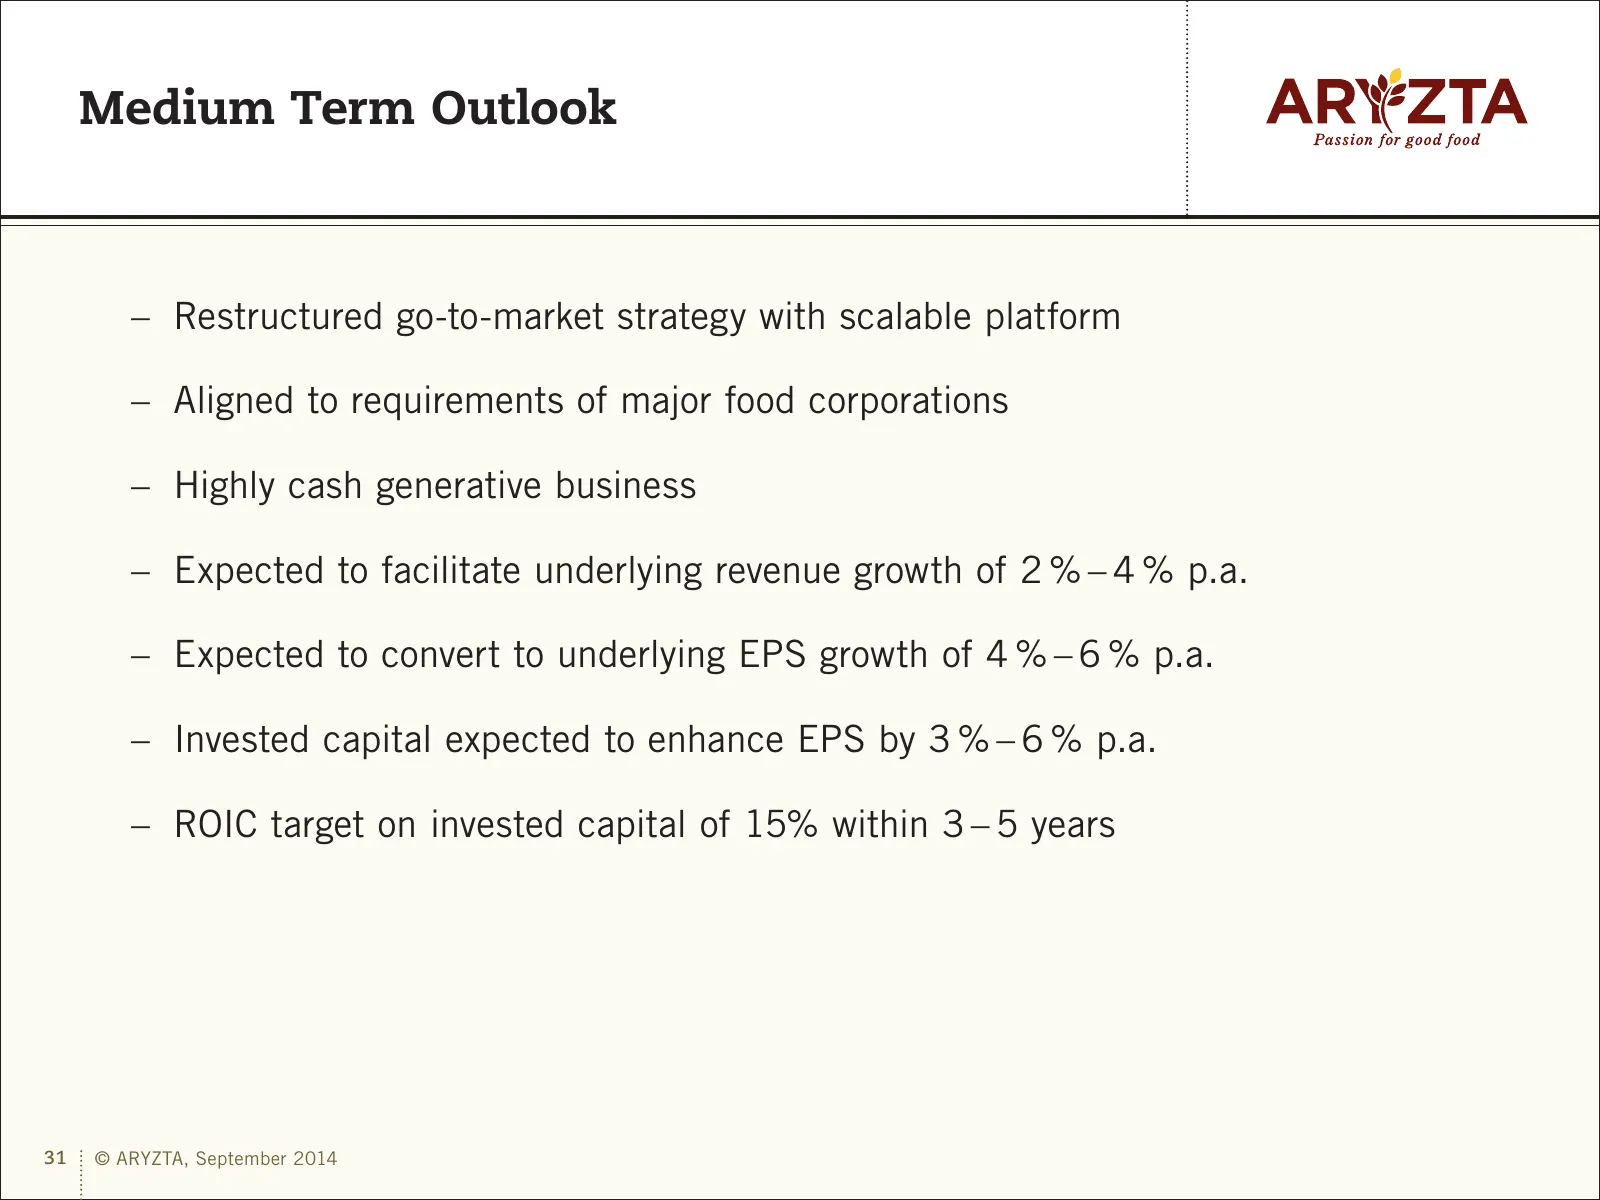
Medium Term Outlook –– Restructured go-to-market strategy with scalable platform –– Aligned to requirements of major food corporations –– Highly cash generative business –– Expected to facilitate underlying revenue growth of 2 % – 4 % p.a. –– Expected to convert to underlying EPS growth of 4 % – 6 %

Slide 32: Thank you!
Thank you! 32 © ARYZTA, September 2014
Slide 33: Appendix – Origin Financials
Appendix 1 – Origin Financials 33 © ARYZTA, September 2014
Slide 34: Origin – Income Statement
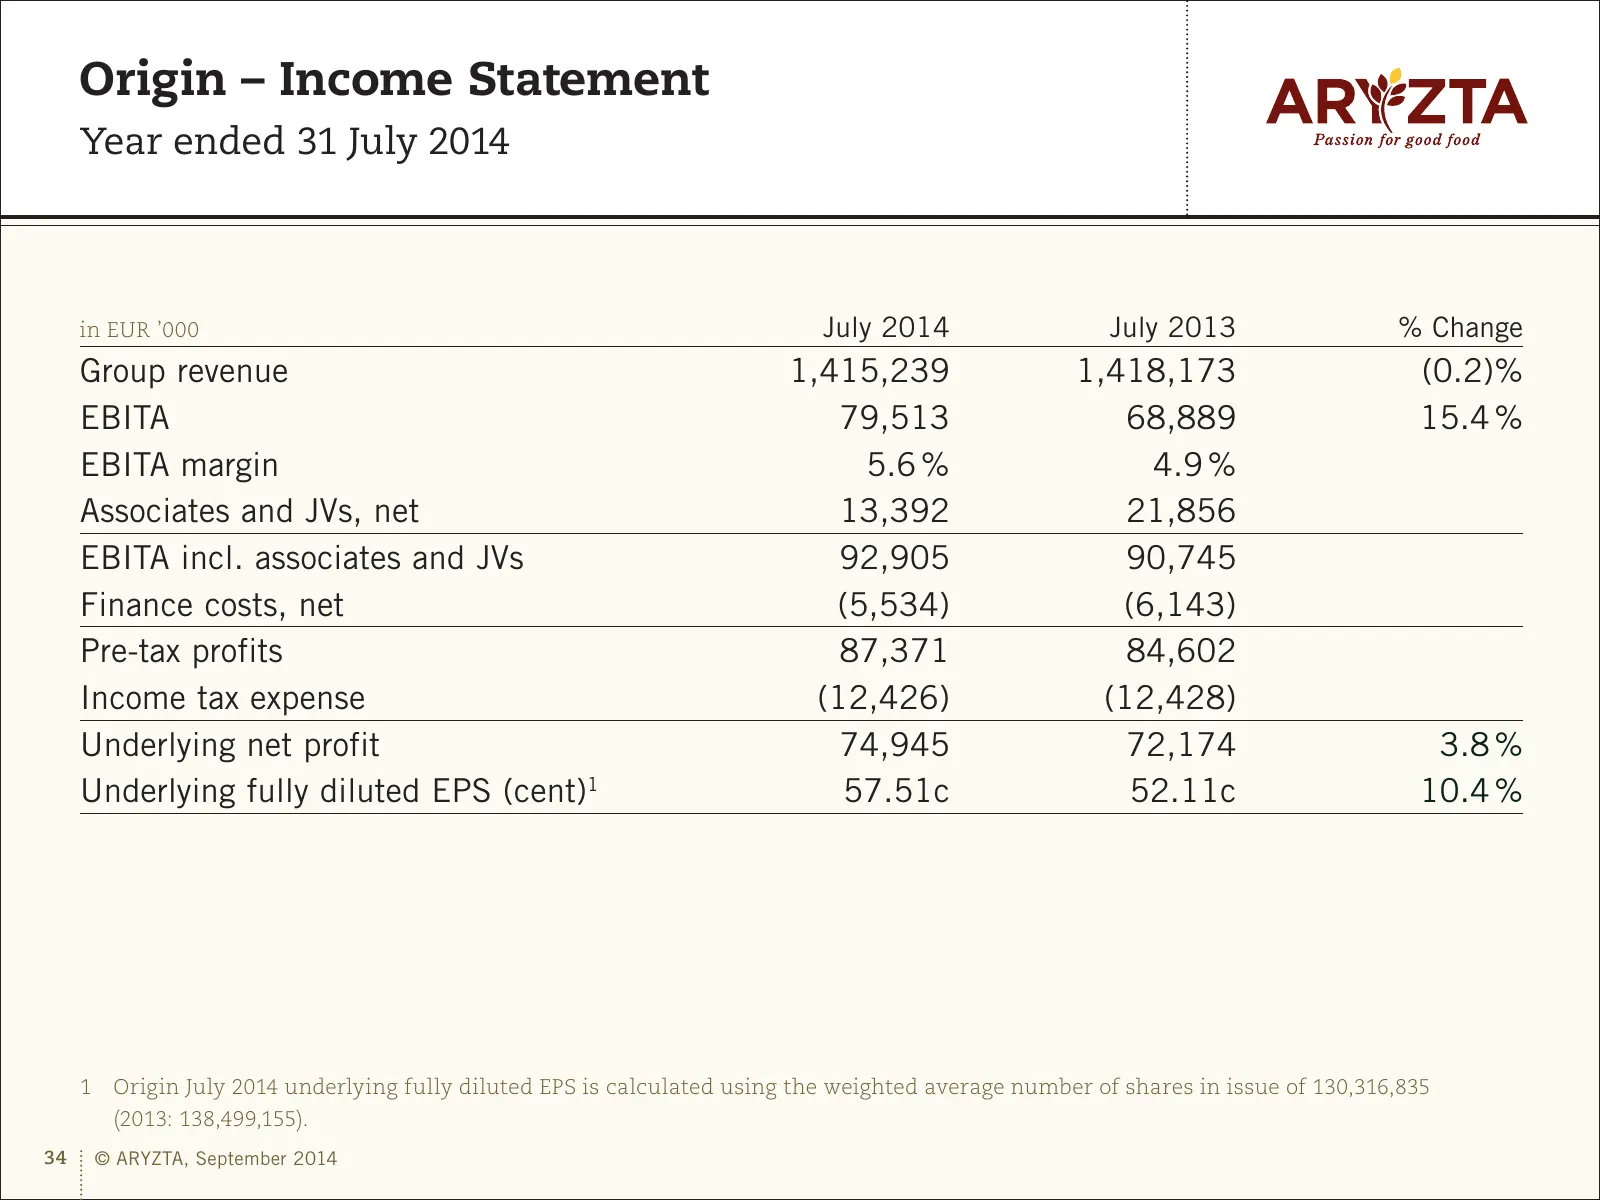
Origin – Income Statement Year ended 31 July 2014 in EUR ’000 July 2014 July 2013 % Change Group revenue 1,415,239 1,418,173 (0.2)% EBITA 79,513 68,889 15.4 % EBITA margin 5.6 % 4.9 % Associates and JVs, net 13,392 21,856 EBITA incl. associates and JVs 92,905 90,745 Finance costs, net (5,534) (6,143
Slide 35: Origin – Underlying Net Profit Rec.
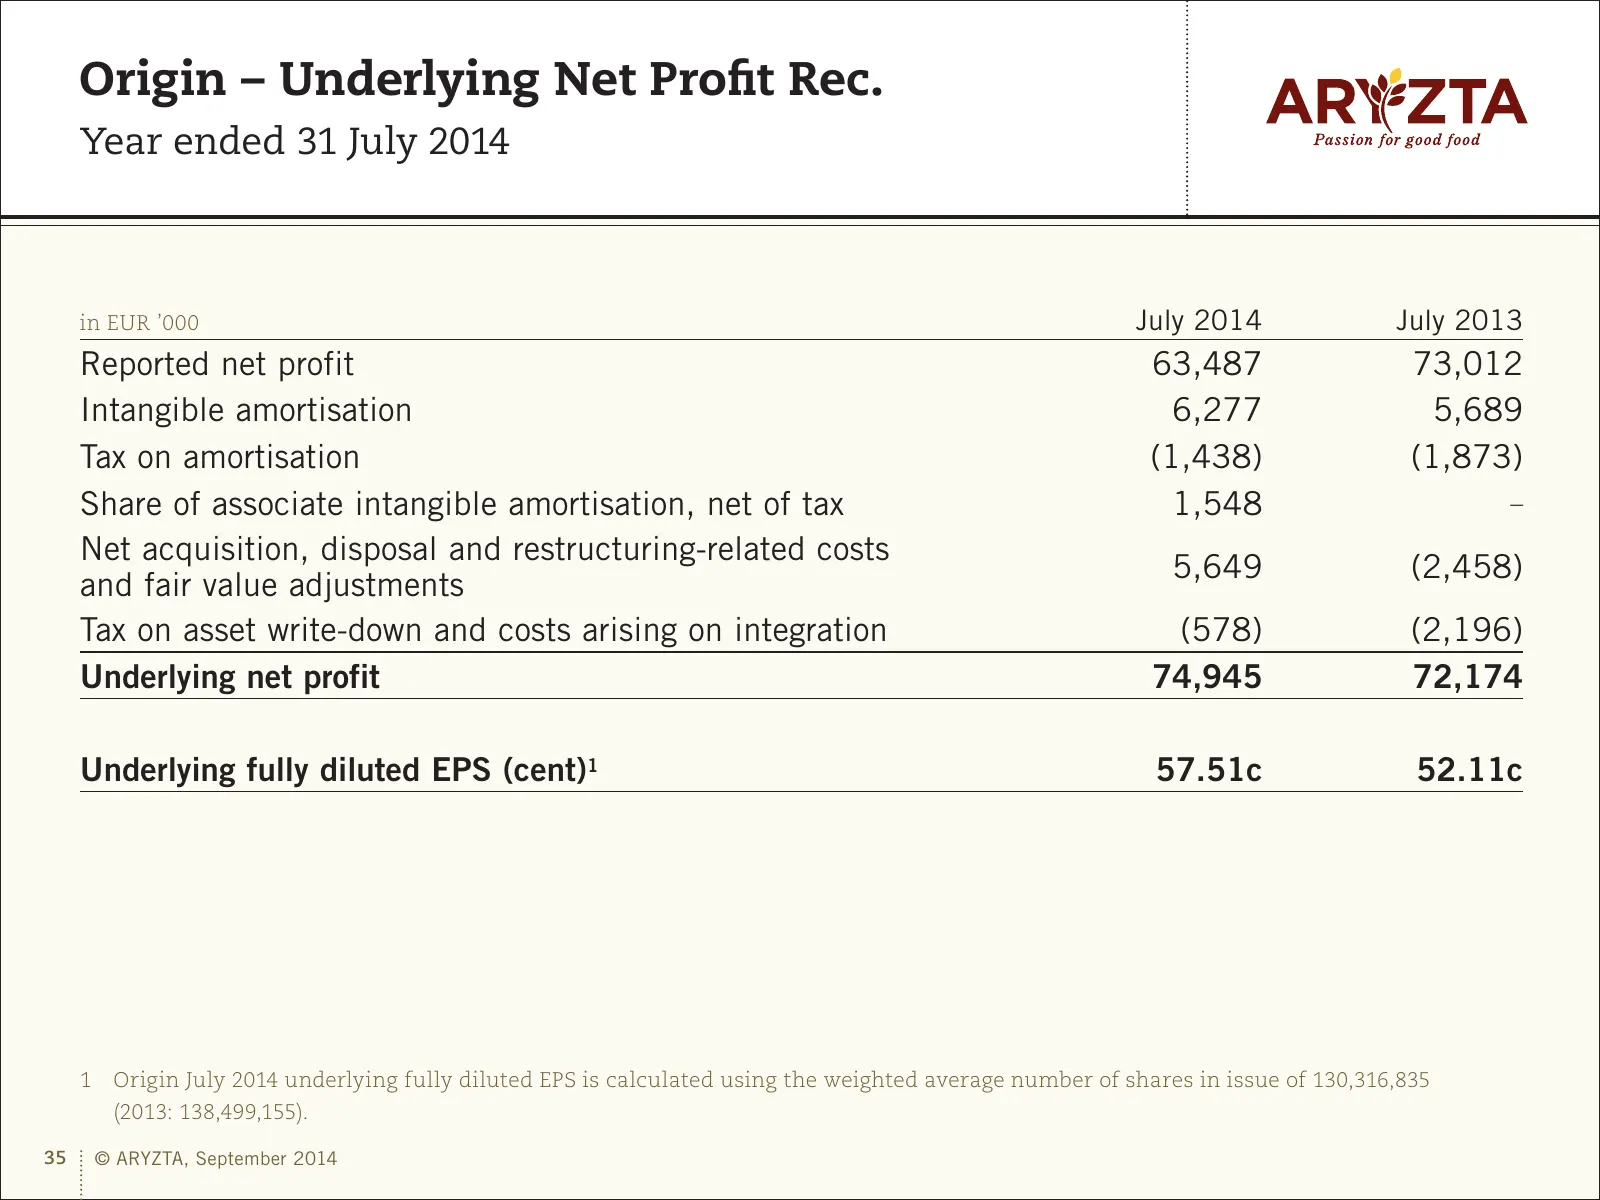
Origin – Underlying Net Profit Rec. Year ended 31 July 2014 in EUR ’000 July 2014 July 2013 Reported net profit 63,487 73,012 Intangible amortisation 6,277 5,689 Tax on amortisation (1,438) (1,873) Share of associate intangible amortisation, net of tax 1,548 – Net acquisition, disposal and restructu
Slide 36: Appendix – Other Financial Information and Presentation Glossary
Appendix 2 – Other Financial Information and Presentation Glossary 36 © ARYZTA, September 2014
Slide 37: Food Group – International Footprint
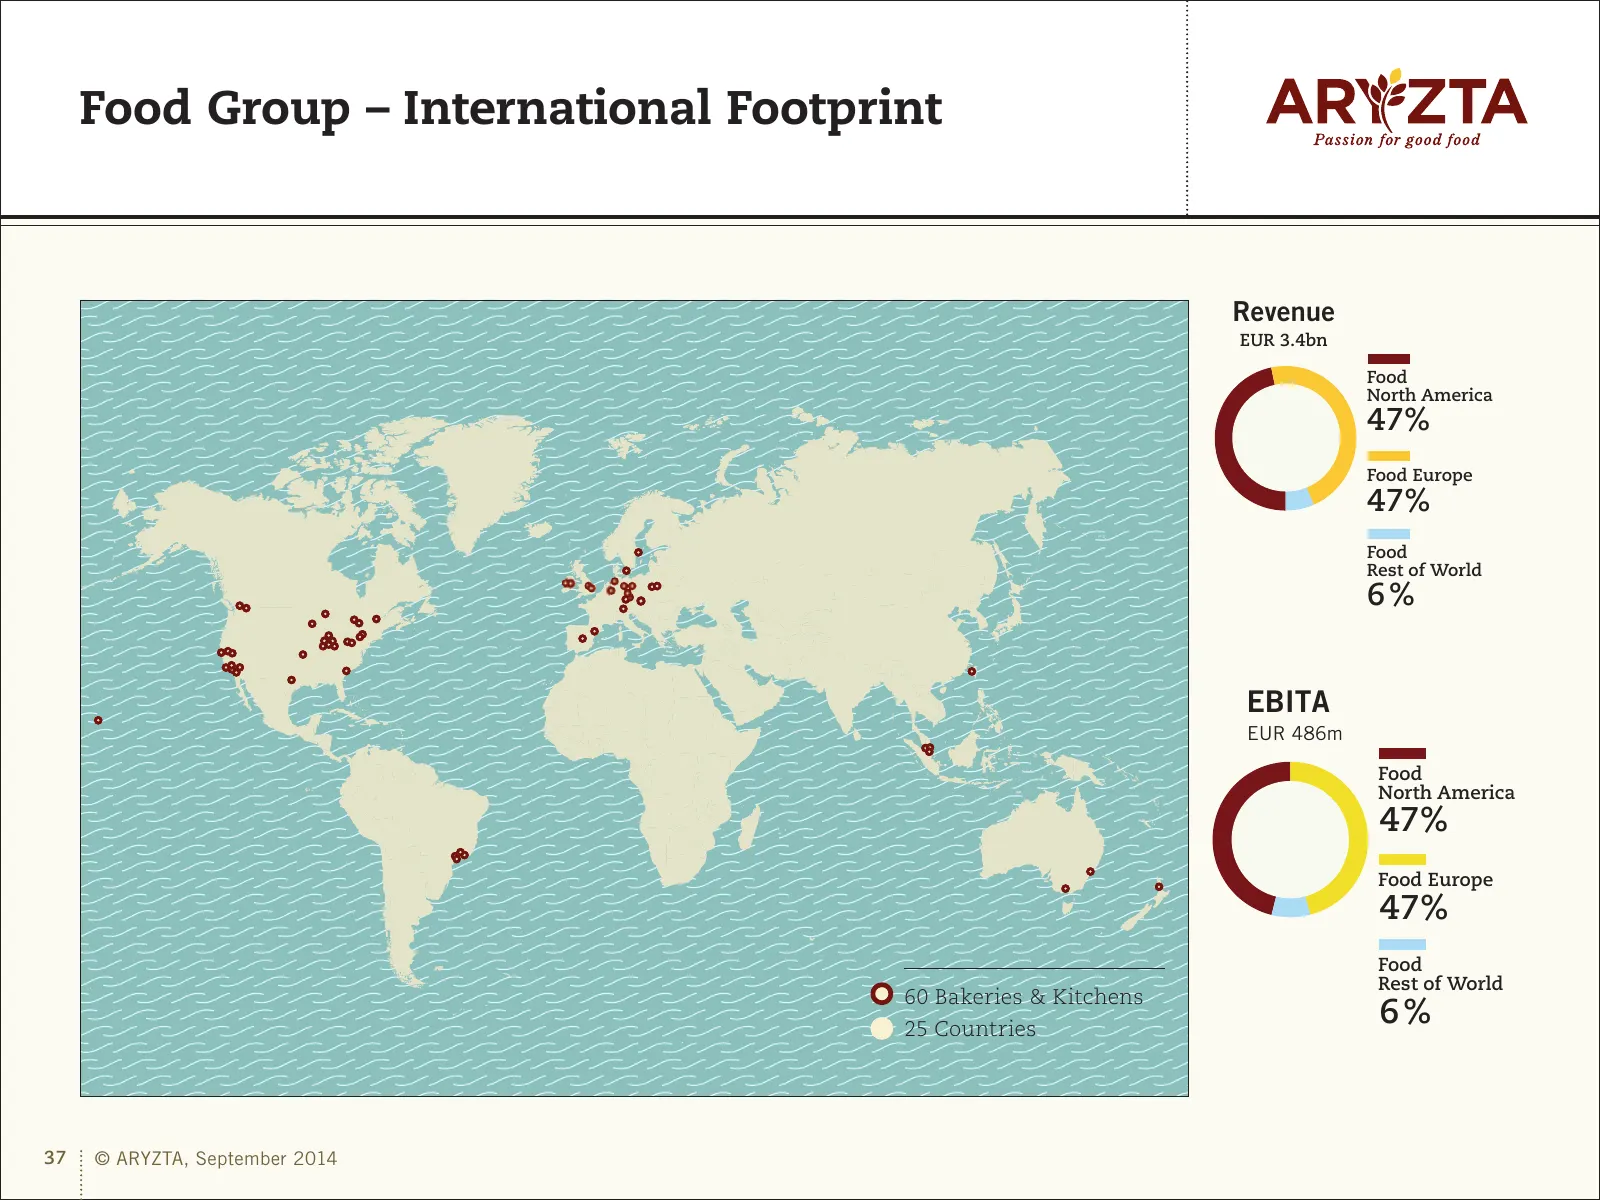
Food Group – International Footprint Revenue EUR 3.4bn Food North America 47% Food Europe 47% Food Rest of World 6% EBITA EUR 486m Food North America 47% Food Europe 47% Food Rest of World 60 Bakeries & Kitchens 25 Countries 6% 37 © ARYZTA, September 2014
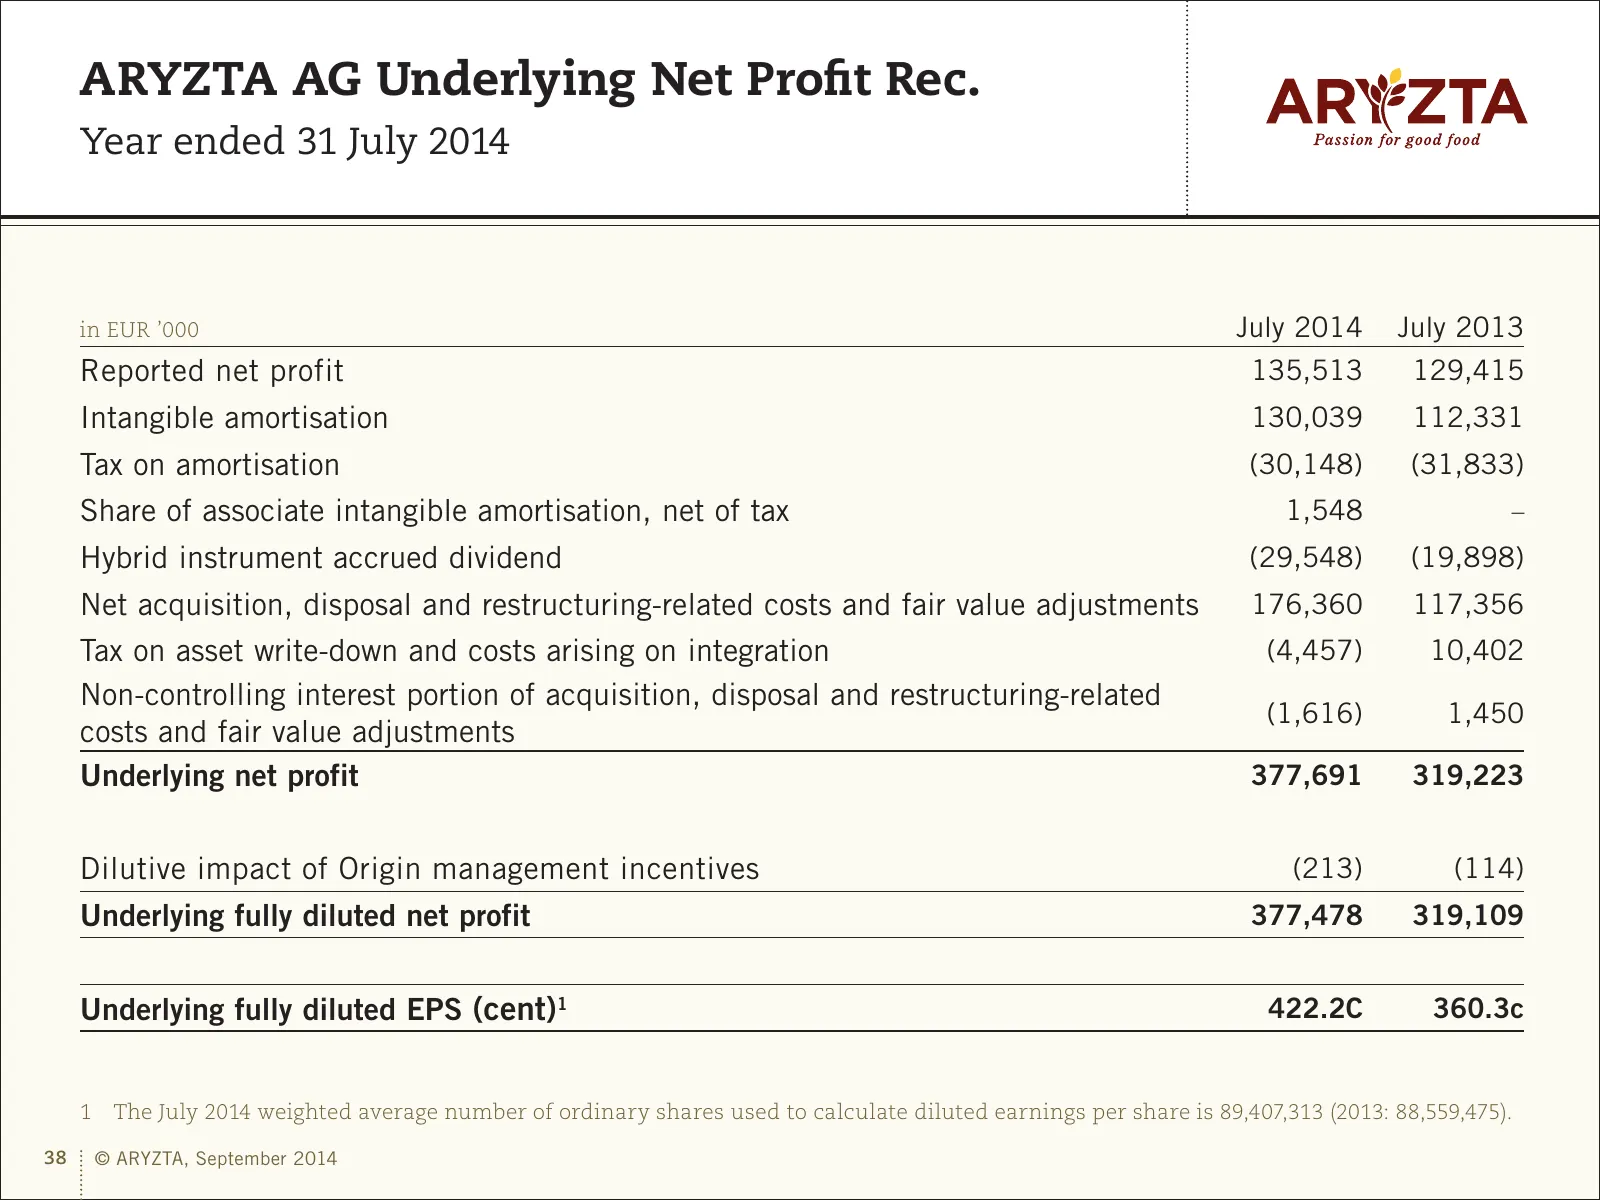
Slide 38: ARYZTA AG Underlying Net Profit Rec.
ARYZTA AG Underlying Net Profit Rec. Year ended 31 July 2014 in EUR ’000 July 2014 July 2013 Reported net profit 135,513 129,415 Intangible amortisation 130,039 112,331 Tax on amortisation (30,148) (31,833) Share of associate intangible amortisation, net of tax 1,548 – Hybrid instrument accrued divi
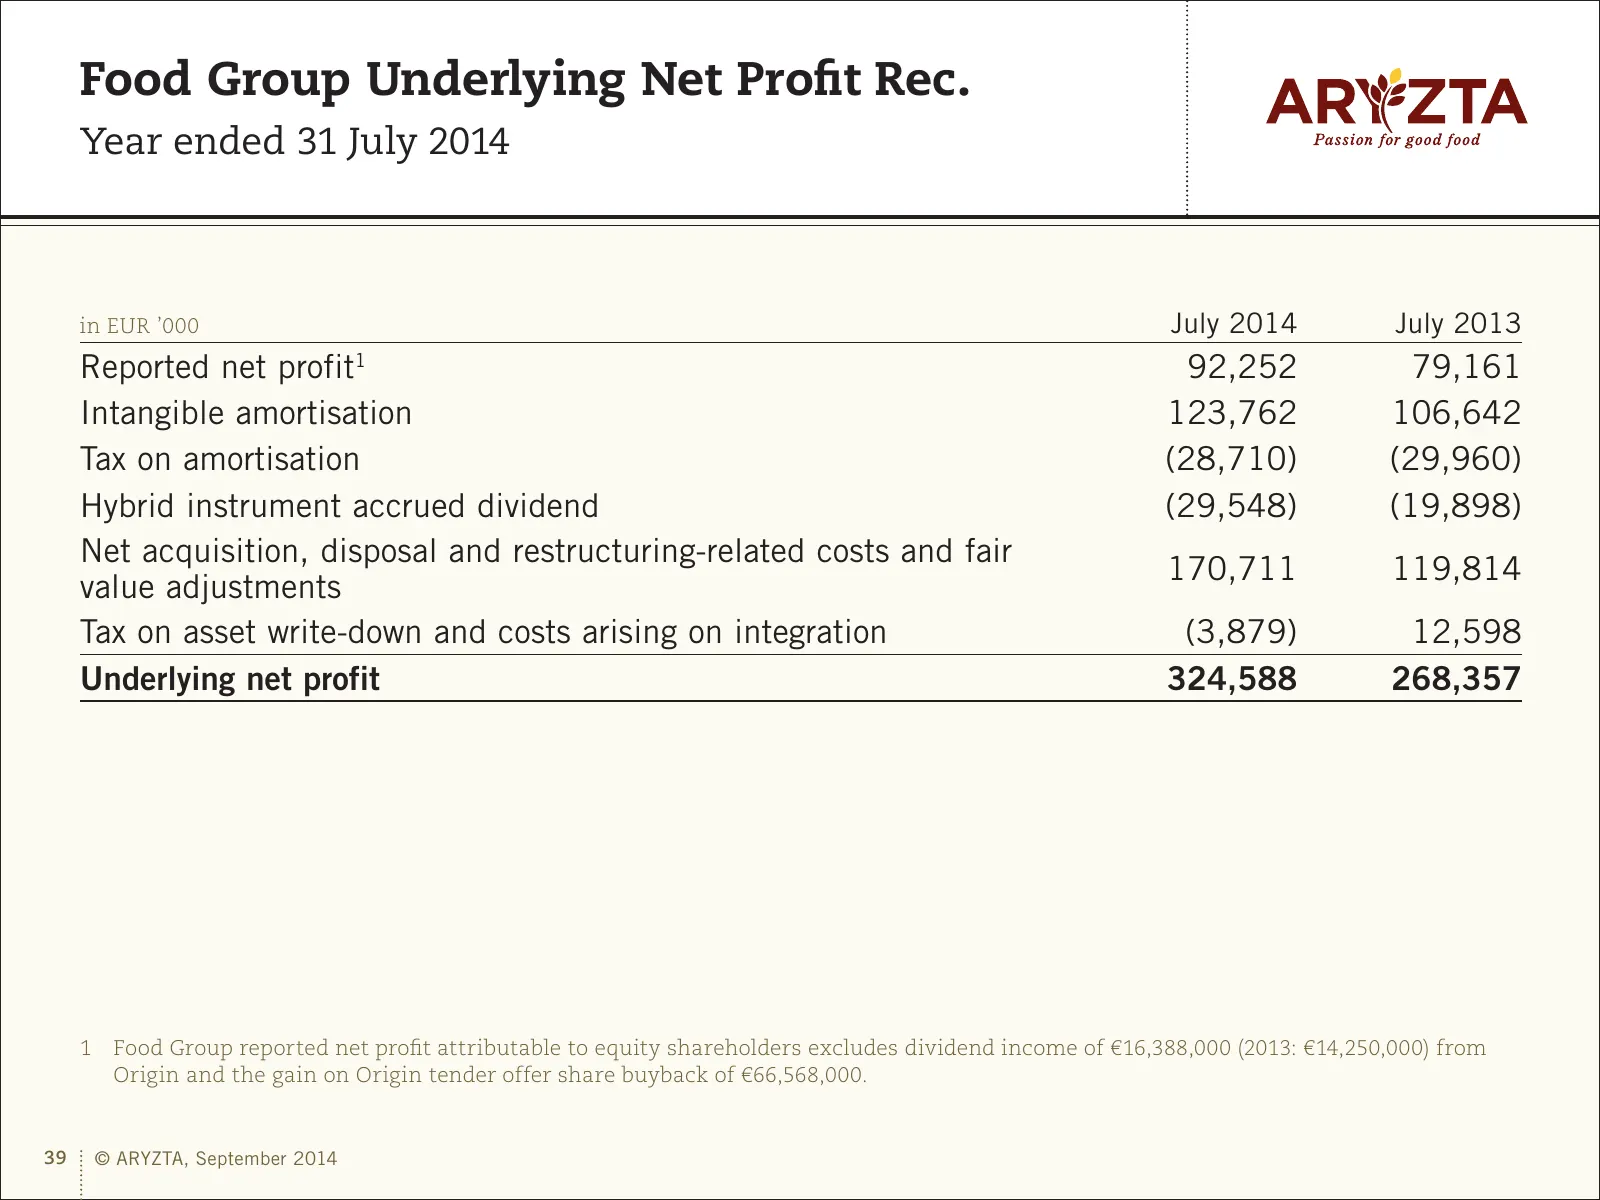
Slide 39: Food Group Underlying Net Profit Rec.
Food Group Underlying Net Profit Rec. Year ended 31 July 2014 in EUR ’000 July 2014 July 2013 Reported net profit1 92,252 79,161 Intangible amortisation 123,762 106,642 Tax on amortisation (28,710) (29,960) Hybrid instrument accrued dividend (29,548) (19,898) Net acquisition, disposal and restructur
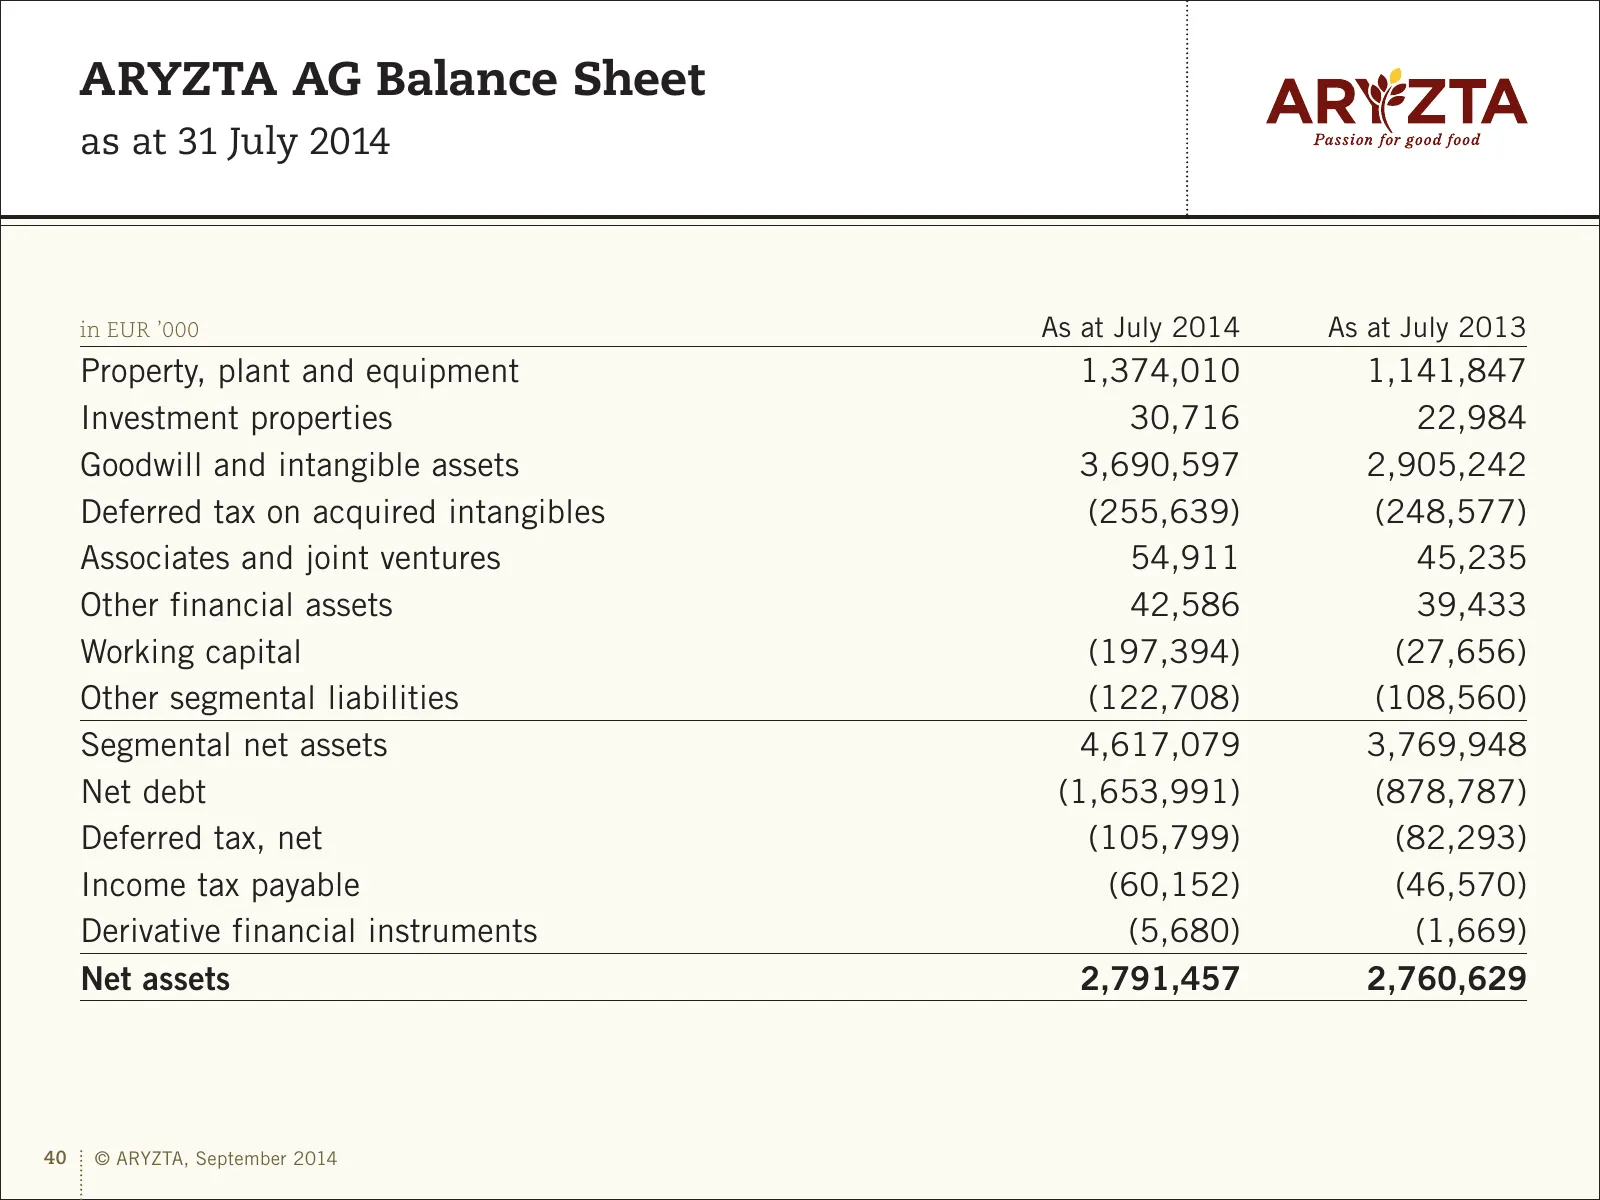
Slide 40: ARYZTA AG Balance Sheet
ARYZTA AG Balance Sheet as at 31 July 2014 in EUR ’000 As at July 2014 As at July 2013 Property, plant and equipment 1,374,010 1,141,847 Investment properties 30,716 22,984 Goodwill and intangible assets 3,690,597 2,905,242 Deferred tax on acquired intangibles (255,639) (248,577) Associates and join
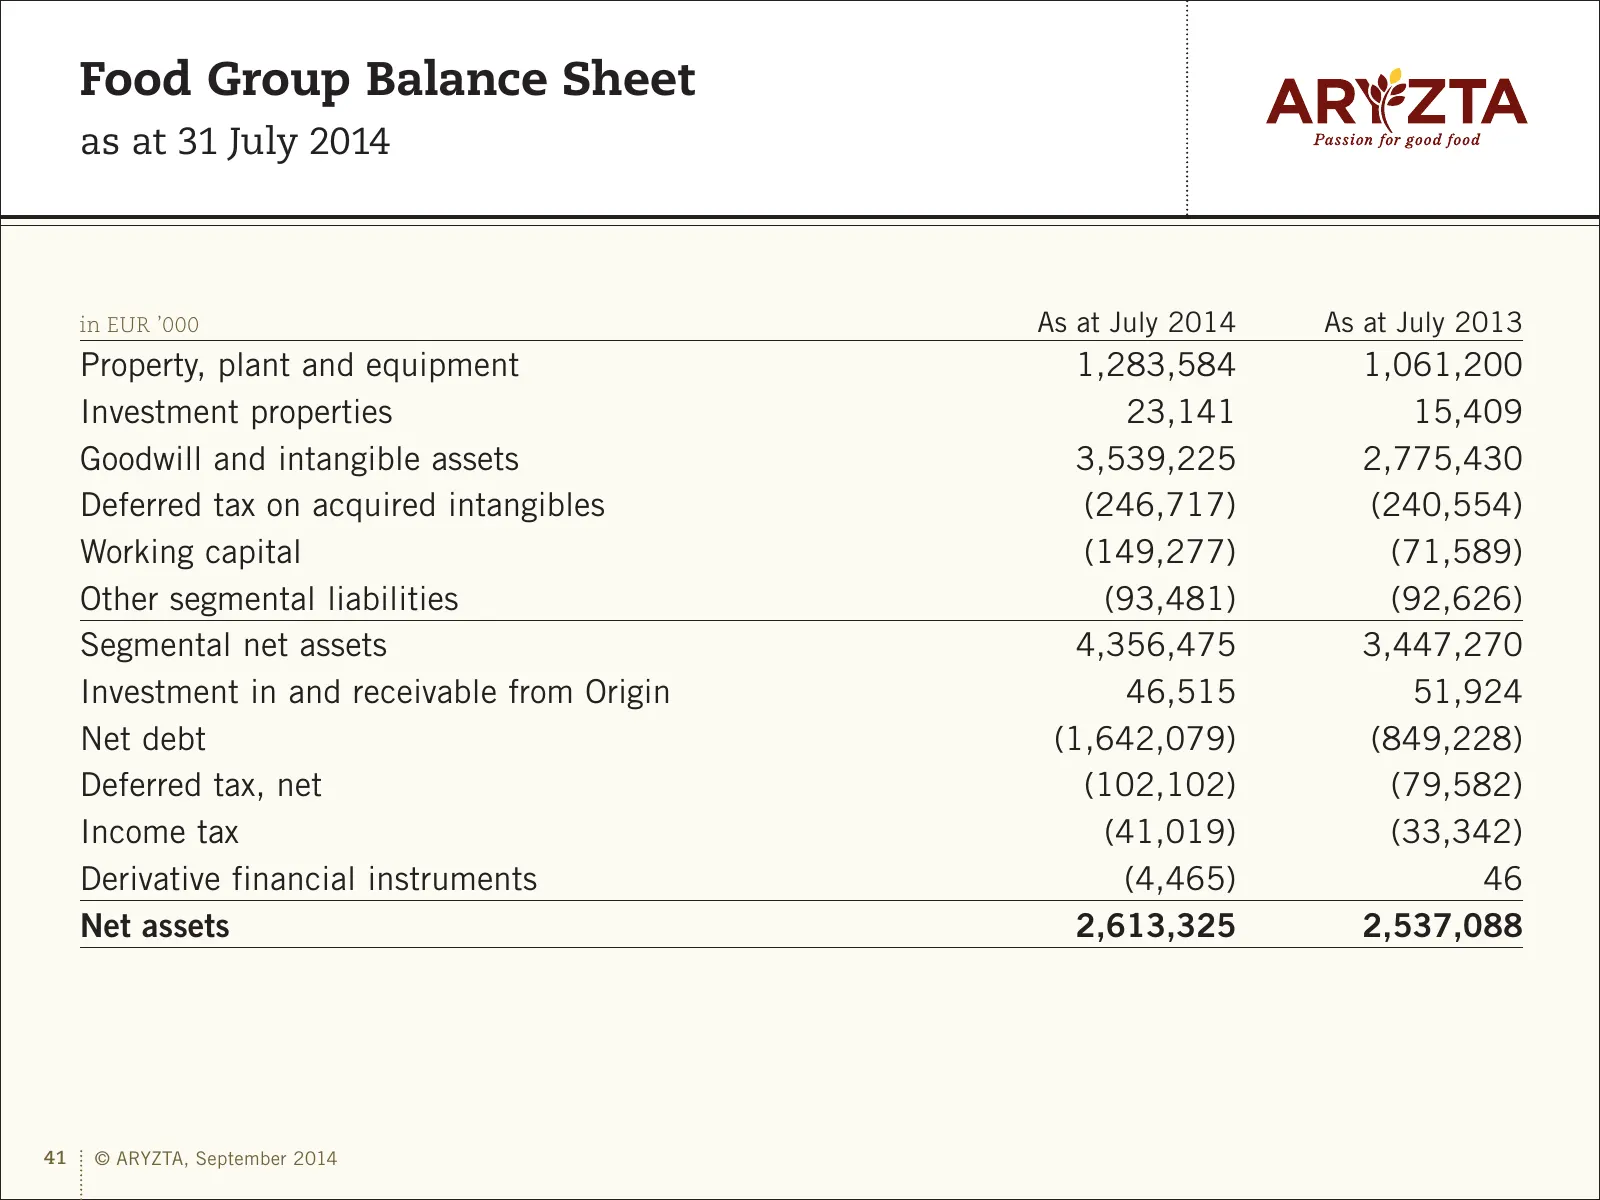
Slide 41: Food Group Balance Sheet
Food Group Balance Sheet as at 31 July 2014 in EUR ’000 As at July 2014 As at July 2013 Property, plant and equipment 1,283,584 1,061,200 Investment properties 23,141 15,409 Goodwill and intangible assets 3,539,225 2,775,430 Deferred tax on acquired intangibles (246,717) (240,554) Working capital (1
Slide 42: Food Group – Financing
Food Group – Financing Excluding Origin – non-recourse financing facilities Debt Funding Principal Maturity Feb 2014 – Syndicated Bank Loan CHF 1,977m Feb 2019 Feb 2014 – US Private Placement USD 490m / EUR 25m Feb 2020 –Feb 2024 May 2010 – US Private Placement USD 350m / EUR 25m May 2016 – May 2022
Slide 43: Food Group – Gross Term Debt Maturity Profile
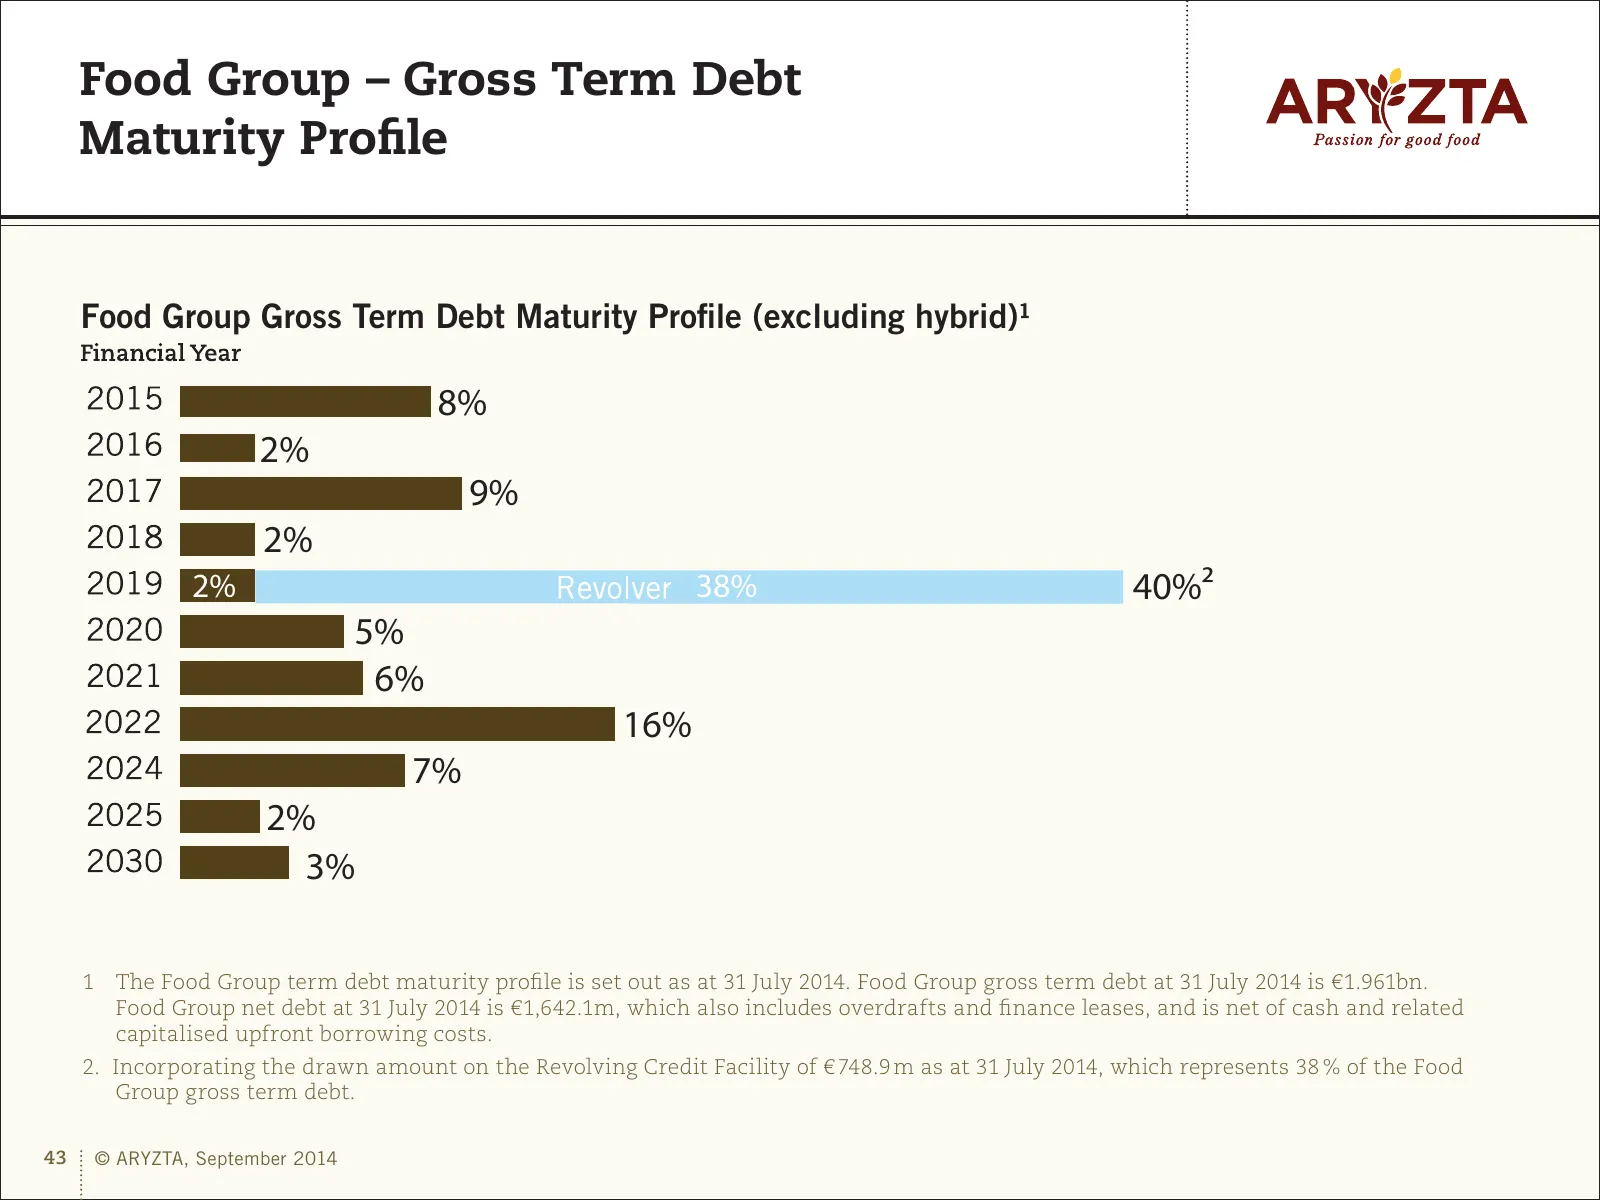
Food Group – Gross Term Debt Maturity Profile Food Group Gross Term Debt Maturity Profile (excluding hybrid)¹ 8% 2% 9% 2% 2% 38% 40%² 5% 6% 16% 7% 2% 3% 1 The Food Group term debt maturity profile is set out as at 31 July 2014. Food Group gross term debt at 31 July 2014 is €1.961bn. Food Group net d
Slide 44: ARYZTA Group – Return on Invested Capital
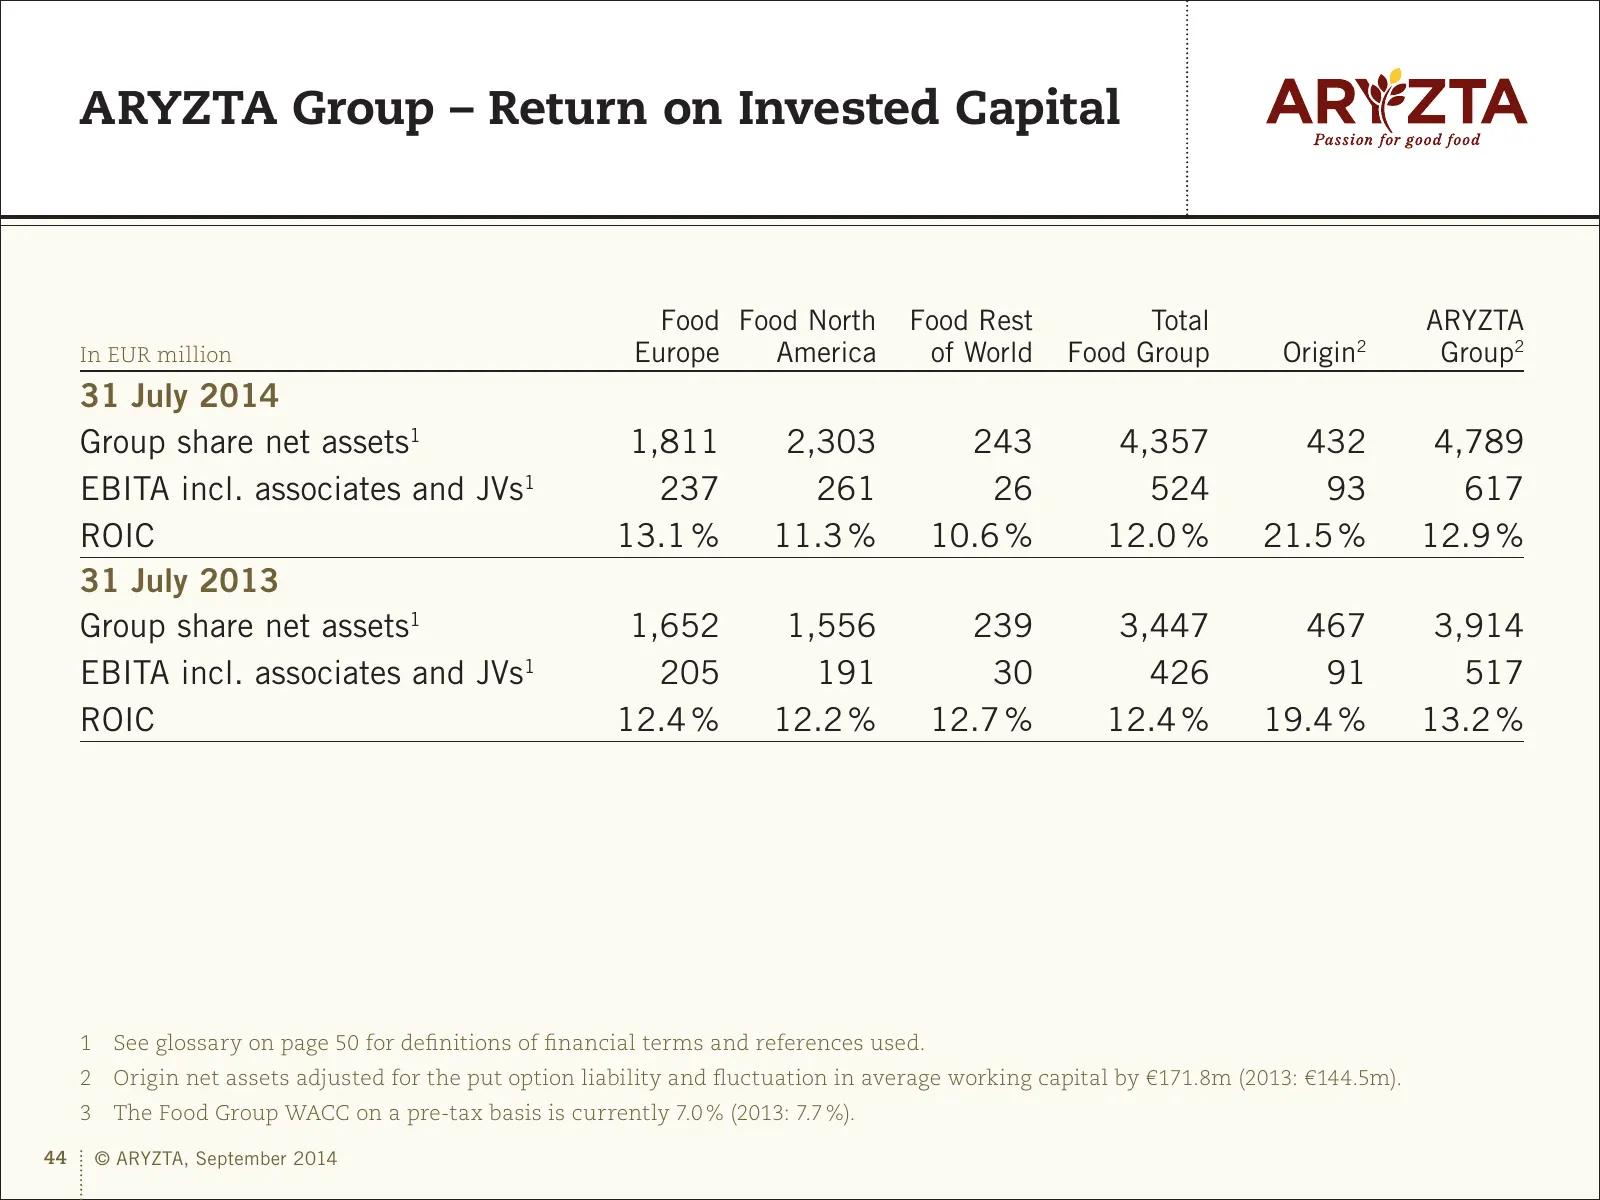
ARYZTA Group – Return on Invested Capital Food Food North Food Rest Total ARYZTA In EUR million Europe America of World Food Group Origin2 Group2 31 July 2014 Group share net assets1 1,811 2,303 243 4,357 432 4,789 EBITA incl. associates and JVs1 237 261 26 524 93 617 ROIC 13.1 % 11.3 % 10.6 % 12.0
Slide 45: Food Group – Underlying Revenue Growth
Food Group – Underlying Revenue Growth 25.0% 20.0% 15.0% 10.0% 5.0% 0.0% (5.0%) (10.0%) (15.0%) Q1 Q2 Q3 Q4 Q1 Q2 Q3 Q4 Q1 Q2 Q3 Q4 Q1 Q2 Q3 Q4 Q1 Q2 Q3 Q4 Q1 Q2 Q3 Q4 2009 2009 2009 2009 2010 2010 2010 2010 2011 2011 2011 2011 2012 2012 2012 2012 2013 2013 2013 2013 2014 2014 2014 2014 Food Europe
Slide 46: Food Group – Five Year Cash Generation
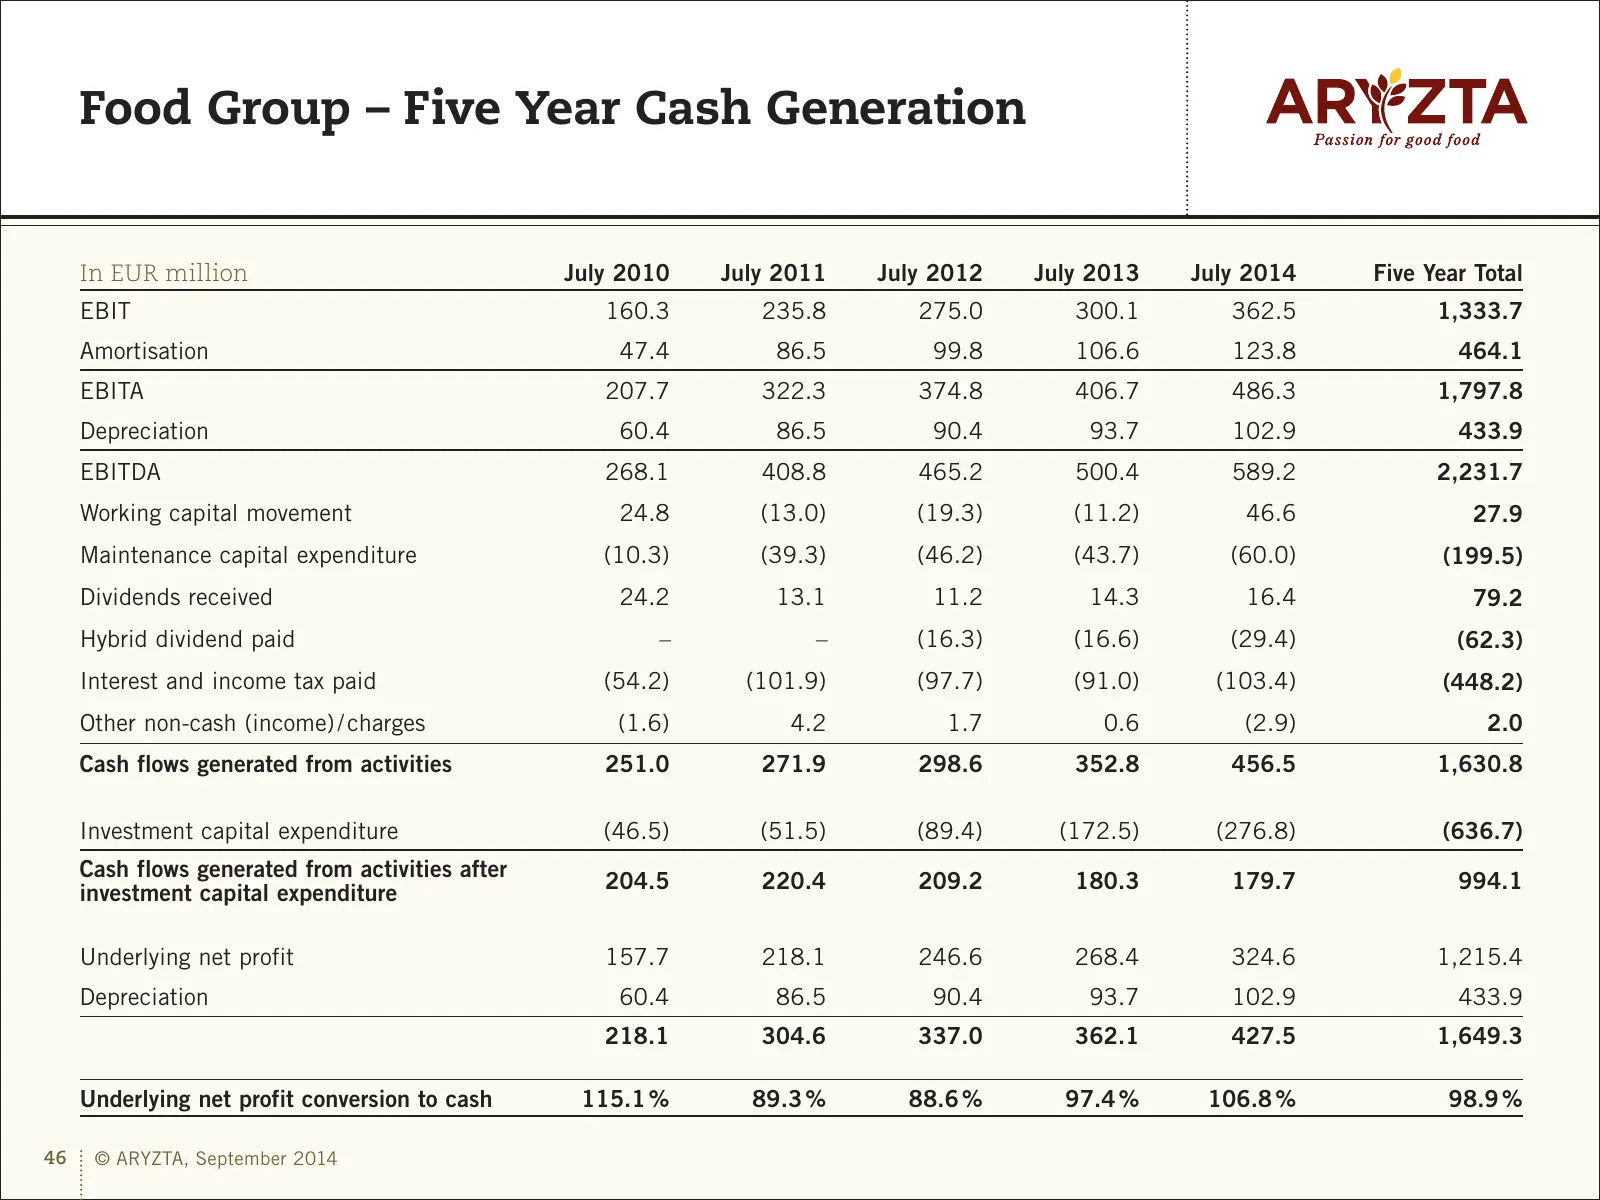
Food Group – Five Year Cash Generation In EUR million July 2010 July 2011 July 2012 July 2013 July 2014 Five Year Total EBIT 160.3 235.8 275.0 300.1 362.5 1,333.7 Amortisation 47.4 86.5 99.8 106.6 123.8 464.1 EBITA 207.7 322.3 374.8 406.7 486.3 1,797.8 Depreciation 60.4 86.5 90.4 93.7 102.9 433.9 EB
Slide 47: Food Group – Five Year Net Debt
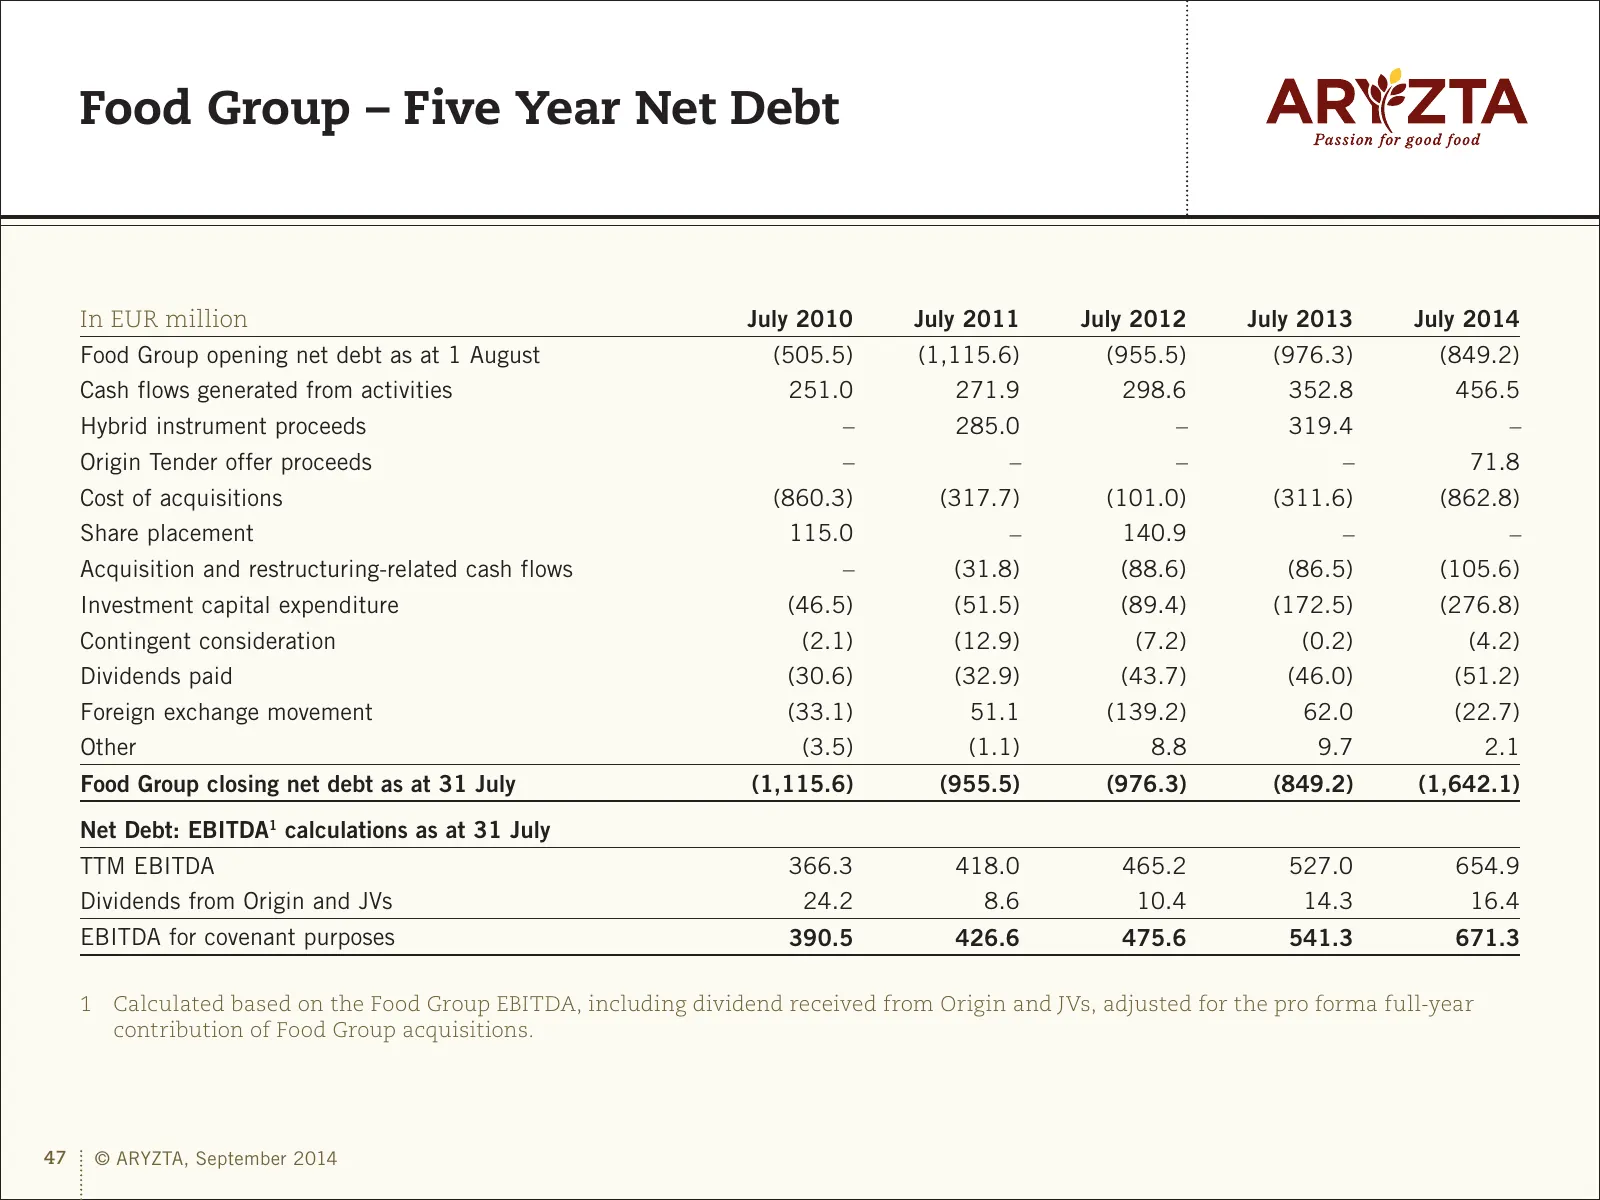
Food Group – Five Year Net Debt In EUR million July 2010 July 2011 July 2012 July 2013 July 2014 Food Group opening net debt as at 1 August (505.5) (1,115.6) (955.5) (976.3) (849.2) Cash flows generated from activities 251.0 271.9 298.6 352.8 456.5 Hybrid instrument proceeds – 285.0 – 319.4 – Origin
Slide 48: EUR Closing and Average FX Rates
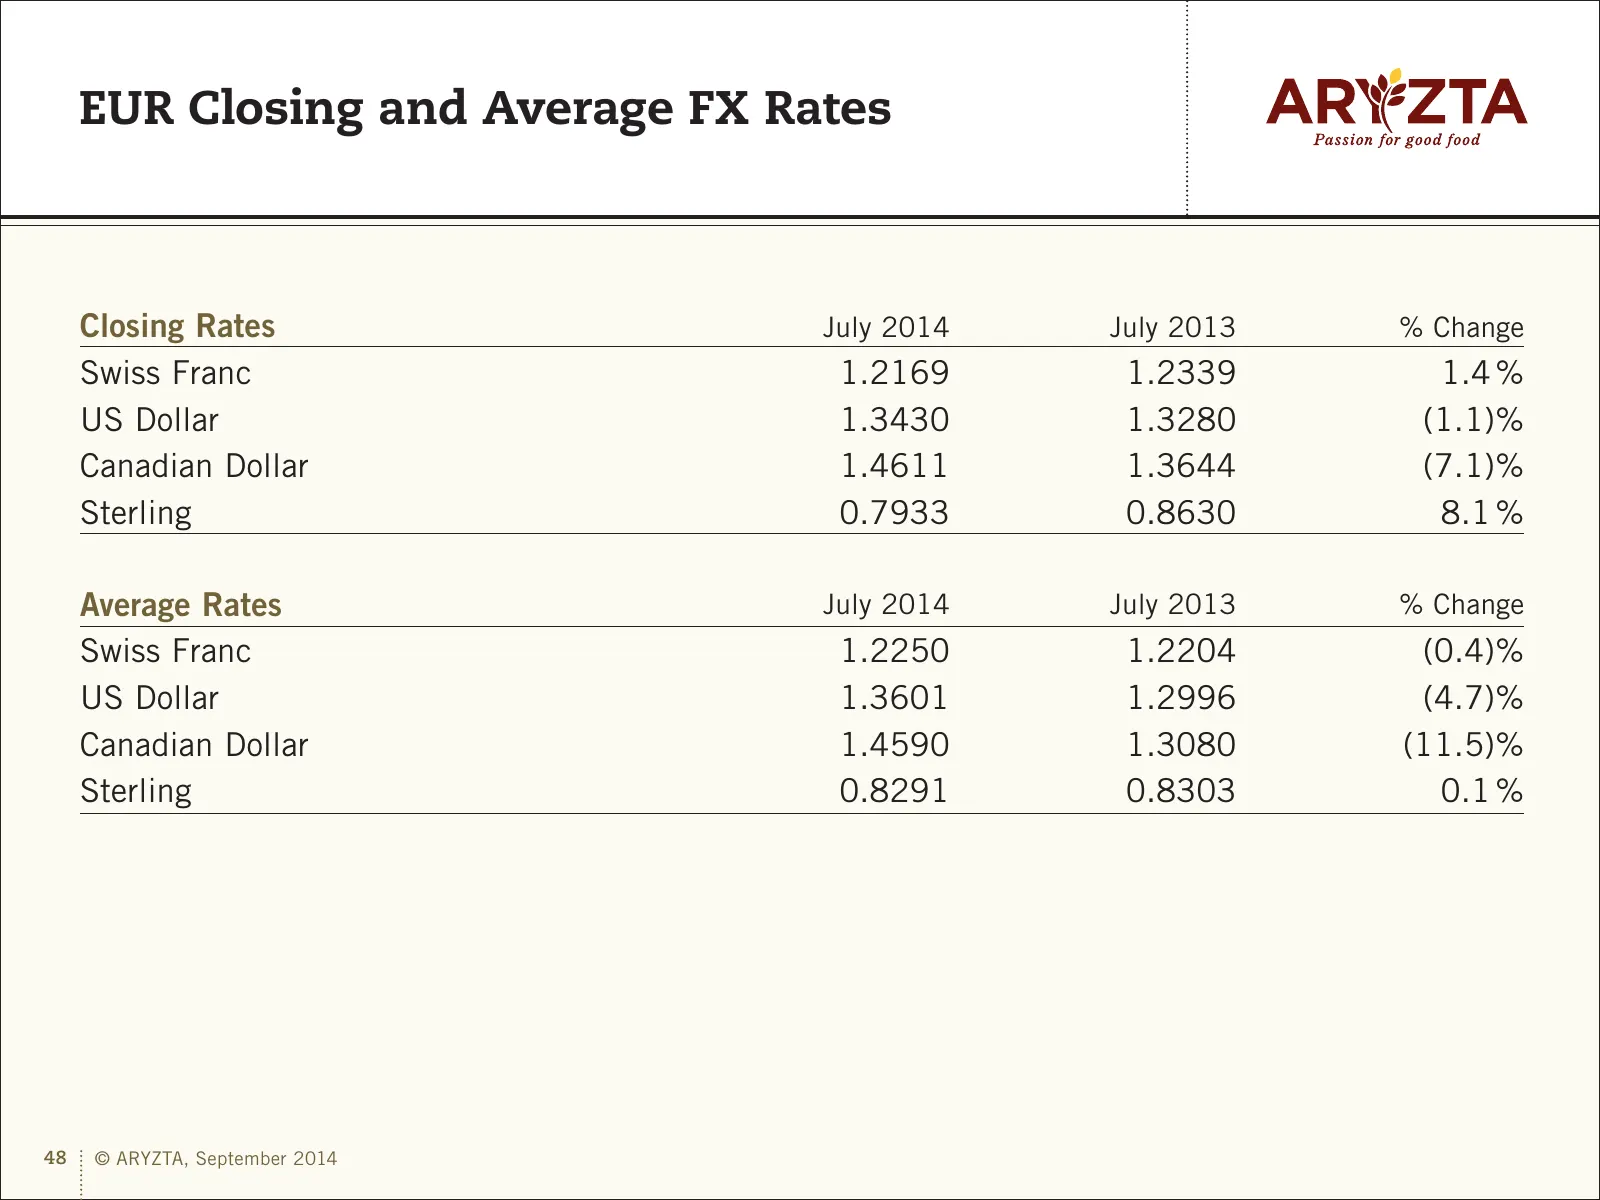
EUR Closing and Average FX Rates Closing Rates July 2014 July 2013 % Change Swiss Franc 1.2169 1.2339 1.4 % US Dollar 1.3430 1.3280 (1.1)% Canadian Dollar 1.4611 1.3644 (7.1)% Sterling 0.7933 0.8630 8.1 % Average Rates July 2014 July 2013 % Change Swiss Franc 1.2250 1.2204 (0.4)% US Dollar 1.3601 1.
Slide 49: ARYZTA – Consensus Estimates
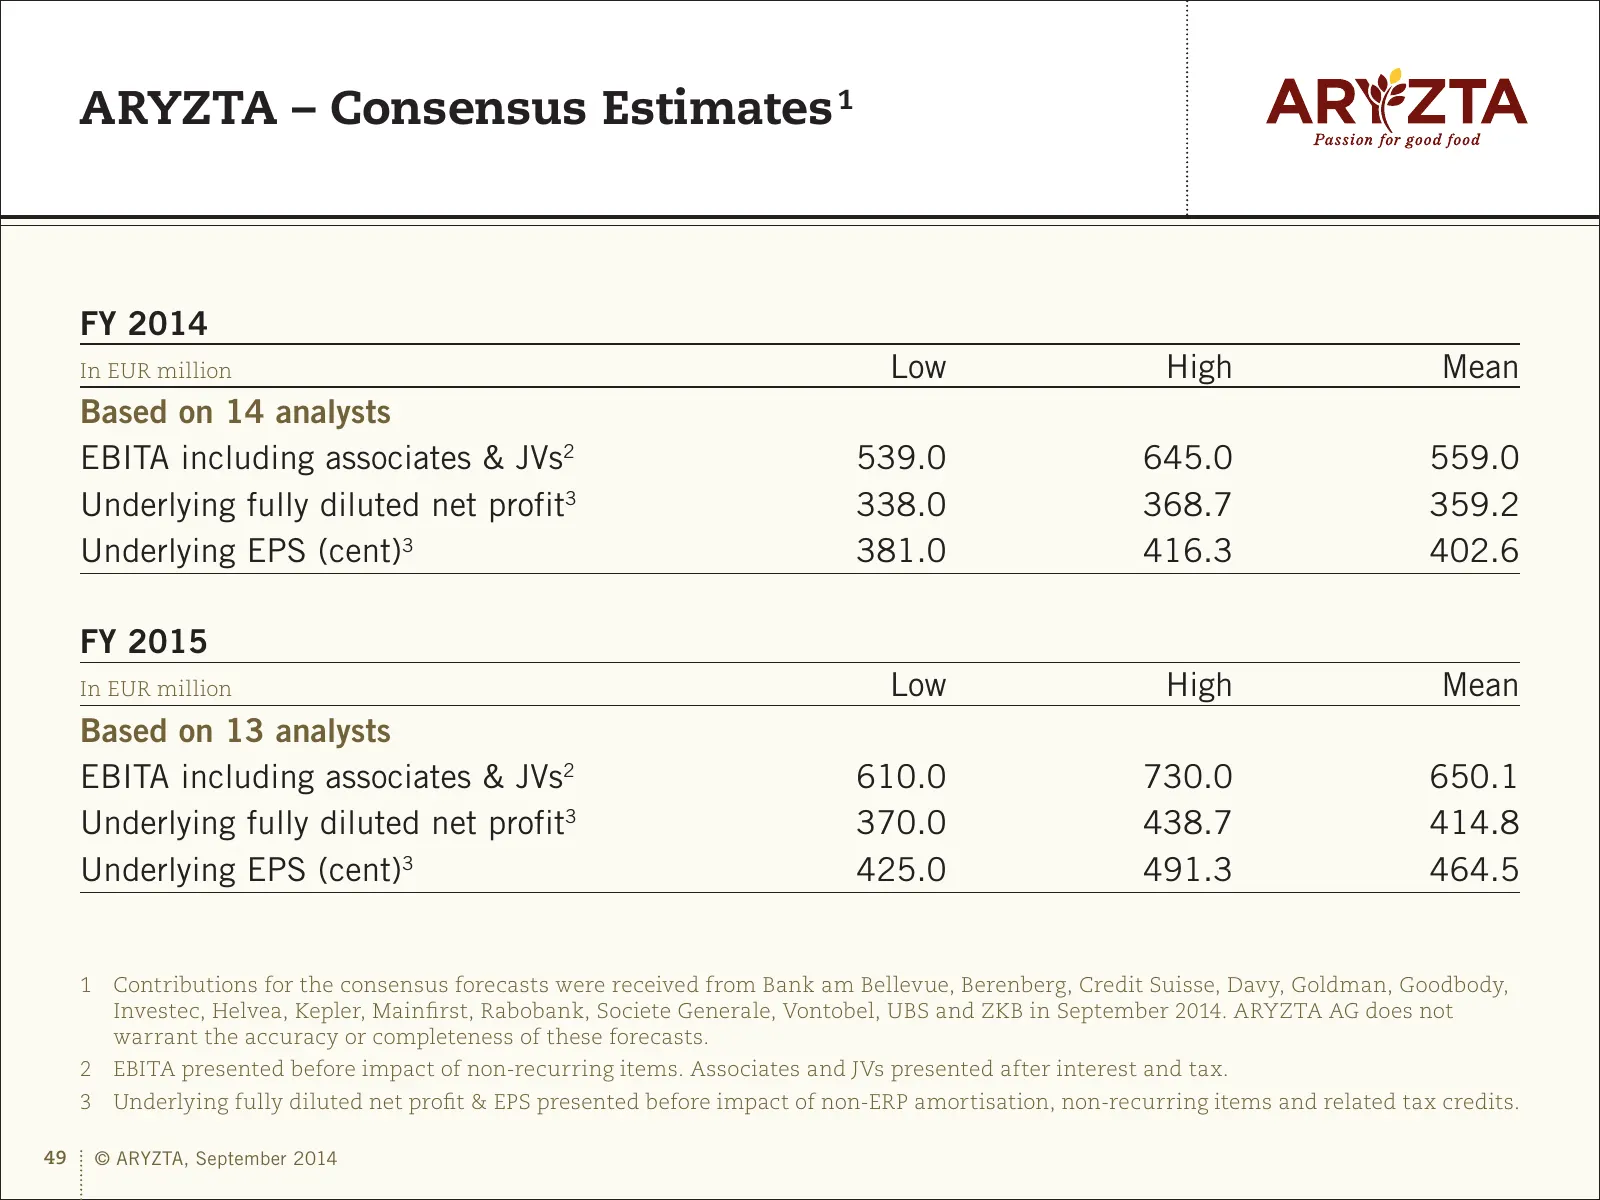
ARYZTA – Consensus Estimates 1 FY 2014 In EUR million Low High Mean Based on 14 analysts EBITA including associates & JVs2 539.0 645.0 559.0 Underlying fully diluted net profit3 338.0 368.7 359.2 Underlying EPS (cent)3 381.0 416.3 402.6 FY 2015 In EUR million Low High Mean Based on 13 analysts EBITA
Slide 50: Presentation Glossary
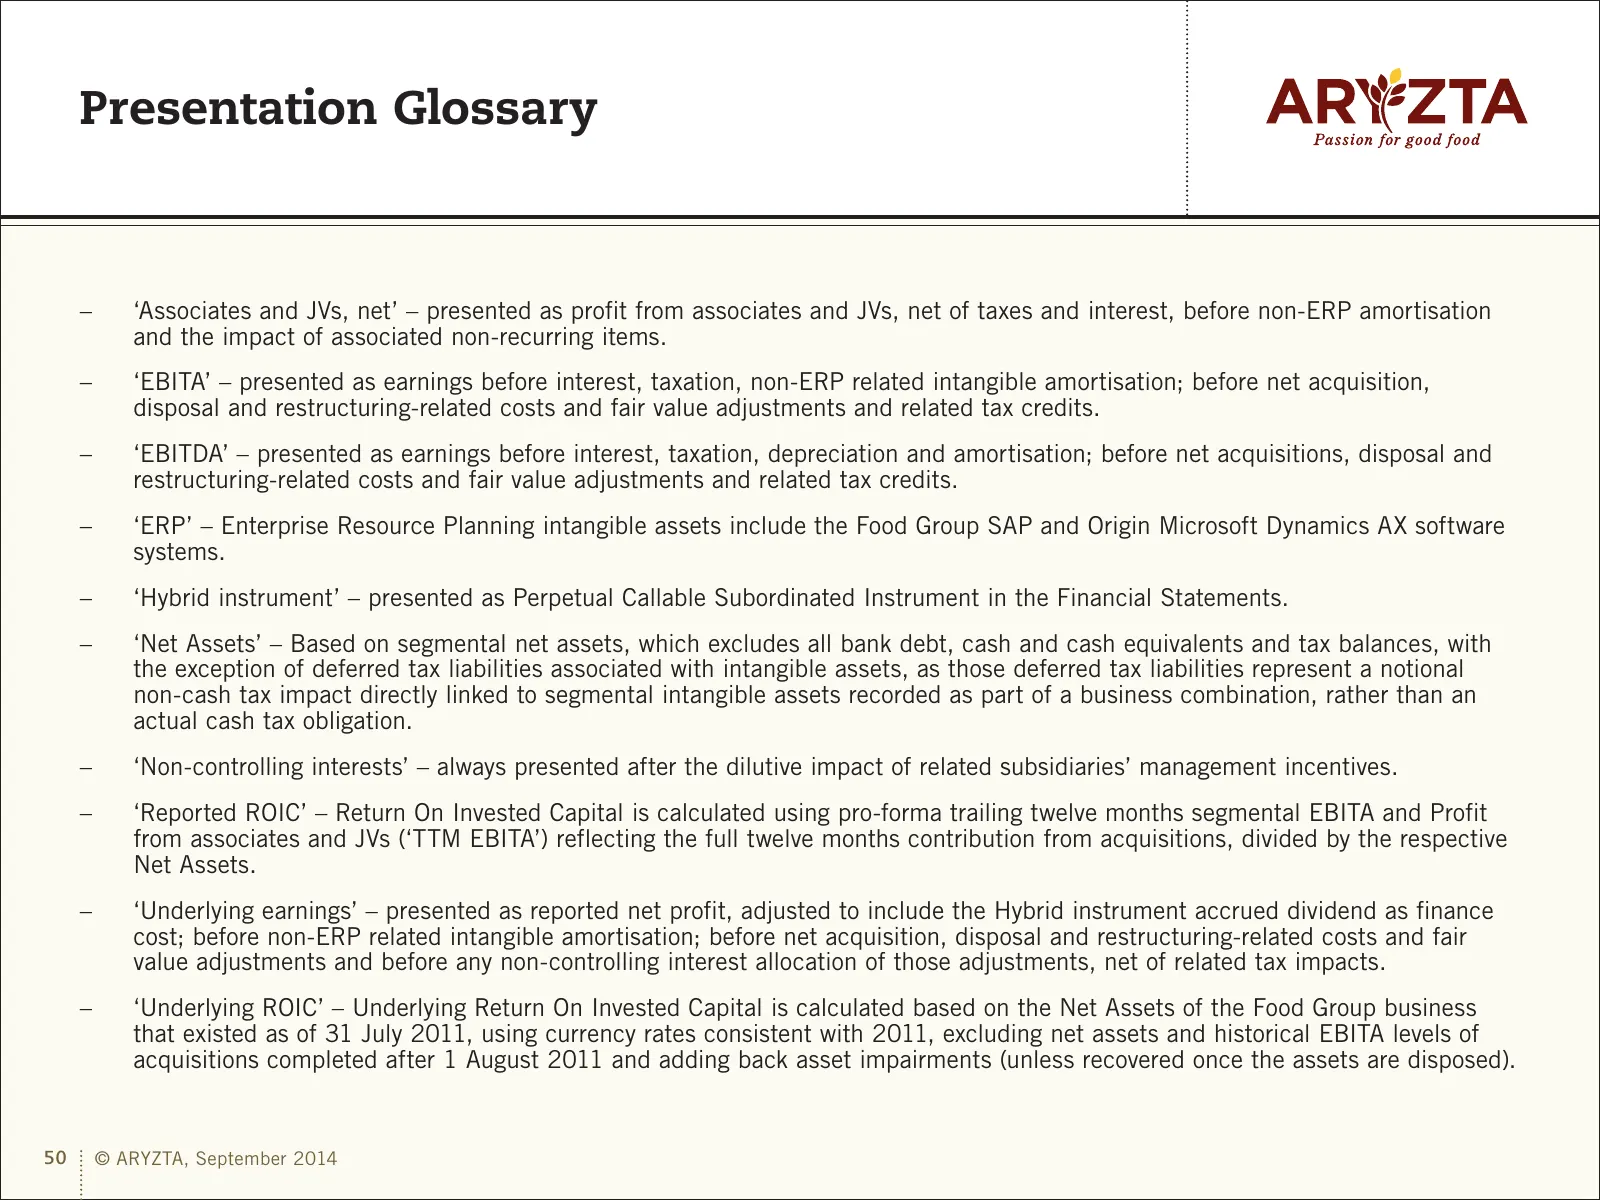
Presentation Glossary –– ‘Associates and JVs, net’ – presented as profit from associates and JVs, net of taxes and interest, before non-ERP amortisation and the impact of associated non-recurring items. –– ‘EBITA’ – presented as earnings before interest, taxation, non-ERP related intangible amortisa
Source: Internet Archive copy of aryzta.com
More decks from Aryzta AG
 H1 2026 Earnings Presentation32 slides · Aug 10, 2026
 FY2025 Earnings Presentation7 slides · Jan 22, 2026
 Q3 2025 Earnings Presentation15 slides · Oct 20, 2025
 H1 2025 Earnings Presentation34 slides · Aug 11, 2025
 Investor Day (May 2025)48 slides · May 7, 2025
 Q1 2025 Earnings Presentation35 slides · Mar 2, 2025